1. Introduction
Unlike new buildings, rehabilitation of existing ones to enhance energy efficiency can cause a decrease in floor space due to the volume of insulation panels inside of walls. External wall insulation has been introduced [
1] because it does not sacrifice inner space. In this method, a layer of insulation is attached to the outside walls, allowing sustainable remodeling of the building without sacrificing the indoor living environment. However, owing to unskilled workers, insufficient supervision, material and system failures, defects such as cracks, bumps, depressions, holes, drops or undulations have occurred. In the most serious cases, safety accidents may happen around the wall due to dropped boards. In general, the collapse of external insulation is caused by inappropriate positioning of adhesive, insufficient adhesive area or lack of adhesive amounts [
2,
3].
Manufacturers have provided technical specifications to guide proper methods to install external wall insulation [
4]. However, adhesion position, area and thickness vary according to the size of insulation boards and thus the quality of installation works cannot be guaranteed when the adhesive materials are pasted manually in the site. For this reason, proper inspection can be challenging even when quality inspectors are deployed at the adhesive work spots, and they investigate adhesive works with bare eyes despite the importance of a quality inspection [
5]. Regarding aspects mentioned so far, in specifications, sampling and detaching fixed boards to evaluate the quality of works is recommended. However, these types of post-inspection cannot prevent errors during the working process and reinstallation cannot be avoided when faults are detected.
As alternatives to post-installation inspection, real-time or pre-installation inspection methods enhance efficiency without the need for deployment of additional human resources. Quality control systems introducing vision-based or image processing technology [
6,
7,
8,
9,
10,
11] and motion capture [
12] technology have been developed. Given the 60% productivity enhancement after introducing quality control systems [
13,
14], real-time inspection is likely to provide more chances for protecting faults.
Comparing the existing methods, a new system is needed in order to address the problems mentioned above. Moreover, decreases in quality that may happen over 2D images in real-time by practicing pre-installation quality control, and post-measures cannot be mentioned as another reason [
15,
16,
17]. To this end, real-time inspection of the task undergone should be realized rather than real-time inspection of as-built components or facilities. Therefore, if a system that judges the status of the task in progress (i.e., adhesive pasted on an individual panel) by developing an algorithm that may judge quality suitability in real time after extracting the characteristics of inspected objects over 2D images, it seems that effective quality control might be achieved when using external insulation constructions.
This study establishes a framework that can inspect outsulation quality in real time with image processing and develops an algorithm that can judge whether the worker has accurately applied the adhesive on external insulation panels as given in the specifications or not. A schematic model real-time quality inspection system introducing image processing (RQIIP) follows. Finally, this study has assessed the performance of the developed system and analyzed the results of experiments to test any practical efficacy of the system suggested.
2. External Wall Insulation and Image Processing
2.1. External Wall Insulation
In the European Union, about 40% of the energy is consumed in buildings, of which 63% are residential ones [
18]. There is a great potential in improving energy performance by retrofitting existing buildings [
19], and it has been proven by research on topics such as the retrofitting method [
20,
21,
22], energy consumption analysis [
23,
24], life-cycle cost analysis [
25,
26] and decision-making on retrofitting [
27].
The external wall insulation system is one of the efficient means in this area [
28]. Many new and old residential buildings achieved a lowering of thermal energy consumption by using polystyrene insulation on the external walls [
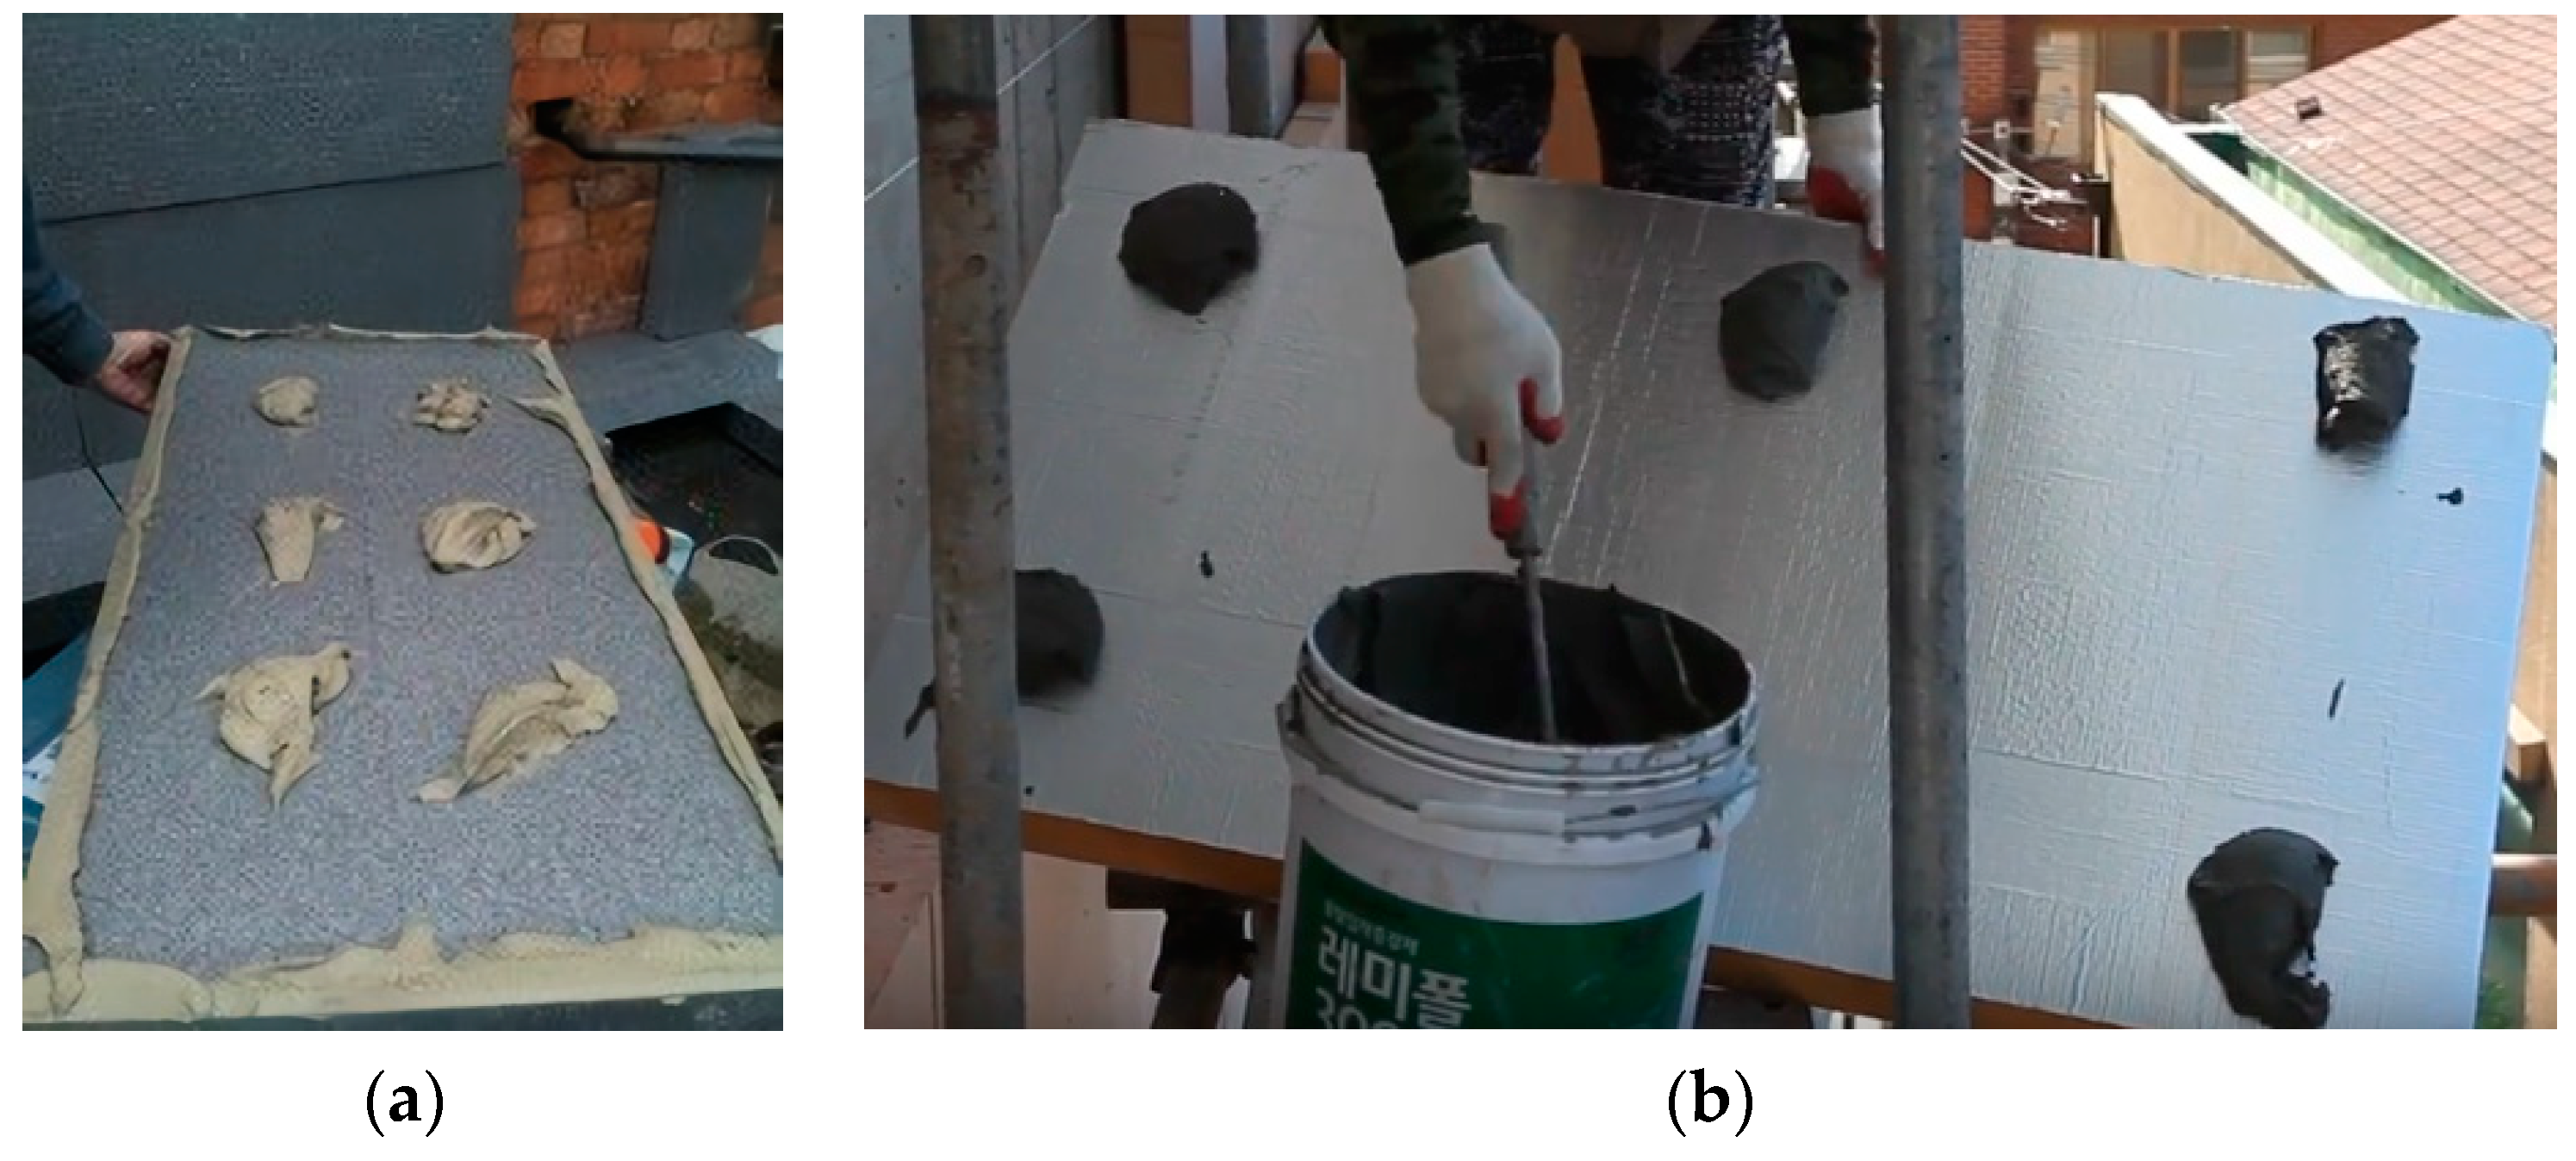
29]. External wall insulation systems attach expanded polystyrene insulation panels on the existing structure, paste glass fiber mesh, and then treat with a decorative finish. Styrofoam is mainly used as an insulator, and glass fiber called a mesh with high tensile strength is used to protect the insulator. Photos of the external insulation board on which adhesive mortar are pasted and actual working conditions are presented in
Figure 1. In the present assessment criteria related to adhesive works, the attaching area, number of places attached and ways to arrange adhesives are specified in the regulations and are to be complied with; when violating these conditions, it is regarded as a bad construction.
According to architectural design and local conditions, the size of insulation panels varies, and thus modification of guidelines needs to follow. Unified Facilities Guide Specification (UFGS) suggests that the external wall insulation installer shall be trained by the exterior insulation and finish system manufacturer to install the system and have successfully installed at least five projects at or near the size and complexity of this project. In order to manage the quality, inspection manpower also needs to submit evidence that they have a current certification from the exterior design institute or an equal inspector certification to manage installation [
30]. A challenge is that, as shown in
Figure 1, it is challenging to judge if the adhesive works are properly done or not with bare eyes. For this reason, a sophisticated quality inspection method is needed by which results of the tasks of installing external wall insulation (called outsulation hereinafter) boards can be monitored and faults can be detected.
2.2. Real-Time Quality Inspection Introducing Image Processing
In this context, real-time quality inspection can be defined as real-time inspection of the task in progress, rather than real-time inspection of an as-built product’s malfunction. The main trend of research in the field of real-time quality inspection is to identify cracks, rust or defects of as-built facilities [
16]. A book was published that detects internal crack patterns of roads and runways that enable non-destructive observation of attributes in situ of materials down to a considerable depth. The view can be made at any stage of a construction and can serve for real-time quality control. Sinha and Fieguth [
7] proposed a statistical filter algorithm for real-time detection of cracks in a pipe. After finding out a crack’s position, it extracts the features and defines the cracks through cleaning and linking process out of segmented candidates. Lee et al. [
8] presented a real-time identification technology that recognizes bridge coating rust defects using digital color image processing. Guo et al. [
9] tried to detect real-time deficiencies from the images captured by two high-resolution digital cameras for condition assessment and defect reporting in wastewater infrastructure instead of a certified operator. Zhu et al. [
10] presented real-time crack detection and a crack properties retrieving method for post-earthquake structure quality inspection. Yu et al. [
31] developed a mobile robot system using image processing to detect several concrete cracks in tunnels.
On the contrary, attempts to monitor the work process or workers have been found in the field of safety management. Han and Lee [
12] proposed a vision-based motion capture technique to identify and detect unsafe actions for inspecting labor safety at worksites. Attempts to develop web and mobile integrated inspection system are given since late 2000s. Wang [
32] developed radio frequency identification (RFID)-based mobile quality inspection system for construction laboratories integrating RFID technology, mobile devices and web portals to gather, filter, manage, monitor and share quality data. Ham and Lee proposed a structural safety diagnosis by using laser scanning data for manpower saving at worksites [
33]. Taneja et al. [
15] presented real-time field data capture technology for material tracking, progress monitoring, and quality assurance in construction fieldwork. Collected images have been integrated with data obtained from a laser scanner, embedded sensor, mobile and video camera.
However, the quality control the aforementioned methods and inspection performed after finishing certain activities is deficient of a process that can judge whether the quality is deteriorated or not, which occurs frequently during the task against individual components. As consequence, after completion, it merely goes through an end-product control that repairs the deterioration which is judged as a defect. This is a passive response for a latent deficiency that can be detected during the construction process, and consequentially cannot reduce the cost and duration required for repairing defects.
In order to prevent installing inappropriate outsulation panels in this context, a system that can judge the results of adhesive works of each panel is required. Given the physical factors that should be inspected are graphical ones (i.e., diameter, thickness and position of adhesives), image processing techniques merged with an algorithm to judge the work result of individual panels needs to be introduced.
2.3. Consideration to Introduce Image Processing
Park et al. [
34] carried out comparative studies of various vision methods and identified that the most appropriate method to track construction site resources is a kernel-based camera. Research by Laofor and Peansupap [
11] has shown that to overcome any barrier of subject judgments, real-time procedures, instead of manual inspections, with sensors, scanners, mobile phones and cameras should be developed. Also, Jo et al. assessed bridge conditions by using multiple image-processing-based displacement measurements that includes enhanced image rotation regardless of the angle between the smartphone camera and the target [
35].
Image processing techniques have been introduced in other industries for enhancing the accuracy of real-time quality inspection. A unique research trend is to introduce X-ray or Raman spectroscopy to analyze the composition of chemistry structures. The composition of the adhesive influences the quality, and thus hybrid methods merging those techniques are worth reviewing. Noble et al. [
17] utilized a real-time image processing model for an X-ray sensor in the manufacturing industry, presenting a new method that is achieved beforehand which is an accurate and quick measurement based on a 3D reconstruction from a few X-ray views of one part. As for the food chemistry industry, Herrero [
36] demonstrated the feasibility of Raman spectroscopy as a non-destructive inspection method to assess muscle food quality by determining food component structure of proteins, water and lipids.
However, the methods which have been applied in existing research for quality inspections have the following limits when applied to real-time quality inspection of external insulation construction.
First, they have technological limits when applied to real time quality checkups of objects with different chemistry from other pertinent objects of inspection. In the construction field, materials with complex combinations composed of inorganic matters, organic matters and metals are used, so they are affected by the surrounding environment, as a result it is hard to expect their accuracy. For example, laser has limits in inspecting metal, high-frequency inorganic matters and ultrasonic waves in the internal state of porous materials, or may be influenced by surroundings composed of them.
Second, the standard of inspection equipment the price is high. It is limited for portable manufacturing, so it is used less at complex construction sites, and maintenance-management costs are higher than the cost spent on inserting additional monitoring manpower and initial investment costs for each workplace deployment.
Finally, the measuring range is very narrow or wide, or the inspection results are higher or lower in precision than needed, so it is inappropriate when used in object inspection of the insulation panel standard.
Therefore, when an image is created by using a web-cam which is relatively cheap and easy to carry, used as a measuring device, even physical aspects (area, thickness), regardless of the chemical properties of the adhesive, its efficacy would be displayed when measuring the quality of outsulation with image processing.
3. Schematic Model of RQIIP Process and Algorithm
3.1. Analysis of Variables
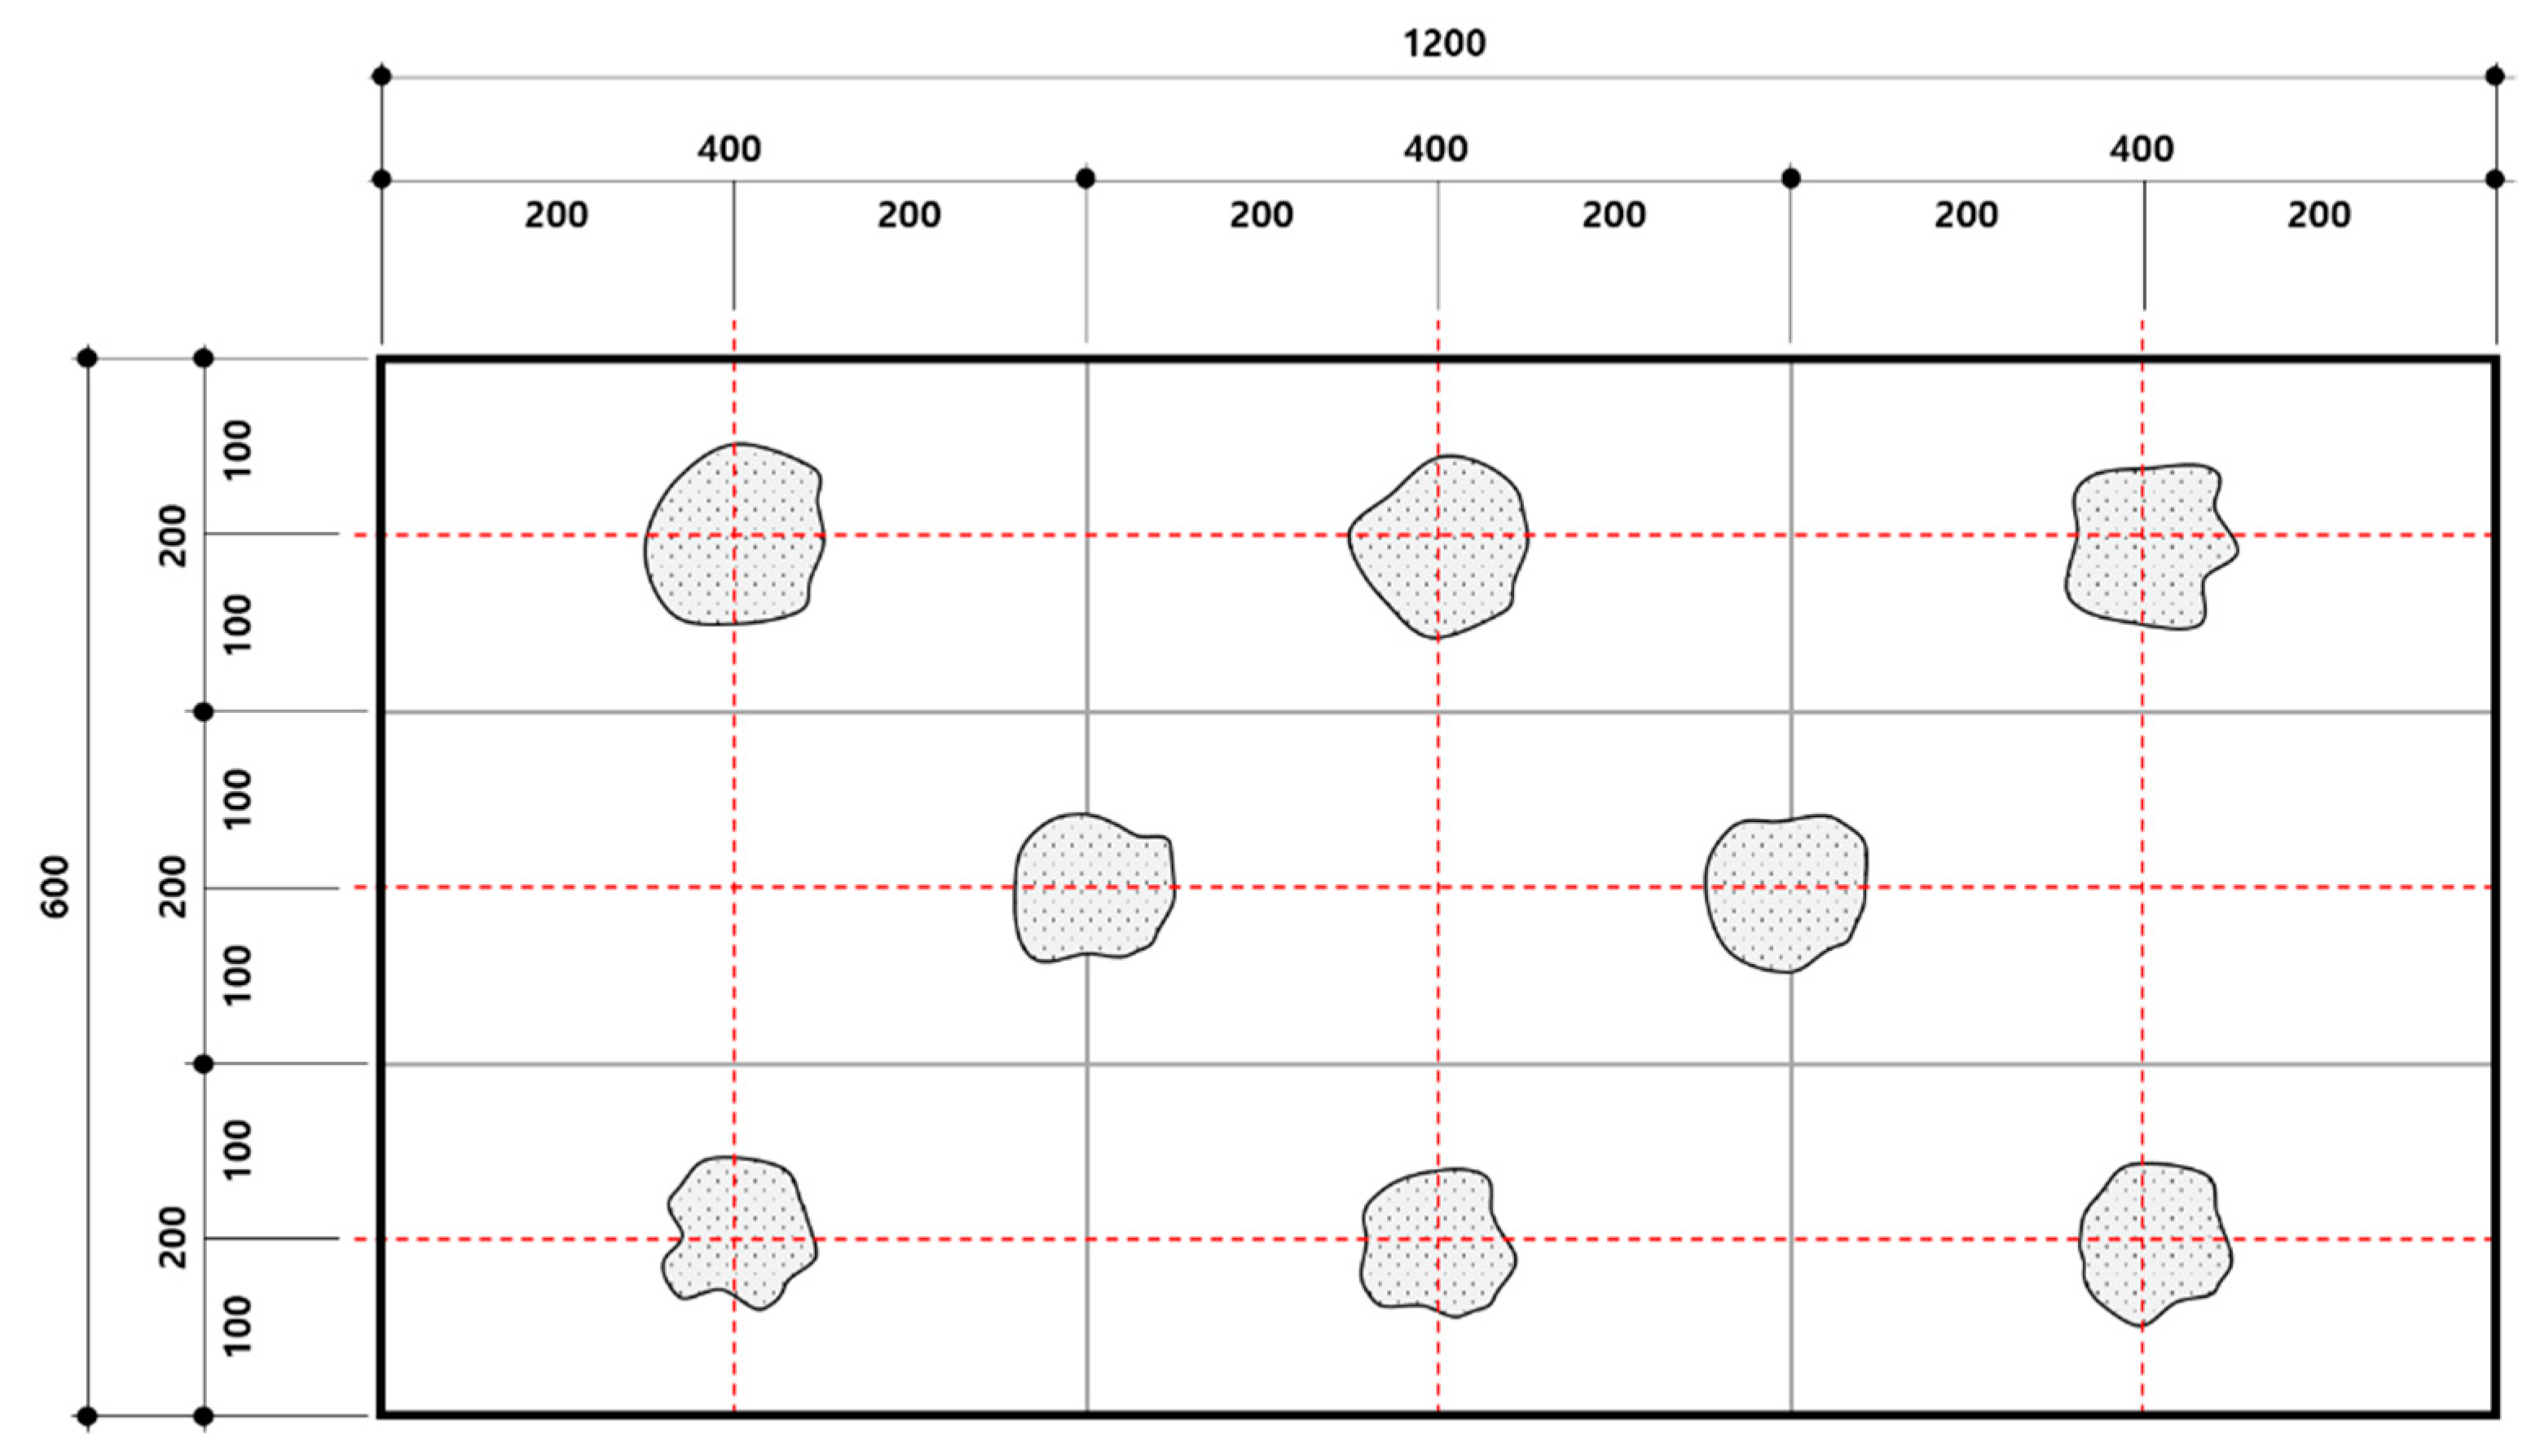
In this research, Dryvit System 485 (DS485) is selected as a sample of outsulation panel to analyze variables and to develop algorithm. RQIIP would be designed to adjust to other type of outsulation by modifying values of variables. In the guide for sample outsulation panel system, the workers are supposed to place eight dabs of adhesive with 9.5 mm (3/8 in) thickness using a stainless-steel trowel. The diameter should be within 102 mm (4 in) and the margin of center point is 203 mm (8 in) to the interior area of the insulation panel.
Figure 2 describes the specifications mentioned in the guide. The thickness and diameter values are determined according to the results obtained from experiments measuring adhesion performance according to the amount of individual adhesive.
In addition, the center gravity of each adhesive must be located within the range. Even if the amount of adhesive fulfills the requirement, if the dabs are partially located, the adhesive role will have failed. If each adhesive is applied in place, the position of the center from the intersection of the grid based on each corner of the plate is less than 5 cm, respectively. Skilled workers spread adhesive with a diameter of 11–13 cm (a little bit longer than 10 cm) through any vertical view before it is squeezed.
3.2. Process
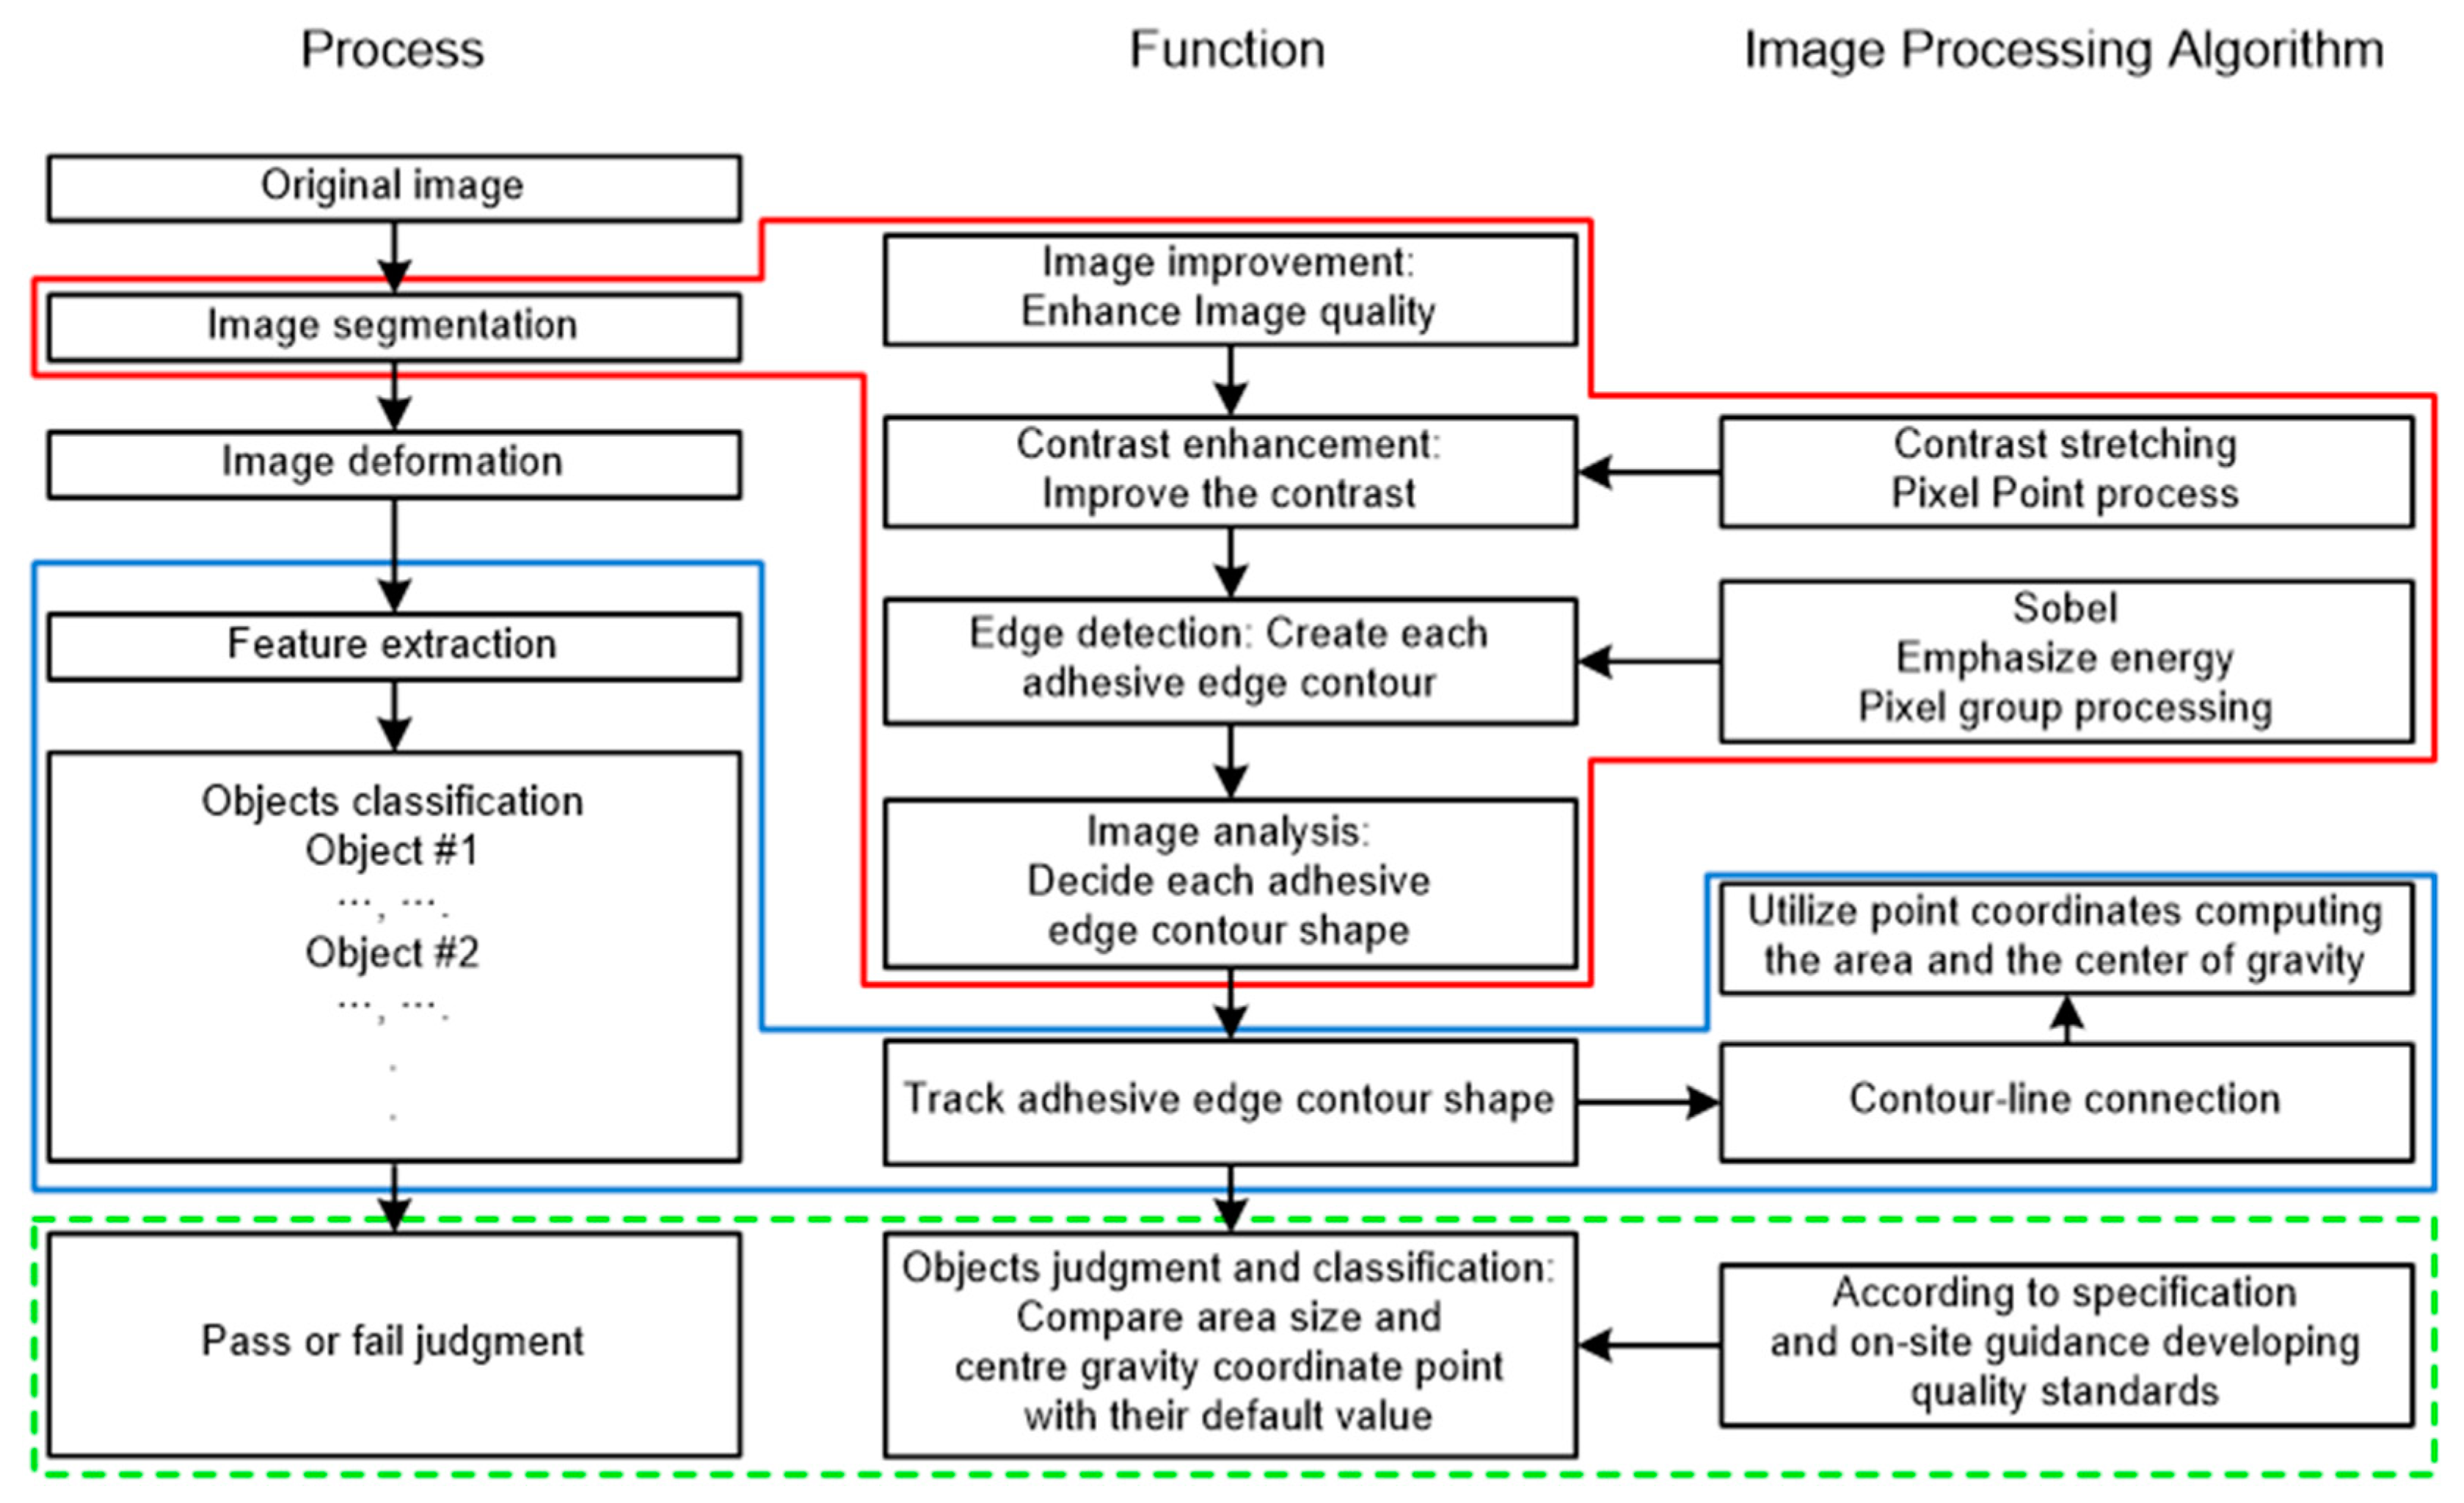
The purpose of image processing is to quantify the image factors such as adhesive size and edge. Properties of brightness, color and texture are used to separate eight individual adhesives from the insulation panel. Image segmentation includes functions to eliminate meaningless parts of captured images and to improve contrast.
Figure 3 shows the process and relevant functions and algorithm. The process is as follows: to segment the image provided from a digital camera into the individual adhesive; to extract the features of each object (i.e., adhesive) and; to judge the passing or failing of tasks by means of adhesive position and area spread.
Given that the primary properties of images would vary according to the algorithm used to inspect the work results, relevant information should be captured and recorded. For instance, the thickness and weight of each adhesive may be used to calculate the amount of adhesive. As an alternative, the thickness and diameter can be used to this end. In order to measure the thickness, 3D or 2D image processing technique might be used. Using a single instrument such as light detection and ranging (LIDAR), the depth of a dab can be measured. However, this kind of technique is less accurate, and it takes time to process the image. If two cameras are used, fast 2D image processing is available given that a camera can measure the depth of an adhesive dab from the side. However, the image processing speed depends on the number of variables required in the algorithm. For this reason, the fewer the variables, the faster the judgment in the field, thus essential features need to be extracted and used.
After the image of adhesives above the insulation panel is clearly divided into distinct objects, the next stage is detecting each adhesive feature which has different eigenvalues of brightness, color, texture and image. In this research, as the unit of measurement is in millimeters, it is appropriate to detect eigenvalue from color and shape, but not texture. Shooting dark gray adhesive contrasting with white insulation panel exhibits a high hue contrast when it is possible to detect all pixels within the edge from adhesive of brightness and color.
3.3. Feature Extraction
Once images are segmented into identifiable objects, the next stage is extracting the features of the objects. Features should contribute to judging of the adhesive work quality. Primary features to this end are the spread area and center gravity of each adhesive, as mentioned in
Section 3.1.
Formula for area of a circle is as follows:
where A: area, d: diameter,
ratio of circle’s circumference to its diameter,
s: standard diameter
When we know the area and weight, the thickness of a circle can be calculated, and its appropriateness compared to the standard thickness can be judged with the following:
where W: weight, m: mass, g: acceleration of gravity on earth (9.81m/s
2),
: density, v: volume, A: area, t: thickness,
s: standard thickness
The shape of an adhesive drop is not a perfect circle. The area of a circle is calculated as the sum of pixel number inside the boundary of adhesive drop and its area. The shape of adhesive will be changed after attaching the board to the wall because of squeezing. In order to predict the center of gravity, the central gravity before squeezing needs to be calculated. Center of Gravity (CG) is a balance point (x, y) that is uniformly distributed over any vertical and horizontal weight. CG of x and y dimension can be calculated as following:
3.4. Prediction of Gravity Center Moving
Adhesive strength can be predicted by checking if the center of gravity of the adhesive drop before squeezing is within the permissible range. However, it does not mean that the strength is guaranteed even after squeezing, given that the squeezed shape would be different to predicted one according to site condition and skills of installers. Statistical data on the shape of adhesive after squeezing can be used to predict possible shape. Firstly, the movement range of the center point of gravity is estimated with a statistical parameter estimation method in the situation where the data of its moving distance before and after squeezing. The data can be obtained from measuring the distance of actual work results. The permissible range of the center of gravity to be inputted in the next system or algorithm is deduced. According to the estimation theory, the number of adhesive lumps used in the experiment shall be a minimum of 30 to estimate the means of the population using normal distribution.
To estimate population means, the average, variance and standard deviation of the samples are as follow.
where
Based on the results above, the confidential interval of population mean is expressed as followed by confidence coefficient z
α.
where
The confidence coefficient when estimating the population mean is estimated as 99% to raise the accuracy either as 95% or 99%. At this time, population mean can be estimated to belong within the confidential interval aforementioned with a 99% degree of reliability.
The aforementioned results mean that the moving distance before and after the squeeze of the center of gravity is included by 99% probability, so the means of maximum distance after squeezing may be estimated as xmean + Xmean. Therefore, in case the value which added maximum moving distance to the distance until each center of gravity of the eight places from the reference point is within (e.g., 5 cm) of the upper limit of the range specified in each field guidance, the adhesive lump which has passed this algorithm may be estimated to have actually passed by 99% probability.
At this time, x
mean +
Xmean −
, the difference between the upper limit in the movement of center point of gravity x
mean +
Xmea specified in the field instruction that this experiment complies with and moving distance upper limit x
mean +
Xmean shall be specified as the upper limit of the center of gravity to be inputted in the system (see
Table 1).
When the means, variance and standard deviation of the samples are found to estimate population mean, V = 0.0094 because n = 800, xmean = 2.73 and s = 0.09695 because the square root value of the variance is the standard deviation.
The confidence coefficient in estimating population means is estimated as 95% or 99% out of 99% according to the tradition of R.A. Fischer. At this time, zα=2.575, so the confidence interval is as 2.605 < < 2.865 (unit: cm). Therefore, it can be estimated that the population means belongs within the confidence interval above with 99% reliability.
These results mean that the movement before and after the squeeze of center of gravity is included within the interval above with 99% probability, so the means of maximum moving distance after squeeze can be estimated as 2.865 cm. Therefore, if the value which added maximum movement to the distance from the reference point to each center of gravity of the eight places is within 5 cm, the probability for the mortar lump, which has already passed to the center of gravity, to have actually passed from this system can be estimated as 99%.
At this time, the upper limit of the center point of gravity specified in the field instruction this experiment complies with is 5 cm, so if the difference, 2.135 cm, is inputted as the upper limit of the center point of gravity to be inputted into the system, it can be inspected as the probability above. Out of 800 places of mortar on 100 panels, 400 places failed with bad adhesives included and 400 places’ adhesives passed.
4. Implementation of Real-Time Quality Inspection System Introducing Image Processing (RQIIP)
4.1. Components of RQIIP
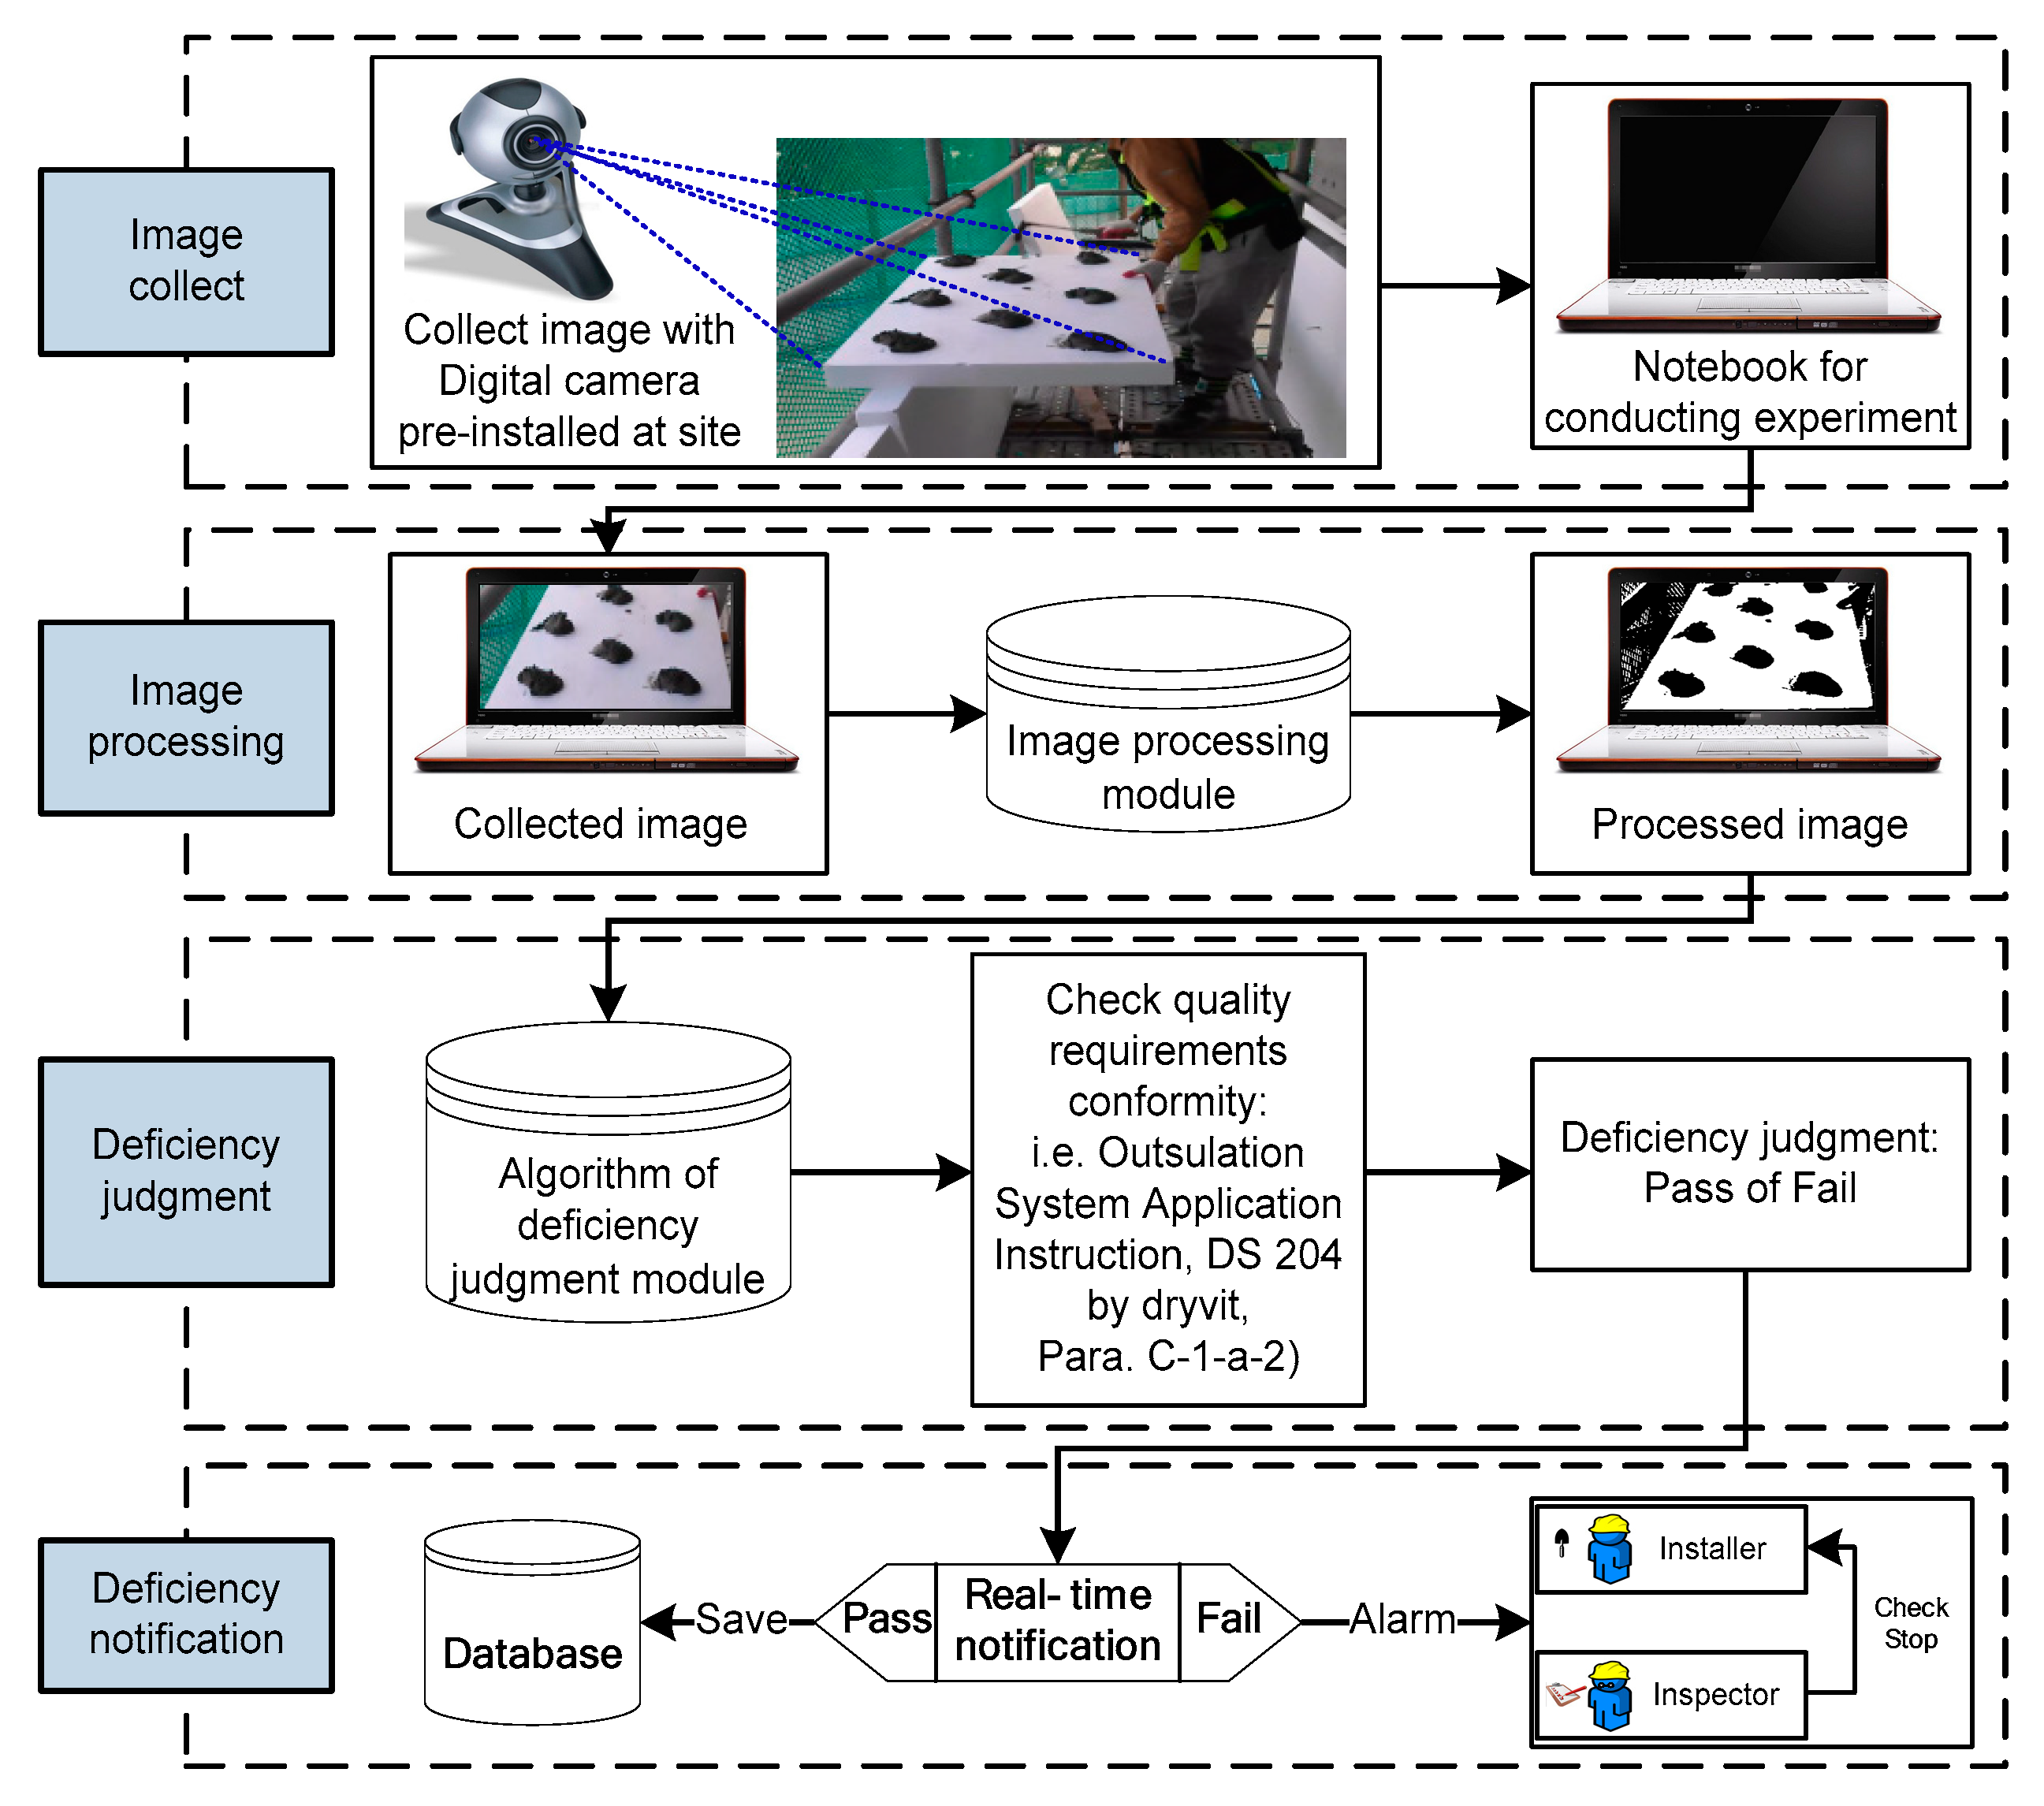
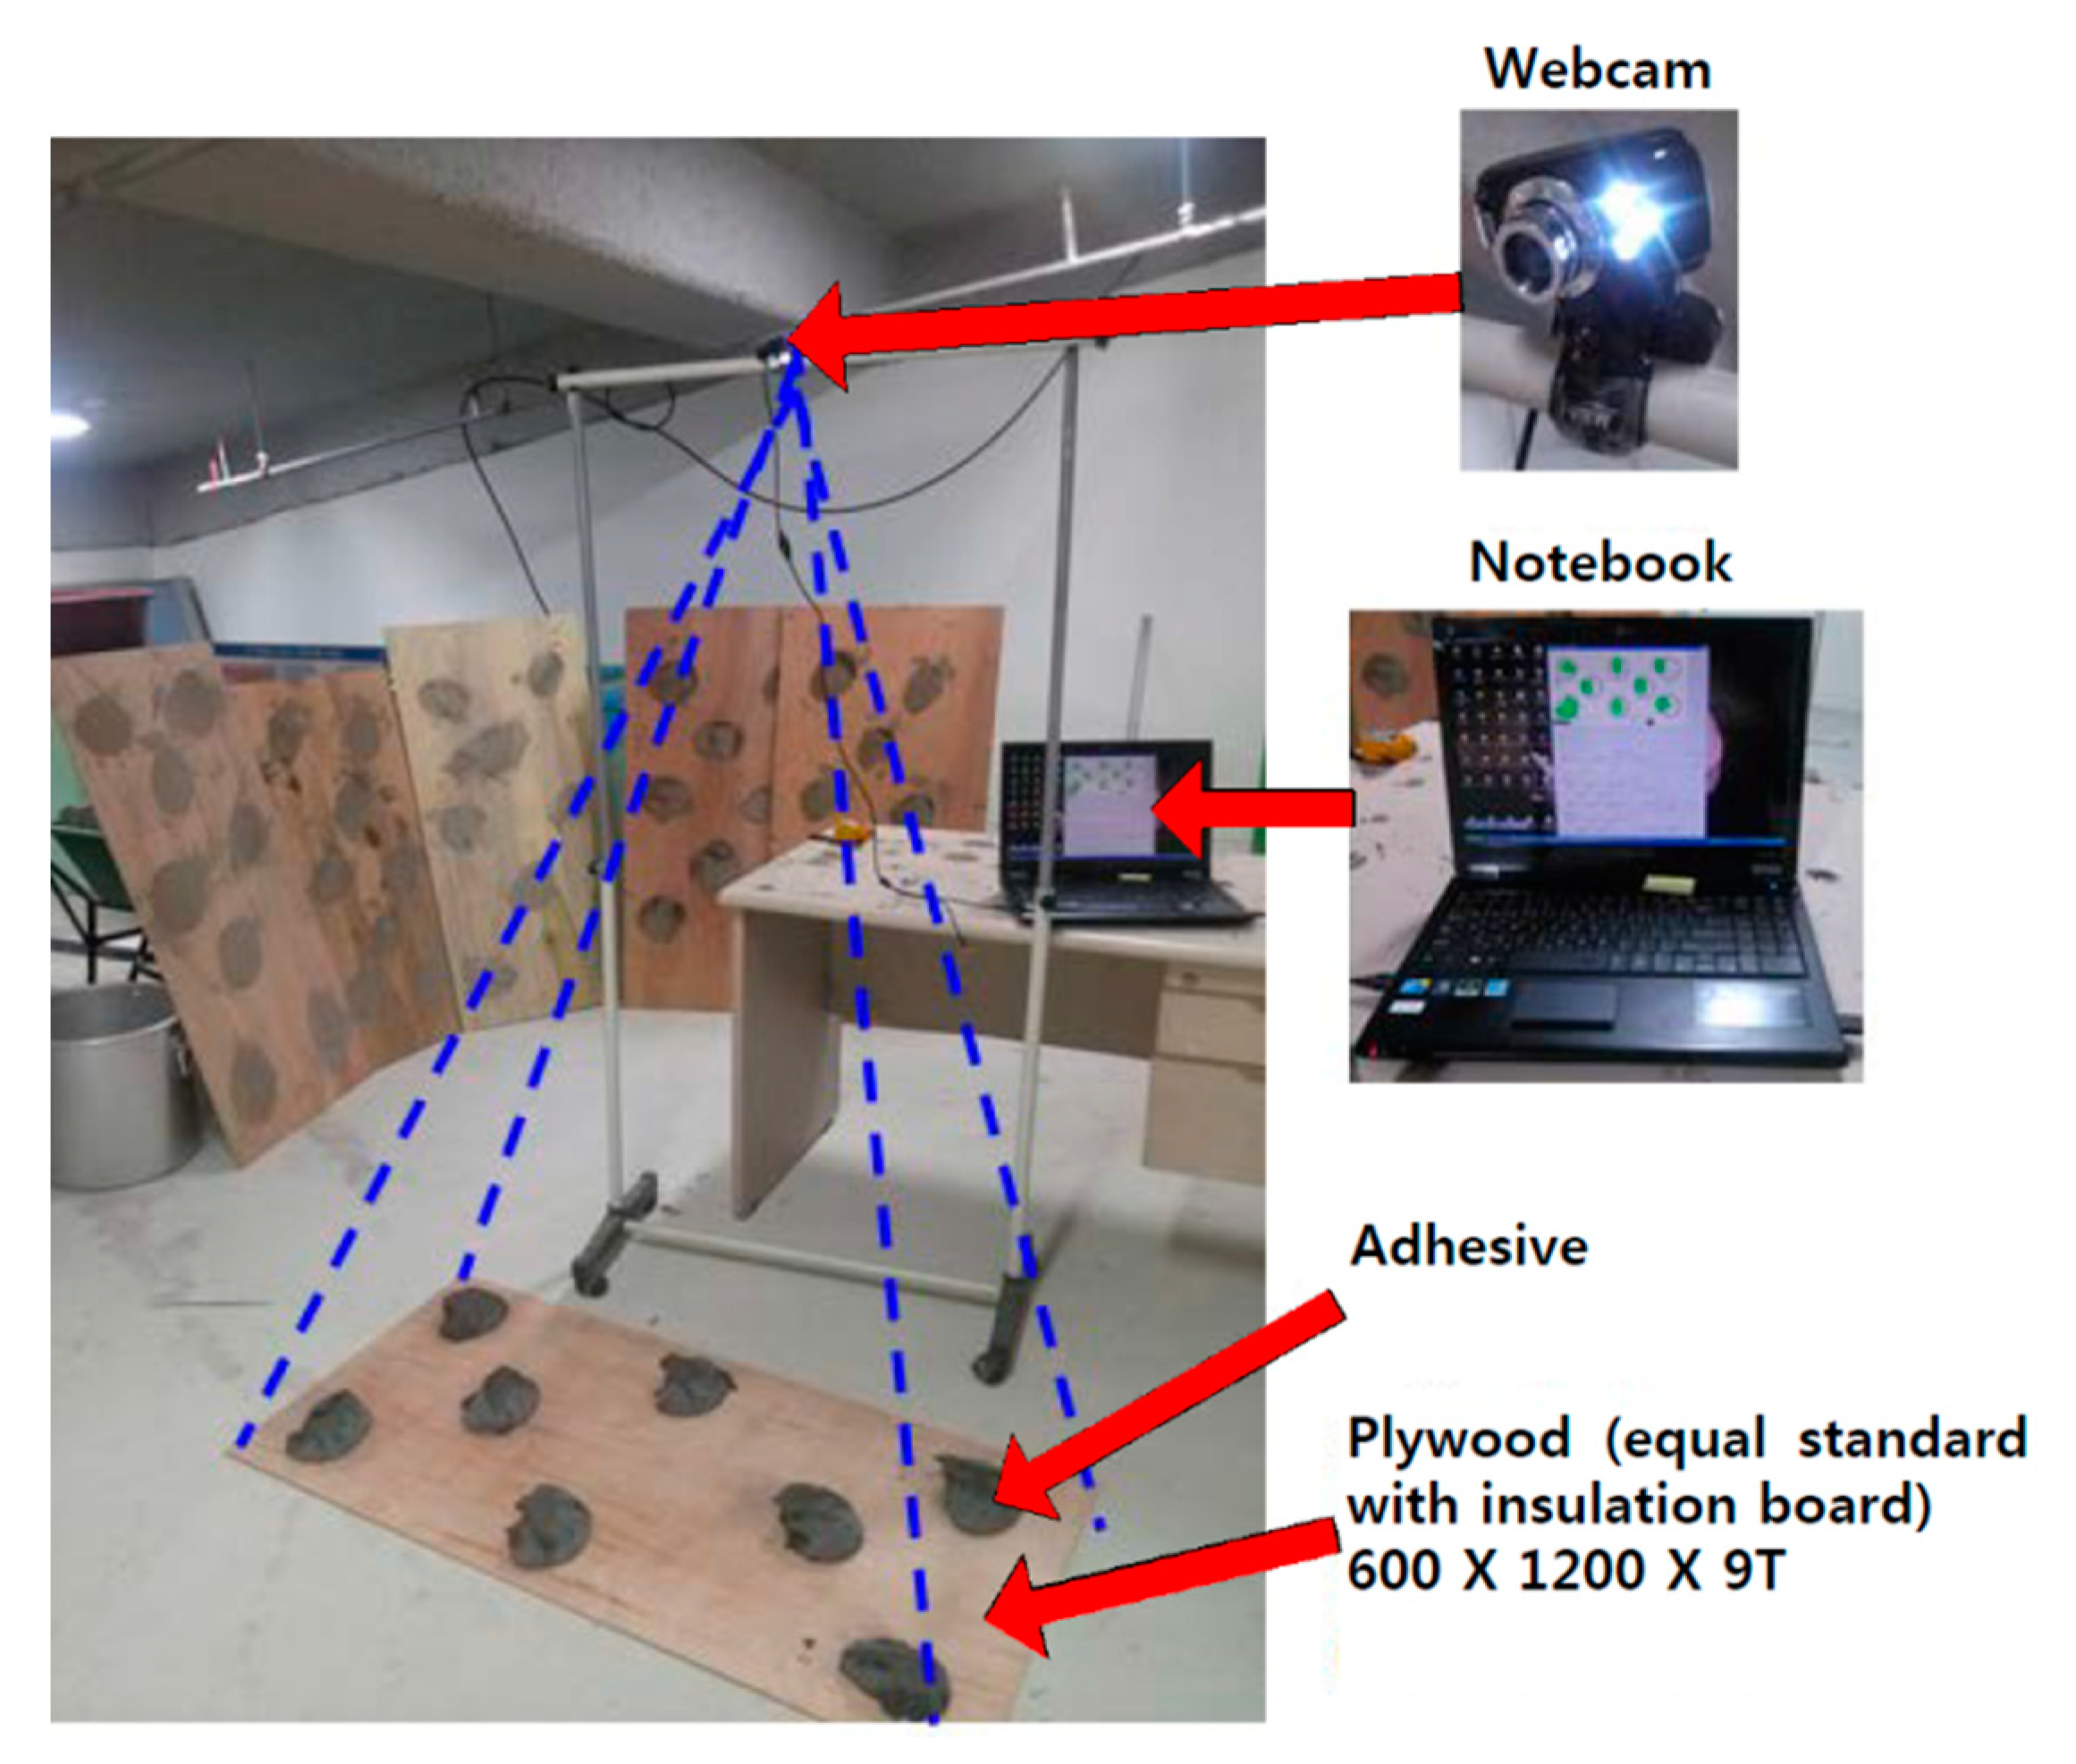
The main components of RQIIP are described in
Figure 4.
Image collect module: This collects image data filmed and chooses the devices that film the physical mid-course outcomes (i.e., adhesive pasted on the board) or task process (i.e., actions to paste adhesive on the insulation board).
Image processing module: This senses the object for quality control (mid-course outcome during the task) from the image data received from the image collect module and extracts information that an inspector needs to check (i.e., shape, position, etc.).
Deficiency judgment module: This predicts and judges whether the mid-course outcome of the task has deteriorated based on the predefined rules (i.e., standard specifications or field instructions) according to variables (i.e., area, height, flatness).
Deficiency notification module: This displays the results from the defect judgment module and reports the status to the inspector. When the field worker has started the next task with a status of failure, the message of failure shall be sent through the mobile device to the field quality manager or inspector, so that it requests the installer to stop and abandon boards with defects.
At this time, this system utilizes image processing technology and a defect judgment algorithm to judge whether it is badly constructed or not, as shown in
Figure 4, and judges whether it has complied with construction regulations as to the mid-course outcomes of construction filmed through a camera installed on the worktable right before insulation panel attachment. The judged outcomes shall be informed by displaying them to the installer on the worktable monitor, and the information of work status shall be sent in real time through a mobile device to the field quality controller. In case it is judged as a defect, a notice is sent immediately to the field quality controller, and rework might be required to the installer to prevent bad constructions.
4.2. Image Data Processing
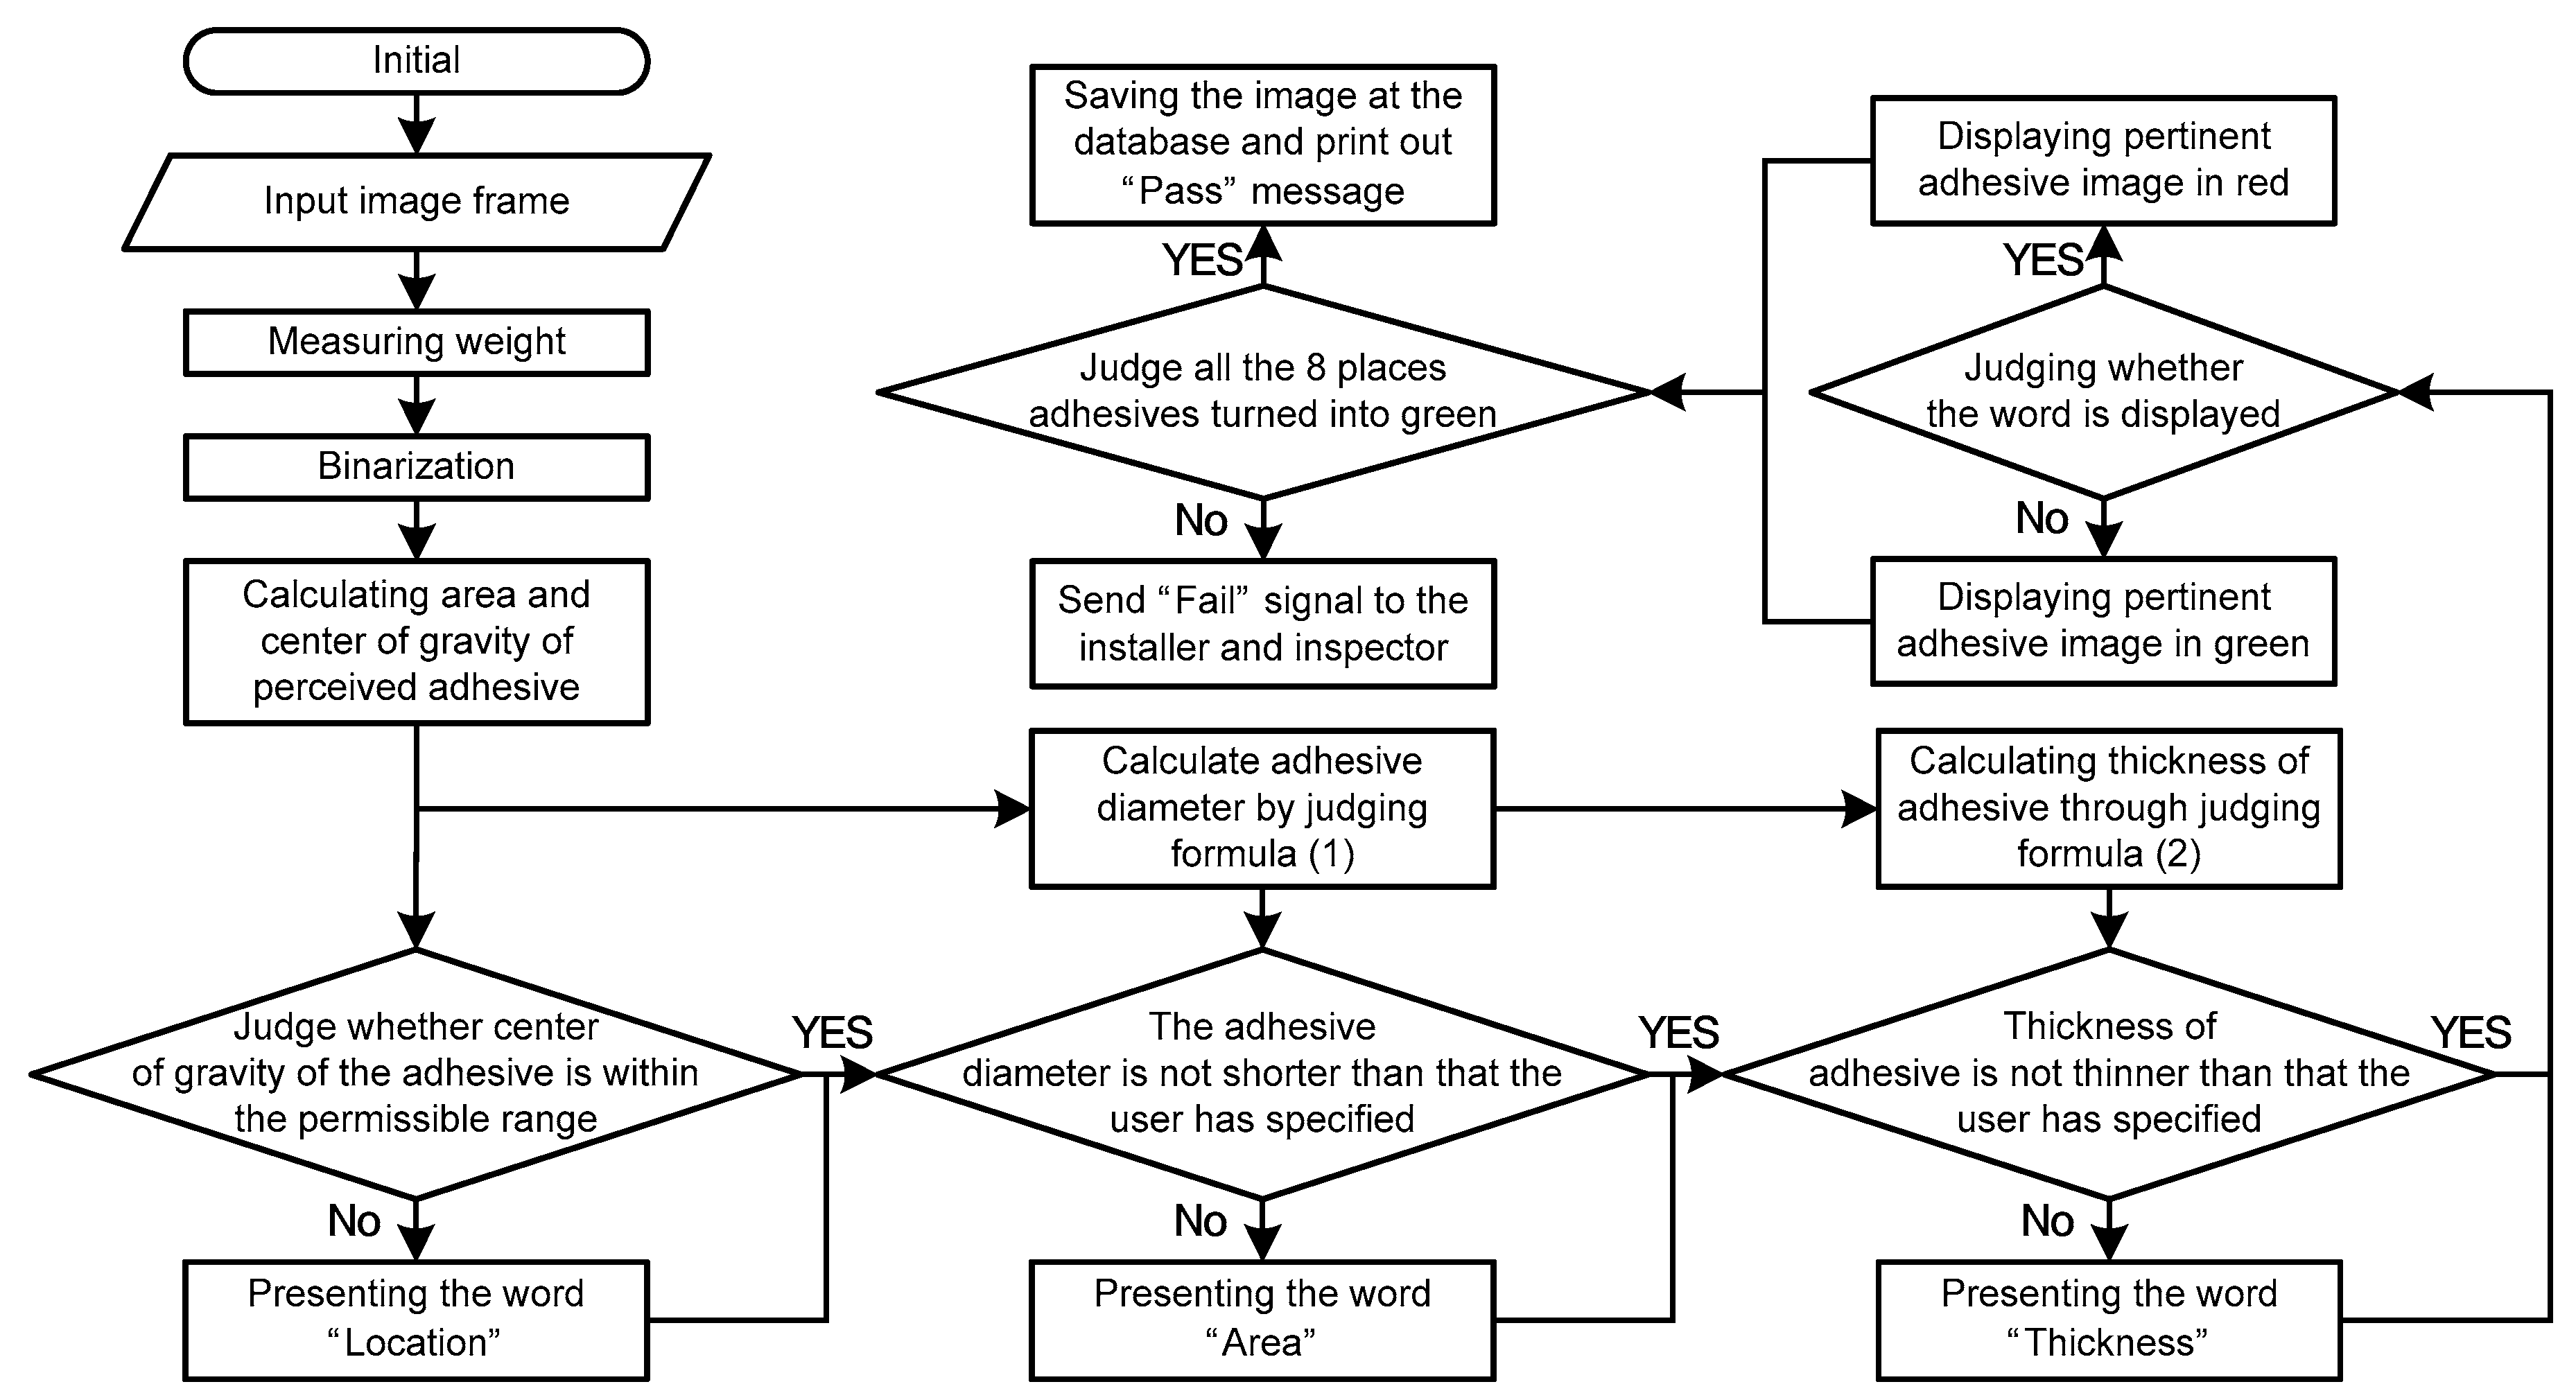
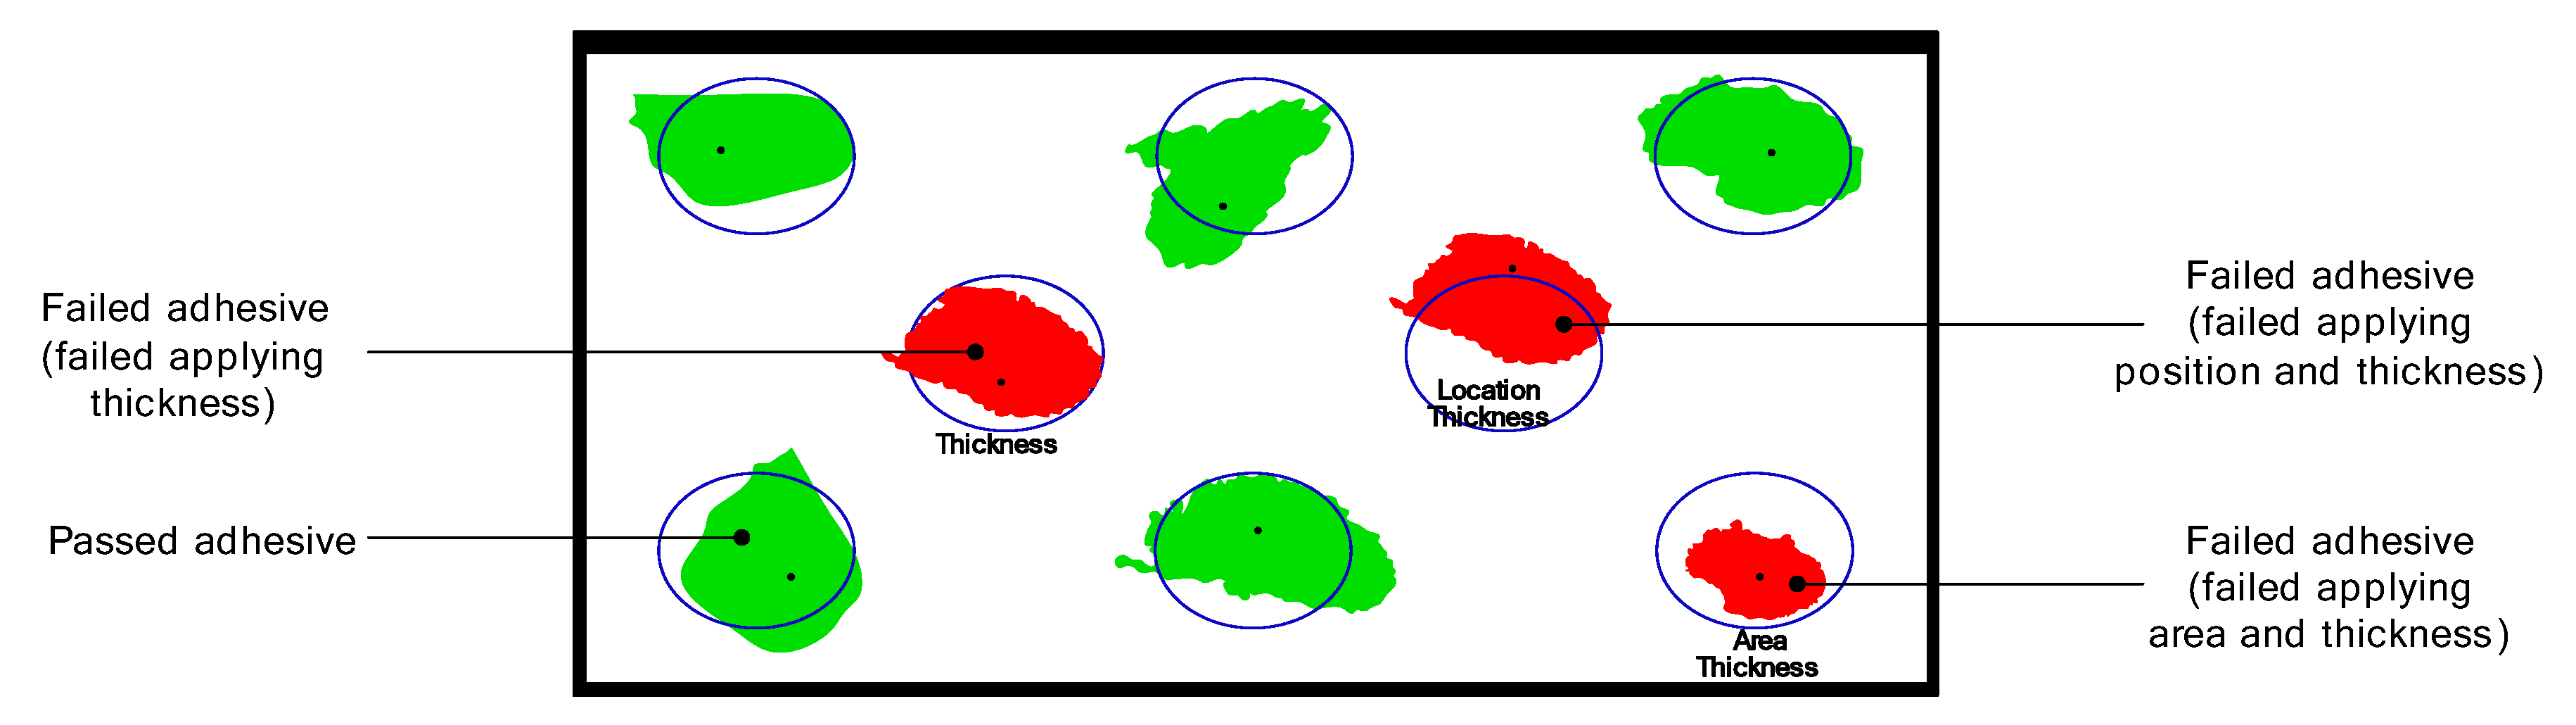
An image frame that films the objects of quality control (adhesive and insulation panel) shall be sent within the system. For extracting characteristics and improving edge definition, the binarization process is used. Compared to the insulation panel becoming the background, adhesive color information is perceived that is in contrast with the colors. The size of the adhesive lump is sent to the image processing module. The central point is calculated from the coordinate of the point that recognizes the adhesive lump and composes the outline. The central point of the adhesive is marked with black, and any valid radius that could actually be positioned shall be marked as a blue circle. If the adhesive central point recognized is located within the valid radius which the user has specified, the adhesive image is displayed in green or red. In case all eight places of lumps are displayed green (in this case it is within the permissible range of the central point position), it sends a “Pass” message, and otherwise, it displays a “Fail” message.
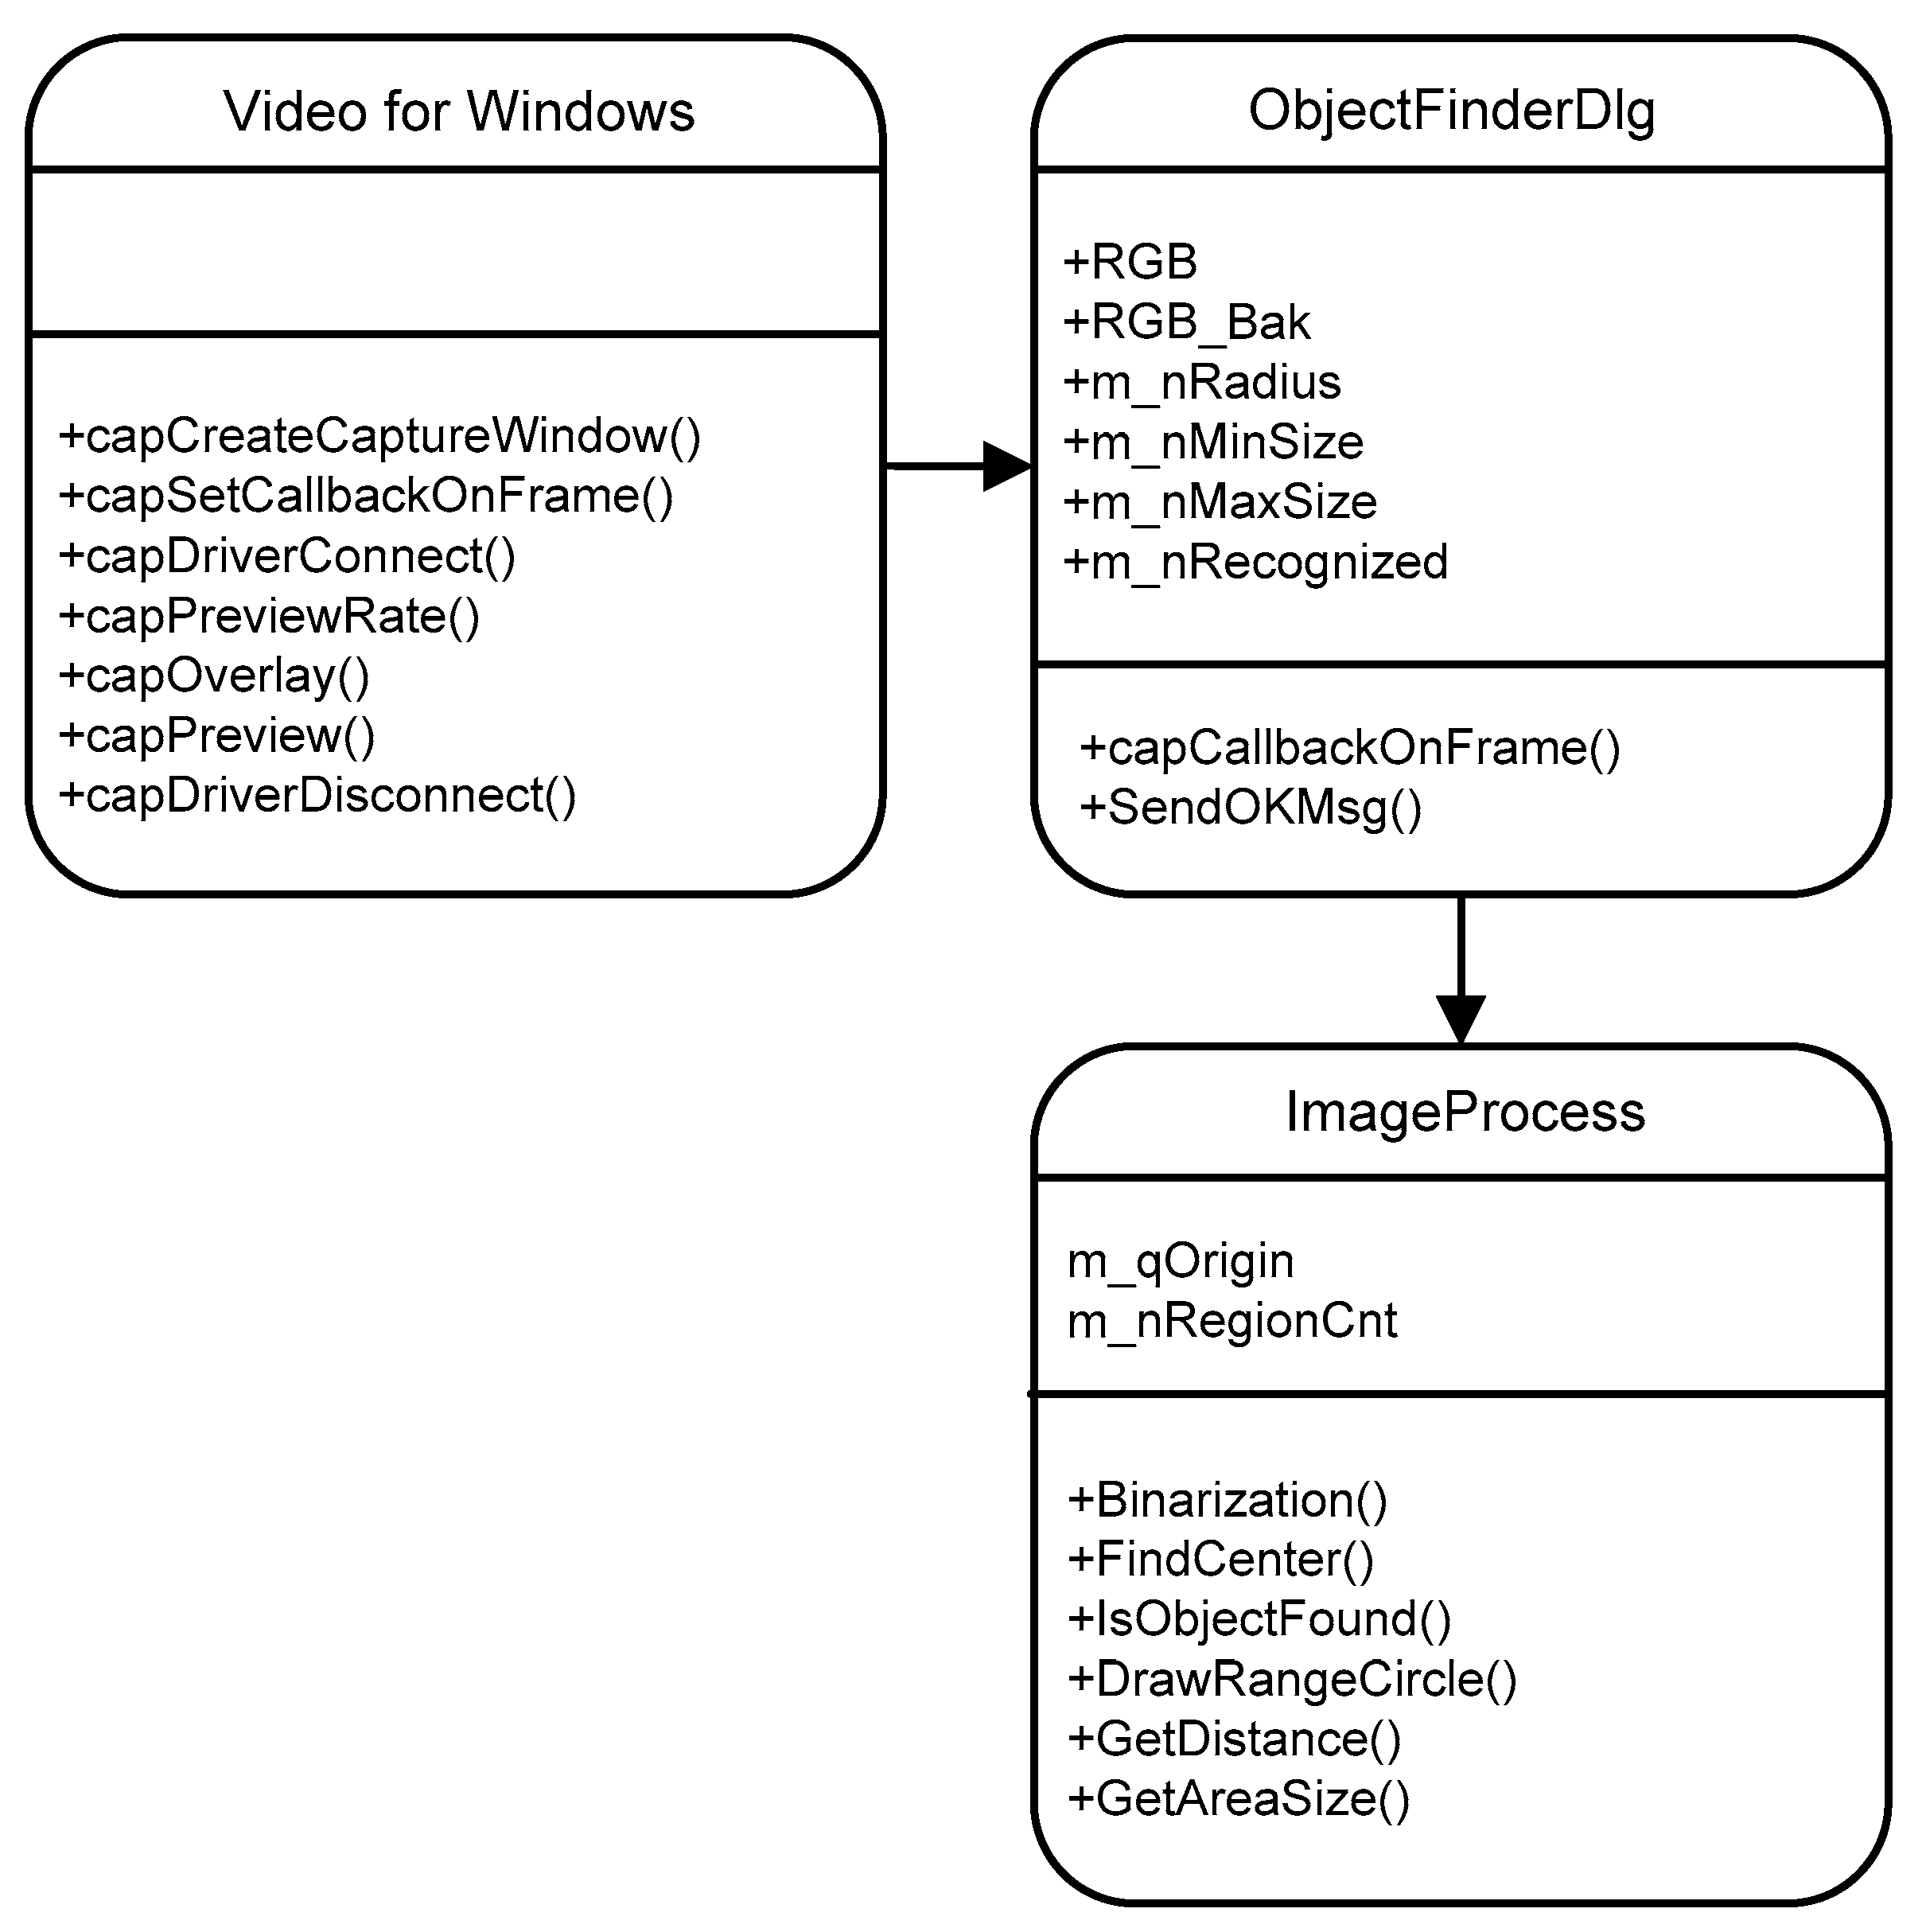
The RQIIP system process is shown in
Figure 5, and RQIIP system class diagram is presented in
Figure 6.
Input the image frame that has filmed quality inspection targets within the system with a webcam.
When putting the adhesive on the external insulation panel, each weight of the adhesive is gauged automatically through an electronic scale to be displayed on the pertinent position at user interface (UI).
After turning input image into binary numbers, calculate the area and center of gravity of the adhesive perceived at the system.
Judge if the calculated center of gravity is within the permissible range of center of gravity the user has specified. If not, display a word “Position” under the pertinent adhesive at UI.
Calculate the diameter of adhesive through judged formula 1 with the area calculated from the system and judge whether it is smaller than the diameter which the user has specified or not. If so, display a word “Area”.
Calculate the thickness of the adhesive through a judged formula 2, and judge whether it is thinner or not than the thickness that the user has specified. If so, display a word “Thickness”.
Judge whether there are any letters under the adhesive places, and if any, display the adhesive image as red, and if not, green.
Judge whether all eight places of adhesives are displayed as green at the UI. When they are all displayed in green, automatically capture the image, save it in the Database, and print out the Pass message. If at least one of the eight places are red, send a Fail sign to the installer and inspector, so that the installer stops working, and the inspector checks to see if the installer has stopped work.
4.3. User Interface
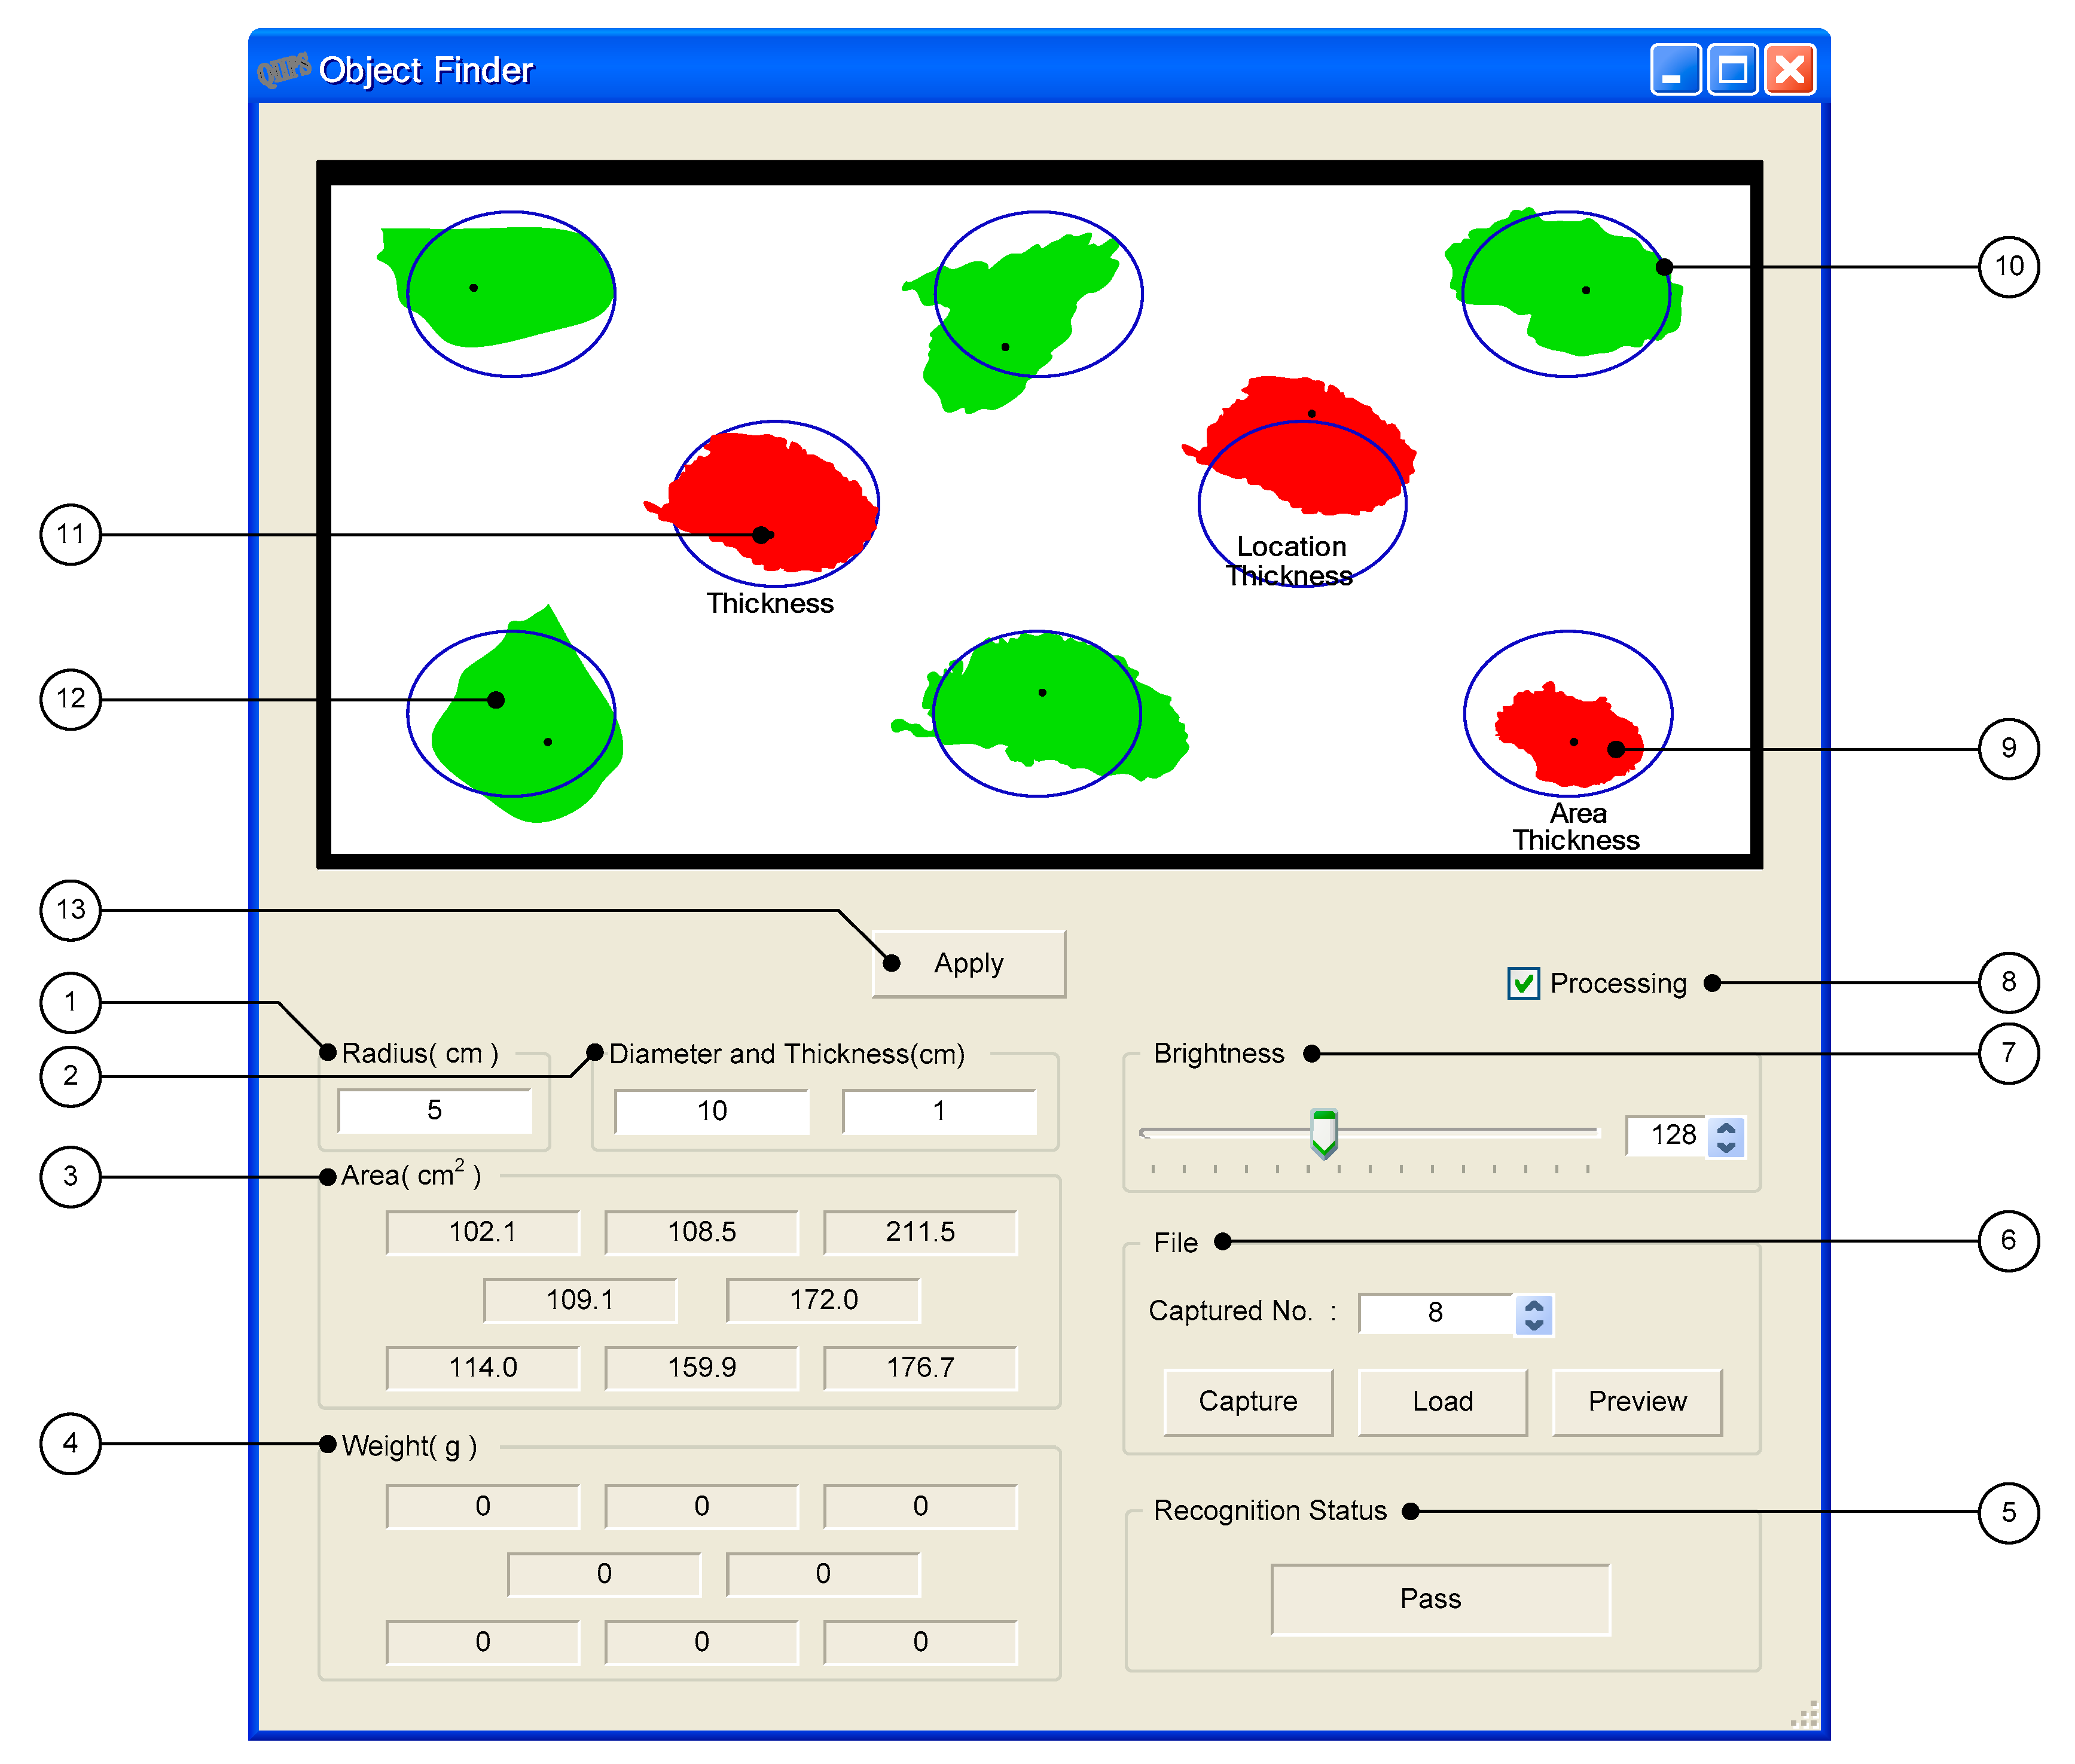
The UI composition of external insulation previous quality control system is shown in
Figure 7.
Set-up window of center of gravity permissible range: Set up the radius of permissible range of the adhesive center of gravity according to construction quality.
Set-up window of minimum diameter of adhesive and thickness: Set up minimum diameter and thickness of adhesives recognized by the norms of specifications.
Pertinent position adhesive place area measuring outcome window: This calculates the area in pixels to show the measures of the area at the pertinent position.
Weight measuring outcome window for each place: Automatically input the numbers measured with electronic scale at the recognized adhesive place positions.
Window showing the status of pass: If passed, display “Pass”, if failed, display “Fail”. When it is a pass, an automatically captured screen and pass pop-up window pops up.
Screen capture/load window: After it has been judged as passed, it is automatically captured, and loads this. After it has been judged as passed, it is automatically captured, and if wanted, it is possible to capture and load randomly.
Binarization sensitivity controlling window: This can control sensitivity according to the light environment of the field. Control perception rates through perception sensitivity controls according to the brightness of light.
Binarization start-up button: When pressing Notch at the general image, it is binarized.
Failure status adhesive: Displayed as red. It sets the crossing of each horizontal and vertical grid as the center of gravity of blue circle.
Permissible range of central point: A blue circle on the screen binarized. Sets the crossing of each horizontal and vertical grid as the center of gravity of blue circle.
Center of gravity of perceived adhesive lump: A black point on the screen binarized.
Pass status adhesive: Displayed as green.
Button applying changes in adhesive center of gravity permissible range, minimum diameter and thickness.
6. Conclusions
Outsulation doesn’t depend on large equipment such as air-conditioners, it attaches insulation panels on the exterior wall to reduce energy consumption and decorate the exterior wall while not reducing the indoor area. However, when attaching the insulation panel on the exterior wall, due to an unskilled installer or insufficient supervision, if a regular amount of adhesive is not applied to a precise position and the insulation panel is attached on the exterior wall of the building, it may not reach the expected effect of insulation, and of outsulation. So, a quality inspection is needed, and the third-party inspector checks each item on the checklist in the field with a general inspection method or can check by taking an installed insulation panel out randomly. These methods need additional manpower, increases construction costs, and causes construction delays.
In this study, when the RQIIP system is introduced, a camera is installed on the worktable, and the installer captures image data of the adhesive applied on the insulation panel then sends it to the system, the system notifies the inspector and installer of the results judging whether the application is appropriate or not. According to the application manual for the sample outsulation panel system, the installers have regulated the diameter, thickness, and horizontal and vertical distances between the centers of gravity of the adhesive that must be applied on the insulation panel. In reality, the installers judge the appropriateness with the weight, position and area of adhesives based on their experiences. This research judges whether the adhesive’s application status is appropriate by extracting these features. That is, it binarizes the image from the camera to analyze, using the RQIIP System, the area data and position data of the adhesives applied. The area data is the size of adhesives applied, and the position data is the distance between the center of gravity of each applied adhesive and the exact position. The position of the center of gravity that affects actual adhesion is after the squeeze, but the filming targets the adhesives before squeeze, so the movement range of the center of gravity shall be able to predict after squeeze from the image that has filmed the adhesive before squeeze. Therefore, the movement range of the center of gravity is inferred through parameter estimation, a statistical method, and the position data acquired through the camera at the system would be judged as appropriate if it is within the movement range (permissible range). The weight of an adhesive is measured separately with an electronic scale.
The suggested RQIIP system was composed of four modules. (1) In the image collection module, the outsulation process was filmed in real time to collect image data; and (2) the image processing module extracts necessary data from the module collected. (3) Based on the data extracted from the deficiency judgment module, any deficiency is predicted or judged according to the criteria inputted into the system. (4) At last, real-time automatic quality control is performed by notifying the installer and quality controller with the results judged at the deficiency notification module. Not depending on any subjective judgment according to the experience of the supervisor or installer, the entire outsulation task quality is controlled in real time with the task criteria unified in the RQIIP System; a mechanical and visual inspection. Quality doesn’t need to be verified by detaching the insulated panel which has already been constructed, so that construction costs and the construction period can be saved.
An experiment was performed to find out the extent of how accurately the system could judge the status of applied adhesive by dividing accurate application of the adhesive from inappropriate applications, in order to verify the practicality of the system this research suggests. Two-hundred spots of adhesive were placed to pass, and 200 spots of adhesive were each placed to fail due to incorrect application thickness, position and area, representing 800 sample adhesives in total; all of them were accurately detected. This extent may be applied to the field enough to ensure external insulation construction quality and complement the system through the feedback of the installers. This means that it enables real-time quality inspection of the external insulation construction process with higher speed, better reliability and lower cost than previous quality inspection through the existing supervising manpower method. Furthermore, this method has its advantages in not only labor cost, but also equipment cost, due to its base of utilizing a general web camera, which requires much lower costs than another visual inspection equipment. When compared to the existing method of an inspector that inspects each outsulation panel after attachment, the suggested method has the benefit on reducing work procedures as well, because this method allows inspection to be proceeded before attaching the panel. In addition, it may be used by improving and extending the algorithm and system of this research, even for methods that use other adhesives or similar methods.
However, the range of the research aforementioned judges whether the quality conforms through the image treatment for a static object, and in future research, an algorithm must be developed that can perceive defects in a dynamic object. An algorithm or physical system should be developed that can assess the mid-course outcomes of the tasks in real time according to the vision of the installer with a camera attached on the safety hat of the installer, not a fixed measurement such as the present workstation format, so as to raise availability in the actual field.


