Healthy Diets and Reduced Land Pressure: Towards a Double Gain for Future Food Systems in Nigeria


1
Wageningen Economic Research, Wageningen University & Research, Prinses Beatrixlaan 582, 2595 BM The Hague, The Netherlands
2
Czech University of Life Sciences, Faculty of Economics and Management, Kamycka 129, 165 21 Prague, Czech Republic
*
Author to whom correspondence should be addressed.
Sustainability 2019, 11(3), 835; https://doi.org/10.3390/su11030835
Submission received: 31 December 2018
/
Revised: 27 January 2019
/
Accepted: 1 February 2019
/
Published: 6 February 2019
(This article belongs to the Special Issue Towards Sustainable Global Food Systems : Conceptual and Policy Analysis of Agriculture, Food and Environment Linkages)
Abstract
:Nigeria is one of the most dynamic economies in Africa. Strong GDP and population growth coupled with urbanization trends place tremendous pressures on natural resources and the food systems that are dependent on them. Understanding the impact of these “mega trends” is important to identify key leverage points for navigating towards improved nutrition and food security in Nigeria. This paper contributes to the Foresight Project of the Food Systems for Healthier Diets which aims to analyse how the food system in Nigeria is expected to transform in the next decades, and to identify the leverage points for making sure that the transformation contributes to balanced consumer diets. For the food systems foresight, a well-established global economy-wide model, MAGNET, is applied that enables to capture the interlinkages among different food industry players in one consistent framework. By linking MAGNET to the GENUS nutritional database, it is further possible to relate the developments occurring on a macro-level with detailed macro and micronutrient consumption. Model projections suggest that a process of intensification of agriculture in combination with land substitution appears critical for the evolution of food and nutrition security, and for shifts towards healthy diets for the population. Intensification results in greater diversity of the production systems, which in turn cascades into positive effects on the diversity in the food supply and better food security outcomes.
1. Introduction
Nigeria is one of the most dynamic economies in Africa. Strong GDP growth and high fertility rates [1] suggest an unfinished demographic revolution, placing tremendous pressures on natural resources and the food systems that are dependent on them. In particular, arable land for expansion is becoming increasingly scarce [2]. Understanding the impact of these “mega trends” on food and nutrition security in the country is highly relevant. Malnutrition in all its forms remains a key concern in Nigeria. While chronic malnutrition remains widespread (in 2013, 37% of children under 5 years of age were stunted [3]), the need to curb the rising prevalence of overweight and obesity among adults and children is emerging as a priority for food security and health policy. Economic development and changing market conditions are associated with shifts in consumption patterns that simultaneously move towards and away from healthy diets [4]. Healthy diets typically have four characteristics—related to quantity, quality, diversity and safety of the diet—and translate into principles for adult consumption [5]: sufficient consumption of fruit, vegetables, pulses; moderate consumption of animal source food, with limited intake of processed meat and sugar-sweetened foods and beverages; avoid transfat and replace consumption of saturated fats with vegetable oils or other sources of unsaturated fat. This paper seeks to contribute with macro-level foresight to the identification of leverage points in the food system of Nigeria for promoting healthy diets in these respects with the exception of safety. Of particular interest is the question how Nigeria’s national food system, given its strong bias towards staple production, could transform towards meeting these diverse nutritional needs.
There is increasing recognition that the interplay between market decisions and contextual drivers at multiple levels is important for understanding dietary quality and nutritional outcomes of food systems [5]. The definition of a food system of the High Level Panel of Experts is also used in this paper: “a food system gathers all the elements (environment, people, inputs, processes, infrastructures, institutions, etc.) and activities that relate to the production, processing, distribution, preparation and consumption of food, and the output of these activities, including socio-economic and environmental outcomes” [6]. This concept of a food system takes into account the complexity of external driving forces that shape food and nutrition security and dietary patterns across different levels. These drivers appear as the key factors that determine the changes in the food system. Such drivers are commonly grouped into 5 categories: innovation, technology and infrastructure; political and economic; socio-cultural; and demographic drivers [7]. In the expanding literature on drivers of global and national food systems, there is often little attention for changes that originate “from within” the food system [8]. The response of entrepreneurs, consumers and regulators to the external drivers, and the interplay of the behaviour of different actors is what makes the food system complex to understand [5,7,9].
A useful distinction can be made between the indirect and the direct drivers in the food system. This classification follows a governance perspective on drivers: it separates those that can be influenced by food system actors (direct drivers) from those that cannot be influenced (indirect drivers) [9]. Three types of feedback loops in food systems are proposed by this framework: (1) adjustments in the market and external effects that follow from interaction between producer and consumer decisions under the influence of drivers of change; (2) adjustments in the policy framework on the basis of market outcomes and external effects that are inconsistent with prevailing visions in public policy; (3) ramifications in the global food system, e.g., in world commodity markets, biophysical or geopolitical balances, etc.
Although there is a recognition of the need for understanding the relations between drivers of food systems and their impact on diets and nutrition, the empirical evidence from the existing foresight studies is rather scarce, particularly regarding the macro-economic perspective of food systems impact on nutrition. One review identified a gap in foresight research regarding how alternative uses of agricultural land impact food security considering both poor people’s access to productive resources and income-earning opportunities as well as their access to food and the prevalence of hunger [10]. These recommendations are fully reflected in this paper where land is identified as the key factor that determines the future development of food systems and food security impacts.
This study thus contributes to the gap in the literature with the objective to provide national-level projections of the demand for food, and to explore how various direct and indirect drivers in the food system (farm input and output prices, demand for on-farm and off-farm labour, consumer preferences, etc.) interact with the general drivers of the food system, and to evaluate ex-ante how these dynamics affect diet outcomes at population level.
The interplay of indirect and direct drivers within the food system are explored in this paper using a computable general equilibrium (CGE) model for Nigeria and the rest of the world. The model is presented in Section 2, along with a scenario framework for exploring future food systems and diets in Nigeria. The results of the impact of drivers and interconnections on food systems outcomes and diets are presented in Section 4, followed by a discussion of the limitations and implications of the paper.
2. Materials and Methods
2.1. Scenario Framework for Exploring Future Food Systems in Nigeria
This paper employs scenario methods to understand how the indirect drivers of the food system interact at multiple scales simultaneously—supra-national level, national and sub-national level for Nigeria and household level—and addresses feedback loops between producers and consumers in Nigeria (feedback loop 1) and between the national and supranational level (feedback loop 3). An advanced quantitative modelling framework is used for this purpose, and will be introduced in the this section. A possible policy response (feedback loop 2) is explored in the discussion. The indirect drivers of change and specific characteristics of the Nigeria food system and its drivers are incorporated in the analysis as follows:
- Supra-national level: Included are the unequal levels of wealth and rates of economic growth among countries and regions, the sectoral composition and human capital dimension of growth including changes in population growth. Excluded is the variation across countries in the quality of basic services that are available to the population. For example, Nigeria has the largest population of out-of-school youth in the world [11,12]. The Nigerian population is increasingly youthful and urbanized, with the urban population expected to outstrip the rural population by 2025 [13]. Interactions with global markets for commodities and merchandise, and integration with the global economy through international trade and adjustments of real exchange rates are included; currency fluctuations and stabilization policies are excluded. The differentiated effect of climate change is included at global level. Section 2.3 dwells largely on these drivers.
- National and sub-national level: Nigerian food systems are the most important sector in the country, representing 41% of Nigeria’s value added in 2011 (see Section 3.3). Included in the analysis are the interaction between agriculture, food supply chains and non-agriculture sectors (energy supply, manufacturing, services), and the interplay between technology change and changes in the factors of production at the national level. Assumptions on the expected rate of technological progress are included in the analysis; excluded are the process of diffusion and adoption. The connection between public research, education and extension services is generally considered weak [14,15], which hampers adoption processes. Nigeria’s core infrastructure stock was low (about 20–25% of GDP) until recently, yet investment in infrastructure has greatly increased in the last 4–5 years. The impact of such investments on infrastructural developments such as roads, railways, storage facilities, as well as energy and ICT are excluded from the analysis. Being almost completely rain-fed, cropping systems and the national food system in Nigeria are sensitive to climatic conditions. Included in the scope of the analysis is the impact of global climate change on agricultural yields. Excluded from the analysis are the feedback mechanisms from more extreme weather, degraded land and water resources, and climate change adaptation on the resilience of the primary production systems [16]. Human-induced crises such as forced displacement of populations due to armed conflicts, insurgency, forced evictions and herdsmen-farmers clashes are affecting food systems in Nigeria, e.g., [17,18]. The impact of conflict and political instability on the food system is excluded from the analysis. Political drivers of food systems including leadership and governance and conflicts/humanitarian crises are largely excluded from the analysis, except for limited discussions of land tenure systems (Section 2.3).
- Household level: Included are the access to productive assets such as land or fishing grounds, capital and infrastructure for livelihood activities of households, with distinctions between skills levels in the labour market; excluded from the analysis are community-level or other in-country inequalities in access to these assets, as well in access to care, hygiene environment and opportunities for schooling. While demographic change is included in terms of population growth rates, it is not included how the food system must increasingly cater for young and urban consumers, with their nutritional needs and aspirations. Urban patterns of food choice are noticeably different from rural patterns across Africa, and include less consumption of traditional staples, more animal and dairy products, more processed food, and a much greater proportion of food consumed outside of home [19]. Both the possible globalization of food culture and change of traditional food systems in Nigeria related to tribal culture have been scarcely documented, see e.g., [20]. Included in the scope of the present study are the variation in food access and composition of consumed diets across households depending on their regional location. Excluded from the scope are urban and rural differences in the decision-making regarding consumption in the specific demographic, socioeconomic and cultural context; the unequal socioeconomic conditions and institutional environment across households; the unequal distribution of food, money and power of decision-making between members of the household.
2.2. Economy-Wide Modelling Framework
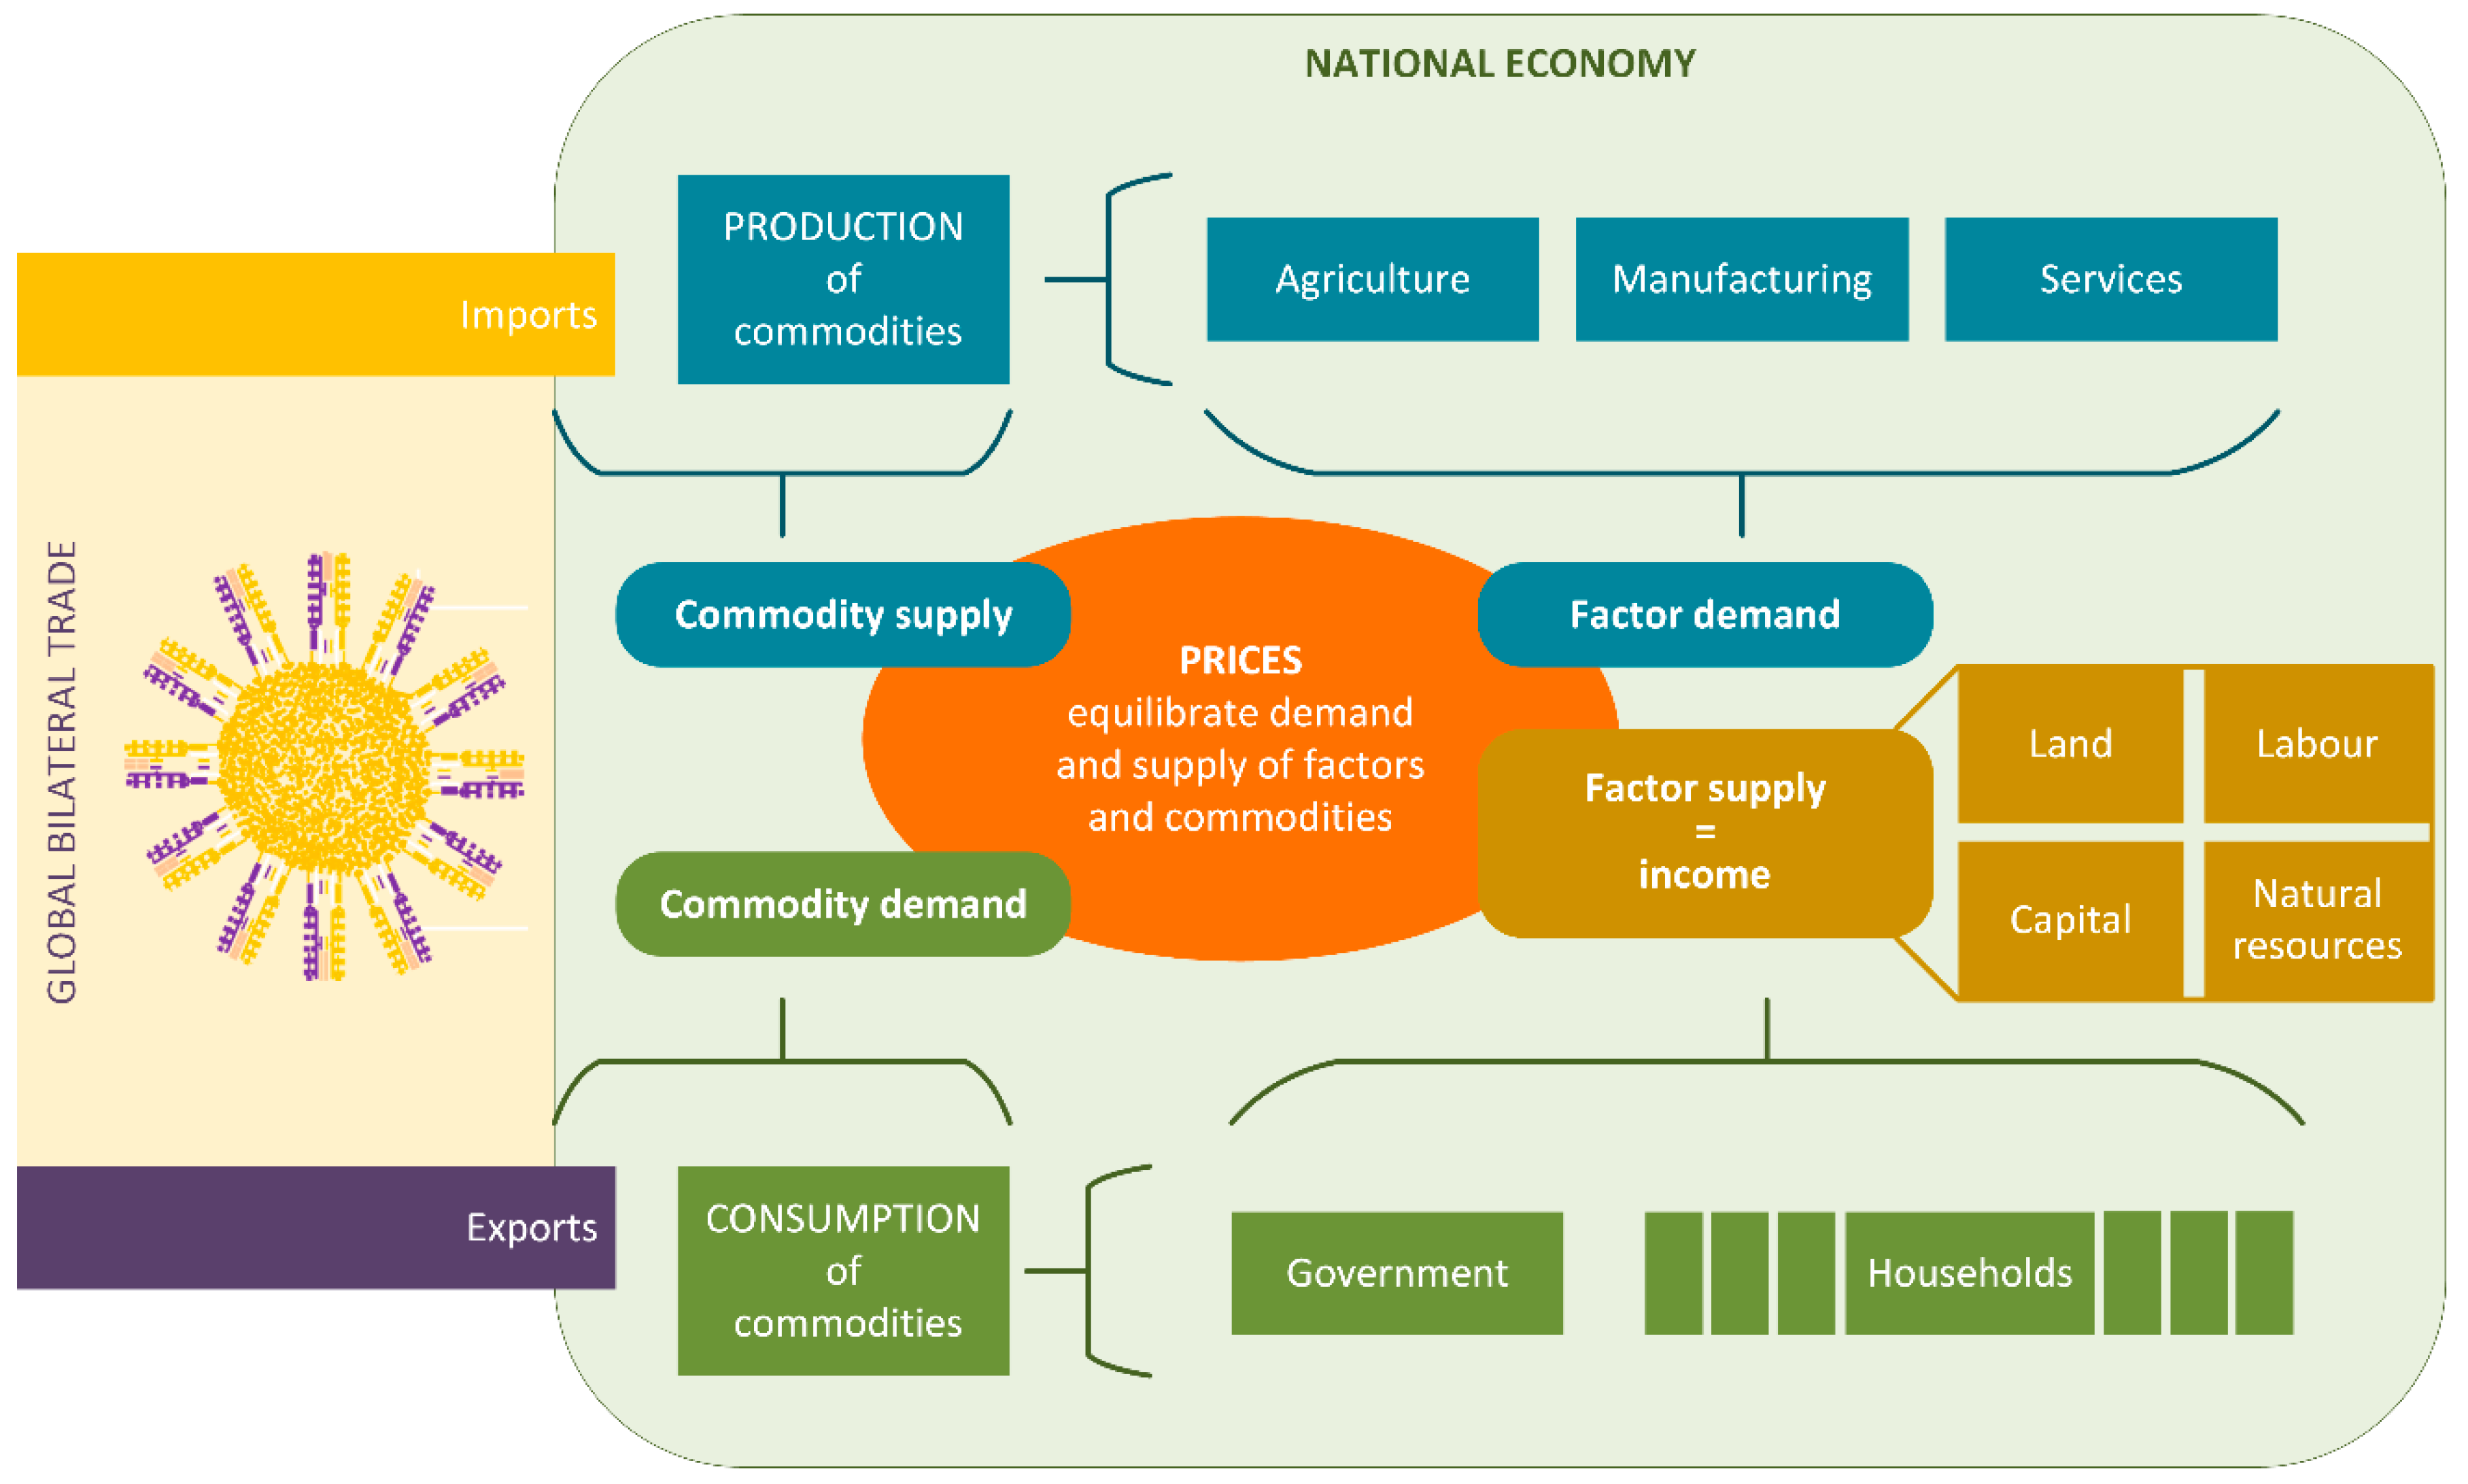
This study applies the MAGNET (Modular Applied General Equilibrium Tool) model, a well-established CGE model used for global projections on agriculture, bio-based economy, climate, food security and nutrition as well as country-specific assessments (see for instance [21,22,23,24]). As an economy-wide model, MAGNET is well placed to examine the costs and benefits of policy scenarios via changes in input and output prices and allocation of competing (agricultural and non-agricultural) uses of primary factors and intermediate inputs [25]. From a food systems perspective, the key strength of MAGNET lies in exploring food systems dynamics, by capturing the interlinkages among different food industry players (farmers, processors, suppliers, traders and consumers) in one consistent framework (see the circular flow of MAGNET in Figure 1). Scenario analysis using MAGNET contributes to an ex-ante identification of challenges and pathways for innovation taking into account trade-offs and synergies between various objectives.
2.2.1. MAGNET Model Database
MAGNET is a neoclassical recursive dynamic, multi-regional, multi-commodity computable general equilibrium (CGE) model. At its core is the well-known Global Trade Analysis project (GTAP) model and the associated GTAP database. The core of the MAGNET database is the 2011 reference year of GTAP database version 9.2, distinguishing 140 regions, including Nigeria, 8 production factors and 57 sectors [26]. To enhance MAGNET’s ability to assess food system and health implications of diet changes, FAOSTAT data is used to split standard GTAP sectors, adding more detail in terms of types of meat (beef, other ruminants, pork, poultry) both in terms of primary products and processed meat products. FISHSTAT data is used to split the GTAP fish sector into aquaculture, wild catch and a fish processing sector producing processed fish for consumers and fishmeal for use as animal feed. To capture the scope for livestock intensification and its potential links to aquaculture, an animal feed sector is defined which uses fishmeal among other crop-based inputs. For crops a fertilizer sector is separated from the broader chemical sector, which can be used as a substitute for land. This allows changes in intensification based on land rent and agricultural prices.
Running the model with the full MAGNET database of 140 regions, 83 sectors and 8 factors is computationally infeasible. Given the purpose of this study, a food-focused sector aggregation was used while the world was aggregated in 11 regions, keeping Nigeria as an individual country (see Table 1). Table 2 lists the food sectors, indicating the amount of food system detail the model is able to capture at macro level. The complete list of sectors included in MAGNET is in Appendix B, Table A1.
2.2.2. MAGNET Production Structure Assumptions
Assumptions on the extent to which inputs can be substituted with each other are a key driver of price and thus food system developments. Production in any of the MAGNET sectors listed in Table 2 are modelled using flexible, multilevel nested Constant Elasticity of Substitution (CES) production functions allowing for substitution of different primary production factors (land, labour, capital and natural resources) and intermediate production factors like energy, fertilisers and animal feed components. In primary agriculture, the production tree is more complicated than in the rest of the economy to be able to capture agricultural intensification processes.
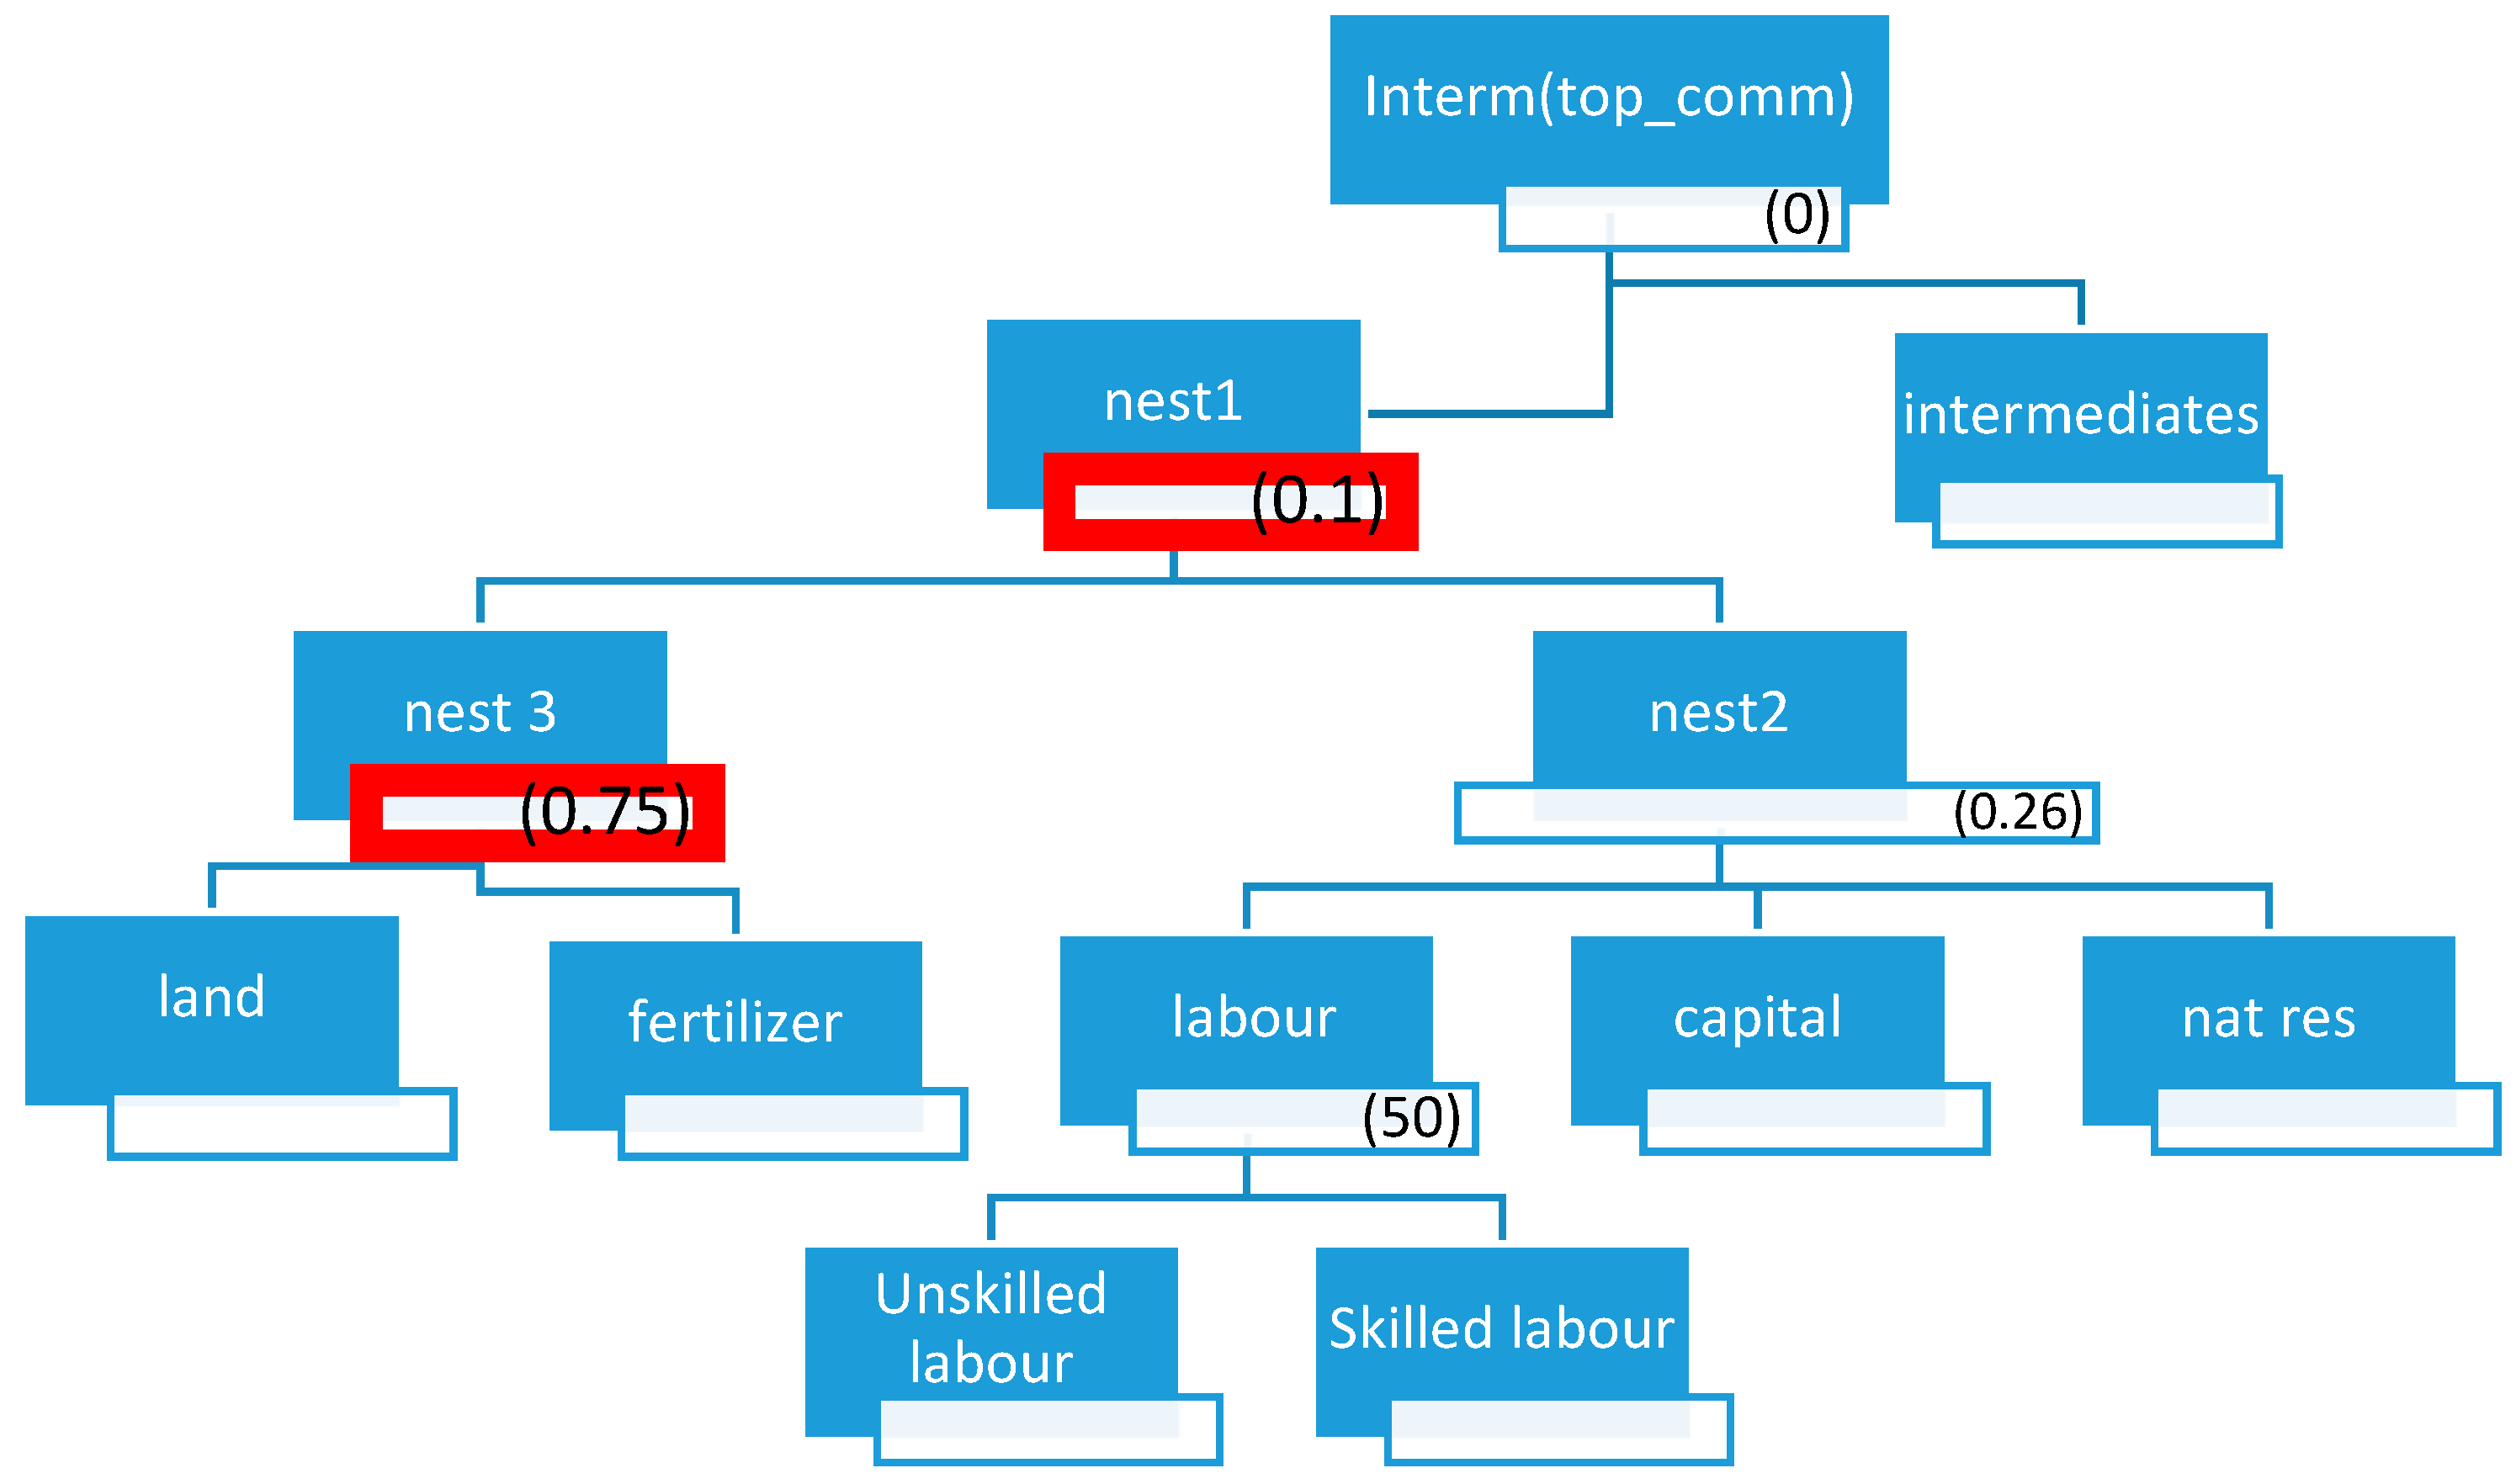
The production structure for arable and horticultural sectors comprises four composite levels or nests (Appendix A, Figure A1). In the upper nest, intermediate consumption and value added are combined in fixed proportions (the corresponding elasticity of substitution is zero (the substitution elasticity values are based on GTAP)). This captures the idea that certain intermediate inputs like seeds are always needed and cannot be substituted by for example labour. One level down the value-added composite consists of a land-fertilizer bundle and the remaining production factors bundle, with substitution elasticity close to zero (0.1) (the choice for very low substitution elasticity is based on simulations made in the past where we observed that low substitution elasticities produce more plausible simulation results [23]), suggesting that that there is limited substitution between the inputs. The substitution between land and fertilizer is further defined on the third level, with the elasticity at 0.75, respecting the assumption that it is easier to substitute for inputs that are on a lower level of production structure where inputs are more similar. Because the substitution elasticity is less than 1, the factors behave as complements—an increasing demand for land will tend to increase demand for fertilizer but since the elasticity is not zero land can be substituted for fertilizer. This limited scope for substitution captures the fact that the chemical fertilizers in the MAGNET fertilizer sector can reduce but not fully replace the use of land.
The production tree for the livestock sector is similar to crops (Appendix A, Figure A2) but combines land with feed, which is further composed of concentrated feed and feed from different crop sectors. Again assuming (imperfect) complements rather than substitutes (elasticity is <1) allows limited scope for intensifying livestock production by substituting land with feed. Finally, the production structure in food processing sectors as well as the remaining industry and services consists of only 2 levels (Appendix A, Figure A3). The production tree has only one nest (following GTAP), assuming that all production factors have the same substitution elasticity which is higher than 1, suggesting that the factors behave as substitutes while the bundle of factors behaves as a perfect complement to all intermediate inputs (elasticity of 0 in the top nest).
2.2.3. MAGNET Labour and Land Availability
Assumptions of production functions determine the food production responses to input price changes. Availability of factors, notably labour and land, affect the extent to which sectors need to compete with each other which is reflected by changing wages and land prices.
Modelling of labour markets in MAGNET reflects the presence of rent and wage differentials between agricultural and non-agricultural sectors [27]. This study adopts the assumption that unskilled labour cannot move freely between agriculture and the rest of the economy. However, within the agricultural sector, skilled and unskilled labour behave as perfect substitutes. The market for skilled labour is not segmented and skilled labour is free to move in all sectors in the economy. This modelling assumption is adopted in the light of a projected increase of skills endowment in Nigeria. Allowing more educated labour to be employed elsewhere increases the absorption capacity of the projected boost of skills in the economy, where at the moment 70% of skilled labour is employed in services.
Availability and thus price of land in MAGNET is determined by the change in total agricultural land and the ease with which land can move between agricultural sectors. Total agricultural land supply is not fixed in MAGNET but a function of the real land price. If prices increase, more land is taken into cultivation, but the closer to the upper limit of land potentially suitable for agriculture the more costly land becomes. This land supply module captures that accessible and fertile lands are taken into cultivation first and the further one expands agricultural land, the more costly the conversion becomes. The price elasticity of land supply for all countries in MAGNET has recently been estimated [28]. In Nigeria, the elasticity is set at 0.07, which is lower than for instance in Ethiopia (0.22), and which reflects the rigidity of the land market as well as the limited possibility of further expansion of land in Nigeria.
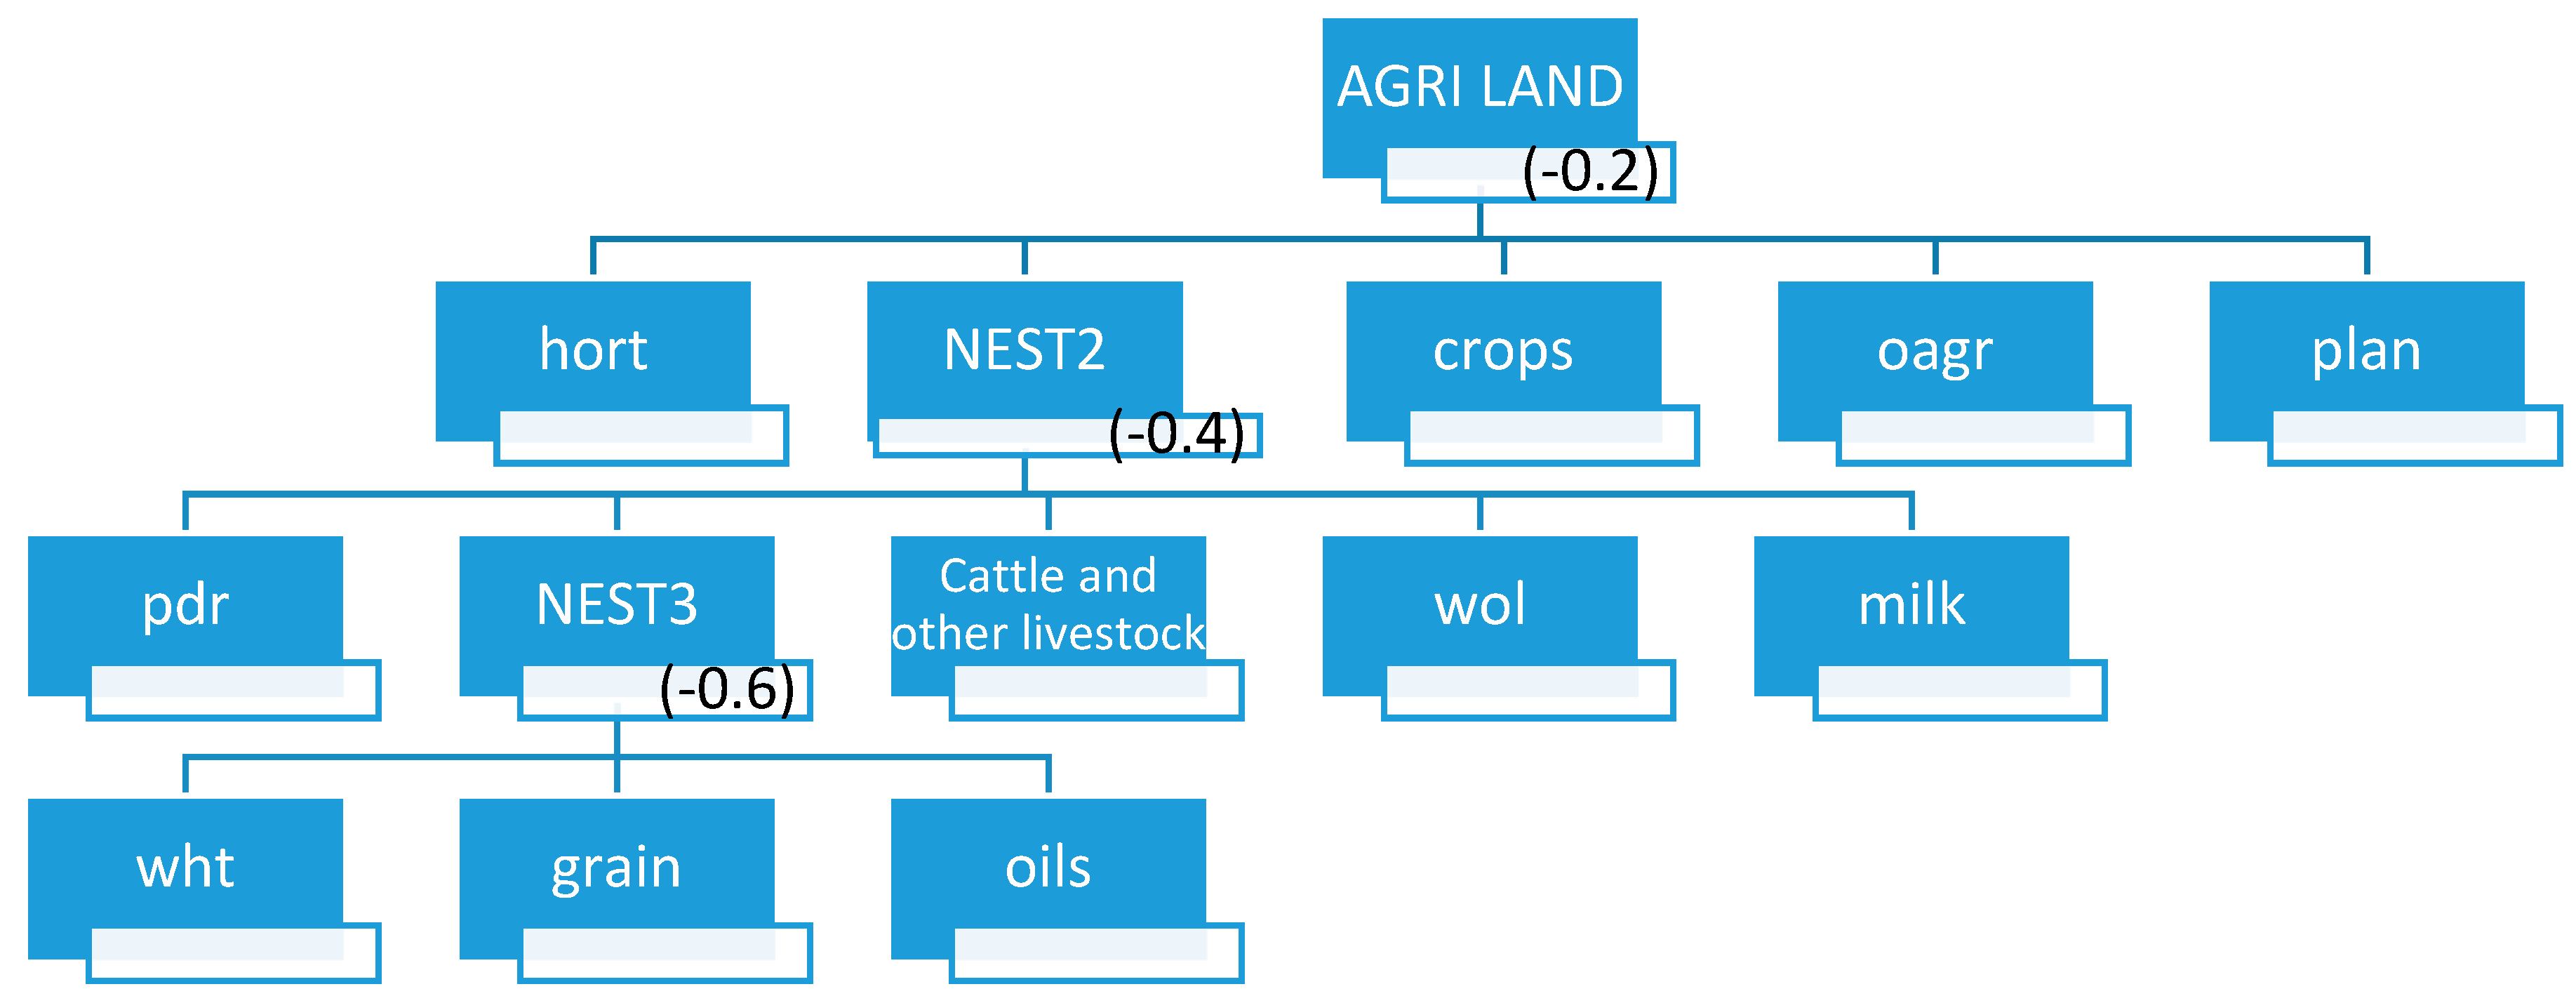
The land allocation module in MAGNET then allocates total agricultural land as a heterogeneous production factor (e.g., having different biophysical characteristics) depending on the commodity produced by a specific sector. This means that different land types cannot be perfectly substituted and that adjustment costs are involved when land moves from one sector to the other. This is modelled by using a constant elasticity of transformation (CET) function (for a schematic representation of the CET land function, see Appendix A, Figure A4). Effectively, the land allocation module assumes that it is easier to reallocate land within the group of cereals, oilseed and protein crops (COP) activities (NEST 3), while greater adjustment costs are assumed to enable land to move out of COP production into, say, horticultural activities.
2.3. Extension of MAGNET for Modelling Nutrients Supply using the GENUS Database
A key strength of MAGNET is its modular structure which allows the user to easily activate those modules of most relevance to the study at hand. In this case, the study makes use of the MAGNET extension to incorporate the Global Expanded Nutrients Supply (GENUS) database [29]. The GENUS database provides macro and micronutrient data for 225 products in 175 countries, including Nigeria. GENUS allows to disentangle the nutritional aspects of food supply—both in terms of the numerous nutritional indicators, and in terms of a much more detailed food composition (see Appendix B, Table A2 for the nutritional indicators in Nigeria in the Base year). The GENUS database combines the FAO food balance sheets (FBS) with trade data and food compositional tables to construct a global and historical food and nutrient supply database. From the estimates of the domestic food supply in the FBS, the edible food supply is obtained after taking into account slaughtering, peeling, etc. Using region-specific composition tables, nutrient supply is derived and provided at a 95% confidence interval (median, low and upper bounds). See Appendix B, Table A2 for the estimated range of the nutrient supply for Nigeria. In the MAGNET GENUS extension, the individual GENUS food items are mapped to MAGNET commodities. Changes in the growth of quantities demanded by household as modelled by MAGNET are used to update the nutritional indicators in the GENUS data, resulting in consistent assessments of food and nutrient availability for the representative household in MAGNET [21]. In the model version applied in this paper, a single representative household is used.
It is important to make a cross-validation of the nutritional data with other sources in the literature (Table 3). Brouwer et al. (2018) explore food and nutrient intake at the household level based on the General Household Survey (GHS) for Nigeria [30]. The GHS is a survey in the format of the World Bank’s Living Standard Measurement Study—Integrated Surveys on Agriculture (LSMS-ISA). It collects data on agricultural practices, socio-economic characteristics of households and communities in a nationally representative sample of 5000 households [31]. Brouwer et al. report average daily caloric consumption from GHS for households in adult female equivalents, which is approximately 20% lower than the usual average adult equivalent. The study of Akerele (2015) computes per capita adult equivalents per rural and urban population, based on the most recent national food consumption and nutrition survey (FCNS) in 2003–04 [32]. In Aromolaran (2010), the caloric data are based on the author’s survey of 480 households from semirural areas of south-western Nigeria [33]. When comparing across these sources, it is apparent that all agree on a high share of carbohydrates in the diets (above 60%). Cassava is one of the most important sources of carbohydrates in the Nigerian diet. The GENUS database estimates the average intake of cassava of about 280 g of per day, which is similar to the data collected in a local survey [34]. It is also noted that in Aromolaran, where data comes from a specific region, the share of roots and tubers is even much higher than in the national surveys (56% of total consumption).
It is not straightforward to compare the total caloric consumption across the sources due to differences in the definitions and measurement. The total caloric consumption expressed in female adult equivalent is 2346 Kcal. When converted to male adult equivalent (2815 Kcal), it is close to the caloric consumption reported in the GENUS database (2969 Kcal per capita). However, it is important to note that the GENUS database measures available caloric supply or availability derived from food balances, whereas the nutritional surveys measure the direct caloric intake by households and individuals. To reflect this in our caloric projections, a correction factor to the GENUS caloric data is applied to downscale the caloric availability to intake by average female equivalent reported in the GHS analysis, which is considered the most representative, given that the data from Akerele is based nutritional surveys from 2003–2004 and Aromolaran provides nutritional data from a single region.
In addition to the caloric composition, it is also insightful to compare the nutritional adequacy of GENUS with other sources. A ratio of nutrient intake to the recommended average intake is calculated and compared with the GENUS nutritional data converted to the female equivalent intake. Table 4 shows that the nutrient adequacy is very similar in both data sources and fat, riboflavin, iron and calcium are the most deficient nutrients in Nigeria. On the other hand, the intake of other micronutrients such as vitamin A, B6 and vitamin C is sufficient. However, it is important to note that even when the average intake exceeds the recommended dose, due to variation in incomes and diet patterns, there are households that do not meet the requirements.
2.4. Quantified Drivers of Food Systems Change in Nigeria
To build the foresight on national food systems, the paper follows the scheme presented in the previous section. From the modelling perspective, this means adopting various choices on how the key national drivers of the food systems will evolve in the future. After specifying this, it will be able to assess how the impact of these drivers will affect future food systems and determine the important limitations and opportunities for Nigeria.
The first considered driver is the GDP growth. After 2000, Nigeria enjoyed a decade of favourable economic growth with average annual rates around 8%. Right before the recent crisis, the economy was growing about 5% p.a. [1]. Such high rates, which result in doubling total GDP in only about 10 years, are in line with Solow’s theory of economic growth that expects that countries with an initially low level of capital stock grow faster to accumulate new capital. If Nigeria sustained such growth rates into the future, it could easily step up to a higher income level category. However, the recent economic crisis has also revealed some of the bottlenecks of the economy, which are a high dependence on the oil sector, an overvaluation of the exchange rate and armed conflict [35]. This means that the favourable projections of GDP growth are conditional on resolving some of the weaknesses.
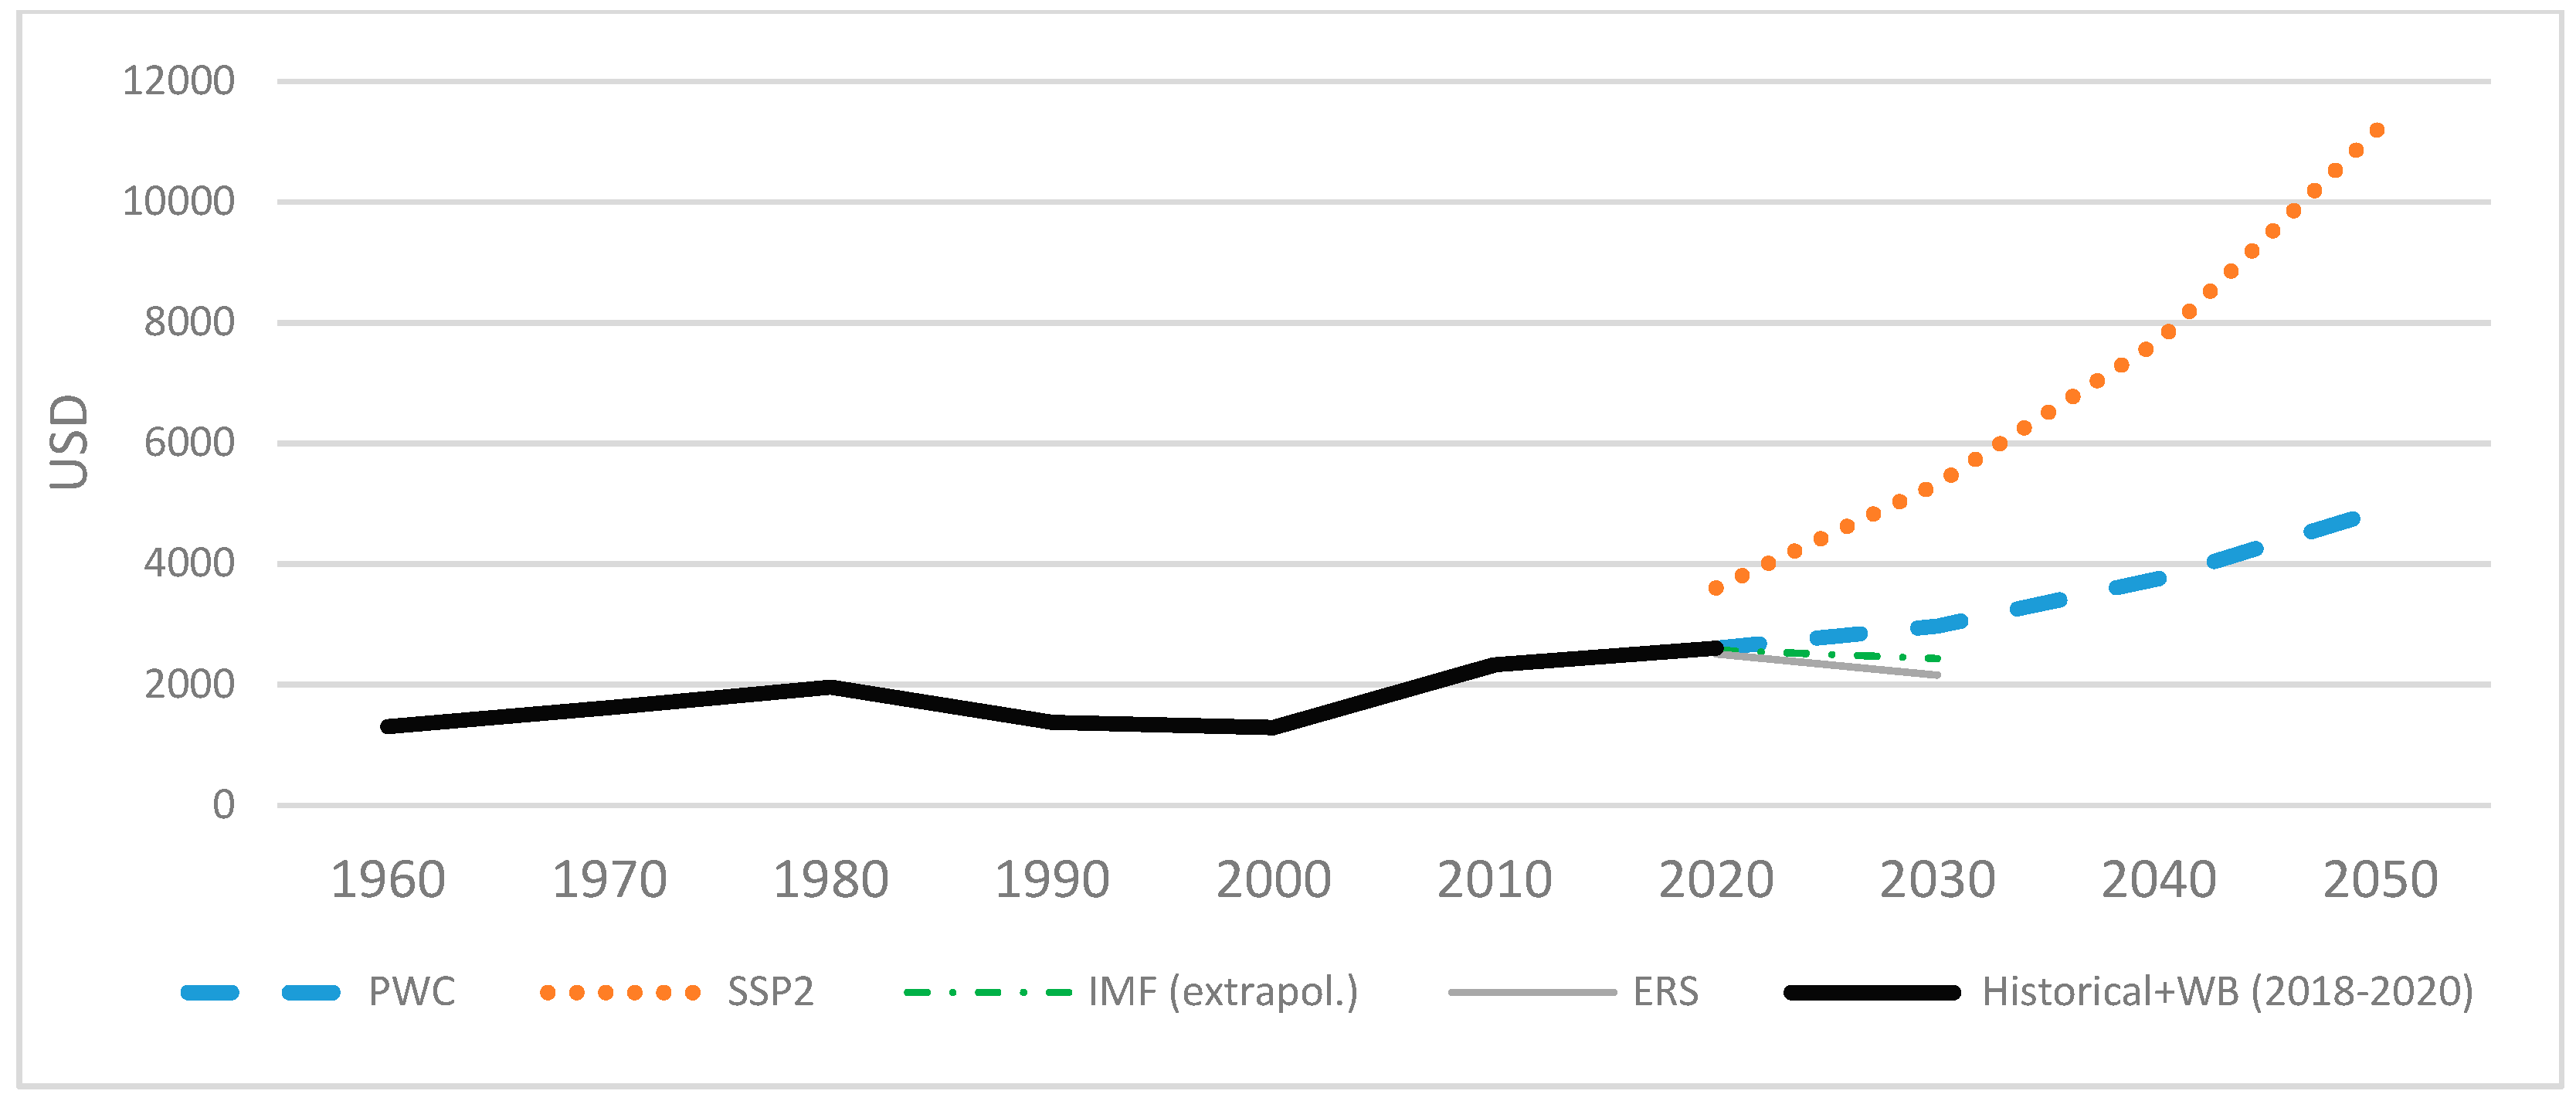
To translate the expected economic performance into our MAGNET model, there are several established international macroeconomic forecasts, such as the World Bank [36] and IMF Economic Outlooks [37]. However, these forecasts extend only into the closest future (not far beyond 2020) and therefore they are not suitable for long-term projections beyond 2020. For instance, the extrapolation of the IMF forecast beyond 2022 would be biased downwards due to the effect of the recent crisis (see Figure 1). The shared socioeconomic pathways (SSP) projections [38] are commonly used in foresight modelling exercises because of their long-term span and underlying future storylines. However, the projected GDP growth rates in the SSP2 Middle of the Road scenario (Figure 2) seem to be very optimistic, expecting that Nigeria could reach up to 12,000 GDP per capita by 2050, which is at the edge of an upper middle income economy (comparable to Russian Federation or Turkey) [39]. Optimistic, but not that extreme are the projections of the PWC outlook to 2050, which assume that Nigeria would reach about 4500 GDP per capita by 2050, belonging to the group of upper-middle income economies, comparable for instance to Albania [40]. For this MAGNET analysis, the PWC scenario is chosen, which reckons with optimistic but moderate GDP growth (4–5% annually until 2050). This choice is in line with other studies; a recent study uses an assumption of 5% growth for the periods until 2030 [16]. Adopting the PWC scenario therefore assumes a transition of Nigeria from lower-middle income to an upper-middle-income economy.
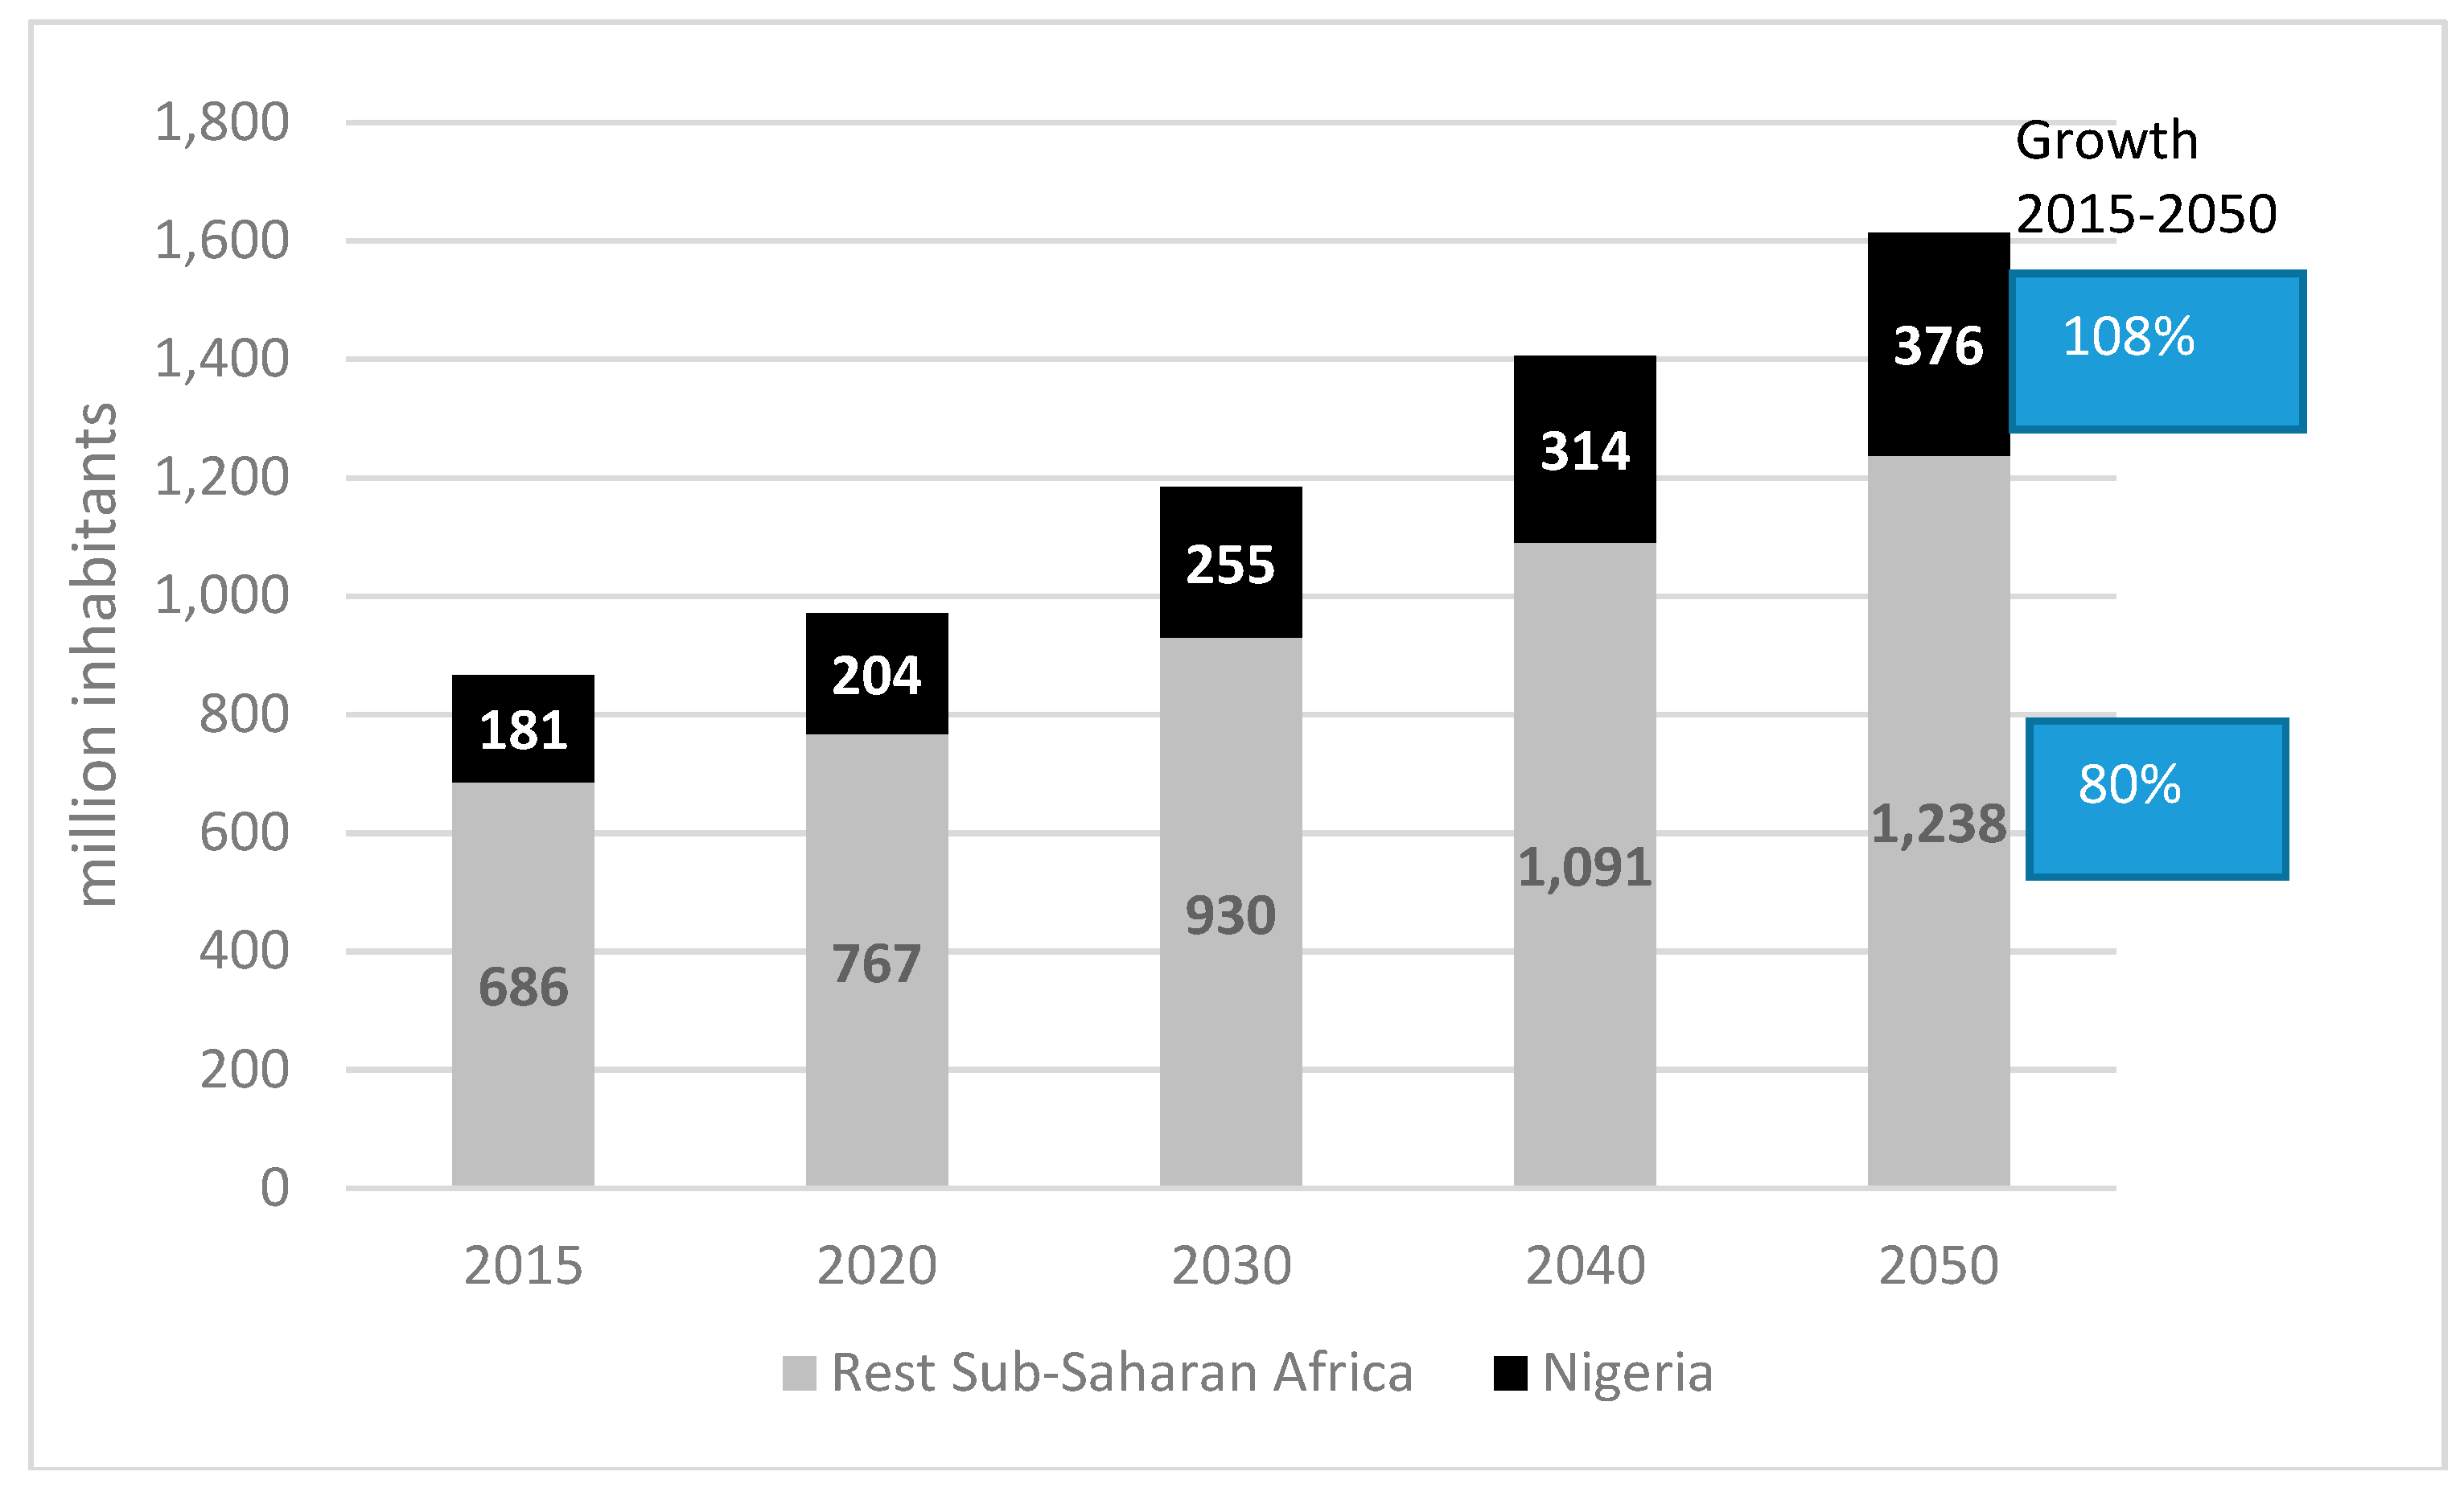
Another key driver for the long-term modelling is the population growth. In this case, the SSP2 projections are based on the UN population growth projections (the medium variant). Figure 3 shows that due to the growth rate exceeding 2% p.a., population will double in Nigeria by 2050. High population growth is also expected in other Sub-Saharan Africa regions, whereas in the EU and other high income countries, the growth is limited.
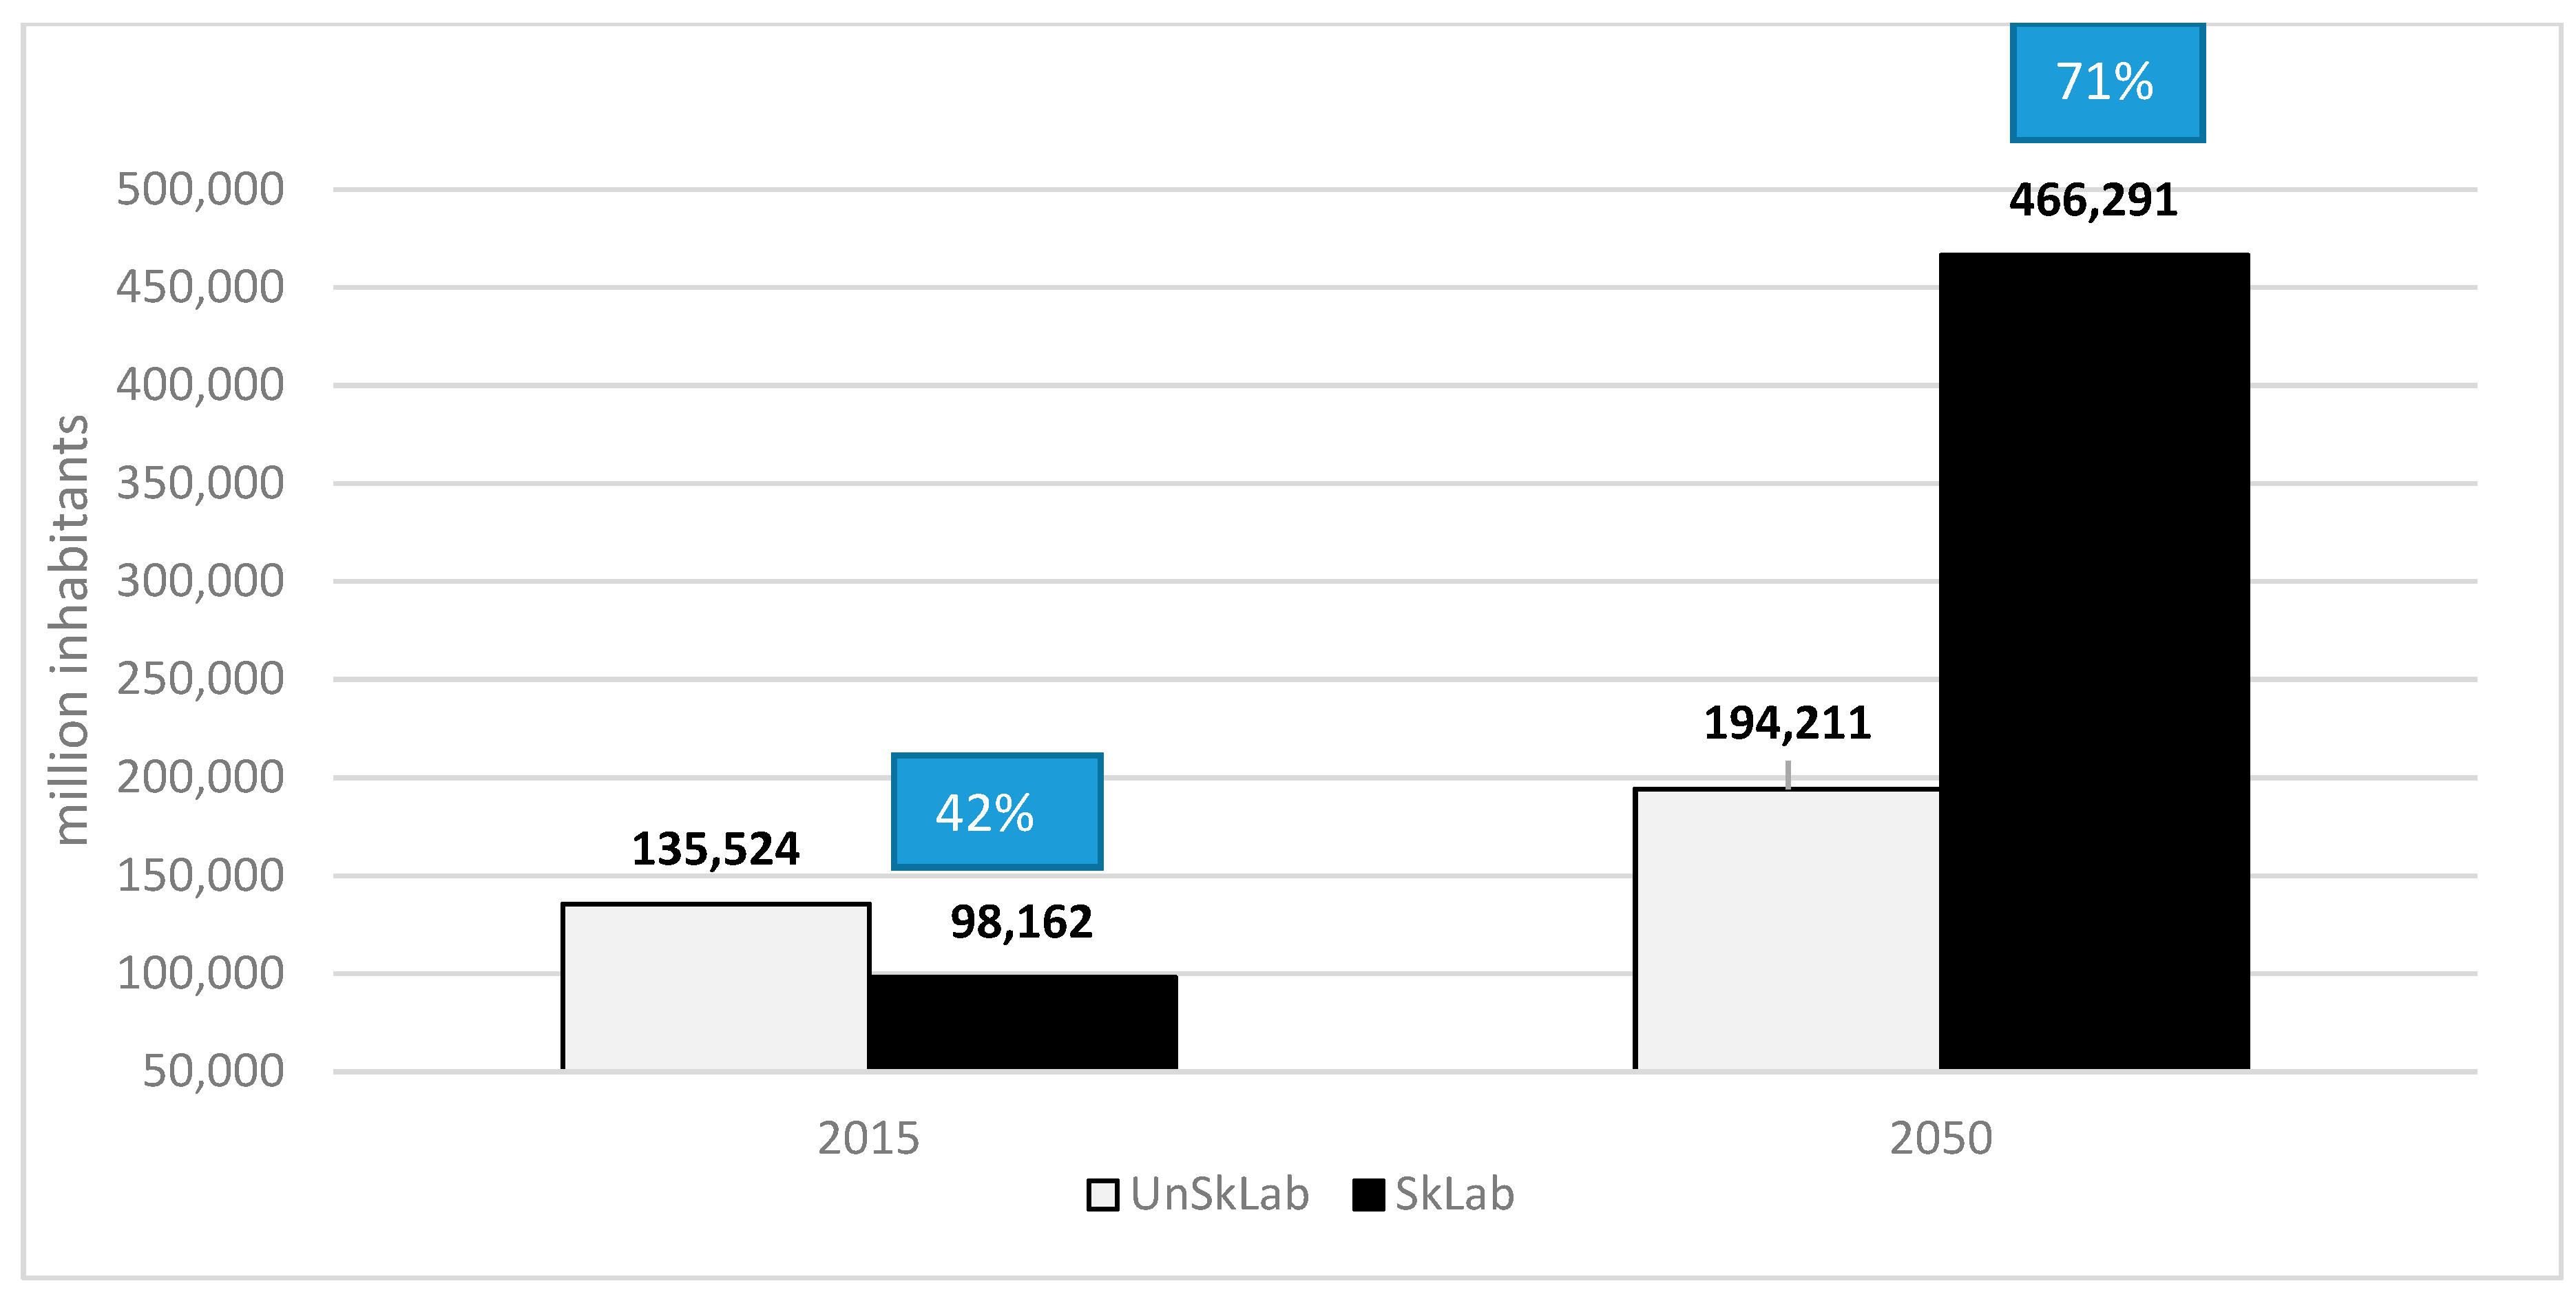
High population growth brings pressure on resources but it can also be an opportunity as a country can benefit from the abundance of labour force. The ratio of skilled and unskilled population will be important for cashing from the demographic dividend—whether the expected mix of skills will find a place in the labour market. In order to translate this into MAGNET, the Wittgenstein labour projections [41] are used. Figure 4 shows that at present, the number of unskilled labour slightly exceeds the number of skilled people in the economy. By 2050, it is expected that the share of skilled labour will reach 70%, up from 40% now, which is comparable with the EU (77%).
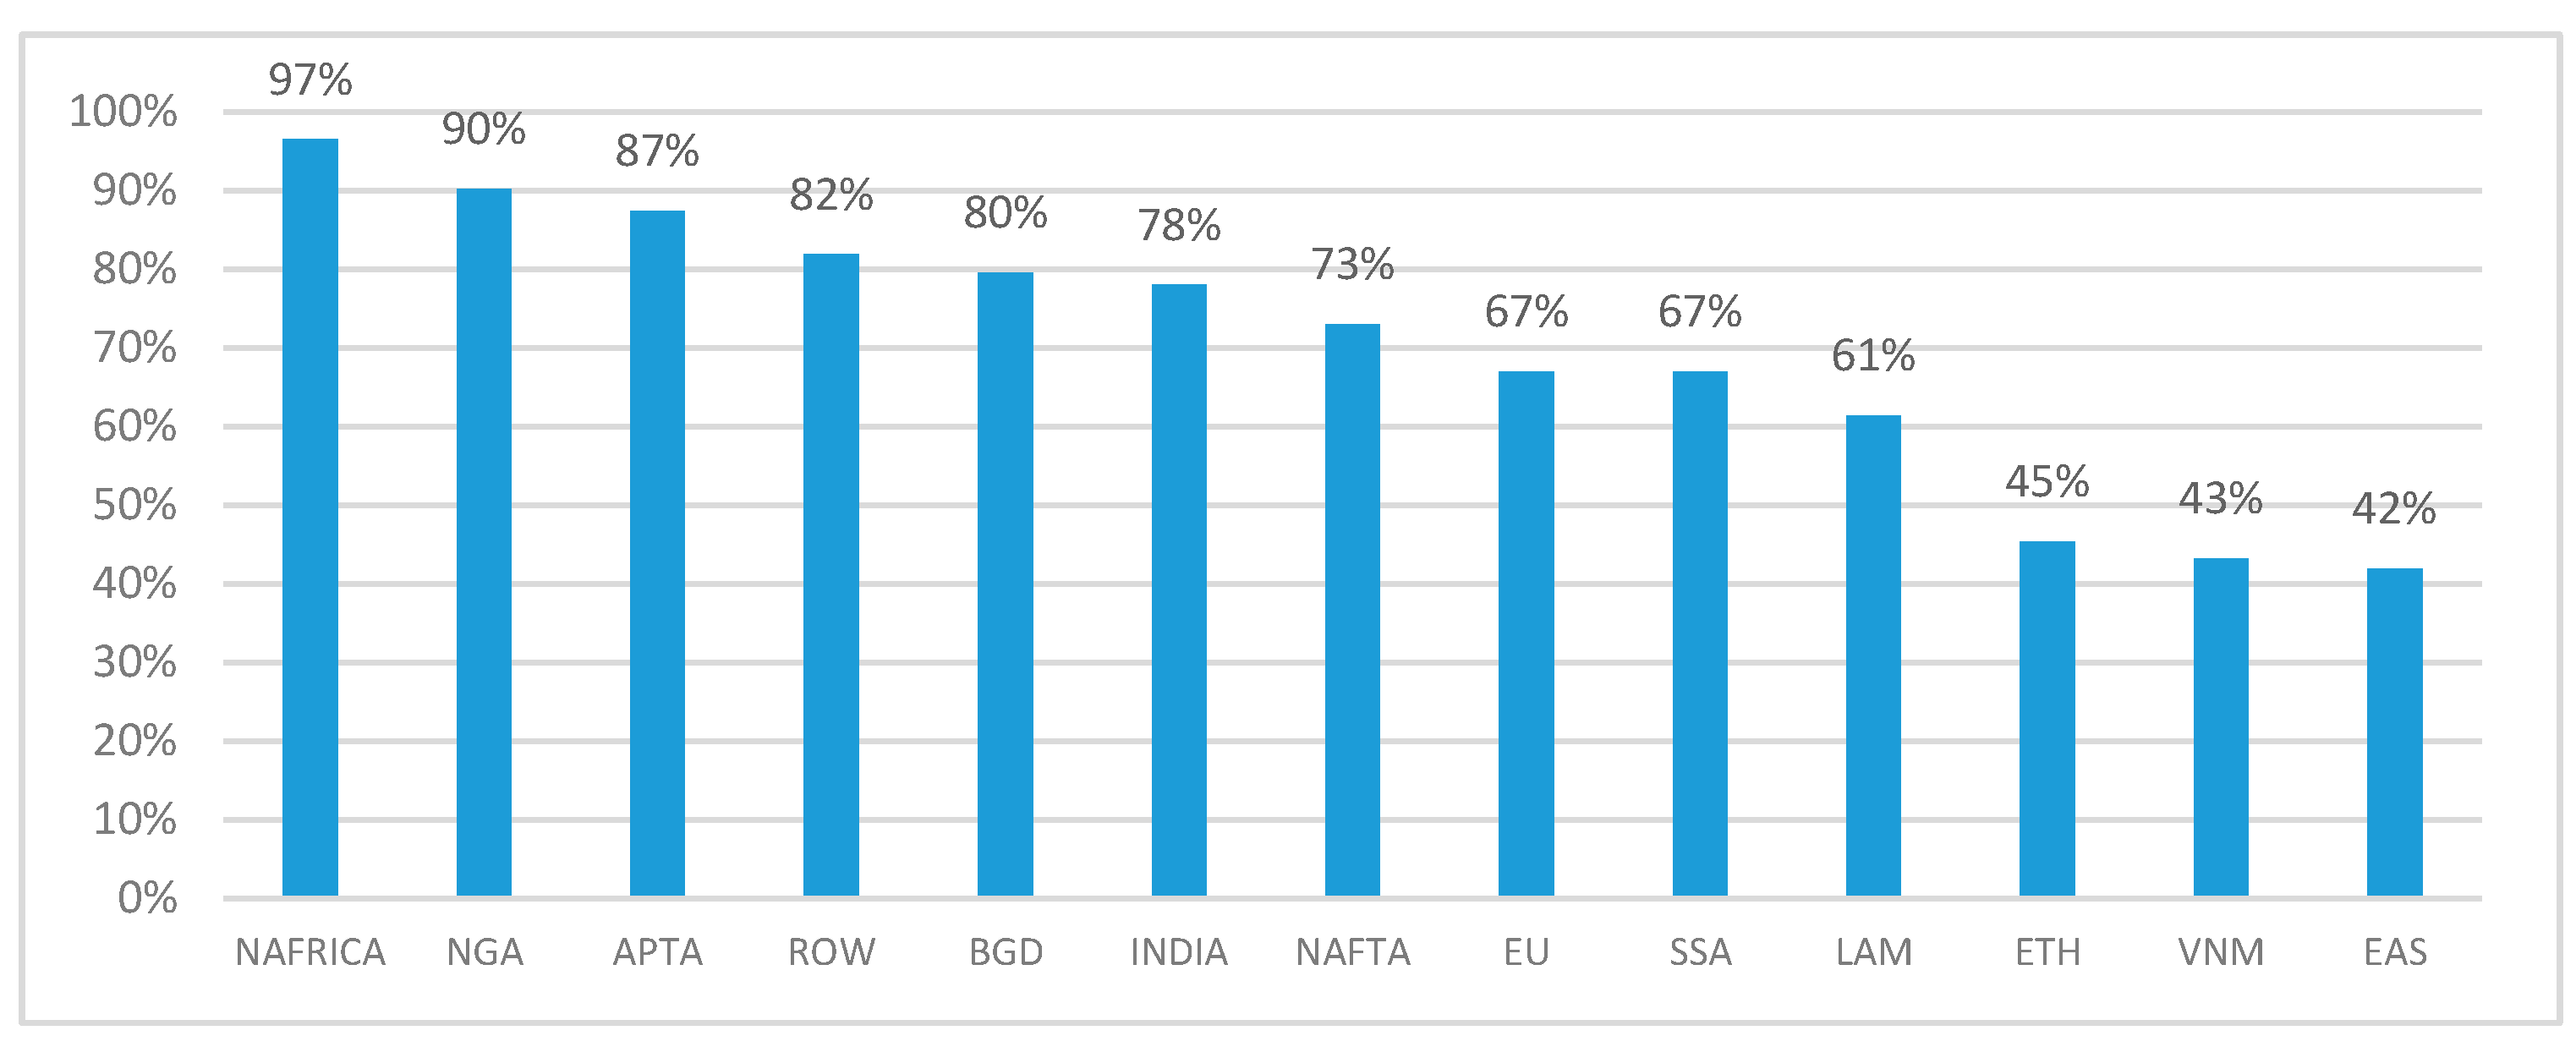
The dynamic economic and population growth that is projected into the future will put tremendous pressures on natural resources in order to feed the existing population. Therefore, it is important to take into account the availability of agricultural land for further expansion. As pointed out in the PWC Report on Nigeria’s agricultural value chains [42], most of the agricultural growth in the past has been driven by area expansion, with limited contribution of yield growth. This suggests that there is only a limited proportion of land that could yet be brought to cultivation. The estimations from the IMAGE model provide an overview of actual land available that can be used for commercial purposes (e.g., crop land and pasture land versus parks) across the world [2]. Figure 5 shows that already, 93% of available agricultural land is occupied. This is because out of the total 79 million ha of available agricultural land, 70 million ha are being cultivated, from which about 40 million ha are arable land and the rest are pastures and other agricultural land (Table 5). This implies that the only way how to increase land use comes from a conversion of the extensively used pasture land to arable land. Indeed, various literature sources claim that about 40% of agricultural land can still be put in cultivation [42,43,44]. However, it must be noted that these claims are only feasible by transforming the existing land use, not by adding more land into cultivation. In addition to this, there are also economic barriers to land access. Administrative procedures for acquiring new agricultural land in Nigeria may be cumbersome and have been put forward as a major bottleneck in the food supply system [42,45].
2.5. Definition of Alternative Baselines
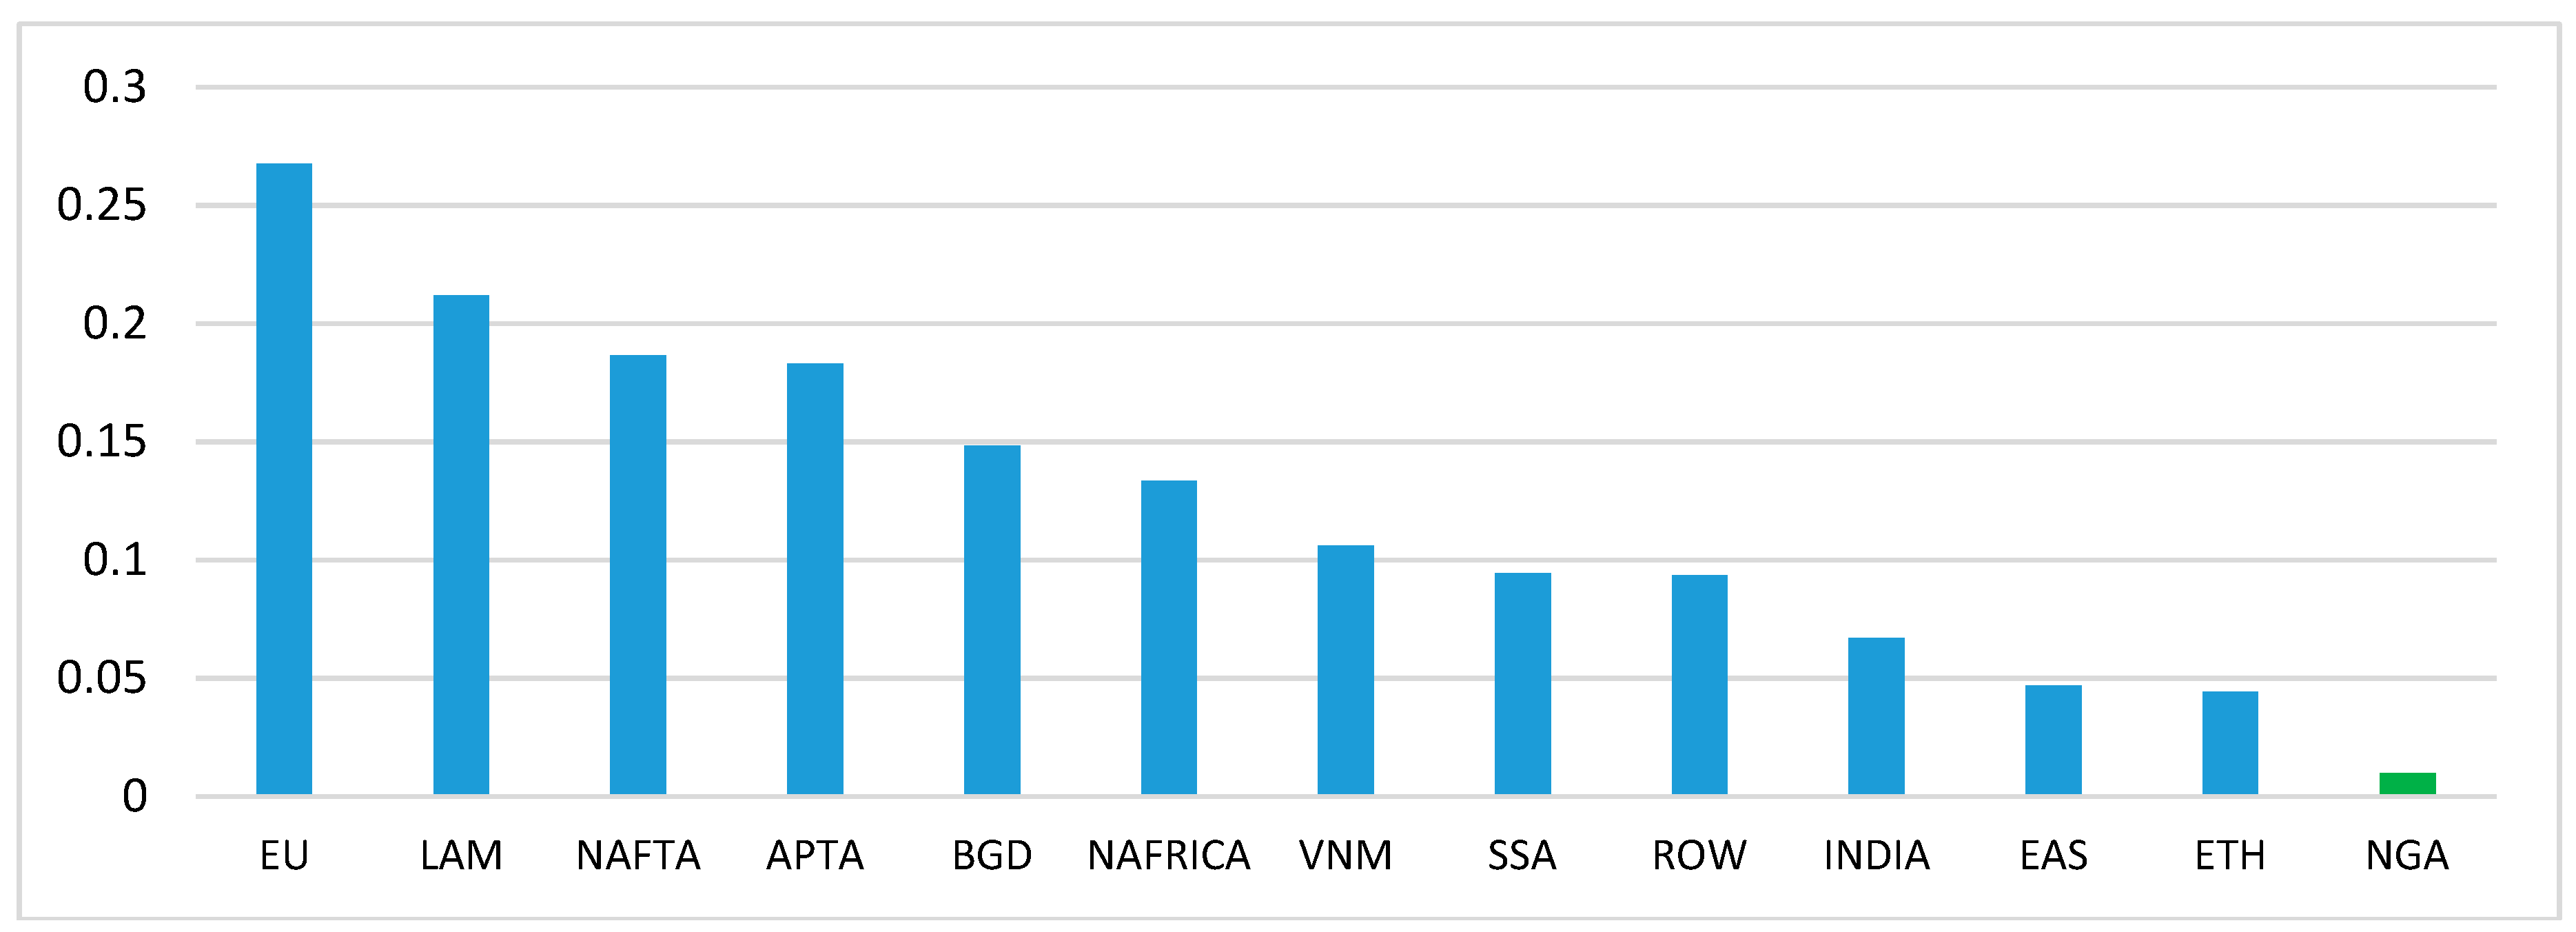
It is becoming apparent that Nigeria will soon approach food production limits if non-land inputs are not used more intensively or if there is not a significant change in R&D policy that would boost the crop and animal sector yields. According to FAO, the potential cassava yield is 40 tonnes per hectare, whereas the achieved yield in Nigeria is only 13 tonnes per hectare [46]. Although the SSP2 projections of yields towards 2050 taken from the IMAGE database [47] assume an annual yield growth of about 1%, which is well above the high income countries, it is not enough to make a significant difference in closing the yield gap with the high income countries. At the moment, Nigeria is one of the countries with the lowest use of fertilizer input to land use (Figure 6). Nigerian farmers utilise on average about 10 kg of fertilizer per hectare, which is very little compared to high income countries such as Netherlands, where the consumption is well above 200 kg [48]. In Nigeria, poor infrastructure increases transportation costs that make fertilizer prices unaffordable [49]. Moreover, in the interaction with poor quality of seeds, the productivity impact of fertilizer has its limits [50].
In order to reflect the need for the input intensification in our modelling approach, two foresight scenarios are designed. The first scenario Land_Fixed is the “status quo” scenario that counts with high rigidity in the land market where an increasing demand for food driven by GDP and population growth will not be able to respond either by higher land expansion or by more intensive use of other factors. The alternative scenario Land_Subs incorporates features of institutional change where increasingly higher land scarcity is adjusted by substituting land for non-land inputs such that they are used more intensively in the production process (Table 6). This is operationalized by increasing the substitution elasticity between land and other inputs both in crops and land-using livestock sectors (corresponding to nest 1 in the Figure A1 and Figure A2). In addition, a higher substitution elasticity between land and feed in the livestock sector and land and fertilizer in the crops sector (nest 3 in Figure A1 and Figure A2) is set. The final choice of parameters is in Table 4. Both scenario versions can be considered as extreme, where under the substitution elasticity of 0.1, which is the default option in MAGNET, there is almost no room for substituting land for other inputs. With the elasticity of 1.2, the inputs behave as substitutes and an increasingly scarcer land can be easily substituted for labour, capital and other inputs. We have performed a sensitivity analysis to assess the response to various levels of substitution elasticity ranging from 0.1 (MAGNET default) to 1.2, which are the upper and lower bounds. The land pressure is notably decreased with substitution elasticities above 0.4.
Another way to mobilize the land market is to allow more flexible conversion between crop land and pastures on the existing land, which makes it easier to increase the share of arable land at the expense of pastures. To operationalize this in MAGNET, a flat land allocation tree is imposed where all types of lands can be perfectly substituted and set the CET elasticity to 1. From the institutional point of view, both measures mean that there is a better mobility of land both for acquiring and for getting rid of.
3. Results
3.1. Agricultural Inputs and Factor Markets
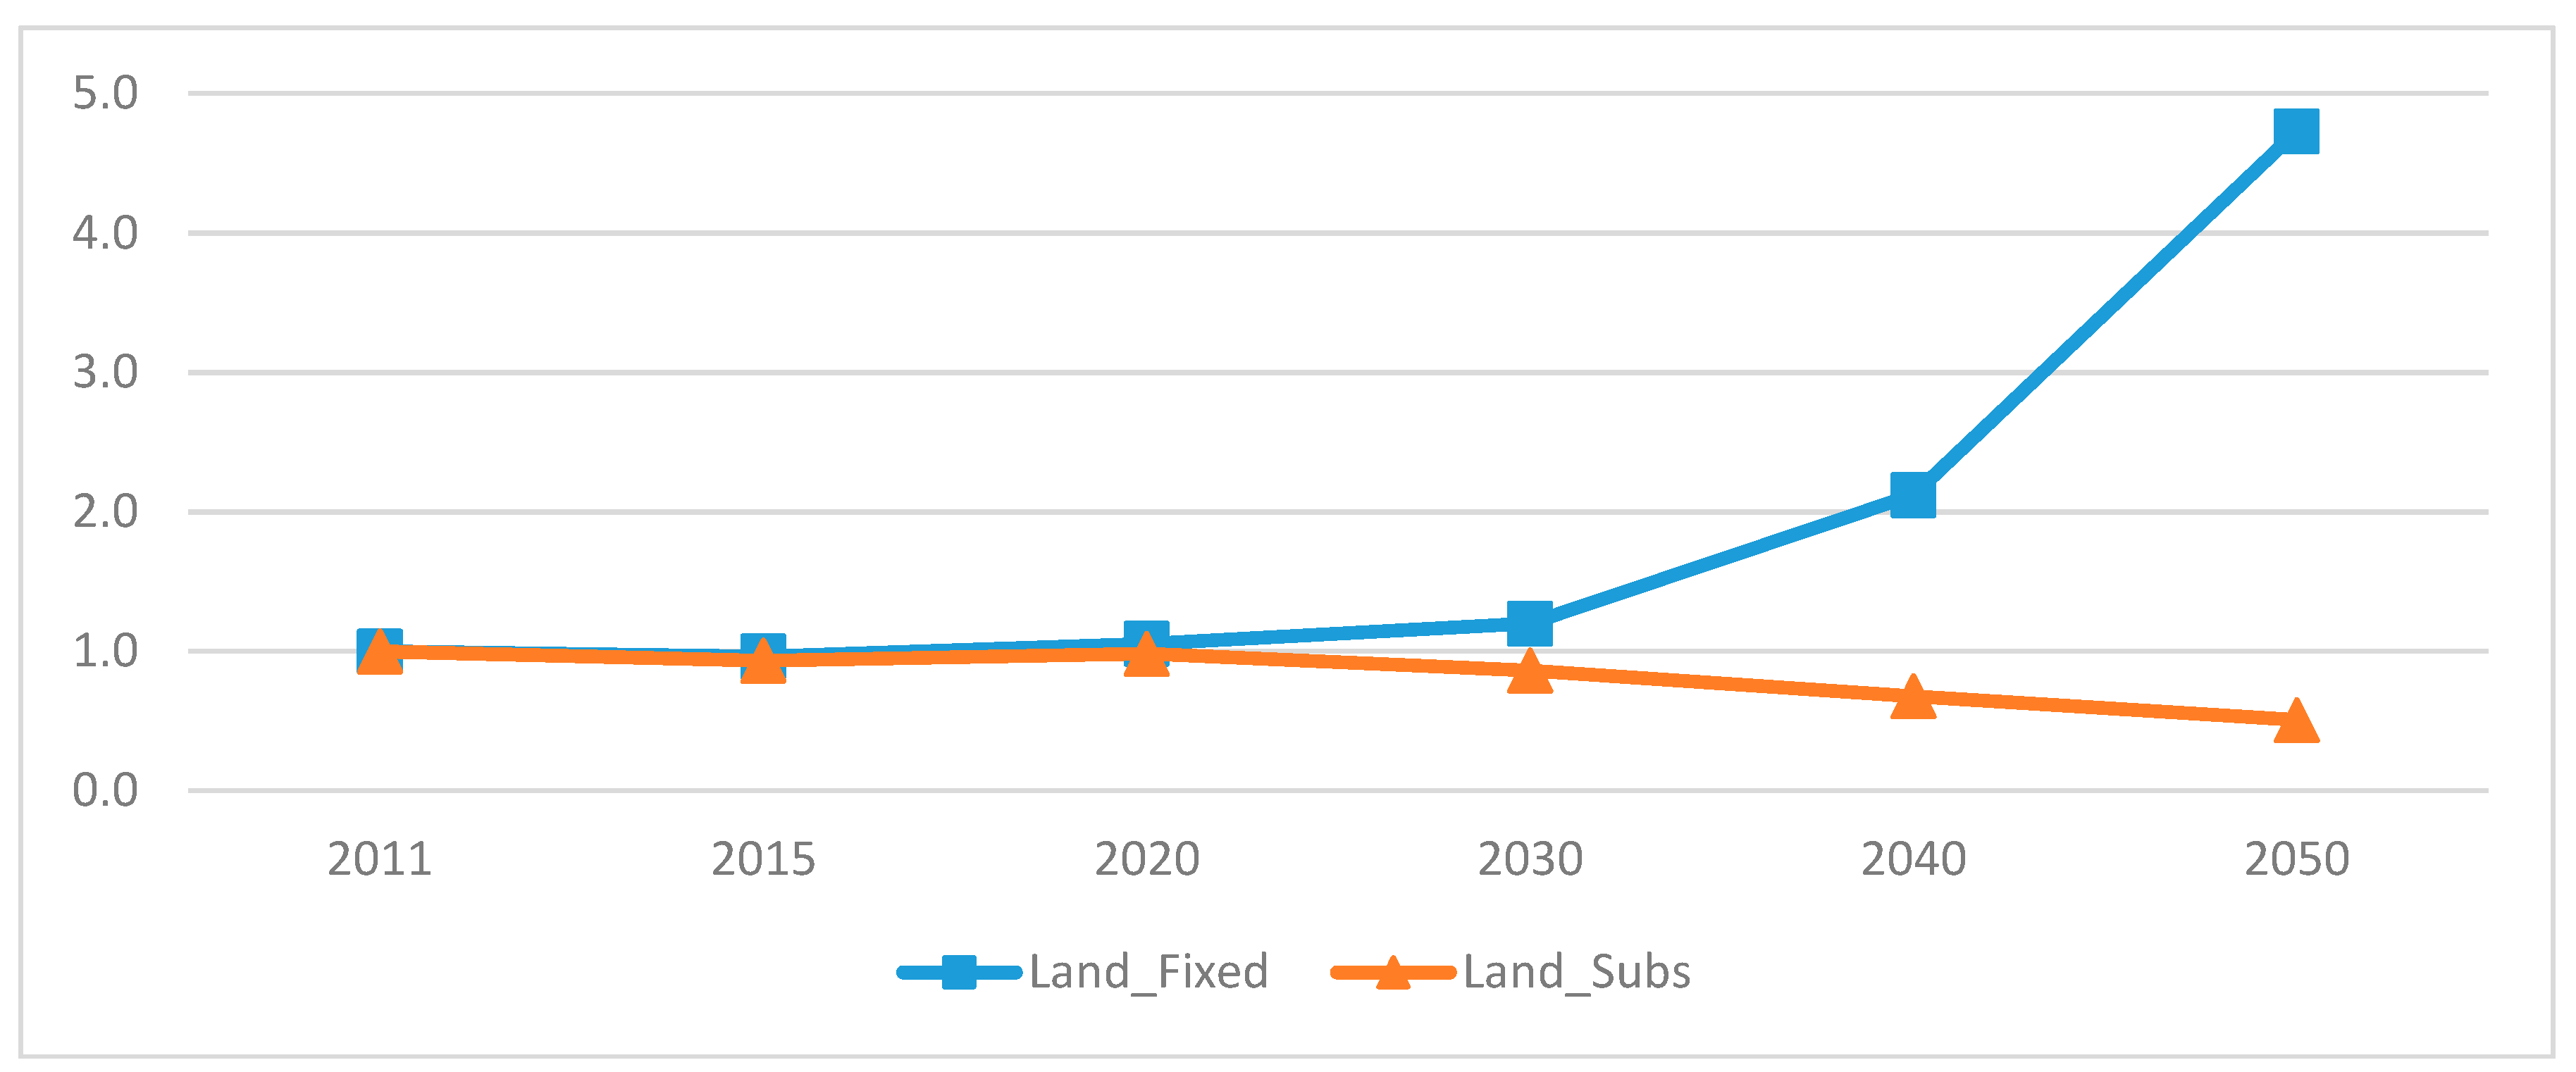
The analysis starts by looking at the agricultural input and factor markets because they directly reveal the pressures or abundance of resources driven by the combination of economic and population growth. First, it is interesting to see what happens with the land prices under both scenarios. Figure 7 shows that if there is no possibility to substitute land for other inputs, land prices will escalate after 2030 due to increasing demand for food. Particularly in the last period, land price growth is enormous, suggesting a real difficulty to meet the demands for food with limited resources. This adverse development could be almost fully avoided if other inputs are used more intensively (Land_Subs scenario). In this case, land prices remain on the same level as in the base year.
Table A3 (Appendix C) shows the comparison of annual growth of factor prices for all production factors. As defined in the scenario framework, in the Land_Fixed scenario land is the key constraining factor in agricultural production, with annual growth of prices reaching up to 13%, particularly in the last two decades. For the other production factors, prices would go down. The difficulties of substituting land for other factors creates a situation where other resources in agriculture are under-utilized and their returns are lower. Particularly, the wages of unskilled labour would go down in primary agriculture. This is related to the fact that the agricultural sector is the most labour intensive sector in the Nigerian economy and the largest employer of unskilled labour (over 70% of unskilled labour works in agriculture). Any decline of agricultural production would be reflected in a decline of agricultural wages.
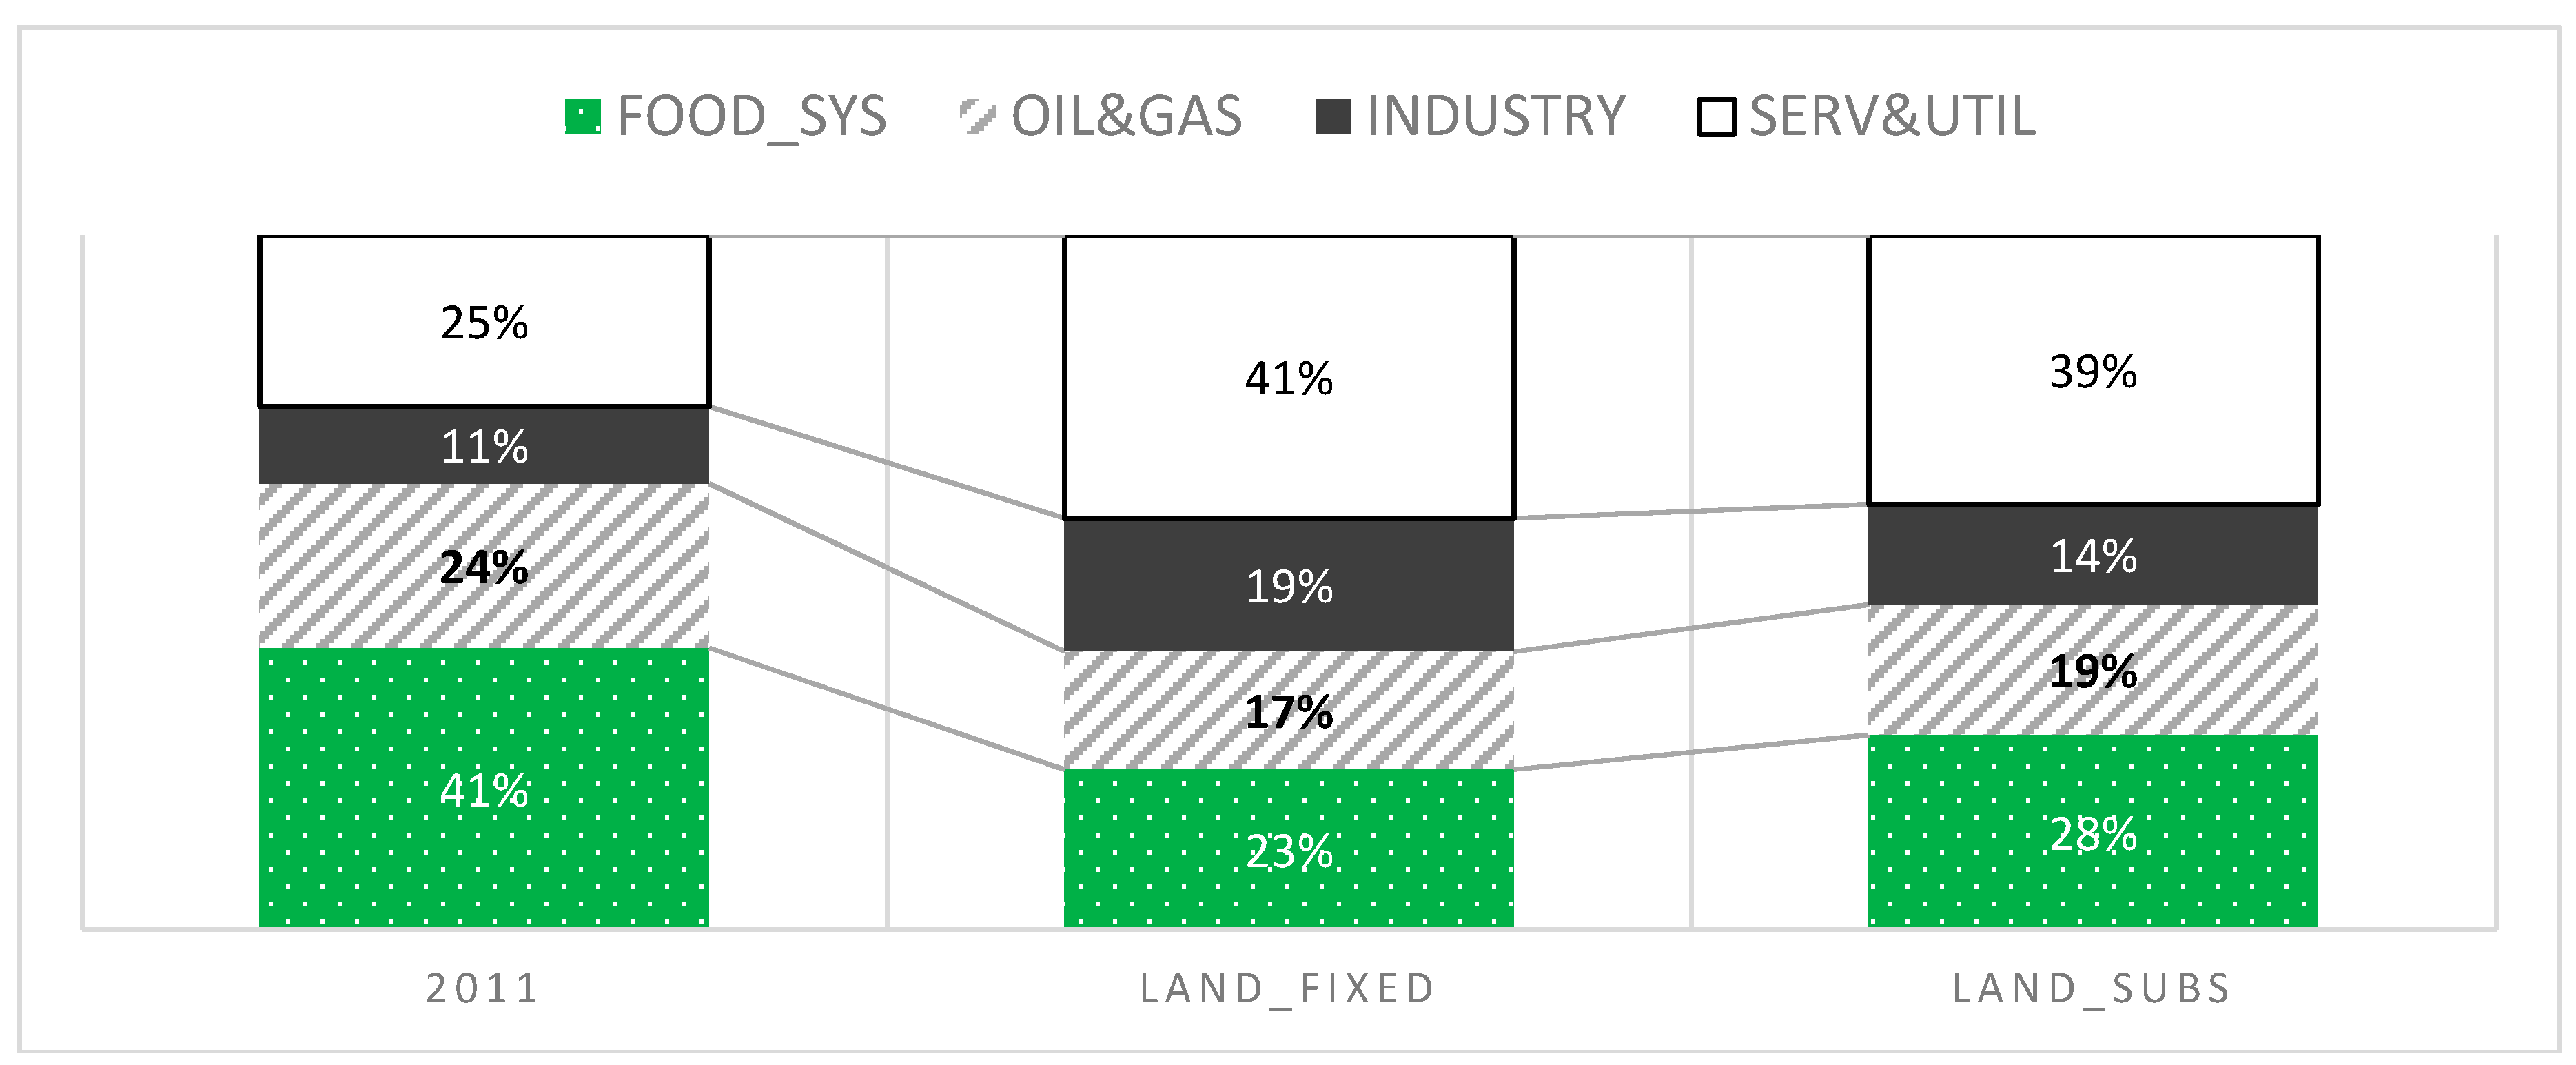
On the other hand, in the Land_Subs scenario, the relative prices of non-land factors decline less notably or even increase (unskilled labour in the rest of the economy). Compared to the Land_Fixed scenario, in 2050, in the primary agriculture, wages of both skilled and unskilled labour would be 60% higher and land prices about 100% lower. This results in a very different composition of value added in both scenarios. In 2011, food system has the largest share in the real value added (41%), followed by industry and services (25%). By 2050, the contribution of food system to the real value added is projected to decline in favour of services and industry, from 41% to 23–28% depending on the scenario (Appendix C, Figure A5). If land remains fixed, the share of food system in total value-added declines more rapidly than in the Land_Subs scenario. On the other hand, it is apparent that the Land_Fixed scenario supports more industrialization of the economy as industry benefits from the absorption of resources from agriculture. The increase of the oil & gas sector’s share in the land substitution scenario is driven by increased foreign demand, provoked by more competitive oil and gas export prices in Nigeria compared to the rest of the world.
It is also instructive to analyse the impact of the land market scenarios on the changes in economy-wide factor demand. Table 7 compares the endowment volumes between the two scenarios. It is apparent that with more land substitution, the agricultural sector utilizes more inputs, including the land itself (the total primary agriculture production goes up and therefore also land). This is also transmitted to the sector of food processing where all endowments increase compared to the Land_Fixed scenario. On the other hand, locking land in agriculture releases labour and capital to be employed in industry and therefore there is more value added created in industry in the Land_Fixed scenario. This is especially visible in case of skilled labour. The resulting impact on the demand for labour and capital in the individual food systems sectors is displayed in Appendix C, Table A4. The conclusion that stems from this analysis is that better management of land markets could potentially be a strong leverage point for inclusive growth in food systems activities, yet with a trade-off in terms of industrial development. This trade-off appears in classical theories of rural development, and has been a subject of increasing criticism [49].
3.2. Price Transmission in the Food Supply Chain
The developments in the factor markets are transmitted into markets of goods and services. For this analysis, it is interesting to see what the expected price trends in the food supply chain are towards 2050 and how they are affected by the rigidity of land markets. Figure 8 shows the development of prices in the primary agriculture sector. The land constraint is a key factor in determining whether primary agricultural prices will grow or decline. The tipping point is the period after 2020 when there will be no available land to cultivate. Because of this, prices in primary agriculture would be 5 times higher by 2050. Releasing pressure on land would make a significant difference in the production costs of primary agriculture. In this case, producer prices would decline by 2050.
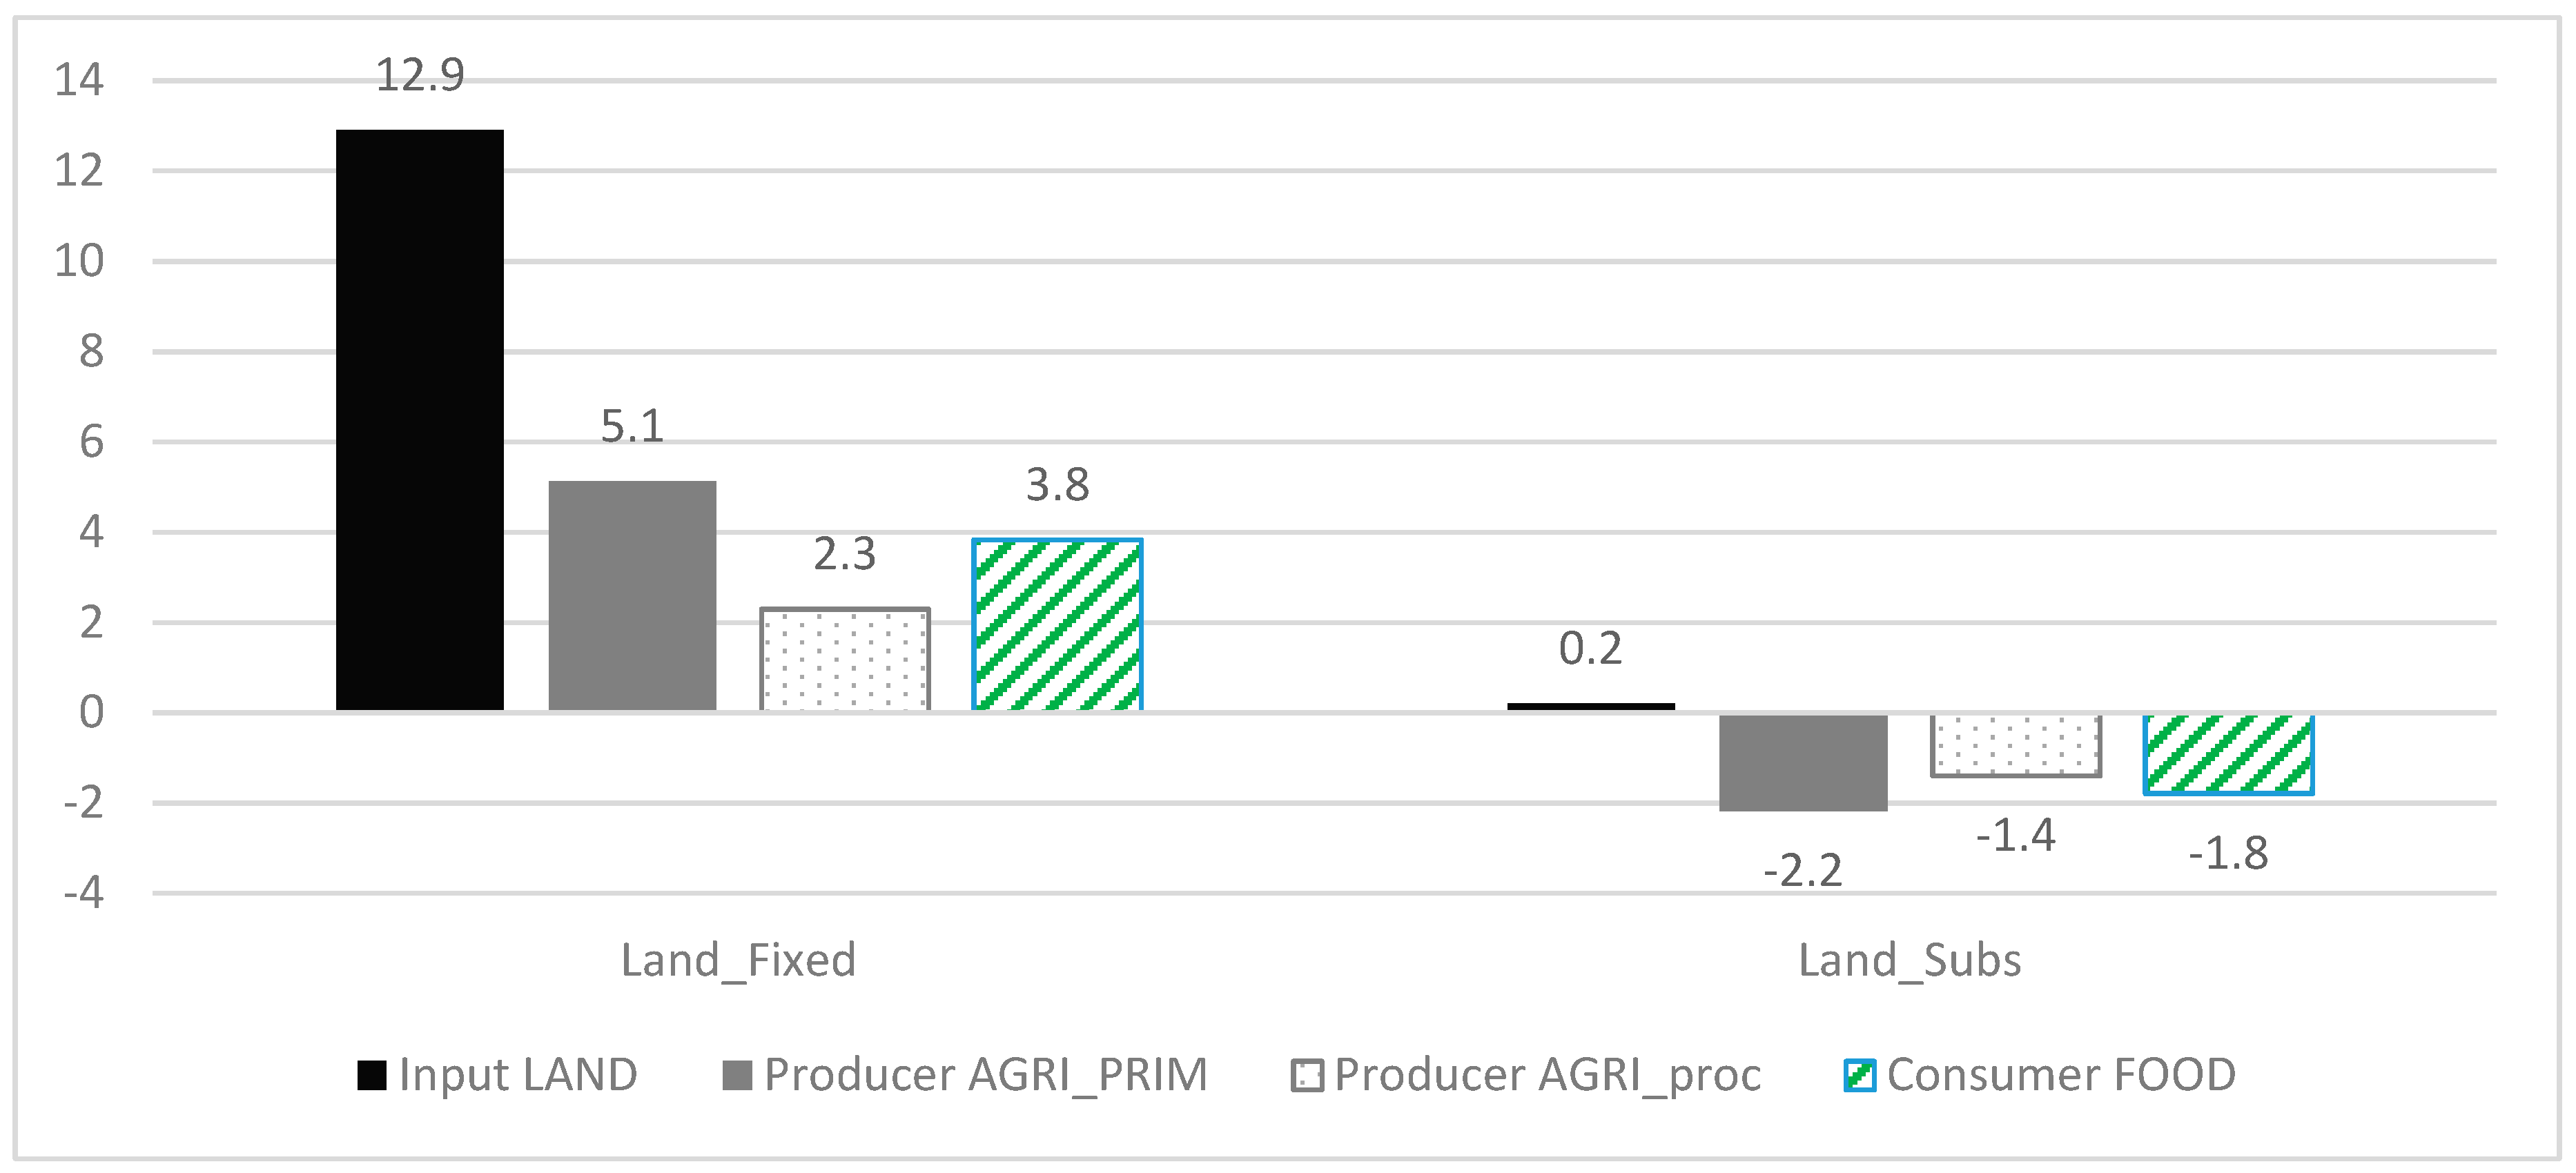
Figure 9 shows how the development on land market is transmitted to other sectors and to final consumers. Clearly, in the Land_Fixed scenario, the growth of land prices is so dominant, that all connecting industries face higher production costs, resulting in an increase of food prices for consumers. On the other hand, with a higher land substitutability, producer prices would go down as well as consumer prices of food. The fact that consumer food prices copy more closely the development of primary rather than processed food suggests that the proportion of consumer spending coming from primary agriculture is higher than from processed industry (about 50% of all food expenditures come from land-using sectors such as horticulture and grain). It also tells that there is a low share of imports in food consumption that could potentially moderate the food price inflation (the share of food imports in total food expenditures is 8% and is stable over time and across the scenario).
It is also interesting to see how the developments in the agri-food markets affect prices in the other industries (Appendix C, Figure A6). Whereas agri-food prices would be significantly higher in the Land_Fixed scenario, producer prices in the other production sectors would decline more than in the Land_Subs scenario. If there is no substitution of labour for land, the surplus of labour from the agricultural sector pushes the wages down. Particularly the sector of services benefits from this, which is the largest employer of skilled labour. In industry, the stronger decline of prices in the Land_Fixed scenario is driven by capital prices. There is again a higher surplus of capital from the food processing sector that is allocated in the rest of the economy.
3.3. Domestic Production, Trade and Value Added
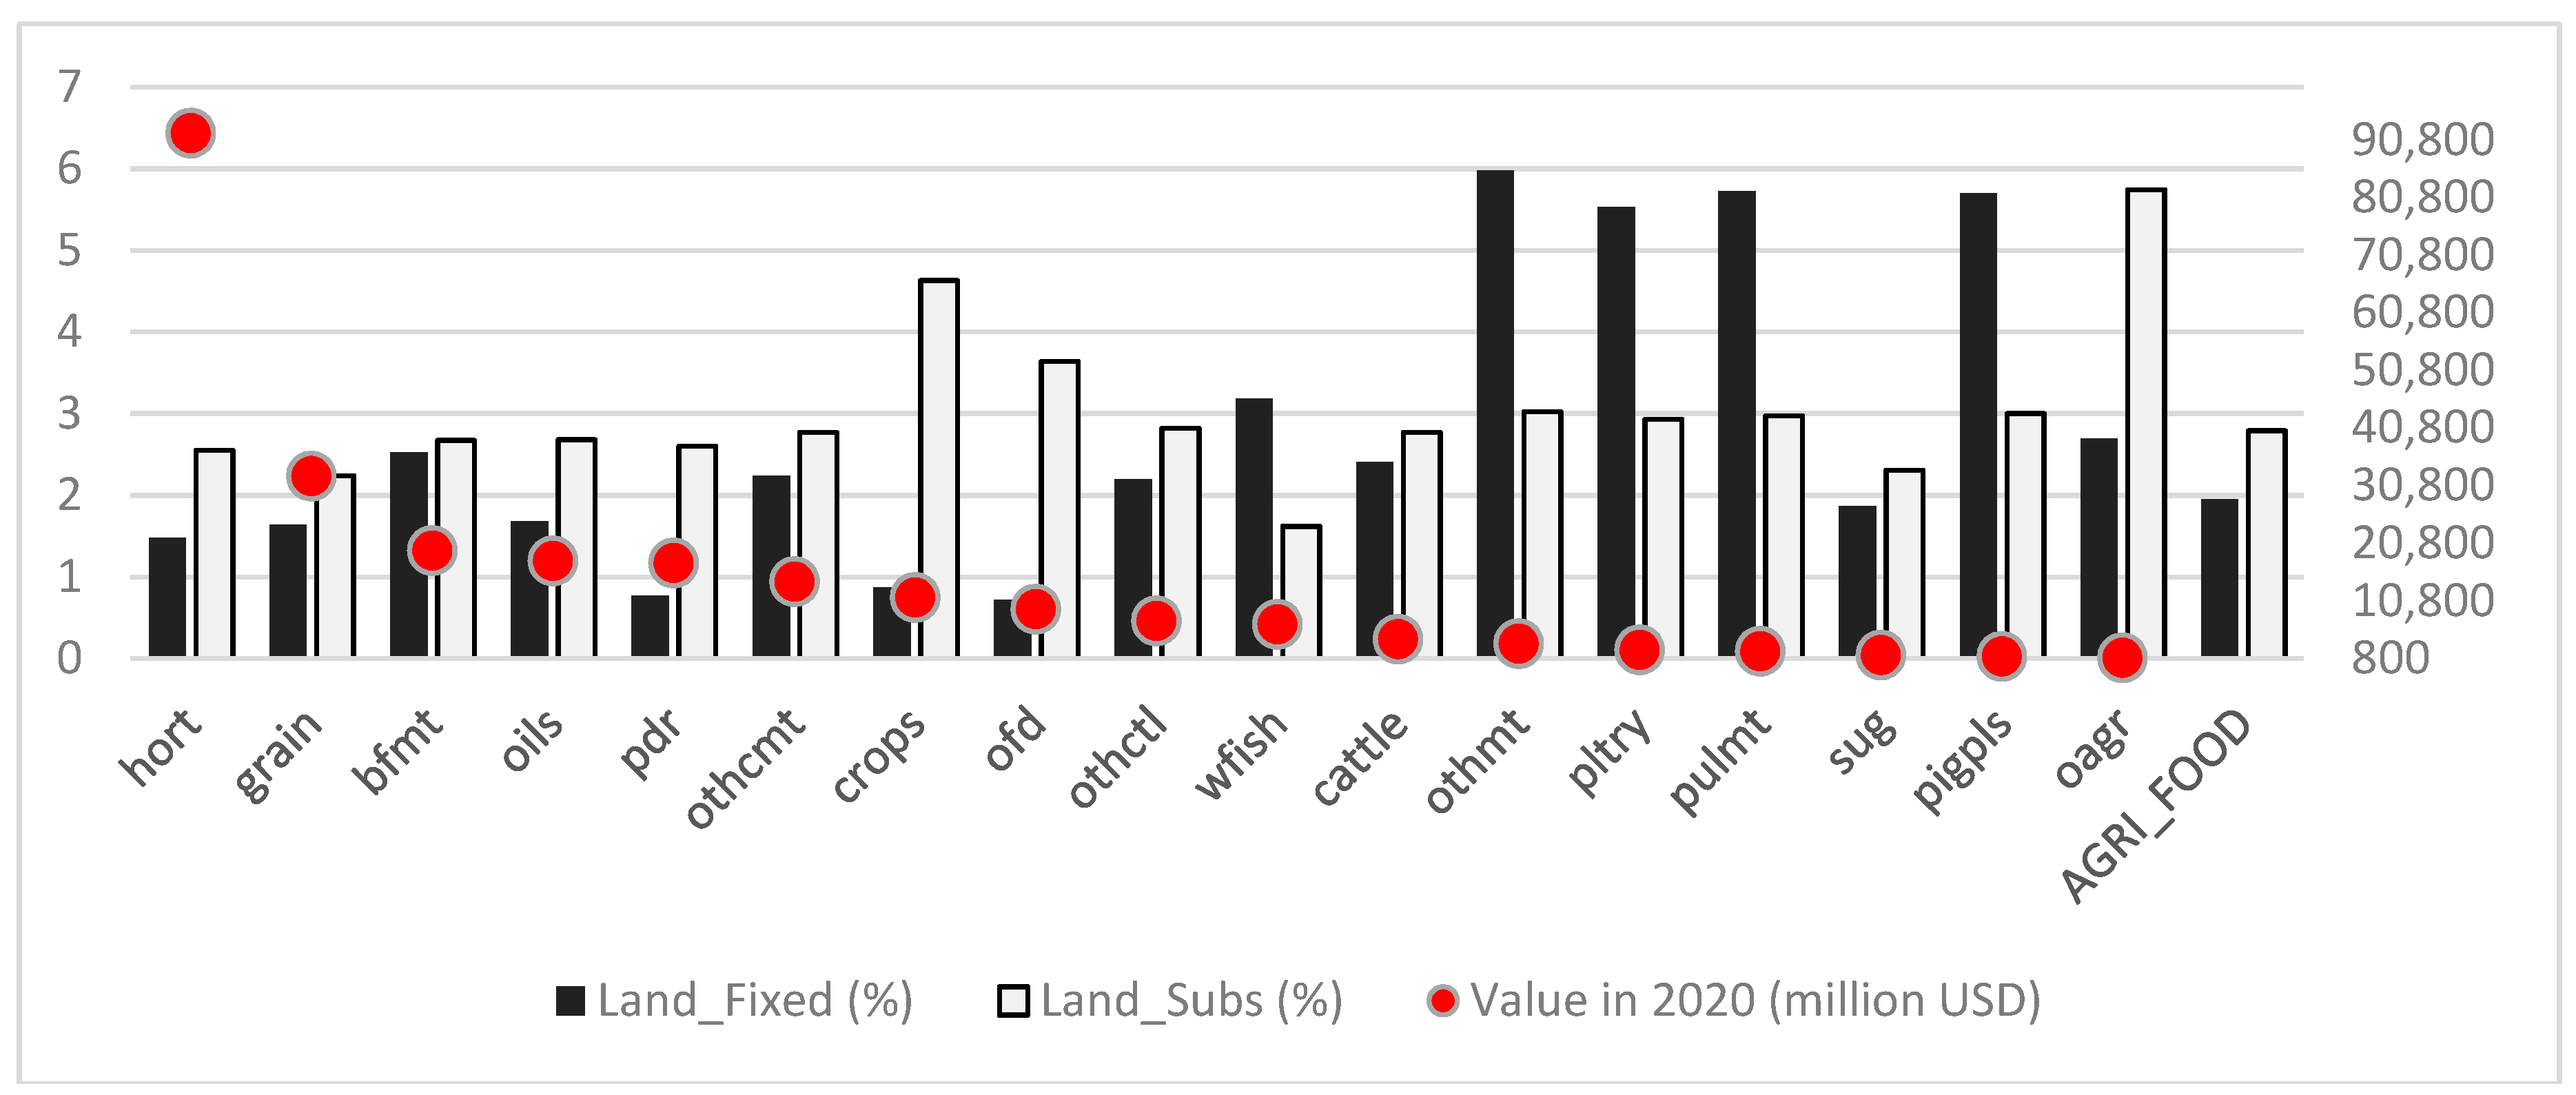
This section looks more closely into the performance of individual agri-food production systems. Figure 10 displays annual growth of production volume of the commodities that represent 99% of total production in 2020 (both in volume and value). The level of production in 2020 is also presented to understand the importance of each sector in the total agri-food complex. It is observed that in the Land_Fixed scenario, meat processing sectors such as poultry meat, pork meat and other meat enjoy unusual production volume growth reaching above 5% per year. On the other hand, in the Land_Subs scenario, land-using sectors such as crops, other agriculture and horticulture flourish. Because the Land_Subs scenario favours those agricultural sectors that have traditionally strong position in the agri-food chain, the total agri-food production volume is higher in the Land_Subs scenario than in Land_Fixed (note that of course, in value terms, it is the other way around).
The divergent development of the agri-food sectors is explained by the growth of production costs and prices. Figure 11 shows that due to an excessive growth of land prices in the Land_Fixed scenario, production costs in land-using sectors such as grain or cattle rise significantly (above 6% p.a.), whereas the non-land agricultural sectors such as other meat, poultry and pigs face a decline of prices. Concretely, prices in pigs and poultry sector reduce 5 times, whereas prices of cattle go up 10 times. Due to these price developments, meat industry enjoys an increased competitiveness compared to the crops sectors. Under the Land_Subs scenario, on the other hand, production costs in primary agricultural sector are lower than in processing industry and the crops sectors expand.
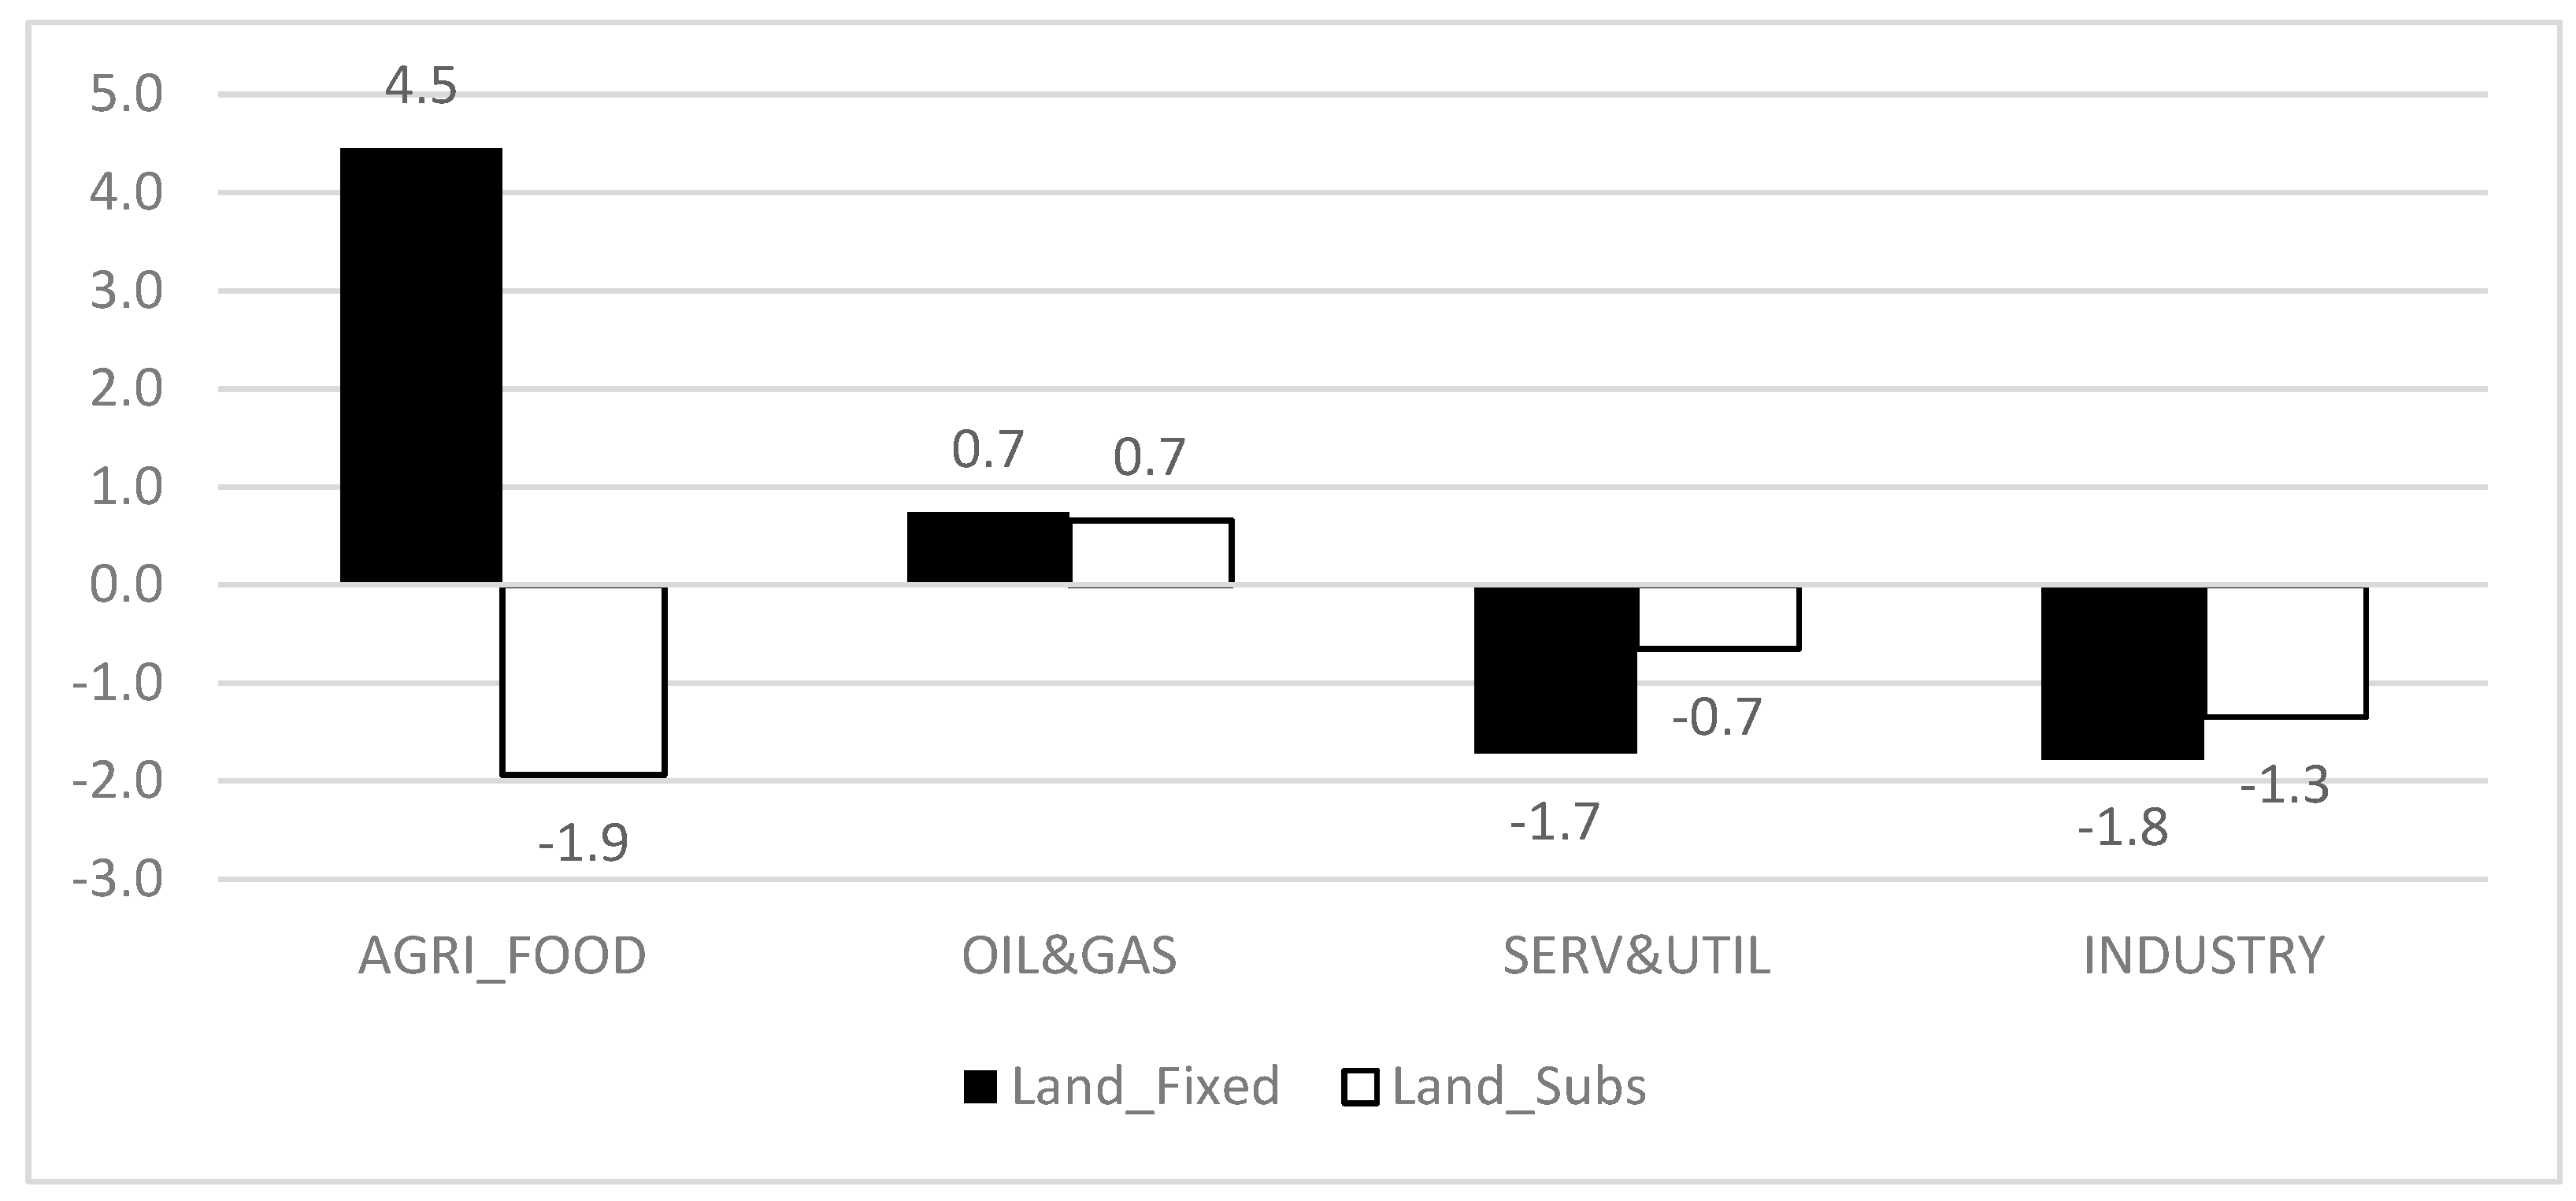
The projected changes in prices, endowments and productivity result in a very different composition of value added in both scenarios. Food supply chain value in MAGNET is defined as a sum of production value of primary agriculture, food processing, wild fish sector, aquaculture, fish processing and fish meal, fertilizer, feed and pesticides. If land is substituted for other factors, the value share of food processing and supplying industries increases, because producer prices and costs in primary agriculture are comparatively lower than in food processing in this scenario. Under the Land_Fixed scenario, due to the excessive growth of land prices, the value of food supply chain is dominated even more strongly by primary agriculture.
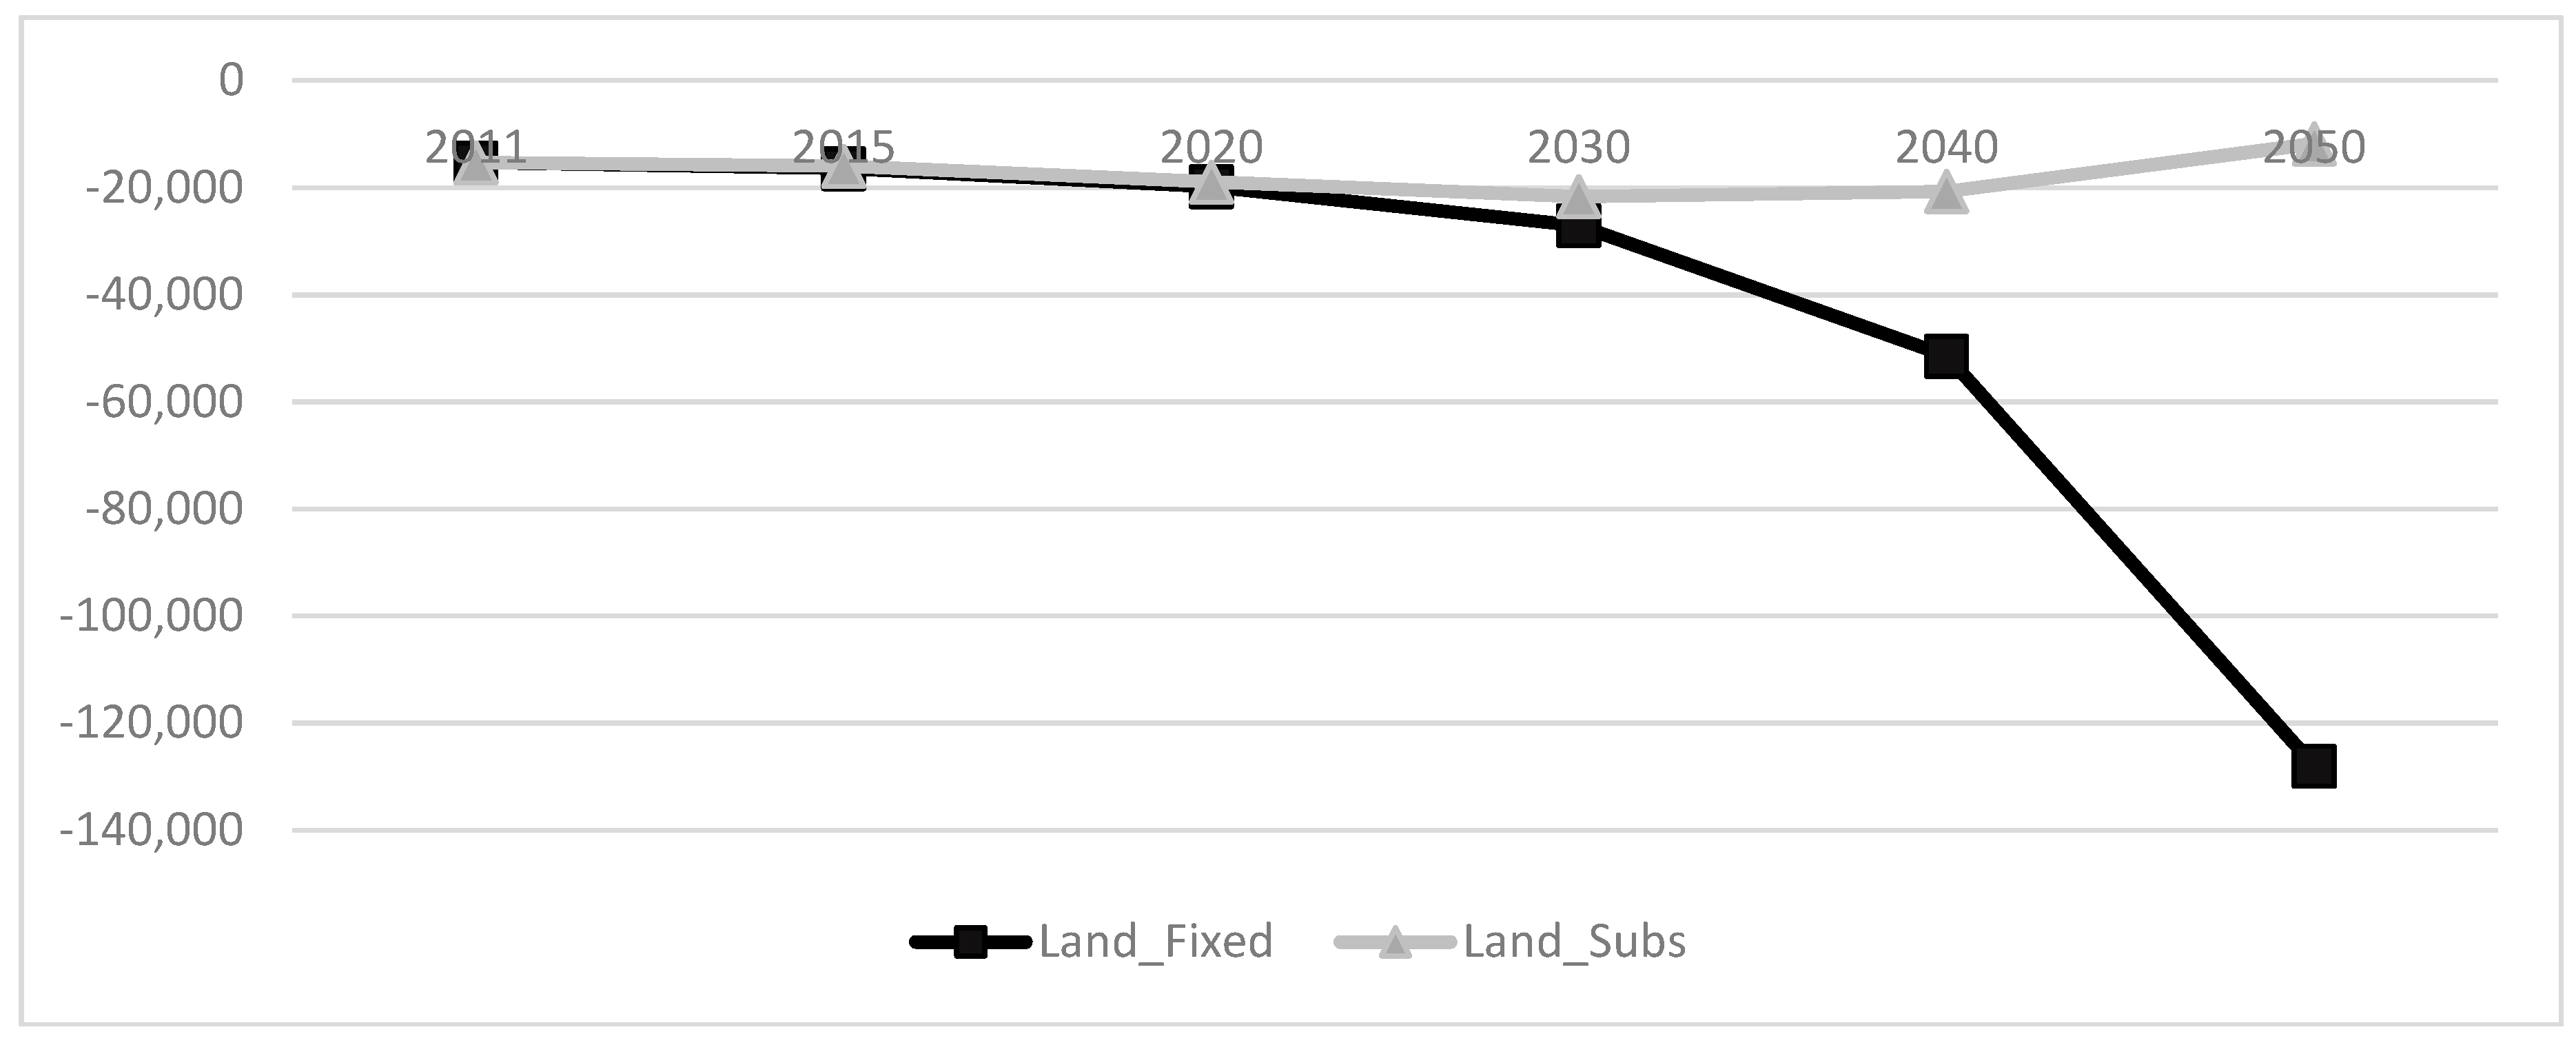
The developments in the food systems sectors are also projected to have a strong impact on the external position of Nigeria and the domestic supply and self-sufficiency. Figure 12 shows that the land substitutability plays a significant role in the competitiveness of Nigeria on foreign agri-food markets. Until 2020, trade balance remains stable and negative at around 20 billion USD. After 2020, the trends diverge notably where under the Land_Fixed scenario, trade balance would deteriorate significantly up to a negative 140 billion USD, whilst in Land_Subs scenario, it would improve to a negative 11 billion USD.
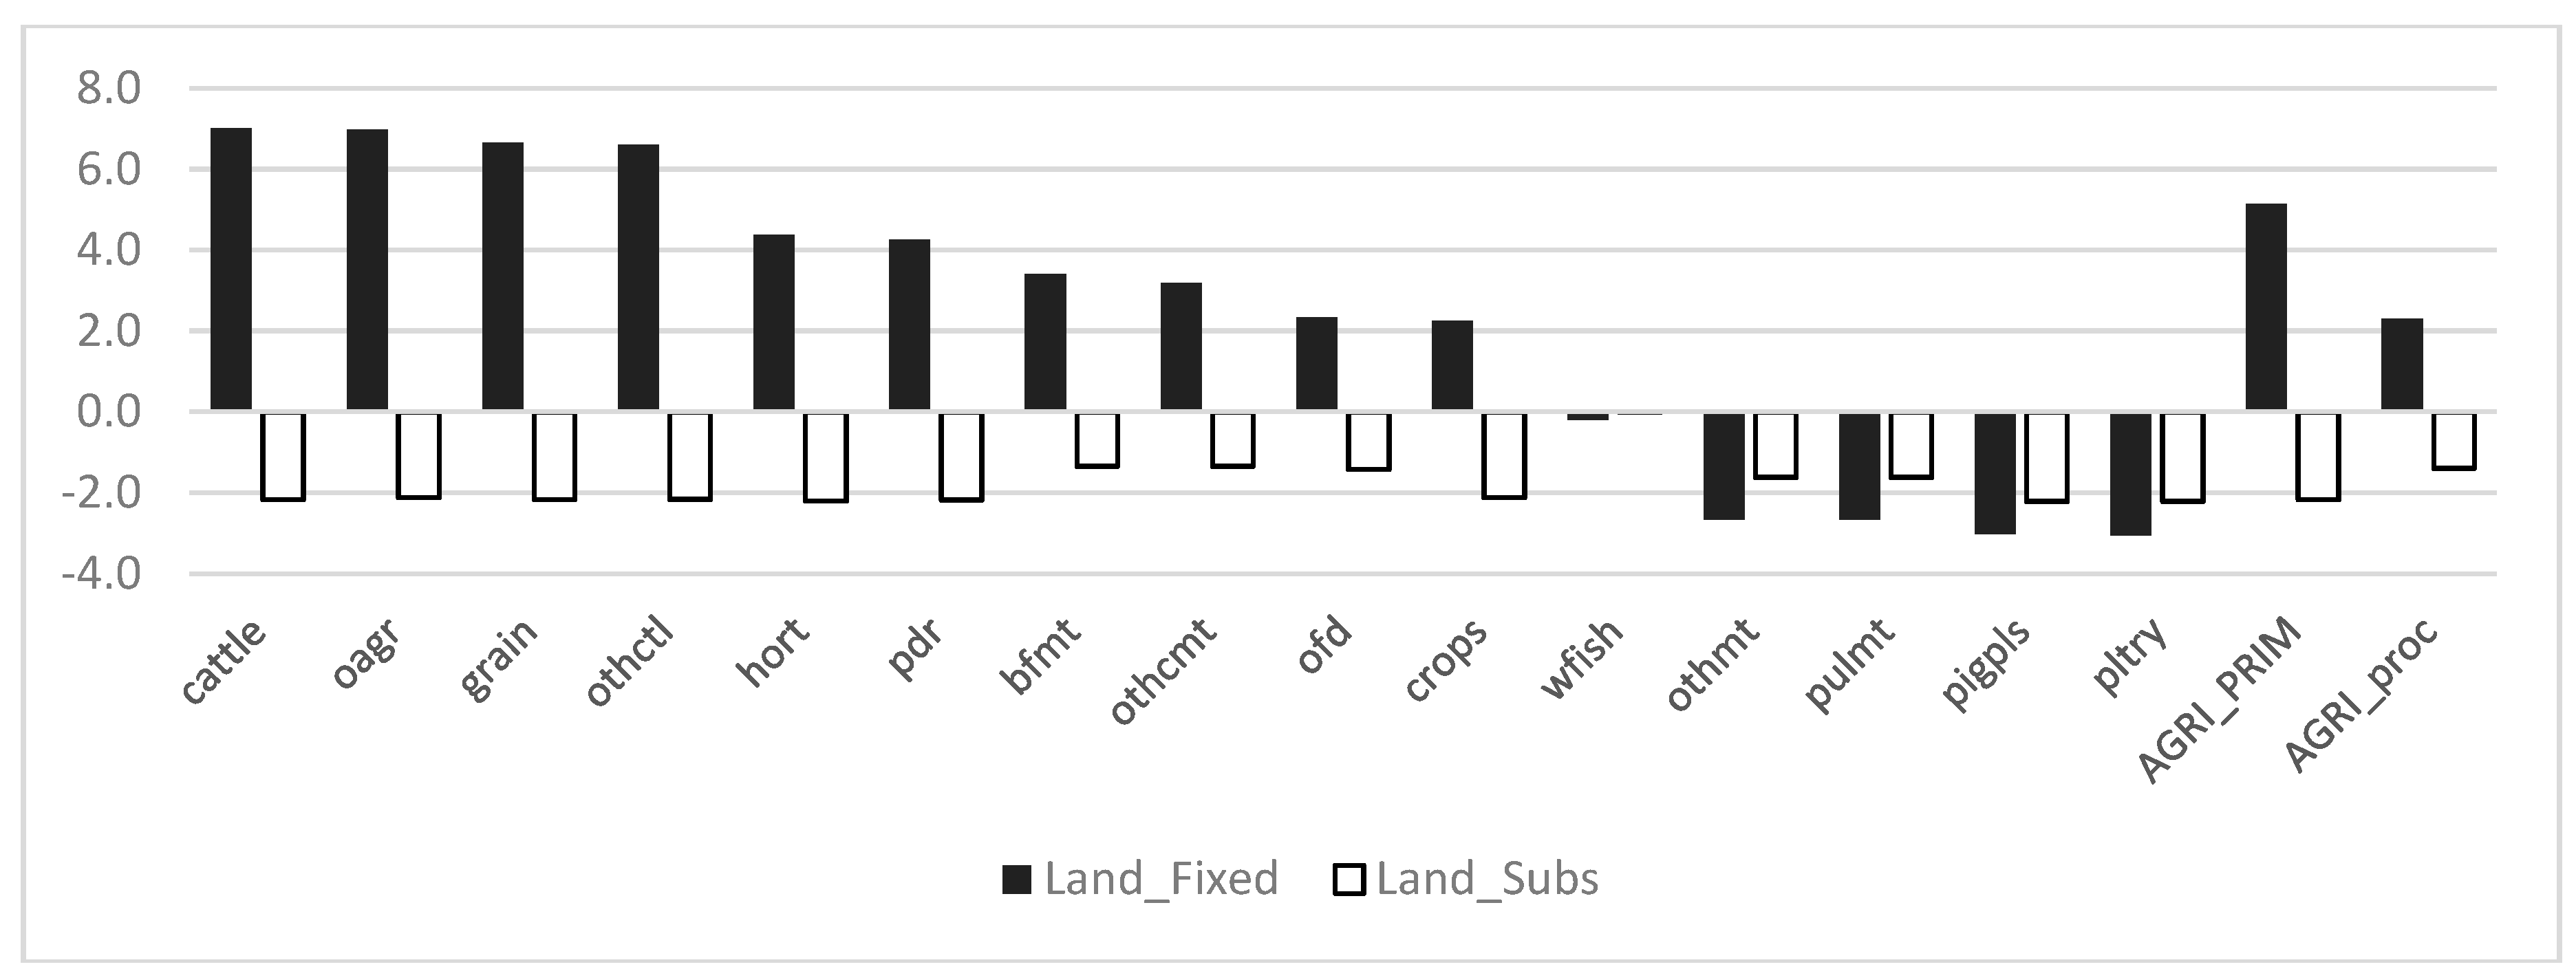
Aggregate agri-food trade balance is driven by the competitiveness of individual agri-food sectors. In 2020, there are only few sectors which have a positive net trade with abroad, namely the sectors of horticulture, grain and other crops, oils and wild fish (similar in both scenarios). By 2050, in the Land-Fixed scenario, the trade balance in all these traditionally trade-oriented sectors would turn negative (except for wild fish). There is also a very strong deterioration of trade balance in other processed food (“ofd”), due to an increased household consumption of processed food from abroad. On the other hand, there would be a new development on the meat markets, previewing a large increase in net exports of poultry and other meat (driven by the relative decline of producer prices of these sectors).
In the Land_Subs scenario, the competitiveness of crops sectors is improved and the deficit of Nigeria’s trade balance is only moderate. The sectors that have a positive balance in 2020 remain with surplus and other sectors such as beef meat and paddy rice newly gain competitiveness on external markets.
3.4. Food Environment and Consumption
In this section, the attention shifts to the consumer side of the economy to assess the impact of the projected changes in food production on households’ living standards and food security. Table 8 shows that agri-food consumer prices are expected to increase by 4% in the Land_Fixed scenario, whereas in the Land_Subs scenario, they decline by 1.8%. As a result of that, the quantity of food consumed is higher in the second scenario. Due to excessive growth of food prices, private expenditures on food grow quite significantly in the Land_Fixed scenario and they are also reflected in the growth of total household expenditures. The lower panel in the table analyses food accessibility as the compounding impact of food prices and household earnings, using a cereal price index divided by wage of skilled and unskilled labour as an indicator. In the Land_Fixed scenario, the accessibility of staple food such as cereals declines as the cereal price index is up to 7 times higher compared to the wage of unskilled labour in agriculture, and 4 times higher compared to unskilled labour wage in other industry. The relative accessibility of food is, on the other hand, increasing in the Land-Subs scenario, where cereal prices are below the wages. Similar developments are recorded for the skilled labour, which shows that food-security problems would be threatening both skilled and unskilled labour households in the Land_Fixed scenario.
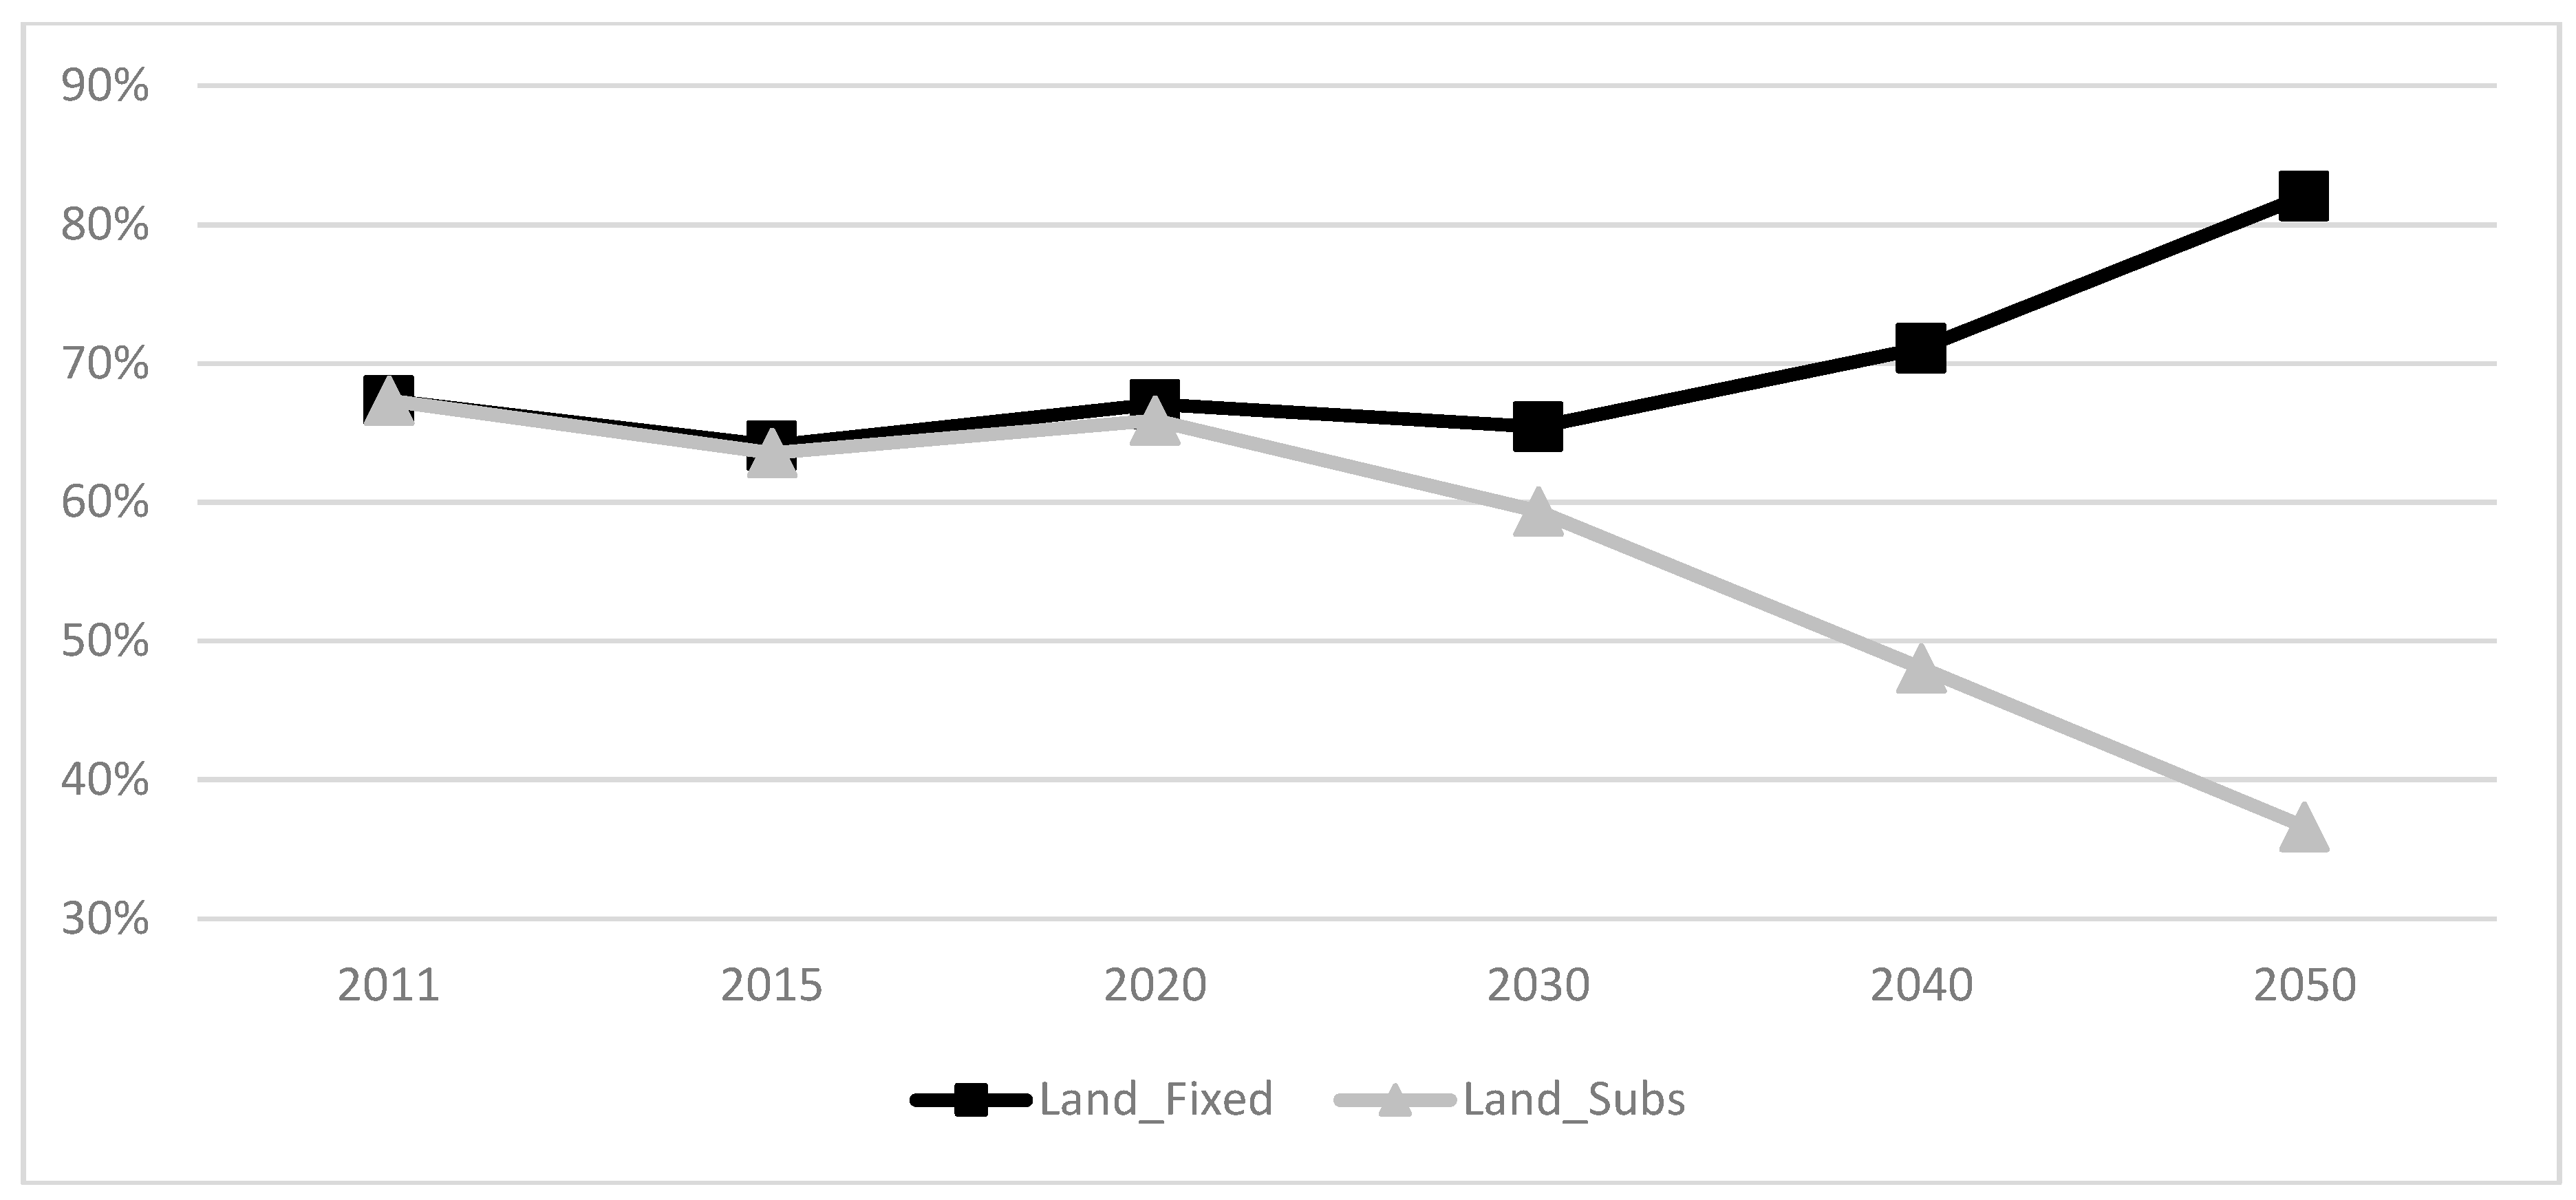
Given that agri-food expenditures grow significantly, it is interesting to see if the share of food expenditures in total household expenditures increases as well (Appendix C, Figure A7). In the base year (2011), the share of food expenditures in total expenditures in Nigeria is relatively high, reaching almost 70%. This is in line with Akerele (2015), who highlights that expenditure on food claimed more than 60% of household income in 2012. In the Land_Subs scenario, the share of food expenditures after 2020 declines to 30%, whereas in the Land_Fixed scenario, due to excessive growth of prices, the share of food expenditures is expected to exceed 80%. Basically, most household income would be spent on food in this case, which is alarming.
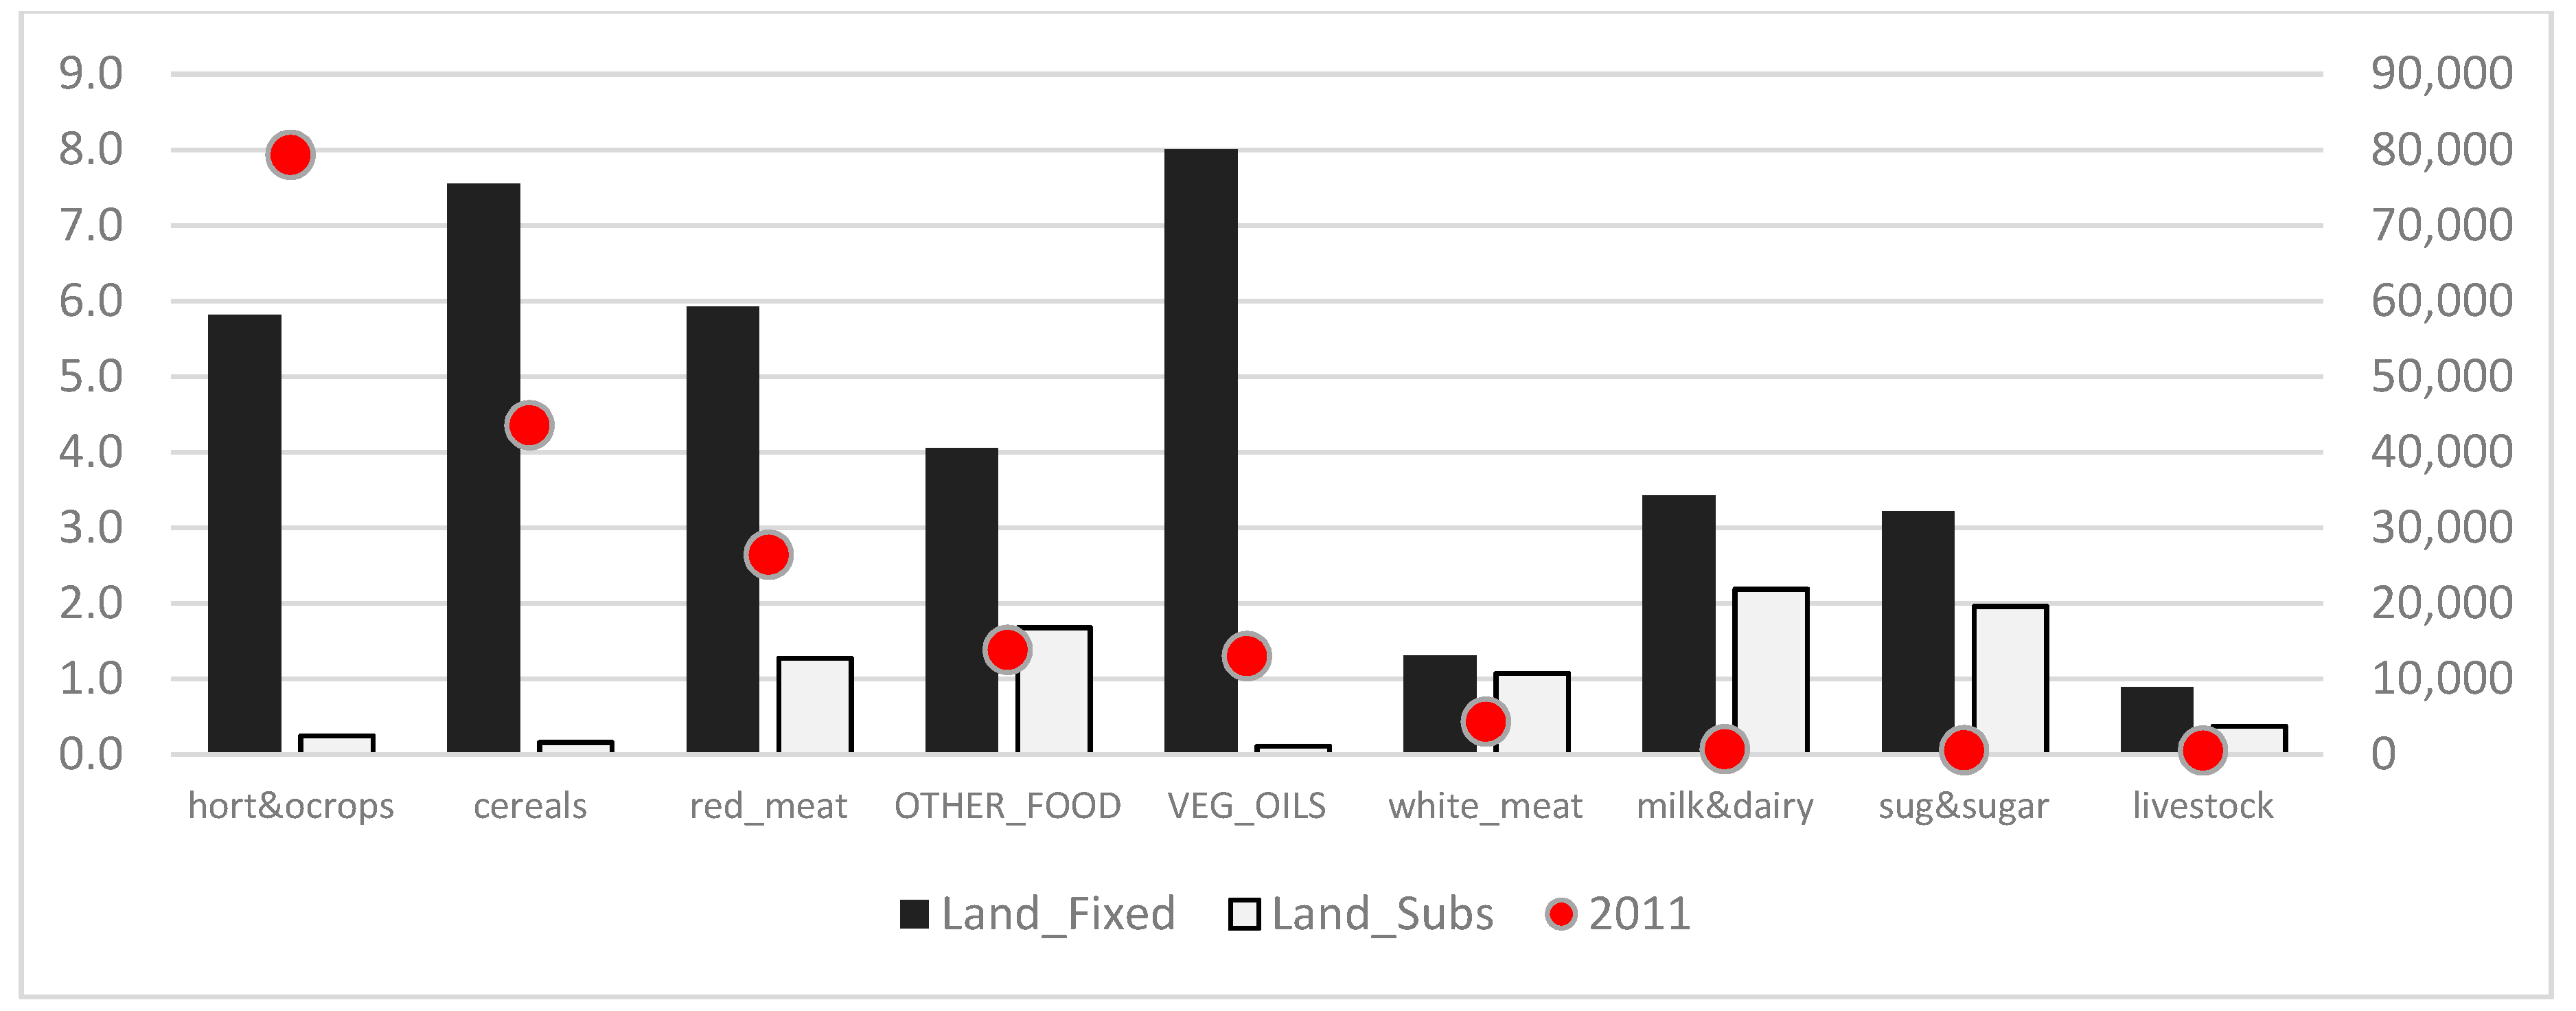
In the Land_Fixed scenario, the food groups that contribute most to total food expenditures are horticulture and other crops, cereals, red meat and other food (Figure 13). Contrary to that, in the Land_Subs scenario, the expenditures growth remains very moderate, except for milk & dairy, sugar and processed food, which are food groups with lower share in total expenditures.
3.5. Nutrient Availability
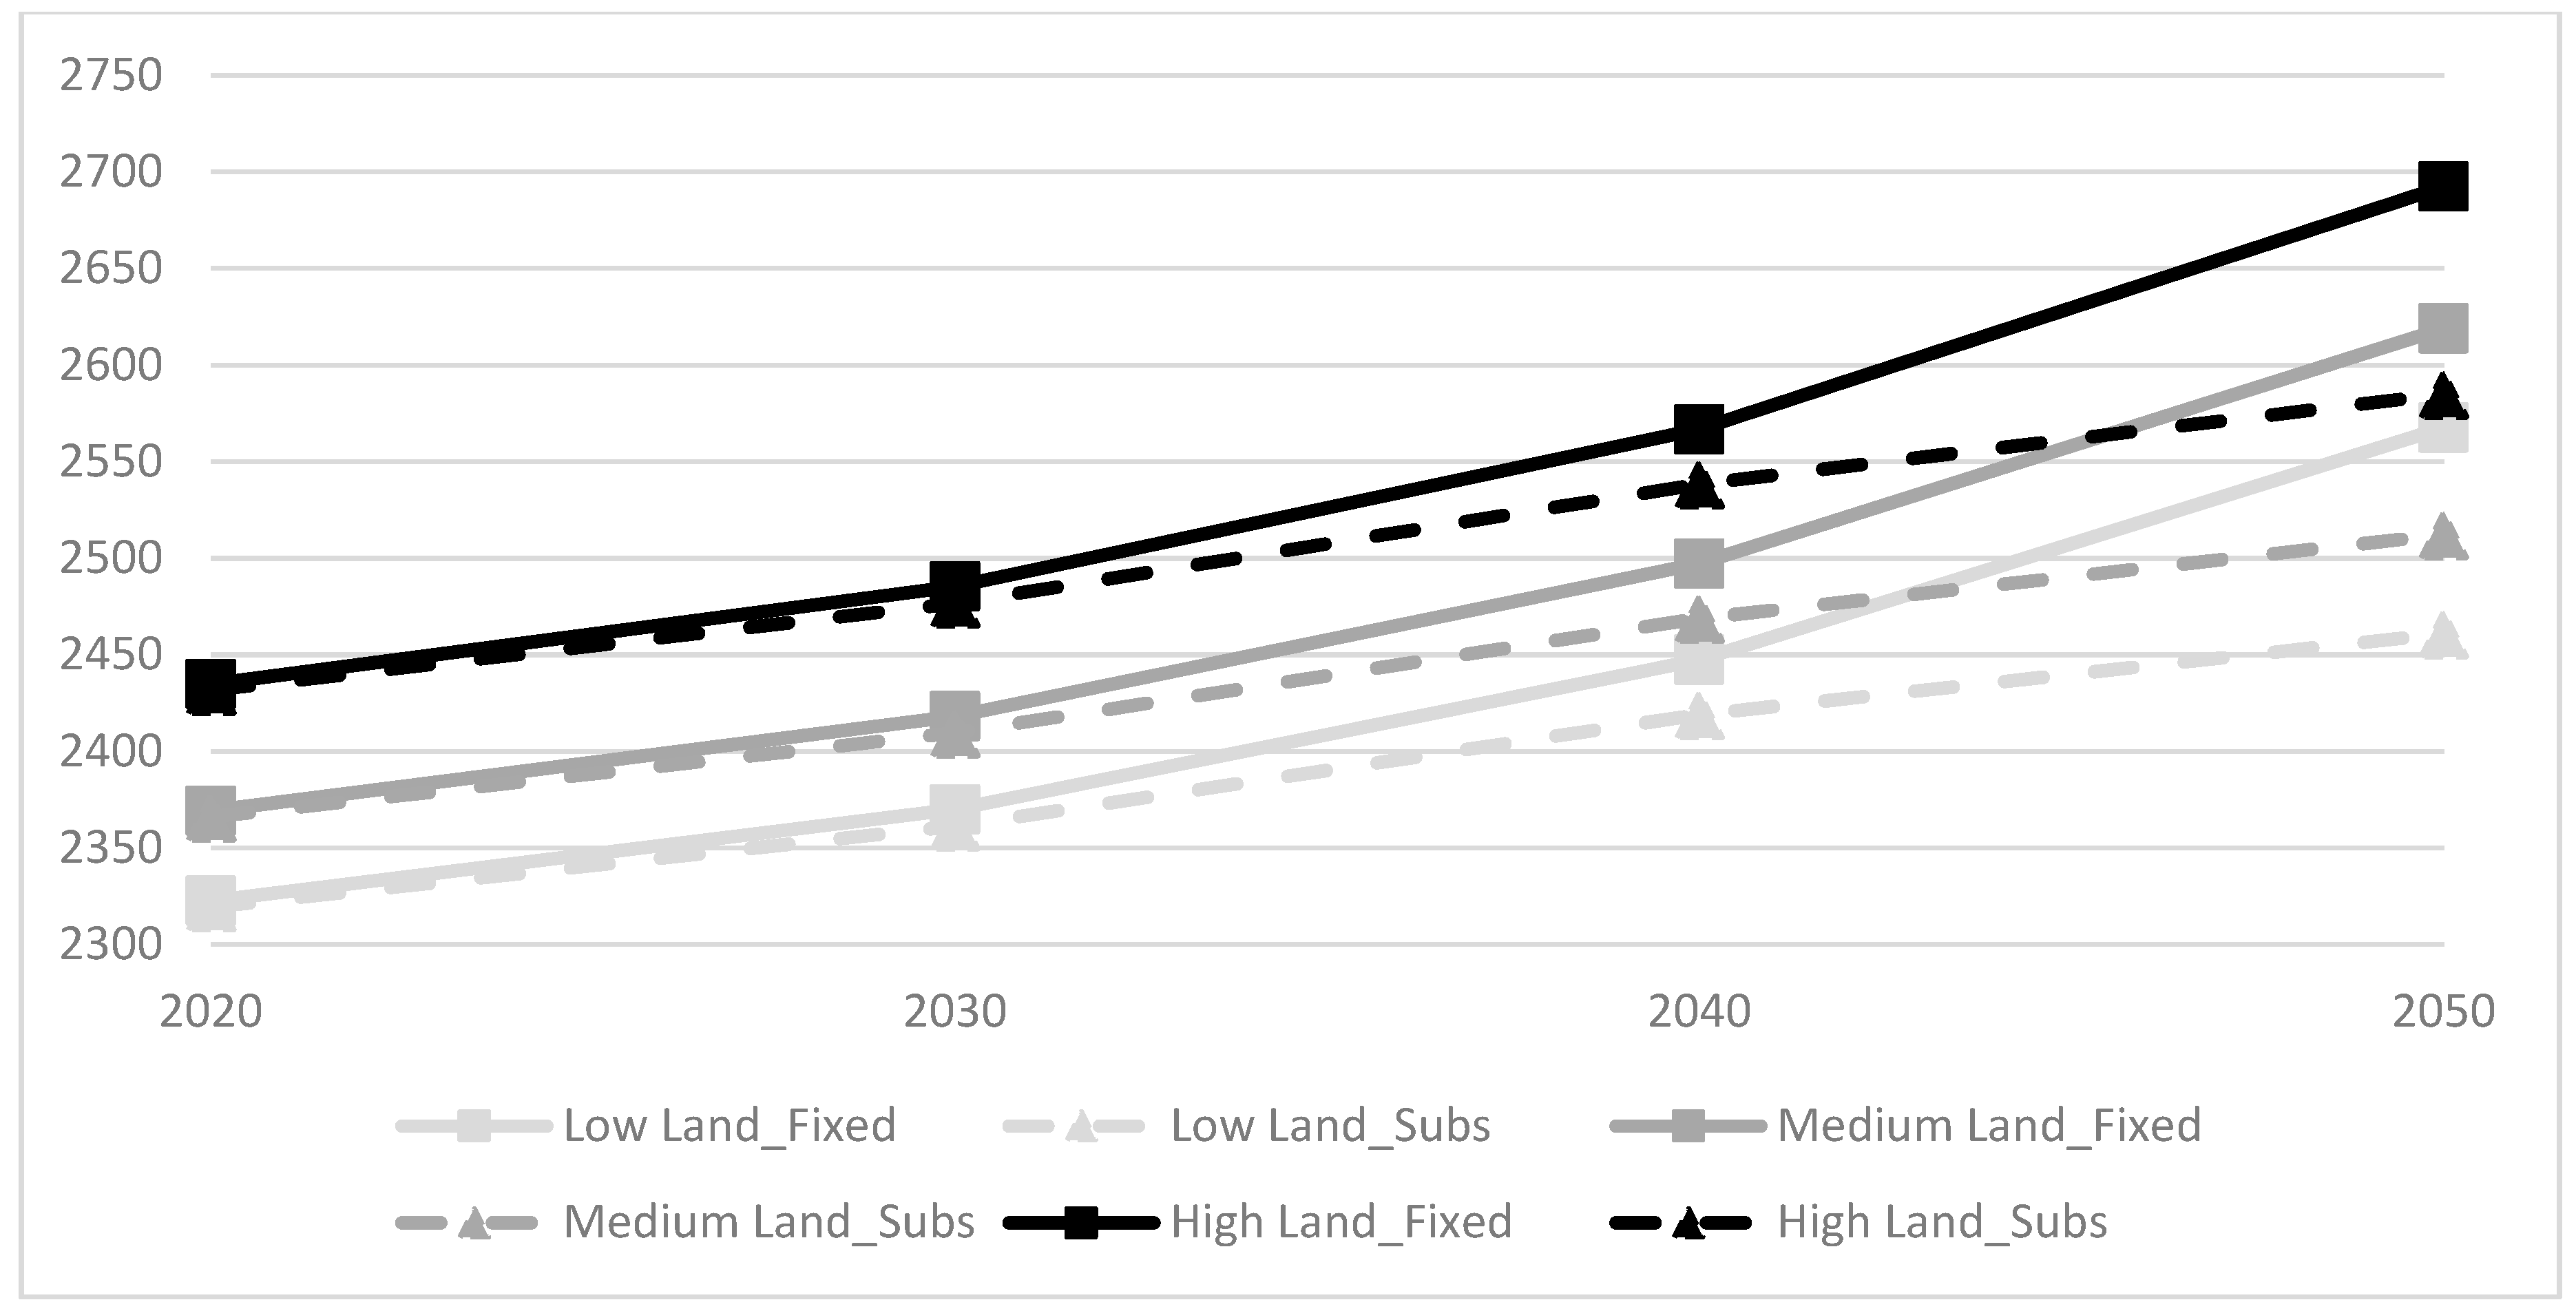
In this section, the impact of the food system developments on household nutrition is analysed. Using the GENUS database, the calories linked to the main food groups in MAGNET are traced. A correction factor is applied to express the total caloric supply in terms of caloric intake of adult female equivalent. Figure 14 shows that in the Land_Fixed scenario, the projected caloric consumption would be in the range of 2600–2700 Kcal, which is about 100 Kcal more than in case of the Land_Subs scenario (4% difference). This shows that improved food accessibility is not necessarily accompanied by higher caloric consumption.
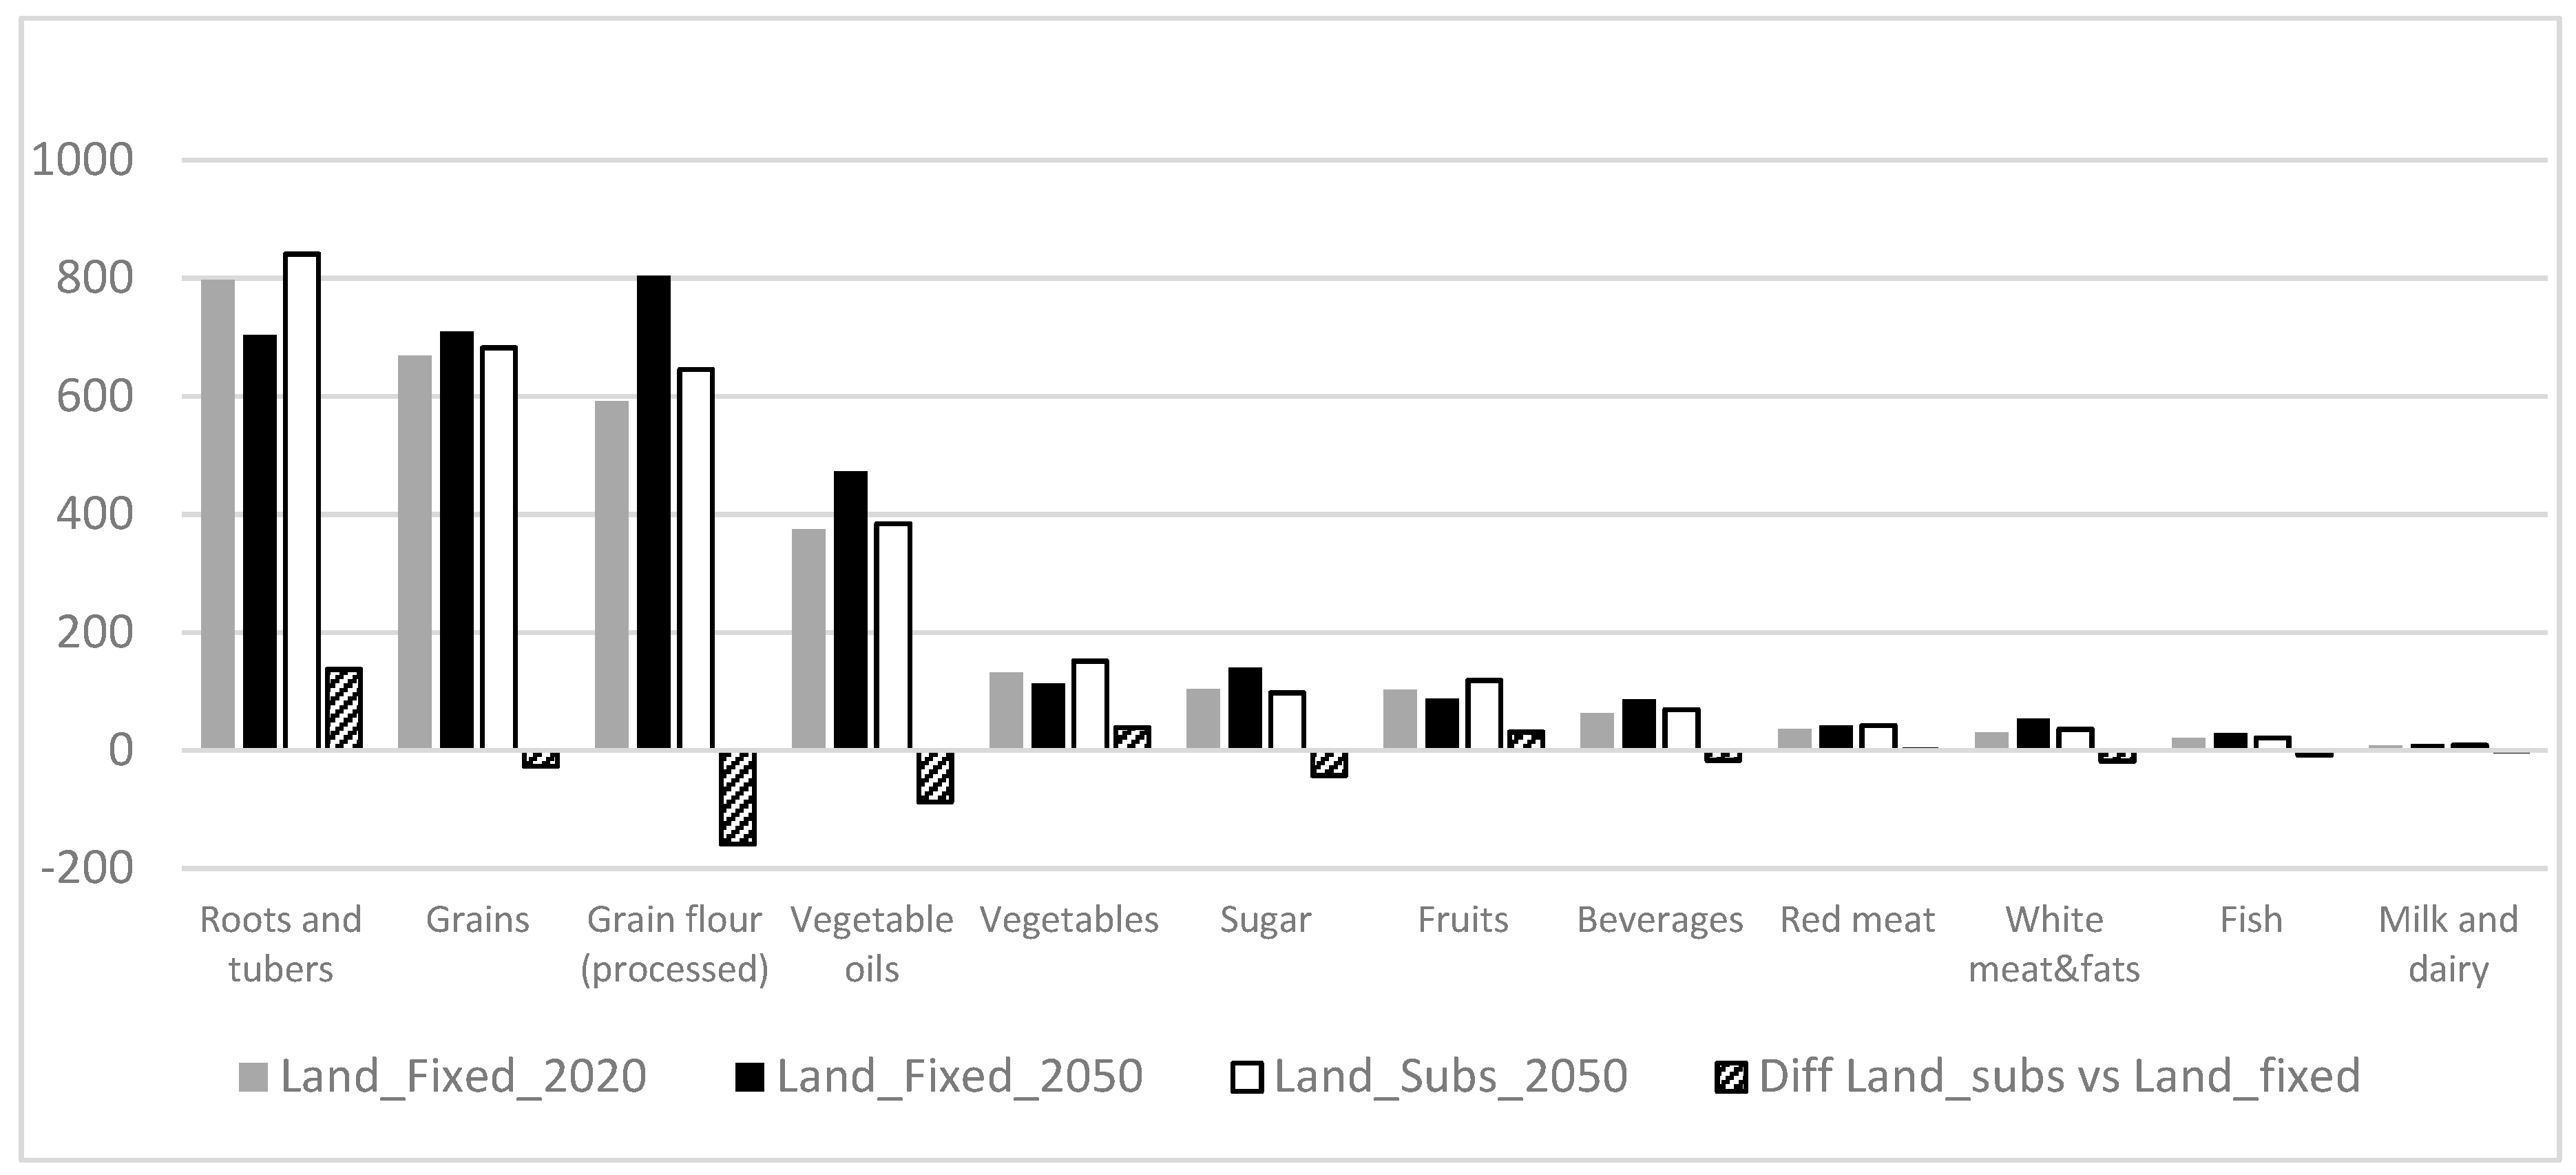
Figure 15 shows the composition of caloric consumption across main food groups. As mentioned before, roots and tubers, grain and grain flour are the key sources of energy—they provide about 2000 Kcal out of 2900 Kcal of daily consumption. By 2050, these foods will remain the most important caloric sources but there will be some differences depending on the scenario. In the Land_Fixed scenario, due to a bigger role of food processing, the caloric consumption of more processed foods such as grain flour, vegetable oils and sugar would be higher compared to Land_Subs. Given that these foods have high caloric content, this explains why the caloric consumption is slightly higher in the Land_Fixed scenario.
It is also important to assess whether the energetic consumption corresponds to a higher intake of micronutrients. For instance, although in Land_Subs scenario the total caloric consumption is slightly lower, the caloric intake from fruits and vegetables is higher, which is important from the health perspective.
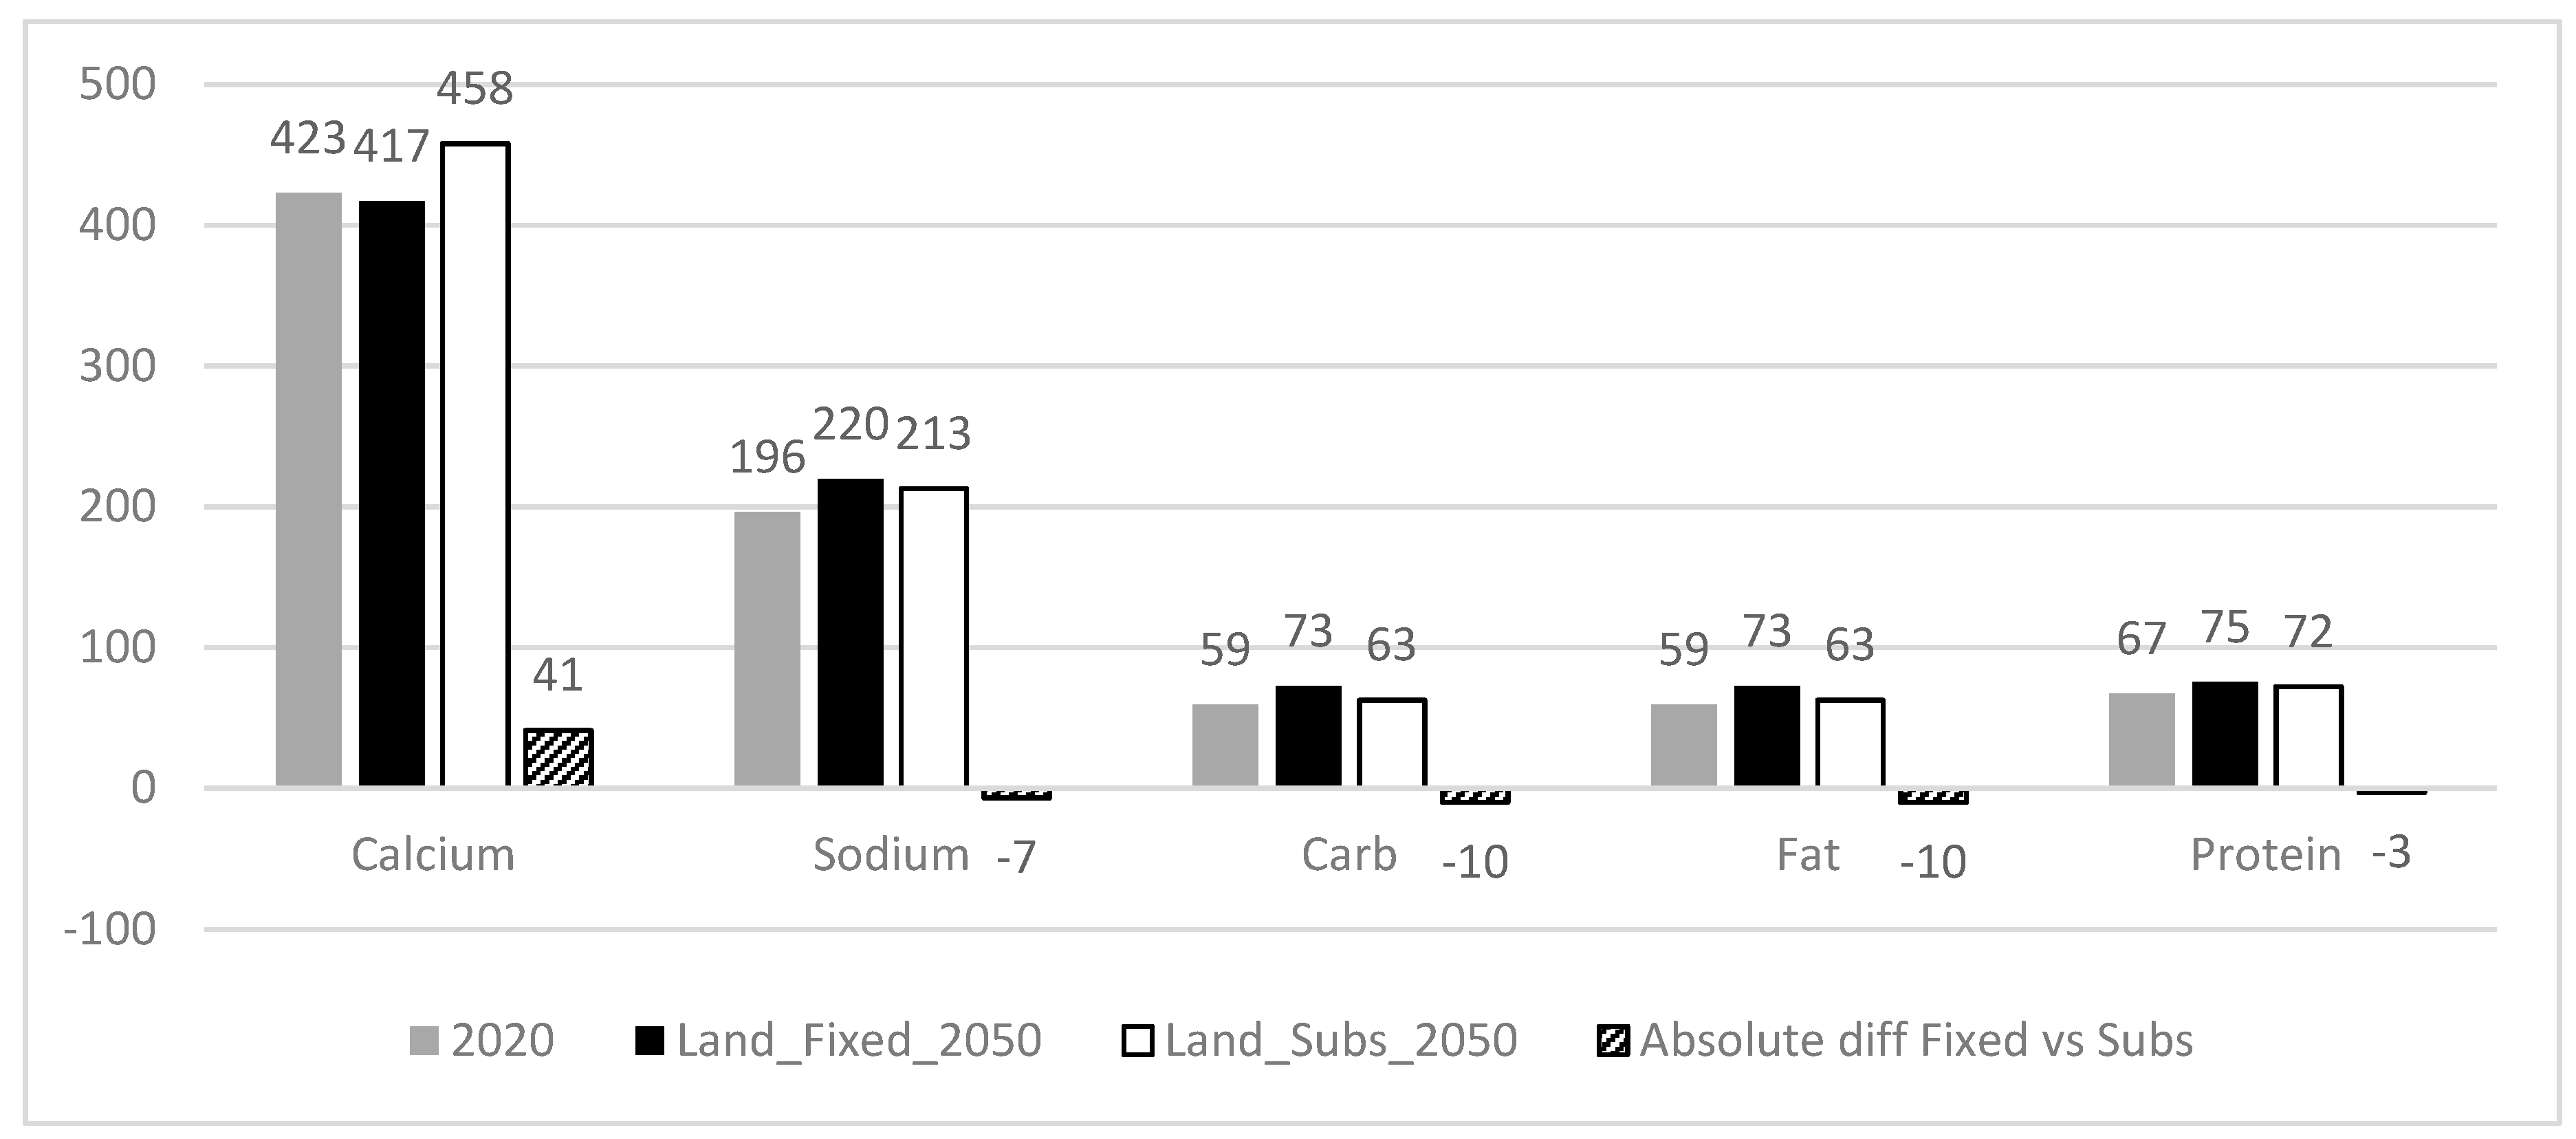
Figure 16 shows that nutritional intake is projected to increase for all deficient nutrients, except for calcium, where projections diverge per scenario. In the Land_Fixed scenario, calcium intake would decline by 1% compared to 2020, whereas in the Land_Subs scenario, nutrient intake increases to 8% compared to 2020. Fifty per cent of calcium in Nigeria is obtained from cassava, yams, citruses and okra. Because the Land_Subs scenario favours the horticulture and crops food systems, it also leads to a higher intake of calcium. On the other hand, in the Land_Fixed scenario the intake of carbohydrates and fats would be up to 23% higher than in 2020.
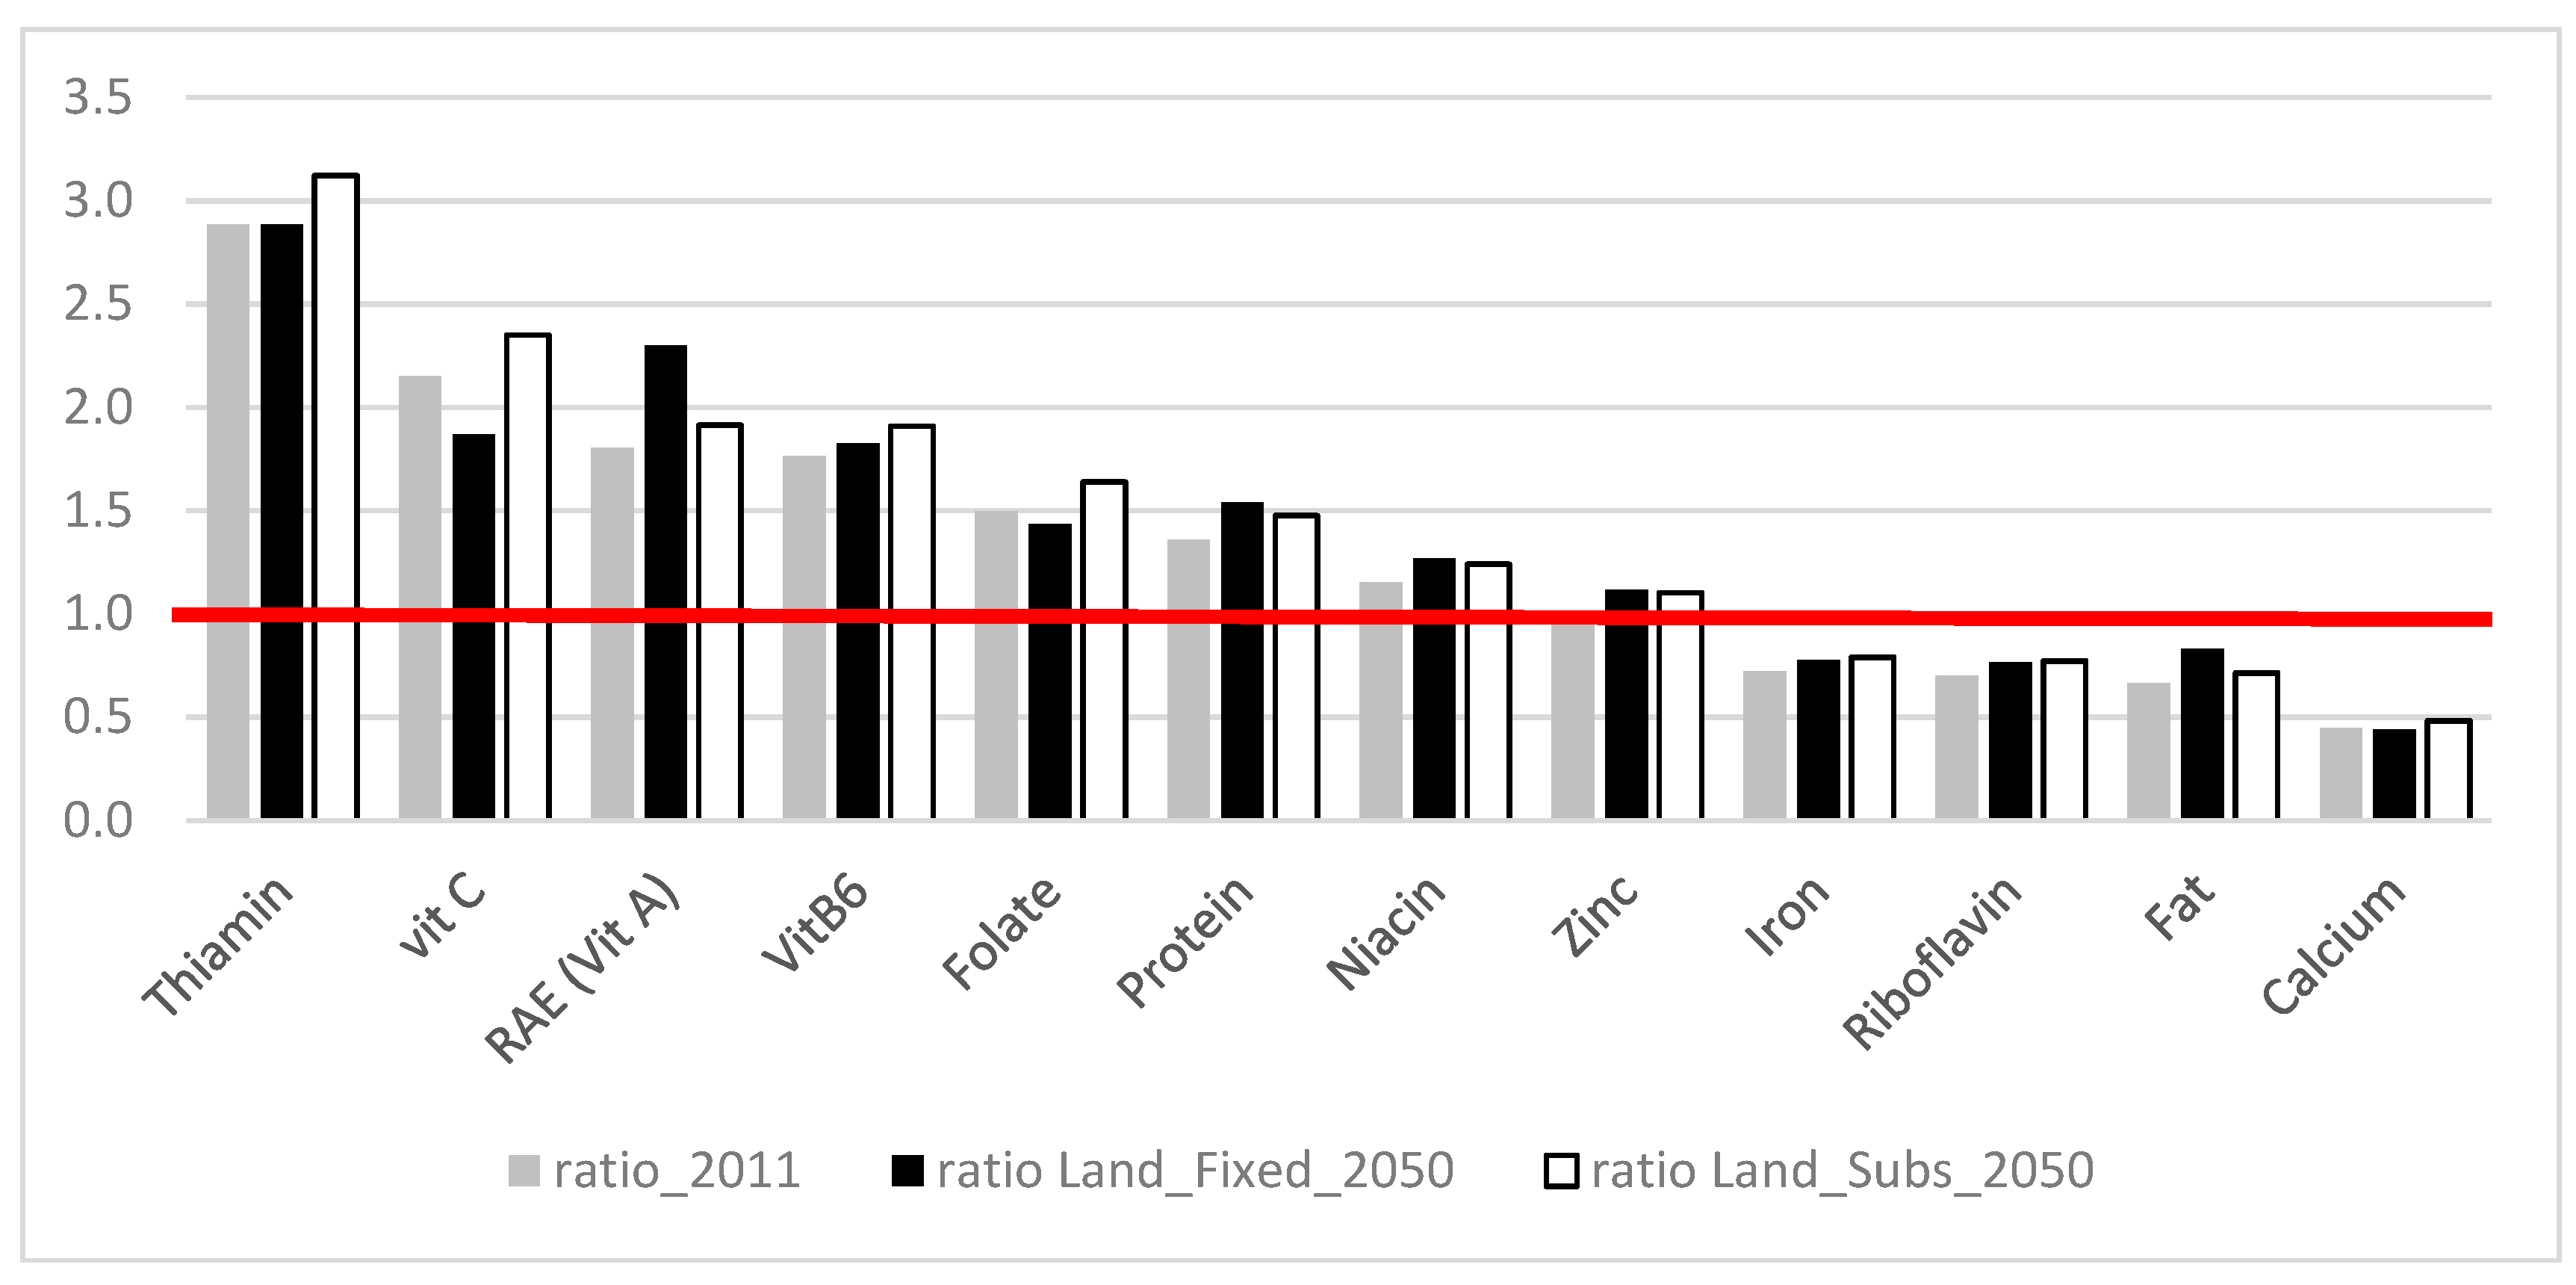
It is also important to look at how the nutrient gap evolves in time per scenario (Figure 17). Clearly, the projected changes in nutrient intake are too small to make a significant improvement in the nutrient gap. The exception is the intake of vitamin A, where the ratio could increase to 1.8 in the Land_Fixed scenario. This is driven by a push in palm oil consumption which represents about 70% of all vitamin A intake in Nigeria. On the other hand, the Land_Subs scenario would favour more the intake of thiamine, vitamin C, vitamin B6 and folate. However, the calcium, fat, riboflavin and iron would remain highly deficient in the Nigerian nutrition by 2050.
4. Discussion
It was shown by means of a modelling exercise that structural change in agriculture and transformation in the food system are important elements in diet change in Nigeria. The Nigerian (agri-fish-) food system is undergoing substantial change under the influence of global and domestic drivers, and model analysis gives insight into the processes of adjustment. Nigeria is currently the country with the lowest level of input use in agriculture (in value terms) in the global database that underpins the MAGNET model, and with a reserve of just 10% of agricultural land that can be brought into production. Model projections suggest that a process of intensification of agriculture in combination with land substitution appears critical for the evolution of food and nutrition security, and for shifts towards healthy diets for the population. The strength of the analytical framework employed in this study is its capability to account for economy-wide adjustments of producer and consumer decisions under the influence of global drivers of change and the drivers related to the rigidity in the land market. This no.1 feedback effect, as defined in the introduction, appears to be particularly strong in relation to adjustments in factor markets for labour in response to the land rigidity scenarios combined with economic growth and expansion of the population. A major assumption underpinning the improved food accessibility and shifts towards greater diversity and quality in the diet under the Land_Subs scenario stems from adjustments in the labour market. In particular, the model projects that unskilled agricultural employment grows by over 2%, and skilled labour by over 80%, suggesting that skilled work becomes firmly established in the agriculture sector. This is a substantial departure from today’s realities, in which farming is predominantly a low-input activity. More detailed assessments will need to be done to assess confidence whether the Nigerian labour market would support such a transformational shift.
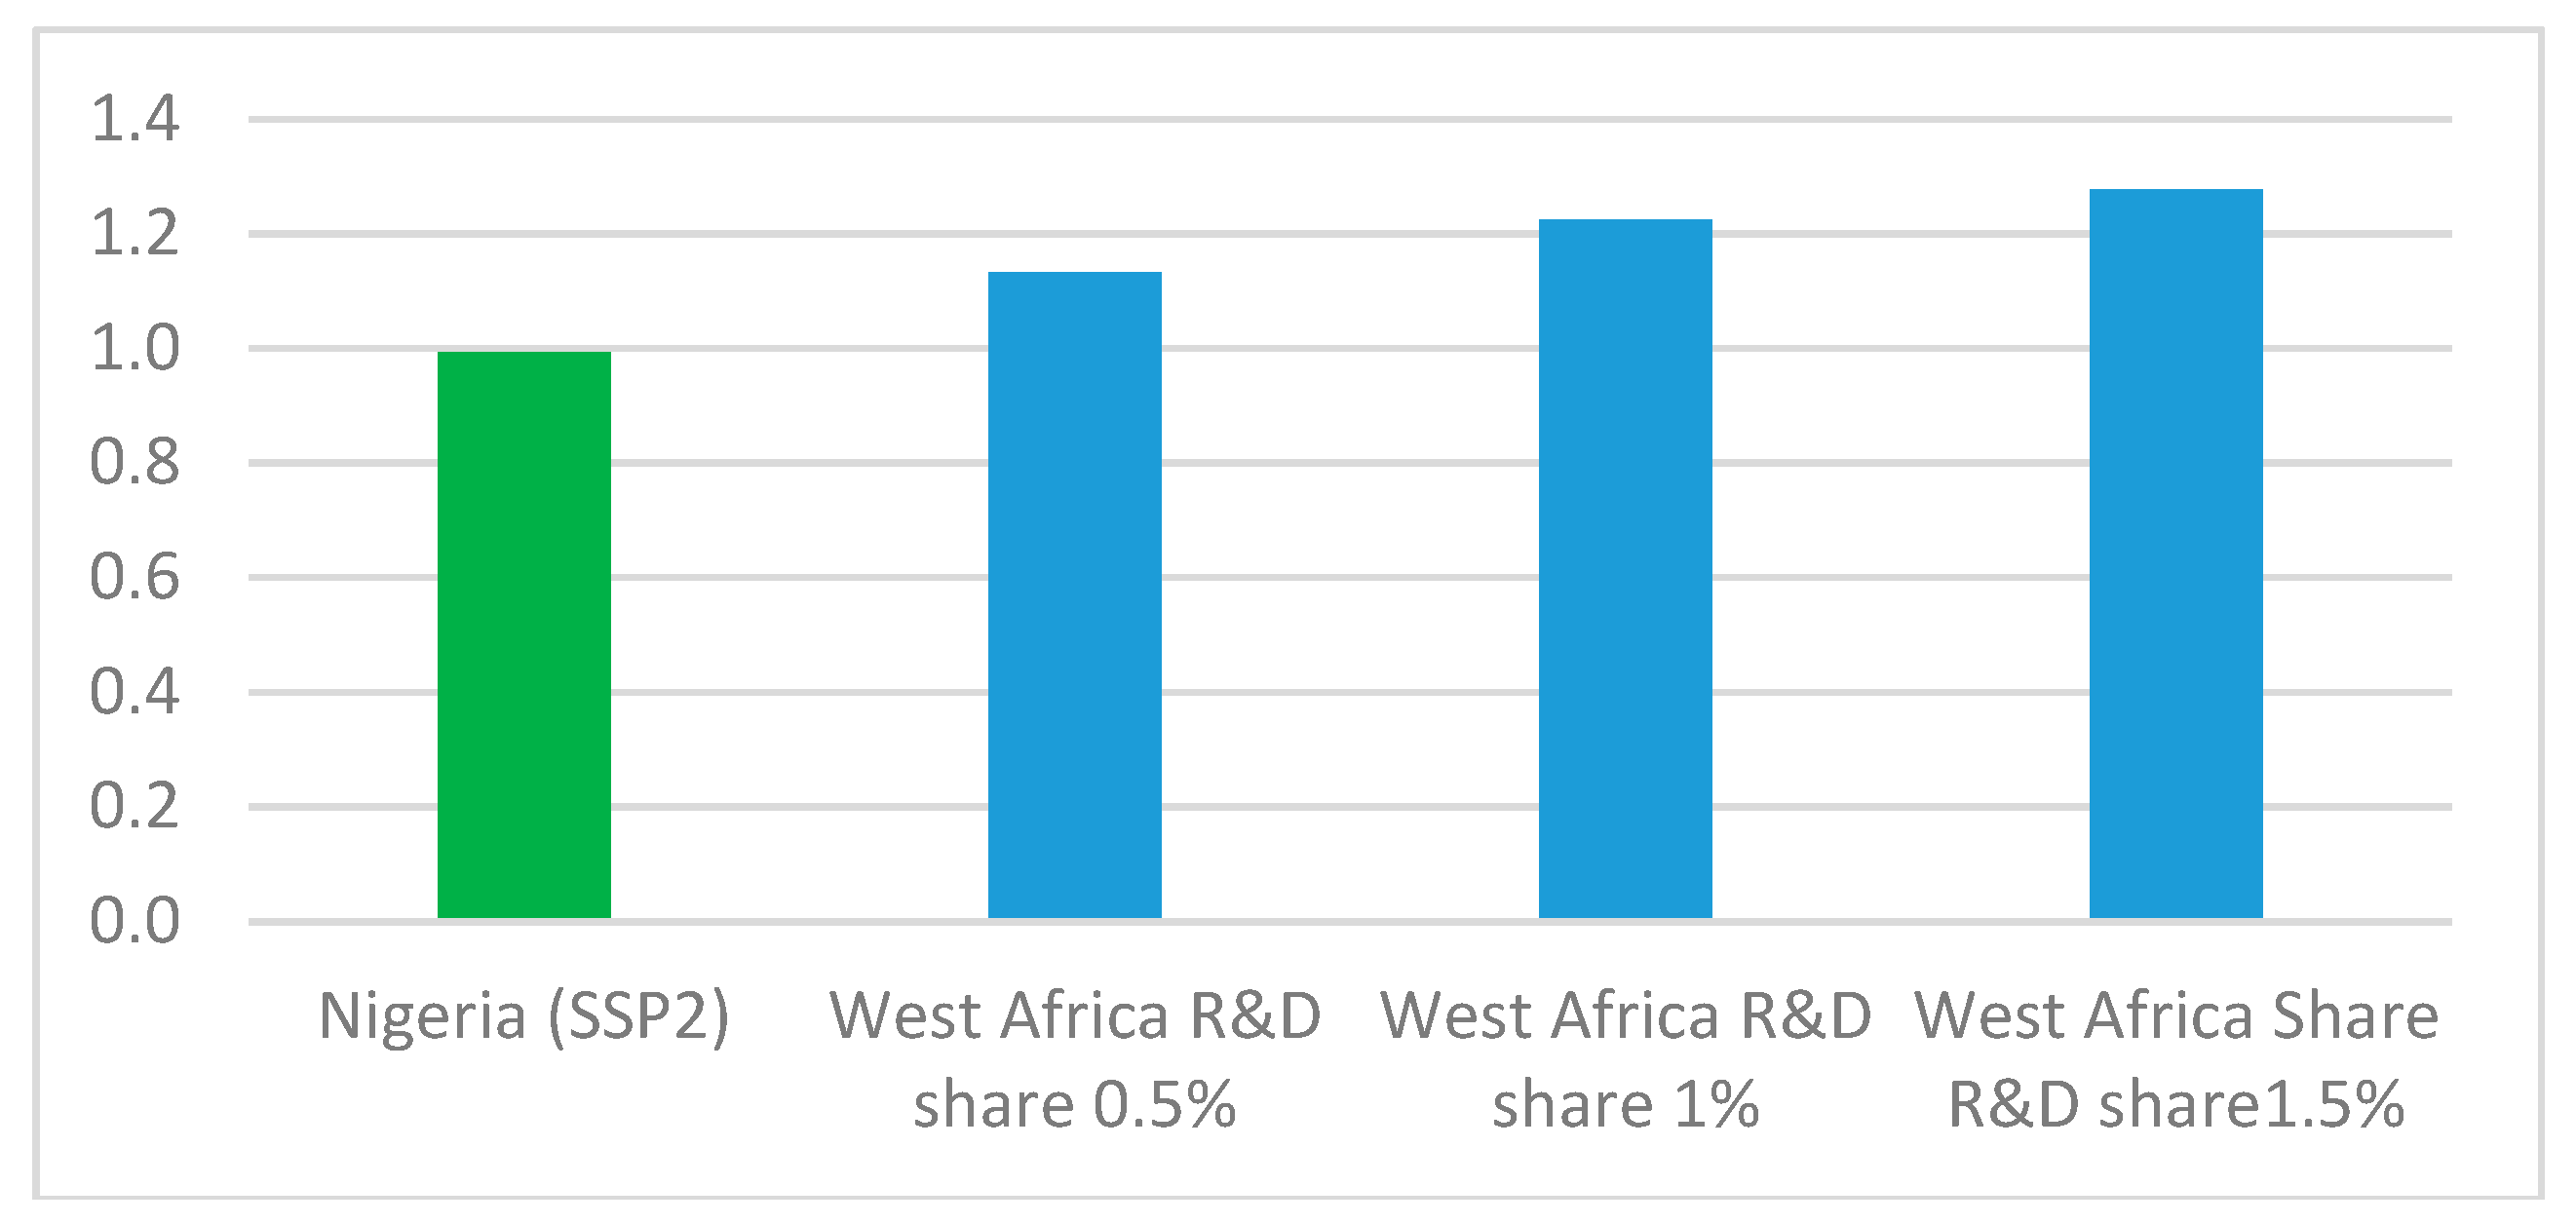
At least two implications of these scenario analyses can be assessed. First, without a significant governmental policy directed to R&D, it is not plausible to expect significant boosts of yields in the future. Coupled with the limited possibilities for the expansion of agricultural land, to prevent the collapse of the system under the dynamic growth of population and incomes, an increase in input intensification will be necessary. Western Africa has one of the lowest shares of agricultural R&D spending as a proportion of agricultural GDP in the world (0.5% vs 5% in high income countries). In earlier research it was estimated that under a 0.5% share of R&D spending in agricultural GDP, land productivity can grow up to 1% annually (Figure 18) [51]. In order to close the yield gap with high income countries, yields would need to grow by 3.5% annually, which requires a much larger share of R&D spending than is the current spending.
The second implication is related to the nature of the land tenure system in Nigeria that has been critiqued to be expensive, cumbersome, time-consuming, and risky, creating a major bottleneck for improving the food supply system [42,45]. If rigidity on the land market is project to remain the status quo, and under contextual changes towards 2050 (as presented by assumptions on buoyant economic growth, population growth and urbanization and technology change), demand growth from the rising middle classes are projected to take the form of more processed food and higher consumption of animal source foods. The model suggests strong import competition in Nigeria for these sectors. Meat and dairy would be produced only in part from domestic livestock systems and with limited backward linkages into domestic cropping systems because of the scarcity and low productivity on crop land. As a result, a significant portion of demand is projected to be sourced from imports. A speculative interpretation of the scenario results for expansion in the meat and dairy sector with a higher input from skilled labour and capital is that “footloose” livestock production systems may thrive in the vicinity of urban centres. These are capital-intensive production systems, aimed at maximum technical efficiency, yet with possible trade-offs in terms of benefits to ecological and human livelihood systems [52]. While these systems may provide clear benefits in terms of an effective and efficient food provision, if these systems depend on global imports of feed or intermediate products (frozen meat, milk powder), the general equilibrium effects on food security and diet quality at population level may be less beneficial for society than under an alternative scenario that promotes a more diverse domestic supply. With land substitution demand, pull may benefit the rural development and nutrition agenda for the rural population. A striking result is that intensification in the analysis results in greater diversity of the production systems, which in turn cascades into positive effects on the diversity in the food supply. This suggests that intensification in Nigeria would lead to the availability of foods with higher density in micronutrients than without intensification.
The results of our study can be put into context with other empirical evidence, although, as argued in the introduction section, the macroeconomic perspective on the linkage between food systems and diets is not yet sufficiently covered in the existing literature. One recent study applied a CGE methodology as well, to carry out an economic assessment of climate change impacts in Nigeria [16]. Whereas the authors warn against possible growth of food prices and higher food dependency on foreign imports due to climate change, they do not analyse the nutritional aspects of climate change impacts in Nigeria. Another study examined the agricultural transformation and its relation to hunger and poverty eradication in Nigeria [43]. The study argued that a rural transition is a condition for the alleviation of hunger and poverty. First, a structural change in labour markets to commercialize agriculture and develop agro-based industries was considered to be a major agricultural development pathway in Nigeria. This is in line with our study that clearly shows that in the absence of land substitution, labour currently employed in agriculture will have to seek employment outside of the primary sector, accelerating the process of urbanization. However, it can also be argued that in case of higher intensification, the agricultural labour could be used more productively within the agricultural sector and contribute thus to growth of rural wages. Second, the potential importance of increased capitalisation of the agricultural sector by improving access to credit was considered as a condition for the commercialisation pathway to materialise [43]. The findings from this study corroborate this; under assumptions that land is better substitutable for other inputs, the food-industry can absorb as much as 40% more capital, which points out to the need to improve access to credit to stimulate the intensification process of Nigerian agri-food system.
Various global initiatives employ food systems foresight on the global scale. A recent review identified a paucity of studies that apply comparable methodologies at regional and national levels [8]. It is instructive, therefore, to reflect on this study on the food systems foresight on Nigeria from the perspective of an earlier global approach that addressed similar themes using comparable methods as ours [53]. The baseline scenario in this study identified similar challenges in achieving the goals of achieving food and nutrition security in the absence of agricultural intensification. These are upward pressure on land prices, high food prices threating economic growth, insufficient agricultural productivity growth and a prevalence of micronutrient deficiency. In view of this, the results of this study, while focussed on Nigeria, can provide lessons for other developing countries facing similar issues of rapid transformation coupled with the triple burden of malnutrition. Results of this study indicate that different trajectories of the food system affect average diet developments towards more calories, carbohydrates and fats or alternatively towards an increased importance of fruit and vegetables. While showing that food system developments matter for the undernutrition, micronutrient deficiency and obesity challenges of fast changing countries like Nigeria, complementary micro-level analyses are needed to assess the food system impacts on the nutrient transition of vulnerable population groups.
There are several limitations of this study that should be mentioned. Because of the widespread presence of informal arrangements in Nigerian markets, it is difficult to represent them in a broad-based modelling framework such as the global computable equilibrium model used here. A further limitation is that the behavioural decisions of consumers are modelled for a single representative household. No distinction is made regarding the livelihood system or geography of the household, even though these conditions will obviously drive both production and consumption decisions as well as dietary outcomes. Analyses of household consumption point to large differences across households in relation to socioeconomic, geographic and cultural variables [30,32,33]. In particular, the regional and rural/urban dimensions of nutrition warrant a deeper analysis if it is made useful for policy-making in Nigeria.
With respect to the areas of future research, a further analysis of the heterogeneity of household response to food systems drivers is considered as key issue. As consumer diets should be seen as outcomes as well as drivers of the performance of national food systems, maintaining a link with the macro-level framework as presented here is considered to be important while exploring response at the micro-level in greater depth. The question raised before, whether Nigeria’s national food system has the potential to nourish its population with a healthy diet, can therefore be answered only in part, with these limitations in mind.
5. Conclusions
This paper provides a perspective on the future of food systems in Nigeria, taking into account an interplay of various macroeconomic and biophysical drivers. Because of its highly dynamic economic growth and demographic boom, the country represents an interesting case of studying the impact of these drivers on the food systems.
Given the historical increase in land expansion and low yield growth, land availability was identified as the key constraining factor determining the future of the food systems and food security.
The projections obtained in this study distinguish two future worlds for Nigeria and it is the land rigidity and extensification that determines which of the two worlds would become reality. In the first world, where land would be used extensively without inputs substitution, increasing pressures on the land market would result in excessive growth of producer prices. Food systems production value would increase about six times to the benefit of some agri-food players, mainly (white) meat processing sectors that could turn net exporters for the first time. For the economy as a whole, it would bring a positive structural transformation towards industrialization, higher role of services, less agriculture and less oil & gas. This is because industry and services would benefit from the release of non-land resources from agriculture. On the other hand, the world would become less favourable for consumers due to rising food prices, declining wages and increasing wage disparity between agriculture and the rest of the economy. Most of the income of the consumers would be spent on food and the access to food as one of the dimensions of food security would worsen not only for the unskilled but also for the skilled labour endowed households. From the nutritional point of view, the households would consume more calories, but these would come from more processed foods such as flour and palm oil, as well as from white meat.
In the alternative world, the non-land inputs, particularly labour, would substitute increasingly scarcer land. Higher land productivity due to the use of more inputs would rise wages in agriculture resulting in a more pro-poor growth. The traditionally trade-oriented sectors would restore competitiveness and, eventually, agri-food trade would enjoy a positive trade balance in many commodities. The structural transformation from agriculture to industry would be also expected, but with a higher share of food-economy. Because of decreasing food prices and increasing wages, food security would improve and the share of food expenditures in total expenditures would be comparable to a middle-income economy. Although the caloric consumption would come from more from primary agriculture, the share of fruits and vegetables would be higher, with more positive health impacts.
Main policy recommendations for fostering food systems development with positive nutritional impacts in Nigeria are directed to increased investments in agricultural R&D to alleviate the land pressure, reducing the rigidity of land markets to stimulate entrance and exit from the land market and to support intensification by improved access to capital markets and by replacing land for agricultural labour to stimulate agricultural wages.
As argued in the discussion, for multiple reasons the evolution of impact of these food systems changes on diet and nutrient gaps warrants further analysis and interpretation in a combined micro-level and macro-level framework. Concretely, the absorption capacity of skilled labour inside agriculture should be further assessed. An important area of future research is the analysis of heterogeneity of household response to food systems by linking the macro-level framework to simulating behaviour of individual households. This can enable tracing how the macro-drivers of food system effect individuals’ nutritional outcomes and provide more insights into the nutrition inequality.
Author Contributions
Conceptualization, Z.S.K. and T.A.; methodology, Z.S.K. and M.K.; investigation, Z.S.K. and T.A.; data curation, Z.S.K. and M.K.; writing—original draft preparation, Z.S.K. and T.A; writing—review and editing, Z.S.K., T.A. and M.K.; visualization, Z.S.K.; project administration and funding acquisition, T.A.
Funding
This research was funded by CGIAR program Agriculture for Nutrition and Health (A4NH), grant no. P329 “Key leverage points in the food system”, Dutch Ministry of Agriculture, Nature and Food Quality under grant no. WUR-KB22-001-003, and the European Union under Grant Agreement no. 633692 (SUSFANS).
Acknowledgments
We thank Jonathan Doelman, PBL Netherlands Environmental Assessment Agency, for sharing data on land use in Nigeria, and for his comments on the scenario design. We thank participants at the A4NH technical stakeholder workshop on food systems diagnosis and foresight (Abuja, 2–3 July 2018), SDG conference (Wageningen, 30 August 2018) and Tropentag (Ghent, September 2018) for comments and discussions.
Conflicts of Interest
The authors declare no conflict of interest. The funders had no role in the design of the study; in the collection, analyses, or interpretation of data; in the writing of the manuscript, or in the decision to publish the results.
Appendix A. The Nested Structure of CES and CET Functions in MAGNET
Figure A1.
The nested production structure in the crop production sectors (substitution elasticity is in the brackets).
Figure A1.
The nested production structure in the crop production sectors (substitution elasticity is in the brackets).

Figure A2.
The nested production structure in the livestock production sectors (substitution elasticity is in the brackets).
Figure A2.
The nested production structure in the livestock production sectors (substitution elasticity is in the brackets).

Figure A3.
The nested production structure in the food processing industry, other industry and services production sectors (substitution elasticity is in the brackets).
Figure A3.
The nested production structure in the food processing industry, other industry and services production sectors (substitution elasticity is in the brackets).

Figure A4.
The structure of land allocation in the CET function (substitution elasticity is in the brackets).
Figure A4.
The structure of land allocation in the CET function (substitution elasticity is in the brackets).

Appendix B. MAGNET and GENUS Database

Table A1.
List of MAGNET sectors and mapping to GTAP.
| GTAP Code | Description | MAGNET Code | Description |
|---|---|---|---|
| pdr | Paddy rice | pdr | Paddy and processed rice |
| wht | Wheat | wht | Wheat |
| gro | Cereal grains nec | grain | Cereal grains nec |
| osd | Oil seeds | oils | Oil seeds |
| c_b | Sugar cane, sugar beet | sug | Sugar cane, sugar beet |
| v_f | Vegetables, fruit, nuts | hort | Vegetables, fruit, nuts |
| ocr | Crops nec | crops | Crops nec |
| pfb | Plant-based fibers | oagr | Other agriculture |
| Bfctl * | beef | cattle | cattle sector |
| ctl | Cattle, sheep, goats, horses | othctl | sheep, goats, horses |
| Pltry * | poultry live animals | pltry | poultry sector |
| wol | Wool, silk-worm cocoons | wol | Wool, silk-worm cocoons |
| oap | Animal products nec | pigpls | Pig and other animal product |
| rmk | Raw milk | milk | Raw milk |
| BFCMT * | beaf meat | bfmt | beef meat |
| cmt | Meat: cattle, sheep, goats, horse | othcmt | Meat: other cattle, sheep, goats, horse |
| Poum * | Poultry meat | pulmt | poultry meat |
| omt | Meat products nec | othmt | Other meat product nec |
| mil | Dairy products | dairy | Dairy products |
| sgr | Sugar and molase | sugar | Sugar and molasses |
| vol | Vegetable oils and fats | vol | Vegetable oils and fats |
| pcr | Processed rice | pcr | Processed rice |
| ofd and b_t | Food products nec, Beverages and tobacco | ofd | Processed food |
| Feed * | Animal feed | feed | Animal feed |
| Fsh * | Fishing | wfish | Wild fish |
| Aqcltr * | Diadromis fish | aqcltr | Aquaculture |
| Fishp * | Fish processing | fishp | Fish processing |
| Fishm * | Fish meal | fishm | fish meal |
Note: GTAP codes with * refer to sectors that are newly disaggregated in MAGNET. Original GTAP sectors are found at: https://www.gtap.agecon.purdue.edu/databases/v9/v9_sectors.asp.
Table A2.
GENUS macro and micronutrient data for Nigeria (2011).
| 1 Median | 2 Low | 3 High | |
|---|---|---|---|
| 1 EdFd | 1549 | 1549 | 1549 |
| 2 Calorie | 2969 | 2911 | 3052 |
| 3 Protein | 66 | 62 | 71 |
| 4 Fat | 58 | 56 | 65 |
| 5 Carb | 58 | 56 | 65 |
| 6 VitC | 218 | 203 | 274 |
| 7 VitA | 1118 | 151 | 1299 |
| 8 Folate | 473 | 463 | 516 |
| 9 Calcium | 423 | 365 | 508 |
| 10 Iron | 23 | 19 | 26 |
| 11 Zinc | 13 | 12 | 15 |
| 12 Potas | 5379 | 5100 | 5613 |
| 13 Fiber | 49 | 47 | 55 |
| 14 Copper | 3 | 2 | 3 |
| 15 Sodium | 195 | 183 | 210 |
| 16 Phosph | 1452 | 1366 | 1768 |
| 17 Thiamin | 2 | 2 | 3 |
| 18 Ribofl | 1 | 1 | 1 |
| 19 Niacin | 16 | 14 | 27 |
| 20 B6 | 3 | 3 | 3 |
| 21 Magnsm | 623 | 594 | 803 |
| 22 SatFat | 22 | 21 | 25 |
| 23 MonoUSF | 20 | 18 | 22 |
| 24 PolyUSF | 14 | 12 | 15 |
Appendix C. Detailed MAGNET Results
Table A3.
Annual growth of factor prices (2020–50) and % difference of prices in 2050 (Land_Subs vs Land_Fixed scenario).
Table A3.
Annual growth of factor prices (2020–50) and % difference of prices in 2050 (Land_Subs vs Land_Fixed scenario).
| Factor | Sector | Land_Fixed | Land_Subs | % Diff. 2050 |
|---|---|---|---|---|
| Land | AGRI_PRIM | 12.8 | 0.2 | −98 |
| UnSkLab | AGRI_PRIM | −1.5 | 0.0 | 62 |
| OTHER_SECTORS | 0.5 | 2.0 | 55 | |
| SkLab | AGRI_PRIM | −1.5 | 0.0 | 60 |
| OTHER_SECTORS | −1.4 | 0.0 | 58 | |
| Capital | AGRI_PRIM | −2.3 | −1.3 | 37 |
| OTHER_SECTORS | −2.2 | −1.2 | 37 |
Figure A5.
The structure of real value added.

Table A4.
Absolute difference of sector endowment volumes in Land_subs vs. Land_Fixed scenario in 2050 (million USD in constant prices of 2011).
Table A4.
Absolute difference of sector endowment volumes in Land_subs vs. Land_Fixed scenario in 2050 (million USD in constant prices of 2011).
| UnSkLab | SkLab | Capital | |
|---|---|---|---|
| AGRI_PRIM | 2659 | 16,281 | 9151 |
| hort | 912 | 7307 | 4387 |
| crops | 6741 | 2806 | 4094 |
| pdr | 2172 | 1809 | 1821 |
| grain | −3514 | 1799 | −333 |
| oils | −553 | 1435 | 585 |
| othctl | −924 | 484 | −82 |
| wht | 1046 | 343 | 583 |
| oagr | 448 | 234 | 298 |
| cattle | −804 | 215 | −185 |
| sug | −199 | 64 | −40 |
| pigpls | −936 | −80 | −696 |
| pltry | −1747 | −142 | −1291 |
| AGRI_proc | 57 | 134 | 5087 |
| ofd | 157 | 3003 | 2499 |
| othcmt | 35 | 409 | 1695 |
| sugar | 12 | 206 | 54 |
| pcr | 8 | 149 | 405 |
| vol | 2 | 38 | 35 |
| bfmt | −13 | −673 | 1708 |
| pulmt | −53 | −1096 | −492 |
| othmt | −98 | −2034 | −940 |
| FISH SECTORS | −3472 | −89 | −3373 |
| wfish | −3462 | −24 | −3360 |
| aqcltr | −3 | 0 | −4 |
| fishp | −7 | −65 | −9 |
| AGRI_FOOD | −760 | 16,325 | 10,863 |
| INDUSTRY | −609 | −20,568 | −24,790 |
| SERV&UTIL | 4791 | 4765 | 5587 |
Figure A6.
Annual growth of producer prices in Nigerian economy between 2020–2050.

Figure A7.
Share of food expenditures in total household expenditures.

References
- World Bank. World Development Indicators; World Bank: Washington, DC, USA, 2018. [Google Scholar]
- Mandryk, M.; Doelman, J.; Stehfest, E. Assessment of Global Land Availability: Land Supply for Agriculture. FOODSECURE Technical Papers; LEI Wageningen UR. 2015. Available online: https://www.pbl.nl/en/publicaties/assessment-of-global-land-availability-land-supply-for-agriculture (accessed on 5 September 2018).
- National Population Commission Nigeria. I. C. F. International Nigeria Demographic and Health Survey, 2013; National Population Commission Nigeria: Abuja, Nigeria, 2014.
- Imamura, F.; Micha, R.; Khatibzadeh, S.; Fahimi, S.; Shi, P.; Powles, J.; Mozaffarian, D. Dietary quality among men and women in 187 countries in 1990 and 2010: A systematic assessment. Lancet Glob. Health 2015, 3, e132–e142. [Google Scholar] [CrossRef]
- HLPE. Nutrition and Food Systems; The High Level Panel of Experts on Food Security and Nutrition of the Committee on World Food Security: Rome, Italy, 2017. [Google Scholar]
- HLPE. Food Losses and Waste in the Context of Sustainable Food Systems; The High Level Panel of Experts on Food Security and Nutrition of the Committee on World Food Security: Rome, Italy, 2014. [Google Scholar]
- Ingram, J. A food systems approach to researching food security and its interactions with global environmental change. Food Secur. 2011, 3, 417–431. [Google Scholar] [CrossRef]
- Van Dijk, M.; Meijerink, G. A Review of Global Food Security Scenario and Assessment Studies: Results, Gaps and Research Priorities; FOODSECURE Working Papers; LEI: Wageningen, The Netherlands, 2014. [Google Scholar]
- Zurek, M.; Hebinck, A.; Leip, A.; Vervoort, J.; Kuiper, M.; Garrone, M.; Havlík, P.; Heckelei, T.; Hornborg, S.; Ingram, J.; et al. Assessing Sustainable Food and Nutrition Security of the EU Food System—An Integrated Approach. Sustainability 2018, 10, 4271. [Google Scholar] [CrossRef]
- De Haen, H.; Réquillart, V. Linkages between sustainable consumption and sustainable production: Some suggestions for foresight work. Food Secur. 2014, 6, 87–100. [Google Scholar] [CrossRef]
- Abdullahi, D.; John, M.S. The Political will and Quality Basic Education in Nigeria. J. Power Polit. Gov. 2014, 2. [Google Scholar]
- WENR. Education in Nigeria; World Education News & Reviews: New York, NY, USA, 2017. [Google Scholar]
- UNDESA. World Urbanization Prospects—2018 Revision; United Nations Population Division: Geneva, Switzerland, 2018. [Google Scholar]
- CTA. A Case Study Report on Nigeria’s Agricultural Extension and Advisory System; Technical Center for Agricultural and Rural Cooperation: Wageningen, The Netherlands, 2011. [Google Scholar]
- DLEC Project. Nigeria: In-Depth Assessment of Extension and Advisory Services; Developing Local Extension Capacity Project; Care, Digital Green, IFPRI and USAID; United States Agency for International Development: Washington, DC, USA, 2017.
- Bosello, F.; Campagnolo, L.; Cervigni, R.; Eboli, F. Climate Change and Adaptation: The Case of Nigerian Agriculture. Environ. Resour. Econ. 2018, 69, 787–810. [Google Scholar] [CrossRef]
- Ayuba, I.G.U.; Ayuba, L.I. The Effect of Internal Displacement and Variation in Crop Production in Barkin Ladi Local Government Area of Plateau State. J. Environ. Earth Sci. 2016, 6, 35–40. [Google Scholar]
- Tari, V.A.; Kibikiwa, M.G.; Umar, K. The effects of Boko Haram insurgency on food security status of some selected local government areas in Adamawa State, Nigeria. Sky J. Food Sci. 2016, 5, 12–18. [Google Scholar]
- Van Berkum, S.; Achterbosch, T.; Linderhof, V.; Godeschalk, F.; Vroege, W. Dynamics of Food Systems in Sub-Saharan Africa: Implications for Consumption Patterns and Farmers’ Position in Food Supply Chains; Wageningen Economic Research: The Hague, The Netherlands, 2017. [Google Scholar]
- Okeke, E.C.; Eneobong, H.N.; Uzuegbunam, A.O.; Ozioko, A.O.; Kuhnlein, H. Igbo Traditional Food System: Documentation, Uses and Research Needs. Pak. J. Nutr. 2008, 7, 365–376. [Google Scholar] [CrossRef]
- Kuiper, M.; Kalter, J.; Mertens, E.; Latka, C.; Heckelei, T.; Leip, A.; Kanellopoulos, A.; Havlik, P.; Achterbosch, T. The SUSFANS Toolbox for Assessing EU Sustainable Food and Nutrition Security; SUSFANS: The Hague, The Netherlands, 2018. [Google Scholar]
- Van Meijl, H.; Tsiropoulos, I.; Bartelings, H.; Hoefnagels, R.; Smeets, E.; Tabeau, A.; Faaij, A. On the macro-economic impact of bioenergy and biochemicals—Introducing advanced bioeconomy sectors into an economic modelling framework with a case study for the Netherlands. Biomass Bioenergy 2018, 108, 381–397. [Google Scholar] [CrossRef]
- Kuiper, M.; Shutes, L.; Verma, M.; Tabeau, A.; van Meijl, H. Exploring the Impact of Alternative Population Projections on Prices, Growth and Poverty Developments; Background Paper to the UNCTAD-FAO Commodities and Development Report 2017 Commodity Markets, Economic Growth and Development; FAO: Rome, Italy, 2018; ISBN 978-92-5-130096-1. [Google Scholar]
- Helming, J.; Tabeau, A. The economic, environmental and agricultural land use effects in the European Union of agricultural labour subsidies under the Common Agricultural Policy. Reg. Environ. Chang. 2018, 18, 763–773. [Google Scholar] [CrossRef]
- Woltjer, G.; Kuiper, M.; Kavallari, A.; van Meijl, H.; Powell, J.; Rutten, M.; Shutes, L.; Tabeau, A. The MAGNET Model: Module Description; LEI Wageningen UR: The Hague, The Netherlands, 2012. [Google Scholar]
- Aguiar, A.; Narayanan, B.; McDougall, R. An Overview of the GTAP 9 Data Base. J. Glob. Econ. Anal. 2016, 1, 181–208. [Google Scholar] [CrossRef] [Green Version]
- Keeney, R.; Hertel, T. GTAP-AGR: A Framework for Assessing the Implications of Multilateral Changes in Agricultural Policies; GTAP Technical Paper No. 24; Purdue University: Purdue, IN, USA, 2005. [Google Scholar]
- Tabeau, A.; Helming, J.; Philippidis, G. Land Supply Elasticity: Overview of Available Estimates and Recommended Values for Magnet; EU: Brussels, Belgium, 2017; ISBN 978-92-79-69102-7. [Google Scholar]
- Smith, M.R.; Micha, R.; Golden, C.D.; Mozaffarian, D.; Myers, S.S. Global Expanded Nutrient Supply (GENuS) Model: A New Method for Estimating the Global Dietary Supply of Nutrients. PLoS ONE 2016, 11, e0146976. [Google Scholar] [CrossRef] [PubMed]
- Brouwer, I.D.; Nijhuis, A.; Talsma, E.F.; Trijsburg, L.; Pastoria, G.; Mekonnen, D.A.; Morley, T.; Linderhof, V.; Achterbosch, T. The state of the dietary and nutrient gaps in Nigeria. In Proceedings of the A4NH Stakeholder Workshop “Food Systems for Healthier Diets in Nigeria”; IFPRI: Washington, DC, USA, 2018. [Google Scholar]
- NBS. Nigeria—General Household Survey, Panel 2015–2016, Wave 3; NBS: Abuja, Nigeria, 2017.
- Akerele, D. Household Food Expenditure Patterns, Food Nutrient Consumption and Nutritional Vulnerability in Nigeria: Implications for Policy. Ecol. Food Nutr. 2015, 54, 546–571. [Google Scholar] [CrossRef] [PubMed]
- Aromolaran, A.B. Does increase in women’s income relative to men’s income increase food calorie intake in poor households? Evidence from Nigeria. Agric. Econ. 2010, 41, 239–249. [Google Scholar] [CrossRef]
- Onyemauwa, C.S. Analysis of Household Consumption of Cassava Products in Ohaozara, Ebonyi State, Southeast Nigeria. Researcher 2010, 2, 1–6. [Google Scholar]
- Arndt, C. Nigeria’s Macroeconomic Crisis Explained; NSSP Working Paper; International Food Policy Research Institute (IFPRI): Abuja, Nigeria, 2018. [Google Scholar]
- World Bank. Macro Poverty Outlook for Sub-Saharan Africa: Nigeria; World Bank: Washington, DC, USA, 2018; pp. 266–267. [Google Scholar]
- International Monetary Fund World Economic Outlook Database April 2018. Available online: https://www.imf.org/external/pubs/ft/weo/2018/01/weodata/index.aspx (accessed on 15 November 2018).
- Riahi, K.; van Vuuren, D.P.; Kriegler, E.; Edmonds, J.; O’Neill, B.C.; Fujimori, S.; Bauer, N.; Calvin, K.; Dellink, R.; Fricko, O.; et al. The Shared Socioeconomic Pathways and their energy, land use, and greenhouse gas emissions implications: An overview. Glob. Environ. Chang. 2017, 42, 153–168. [Google Scholar] [CrossRef] [Green Version]
- Fricko, O.; Havlik, P.; Rogelj, J.; Klimont, Z.; Gusti, M.; Johnson, N.; Kolp, P.; Strubegger, M.; Valin, H.; Amann, M.; et al. The marker quantification of the Shared Socioeconomic Pathway 2: A middle-of-the-road scenario for the 21st century. Glob. Environ. Chang. 2017, 42, 251–267. [Google Scholar] [CrossRef] [Green Version]
- PWC. The World in 2050; Pricewaterhouse Coopers: London, UK, 2017. [Google Scholar]
- Lutz, Butz, and Kc Wittgenstein Centre Data Explorer. Available online: http://dataexplorer.wittgensteincentre.org/shiny/wic/ (accessed on 15 November 2018).
- PWC. Transforming Nigeria’s Agricultural Value Chain; PricewaterhouseCoopers: London, UK, 2017. [Google Scholar]
- Nwankpa, N. Sustainable Agricultural Development in Nigeria: A Way Out of Hunger and Poverty. Eur. J. Sustain. Dev. 2017, 6, 175–184. [Google Scholar] [CrossRef]
- Laborde, D.; Lallemant, T.; McDougal, K.; Smaller, C.; Fousseini, T. Transforming Agriculture in Africa & Asia: What Are the Policy Priorities? ISSD and IFPRI: Washington, DC, USA, 2018. [Google Scholar]
- UNDP. The Roles and Opportunities for the Private Sector in Africa’s Agro-Food Industry; United Nations Development Programme (UNDP): Johannesburg, South Africa, 2012. [Google Scholar]
- FAO Nigeria at a Glance. Available online: http://www.fao.org/nigeria/fao-in-nigeria/nigeria-at-a-glance/en/ (accessed on 15 November 2018).
- Stehfest, E.; van Vuuren, D.; Bouwman, L.; Kram, T. Integrated Assessment of Global Environmental Change with IMAGE 3.0: Model Description and Policy Applications; Netherlands Environmental Assessment Agency (PBL): Bilthoven, The Netherlands, 2014; ISBN 94-91506-71-4. [Google Scholar]
- World Bank. World Development Indicators—Fertilizer Consumption; World Bank: Washington, DC, USA, 2018. [Google Scholar]
- World Bank. World Development Report 2008: Agriculture for Development; The World Bank: Washington, DC, USA, 2008. [Google Scholar]
- Liverpool-Tasie, L.S.; Barrett, C.B.; Sheahan, M.B. Understanding Fertilizer Use and Profitability of Rice Production across Nigeria’s Diverse Agroecological Conditions. In Proceedings of the Annual Bank Conference on Africa 2014; Available online: http://catalog.ihsn.org/index.php/citations/61607 (accessed on 5 September 2018).
- Kristkova, Z.S.; van Dijk, M.; van Meijl, H. Assessing the Impact of Agricultural R&D Investments on Long-Term Projections of Food Security. In World Agricultural Resources and Food Security; Frontiers of Economics and Globalization; Emerald Publishing Limited: Bingley, UK, 2017; Volume 17, pp. 1–17. [Google Scholar]
- Baltussen, W.; Achterbosch, T.; Arets, E.; de Blaeij, A.; Erlenborn, N.; Fobelets, V.; Galgani, P.; de Groot Ruiz, A.; Hardwicke, R.; Hiemstra, S.J.; et al. Valuation of Livestock Eco-Agri-Food Systems: Poultry, Beef and Dairy; Wageningen Economic Research Report; 2017-039; Wageningen Economic Research: Wageningen, The Netherlands, 2017; ISBN 978-90-8615-734-1. [Google Scholar]
- Dobermann, A.; Nelson, R.; Beever, D.; Bergvinson, D.; Crowley, E.; Denning, G.; Giller, K.; d’Arros Hughes, J.; Jahn, M.; Lynam, J. Solutions for Sustainable Agriculture and Food Systems. U. N. Sustain. Dev. Solut. Netw. Paris Fr. 2013. Available online: http://unsdsn.org/what-we-do/thematic-networks/sustainable-agriculture-and-food-systems/ (accessed on 5 September 2018).
Figure 1.
MAGNET—a complete economic model of nations in the global economy.

Figure 2.
Historical and projected GDP per capita in Nigeria (compilation of sources).

Figure 3.
Projected population growth in Nigeria and the rest of Sub-Saharan Africa.

Figure 4.
Projections of skilled and unskilled labour force in Nigeria.

Figure 5.
Land pressure in MAGNET countries (% of occupied land in total agricultural land) in the base year.
Figure 5.
Land pressure in MAGNET countries (% of occupied land in total agricultural land) in the base year.

Figure 6.
Ratio of fertilizer to land input use in nominal terms (USD) in MAGNET database.

Figure 7.
Growth of land price index per scenario. (2011 = 1).

Figure 8.
Index of primary agriculture prices in the two scenarios.

Figure 9.
Annual growth of prices between 2020–2050.

Figure 10.
Annual growth of production volume (2020–2050) and volume of production of the major commodities (production volume of sugar, milk, dairy, wheat and aquaculture are too small to be reported).
Figure 10.
Annual growth of production volume (2020–2050) and volume of production of the major commodities (production volume of sugar, milk, dairy, wheat and aquaculture are too small to be reported).

Figure 11.
Annual growth of producer market prices of major agro-food commodities (2020–2050).

Figure 12.
Agri-food trade balance expressed in world prices in million USD.

Figure 13.
Annual growth of household expenditures on individual food groups (%, 2020–2050, left-hand scale) and value of expenditures in 2011 (million USD, right-hand scale).
Figure 13.
Annual growth of household expenditures on individual food groups (%, 2020–2050, left-hand scale) and value of expenditures in 2011 (million USD, right-hand scale).

Figure 14.
Projections of household caloric consumption (kcal per day) in the low, medium and high variant (converted to adult female equivalent).
Figure 14.
Projections of household caloric consumption (kcal per day) in the low, medium and high variant (converted to adult female equivalent).

Figure 15.
Projections of caloric consumption (kcal per capita day) per food group.

Figure 16.
Overview of micronutrient intake in different scenarios (mg/capita/day or g/capita/day).

Figure 17.
Overview of micronutrient gap in 2011 and 2050. Note: ratio is calculated as a nutritional intake divided by recommended dose. GENUS data is translated to female adult equivalent to correspond to the recommended dose in LSMS-ISA.
Figure 17.
Overview of micronutrient gap in 2011 and 2050. Note: ratio is calculated as a nutritional intake divided by recommended dose. GENUS data is translated to female adult equivalent to correspond to the recommended dose in LSMS-ISA.

Figure 18.
Expected annual growth of land productivity (2011–2050) in the SSP2 scenario and under alternative intensities for R&D. Sources: for Nigeria, the IMAGE model [47]; for West-Africa under different R&D intensities, the MAGNET model [51].

Table 1.
Regional aggregation in MAGNET.
| Code | Description | GTAP Regions Included |
|---|---|---|
| NGA | Nigeria | nga |
| ETH | Ethiopia | eth |
| SSA | Sub Saharan Africa | ben, bfa, cmr, civ, gha, gin, sen, tgo, xwf, xcf, xac, ken, mdg, mwi, mus, moz, rwa, tza, uga, zmb, zwe, xec, bwa, nam, zaf, xsc |
| VNM | Vietnam | vnm |
| BGD | Bangladesh | bgd |
| APTA | Asia-Pacific trade agreement | chn, hkg, kor, mng, twn, lao, ind, lka |
| EAS | East and South East Asia | xea, brn, khm, idn, mys, phl, sgp, tha, xse |
| EU | European Union | aut, bel, cze, dk, est, fin, fra, deu, grc, hun, irl, ita, lva, ltu, lux, mlt, nld, pol, prt, svk, svn, esp, swe, gbr, hr, rou |
| NAFTA | North American FTA | can usa, mex, xna |
| LAM | Latin America | arg, bol, bra, chl, col, ecu, pry, per, ury, ven, xsm, cri, gtm, hnd, nic, pan, slv, xca, dom, jam, pri, tto, xcb |
| ROW | Rest of the World | all remaining regions |
Note: GTAP regions are described at: https://www.gtap.agecon.purdue.edu/databases/regions.asp?Version = 9.211.
Table 2.
Sectoral aggregation in MAGNET (MAGNET codes in brackets).
| Category | MAGNET Food System Sectors |
|---|---|
| Arable and horticulture | paddy rice (pdr), wheat (wht); other grains (grain); oilseeds (oils); raw sugar (sug); vegetables, fruits and nuts (hort); other crops (crops); plant fibres (oagr) |
| Livestock and meat | beef cattle (cattle); other grazing animals such as sheep,goats,horses (othctl), wool (wol); pigs (pigpls), poultry (pltry); raw milk (milk); cattle meat (bfmt); meat from other grazing animals (othcmt), pork meat (othmt), poultry meat (pulmt); dairy (dairy) |
| Other food and beverages | sugar processing (sugar); rice processing (pcr); vegetable oils and fats, including crude vegetable oil (vol)1; fishing (fish); aqua culture (aqcu), fish processing (fishp), other food and beverages (ofd) |
| Supplying food system industries | fertiliser (fert), crude vegetable oil by-product oilcake (oilcake); fish meal (fishm), animal feed (feed), chemicals, rubbers and plastics—pesticides (othcrp); 1st generation bioethanol by-product distillers dried grains and solubles (ddgs) |
| Other sectors | Various industry (including biofuels), transport and service sectors |
Table 3.
Structure of caloric consumption in Nigeria by food group, across various resources.
| Database (Year), Source | ||||
|---|---|---|---|---|
| Database | GENUS (2011) | General household survey (2015–16) | National FCNS (2003–04) | Rural South-west Nigeria |
| Source | Smith et al. (2016) | Brouwer et al. (2018) | Akerele (2015) | Aromolaran (2010) |
| Cereals | 41.7% | 39.5% | 42.0% | 17.0% |
| Roots and tubers | 26.8% | 27.9% | 24.0% | 56.0% |
| Cereals, roots and tubers | 68.5% | 67.4% | 66.0% | 73.0% |
| Sugar | 3.4% | 1.9% | 0.5% | 0.6% |
| Legumes | 2.8% | 6.9% | 10.0% | 7.5% |
| Seeds and nuts | 4.8% | 1.5% | 1.7% | x |
| Vegetables | 1.8% | 1.2% | 2.5% | 2.90% |
| Fruits | 3.5% | 2.0% | 0.3% | 1.35% |
| Fruits and vegetables | 5.3% | 3.2% | 2.8% | 4.3% |
| Tea coffee | 0.0% | 0.0% | 0.1% | 0.63% |
| Spices | 0.4% | 0.2% | x | x |
| Alcohol | 2.1% | 0.2% | 0.1% | x |
| Meat | 1.4% | 2.1% | 1.6% | 0.8% |
| Milk | 0.2% | 0.6% | 0.5% | 0.4% |
| Fish | 0.7% | 1.9% | 5% | 1.2% |
| Eggs | 0.4% | 0.2% | 0.1% | 0.4% |
| Eggs, meat and milk | 2.7% | 4.7% | 7.2% | 2.8% |
| Fats and oils | 9.9% | 13.8% | 9.0% | 10.0% |
| Total | 100% | 100% | 97% | 99% |
| Caloric consumption | 2969 | 2346 (2815) * | 2440 | 1980 ** |
Note: Categories not reported in the respective sources are marked with x.* GHS data converted to male equivalent. ** Calculated from the statistical regression tables provided by the author. Aggregated food groups are in bold.
Table 4.
Micro and macronutrient deficiency calculated as ratio of a nutrient intake to average recommended intake (expressed per adult female equivalent).
Table 4.
Micro and macronutrient deficiency calculated as ratio of a nutrient intake to average recommended intake (expressed per adult female equivalent).
| GENUS (2011) | General Household Survey (2015–2016) | ||
|---|---|---|---|
| Nutrients meeting recommendations | Thiamine | 2.9 | 3.4 |
| Vitamin A | 1.8 | 3.2 | |
| Vitamin B6 | 1.8 | 2.0 | |
| Folate | 1.5 | 1.7 | |
| Protein | 1.4 | 1.5 | |
| Niacin | 1.2 | 1.2 | |
| Vitamin C | 2.2 | 1.1 | |
| Zinc | 1.0 | 1.0 | |
| Nutrients not meeting recommendations | Fat | 0.7 | 0.8 |
| Riboflavin | 0.7 | 0.7 | |
| Iron | 0.7 | 0.7 | |
| Calcium | 0.4 | 0.6 |
Table 5.
Land use and land potential in Nigeria (2011).
| Land Type | Land Used for Agriculture (Million ha) | Land Suitable for Agriculture (Million ha) |
|---|---|---|
| Arable land | 41 | - |
| Pastures & other | 30 | - |
| Total agricultural land | 71 | - |
| Land suitable for agriculture (based on IMAGE) | - | 79 |
| Available land for expansion | - | 8 |
| Land pressure (% of land used or left) | 90% | 10% |
Source: land use (MAGNET database), land potential (IMAGE model).
Table 6.
Overview of the alternative baseline scenarios.
| Key Assumptions | LAND_FIXED | LAND_SUBS |
|---|---|---|
| Technical change | Exogenous—calibrated to GDP growth based on 4–5% p.a. | |
| GDP growth | Endogenous | |
| Population Growth | SSP2 (UN Medium Variant) | |
| Exogenous Yield growth | 1% p.a. based on SSP2 | |
| Feed efficiency improvements in livestock sectors | 1–2% p.a. based on IMAGE | |
| CES Substitution elasticity of NEST 1 (land bundle -other factors) | 0.1 (MAGNET) | 1.2 |
| CES Substitution elasticity of NEST 3 (land-fertilizer or land-feed) | 0.75 land-fertilizer, 0.5 land-feed | 1.2 both land-fertilizer and land-feed |
| Land allocation elasticity | −0.2 (NEST1), −0.4 (NEST2), −0.6 (NEST3) | 1 (Non-nested) |
Table 7.
Endowment volumes growth in Land_Subs in 2050 (% difference from Land_Fixed scenario) by sector in the economy.
Table 7.
Endowment volumes growth in Land_Subs in 2050 (% difference from Land_Fixed scenario) by sector in the economy.
| Sector Description | Code | Land | Unskilled Labour | Skilled Labour | Capital |
|---|---|---|---|---|---|
| Primary agriculture | AGRI_PRIM | 1.3 | 2.5 | 85.4 | 17.3 |
| Food processing | AGRI_proc | 4.1 | 0.5 | 36.4 | |
| Industry (non-food) | INDUSTRY | −38.2 | −42.2 | −11.6 | |
| Services and utilities | SERV&UTIL | 7.0 | 1.2 | 8.9 |
Table 8.
Aggregate consumer prices and expenditures of Nigerian households.
| (% annual growth, 2020–2050) | Land_Fixed | Land_Subs |
| Price index agri-food consumption | 4.2 | −1.8 |
| Agri-food consumption quantity | 2.0 | 2.4 |
| Agri-food expenditures | 6.3 | 0.6 |
| Total Household Expenditures | 5.6 | 2.6 |
| (Ratio of cereal consumer price index to unskilled labour wages, by sector of employment, 2050) | Land_Fixed | Land_Subs |
| Household employed in primary agriculture (2011 = 1) | 6.89 | 0.52 |
| Household employed in the rest of the economy (2011 = 1) | 3.69 | 0.28 |
© 2019 by the authors. Licensee MDPI, Basel, Switzerland. This article is an open access article distributed under the terms and conditions of the Creative Commons Attribution (CC BY) license (http://creativecommons.org/licenses/by/4.0/).
Share and Cite
MDPI and ACS Style
Smeets-Kristkova, Z.; Achterbosch, T.; Kuiper, M. Healthy Diets and Reduced Land Pressure: Towards a Double Gain for Future Food Systems in Nigeria. Sustainability 2019, 11, 835. https://doi.org/10.3390/su11030835
AMA Style
Smeets-Kristkova Z, Achterbosch T, Kuiper M. Healthy Diets and Reduced Land Pressure: Towards a Double Gain for Future Food Systems in Nigeria. Sustainability. 2019; 11(3):835. https://doi.org/10.3390/su11030835
Chicago/Turabian StyleSmeets-Kristkova, Zuzana, Thom Achterbosch, and Marijke Kuiper. 2019. "Healthy Diets and Reduced Land Pressure: Towards a Double Gain for Future Food Systems in Nigeria" Sustainability 11, no. 3: 835. https://doi.org/10.3390/su11030835
Note that from the first issue of 2016, this journal uses article numbers instead of page numbers. See further details here.