Financing for Water—Water for Financing: A Global Review of Policy and Practice


1
IHE-Delft Institute for Water Education, 2282XS Delft, The Netherlands
2
Global Center on Adaptation, 3072AP Rotterdam/9747AG Groningen, The Netherlands
Sustainability 2019, 11(3), 821; https://doi.org/10.3390/su11030821
Submission received: 30 October 2018
/
Revised: 30 January 2019
/
Accepted: 1 February 2019
/
Published: 5 February 2019
(This article belongs to the Special Issue Sustainable Water Management: Economics and Governance)
Abstract
:The relationship between the water and financial sectors is explored through a review of past and current policies and practices, and new needs driven by growing water insecurity (i.e., drought and floods) and climate change. This paper focuses on emerging markets and developing economies. The “conventional” agenda of providing safe drinking water supply and sanitation has met with growing success. The newer water resources agenda covering flood, drought and irrigation, in contrast, has to address rapid alterations in the landscape due to destruction of catchments, and rapid water use growth. By approximately 2045 the world will transition from a predominantly water-abundant place to a predominantly water-scarce one. Though this masks large regional differences, pressure will grow to improve water management and broaden adoption of technologies and policies for recycling, desalination and water efficiency. Climate change will exacerbate these trends. Finance for the water agenda has been dominated by public budgets. To meet the SDGs, the need for finance in emerging markets and developing economies is 2–4 times larger than current practice. National budgets have grown significantly while international development assistance has grown modestly. Commercial finance holds promise but is constrained by high-risk profiles of many water investments: deals are small or risky and creditworthiness of water utilities and municipalities is weak. Access to commercial finance can be enhanced through blended finance, intermediary institutions and, increasingly, local capital markets. However, though the capacity to access finance is constrained in many developing economies, the capacity to absorb finance and prepare “bankable” proposals proves even more constraining. Climate change is emerging as a systemic threat to corporate and financial assets. Water insecurity undercuts the financial viability of production assets, services and real estate. It is argued that the longer-term interests of the water and financial sectors will converge.
1. Introduction
1.1. Scope and Purpose
This paper reviews the evolving water sector policies in an international development context where the sustainability of traditional economic development and humanitarian goals is now increasingly challenged by water resource constraints and by climate change. The paper reviews the attempts to analyse the demand of and options for the financing of water sector investments to attain these goals, and how incentives and disincentives work to facilitate or hamper transactions involving commercial finance, notably to assist emerging markets and developing economies (EMDEs) with their water management. The paper applies this for technical, economic, financial and institutional perspectives. Special attention is given to what are considered current best practices in water financing in EMDEs. The paper also explores how the assets held by the financial sector and others are increasingly exposed to water-related risk, notably due to climate change, and how this is being addressed. The main focus in the paper is on water supply and sanitation (WSS) services as these still benefit from priority attention of governments and donors and provide the most complete data. This is a rapidly evolving and complex discourse that this paper aims to better structure.
1.2. The Water Sector in International Development
The value of water for our economy and sheer survival is acknowledged by all. Physical interventions with infrastructure allow to convey the water resource to the locations where it adds value, and to treat it to enhance its quality. The water sector has distinctive attributes as water, different from other “economic infrastructure sectors” such as transportation and energy, and from “social infrastructure sectors” such as health and education, combines characteristics of public, private and common-property resources. In places without water, life, and thus economy, are precluded; lack of energy or transport infrastructures on the contrary does not prohibit life or economic activity. Similarly, when water is in flood condition or polluted infrastructure is required to prevent a negative impact; such circumstances do not arise in the energy and transport sectors. While water is considered by some a human right [1,2], it is generally recommended to be managed as an economic good [3]. As the hydraulic system in a landscape is physically connected and simultaneously serves multiple uses, the water sector is typically organised in sub-sectors defined by the nature of their assets and the uses they serve: drinking water supply in urban or rural areas, urban and industrial wastewater collection and treatment, irrigation and drainage, flood protection, reservoir management and bulk water supply, groundwater management, navigation and river training, aquatic ecology, etc. The associated infrastructural asset classes usually also fall under different administrative authorities and ministries raising challenges for policy coherence, and, notably, requiring different approaches for cost recovery, funding and financing. However, reliable provision of clean water supply from taps or wells, and the sanitary disposal of human excrement and other wastewater (in short, the WSS agenda) are eminent pre-conditions to human health and economic productivity. In response, in the past decades, nations have increasingly prioritized this in their policies and budgets.
The water agenda has been embedded in an expanding global dialogue and policy involving governments, multilateral organisations, expert associations, NGOs, industry and other stakeholders. The focus of these dialogues has shifted continually between narrower and broader interpretations on water management. The 1976 United Nations Conference on Water (Mar del Plata) took a broad water resources approach recommending integrated water resources management (IWRM). The subsequent International Drinking Water Supply and Sanitation Decade 1981–1990, taking a much narrower scope, mobilized significant multilateral financing but fell short of its aim to provide universal access to safe water and sanitation, due to rapid population growth, inadequate financing, and low implementation capacity in developing economies. The seminal 1992 International Conference on Water and the Environment (Dublin, ICWE) [3] called for water management that is more responsive to local demand. Countries also invested heavily in irrigation in the second half of the 20th century but they soon hit limits to the water system due to excessive water withdrawals and low water use efficiency. In the 1990s, new irrigation development all but halted; henceforth, more modest investments targeted system modernization and techniques to yield “more crop per drop”. The global average water withdrawal for irrigated agriculture amounts to about 70% but can exceed 90% in arid countries [4].
The lagging progress in WSS coverage triggered a fresh effort under the UN Millennium Development Goals (MDGs) (2000) to “halve, by 2015, the proportion of the population without sustainable access to safe drinking water and basic sanitation”. This effort was associated with additional financing from multilateral and bilateral donors combined with a systematic effort to engage the private sector through concessions and leases. Significant progress was made in many countries, notably in China, and about 2.6 billion people gained access to improved water and 2.1 billion to improved sanitation. Although the MDG target 7.c for water supply was met already in 2010, some 660 million people still “are lacking access to clean water” [5] and 2.1 billion to “safely managed water” [6], mostly in Sub-Saharan Africa. On the other hand, the target for sanitation was not achieved and approximately 2.4 billion people are still lacking access to improved sanitation [6].
The outstanding task to reach 100% coverage remains a formidable and urgent challenge and has been rolled into the UN Sustainable Development Goals (SDGs) (2015–2030). The SDG 6 aims for “universal access to WSS services by 2030 that are safe, affordable, and available when needed”. The SDGs, also called Agenda 2030, are central to the current global development dialogue and are prominent in national agendas. However, two major pressures will burden this effort. Firstly, the 2016 population of 7.5 billion will grow to 8.6, and between 9.4 and 10.2 billion in 2030 and 2050, respectively. Over half the increment of about 2 billion will be in Africa, a continent with, on average, weaker institutional capacity [7,8]. Secondly, water will turn increasingly scarcer due to growing competitive use, and climate change will superimpose a new meteorological dynamic that, in aggregate in most countries, will raise water-related risks in the form of more frequent or prolonged drought and heat stress, flooding, coastal storm surges, and sea level rise (see further). Several climate change forums and publications have built a robust body of work culminating, among others, in the Paris Climate Agreement (2015). While most current policy discussions and financing initiatives are targeting climate change mitigation (to reduce greenhouse gas emissions notably from transport and energy generation), policies and new financing arrangements are emerging more slowly to address climate change adaptation, which is predominantly water- and food-related. Thus, over the next three decades towards 2050 the global development policy and the articulation of the financing requirements for water will be driven by these two overriding policy thrusts—the SDG agenda focused mostly on WSS; and the climate adaptation agenda which, in turn, is more related to water resources. These are on some accounts convergent and synergetic but may in other instances involve trade-offs. The methodological differences of the two epistemological communities can be substantial. Also, what are purported to be climate-related forecasts and impact assessments can sometimes draw upon different definitions and scopes: some are based on extrapolation of historic sectoral data (e.g., including changes in land use) while others try to discern only the incremental climate effects over and beyond the effects from the increasing pressure caused by “normal” development in a climate-neutral world. Importantly, while the SDG discourse is focused explicitly on economic and social development notably in the EMDEs and has been able to incorporate decades of lessons learnt from devising increasingly effective policies for these social–political environments, the climate discourse tends, for the moment, to be more centred on the richer economies assuming, incorrectly, that these experiences can be readily replicated in EMDEs as soon as the finance for the required capital investment can be furnished.
1.3. The Financial Sector
On the supply side of financing, a wide and diverse array of institutions are seeking to furnish investment capital for water. Firstly, in most rich countries the capital provision for water services is arranged through publicly managed budgets, typically in corporatized utilities and water and irrigation agencies, because of water’s public function and the inherent characteristic of water services that make them monopolistic. Financing is often mobilized as debt (e.g., through loans, bonds) or equity (i.e., through stock/shares or ownership), often complemented with a larger or smaller subsidy from the national or local tax base.
A few rich economies have decided to engage the private sector’s technical and financial capabilities: in France about 60% of all water supply takes place through management contracts, leases and concessions to private firms that conduct the operation and management (and in the case of concessions, also part of the investment); England and Wales are the only nations that sold full ownership (privatization) for drinking water supply and wastewater management to specialized firms. In Senegal, Côte d’Ivoire, the Philippines, Colombia, the Czech Republic, Romania, China and several other countries, various forms of this type of public–private partnerships are effective, but only in selected cities, and only for tap water supply, and sometimes wastewater management. In many other countries, on the other hand, such forms of equity participation are not allowed (such as in the Netherlands) or politically unpalatable, sometimes after earlier failed initiatives (such as in Bolivia). As households in rich countries can afford and are willing to pay the full tariff covering operation, maintenance and capital expenditures, this is a viable business proposition particularly in such countries. Major international firms active in this field are Veolia Water, Suez Environnement (both French), United Utilities (UK), Aguas de Barcelona (Spain), Ayala Corp. (Philippines), Bechtel (US) and Mitsubishi (Japan), with the first three arguably possessing the most comprehensive technical and managerial sector expertise. The ownership structure of these firms is of an increasingly global signature. At the same time, in many countries, such as Colombia and the Philippines, the number of smaller specialized firms operating only at national scale is growing.
Secondly, water agencies in EMDEs often receive multilateral and bilateral development financing that typically is channeled through the Ministry of Finance of the recipient countries in the form of loans, often at concessional rates, or as grants.
Thirdly, the capital markets hold most funds, for which primary capital is furnished mostly by banks, pension funds, insurers, sovereign wealth funds, corporations, wealthy individuals and charities. The capital owned by wealthy individuals or families is often managed through so-called family offices. The capital is pooled, invested and managed by mutual funds, equity funds, venture capitalists, asset managers, specialized investment banks, retail investors, transaction specialists, structurers and others in the form of debt or equity. Some investors seek income from the increased value of an asset in the short term, but others, such as pension funds and insurers that are more defined by longer-term liabilities of 20+ years, are seeking stable revenue streams over 20–30 years (which is a time span that is also more amenable for typically slowly evolving water assets). Other financials specialize in financial engineering instruments and derivatives. Some firms (as well as some government and multilateral-backed institutions such as MIGA (Multilateral Investment Guarantee Agency, a part of The World Bank Group)) offer guarantee instruments that allow to hedge against risk (see further). Important actors are also agencies such as Standard & Poor’s and Moody’s that rate the creditworthiness of firms and agencies seeking financing. Finally, central banks and government regulators play key roles in regulating financial flows and creating (dis)incentives for water financing.
Obviously, the commercial financial sector seeks to create profit, and thus far, has proven shy to finance public water sector investments in EMDEs. On the other hand, water investments in both the public water sector in rich economies and in industry across the world have attracted significant commercial capital thanks to their good credit ratings, compelling business cases, and stable markets and regulatory regimes.
Fourthly, over the past decade, private charities and foundations as well as commercial “impact investors” inspired by environmental, social and governance (ESG) objectives have become increasingly active in investments that are commercially less obvious and more development-oriented. In these, the expected longer-term social impact, goodwill and sustainability are allowed to compensate for possibly lower returns. In 2004, the World Bank launched the first green bonds followed by climate bonds to attract capital for “green” or climate-friendly investments. The appetite of individuals and institutional investors to invest in such bonds has been growing swiftly and in 2017 a record US $155.5 billion green bonds were issued in that year, mostly in China and France [9]. While such “greening” is helpful to raise more finance dedicated to green and climate investments, a risk emerges that saturation occurs on the finance demand side. Similarly, a risk exists that such bonds may crowd out more competitive commercial financing in EMDEs in cases where multilaterals such as the Asian Development Bank and the European Investment Bank have started to attract incremental finance through new green bonds, that then is applied in developing countries through conventional sovereign lending procedures (i.e., to the Ministry of Finance which guarantees repayment of the loan without the risk that the ultimate beneficiary water agency would default).
Finally, the fifth category of private investors is the corporate sector, i.e., firms and businesses that have a stake in secure water provision, process water, water reuse, wastewater treatment, and for agro-businesses in irrigation.
2. Financing to Develop and Manage Water
2.1. The Economic Case for Investment in Water Security
In the past 15 years various studies have been conducted to quantify damages (or benefits foregone) from poor water management. Each study tends to apply a different scope and methodology for the analysis, and works from a more, or less, comprehensive and representative dataset. Below, a set of assessments have been selected that are considered as relatively consistent and that, together, provide a reliable overview for the water sector.
Inadequate water management (in the form of poor policies, weak organization and reluctance of water users to pay for the service) is a drag on health and wellbeing, and on the economy. Countries, thus, are striving for “water security”. Water security is the capacity of a population to safeguard sustainable access to adequate quantities of acceptable quality water for sustaining livelihoods, human well-being, and socio-economic development, for ensuring protection against water-borne pollution and water-related disasters, and for preserving ecosystems in a climate of peace and political stability [10] Poor water supply and sanitation (WSS) services are estimated to cost EMDEs about US $260 billion per year due to poor health, pollution and inefficiencies in households and industries. This amounts to 1.5% of global gross domestic product (GDP), but may, in individual countries, rise to as high as 10% [5]. Since 2000, it has become increasingly recognized that droughts and floods also create systemic insecurity and come at an economic cost [4,11]. Drought is deemed to be the deadliest existing physical hazard, with at present an estimated 3.6 billion people (nearly half the global population) living in areas that are potentially water-scarce at least one month per year. This population could increase to some 4.8–5.7 billion by 2050 (i.e., 55–65% of the world population), with over 60% of the world population living in water-scarce river basins and 40% living under severe water stress, up from about 16% living in severely- and moderately-stressed basins in 2010 [4,12,13]. In other words, the year 2045 can be estimated to signal a tipping point: the world will turn from a predominantly water-abundant place into one that is predominantly water-scarce. Though this average picture masks large regional differences, pressure will continue to grow to improve water management and broaden the adoption of technologies and policies for recycling, desalination and water efficiency. To support this challenging transition, significant additional finance must be mobilised.
The OECD [12] estimates that the number of people per year affected or killed by water-related disasters (of which two-thirds can be attributed to floods) will rise from 100–200 million in 2010 to 1.2 billion in 2050, or almost 20% of the world population. Ligtvoet et al. [14] reckon that, currently, flooding affects about 106 million people annually and causes the largest economic damage, at US $31 billion per annum. In 2050, the economic value of the assets at risk of floods is expected to be around US $45 trillion, or 350% higher than in 2010, partly because of higher flood frequency, but mostly driven by growing value of the assets at risk. While the number of affected population and assets is much higher in the EMDEs, the financial and economic value of the assets at risk is much higher in the rich economies. This is borne out by, for example, the financial costs from hurricanes, resulting primarily from flooding damage in the US: Katrina near New Orleans (2005) US $161 billion; Harvey (2017) US $125 billion and Maria (2017) US $90 billion, both on the East Coast; and Sandy (2012) in New Jersey and New York US $71 billion. Only a minor part of the financial damage is reimbursed by insurers; after the Katrina event, insurers paid out approximately US $16 billion for flood damage [15]. The economy was also affected: the Harvey and Irma episodes depressed the fourth-quarter GDP growth forecast for the US by 0.8 percentage points [16].
Water insecurity depresses economic development: by approximately US $260 billion annually from inadequate WSS, US $120 million from urban property damages and US $94 from underperforming irrigation (and excluding environmental damage and other non-monetized impacts). Significant flood episodes in Pakistan, Bangladesh, Thailand and other developing countries since 2000 are reckoned to have cost these countries 1 to 4% of GDP [13]. The impact of poor WSS specifically is assessed by the World Bank [17] as causing 657,000 premature deaths annually and an economic loss of up to 7% of GDP. The World Bank [18] forecasts a likely decline in GDP of up to 6% by 2050 caused by water-related losses in agriculture, health, income and property, with some regions in the world facing sustained negative growth. All the foregoing forecasts assume continuation of current or moderately enhanced policies and sector performance.
2.2. Capital Flows to Water
The recognition that only a moderately equipped and performing water sector has such a significant impact on the economy has emerged only recently and is now increasingly focusing attention. Inderst and Stewart [19] estimated the need for infrastructure investment (excluding O&M expenditures) across EMDEs at US $2 trillion per year, roughly twice the amount of what is currently being spent, and of which 15–30% of the need is in the water sector. From 1990 to 2012, only US $69 billion of private financing went to the water sector. Most of this private finance is international finance or through municipal bonds.
McKinsey [20] analysed supply and demand of financing for infrastructure investment world-wide, distinguishing by source, sector and region. Of the US $2.5–3 trillion a year invested in infrastructure, the private sector, i.e., institutional investors and corporations, accounts for US $1–1.5 trillion. The institutional investors furnished about $350 to $400 billion for annual infrastructure spending and usually invested as part of a broader portfolio (Figure 1). Most investment went to telecoms and energy and only about 5–10% to water. Only 5% of the latter went to EMDEs, and thus, covered a very small portion only of their water financing needs. Government budgets, meanwhile, were more likely to pay for traditional public infrastructure, such as transport and, in particular, water systems. The corporations, as a second source of private funds, invested in infrastructure as part of their business strategy for production facilities, supply and market chains, etc. The corporations invested about US $1 trillion per annum in infrastructure—a sizeable portion. Also, corporations are investing increasingly in assets that may at the same time benefit local stakeholders and communities.
One would expect that investment finance grows proportionally with the sector’s prominence and needs; however, analysis shows that this is not the case. The seminal Camdessus (2003) and Gurrìa reports (2006) responded to the MDG agenda calling for a doubling of the annual flows of financing to water. They estimated annual flows (in 2002 US$) to water in the EMDEs at about US $80 billion and the required flows at US $180 billion; the figures for WSS being US $15 billion and US $30 billion, respectively. Three-quarters of these flows comprised public funds and loans and grants from multilateral and bilateral financiers. Hutton and Varughese [21] calculate the cost to extend “basic WSS services” to the unserved in the EMDEs at US $28.4 billion per year from 2015 to 2030, or 0.10% of the GDP of these countries. The capital financing required for “safely managed WSS services” would be approximately 0.39%of their GDP, or a little over three times the historical financing trend of the past decade. Thus, the total capital cost of meeting SDG 6 would amount to about US $114 billion per year. These authors helpfully provide ranges for the figures and disaggregation to account for stark differences between regions. For urban sanitation, a World Water Council panel estimates actual flows at US $9 billion and the required flows at US $45 billion [22]. The ADB [23] estimates the current water investment (2011) in developing Asian countries at US $62 billion per year, against a need of US $152 billion (in 2016–2030). For both Asian and Latin American developing countries, about 91% of this finance is public against about 13% in the telecoms sector, 52% in power and 70% in transportation [24]. Compared to the GDP and capital available, the needs for the water sector are significant but certainly not insurmountable, at less than 1–2%. The fact that only 20–50% of the needs are being met thus suggests the presence of obstacles to larger capital flows to “needed” water investments that are of a more fundamental nature.
National budgets in EMDEs have increased substantially in the past three decades apace with the growing national income of these countries. For example, if in Bangladesh the budget of the Department of Public Health Engineering was comprised in 1990 of about 80% of donor contributions, by 2000 this proportion had been reversed. In countries such as Uganda and Indonesia, the national budget allocated to water has nearly doubled between 2010 and 2016. On the other hand, the Official Donor Finance (ODF) (ODF comprises loans, concessional credits and grants from bilateral and multilateral donor agencies and development banks. Under OECD Development Assistance Committee (DAC) rule, guarantees are not counted as assistance [25]) to EMDEs for all water nearly tripled between 2003 and 2014 according to Winpenny et al. [26], rising from an annual allocation of US $6 billion in 2003 to close to US $18 billion in 2014, but the OECD [27] reports that the WSS increase was more modest, from about US $10 billion (in 2015 US$) in 2006 to US $14 billion in 2015. The ODF for water has remained primarily targeted to WSS as opposed to irrigation, flood protection and river and reservoir investment: from 1995 to 2014, WSS received approximately 55% of all such water sector support. WSS also attracted most of the grant financing, which made up 32% of its portfolio. Finally, Winpenny et al. [26] point out that ODF for all water sectors rose between 1995 and 2014 by 90%, while the ODF for all sectors combined grew by over 230% in the same period, again hinting at water-specific hurdles. Lately, international finance for climate-related purposes has grown significantly, but over 80% of disbursements are geared to mitigation programs in the energy and transport sectors. Of the amount assigned to adaptation in the period 2011–2014, WSS received one quarter or about US $1.3 billion [28,29]. The UNEP [30] estimates that the annual cost for climate adaptation in EMDEs alone could range from US $140 billion to US $300 billion by 2030, and at the global scale from US $280 billion to US $500 billion under moderate emission scenarios, yet public international finance flows for adaptation were only US $22 billion in 2017. This lag suggests major structural implementation challenges and too slow progress ahead. A methodological challenge, however, is that in many of these programs, adaptation also includes measures to address water security concerns under “business-as-usual” climate-neutral conditions.
2.3. Seeking Increased Finance
The above compilation comprises analyses that were prepared by different organisations, for different purposes and with different levels of rigor. Even though they sometimes lead to divergent results, in aggregate they start to provide a comprehensive and coherent picture. They do depict an important transition. In the approach prevailing in the 1980s and 1990s a “need” was identified for an incremental output (mostly in WSS coverage rates) and the additional commensurate finance was sought from donors. In contrast, the paradigm that started to form after 2000 is more informed by detailed global coordination efforts, is more adaptive and monitorable, and tries to better align investment requirements with economic benefits. The following can be observed.
Foremost, universal coverage with WSS services, despite large sustained efforts, remains elusive due to the population increase, economic growth, and climate variability affecting water availability. The economic growth, on one hand, allows to devise more effective policies and fund these, as is obvious from the growing commitment and endogenic financing by governments. That growth, on the other hand, is at the same time a major cause of reduced water availability and security because of environmental degradation, pollution, large-scale deforestation, etc. Yet, despite this progress and rising national budgets for water, the aggregate financing effort is rising much more slowly than needed, with—as outlined in the above quantifications—only one-fifth to one-half of the need being met. Also, ODF financing for water is rising much more slowly than for other sectors. Importantly, private-sector (commercial) finance for water has remained minor and at about 10% is staying well below the engagement of private capital in other infrastructure sectors.
The global water policy organisations have insistently called for greater involvement of private financiers to help close the financing gap for water. The private sector would, in addition, also help in hedging against the possible phasing out of bilateral and multilateral ODF and bring more flexibility to the market as well as a more discipline with respect to creditworthiness requirements and business models. In the 1990s this mostly took the form of involving water operator businesses and the issuance of municipal bonds for WSS. The limits of the operators became apparent after the 1998 Asian and the 2000 dotcom financial crises; a number of concessions that went sour significantly lowered the appetite of these operators. In several countries, such as Indonesia, the Philippines and Argentina, concessions and leases to take over operational functions had become perceived as infringing on national sovereignty and “privatization” of a citizen’s right. In the past decade, however, a new and growing effort is building to enhance the amount and quality of water financing by the capital markets. This dynamic is spurred by, on the side of the water sector, the desire to fill the existing gap arguing that the business case for such financing has been improving, and on the side of the financiers, the double objective to identify new markets and develop a “greener” business line with which to compete in attracting primary capital. The globally active investors are, however, still in the process of discovering this market as demonstrated by an analysis by Crédit Suisse on what infrastructure asset classes are appealing: the preferred classes yield moderate returns but are characterized by low-to-medium risk and comprise primarily more standard, proven “brownfield” investments in the energy, communications/IT and transportation sectors; the only water-related asset mentioned being desalination plants (which tend to be also well-described, high-value and replicable investments) [31].
Since the 1990s, the global financial markets have expanded at rates well above those of population and even GDP growth (Table 1). Because the global financial system has grown so large relative to the underlying economy, asset values can quickly reach unsustainable levels and remain inflated for months or years, tempting businesses to commit more resources in pursuit of unachievable returns [32]. Investors are therefore exploring new markets in the form of water projects; the industrial sector already attracted significant finance for its water projects, and as the public water sector in many EMDEs is growing more mature, this market is becoming more appealing too.
2.4. Incentives and Disincentives for Commercial Financing to Water
Such partnership makes eminent sense, yet, although transactions in the public water sector are common in rich economies, they encounter structural constraints in the developing world. Several hurdles and disincentives are at play depending on the asset type and owner profiles, which add to the investment’s risk profile and to transaction costs. Water infrastructural assets fall into different classes depending on their sub-sector. Flood protection infrastructure, for instance, usually is under the authority of local or regional (or national) governments, is spatially distributed and is not associated with a specific revenue stream; typically, the cost is borne by the general or municipal tax base or recovered indirectly through increased property taxes. Drinking water and wastewater treatment systems, on the other hand, are well-defined spatially and cost-wise, and their costs are recovered through the tariffs of the local water utility. Water utilities as semi-autonomous businesses are often perceived by financiers as more reliable partners than local governments that are more subject to political cycles and do not dispose of ring-fenced water budgets.
Weak creditworthiness of the owner or borrower is a major hurdle. Utilities, local governments, irrigation corporations and most other water management authorities in EMDEs face challenges in their independence as business operators and in their aim to achieve a reasonable and sustained cost recovery, while taking into account the often constrained capability and willingness to pay of their customers. Aiming at coverage of full operation and maintenance costs is an acceptable basic objective, with capital investment financed through tax transfers. However, despite slow progress, many utilities in EMDEs, but also in higher middle-income countries, do not succeed in collecting enough revenue to cover both operational and capital expenditures (e.g., [5,35,37,38,39]). Also, many local governments may not yet give the impression of good governance and generate the healthy public budgets that allow to provide comfort to investors—either commercial or public. Yet, at the same time a small but significant number of these organisations and their projects do potentially qualify for financing; when these transactions are effectuated, they will help to develop capacity, create experience, and offer success stories.
Investors are sensitive to the perceived risk of the transaction. Ho and Lee [40] offer a useful taxonomy of risks to investors by clustering them as project development risk, off-take risk (related to cost recovery), political and regulatory risk, and currency risk. The investment climate for public assets in EMDEs is not helped by weak regulatory quality and opacity. Many EMDEs have only basic oversight systems in place to regulate tariffs, performance and finance. Investors favour a transparent and consistent frame that offers predictability and stability. The regulatory systems that are in place, furthermore, may be beholden to political prerogatives or pressure from local vested interests—such as unions and powerful local families. Often the system discourages foreign investment or fails to provide protection to investors. The limited or unreliable options for arbitration or legal recourse in case of disputes, and contractual limitations with collateral and securitization of the revenue stream that are inherent to the sector, also raise the risk profile. Other regulations, such as on procurement, construction standards and land zoning, may be obsolete or unpractical, further adding to the investment risk.
A shortage of “bankable” proposals further reduces the opportunities of investments. Too often, the plans of water agencies or government departments have a propensity to reflect the “need” (that what is perceived as need or desirable) instead of “demand” (that what people or the government are able and willing to pay for and makes economic and business sense). Many individual projects for which financing is sought are not prepared properly, with, for example, weak feasibility analysis, absence of realistic cost recovery and financial frameworks, unclear or unrealistic environmental and social safeguards documentation (concerning notably environmental assessment, land acquisition, resettlement, right of access, etc.), application of old construction or design standards, and insufficient budget cover. In addition, many individual projects (e.g., expansion of a water distribution network, adding a new pumping station) tend to be small by the standards of the financial industry (smaller than, say, US $25 million) making the assessment, supervision and administration cost overly expensive because of the lack of scale. Investors would rather prefer transactions in the range of US $20 to 1000 million to keep transaction costs down.
Commercial financiers, thus, tend to avoid certain classes of investment and concentrate in relatively small sub-sectors (Figure 2). Transactions or projects that are diffuse, small, have little potential for cost recovery and a high political content, such as small-town WSS, smallholder irrigation and most flood protection, are too demanding. On the other hand, large one-off transactions with ring-fenced revenue, well-defined counterparts, applying repetitive “tested” technology, and manageable regulatory risk are more appealing, such as industrial (waste)water treatment plants, large-city water supply, estate irrigation and large reservoirs for bulk water supply and hydropower.
Importantly, it can be observed that in developed economies, but even more so in EMDEs, the public sector often exhibits a weak absorption capacity, i.e., the administrative capacity and human resources to actually and effectively translate allocated budgets into physical infrastructure that meets its designated purpose. Politicians and financiers tend to assume too readily that once a policy or political commitment is in place, or finance committed, this expediently leads to the actual construction of the asset. In practice, the absorption of this finance in the real economy typically is slow. Significant lag times between the financing and the actual absorption exist and may reach two decades or longer for investments of substantial size and complexity. The Netherlands started to prepare its national program for flood protection “Room for the River” along the rivers Rhine and Ijssel with a budget of about €2.5 billion in 1993, and the last work was completed in 2017. In Poland, the World Bank, the Council of Europe Development Bank and the European Commission are co-financing a national flood protection program on the Odra and Vistula rivers of about €2.3 billion, which is expected to also take about 25 years to complete. The program on the Nam Theun II hydropower dam in the Lao PDR involved about US $1 billion and required about 20 years from pre-identification to completion. Many investment proposals are overly optimistic, and the lack of up-front realism tends to lower the credibility and raise the risk perception after delays are incurred.
Even until now, some argue that risk and regulatory hurdles to the flow of finance are the only constraint to meeting the investment needs in EMDEs (e.g., [41,42]). However, recent forums, such as the 2018 OECD Green Finance Forum and the High-Level Panel on Water Roundtable on Water Finance, have started to recognize that one other major constraint in EMDEs is the lack of “pipeline” of bankable proposals. The dearth of good proposals is a growing hurdle in all infrastructure sectors but especially so in water [43]. Also, in the US, early efforts by the government to kick-start the flagging economy after the onset of the crisis in 2008 with capital injections in infrastructure, faltered partly because few robust and ready proposals were available. The challenge of fund absorption is not well documented in scholarly articles, but some reporting exists in the European Union that faced poor absorption of its multi-billion grant programs. The European Parliament [44] reported absorption challenges in its Member States due to design problems; lack of capacity to provide the required co-financing from the national budget; incompatibility, inconsistency and instability of national regulations, especially on sector policy, land acquisition and environmental safeguards; weaknesses and lack of readiness of the implementing organisations and related institutions; and constraints in the quality, quantity and motivation of the staff responsible in the different phases of the preparation and implementation [44]. The European Court of Auditors [45] noted that absorption of the grants over all Member States exceeded 90% absorption after a delay of up to five years but emphasizing that in some States it was less than half. Even though the Auditors reported that “only” about €5 billion of grants could not be absorbed out of €365 billion (Figure 3), it pointed out that funds often got absorbed only after last-minute re-designs and re-allocations to different projects and even different sectors. The latter raises serious concern about the effectiveness and purposefulness of possibly up to half of the investments.
The largest infrastructure financing gap exists in Asia which is estimated by the Asian Development Bank [23] for its 45 developing member countries at US $1.7 trillion per annum from 2016 to 2030 (in 2015 prices). It concludes that major causes are that (i) rich Asian economies (Japan, Singapore) direct their investments outside of Asia as they perceive those inside Asia as riskier, (ii) weak preparation and financing-readiness of projects and the sectoral institutions, and (iii) high risks associated with infrastructure, especially water. Institutional investors such as pension funds, insurers and banks systematically fail to meet their targets for infrastructure investment. The stubborn inertia of implementation capacity to respond well to the increased availability of finance is also demonstrated in the disconnect between committed funding by the World Bank and the actual absorption of these funds in India (Figure 4). While in 2009 commitment doubled to serve the increased government ambition, in practice the annual disbursement in 2009–2015 barely changed from its steady level prior to 2009 [46]. Similar situations have occurred regularly also in the portfolios of the other multilateral and bilateral financing organisations.
In conclusion, the dearth of bankable project proposals, the weak creditworthiness and the regulatory risks point to a systemic weakness in institutional capacity. Capacity is typically associated with the knowledge and capacity of individuals that must be acquired through education, training, peer learning, mentoring and through experiential learning. While this is essential, institutions as aggregates of individuals working on shared objectives and with common, formalized procedures, also develop and incorporate “knowledge” and the capacity to acquire knowledge, and to analyse, prepare and implement activities, and learn from these experiences [47]. The private and public sector organisations and their frames for administrative action all consist of such “institutions”. However, the knowledge and capacity embedded in these institutions should be investment-oriented, which implies that they are able to combine knowledge from different disciplines ultimately leading to an effective investment. However, often the water institutions and the institutions that have an impact on water management (such as environmental and land zoning agencies) operate in isolated mono-disciplinary silos. The 2019 World Development Report [48] highlights that markets are increasingly demanding workers with higher levels of human capital, especially advanced cognitive and behavioural skills. At more operational level, an analysis on the water investment gap in Uganda [49], GIF [50] and the World Water Development Report [4] conclude that a considerable challenge remains at national, regional and global scales between high available potential capital for investment and low availability of bankable projects supported by capable, creditworthy implementation bodies to execute them. This is often partially a result of a mismatch in knowledge and capacity between stakeholder groups—those with technical knowledge often do not themselves have the knowledge about available financing and the requirements to access it, and conversely, finance specialists often perceive the water sector as a black box. Thus, the major bottleneck in most ESDEs may not be the capacity to access the finance but the capacity to absorb it.
2.5. Options for the Road Forward
A blanket increase in available private sector financing to water is unlikely to make a major difference in closing the financing gap in EMDEs in the medium term. This is partly due to, on the demand side, only slow growth in absorption capacity (and improvement of the underlying risk profile), and, on the supply side, competition from growing national public budgets and more slowly increasing ODF. In the long-term, private sector finance will likely gain in prominence as absorption capacity and demand will increase, success stories will become available and as ODF may phase out.
To become more effective in financing interventions for water services and water security, the governments, ODF suppliers and private sector investors could consider the following. Many of these recommendations are adapted from good practice in developed economies. The ultimate objectives are to de-risk potential investment deals and lower transaction costs for the investor.
- Financial risk mitigating measures can be explored to make projects more attractive, such as contingent subordinated guarantees to better share risk; a facility to cover debt service default risk emanating from regulatory changes; a counterparty risk cover facility; and a refinancing facility to allow commercial banks to extend the tenor of their loans—with water projects often demanding tenors of up to 30 years, commonly longer than for loans in the energy sector or in industry [50].
- Blended finance is increasingly recognized as an innovative important tool, where concessional finance is applied (“structured” into a deal) specifically to help lower risk profiles and transaction costs with the aim to facilitate entry of commercial finance for development purposes in EMDEs [51,52,53]. Several financial and development institutions are actively piloting different arrangements to use concessional funds to crowd in commercial funds. The OECD has outlined five principles for blended finance: (i) anchor blended finance to a development rationale, (ii) design blended finance to increase the mobilization of commercial finance, e.g., deploy blended finance to address market failures, while minimising the use of concessionality, (iii) tailor blended finance to local context, (iv) focus on effective partnering for blended finance, e.g., by allocating risks in a targeted, balanced and sustainable manner, and (v) monitor blended finance for transparency and financial and development results. Instruments include insurance and guarantee systems to transfer part of the risks from the investing partners to a guarantor. Examples are SIDA’s Guarantee Portfolio with specialized instruments [54], and the Philippine Water Revolving Fund with guarantees provided by JICA [55]. Pioneering institutions are the MIGA that insures foreign direct investments against losses related to currency inconvertibility and transfer restrictions, expropriation, war, civil disturbance, terrorism and sabotage, breach of contract, and the non-honouring of financial obligations. Nonetheless, MIGA has had few transactions for water thus far. Also, the International Finance Corporation (IFC) offers guarantees, such as one for the bond issued by the Mexican municipality of Tlalnepantla de Baz for a local water conservation project; here, IFC provided a partial credit guarantee that allowed the bond to obtain a better credit rating, higher than that of the municipality itself [56]. Currently, many donor agencies are engaged in developing guarantee-like systems.
- Intermediary institutions can be designed to better connect the interests and capabilities of the water and financing industries. Intermediary agencies are able to pool specialized knowledge on finance supply and investment projects. As transpired from the above, the financial industry and the water sector are rather separate epistemic communities with different language, interests and procedures. Intermediaries have been functioning in richer economies for several decades such as the Netherlands Water Boards Bank (NWB Waterbank), Aquafin (Belgium), the Agences de l’eau (river basin-based Water Agencies, France) and USEPA (US). They possess intricate knowledge of both the water sector and its financing demands, and of the capital markets. The governance system and incorporation of these institutions differs, depending on the administrative structure and needs of the country. However, they help pool the financing requests for different projects of their clients, i.e., water utilities, municipalities and water boards, sometimes packaging small-scale investments into larger vehicles and ensuring quality control; on the supply side, they also pool the financial resources, e.g., combining public funds or income from tariffs with funds attracted from banks and institutional investors. This pooling (syndication) helps mitigate risk profiles of individual investments, scale-up operations, and thus, lower transaction costs.
In EMDEs, such intermediary institutions are still rare but are gaining traction. Examples are the Philippine Water Revolving Fund [55] and the Kenya Pooled Water Fund [57]. The latter has been initiated by the Water Financing Facility and is supported by the Kenyan National Treasury, the Kenya Market Trust, USAID, SIDA and others. The first pooled bond of about US $20 million equivalent is expected to be issued in 2019 drawing local currency from Kenyan pension funds and other local investors with a long tenor to support selected “bankable” water supply and sanitation projects of eight Kenyan water service providers that were assessed to be creditworthy. The international financiers provide guarantees and subordinate “first-loss” debt, as well as grant funding for technical support prior to and after the transaction. For every €10 million in donor grant funding, WFF feels it can raise an indicated €100 million in local capital; however, it places high value on proper screening of borrowers and projects and on continuous technical assistance and capacity development of the borrower. While this may not be considered a fully commercial proposition, it allows to show the way towards a potentially competitive sustainable arrangement.
- Debt in local currency denomination may prove superior to dependence on the international markets using denominations in strong currencies, even taking into account the comparatively high interest rates prevailing in local markets. The World Bank [5] compared the net present value of borrowing in low-interest strong currency versus high-interest local currency and found that local currency often has the advantage due to the likely depreciation of the local against the stronger currency. Also, international markets go through cycles of tightening, and of fluctuating interest rates and exchange rates. Such fluctuations may push vulnerable borrowers into default. In addition, local financiers may be more familiar with local conditions and its regulatory climate. As the financial industry globally has grown fast (Table 1) so have local capital assets expanded and are achieving scale, capability and appetite for water investments. Because the local demand for water finance is also still of modest scale, it may be well suited for the local markets. The Philippine Water Revolving Fund [55], the Water Financing Facility [57] and others are therefore arranging their capital demand in local currency.
- Alaerts and Kaspersma [47] conclude that the development of institutional capacity (the “capacity to act”) is a systemic requirement for development in the water sector as described before, however, also the financing community and its regulators are dependent on reliable data and information and the institutional capacity to utilize this information and translate it into effective decision-making. Institutional capacity development is also known as knowledge management in the corporate sector. It typically implies a knowledge transfer process as well as a (more political) agreement to engage in a change process for the institution, i.e., for the utility, ministry, department, company or sector [58]. The capacity development process is preferably laid out in a realistic implementation strategy based on a gap analysis between the available and the desired capacity. Instruments for individual capacity development include education, training, peer learning, mentoring and experiential learning. At the level of institutions such as organisations and the whole sector, knowledge can be acquired, shared and developed through educating and training the individual staff but also through institutional tools such as twinning arrangements, communities of practice, dedicated formal and informal networks, internal knowledge management procedures and targets to make sure staff share and build on knowledge, and human resource management. This knowledge may aim to impart or develop (i) technical knowledge and knowhow (e.g., on design of dikes and accounting), (ii) skills and operational procedures (e.g., on negotiation, management), (iii) attitudes (e.g., on leadership and values), and (iv) to set in motion an autonomous and endogenic learning process [47]. This applies, e.g., to government agencies, local governments, utilities, regulators, but also local banks and other potential financiers, as well as to local consumer associations, NGOs, politicians and the press. Muhairwe [52], who turned around the Uganda National Water and Sewerage Corporation in 2000–2004 to become one of the best performing water utilities in the EMDEs, recommends to start preparing for and maintaining the institutional change processes by conducting sustained but targeted training for different groups in the organization.
The education and training needs to prepare water professionals for operating in complex, multi-disciplinary environments, able to “cut across complexity”, and manage more demanding regulatory requirements; they must be enabled to deliver “bankable” proposals in cooperation with financiers. A growing part of attitudinal training should be aimed at developing “personal leadership” for water management to educate professionals to also “get things done effectively” and lead change processes [59]. For example, water leadership training for professionals from different cultural and technical backgrounds is currently provided by a consortium of IHE-Delft Institute for Water Education (The Netherlands), TransformationFirst.Asia (Singapore), Nyenrode Business University (The Netherlands) and the International WaterCentre, Brisbane. Generally, water sector agencies should be supported more intensively with technical assistance to allow them to prepare more bankable proposals.
- Finally, the focal area of enhancing the creditworthiness of water supply utilities can be addressed by taking simple straightforward steps. In a large sample of 690 utilities across the globe, only an estimated 15% of service providers were found to cover their O&M costs and create a basic surplus (assumed as having cash revenues exceeding costs by at least 20%), a requirement for access to commercial credit [60]. Figure 5 shows how four measures are able to cut costs and bolster revenue, rendering up to 77% of utilities financially viable—without raising tariffs. Full creditworthiness is more likely to occur when the provider recovers at least 150% of operating costs.
3. Water for the Financing Sector—A Changing Climate
3.1. A Changing Dynamic to Protect Assets from Water Risk
The preceding sections reviewed the experiences and progress in the challenge to raise finance from public and increasingly private (commercial) sources to meet SDG 6 and associated development objectives in the water sector. The WSS sub-sector is still occupying a dominant place in this narrative. The underlying policy discourse has matured after four decades and intensive learning and yielded a vast body of experience. The next section concerns the new emerging policy discourse related to climate change and how its consequences are likely to impact financial assets. The climate change discourse largely refers to two complementary agendas: the mitigation, which aims at reducing the emission of greenhouse gases such as CO2 and methane, and the adaptation to the change, which aims at minimizing negative impacts. While the mitigation agenda relates for 80% to energy and transportation, the adaptation agenda is foremost an agenda on water resources and agriculture. Arguably, as climate adaptation will gradually become mainstreamed in society and politically, the policy thrust will shift political priority and budgets from WSS to water resources management.
Where in the preceding sections the water discourse remained primarily a public affair seeking a partnership with the private sector, especially the commercial finance sector, climate change is starting to shape a different dynamic. One part of the adaptation agenda will stay with the public sector where it concerns water and agriculture. In effect, it will be in many respects a continuation and improvement of existing practices that are already dealing with the existing natural variability in climate and water availability. The other part concerns the climate change adaptation as the change will impact the commercial strategies and viability of corporations, and on real estate and other assets owned by households, thus negatively influencing their financial risk profiles creating a challenge for the stability of the financial markets. Thus, in this discourse it is the private sector and notably the financials that will seek effective and urgent adaptation measures in the water sector—and seek to enlist the public sector in achieving water security to safeguard the value of the capital assets.
Above, it was argued that pressures on water availability across the globe will rise inexorably and substantially in the next 2–3 decades with the year (about) 2045 becoming a tipping point. Global water use will continue to grow steadily at a rate of about 1% per year [61,62,63] following a polynomial [64]. Global demand for agricultural and energy production (mainly food and electricity), both of which are water-intensive, is expected to increase by roughly 60% and 80%, respectively, between 2010 and 2025 [12,65]. Because of the large changes in land use and water catchment integrity (such as deforestation, expansion of “hard” surfaces that do not absorb rainwater, land subsidence, etc.) the relative availability of water per capita will at the same time decline. In addition, climate change is expected to induce changes in rainfall patterns and intensity and create more extreme weather events. While the combined effect of these three factors will drastically raise the incidence of drought conditions in most river basins, they will also increase vulnerability to pluvial, riverine and coastal flooding. Furthermore, sea level rise and enhanced storm conditions (due to the increased ocean temperatures) are likely to create special risks for coastal zones and deltas—where most of the global population and industry are situated. The value of the damages will experience significant notional growth simply because the value of the assets at risks (industrial and infrastructural assets, and land value) is growing apace.
The incremental impacts that are attributable to climate change by 2050 may be generally smaller than those caused by the more rapid economic growth and land use alterations. This would pertain to many flood events. In contrast, many impacts along the coastal and deltaic zones are more directly imputable to specific, new climate-related effects. Ligtvoet et al. [14] estimate the future damage due to riverine and local pluvial floods and conclude that only about 2–3% of future annual economic damage can be attributed to climate change; they expect the overall damage to grow exponentially between 2010 and 20–50 in rich economies under business-as-usual scenarios from US $9 to 93 billion, and for Asia and the Pacific, from US $9 to 215 billion, respectively. The tilt in damage towards Asia is pronounced and driven largely by the growth in the economic value in the flood-prone areas along the large rivers—which is where most urbanization and economic activity in the EMDEs is taking place. The number of people exposed to floods would grow much less dramatically: in the rich economies from 1.4 to 1.7 billion and in Asia from 2.8 to 4.3 billion. Interestingly, the incremental contribution of climate change in the latter growth is higher, namely at about 10%. In the coastal and deltaic areas, the damage may rise even more steeply in this period. Hallegatte et al. [66] identify growing populations and asset values, the changing climate and subsidence (due to overabstraction of groundwater and disturbance of soil and water) as the key drivers of vulnerability. They estimate average global flood losses in the 136 largest coastal cities in 2005 at US $6 billion per year, increasing to US $52 billion by 2050 assuming that only the projected socio-economic change will take place. When including the effect of climate change and subsidence, unacceptable losses of US $1 trillion or more per year would be incurred. Even if adaptation investments in flood protection would maintain constant flood probability, subsidence and sea-level rise will increase global flood losses to US $60–63 billion per year in 2050. To maintain present flood risk, adaptation will need to reduce flood probabilities below present values. The magnitude of losses when floods do occur would increase, often by more than 50%, making it critical to also prepare for larger disasters than we are experiencing today. Hinkel et al. [67] conclude that, without adaptation, 0.2–4.6% of the global population is expected to be flooded annually in 2100 under 25–123 cm of global mean sea-level rise, with expected annual losses of 0.3–9.3% of global GDP. The global costs of protecting the coast with dikes would be significant, with annual investment and maintenance costs of US $12–71 billion in 2100, but much smaller than the global value of avoided damages. Such flood damages would be much more sensitive to the protection strategy than to variations in climate and socioeconomic scenarios. These results emphasize the central role of long-term coastal adaptation strategies that should also take into account that protecting large parts of the developed coast increases the risk of catastrophic consequences in the case of defence failure.
3.2. Assessing Exposure to Climate Risk
In the very recent past several specific incidents underscore the above generic prognoses. The damages inflicted in the US by the hurricanes Katrina, Sandy and Harvey (see higher) (as well as several smaller ones) demonstrate the vulnerability of coastal communities and industry. The 1–3 March 2018 winter storm in Northeast US created such a storm surge that Boston experienced its third highest tide on record along the shoreline which threatened the closure of several large chemical and other production facilities [68]. The 2011 Thailand floods are reckoned to have costed US $46.5 billion in financial damages and losses, of which the private sector bore 70% [69]. The floods led to vast disruption across industries, notably export-oriented car and electronics manufacturers. Many factories and their supply chains were closed for six months and longer. In India, Gassert [70] and WRI [71] reviewed the vulnerability of over 400 power plants and found that more than a third of those plants that depend on freshwater for cooling are located in areas of high or extremely high-water stress. These plants have, on average, a 21% lower utilization rate than their counterparts located in low or medium water-stress regions—lack of water simply prevents them from running at full capacity. Fourteen of India’s 20 largest thermal utilities experienced at least one shutdown due to water shortages between 2013 and 2016, costing the companies US $1.4 billion. This will increasingly put the economic and commercial viability of these plants in doubt especially as India plans to significantly raise power generation and food production, and other uses are growing as well. As another reference emerging market, assets in South Africa are at serious risk of water scarcity and heat effects, as demonstrated by the water crisis that afflicted the city of Cape Town, rich and well governed, in January–April 2018, which endangered the sustained viability of its services, manufacturing and tourism industries [72]. The US is one of the few countries that is, gradually, managing to quantify the impacts and costs of climate change. The 2018 National Climate Assessment [73] confirms that, without proper adaptation, the specific climate change-related phenomena will cause significant damage to infrastructure, property and to the production, supply chains and trade of US businesses, inside and outside the country. The Assessment cautions that, typically, risks do not yet reflect compound extremes (co-occurrence of multiple events, as happened with the 2012 Sandy hurricane event when the sea surge was combined with extreme precipitation) and the risk of cascading infrastructure failure. The economic cost to the US by 2100 is estimated at US $118 billion from sea level rise and US $32 billion from infrastructure damage, mostly from water-related impacts; in aggregate, by 2100 the impacts could lower GDP by up to 10%.
The above is a representative selection of salient examples showing how physical productive assets, real estate and other “investables” are turning vulnerable in the next few decades to quickly evolving water-related extremes that are being exacerbated by climate change. This development, therefore, is threatening certain types of financial interests and investment value in specific locations. Some financial consultancies, such as Four Twenty Seven (California) and Acclimatise (UK) have started assessing the “climate resilience” of investment classes linking physical risks (i.e., the “natural” risks, but as mitigated under current protection arrangements) with the viability of firms and investment portfolios. Four Twenty Seven screens each corporate site for its exposure and sensitivity to a set of climate hazards including extreme precipitation, sea level rise, hurricanes, heat stress, water stress and wildfires. It developed an equity scoring methodology which includes Operations Risk (which is site specific, commonly related to the production facilities), Supply Chain Risk and Market Risk (which both are spatially more diffuse), accounting for differential vulnerability scores to climate hazards between industries, asset types and locations. Figure 6 shows the result of a preliminary climate-vulnerability assessment of the CAC40—the benchmark 40 most significant firms listed on the Paris stock exchange—to climate change-related risks [74]. Such scoring helps better understand the nature of the vulnerability and preparation of adaptation strategies. Applying the same analytical approach on the banking, energy and food industrial sectors in Asia allows to similarly capture the industries’ exposure to risk (Figure 7) [74]. Banks tend to perform well on all metrics but Country of Sales as banks do not have much of a supply chain, and operate numerous branches across their markets with limited business impacts from local hazards. However, many banks serve only their domestic market, such that banks in Thailand, the Philippines, China and Indonesia rank as vulnerable to shocks in their home country. Utilities, in contrast, tend to be very exposed to Operation Risk, as they operate water and energy intensive power plants. They, too, depend on the market they serve; Kepco, the South Korean utility, scores better than utilities in Thailand and the Philippines. Companies in the food industry score consistently low for Supply Chain Risk due to their dependence on agricultural supply chains, but show a wide range of Market Risk, depending on whether they cater to their domestic market or to exports. Similar exposure analyses have also been piloted on real estate in the US.
Thus, climate change—to be understood in its broadest meaning—is becoming a driver of risk and negative performance in corporate investments and financial markets. Such risk will need to be increasingly integrated into investment decisions. It is currently not transparently and uniformly assessed nor reported. As investors and regulators will likely impose disclosure requirements, these analyses will become more specific and robust, which, in turn, will help direct investments into more sustainable solutions leading to more resilience for the firm, investor and society.
Climate-related hazard differs from past events that were considered “disasters” because it will be affecting regions and sectors in systemic and structural ways. Also, the connectedness of local and global economies and the steep rise in the investment value of all classes of assets contribute to the extent of the risk. The traditional fashion of diluting net risk in one location by balancing it out against the performance in many unaffected other locations, may no longer be always valid. Therefore, the Financial Stability Board and the Bank of International Settlements (Basel) commissioned the Task Force on Climate-related Financial Disclosures (TCFD) [75], chaired by Michael Bloomberg, to formulate recommendations. The TCFD concludes that risks related to climate change are one of the most significant and perhaps most misunderstood risks that organisations and investors face today, with impacts both in the short and long term. Thus, the value at risk to the global stock of manageable assets would range between US $4.2 and 43 trillion between now and 2100. Importantly, this impact would differ substantially between sectors and locations. The main impact would be through weaker growth and lower asset returns across the board. The Task Force recommends that firms and financial institutions disclose publicly in their mandatory annual filings both their exposure to the risk and their response, around four core thematic areas of their operations: their governance related to the risk, their strategy including how the risk also creates commercial opportunity, their risk management, and the metrics and operational targets applied to manage the risk and opportunities. As per 2018, these recommendations are being broadly subscribed to by a representative part of the financial sector but remains voluntary [76]. The EBRD [76] also identifies first-order and second-order impacts on the corporate value chain. First-order impacts are direct hazards from climate-related change, acute and chronic, that can be measured in physical terms (e.g., degrees centigrade, mm of rain, etc.) and that affect specific locations and can be mitigated by conventional methods, usually of a protective nature. Second-order impacts include all impacts beyond the boundaries of the corporation, such as agricultural productivity, disruptions to transport or workforce availability, migration, etc. The latter are more difficult to predict and require special mitigation through adaptive management methods. Similar new regulatory initiatives are being introduced in the UK by the Prudential Regulation Authority (PRA) and the Financial Conduct Authority (FCA); by the European Commission’s preparations for a legislative package on Sustainable Finance [77]; as well as by Japan’s, the Netherlands’ and other countries’ financial regulators.
For the purpose of this paper, however, the main conclusion is that water is recognized as playing a pivotal function and water-related impacts are considered of largest concern. Hence, the health of our global financial system will need to seek stronger partnership with the public and private water sector to help manage these systemic risks.
4. Conclusions
The water sector across the globe has benefited from a rather unique sustained and coherent policy and financial support agenda over the past three decades. This attention is likely to continue and intensify for the next 2–3 decades as water will become scarcer and more difficult to control, and thus, more valuable. Interestingly, in the sequence of subsequent policy paradigms, these policies have gradually become more effective—as measured against, for example, coverage with water services—and lessons appear to be learned. In the same period, the globally available capital has multiplied at a rate faster than that of the GDP. In the 1980s and 1990s comparatively scarce capital may have been one of the impediments to faster growth in the service coverage. However, after about 2000, capital has become sufficiently available and the lack of creditworthiness and institutional capacity are the main impediments.
The two global water agendas—SDGs and WSS on the one hand, and water resources and climate adaptation on the other—are experiencing a growing need for commercial (i.e., private sector) finance. The financial sector’s business model and systemic stability increasingly depend on water security, and thus, the quality of water management. The emphasis of this paper has been on EMDEs and international development because these countries are least able to face the challenge.
The “conventional” agenda of providing safe drinking water supply and sanitation to the world population has managed to learn from past experiences. With the political boost of the SDG policy, it has led to growing success offering a historically high coverage rate despite the rapidly expanding population. On the other hand, the newer water resources agenda, including notably flood, drought and river management and irrigation, is facing two constraints of growing significance: rapid changes in the landscape are often causing irrevocable destruction of catchments and hydrological systems; and rapid demographic and economic growth, driven by strong urbanization, imply that the world is reaching the boundaries of what the water system can carry. While droughts cause the largest numbers of deaths, floods are deemed economically the most destructive water-related hazard. The damages and losses due to floods are likely to grow exponentially by 2050, primarily in Asia. Similarly, water scarcity will affect many more people. By about 2045 the world will hit a tipping point when it will transition from a predominantly water-abundant place to one that is predominantly water-scarce because of reduced per-capita water availability (while recognizing that this picture masks large regional differences). Climate change will amplify these trends; however, the incremental impact of climate change on riverine floods by 2050 will still be minor in the order of 5–15% compared to that caused by poor land use, poor or non-existing resilience, weak implementation capacity and rising value of the assets at risk. Other types of hazard, however, are strongly correlated with climate change such as coastal flooding and seawater intrusion.
Finance for the water agenda has been historically determined by public budgets. Because of its public and common-property attributes, the public sector is likely to remain dominant. To meet the SDGs, the need for finance is 2–5 times larger than current practice, notably in the EMDEs, depending on sector and country. In the past five years the national budgets (from national government as well as from revenues of utilities) have grown significantly as countries are growing richer, while international development assistance has grown only modestly. Still, the effectiveness of these investments has improved as more best practices are being applied.
(More) financing is not the main factor towards making the water sector more sustainable and secure. Improving planning and policies, strengthening institutions, imposition of proper economic incentives and addressing the reluctance of water users to pay for the service are likely more crucial. Nonetheless, given the large amounts of capital and recurrent finance that will be required, and fiscal prudence regarding public budgets, commercial (private) finance will be an important factor in creating the conditions for a more sustainable future. Also, commercial finance is likely to play a growing role as it is seeking new investment opportunity and is responding to the request to help finance water. Compared to the GDP and capital available, the needs for the water sector are significant but certainly not insurmountable, at less than 1–2% of GDP. The observation that, nonetheless, commercial finance uptake by the water sector has remained very small compared to that in the energy and roads sectors suggests the presence of structural obstacles of institutional nature. Such finance is constrained by the high-risk profiles of many water investments: deals are too small and risky and the working environment in EMDEs is less stable. Thus, the creditworthiness of utilities, municipalities and water agencies needs to be enhanced. As a consequence, commercial financiers are engaged only in very specific parts of the water sector, in particular with corporates and selected public entities. To enhance access to commercial finance, three instruments stand out: (i) blending, where sovereign finance from development assistance or philanthropic sources is used to lower risks in deals or provide guarantees, thereby making the net risk profile palatable for the commercial investor, (ii) the use of intermediary institutions that combine expert knowledge of the water and financing sectors and are able to pool demand into larger baskets and syndicate loans, thus diluting risk and lowering transaction costs, and (iii) more intensive use of the emerging local capital markets to arrange deals in local currency to avoid currency risk. However, even though the capacity to access finance is constrained in many developing economies, it is observed that in many countries and situations the capacity to absorb finance and prepare “bankable” proposals may be an even more constraining factor. In other words, the central impediment to financing is of institutional rather than financial nature. Hence, capacity development needs to be more targeted at preparing and facilitating such transactions. Dedicated capacity development should also be aimed at the financial institutions.
Climate change—interpreted in its broadest sense and including also the consequences of economic growth dynamics that contribute to heightening of water insecurity—is increasingly acknowledged as a systemic threat to corporate and financial assets. The financial sector is slowly waking up to the fact that water insecurity undercuts the financial viability of existing or planned production assets in energy generation, agro-business, manufacturing, logistics and services. Also, real estate is at risk. Especially for investors with a long-term perspective such as pension funds and insurers, this is a substantial risk. The exposure of corporations and financials to climate-related risk differs by organization, industry class and location. Corporations and financial portfolios will have to disclose the climate-related risk to which they are exposed and how they intend to manage it.
In the long term, the water resources and climate adaptation agendas will likely start appropriating the budgets that thus far have been targeting the improved coverage of the world population with water and sanitation services. The interests of the water and financial sectors will in the future also start to converge. The water sector will depend on commercial finance to generate more finance, complement public funding, and replace the international assistance that is likely to phase out over time. This creates a business opportunity for the financial sector. On the other hand, a vast array of assets in which the financial sector has a vested interest is at climate-related risk; this will incentivize governments and the water sector to accord priority to higher water security.
Funding
This research received no external funding.
Conflicts of Interest
The author declares no conflict of interest.
References
- UN (United Nations). Resolution 64/292: The Human Right to Water and Sanitation; United Nations: New York, NY, USA, 2010. [Google Scholar]
- HLPW (High-Level Panel on Water). Making Every Drop Count. An Agenda for Action; HLPW Outcome Document; United Nations: New York, NY, USA, 2018. [Google Scholar]
- ICWE (International Conference on Water and the Environment). The Dublin Statement on Water and Sustainable Development. Available online: http://www.wmo.int/pages/prog/hwrp/documents/english/icwedece.html (accessed on 21 December 2018).
- WWAP (United Nations World Water Assessment Programmer). The United Nations World Water Development Report 2018: Nature-Based Solutions for Water; UNESCO: Paris, France, 2018. [Google Scholar]
- World Bank/UNICEF (United Nations Children’s Fund). Sanitation and Water for All: Priority Actions for Sector Financing; The World Bank: Washington, DC, USA, 2017. [Google Scholar]
- WHO (World Health Organization). UN-Water Global Analysis and Assessment of Sanitation and Drinking-Water (GLAAS) 2017 Report: Financing Universal Water, Sanitation and Hygiene under the Sustainable Development Goals; World Health Organization: Geneva, Switzerland, 2017. [Google Scholar]
- WHO/UNICEF (World Health Organization and United Nations Children’s Fund). Progress on Sanitation and Drinking Water: 2015 Update and MDG Assessment; World Health Organization: Geneva, Switzerland, 2015. [Google Scholar]
- UNDESA. World Population Prospects: Key Findings and Advance Tables—The 2017 Revision; Working Paper No. ESA/P/WP/248; UNDESA, Population Division: New York, NY, USA, 2017; Available online: esa.un.org/unpd/wpp/Publications/Files/WPP2017_KeyFindings.pdf (accessed on 12 August 2018).
- Climate Bonds Initiative. Green Bond Highlight; Climate Bonds Initiative: London, UK, January 2018. [Google Scholar]
- UN-Water. Available online: http://www.unwater.org/publications/water-security-infographic/ (accessed on 12 November 2018).
- WWAP (United Nations World Water Assessment Programmer). The United Nations World Water Development Report 4: Managing Water under Uncertainty and Risk; United Nations Educational, Scientific and Cultural Organization: Paris, France, 2012. [Google Scholar]
- OECD (Organization for Economic Co-operation and Development). OECD Environmental Outlook to 2050; OECD: Paris, France, 2012. [Google Scholar]
- Sadoff, C.W.; Hall, J.W.; Grey, D.; Aerts, J.C.; Ait-Kadi, M.; Brown, C.; Cox, A.; Dadson, S.; Garrick, D.; Kelman, J.; et al. Securing Water, Sustaining Growth: Report of the GWP/OECD Task Force on Water Security and Sustainable Growth; University of Oxford: Oxford, UK, 2015. [Google Scholar]
- Ligtvoet, W. The Geography of Future Water Challenges; PBL Netherlands Environmental Assessment Agency: The Hague, The Netherlands, 2018. [Google Scholar]
- NOAA (National Oceanic and Atmospheric Administration). Available online: https://coast.noaa.gov/states/fast-facts/hurricane-costs.html (accessed on 12 October 2018).
- Ciolli, J. Hurricanes Irma and Harvey Cause Goldman Sachs to Slash Its Outlook for the US Economy. Available online: http://www.businessinsider.com/goldman-sachs-hurricane-irma-harvey-gdp-impact-2017-9 (accessed on 11 September 2018).
- World Bank. Water Overview; The World Bank: Washington, DC, USA, 2016. [Google Scholar]
- World Bank. High and Dry: Climate Change, Water and the Economy; The World Bank: Washington, DC, USA, 2016. [Google Scholar]
- Inderst, G.; Stewart, F. Institutional Investment in Infrastructure in Developing Countries: Introduction to Potential Models; Policy Research Working Paper 6780; The World Bank: Washington, DC, USA, 2014. [Google Scholar]
- McKinsey. Financing Change: How to Mobilize Private Sector Financing for Sustainable Infrastructure; McKinsey & Partners: New York, NY, USA, 2016. [Google Scholar]
- Hutton, G.; Varughese, M. The Costs of Meeting the Sustainable Development Goal Targets on Drinking Water, Sanitation and Hygiene; Technical Paper 10317; World Bank: Washington, DC, USA, 2016. [Google Scholar]
- WWC (World Water Council). Increasing Financial Flows for Urban Sanitation; World Water Council: Marseilles, France, 2018. [Google Scholar]
- ADB (Asian Development Bank). Meeting Asia’s Infrastructure Needs; Asian Development Bank: Manila, Philippines, 2017. [Google Scholar]
- World Bank. Private Participation in Infrastructure Database. Available online: https://ppi.worldbank.org/ (accessed on 11 September 2018).
- OECD (Organization for Economic Co-operation and Development). Available online: https://data.oecd.org/drf/private-flows.htm#indicator-chart (accessed on 12 October 2018).
- Winpenny, J.; Trémolet, S.; Cardone, R. Aid Flows to the Water Sector: Overview and Recommendations; The World Bank: Washington, DC, USA, 2016. [Google Scholar]
- OECD (Organization for Economic Co-Operation and Development). Financing Water and Sanitation in Developing Countries: Key Trends and Figures; OECD: Paris, France, 2017. [Google Scholar]
- IPCC (Intergovernmental Panel on Climate Change). Climate Change 2014: Impacts, Adaptation, and Vulnerability; Working Group II Contribution to the Fifth Assessment Report of the Intergovernmental Panel on Climate Change; Cambridge University Press: Cambridge, UK; New York, NY, USA, 2014; Available online: www.ipcc.ch/report/ar5/wg2/ (accessed on 12 November 2018).
- Buchner, B.; Trabacchi, C.; Mazza, F.; Abramskiehn, D.; Wang, D. Global Landscape of Climate Finance; Climate Policy Initiative. 2015. Available online: https://climatepolicyinitiative.org/publication/global-landscape-of-climate-finance-2015/ (accessed on 21 December 2018).
- UNEP (United Nations Environment Programmer). The Adaptation Finance Gap Report 2016; United Nations Environment Programmer: Nairobi, Kenya, 2016. [Google Scholar]
- Russ, D.; Thambiah, Y.; Foscari, N. Can Infrastructure Investing Enhance Portfolio Efficiency? Crédit Suisse Asset Management. Available online: https://www.credit-suisse.com/pwp/am/downloads/marketing/infrastructure_ch_uk_lux_ita_scandinavia.pdf (accessed on 2 October 2018).
- Bain & Co. Capital Super-Abundance; Bain & Co: Boston, MA, USA, 2015; Available online: www.bain.com/publications/articles/a-world-awash-in-money.aspx (accessed on 12 October 2018).
- World Bank. Indicators. 2018. Available online: https://data.worldbank.org/indicator/ny.gdp.mktp.cd (accessed on 12 October 2018).
- McKinsey. Global Capital Markets-Entering a New Era; McKinsey & Partners: New York, NY, USA, 2009. [Google Scholar]
- PwC. Capital Markets 2020; Price Waterhouse Coopers, 2015. Available online: https://www.pwc.se/sv/pdf-reports/capital-markets-2020-will-it-change-for-good.pdf. (accessed on 2 October 2018).
- IMF (International Monetary Fund). Global Financial Stability Report 2016; International Monetary Fund: Washington, DC, USA, 2016. [Google Scholar]
- ADB (Asian Development Bank). Benchmarking and Data Book of Water Utilities in India; ADB: Manila, Philippines, 2007. [Google Scholar]
- World Bank. Water and Wastewater Services in the Danube Region. A State of the Sector; World Bank: Washington, DC, USA, 2015. [Google Scholar]
- GWL (Global Water Leaders Group). The Global Value of Water; The Global Water Leaders Group: Oxford, UK, 2017. [Google Scholar]
- Ho, T.; Lee, S. The Oxford Guide to Financial Modeling: Applications for Capital Markets, Corporate Finance, Risk Management, and Financial Institutions; Oxford University Press: New York, NY, USA; Oxford, UK, 2004. [Google Scholar]
- OECD. A Framework for Financing Water Resources; OECD Publishing: Paris, France, 2012. [Google Scholar]
- Micale, V.; Tonkonogy, B.; Mazza, F. Understanding and Increasing Climate Financing for Adaptation; Climate Policy Initiative. Available online: https://climatepolicyinitiative.org/publication/understanding-and-increasing-finance-for-climate-adaptation-in-developing-countries/ (accessed on 21 December 2018).
- 2018 OECD. Green Finance Forum. Available online: www.oecd.org/cgfi/2018-forum-documents.htm (accessed on 30 November 2018).
- European Parliament. On Absorption of Structural and Cohesion Funds: Lessons Learnt for the Future Cohesion Policy of the EU; European Parliament 2010/2305(INI): Brussels, Belgium, 2011. [Google Scholar]
- European Court of Auditors. Commission’s and Member States’ Actions in the Last Years of the 2007–2013 Programmes Tackled Low Absorption but Had Insufficient Focus on Results; Report 17; European Court of Auditors: Brussels, Belgium, 2018. [Google Scholar]
- World Bank. Data from Annual Reports and Sectoral Reports 2006–2018; The World Bank: Washington, DC, USA, 2018. [Google Scholar]
- Alaerts, G.; Kaspersma, J. Progress and Challenges in Knowledge and Capacity Development. In Capacity for Improved Water Management; Blokland, M., Alaerts, G., Kaspersma, J., Hare, M., Eds.; Taylor & Francis: London, UK, 2009. [Google Scholar]
- World Bank. World Development Report 2019: The Changing Nature of Work; The World Bank: Washington, DC, USA, 2018. [Google Scholar]
- Ministry of Economic Development. Financing the Uganda Water Sector; Proceedings, Ministry of Economic Development, Makerere University: Kampala, Uganda, 24 September 2018. [Google Scholar]
- GIF (Global Infrastructure Facility). Making Infrastructure Rewarding. A Report by the Global Infrastructure Facility; Global Infrastructure Facility: Washington, DC, USA, 2016. [Google Scholar]
- OECD (Organisation for Economic Co-Operation and Development). Blended Finance—Mobilising Resources for Sustainable Development and Climate Action in Developing Countries; OECD: Paris, France, 2017. [Google Scholar]
- GIZ (Gesellschaft für Zusammenarbeit). Closing the Financing Gap for Water in Line with SDG Ambitions: The Role of Blended Finance; Proceedings of a Workshop, GIZ: Eschborn, Germany, 2018. [Google Scholar]
- OECD (Organisation for Economic Co-Operation and Development). Blended Finance for Water Investment; Working Paper; OECD: Paris, France, 2018. [Google Scholar]
- SIDA (Swedish International Development Agency). Sida’s Guarantee Portfolio. 2018. Available online: http://www.oecd.org/water/OECD-GIZ-Conference-Background-Document-Sida-Guarantee-Portfolio-2017.pdf (accessed on 30 October 2018).
- JICA (Japan International Cooperation Agency). The Philippine Water Revolving Fund (PWRF); Proceedings, GIZ Conference on Blended Finance, GIZ: Eschborn, Germany, 2018. [Google Scholar]
- World Bank. Case Studies in Blended Finance for Water and Sanitation. 2016. Available online: https://www.wsp.org/sites/wsp.org/files/publications/WSS-9-Case-Studies-Blended-Finance.pdf. (accessed on 14 July 2018).
- WFF (Water Finance Facility). Available online: https://waterfinancefacility.com/2017/11/20/portfolio/ (accessed on 14 November 2018).
- Sewilam, H.; Alaerts, G. Developing knowledge and capacity. In World Water Development Report; Chapter 26; UNESCO: Paris, France, 2012. [Google Scholar]
- Wehn de Montalvo, U.; Alaerts, G. Leadership in knowledge and capacity development in the water sector: a status review. Water Policy 2013, 15, 1–14. [Google Scholar] [CrossRef] [Green Version]
- World Bank. Easing the Transition to Commercial Finance for Sustainable Water and Sanitation; World Bank: Washington, DC, USA, 2017. [Google Scholar]
- AQUASTAT. Available online: http://www.fao.org/nr/water/aquastat/water_use/index.stm (accessed on 23 December 2018).
- Wada, Y.; Flörke, M.; Hanasaki, N.; Eisner, S.; Fischer, G.; Tramberend, S.; Satoh, Y.; Van Vliet, M.T.H.; Yillia, P.; Ringler, C.; et al. Modelling global water use for the 21st century: The Water Futures and Solutions (WFaS) initiative and its approaches. Geosci. Model Dev. 2016, 9, 175–222. [Google Scholar] [CrossRef]
- Burek, P.; Satoh, Y.; Fischer, G.; Kahil, M.T.; Scherzer, A.; Tramberend, S.; Nava, L.F.; Wada, Y.; Eisner, S.; Flörke, M.; et al. Water Futures and Solution: Fast Track Initiative (Final Report); IIASA Working Paper; International Institute for Applied Systems Analysis (IIASA): Laxenburg, Austria, 2016; Available online: pure.iiasa.ac.at/13008/ (accessed on 14 January 2018).
- Susnik, J. Economic metrics to estimate current and future resource use, with a focus on water withdrawals. J. Sust. Prod. Consum. 2015, 2, 109–127. [Google Scholar]
- Alexandratos, N.; Bruinsma, J. World Agriculture Towards 2030/2050: The 2012 Revision; ESA Working paper No. 12-03; Food and Agriculture Organization of the United Nations (FAO): Rome, Italy, 2012; Available online: www.fao.org/docrep/016/ap106e/ap106e.pdf (accessed on 12 August 2018).
- Hallegatte, S.; Green, C.; Nicholls, R.J.; Corfee-Morlot, J. Future flood losses in major coastal cities. Nat. Clim. Chang. Lett. 2014, 3, 802. [Google Scholar] [CrossRef]
- Hinkel, J.; Lincke, D.; Vafeidis, A.; Perrette, M.; Nicholls, R.; Tol, R.; Marzeion, B.; Fettweis, X.; Ionescu, C.; Levermann, A. Coastal flood damage and adaptation costs under 21st century sea-level rise. Proc. Natl. Acad. Sci. USA 2014, 111, 3292–3297. [Google Scholar] [CrossRef] [PubMed] [Green Version]
- CNN. Available online: https://edition.cnn.com/2018/03/02/us/weather-bomb-cyclone/index.html (accessed on 12 October 2018).
- World Bank. Thai Flood 2011; The World Bank: Bangkok, Thailand, 2012. [Google Scholar]
- Gassert, F.; Landis, M.; Luck, M.; Reig, P.; Shiao, T. Aqueduct Global Maps 2.1; Working Paper; World Resources Institute: Washington, DC, USA, 2017. [Google Scholar]
- WRI (World Resources Institute). 2018. Available online: https://www.wri.org/blog/2018/01/40-indias-thermal-power-plants-are-water-scarce-areas-threatening-shutdowns. (accessed on 12 November 2018).
- The Bulletin. Available online: https://thebulletin.org/what-cape-town-learned-its-drought11698 (accessed on 6 July 2018).
- USGCRP. Impacts, Risks, and Adaptation in the United States: Fourth National Climate Assessment, Volume II: Report-in-Brief; Reidmiller, D.R., Avery, C.W., Easterling, D.R., Kunkel, K.E., Lewis, K.L.M., Maycock, T.K., Stewart, B.C., Eds.; U.S. Global Change Research Program: Washington, DC, USA, 2018. [Google Scholar]
- Mazzacurati, E.; Vargas Mallard, D.; Turner, J.; Steinberg, N.; Shaw, C. Measuring Physical Climate Risk in Equity Portfolios; Deutsche Asset Management Global Research Group: Frankfurt, Germany; New York, NY, USA, 2017. [Google Scholar]
- TCFD (Task Force on Climate-Related Financial Disclosures). Final Report—Recommendations of the Task Force on Climate-Related Financial Disclosures; Bank for International Settlements, Financial Stability Board: Basel, Switzerland, 2017. [Google Scholar]
- EBRD. Advancing TCFD Guidance on Physical Climate Risks and Opportunities; Conference, European Bank for Reconstruction and Development: London, UK, 2018. [Google Scholar]
- European Union. Report on Climate-Related Disclosures; Technical Expert Group on Sustainable Finance, European Commission: Brussels, Belgium, 2019. [Google Scholar]
Figure 1.
Distribution of infrastructure assets held by different categories of institutional investors, all in US $ trillion [20].
Figure 1.
Distribution of infrastructure assets held by different categories of institutional investors, all in US $ trillion [20].
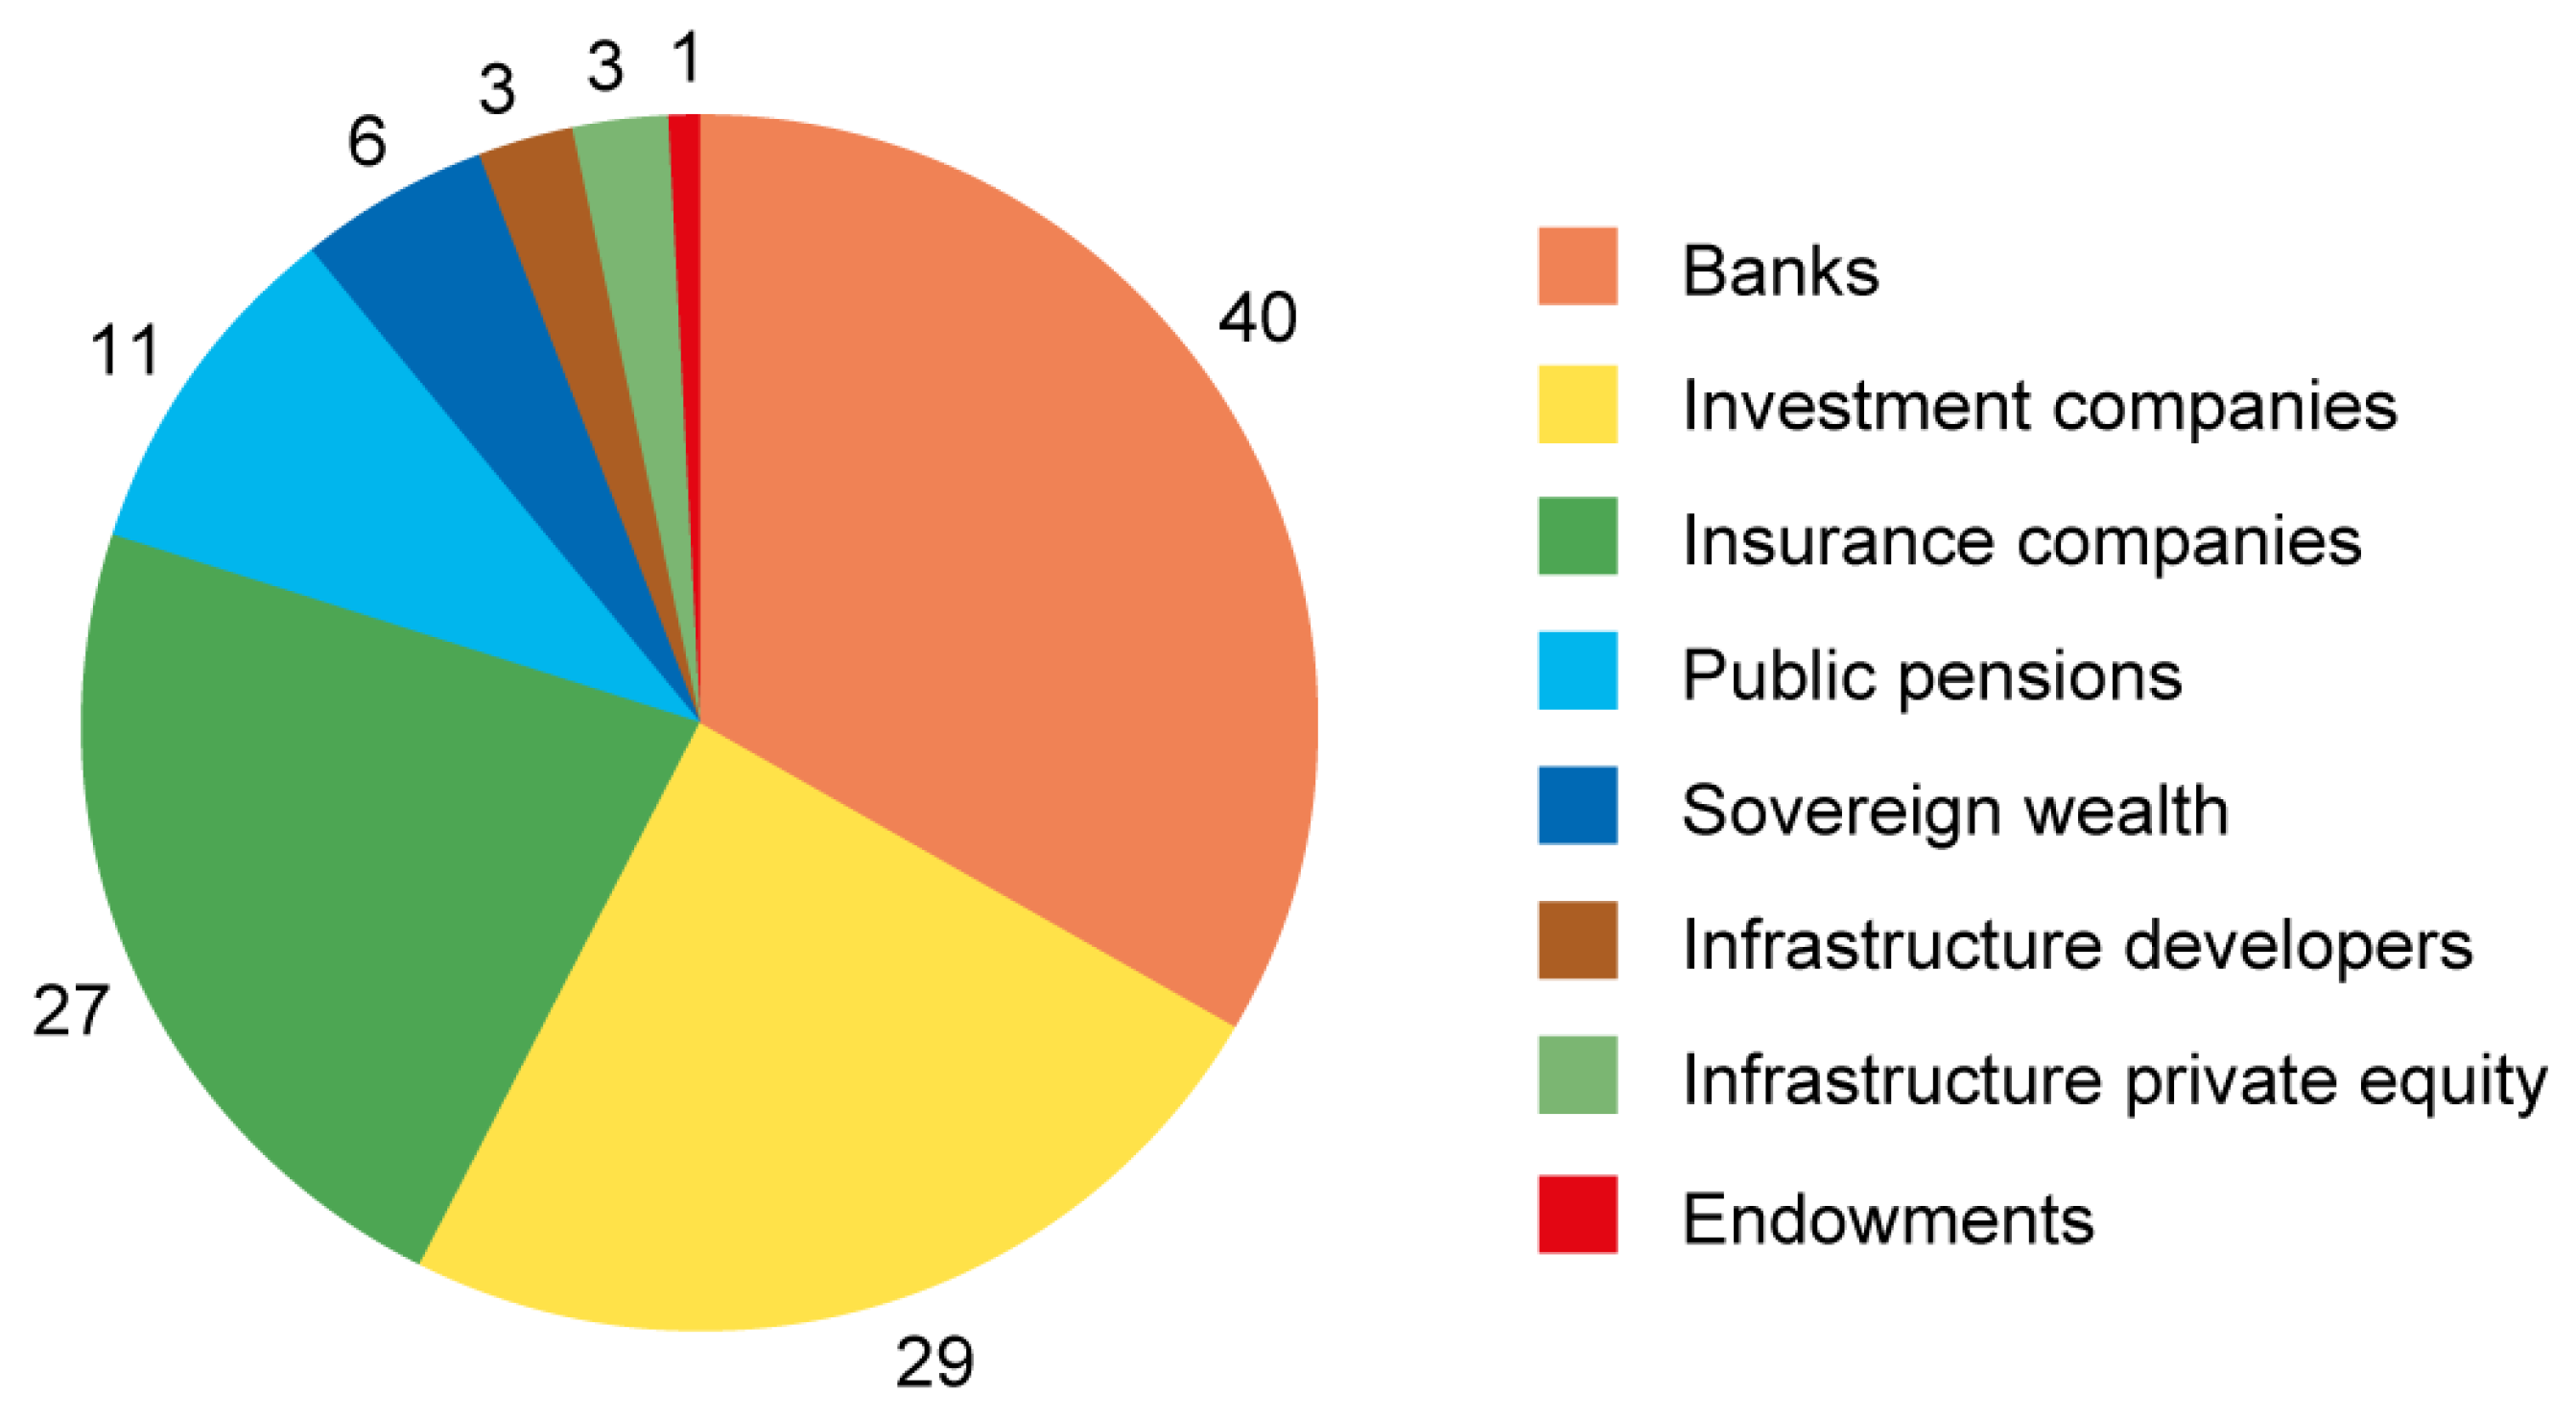
Figure 2.
Investment appetite for commercial finance depending on asset class, investment size and risk profile.
Figure 2.
Investment appetite for commercial finance depending on asset class, investment size and risk profile.
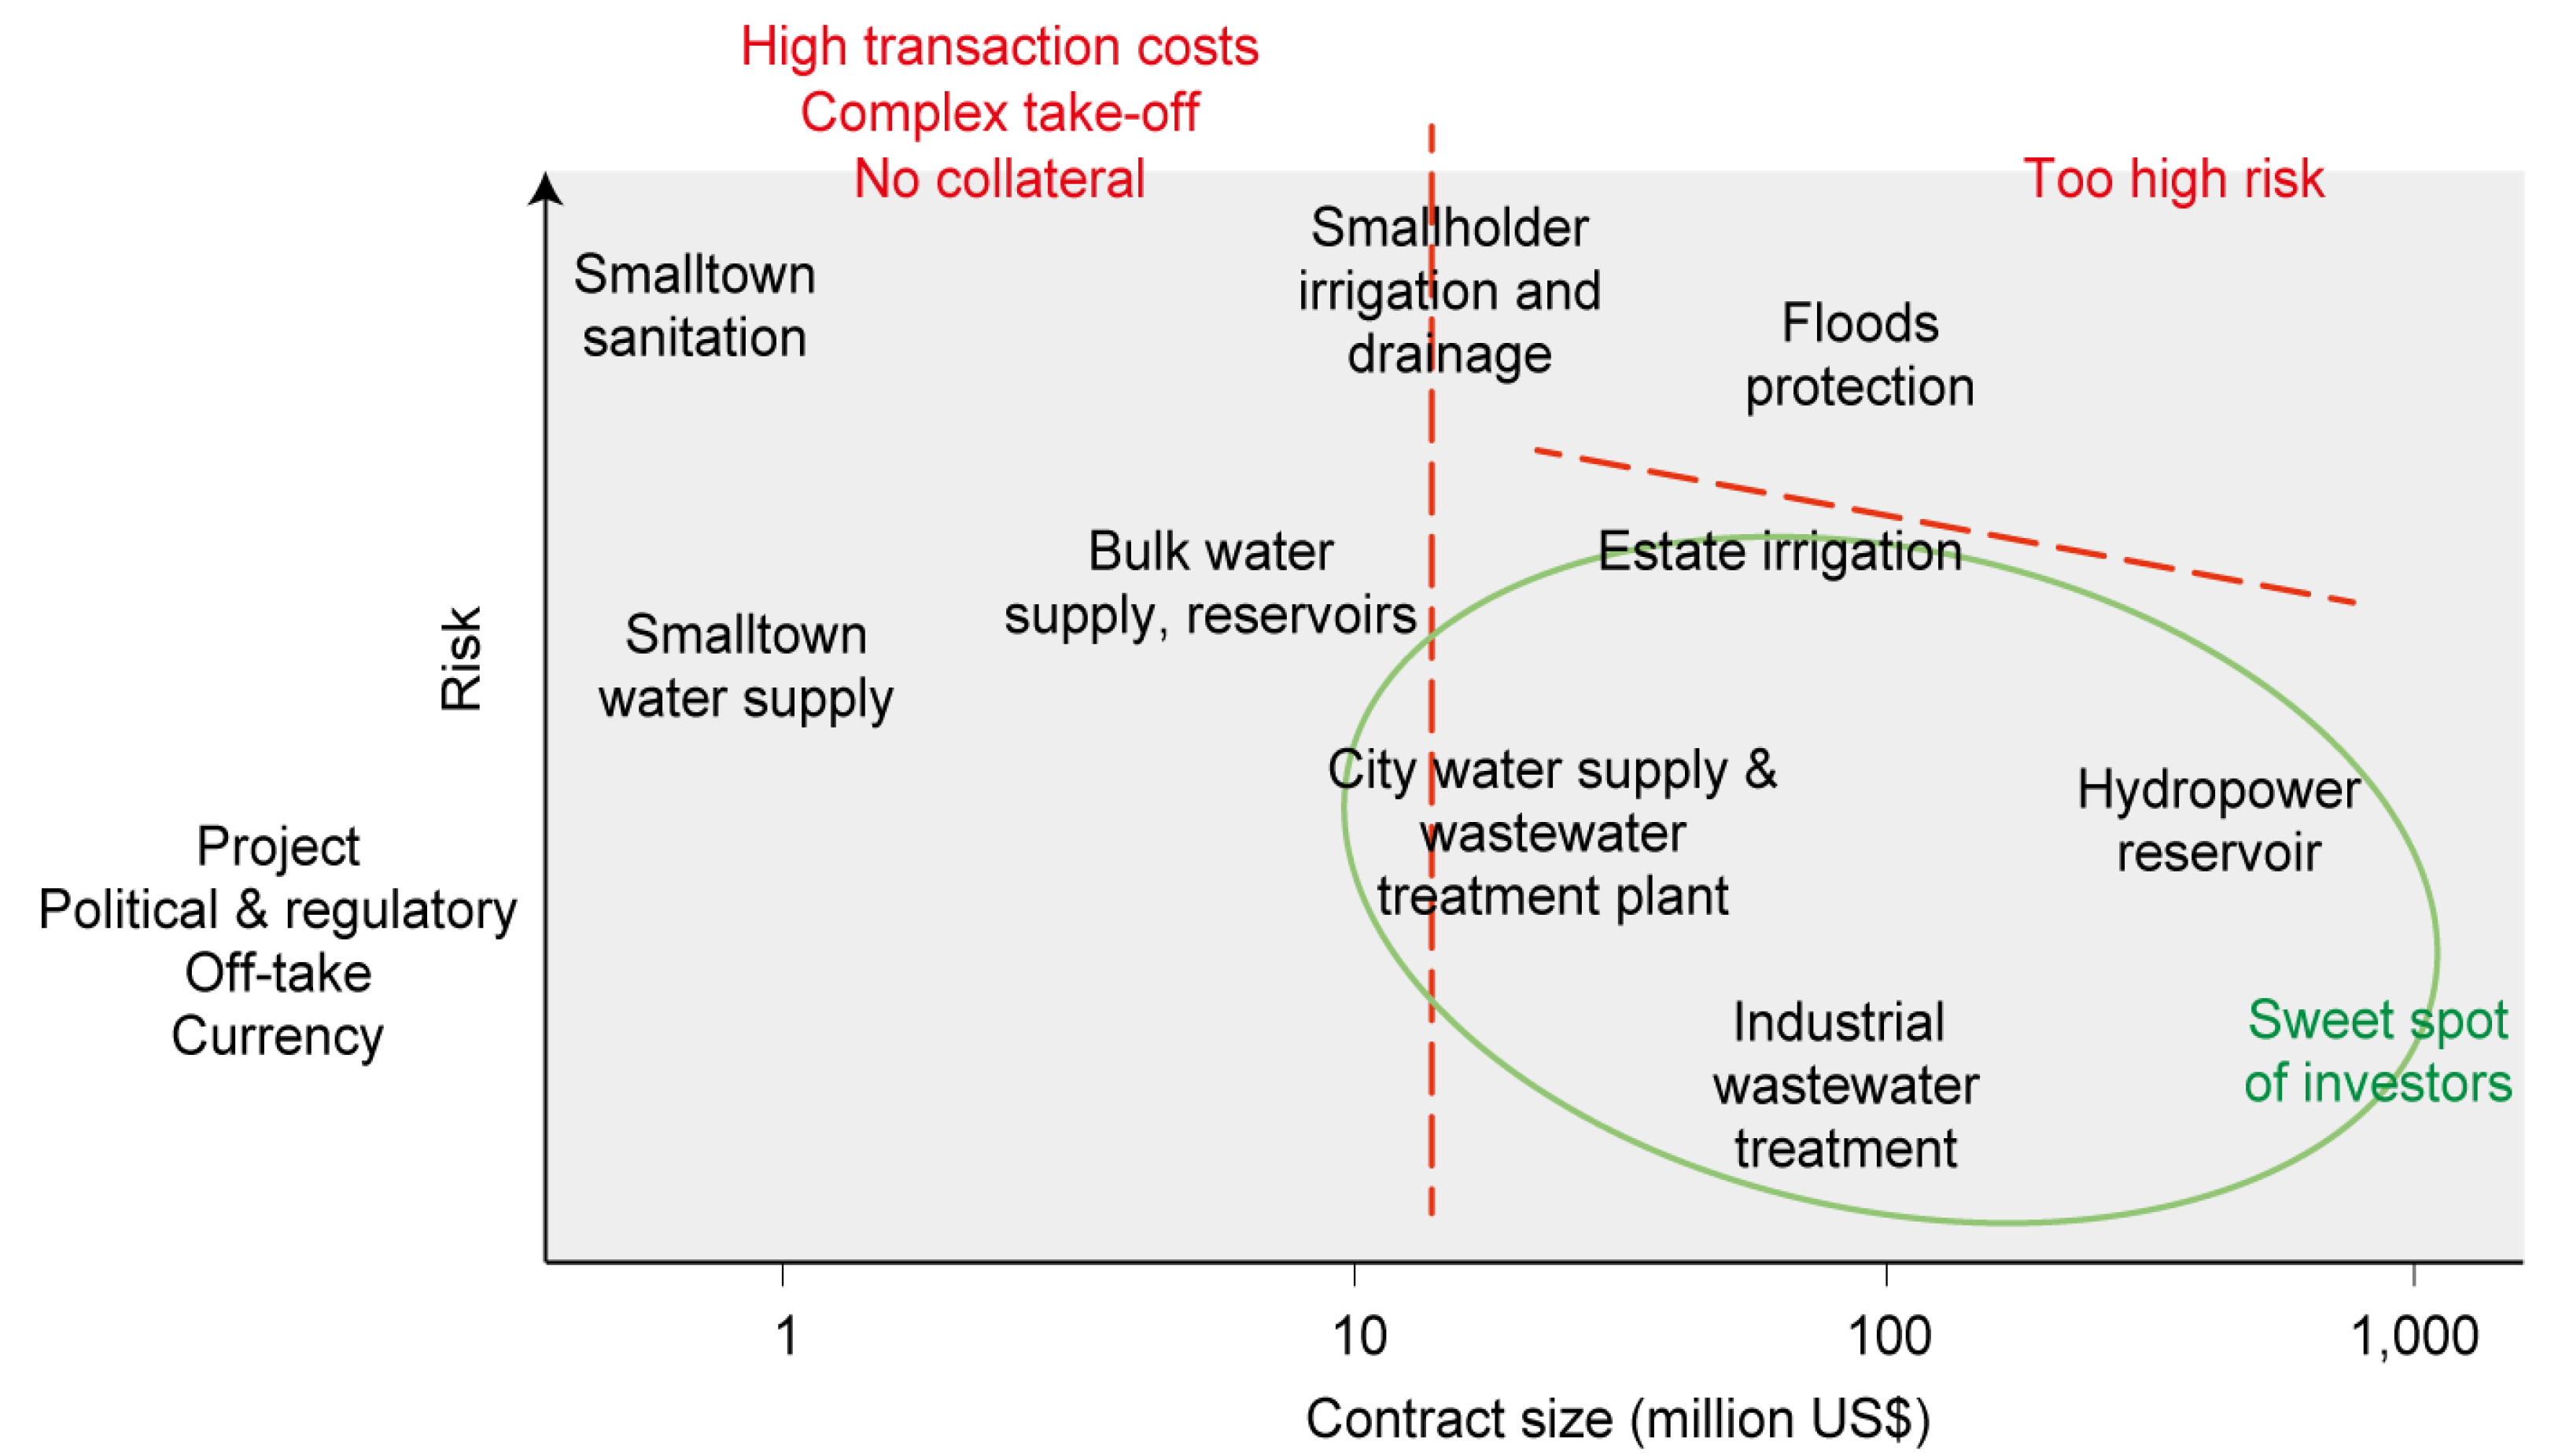
Figure 3.
Unused funds from the 2007–2013 programming period among European Union Member States due to exceedance of eligibility period (grey), lack of eligibility post-execution (blue) and suspension (red) [45]. RO = Romania, IT = Italy, CZ = Czech Republic, DE = Germany, SK = Slovakia, BG = Bulgaria, ES = Estonia, UK = United Kingdom.
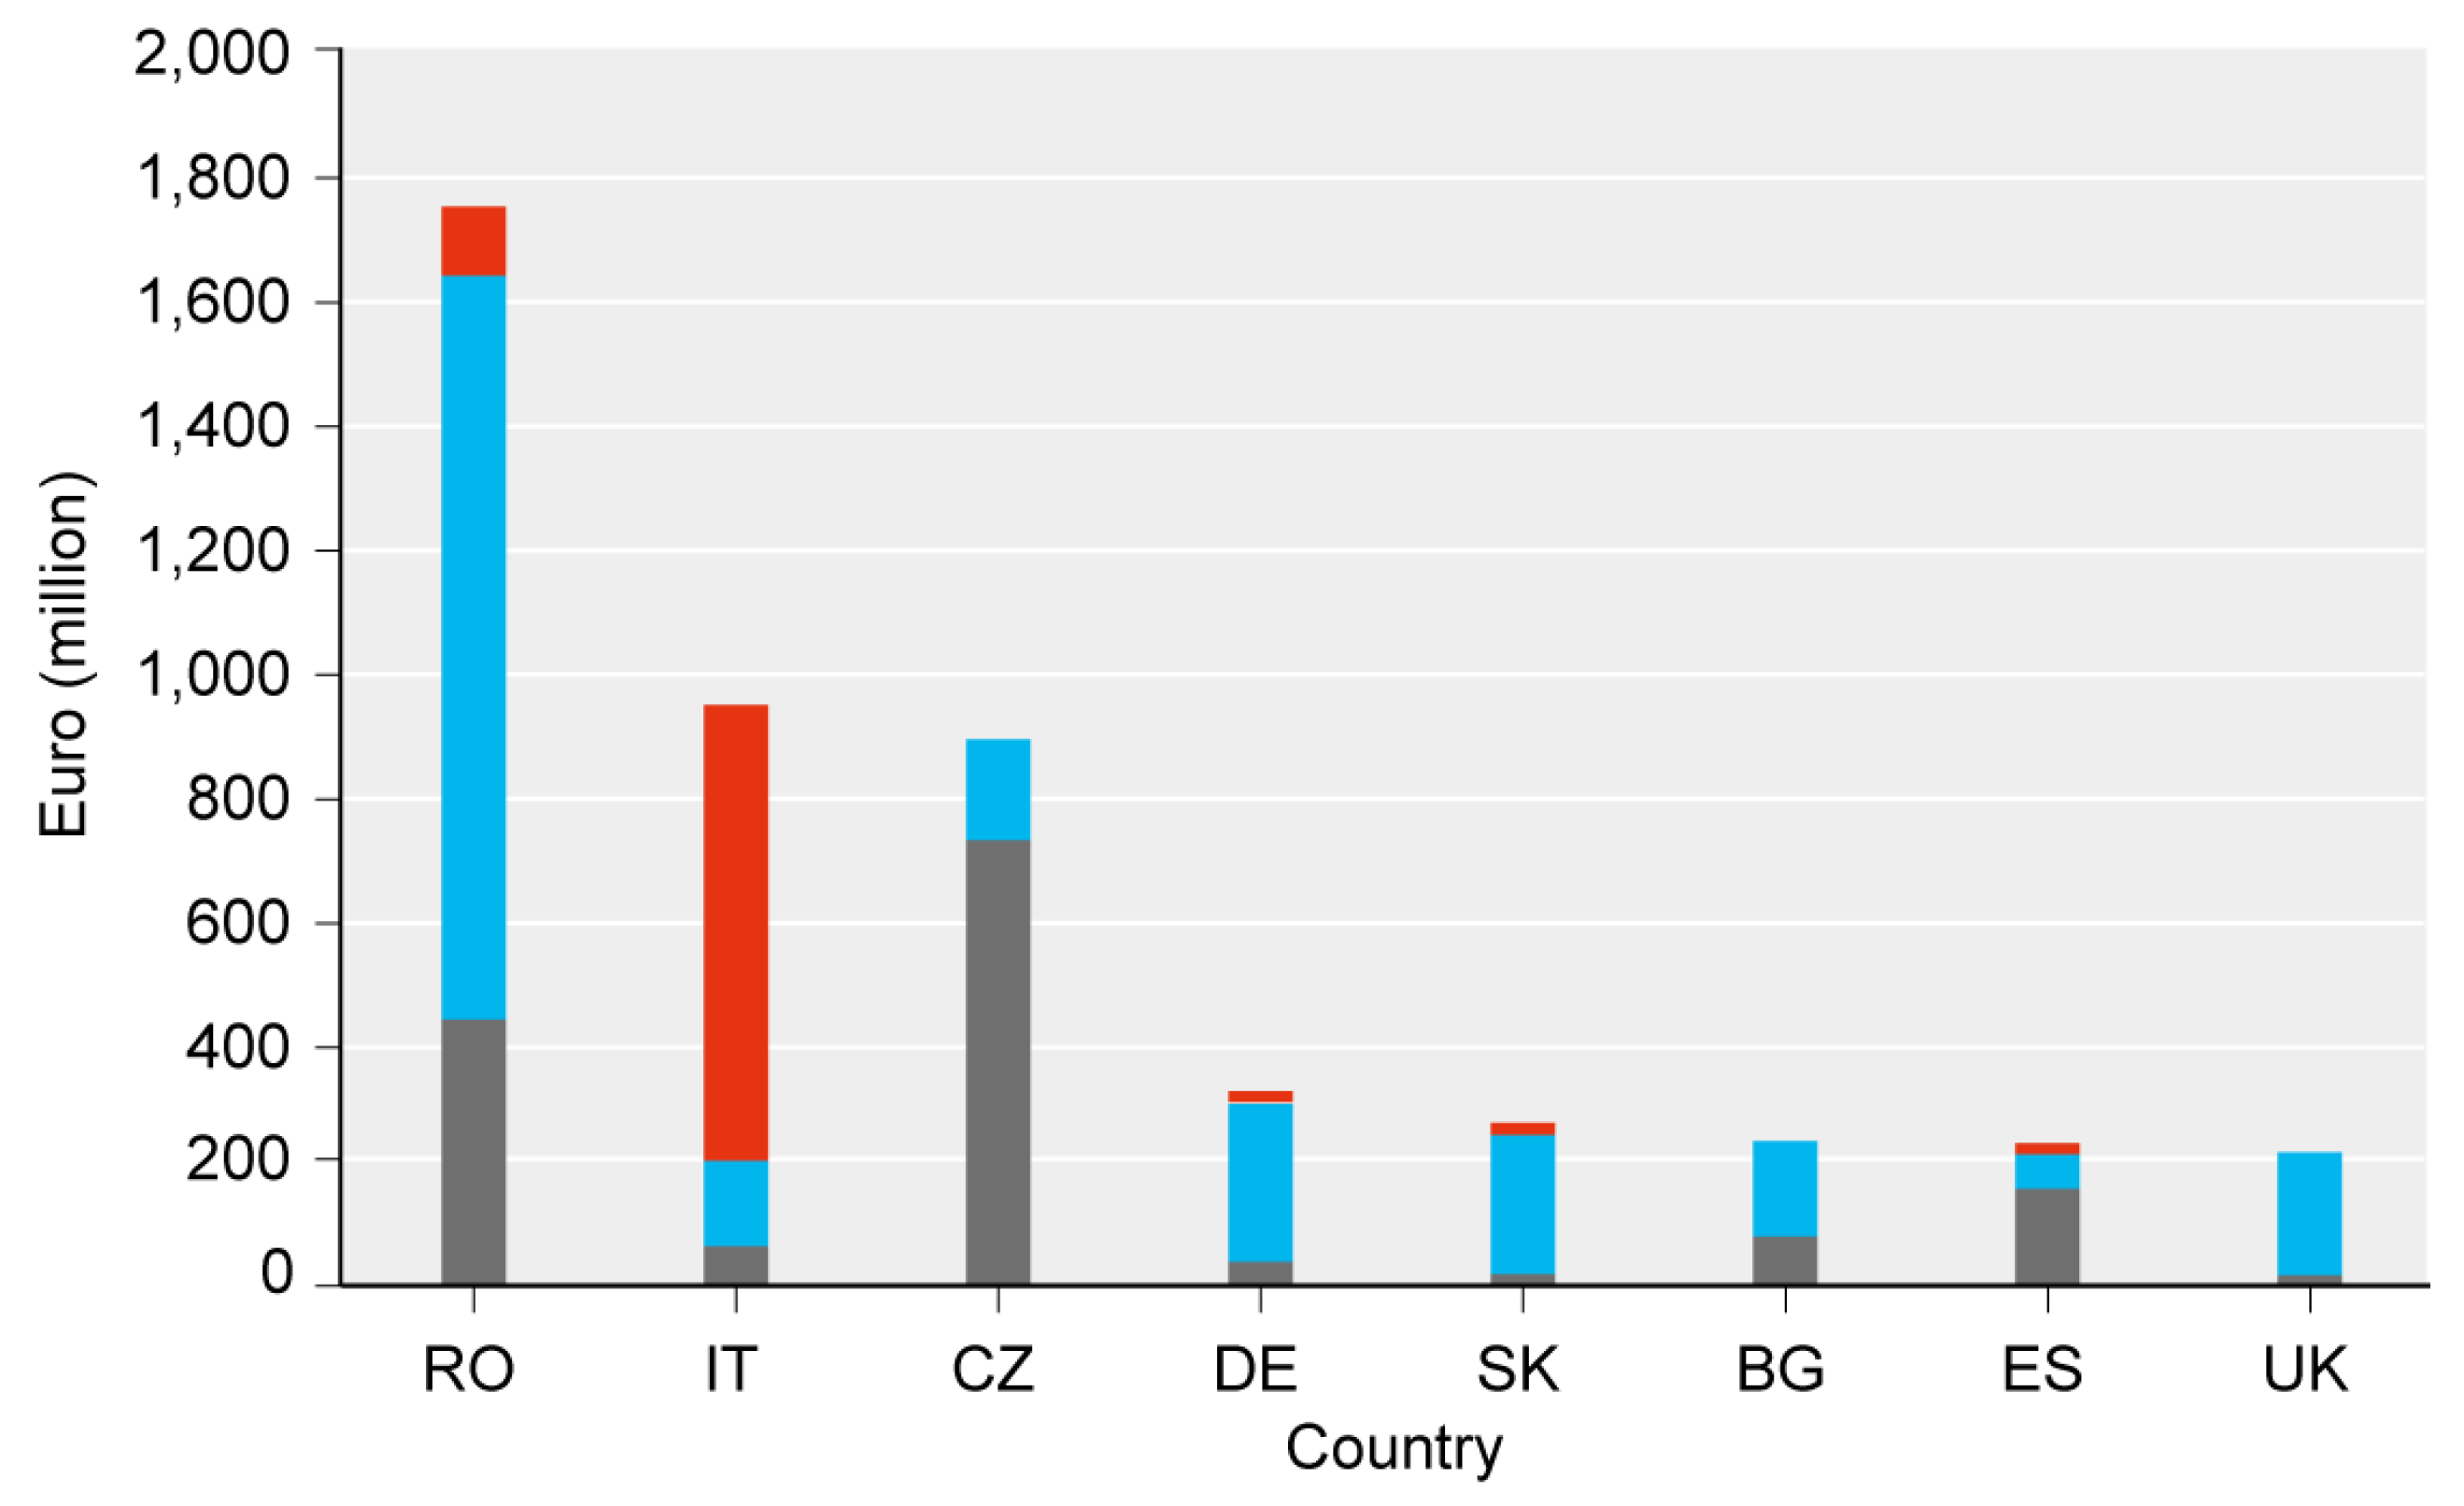
Figure 4.
India: total financial commitment by the World Bank and actual annual disbursements [46].
Figure 4.
India: total financial commitment by the World Bank and actual annual disbursements [46].
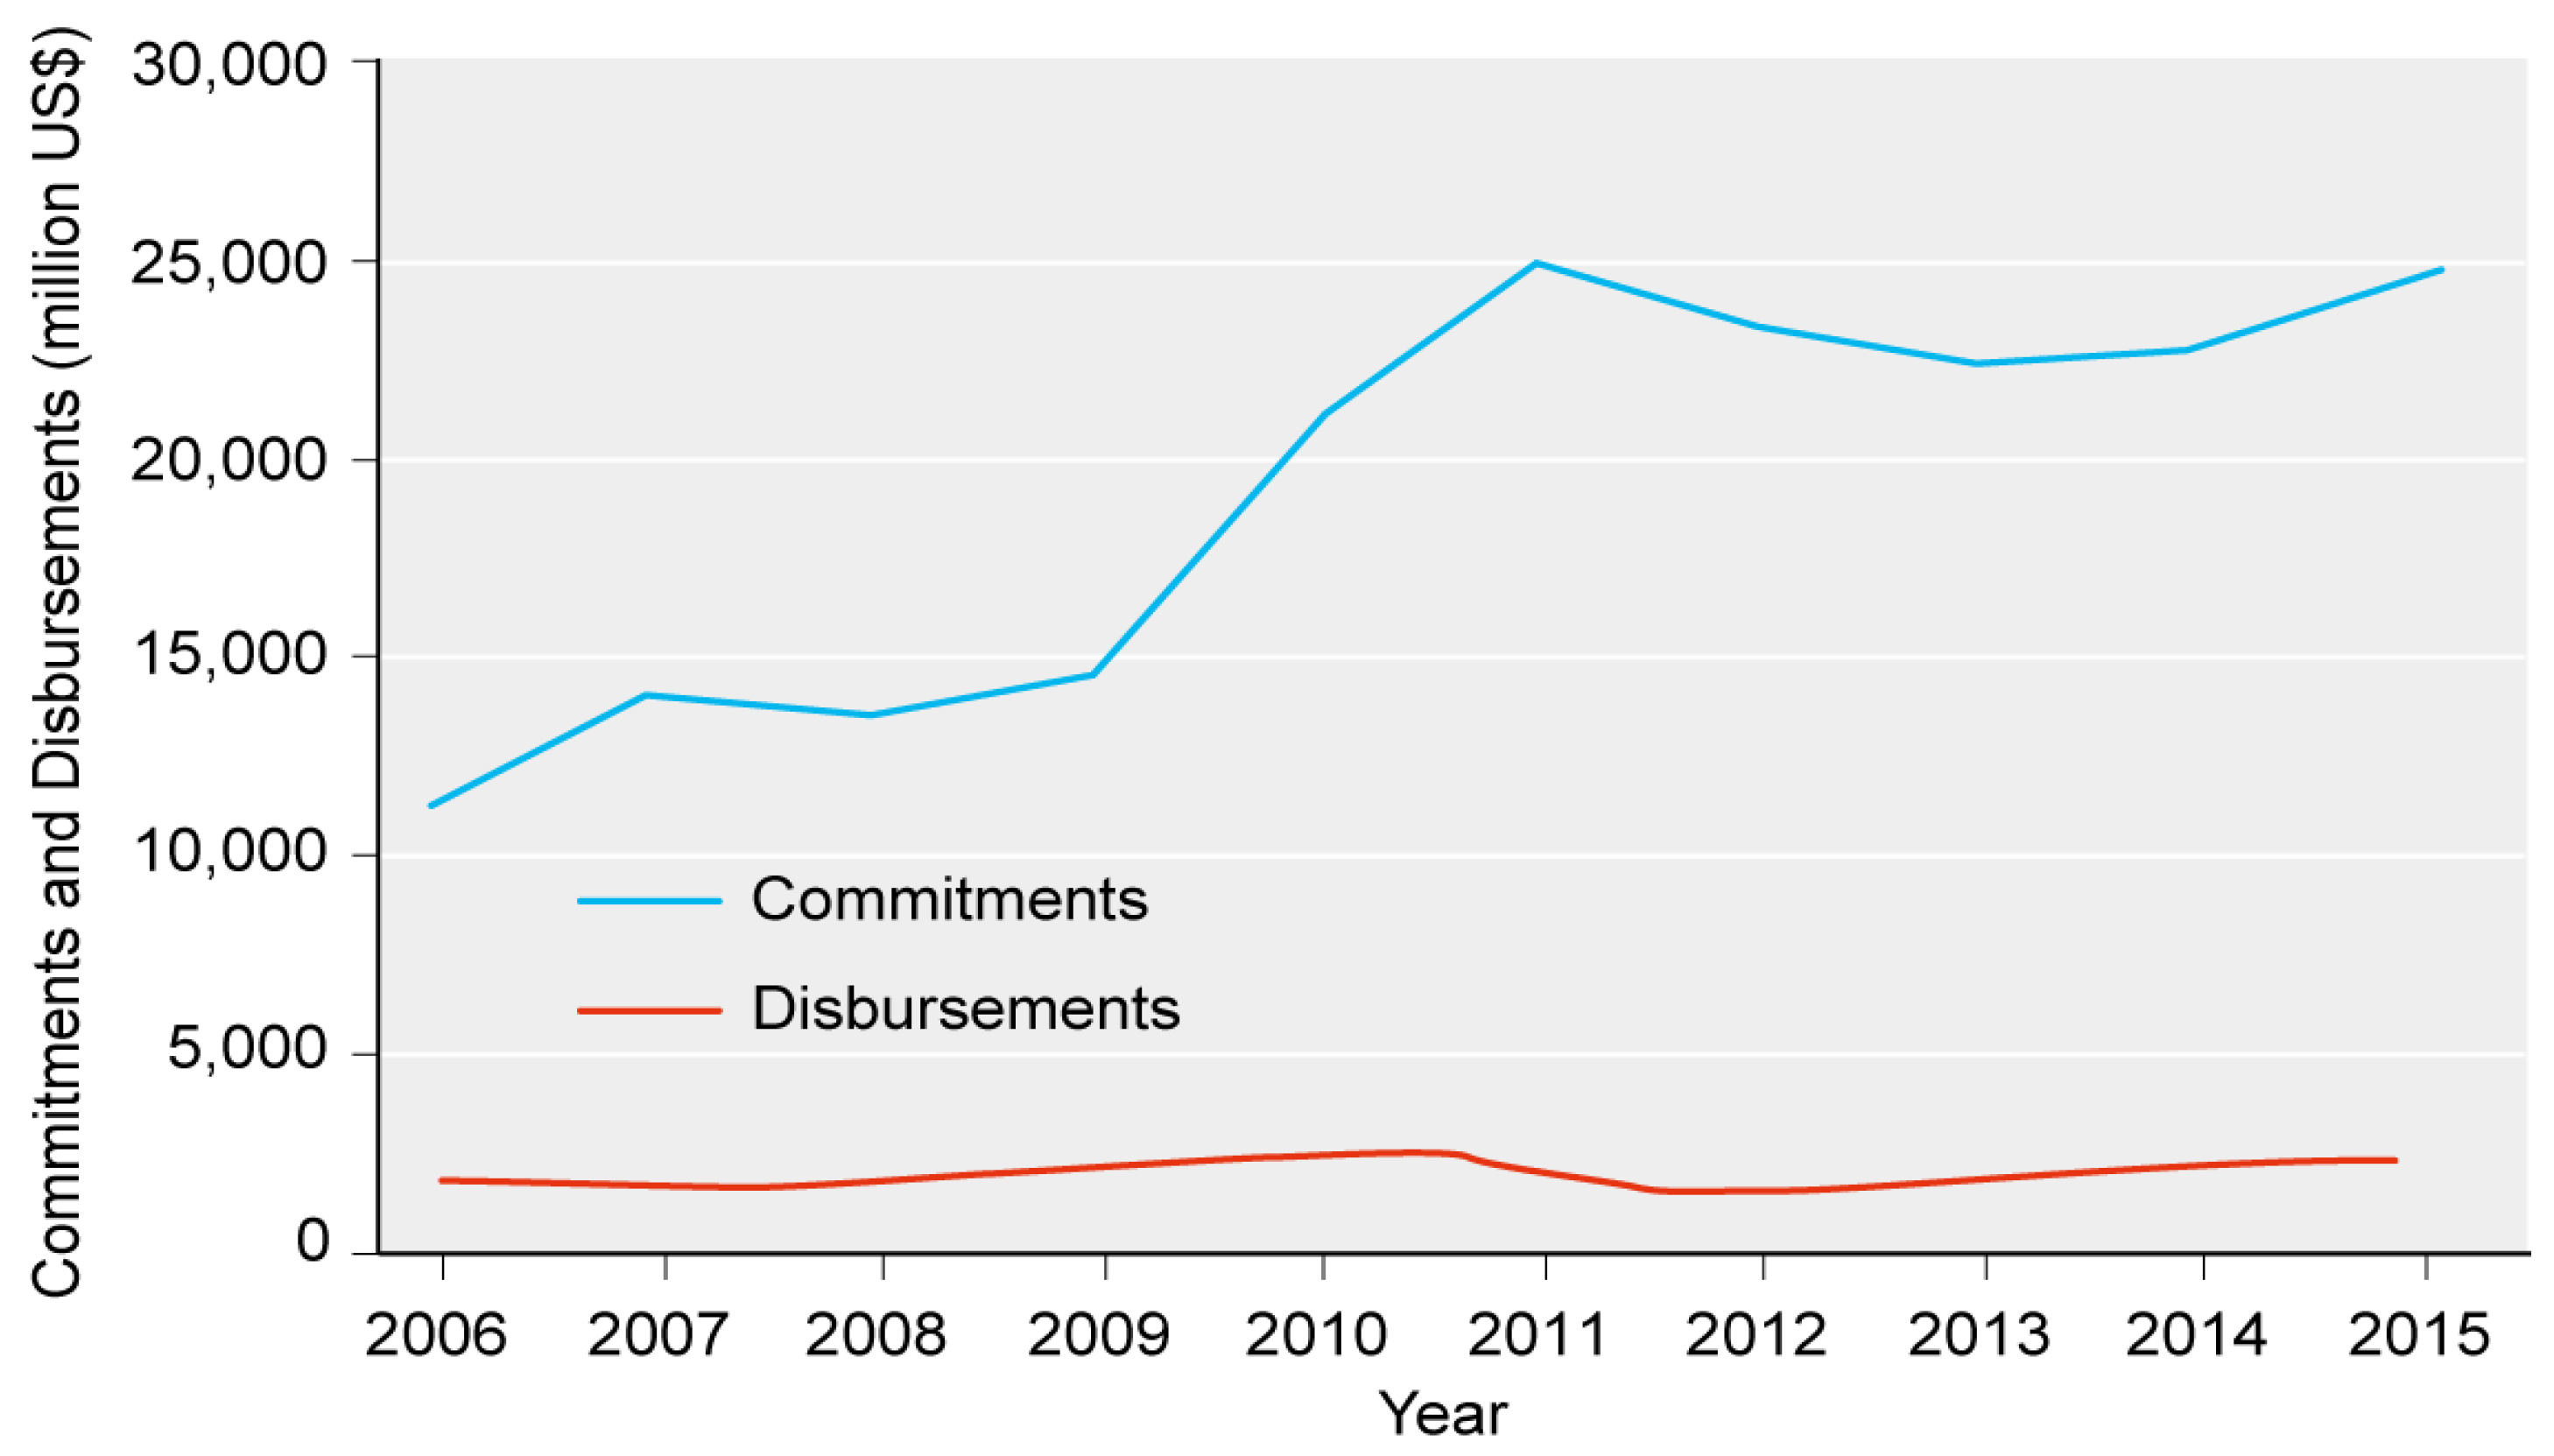
Figure 5.
Four efficiency improvement steps in water supply utilities would suffice to render up to 77% of the utilities in a representative sample from EMDEs financially viable [60].
Figure 5.
Four efficiency improvement steps in water supply utilities would suffice to render up to 77% of the utilities in a representative sample from EMDEs financially viable [60].
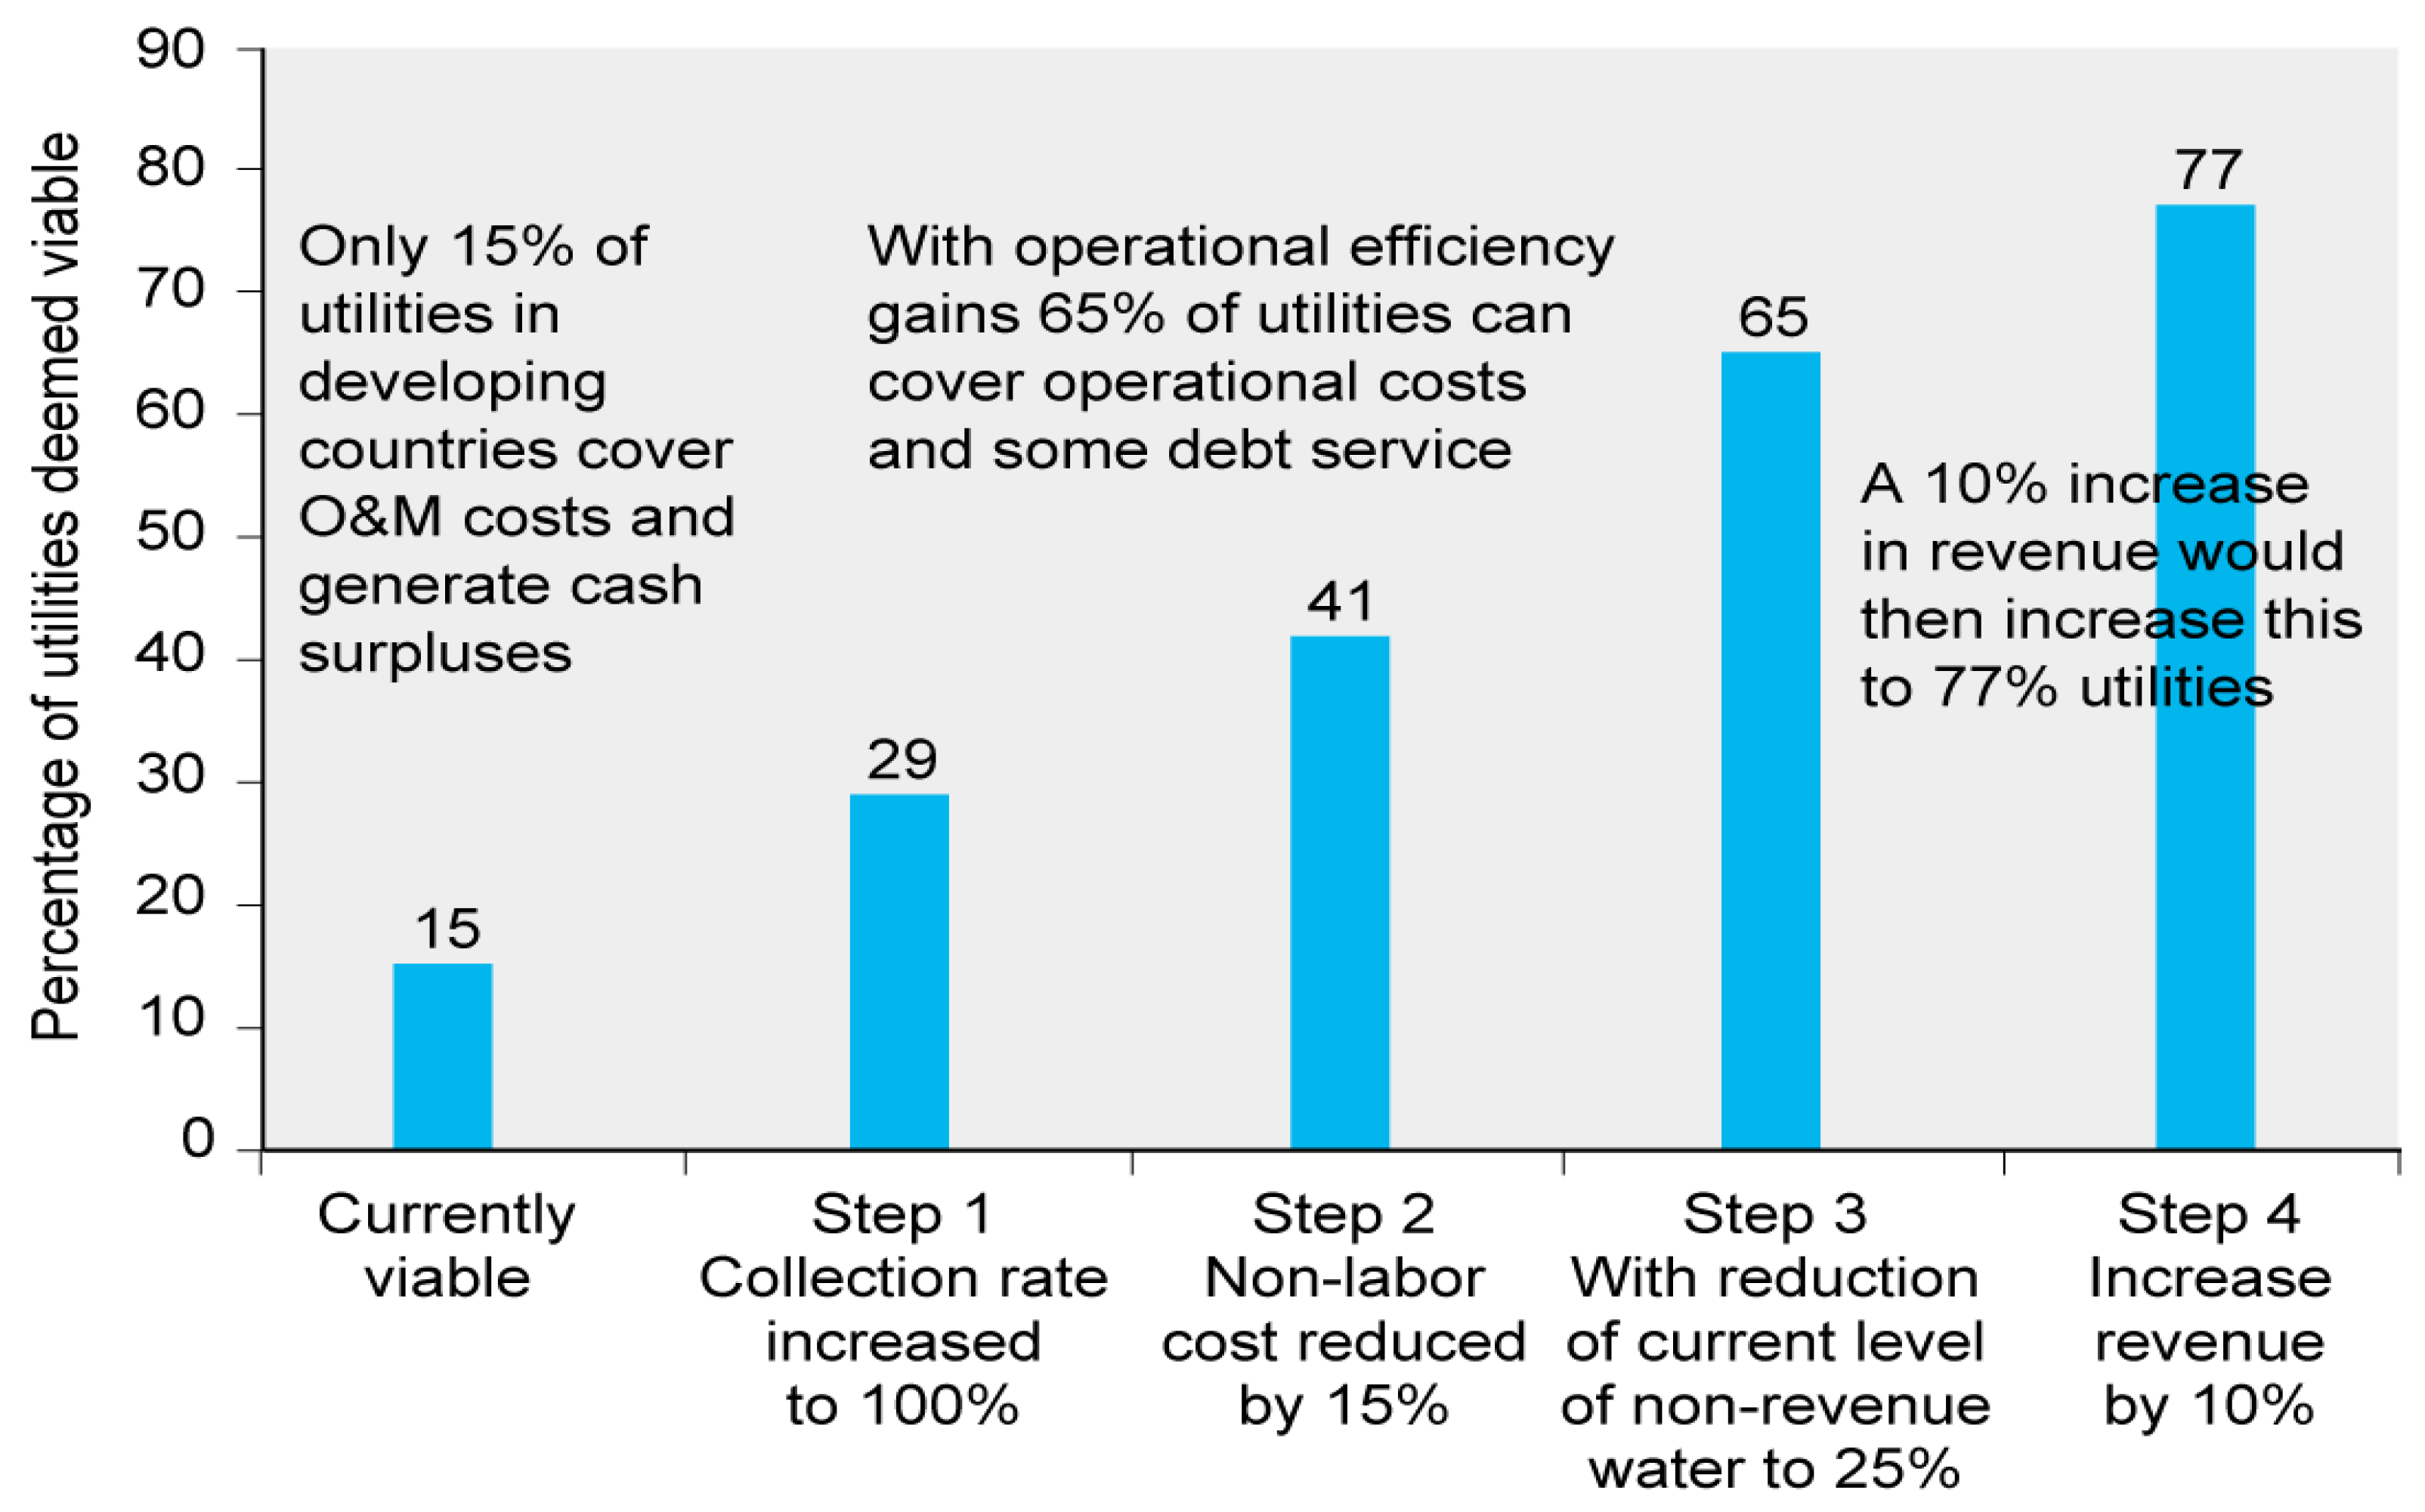
Figure 6.
Exposure of the CAC40, the 40 most significant firms listed on the Paris stock exchange, to climate change-related Operations Risks (vertical axis) and Market and Supply Chain Risks (horizontal axis) [74]. Low scores mean high risk. Weight (%) refers to the weight of the stock in the CAC40. Scores are normalized allowing comparison. The Operations Risk is based on risk exposure at manufacturing sites on about 68,000 locations around the globe. Risk includes risk from heat stress, wildfires, water stress, sea level rise, extreme precipitation and hurricanes/typhoons.
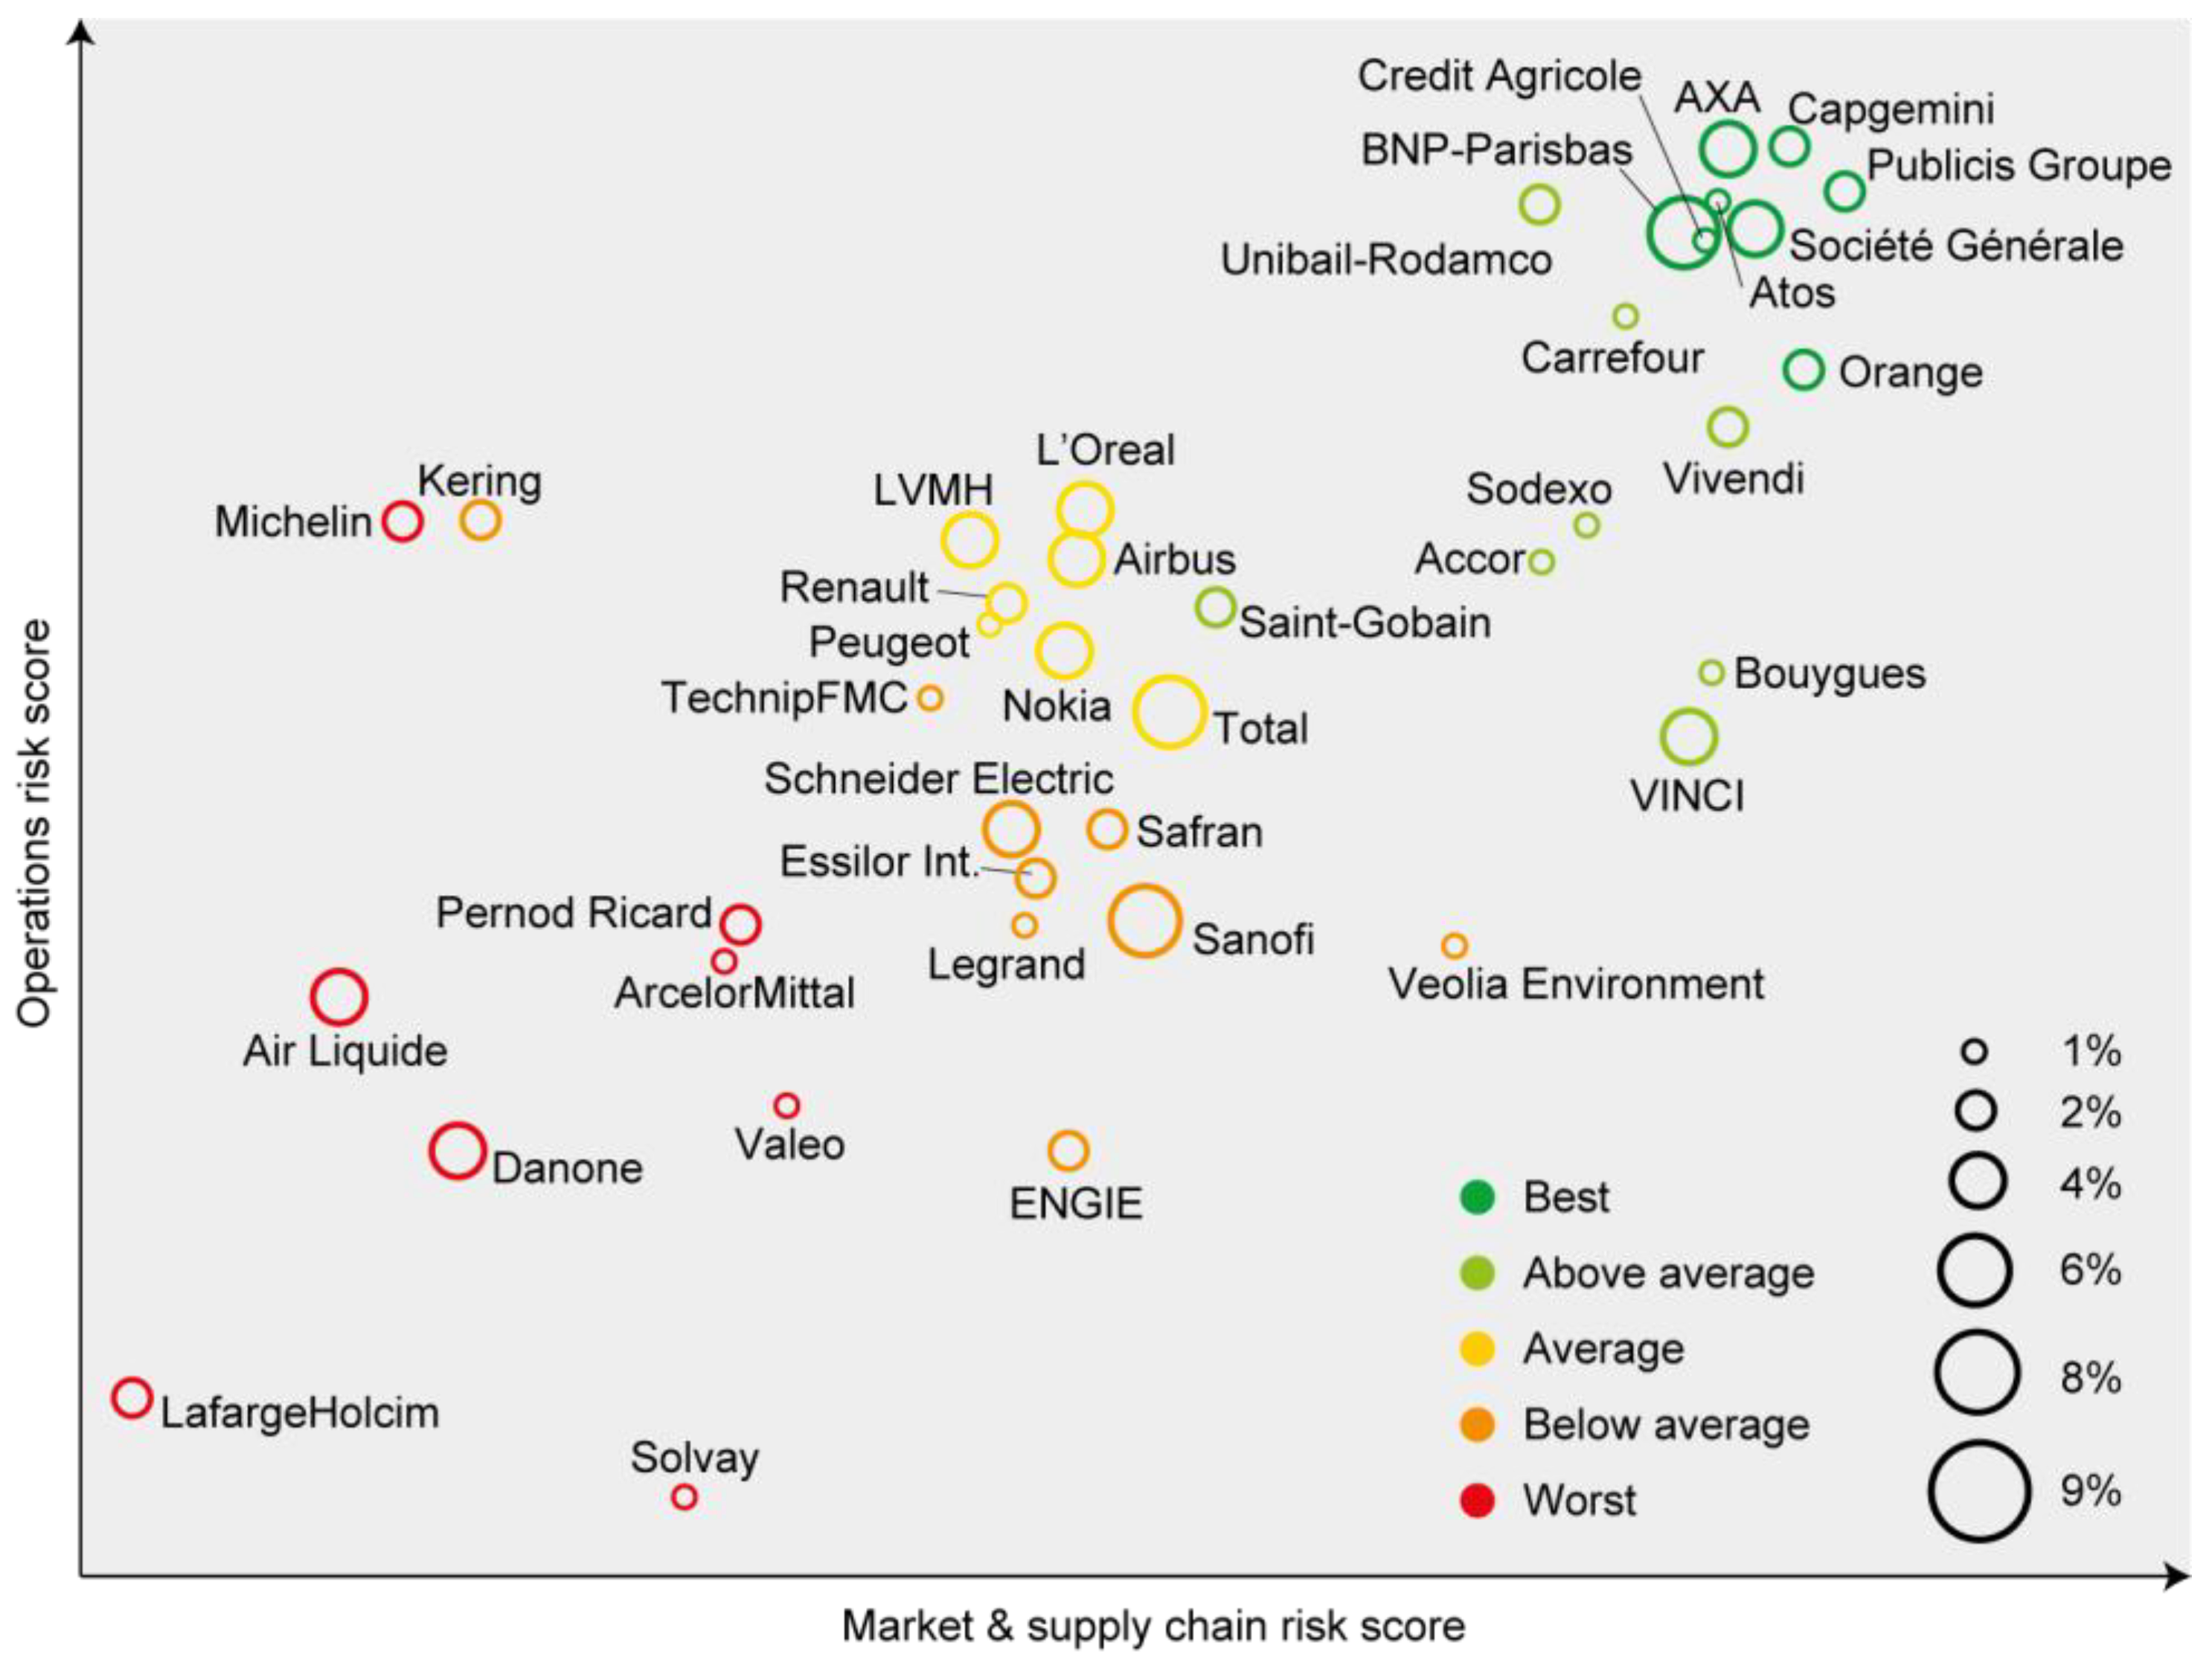
Figure 7.
Exposure of the business of selected banks, energy utilities and foodstuff corporations in Asia to climate risk affecting their Country of Sales (vertical axis) and Supply Chain (horizontal axis) [74]. Low scores mean high risk. Weight (%) refers to the relative size of the stock in the sample. Global Industry Classification Standard (MSCI and Standard & Poor’s) for sector definition.
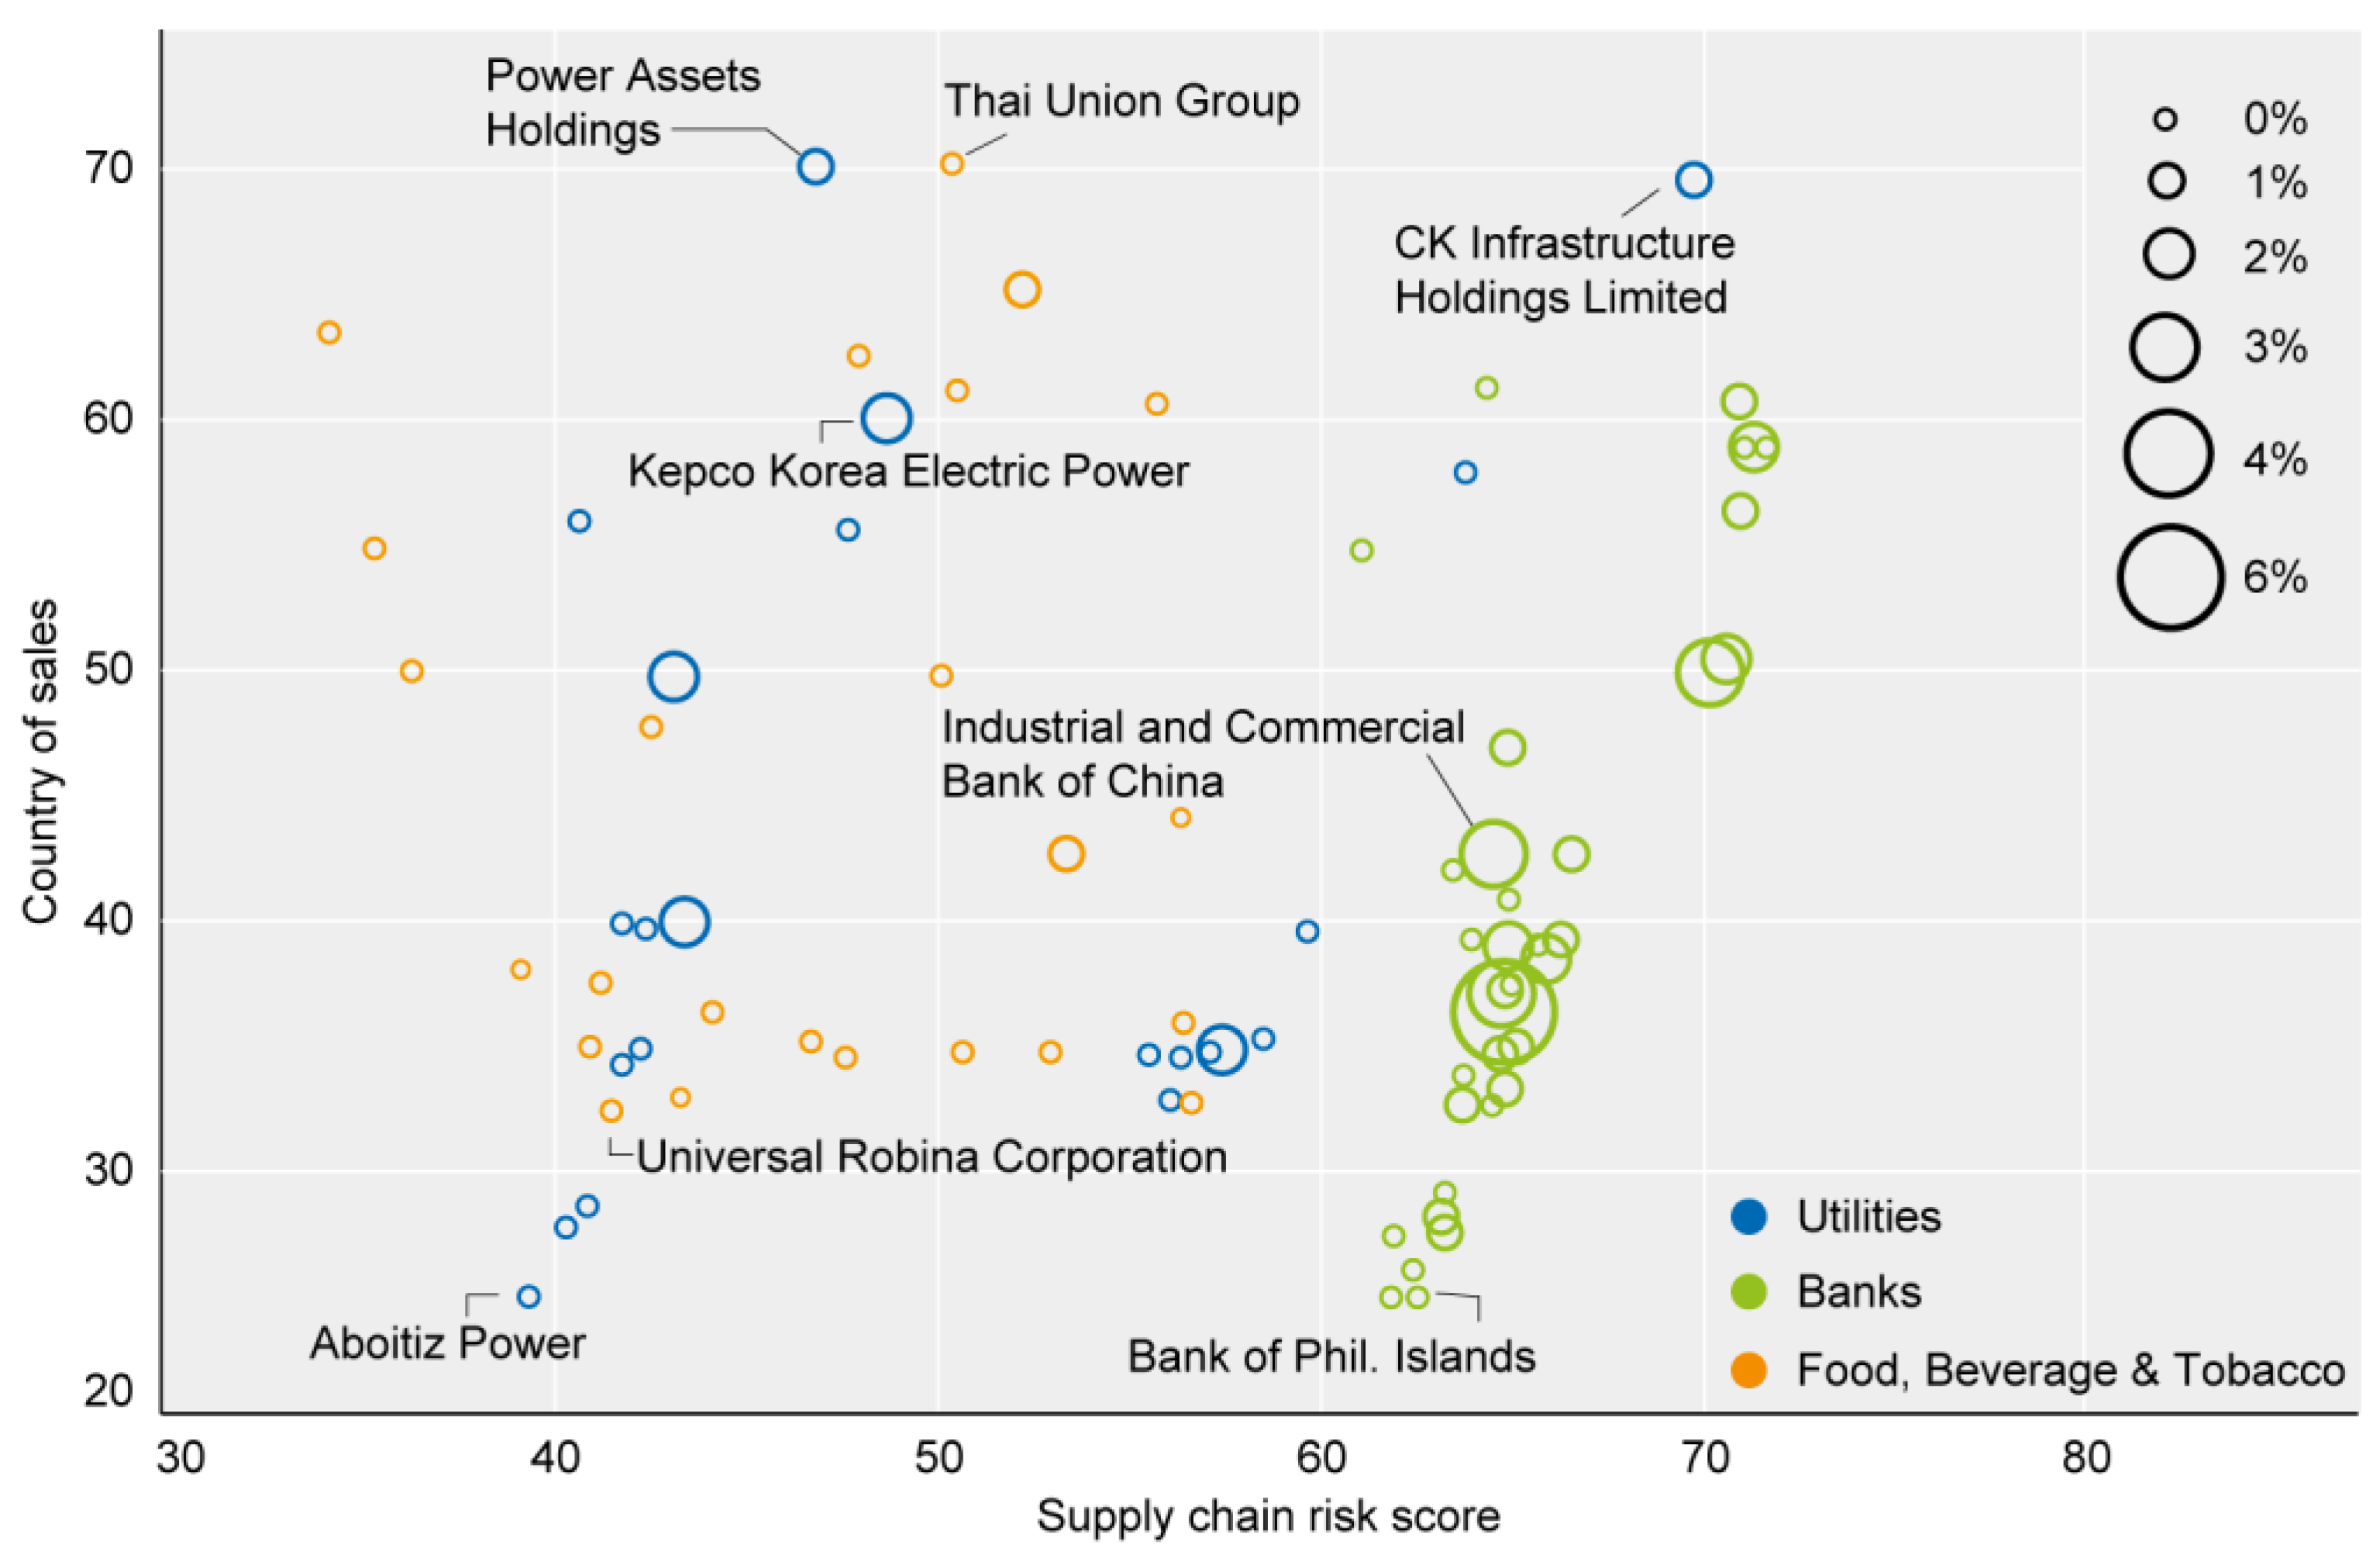

Table 1.
Size and growth rates of global population, GDP and financial assets.
| 1990 | 2000 | 2015 | 2020 Forecast | Increment 1990–2020 (compounded) | |
|---|---|---|---|---|---|
| Population 1 (billion) | 5.33 | 6.15 | 7.38 | 7.80 | +46% |
| +1.9% p.a. | +1.3% p.a. | +1.2% p.a. | +1.1% p.a. | +1.5% avg. p.a. | |
| GDP 2 (US$ billion) | 22,574 | 33,571 | 74,843 | 83,824 | +271% |
| +2.9% p.a. | +1.5% p.a. | +2.8% p.a. | +3% p.a. | ||
| Financial capital (US $ tr) | |||||
| Bain 3 | 200 | - | 750 | ||
| McKinsey 4 | 54 | 112 | 220 | 260 | +381% |
| +9% p.a. | - | +12.7% avg. p.a. | |||
| PwC 5 | - | 20–25 | 70–80 | - | - |
| IMF 6 | - | - | 292 | - | - |
Notes/Sources: 1 UN-DESA [8]; 2 World Bank [32]. 3 Bain [33] (all figures in 2010 US $, capital defined as including all tangible and non-tangible assets owned by all sectors, all financial assets such as securities, bonds and equity, as well as all financial assets in the form of leverage instruments and derivatives); 4 McKinsey [34] (capital defined as government and private debt, equity and bank deposits); 5 PwC [35]; 6 IMF [36] (capital defined as aggregate of stocks, bonds and bank assets).
© 2019 by the author. Licensee MDPI, Basel, Switzerland. This article is an open access article distributed under the terms and conditions of the Creative Commons Attribution (CC BY) license (http://creativecommons.org/licenses/by/4.0/).
Share and Cite
MDPI and ACS Style
Alaerts, G.J. Financing for Water—Water for Financing: A Global Review of Policy and Practice. Sustainability 2019, 11, 821. https://doi.org/10.3390/su11030821
AMA Style
Alaerts GJ. Financing for Water—Water for Financing: A Global Review of Policy and Practice. Sustainability. 2019; 11(3):821. https://doi.org/10.3390/su11030821
Chicago/Turabian StyleAlaerts, Guy J. 2019. "Financing for Water—Water for Financing: A Global Review of Policy and Practice" Sustainability 11, no. 3: 821. https://doi.org/10.3390/su11030821
Note that from the first issue of 2016, this journal uses article numbers instead of page numbers. See further details here.