Social Acceptability of Flood Management Strategies under Climate Change Using Contingent Valuation Method (CVM)

 , , and
Abstract
:1. Introduction
2. Materials and Methods
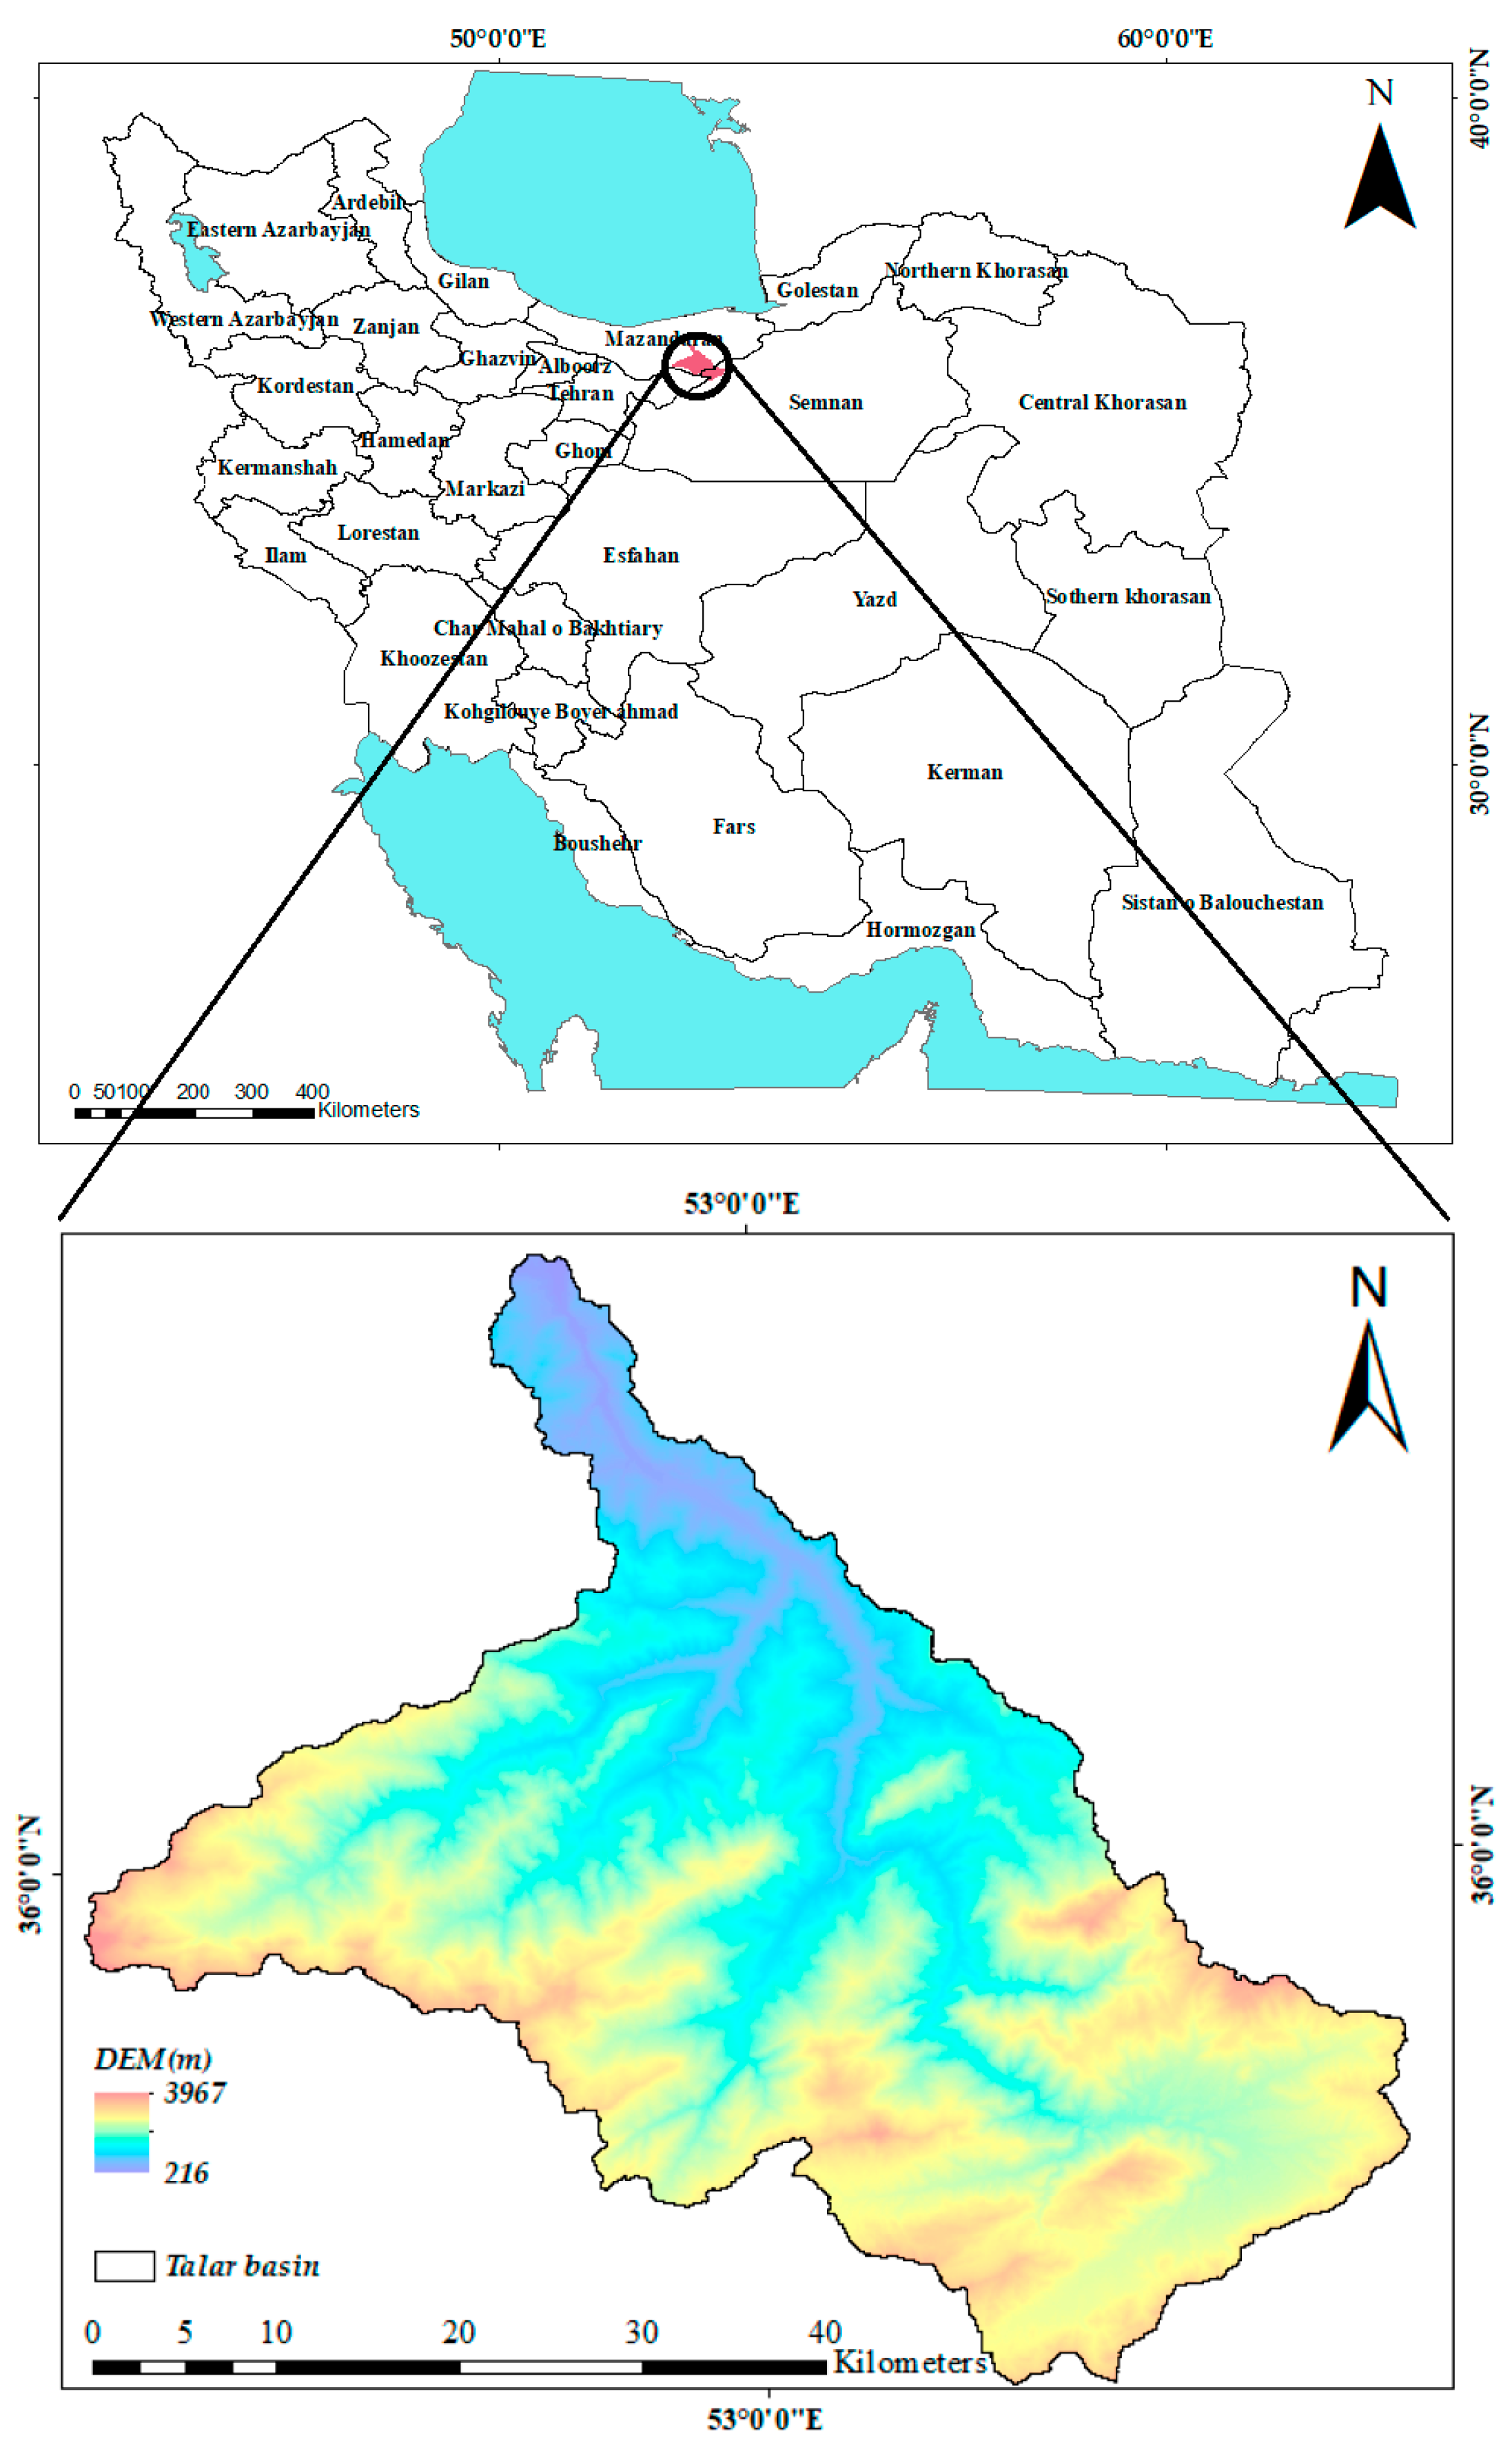
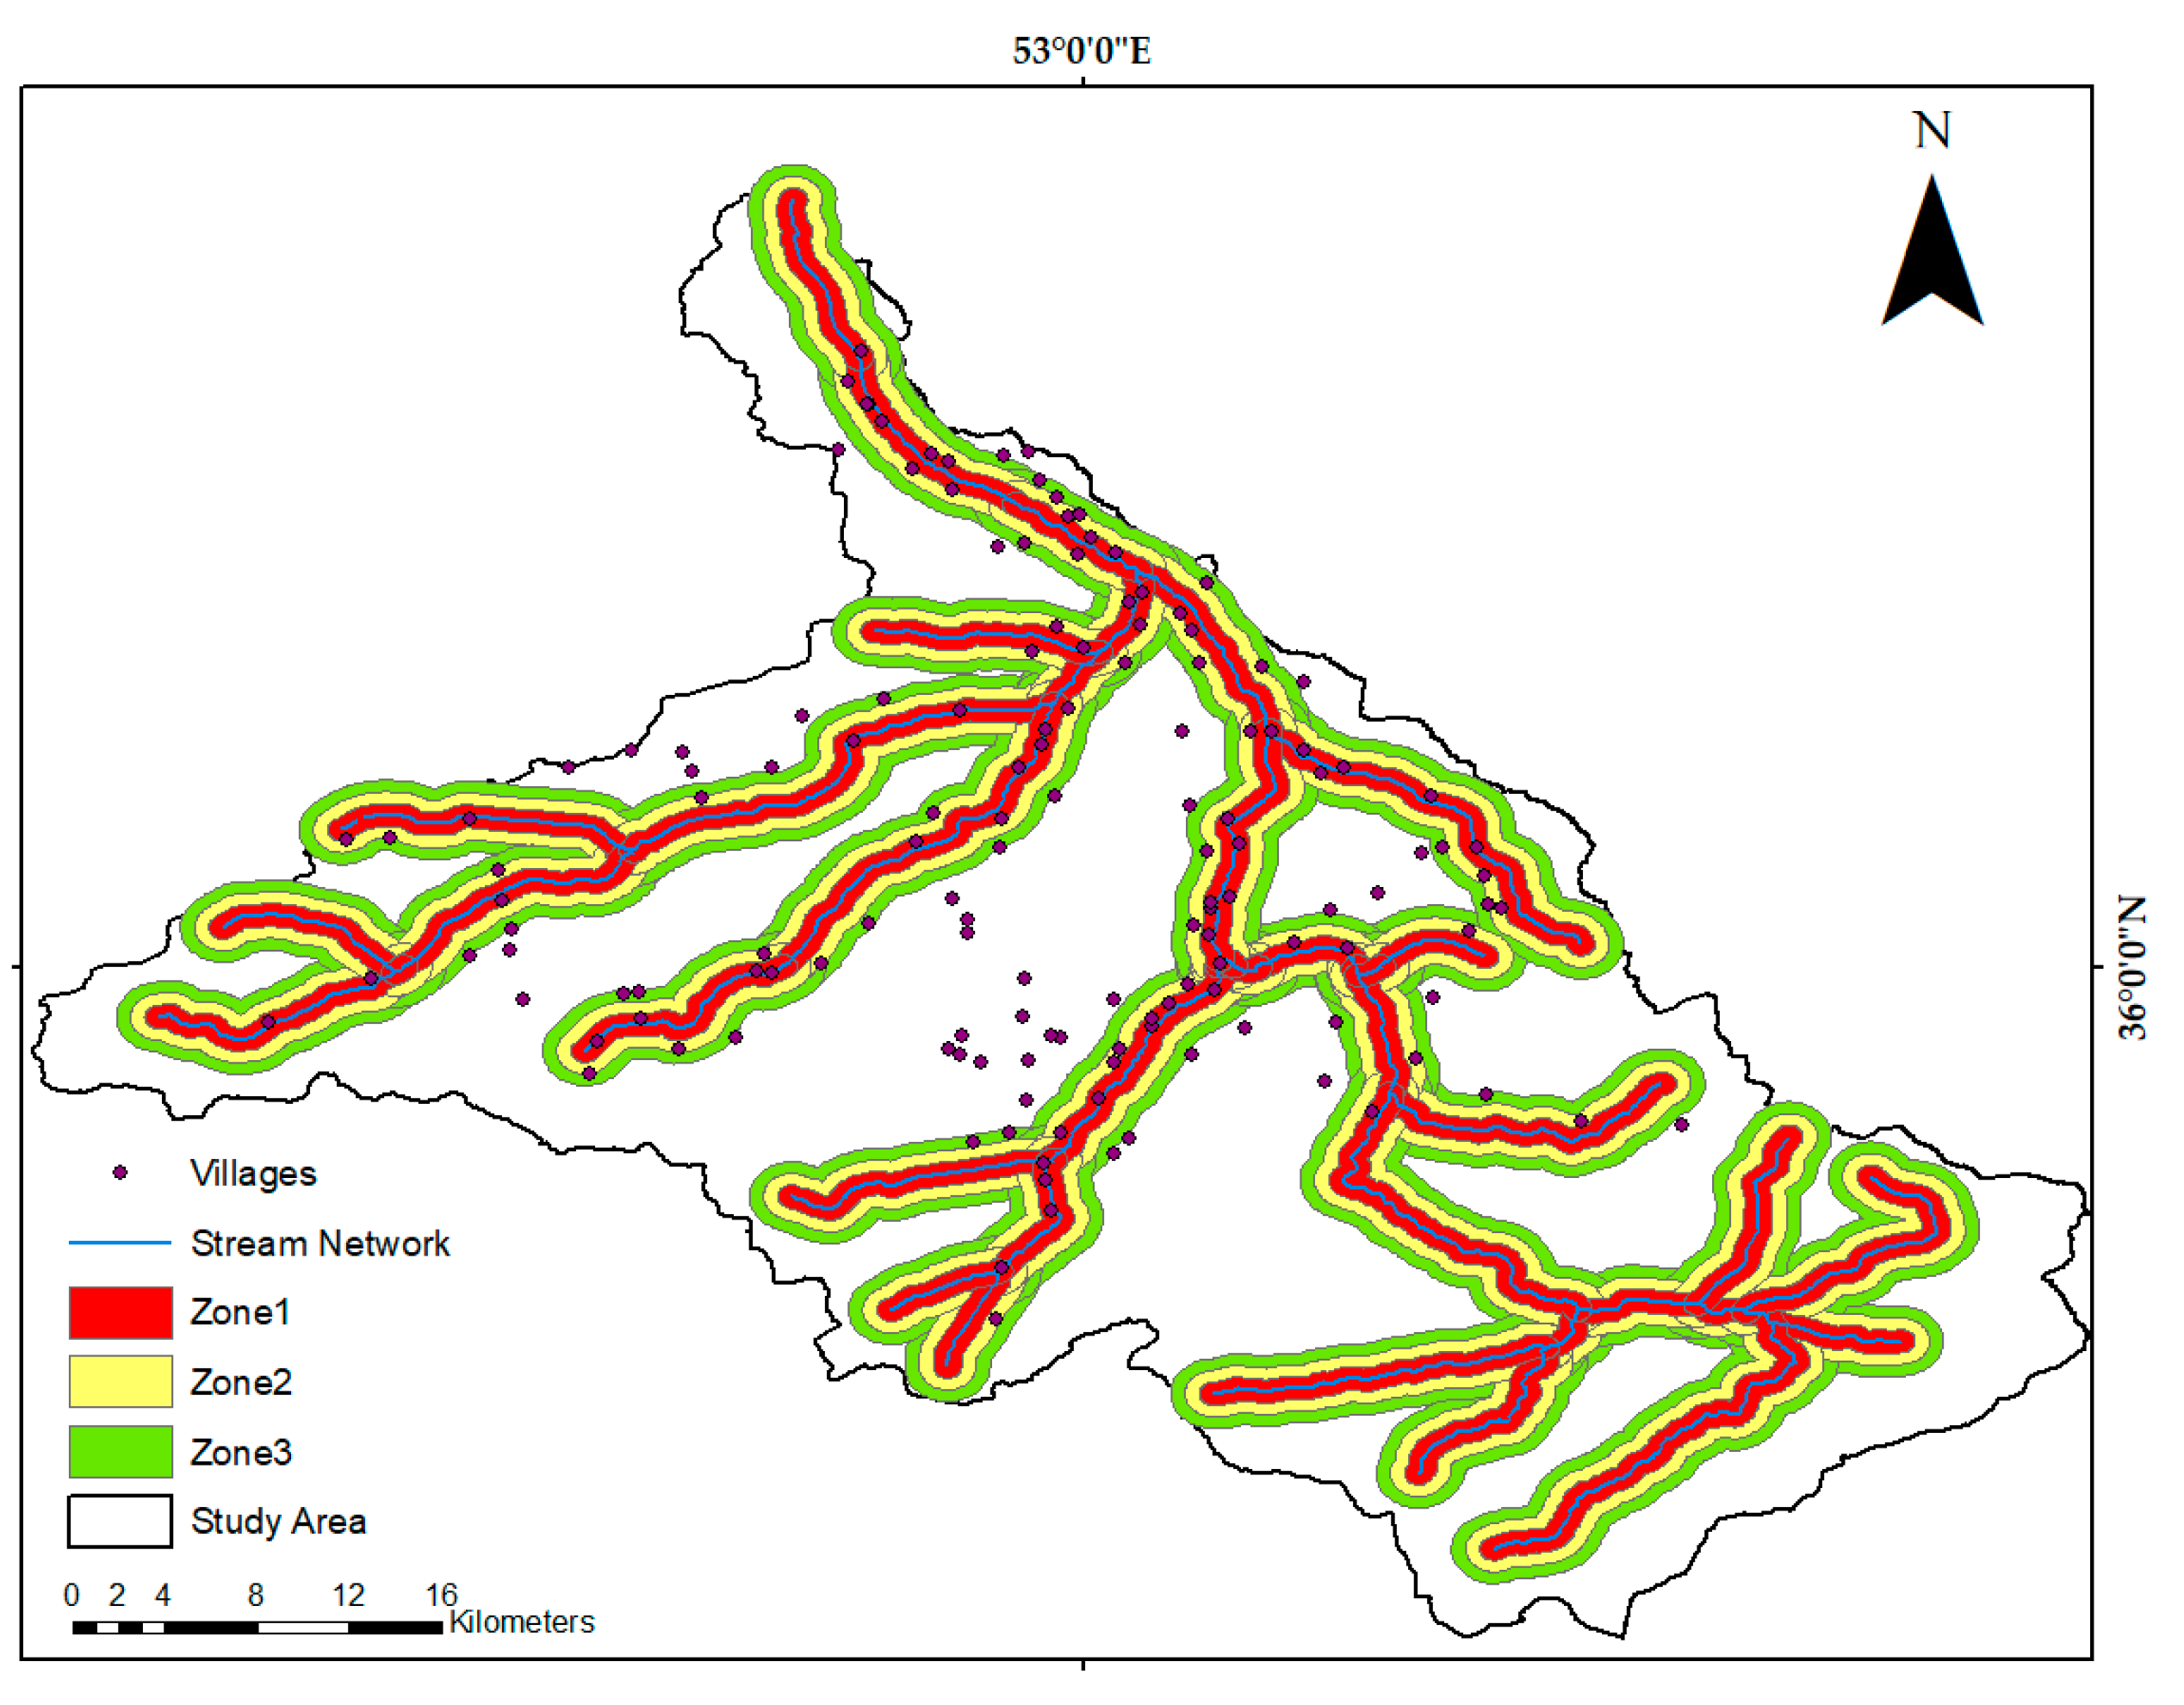
2.1. Study Area
2.2. Multi-Criteria Decision-Making
2.3. Analytical Network Process Questionnaire
2.4. Hydro-Climatic Modeling
2.5. Contingent Valuation Method
2.6. Contingent Valuation Method Questionnaire
3. Results and Discussion
3.1. Analytical Network Process Results
3.2. Contingent Valuation Method Results
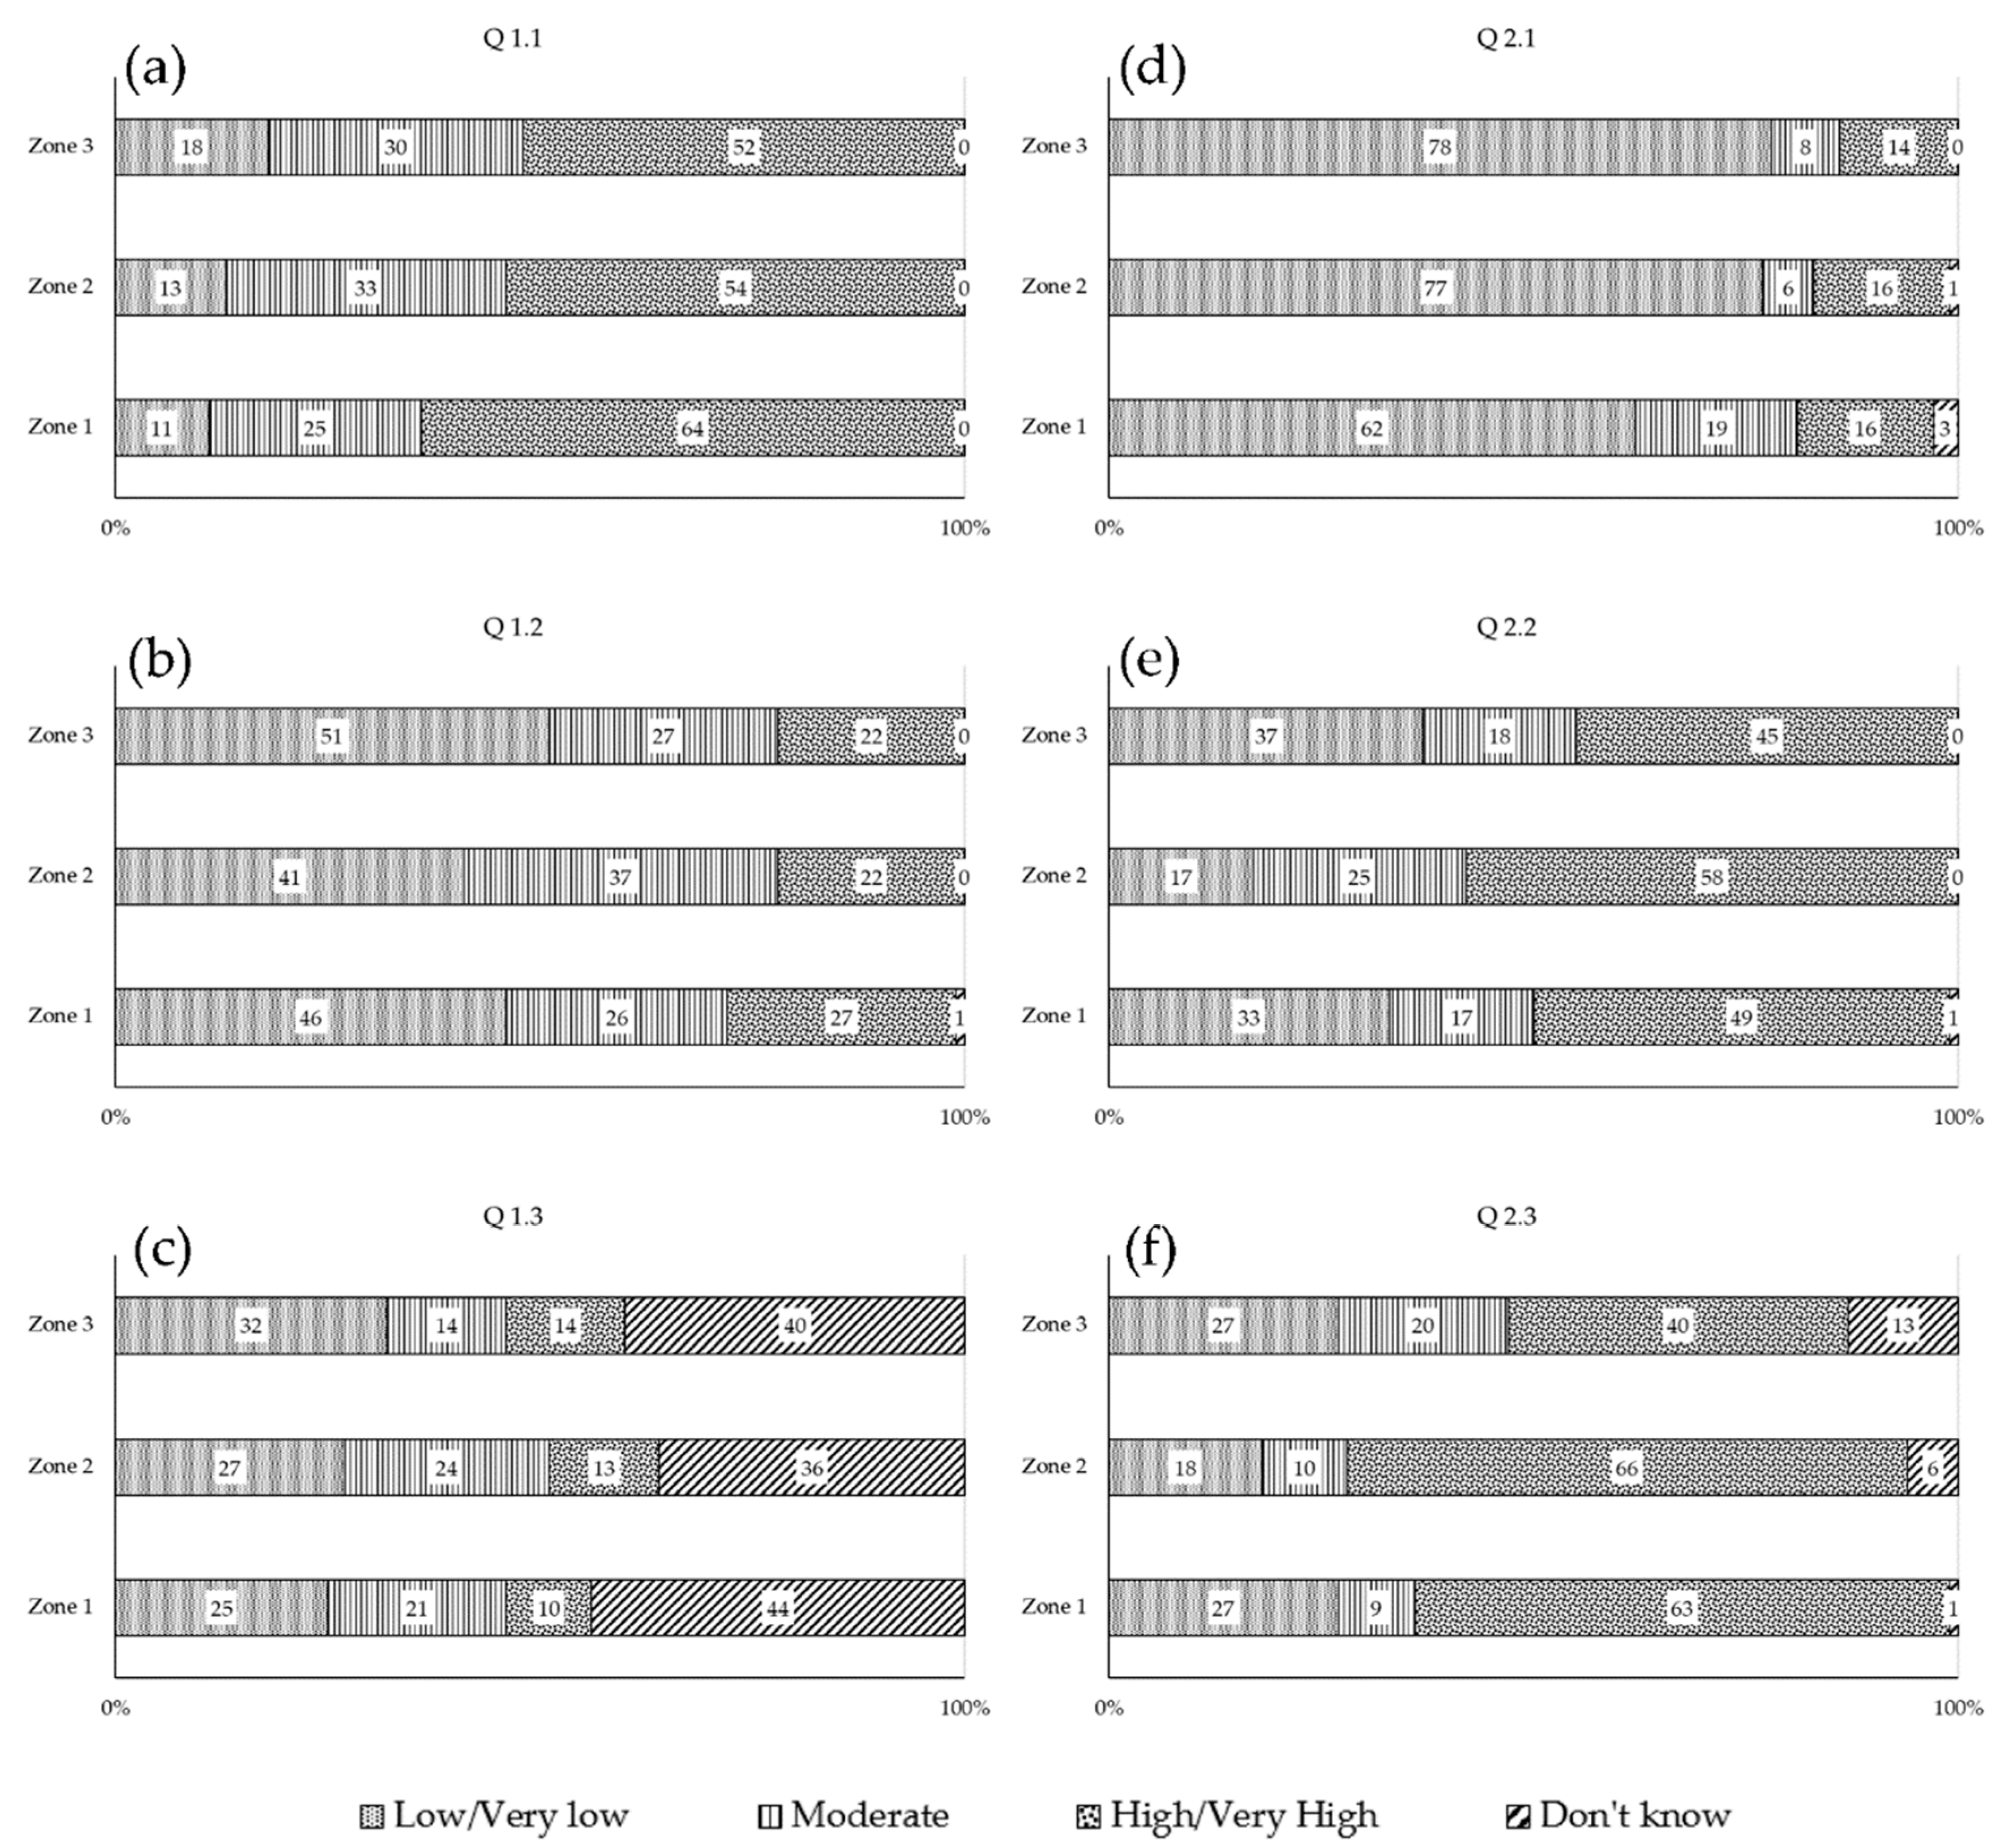
Respondents’ Attitudes
3.3. Inferential Results of WTP
4. Conclusions
Author Contributions
Funding
Acknowledgments
Conflicts of Interest
References
- Quintero, F.; Mantilla, R.; Anderson, C.; Claman, D.; Krajewski, W. Assessment of Changes in Flood Frequency Due to the Effects of Climate Change: Implications for Engineering Design. Hydrology 2018, 5, 19. [Google Scholar] [CrossRef]
- Maghsood, F.F.; Moradi, H.; Massah Bavani, A.R.; Panahi, M.; Berndtsson, R.; Hashemi, H. Climate Change Impact on Flood Frequency and Source Area in Northern Iran under CMIP5 Scenarios. Water 2019, 11, 273. [Google Scholar] [CrossRef]
- Arnell, N.; Berry, P.; Dodman, D.; Fankhauser, S.; Hope, C.; Kovats, S.; Nicholls, R.; Sattherwaite, D.; Tiffin, R.; Wheeler, T. Assessing the Costs of Adaptation to Climate Change: A Critique of the UNFCCC Estimates; Imperial College: London, UK, 2009; ISBN 9781843697459. [Google Scholar]
- Morid, S.; Massah Bavani, A.R. Exploration of potential adaptation strategies to climate change in the Zayandeh Rud irrigation system, Iran. The journal of the International Commission on Irrigation and Drainage 2010, 59, 226–238. [Google Scholar] [CrossRef]
- Devkota, R.P. Flood Adaptation Strategies under Climate Change in Nepal: A Socio-Hydrological Analysis; University of Southern Queensland: Toowoomba, QLD, Australia, 2014. [Google Scholar]
- Carraro, C.; Sgobbi, A.; Eni Enrico Mattei, F.; Alberini, A.; Bigano, A.; Bosello, F.; Breil, M.; Catenacci, M.; Chiabai, A.; Crimi, J.; et al. Climate Change Impacts and Adaptation Strategies In Italy: An Economic Assessment; Fondazione Eni Enrico Mattei: Milano, Italy, 2008. [Google Scholar]
- Chang, C.T. Risk-trading in flood management: An economic model. J. Environ. Manag. 2017, 200, 1–5. [Google Scholar] [CrossRef]
- Thomassin, A.; White, C.S.; Stead, S.S.; David, G. Social acceptability of a marine protected area: The case of Reunion Island. Ocean. Coast. Manag. 2010, 53, 169–179. [Google Scholar] [CrossRef] [Green Version]
- De Brito, M.M.; Evers, M. Multi-criteria decision-making for flood risk management: A survey of the current state of the art. Nat. Hazards Earth Syst. Sci. 2016, 16, 1019–1033. [Google Scholar] [CrossRef]
- Verlynde, N.; Voltaire, L.; Chagnon, P. Exploring the link between flood risk perception and public support for funding on flood mitigation policies. J. Environ. Plan. Manag. 2019, 1–22. [Google Scholar] [CrossRef]
- Zhai, G. Public preference and willingness to pay for flood risk reduction. In A Better Integrated Management of Disaster Risks: Toward Resilient Society to Emerging Disaster Risks in Mega-Cities; Ikeda, S., Fukuzono, T., Sato, T., Eds.; TERRAPUB: Tokyo, Japan, 2006; pp. 57–87. [Google Scholar]
- Fuks, M.; Chatterjee, L. Estimating the willingness to pay for a flood control project in Brazil using the Contingent Valuation Method. J. Urban Plan. Dev. 2008, 134, 42–52. [Google Scholar] [CrossRef]
- Liziński, T.; Wróblewska, A.; Rauba, K. Application of CVM method in the evaluation of flood control and water and sewage management projects. J. Water Land Dev. 2015, 24, 41–49. [Google Scholar] [CrossRef]
- Markantonis, V.; Bithas, K. The application of the contingent valuation method in estimating the climate change mitigation and adaptation policies in Greece. An expert-based approach. Environ. Dev. Sustain. 2010, 12, 807–824. [Google Scholar] [CrossRef]
- Yousefi, S.; Moradi, H.R.; Pourghasemi, H.R.; Khatami, R. Assessment of floodplain landuse and channel morphology within meandering reach of the Talar River in Iran using GIS and aerial photographs. Geocarto Int. 2018, 33, 1367–1380. [Google Scholar] [CrossRef]
- Brito, M.M.D. A Participatory Multi-Criteria Approach for Flood Vulnerability Assessment. Ph.D. Thesis, Universitäts-und Landesbibliothek Bonn, Bonn, Germany, 2018. [Google Scholar]
- Saaty, T.L. Fundamentals of the analytic network process. In Proceedings of the 5th International Symposium on the Analytic Hierarchy Process, Kobe, Japan, 12–14 August 1999. [Google Scholar]
- Saaty, T.L.; Vargas, L.G. Decision Making with the Analytic Network Process; Springer: New York, NY, USA, 2006. [Google Scholar]
- Saaty, R.W. Decision Making in Complex Environments. The Analytic Network Process (ANP) for Dependence and Feedback. Including a Tutorial for the SuperDecisions Software and Portions of the Encyclicon of Applications. 2016. Available online: https://superdecisions.com/sd_resources/v28_man02.pdf (accessed on 20 March 2019).
- Tussupova, K.; Berndtsson, R.; Bramryd, T.; Beisenova, R. Investigating willingness to pay to improve water supply services: Application of contingent valuation method. Water 2015, 7, 3024–3039. [Google Scholar] [CrossRef]
- Shang, Z.; Che, Y.; Yang, K.; Jiang, Y. Assessing local communities’ willingness to pay for river network protection: A contingent valuation study of Shanghai, China. Int. J. Environ. Res. Public Health 2012, 9, 3866–3882. [Google Scholar] [CrossRef] [PubMed]
- Lee, C.K.; Han, S.Y. Estimating the use and preservation values of national parks’ tourism resources using a contingent valuation method. Tour. Manag. 2002, 23, 531–540. [Google Scholar] [CrossRef]
- Ji, S.; Choi, Y.; Lee, C.K.; Mjelde, J.W. Comparing willingness-to-pay between residents and non-residents using a contingent valuation method: Case of the Grand Canal in China. Asia Pac. J. Tour. Res. 2018, 23, 79–91. [Google Scholar] [CrossRef]
- Duffield, J.W.; Patte, D.A. Inference and optimal design for a welfare measure in dichotomous choice contingent valuation. Land Econ. 1991, 67, 225–239. [Google Scholar] [CrossRef]
- Jin, M.; Juan, Y.; Choi, Y.; Lee, C.K. Estimating the preservation value of world heritage site using contingent valuation method: The case of the Li River, China. Sustainability 2019, 11, 1100. [Google Scholar] [CrossRef]
- Berrens, R.P.; Bohara, A.K.; Silva, C.L.; Brookshire, D.; Mckee, M. Contingent values for New Mexico instream flows: With tests of scope, group-size reminder and temporal reliability. J. Environ. Manag. 2000, 58, 73–90. [Google Scholar] [CrossRef]
- Markantonis, V.; Meyer, V.; Lienhoop, N. Evaluation of the environmental impacts of extreme floods in the Evros River basin using Contingent Valuation Method. Nat. Hazards 2013, 69, 1535–1549. [Google Scholar] [CrossRef]
- Amigues, J.P.; Boulatoff, C.; Desaigues, B.; Gauthier, C.; Keith, J.E. The benefits and costs of riparian analysis habitat preservation: A willingness to accept/willingness to pay contingent valuation approach. Ecol. Econ. 2002, 43, 17–31. [Google Scholar] [CrossRef]
- Modarres, R.; Sarhadi, A.; Burn, D.H. Changes of extreme drought and flood events in Iran. Glob. Planet. Chang. 2016, 144, 67–81. [Google Scholar] [CrossRef]
- Amirnejad, H.; Tonakbar, P. The willingness to pay for organic milk by consumers in Tehran. J. Agric. Sci. Technol. 2015, 17, 1685–1694. [Google Scholar]
- Vice Presidency Plan and Budget Organization Statistical Centre of Iran. Population and Housing Censuses; Statistical Center of Iran: Tehran, Iran, 2016; ISBN 9786004092425. (In Persian) [Google Scholar]
- Zhai, G.; Sato, T.; Fukuzono, T.; Ikeda, S.; Yoshida, K. Willingness To Pay for Flood Risk Reduction and Its Determinants in Japan1. J. Am. Water Resour. Assoc. 2006, 42, 927–936. [Google Scholar] [CrossRef]
- Loureiro, M.L.; McCluskey, J.J.; Mittelhammer, R.C. Will consumers pay a premium for eco-labeled apples. J. Consum. Aff. 2002, 36, 203–219. [Google Scholar] [CrossRef]
- Gracia, A.; de Magistris, T. The demand for organic foods in the South of Italy: A discrete choice model. Food Policy 2008, 33, 386–396. [Google Scholar] [CrossRef]
- Yahaya, I. Measuring Consumers’ Willingness to Pay for “Safer” Vegetables in Urban and Peri-Urban Ghana. Ph.D. Thesis, Kwame Nkrumah University of Science and Technology, Kumasi, Ghana, 2008. [Google Scholar]
- Brouwer, R.; Akter, S.; Brander, L.; Haque, E. Economic valuation of flood risk exposure and flood control in a severely flood prone developing country. J. Environ. Econ. Manag. 2006, 32, 251–270. [Google Scholar]
- Ogunjinmi, A.; Ogunjinmi, K.; Sunday, O.; Adekoya, O. Influence of Social Media on Climate Change Knowledge and Concerns. Nig. J. Agric. Food Environ. 2016, 12, 23–30. [Google Scholar]
- Aisha, T.S.; Wok, S.; Manaf, A.M.A.; Ismail, R. Exploring the Use of Social Media During the 2014 Flood in Malaysia. Procedia Soc. Behav. Sci. 2015, 211, 931–937. [Google Scholar] [CrossRef] [Green Version]


| Criteria | Description of Strategies (Sub-Criteria) |
|---|---|
| Structural (C1) | (S11): Dams and reservoirs (S12): Construction standards and building codes (S13): Flood relief channels (S14): River restoration (S15): Embankments |
| Non-structural (C2) | (S21): Rising public awareness (S22): Agricultural management and planning (S23): Flood forecasting and warning (S24): Flood insurance or compensation |
| Combination of structural and non-structural (C3) | (S31): Watershed management practices (S32): Land use policy, planning, zoning, and regulation (S33): Flood spreading systems |
| Section 1: Respondents’ Perception of Climate Change and Its Impacts | |
| Q 1.1 | How much do you feel temperature has changed over the past years? |
| Q 1.2 | How much do you feel extreme rainfall has changed over the past years? |
| Q 1.3 | How much are you aware of the climate change and its impacts? |
| Section 2: Respondents’ Perception of Flood Risk and Management | |
| Q 2.1 | How much has floods affected your family over the past years? |
| Q 2.2 | What is your concern about the flood risk in your area? |
| Q 2.3 | Do you think flood control plans are effective to reduce flood risks? |
| Factors | Category |
|---|---|
| Gender | Male/ Female |
| Education Level | Illiterate/Elementary degree/Middle school degree 1/High school degree/College degree 2/Bachelor’s degree/Master or Ph.D. degree. |
| Occupation | Office work/Labor/Military/Farmer/Cattle farmer/Private business/ Other |
| Income level (Monthly) | <10, 10–20, 20–30, 30 < (Million Rials) |
| Age | <30, 30–40, 40–50, 50 < |
| Key Character | Specification | Frequency (%) |
|---|---|---|
| Gender | Male | 75 |
| Female | 25 | |
| Age (Year) | <30 | 10 |
| 30–35 | 25 | |
| 35–40 | 40 | |
| >40 | 25 | |
| Work experience (Year) | <5 | 20 |
| 5 to 10 | 50 | |
| 10 to 15 | 30 | |
| Education level (degree) | PhD | 50 |
| Master | 40 | |
| Bachelor | 10 |
| Criteria and Sub-Criteria | Weight | Rank | |
|---|---|---|---|
| Criteria | Structural (C1) | 0.25 | 3 |
| Non-structural (C2) | 0.33 | 2 | |
| Combination of structural and non-structural (C3) | 0.41 | 1 | |
| Sub-criteria structural | (S11): Dams and reservoirs | 0.09 | 5 |
| (S12): Construction standards and building codes | 0.24 | 2 | |
| (S13): Flood relief channels | 0.11 | 4 | |
| (S14): River restoration | 0.33 | 1 | |
| (S15): Embankments | 0.20 | 3 | |
| Sub-criteria non-structural | (S21): Rising public awareness | 0.29 | 2 |
| (S22): Agricultural management and planning | 0.34 | 1 | |
| (S23): Flood forecasting and warning | 0.19 | 3 | |
| (S24): Flood insurance or compensation | 0.16 | 4 | |
| Sub-criteria combination of structural and non-structural | (S31): Watershed management practices | 0.46 | 1 |
| (S32): Land use policy, planning, zoning and regulation | 0.34 | 2 | |
| (S33): Flood spreading systems | 0.14 | 3 | |
| Bid (Rials) | Response | Zone 1 (%) | Zone 2 (%) | Zone 3 (%) |
|---|---|---|---|---|
| 80,000 | Yes | 35 | 21 | 11 |
| No | 65 | 79 | 89 | |
| 160,000 | Yes | 12 | 7 | 3 |
| No | 88 | 93 | 97 | |
| 40,000 | Yes | 18 | 17 | 7 |
| No | 82 | 83 | 93 | |
| Maximum (Rials) | >160,000 | 4 | 2 | 2 |
| Response | Zone 1 (%) | Zone 2 (%) | Zone 3 (%) |
|---|---|---|---|
| Yes | 44 | 48 | 52 |
| No | 56 | 52 | 48 |
| Days (Day/Month) | Zone 1 (%) | Zone 2 (%) | Zone 3 (%) |
|---|---|---|---|
| One | 21 | 22 | 14 |
| Two | 33 | 45 | 45 |
| Three | 16 | 12 | 27 |
| Four | 12 | 4 | 6 |
| Five | 19 | 16 | 8 |
| Reason | Zone 1 (%) | Zone 2 (%) | Zone 3 (%) |
|---|---|---|---|
| It is a government responsibility | 34 | 41 | 70 |
| I don’t think these measures are necessary | 1 | 2 | 0 |
| I have economic problems | 18 | 23 | 26 |
| Other reasons | 47 | 34 | 4 |
| Characters | Categories | Zone 1 (%) | Zone 2 (%) | Zone 3 (%) |
|---|---|---|---|---|
| Gender | Male | 80 | 85 | 70 |
| Female | 20 | 15 | 30 | |
| Education Level | Illiterate | 5 | 2 | 5 |
| Elementary degree | 10 | 8 | 11 | |
| Middle school degree | 16 | 12 | 8 | |
| High school degree | 33 | 44 | 44 | |
| College degree | 9 | 12 | 11 | |
| Bachelor degree | 20 | 19 | 19 | |
| Master and Ph.D. degree | 7 | 3 | 2 | |
| Occupation | Office work | 17 | 18 | 16 |
| Labor | 16 | 21 | 10 | |
| Military | 0 | 1 | 0 | |
| Farmer | 15 | 15 | 11 | |
| Cattle farmer | 5 | 2 | 0 | |
| Private business | 40 | 42 | 62 | |
| Other | 7 | 1 | 1 | |
| Income (Million Rials) | <10 | 18 | 19 | 28 |
| 10 to 20 | 44 | 42 | 45 | |
| 20 to 30 | 25 | 31 | 22 | |
| >30 | 13 | 8 | 5 | |
| Age | <30 | 27 | 26 | 21 |
| 30–40 | 23 | 28 | 27 | |
| 40–50 | 24 | 19 | 27 | |
| >50 | 26 | 27 | 25 |
| Variables Name | Zone 1 a | Zone 2 b | Zone 3 c | |||||||||
|---|---|---|---|---|---|---|---|---|---|---|---|---|
| Coefficient | T-Statistic | Elasticity in Mean | Marginal Effect | Coefficient | T-Statistic | Elasticity in Mean | Marginal Effect | Coefficient | T-Statistic | Elasticity in Mean | Marginal Effect | |
| Bid | −0.135 × 10⁻⁴ | −2.31 ** | −0.683 | −0.29 × 10⁻⁵ | −0.189 × 10⁻⁴ | −2.616 ** | −0.96 | −0.347 × 10⁻⁵ | −0.267 × 10⁻⁴ | −2.064 ** | −1.31 | −0.16 × 10⁻⁵ |
| Age | −0.0162 | −0.953 | −0.461 | −0.00348 | −0.0113 | −0.617 | −0.36 | −0.00208 | −0.0516 | −1.543 * | −2.052 | −0.0031 |
| Gender | 0.728 | 0.838 | 0.534 | 0.156 | 0.354 | 0.266 | 0.274 | −0.0649 | −0.0989 | 0.095 | 0.0997 | 0.594 × 10⁻² |
| Education | −0.0607 | −0.408 | 0.176 | −0.013 | 0.142 | 0.666 | 0.462 | 0.0261 | −0.257 × 10⁻⁴ | −0.845 | −1.009 | −0.0154 |
| Income | 0.150 × 10⁻⁶ | 4.425 *** | 2.197 | 0.323 × 10⁻⁷ | 0.165 × 10⁻⁶ | 4.302 *** | 2.343 | 0.303 × 10⁻⁷ | 0.274 × 10⁻⁶ | 4.224 *** | 3.92 | 0.165 × 10⁻⁷ |
| C-WTP 1 | |||
| Zone 1 | Zone 2 | Zone 3 | |
| Number of households in zone [31] | 772 | 1119 | 639 |
| WTP (per month) | 122,700 | 47,500 | 38,500 |
| WTP (per year) | 1,472,304 | 570,072 | 462,444 |
| Total C-WTP in zone (million Rials) (~) | 1,137 | 638 | 295 |
| Nc-WTP 2 | |||
| Zone 1 | Zone 2 | Zone 3 | |
| Number of respondents | 100 | 100 | 100 |
| Number of labor days | 118 | 121 | 127 |
| Average of respondents | 14.16 | 14.52 | 15.24 |
| Average income (Rials/day) | 505,627 | 505,627 | 505,627 |
| Total Nc-WTP in zone (million Rials) | 5527 | 8215 | 4924 |
| Total WTP (C-WTP and Nc-WTP) in zone (million Rials) | 6664 | 8853 | 5219 |
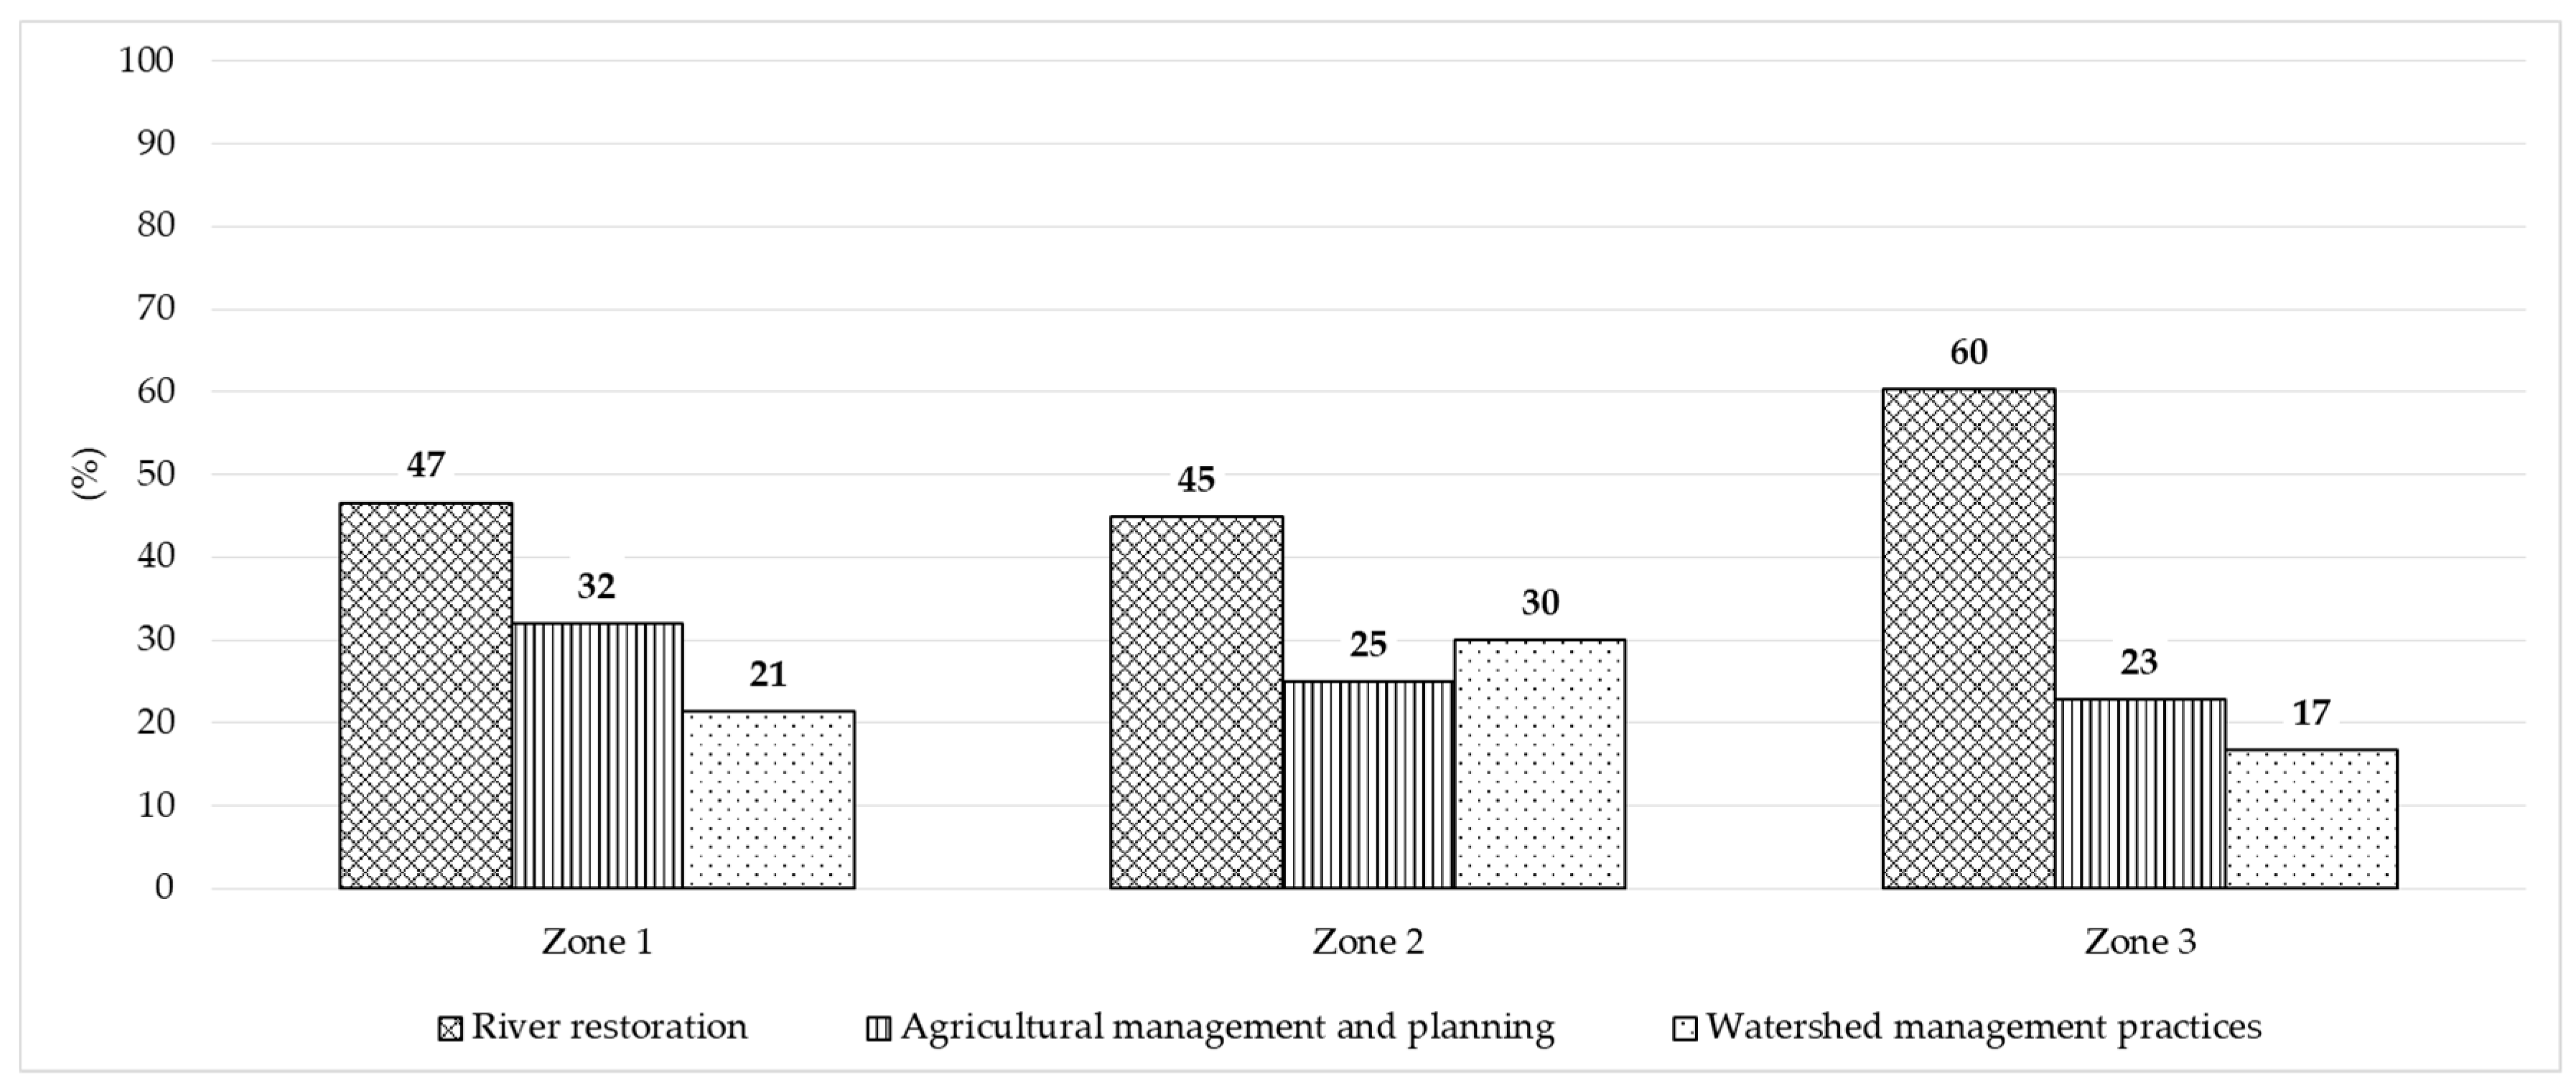
| Flood Management Strategies | Zone 1 | Zone 2 | Zone 3 | |||
|---|---|---|---|---|---|---|
| % | Million Rials | % | Million Rials | % | Million Rials | |
| River restoration | 47 | 3,132 | 45 | 4,161 | 60 | 2,453 |
| Agricultural management and planning measures | 32 | 2,132 | 25 | 2,833 | 23 | 1,670 |
| Watershed management measures | 21 | 1,399 | 30 | 1,859 | 17 | 1,096 |
| Total WTP | 100 | 6,663 | 100 | 8,853 | 100 | 5,219 |
© 2019 by the authors. Licensee MDPI, Basel, Switzerland. This article is an open access article distributed under the terms and conditions of the Creative Commons Attribution (CC BY) license (http://creativecommons.org/licenses/by/4.0/).
Share and Cite
Maghsood, F.F.; Moradi, H.; Berndtsson, R.; Panahi, M.; Daneshi, A.; Hashemi, H.; Bavani, A.R.M. Social Acceptability of Flood Management Strategies under Climate Change Using Contingent Valuation Method (CVM). Sustainability 2019, 11, 5053. https://doi.org/10.3390/su11185053
Maghsood FF, Moradi H, Berndtsson R, Panahi M, Daneshi A, Hashemi H, Bavani ARM. Social Acceptability of Flood Management Strategies under Climate Change Using Contingent Valuation Method (CVM). Sustainability. 2019; 11(18):5053. https://doi.org/10.3390/su11185053
Chicago/Turabian StyleMaghsood, Fatemeh Fadia, Hamidreza Moradi, Ronny Berndtsson, Mostafa Panahi, Alireza Daneshi, Hossein Hashemi, and Ali Reza Massah Bavani. 2019. "Social Acceptability of Flood Management Strategies under Climate Change Using Contingent Valuation Method (CVM)" Sustainability 11, no. 18: 5053. https://doi.org/10.3390/su11185053