The Balance of Individual and Infrastructure Values in Decisions Regarding Advanced Science and Technology
by
 ,
,
Shunichi Hienuki
1,*, 
Kazuhiko Noguchi
1,
Tadahiro Shibutani
1,
Takahiro Saigo
2 and
Atsumi Miyake
3 1
Center for Creation of Symbiosis Society with Risk, Yokohama National University, 79-5 Tokiwadai, Hodogaya-ku, Yokohama 240-8501, Japan
2
Mitsubishi Research Institute, Inc., 2-10-3, Nagatacho, Chiyoda-ku, Tokyo 100-8141, Japan
3
Institute of Advanced Sciences, Yokohama National University, 79-5 Tokiwadai, Hodogaya-ku, Yokohama 240-8501, Japan
*
Author to whom correspondence should be addressed.
Sustainability 2019, 11(12), 3385; https://doi.org/10.3390/su11123385
Submission received: 12 April 2019
/
Revised: 11 June 2019
/
Accepted: 13 June 2019
/
Published: 19 June 2019
(This article belongs to the Collection Advanced Methodologies for Sustainability Assessment: Theory and Practice)
Abstract
:A country’s scientific technology policy rarely reflects public opinion. In this study, we created a hierarchical model of societal well-being, comprising five value components for both individual and infrastructure well-being, to analyze the balance among these values. We conducted a survey in two stages; first, both individual and infrastructure well-being were investigated, and then the weights between pairs of value categories composing individual and infrastructure well-being were scored to assess which categories were most important. The analysis of the first stage used the score magnitudes, while that of the second stage used the analytic hierarchy process. The results showed that people value individual well-being more than infrastructure well-being. For both types of well-being, values related to the economy and safety were ranked as more important than the other values, but the weights were distributed over all value components. For individual well-being, the most important value category was the one related to safety, while for infrastructure well-being, it was economy. Therefore, people prioritize different values for themselves and for society as a whole. This suggests that when making decisions regarding technology, it is necessary to understand its effects on all fields and consider the balance between the value categories of well-being.
1. Introduction
Advanced science and technology, such as hydrogen-energy technology and autonomous driving systems, are usually introduced to make individuals and societies happier. However, as these technologies can produce both negative and positive effects, the balance between them must be considered. Furthermore, today’s society links different entities in complex and organic ways, and the solution to a problem or an optimization in one sector does not necessarily lead to optimization in all sectors. For example, if new regulations and laws were established to ensure the safety of a hydrogen refilling station, their influence would not be limited to the hydrogen-energy system but would also affect the safety, economy, and environment of other energy systems. Therefore, while making policies or decisions related to innovative research, the effects on all sectors should be considered and studied systematically.
Several attempts have been made to measure sustainability and well-being by considering both the individual and infrastructure from multiple viewpoints. Beginning with the triple bottom line [1], which considers the three aspects of environment, society, and economy, Stiglitz [2] proposed 12 components required for the future. More recently, the United Nations [3] established 17 sustainable development goals (SDGs). These include new areas, such as climate change and economic inequality, innovation, sustainable consumption, peace, and justice, as priority issues. To achieve one goal, it is necessary to tackle problems related to other goals, and it is assumed that all goals are interconnected. Moreover, although multifaceted analyses and evaluations are required for policy and scientific technology, it is unclear how individuals weigh the importance of each of the component values. This is because, at the initial stages of a science and technology policy, ordinary people do not have enough knowledge or information about the technology under consideration. Furthermore, large-scale surveys should contain appropriate information about the technology being considered to allow participants to learn about it. This necessarily incurs a large cost in terms of time and money, and thus is not realistic to perform a survey for every scientific technology. Also, at this stage, the final decision-maker must use subjective information while paying close attention to objective information based on numerical and scientific data [4].
Under such preconditions, hierarchy is involved in the method of organizing subjective and qualitative information [5,6]. The analytic hierarchy process (AHP) is a method of evaluating scientific technology by considering multiple indicators. It is used in many decision-making situations, especially in the environment, energy, and construction fields [7,8]. The AHP was first proposed by Saaty [9], and it can quantitatively explain people’s subjective views and simultaneously consider many evaluation categories and criteria. In addition, the AHP contributed risk assessment, and therefore, can be used to resolve problems with project management [10,11,12] and supply chains [13,14]. Many of the studies on AHP provide information that contributes to useful decision-making during the planning and implementation stages of technology adoption.
Several weight analyses of values targeting environment/energy technology have been conducted in various countries [8,9,10,11,12,13,14]. However, these studies are focused on specific fields of science and technology, and there are few analyses on the values of individuals and infrastructure in daily life.
As such, the purpose of this research is to analyze the relative weights of values for the components of individual and infrastructure well-being to ensure a balanced formulation and decision-making in scientific technology policy. Specifically, we will provide a definition of total well-being, improve the value hierarchies used by Kinehara et al. [15] and Noguchi [16], and clarify the weights of individual and infrastructure values that applied to the majority of people who participated in our survey in 2015. Furthermore, by analyzing the weights of individual and infrastructure values, we will elucidate the difference in values prioritized by individuals when they make decisions from the perspectives of either their personal lives (microscopic) or infrastructure (macroscopic).
2. Literature Review
2.1. Well-Being Index and Related Research
A famous usage of well-being was the definition of health as recognized by the World Health Organization [17]. In recent years, this concept of well-being has been introduced into comprehensive indicators beyond economic indicators such as GDP for a sustainable society [3,18,19]. For example, one of the representative indicators is the Better Life Index created by the Organization for Economic Co-operation and Development [20]. This index consisted of 11 indicators: housing, income, jobs, community, education environment, civic engagement, health, life satisfaction, safety, and work-life balance [21]. In addition, Legatum Institute [22] was configured using the nine indices: economic quality, business environment, governance, education, health, safety and security, personal freedom, social capital, and natural environment. Both surveys and analyses are systems in which users move their rankings by weighting, and it is left to individual value judgments as to which index is important. In addition, several analyses on ranking using a mathematical programming model that dealt with these multiple indicators were addressed [23,24,25].
Well-being is addressed not only in the above-mentioned society-wide perspective but also in individual perspectives in several fields. For example, in the health and medical fields, studies on well-being have been conducted for a relatively long time [26,27,28,29]. The concept is also employed in work and education environments at the levels of individuals and small-scale organizations [30,31]. Furthermore, many studies have shed light on aspects of college life for students including their health, learning, and so on [32,33,34], and research and analysis has been conducted [35,36]. On the other hand, it has also been shown that such well-being values differ greatly depending on country, region, culture, etc. [37,38].
In the Japanese context, Shibuya et al. [39] suggested the limitations of quantitative indicators, including gross domestic product (GDP), through changes in the socio-economic environment, and discussed the concept of happiness as conceptualized by individuals, the government, and corporations. Further, through large-scale surveys, Tsutsui et al. [40] elucidated which criteria determine happiness (values). With such research on happiness, well-being, and the values of ordinary people as a background, Kinehara et al. [15] and Noguchi [16] suggested that even if individual and infrastructure well-being is measured by combining objective indicators, the measure does not concur with people’s feelings. For example, GDP, CO2 emissions, the unemployment rate, and so on, are often used as objective indicators. However, if we measure individual and infrastructure well-being by combining the statistical data on these indicators, values such as the uncertainty of individuals’ well-being cannot be measured. In addition, optimal individual life models using specific indicators, such as the economy or safety, could possibly cause people to report their values in a more limited, and therefore, inaccurate way. Against this background, they constructed a hierarchical infrastructure model composed of 10 components that measured the uncertainties associated with individuals and analyzed relative values held by individuals using the AHP.
Based on the reviews above, judgment of the important indicator differs depending on the individual and position, and it is important for decision-makers or stakeholders to consider the individual (subjective) value to discuss social priorities.
2.2. Technology Assessment Using the Analytic Hierarchy Process
The AHP was commonly used for decision-making and risk assessment between technology and society. In this section, we conducted a literature review that dealt with the relationship between new technology and society. For example, Scannapieco [41] combined environmental burden information from the life cycle assessment (LCA) with the AHP to evaluate seven power-generation technologies using multiple indicators of environmental effects. As an example of analysis using indicators from different fields, Kablan [42], taking Jordan as a case study, used indicators, such as satisfying basic energy demand, economic growth, clean environment, and greater utilization of renewable energy, to analyze energy demand, showing the effectiveness of the AHP for policy decision-making. In a study on Turkey’s regional energy project, Erol and Kılkış [43] determined the priorities among economy, technology, the public, and the environment from five perspectives: industry, public authorities, local residents, academics, and environmentalists. In their study on Italy’s hydropower plant project, Rosso et al. [44] incorporated evaluations from 42 stakeholders with respect to environmental, economic, technical, and sociopolitical indicators. Stein [7] compared nine main power-generation technologies, including five types of renewable energy, using financial, technical, environmental, and socio-economic-political indicators and future scenarios. Ahmad and Tahar [45] evaluated Malaysia’s four renewable energy production technologies in terms of their technical, economic, social, and environmental aspects. Väisänen et al. [46] performed a weighting of the values placed on technological, economic, social, environmental, and institutional fields for distributed power in Finland. Thus, researchers have used the AHP to perform comprehensive evaluations incorporating the viewpoints of multiple fields and stakeholders, and the effectiveness of the AHP has been demonstrated. However, many of these studies focus on social infrastructure and social functions, and only a few of them target personal well-being indicators without distinguishing between individual and social infrastructure indicators.
3. Materials and Methods
3.1. Hierarchical Model of Well-Being
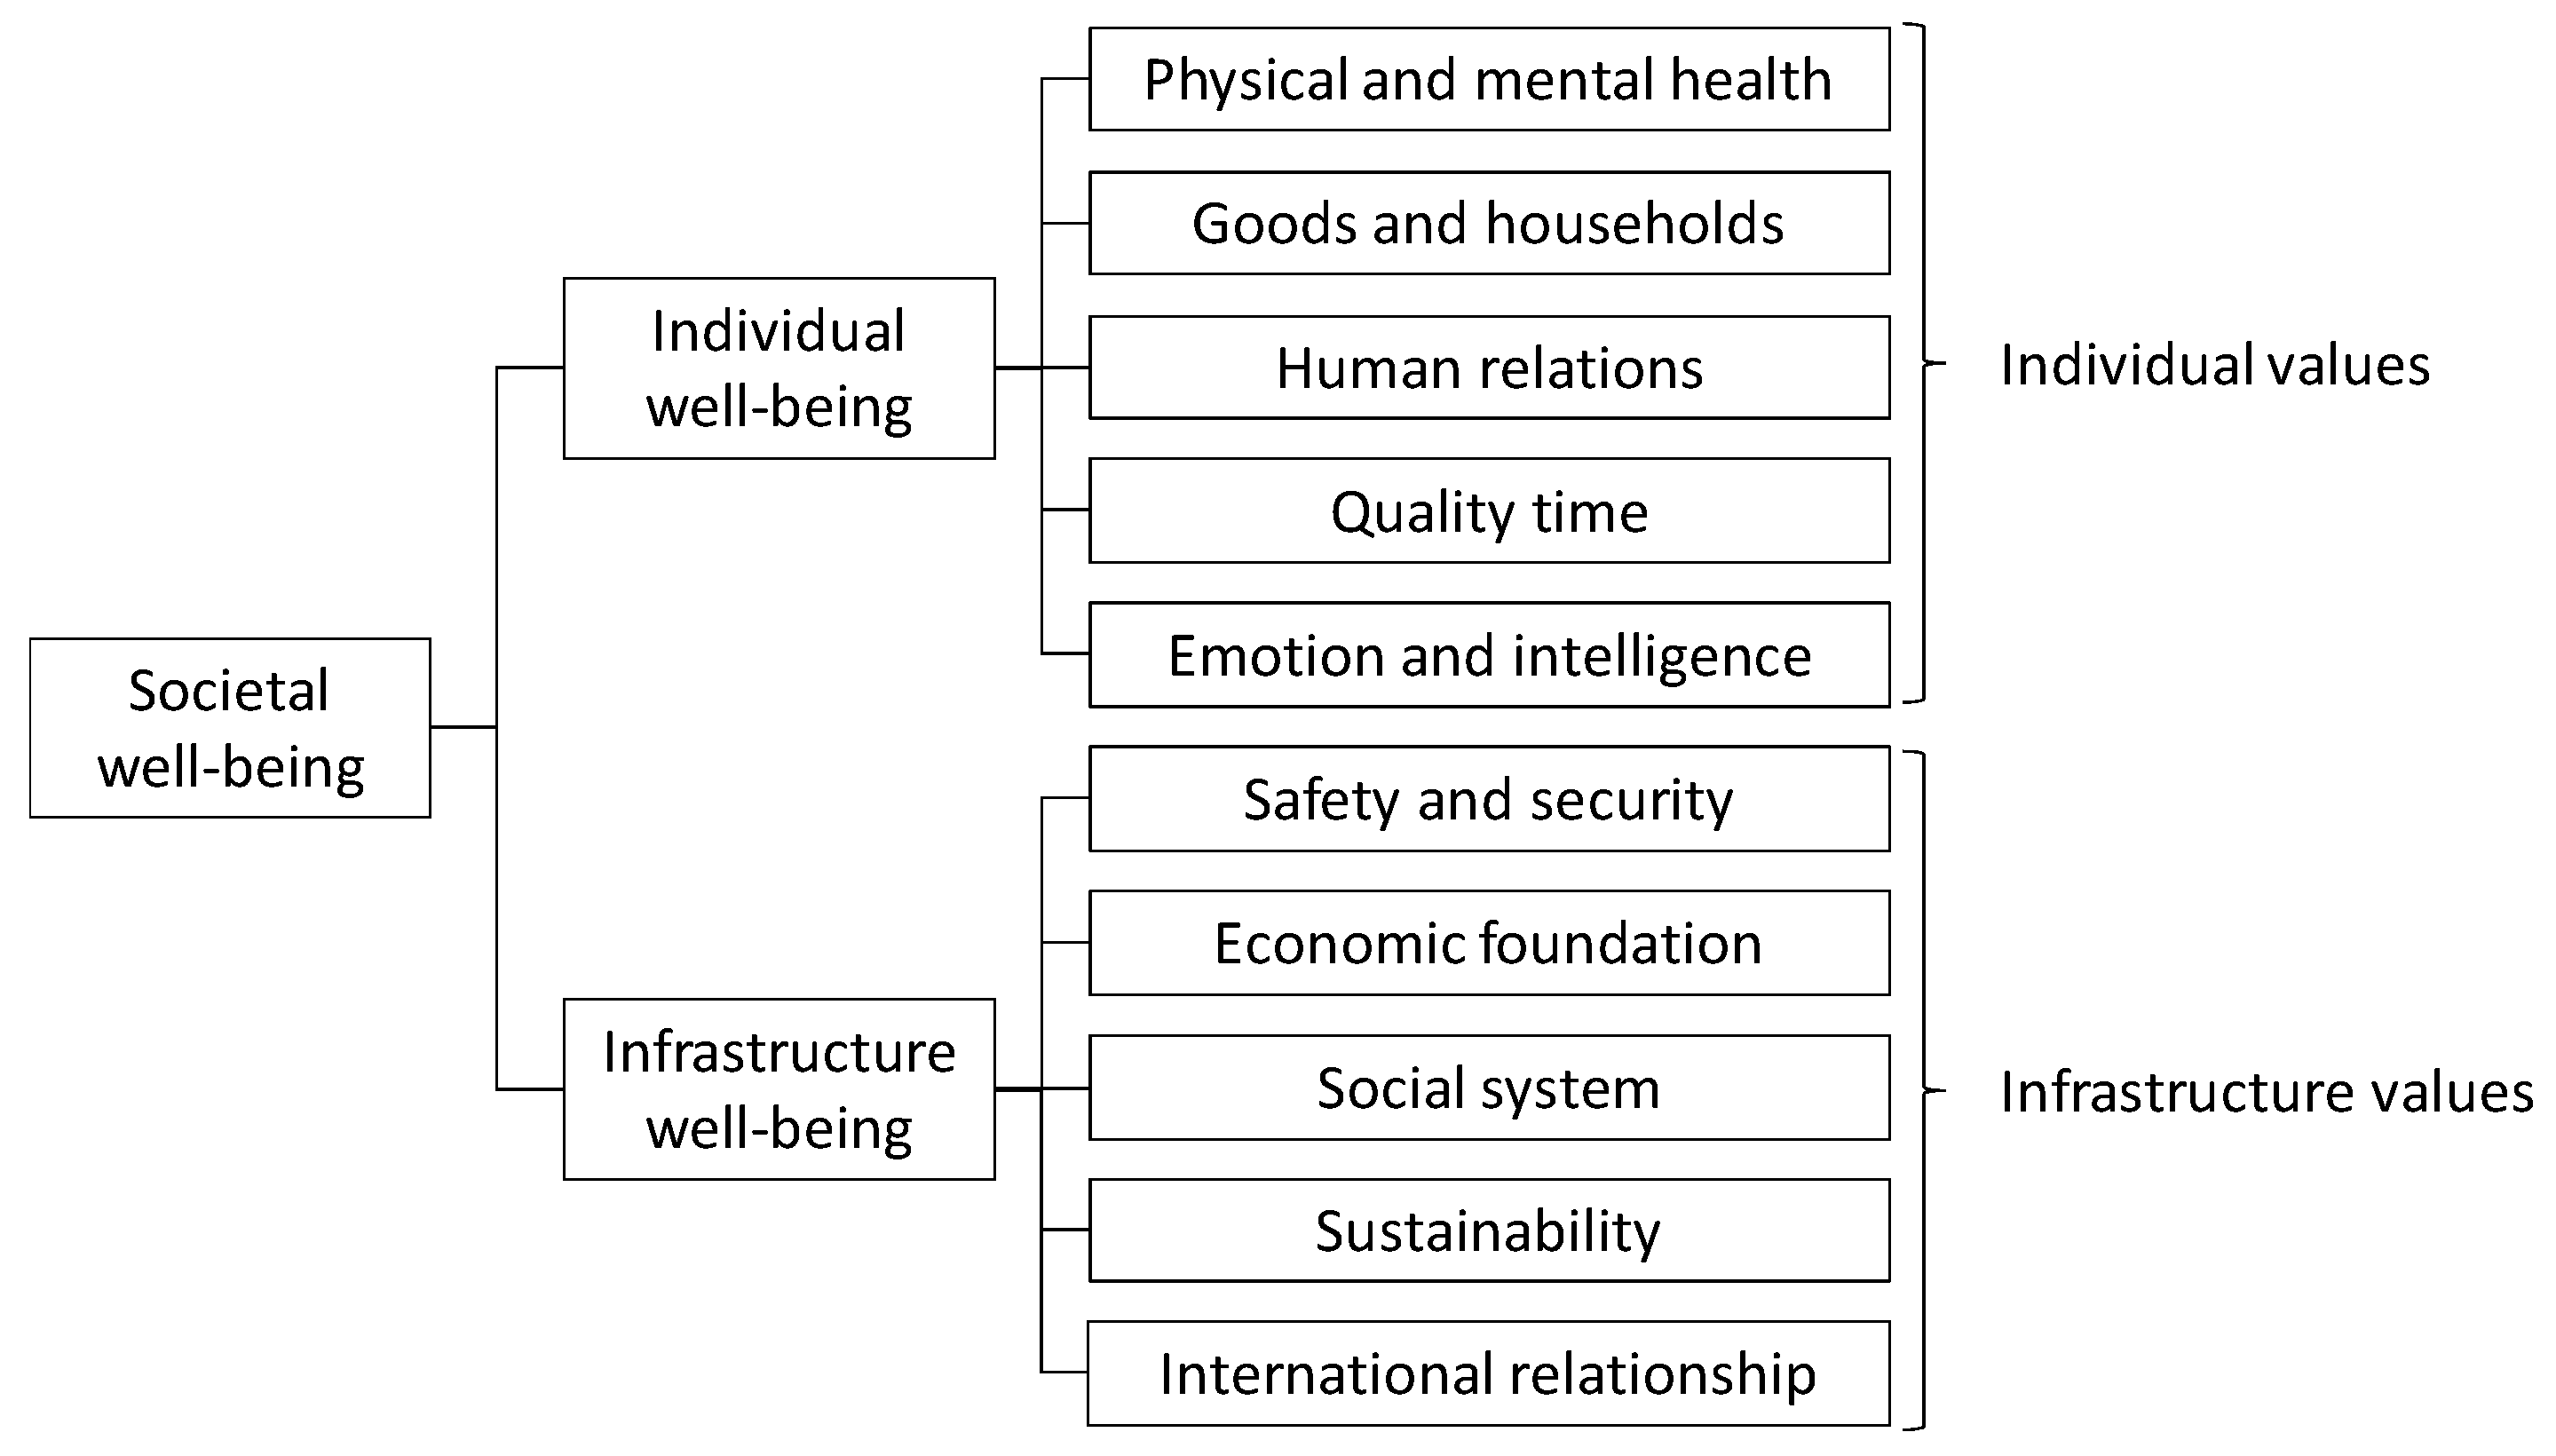
The construction of a hierarchy for each value criterion is important to measure individual and infrastructure values. In this study, we propose a new model, shown in Figure 1, for the structure of well-being. In this model, societal well-being is composed of both individual and infrastructure well-being. These, in turn, consist of five values each, as defined in the hierarchical models of society constructed by Kinehara et al. [15] and Noguchi [16] (Table 1 and Table 2).
These authors constructed a hierarchy of values so that scientific technology policy would be discussed in light of the well-being of infrastructure rather than from the perspective of technological innovation or economic development. The difference between individual and infrastructure well-being is that the former includes individuals’ decision-making power, while the latter includes societal (group) decision-making power. In other words, individual well-being is affected by decisions made by the individual and includes personal-level values, whereas infrastructure well-being is affected by decisions made collectively and includes societal-level values. Additionally, the following points should be kept in mind.
- Based on the risk categories discussed at the World Economic Forum [47], five components each were defined for individual well-being and infrastructure well-being.
- For people to be happy, a certain level of societal infrastructure is necessary to ensure the safety, stability, efficiency, and sustainability of their lives and economic activities; additionally, there are factors of well-being derived from people’s economic activities that directly affect other factors relating to individual values.
- The separation between “infrastructure well-being” and “individual well-being” is based on whether individuals can participate in decision-making (when government involvement is strong).
- Individual well-being is constructed on the well-being of a happy society as described above, as well as the basic elements that constitute the feeling of well-being for individuals. Specifically, individual well-being is formed by connections to one’s family members, acquaintances, friends, neighborhoods, and the organizations to which one belongs, as well as to society in general.
- Infrastructure well-being is a basic framework of a country that supports people’s lives and is built mainly on the administration of the country and local governments.
3.2. Survey
In this research, a two-step online survey with 3000 people was conducted using Market Intelligence & Forecast [48]. The first step evaluated the participants’ current levels of well-being in terms of “individual well-being” and “infrastructure well-being,” grading each on a 10-point scale ranging from 1 (not well) to 10 (well). The second step separated both individual well-being and infrastructure well-being into five component value categories and investigated which categories are considered more important. This survey was conducted from December 2015 to January 2016. Appendix A contains an extract of the questionnaire.
As shown in Table 3, to choose the target population, we followed the “Questionnaire on Well-Being” conducted by Kinehara et al. [15] and Noguchi [16] and added the following conditions. The questionnaire targets and survey subjects were set according to the population composition ratio of each area. However, the questionnaire did not consider occupation, income, or family composition. As this research aims to contribute to science and technology-centered policy, it targeted voters who have a certain knowledge of individual- and infrastructure-related concepts. In the implementation of the questionnaire, the following three points were used as preconditions to avoid bias in the distribution of the respondents:
- An equal number of male and female respondents;
- People in their 20s, 30s, 40s, and 50s each constitute a quarter of the sample, and 20% of the people in their 20s are students;
- Residents of the capital region (Tokyo, Kanagawa, Chiba, and Saitama) and the Chubu-Kinki region (Aichi, Gifu, Mie, Osaka, Kyoto, Hyogo, and Nara) each constitute a quarter of the sample, and residents of other regions make up the other half.
3.3. Estimated Relative Weight
The weights between individual and infrastructure well-being and between the component values of wellness, obtained in the second step of the questionnaire, were analyzed using the AHP. The relative weights between the value categories were calculated by taking the average of all respondents.
Specifically, the estimation was performed using Equations (1)–(4). Matrix , composed of n different elements, can be expressed as in Equation (1). Here, is the weight with respect to the element that is one level higher in the hierarchy, while is the importance. From the construction of each hierarchy, let Equation (2) be a precondition. Letting the maximum eigenvalue of matrix be , and the associated eigenvector , Equation (3) is obtained. Finally, consistency index is determined from Equation (4).
The standard scoring in the AHP is called the Saaty scale and corresponds to 9-7-5-3-1-1/3-1/5-1/7 [9]. In this research, however, we converted the survey results of pair comparisons in a five-step scale into scores as 9-3-1-1/3-1/9. The reasons were, first, to express the difference in people’s feelings more strongly, and second, to perform the estimations with the same conditions as the previous studies conducted in 2005 and 2010 [15,16].
4. Results and Discussion
4.1. Magnitudes of Well-Being
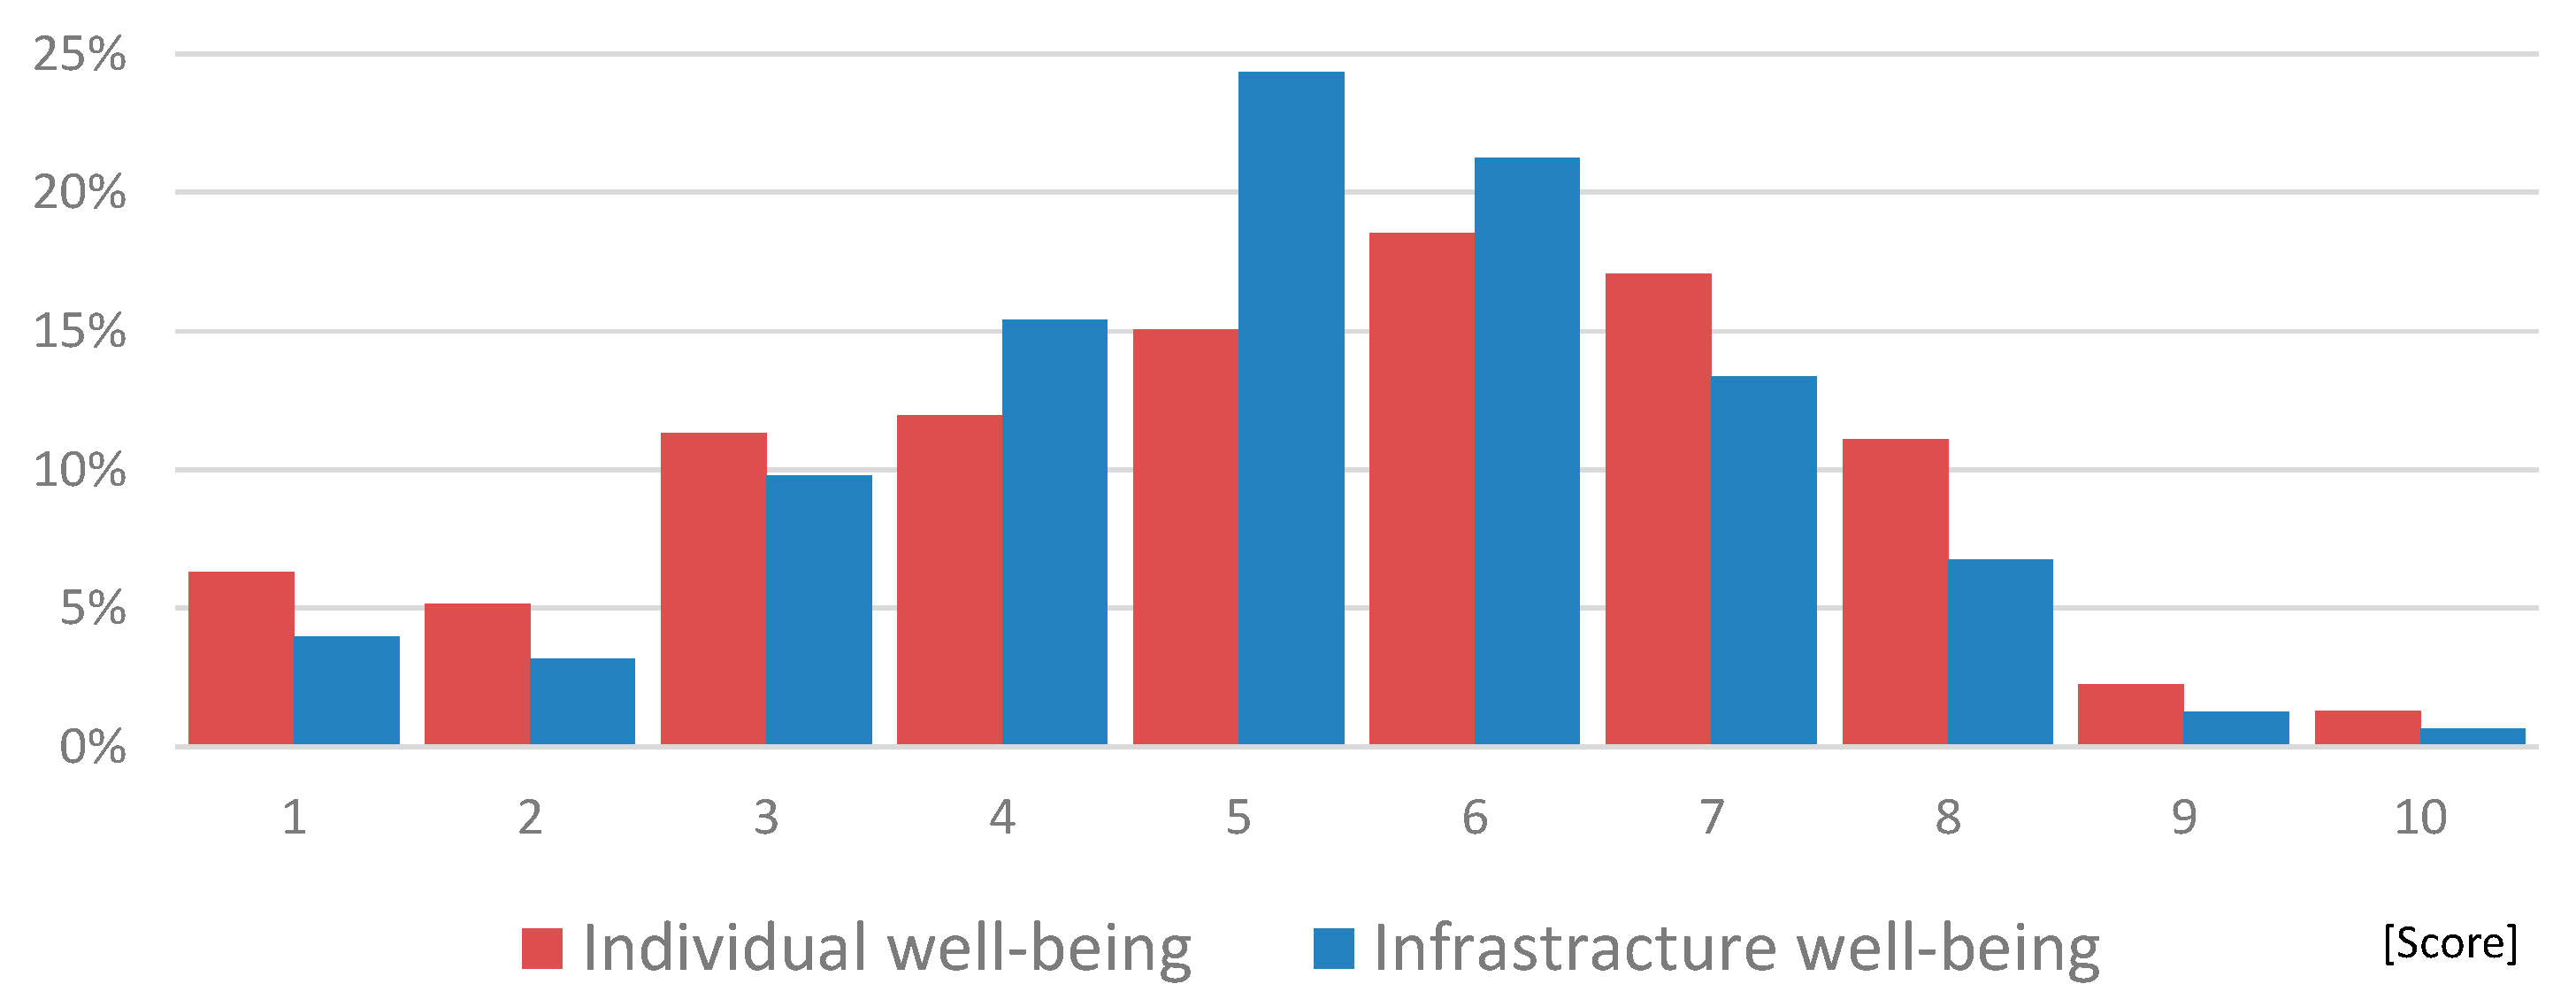
Figure 2 shows the results for the magnitudes of individual well-being and infrastructure well-being.
The average values of individual and infrastructure well-being were 5.3 and 5.2, respectively, but the dispersion tendencies were different. Responses of 3 to 8 regarding individual well-being exceeded 10%. By contrast, responses about infrastructure well-being from 4 to 7 exceeded 10%. The former and the latter accounted for 85% and 74% of the total score, respectively. Therefore, individual well-being is more dispersed than infrastructure well-being, whereas infrastructure well-being is more polarized.
4.2. The Relationship between Individual and Infrastructure Well-Being
Table 4 presents the cross-tabulation of the results for individual and infrastructure well-being. The relationship between the responses for individual and infrastructure well-being can be summarized as follows: the null hypothesis was rejected at less than 1%, so there is a relationship between the two. In other words, respondents who feel generally positive regarding their individual well-being tend to feel the same about their society. However, many responses ranged from 3 to 8 for both types of well-being, although people choosing 5 and 6 were especially prevalent, at 183 and 204, respectively. Many of the respondents recognized that their well-being falls in the middle of the 10-point scale.
4.3. Relative Weights between Values Composing Well-Being
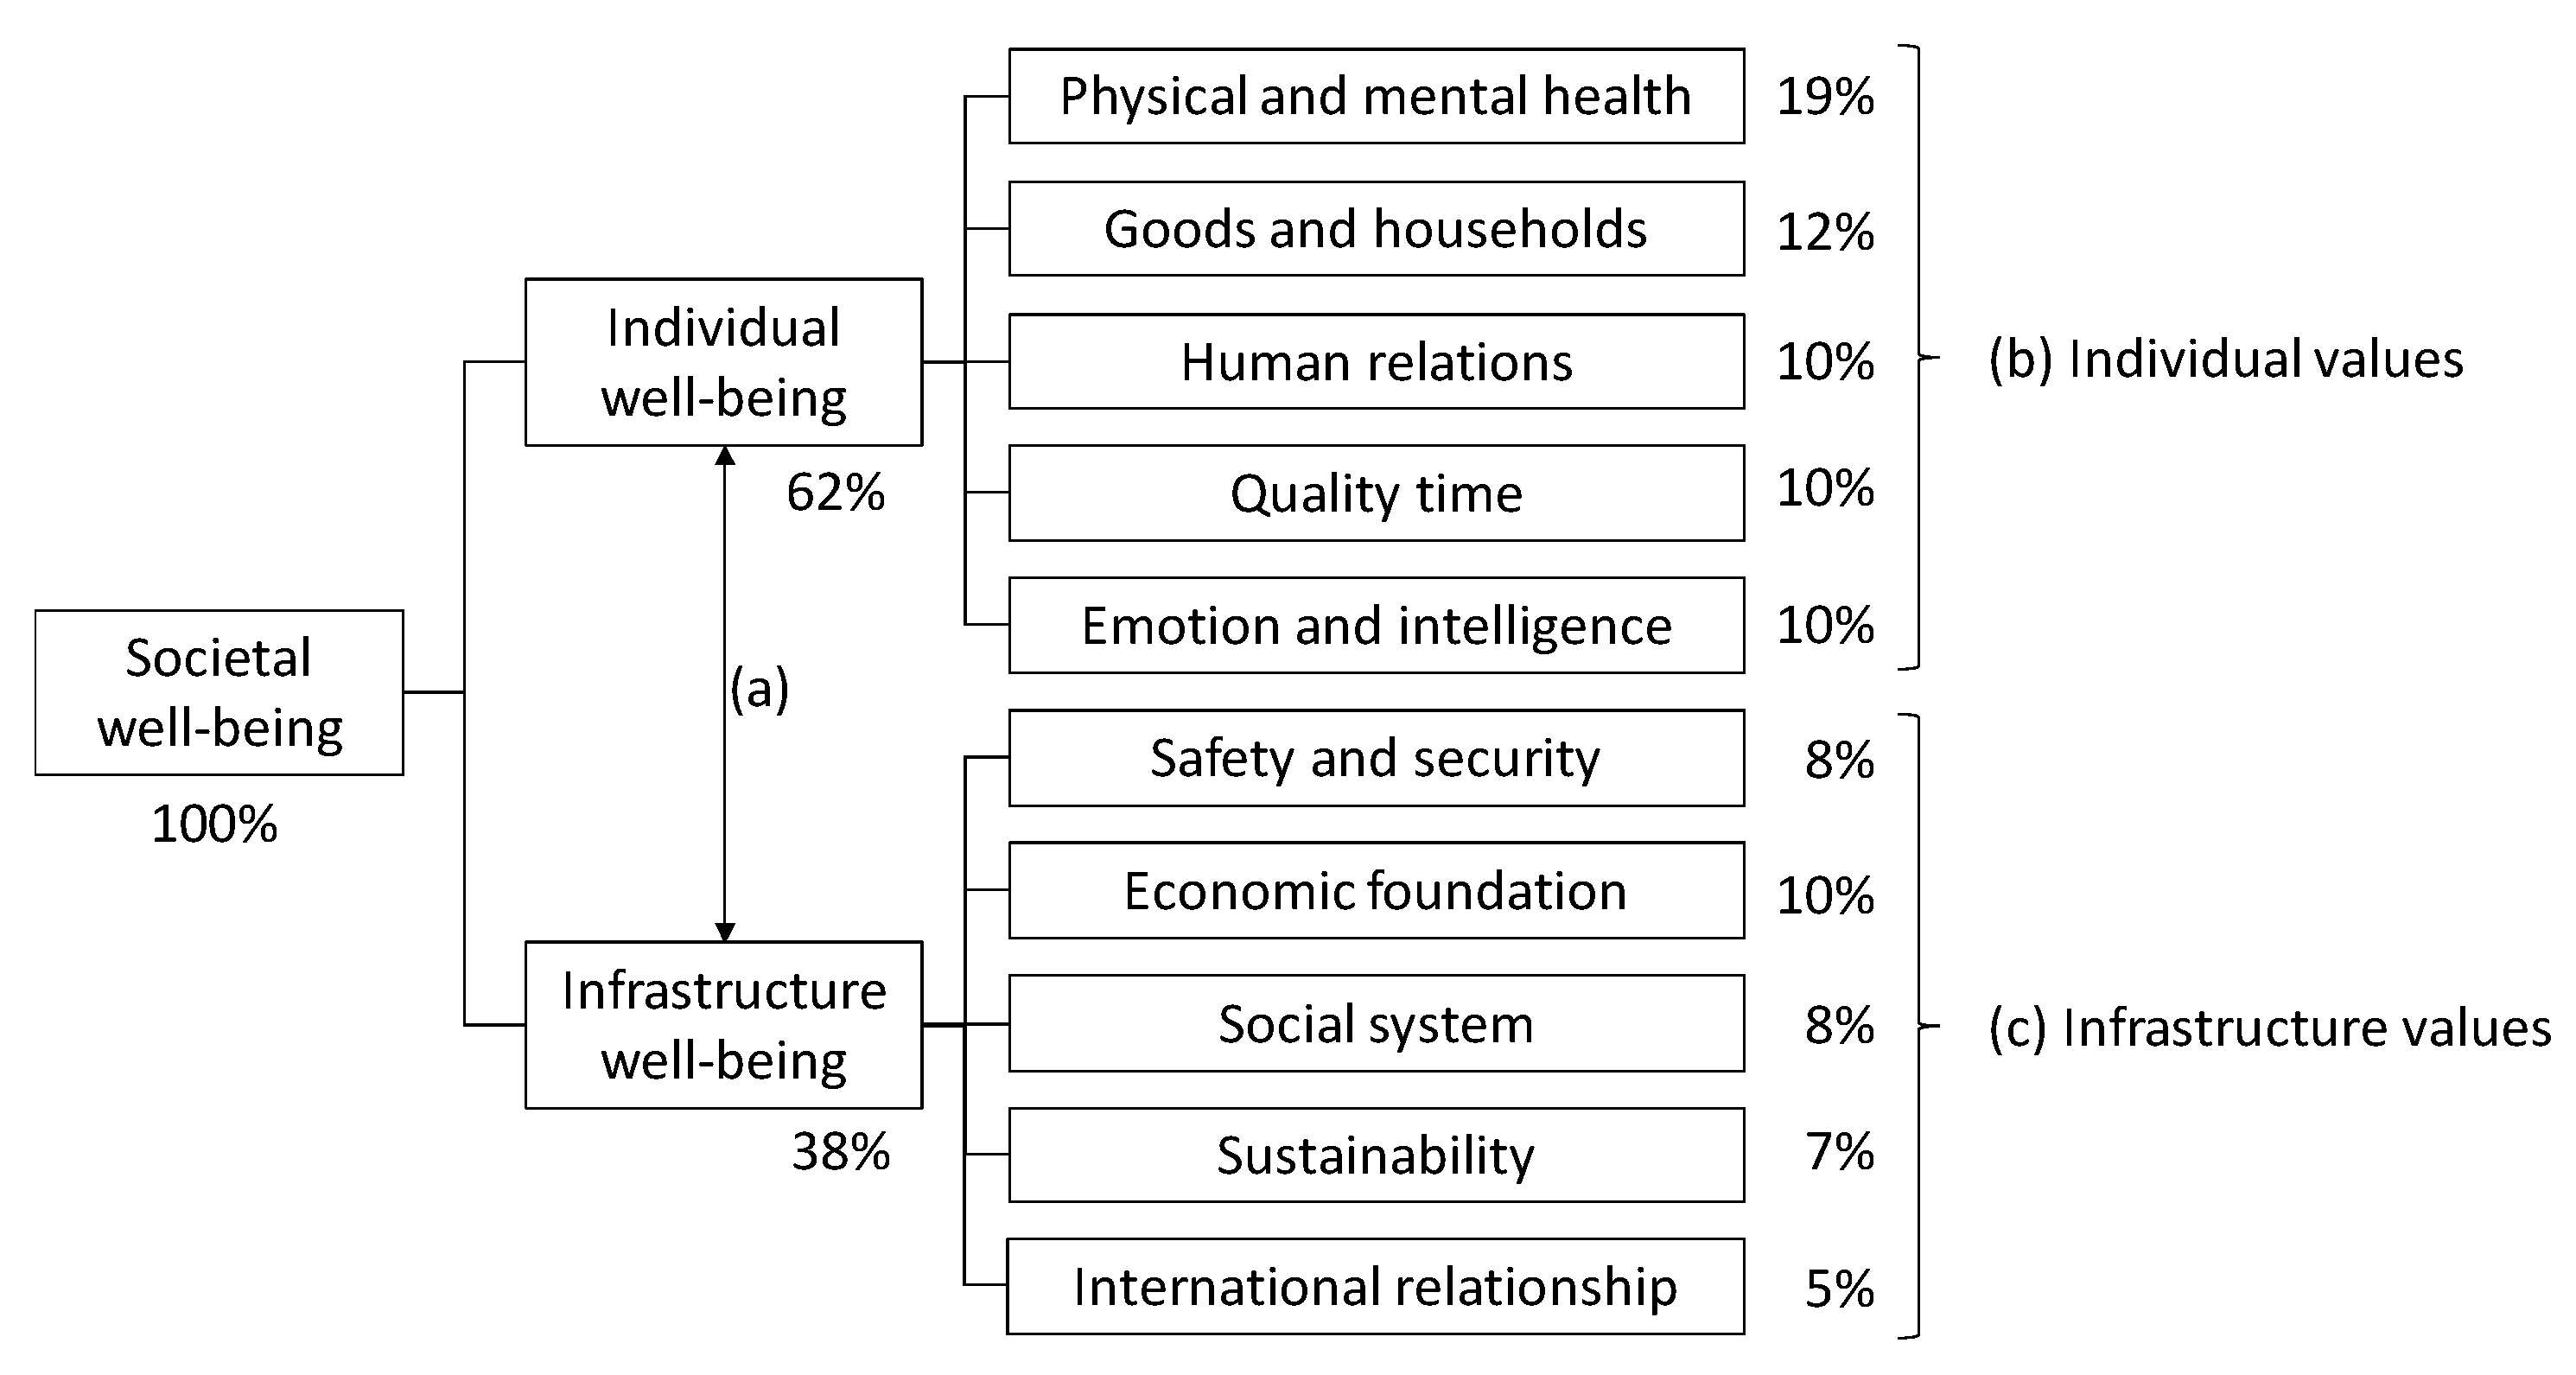
Figure 3 shows the weights for values within infrastructure well-being. The weight for “economic foundation” is slightly larger at 10%, “safety and security” and “infrastructure system” are at 8%, while “sustainability” and “relationship” are at 7% and 5%, respectively. While the values for the economy and safety are somewhat large, there are no weights that are as large as the largest values for individual well-being. This shows that the balance between values is more important in considering infrastructure values than in considering individual values, because there is no large disparity among infrastructure values as there is among individual values.
As an overall trend, “physical and mental health” and “safety and security,” which relate to safety, along with “goods and households” and “economic foundation,” which relate to the economy, are weighted relatively heavily in both individual and infrastructure well-being, but the results also demonstrate that the balance between the weights of various values is important for any decision-making. However, it should be noted that the weights of all five aspects of individual well-being are the same or greater than the largest value of infrastructure well-being. However, since there was no major difference in region or age, we can assume this result likely represents the various value balance of Japan as a whole.
4.4. Safety and Economy
Table 5 shows the result of cross-tabulating the responses related to safety and the economy, which have relatively large weights within individual and infrastructure well-being. The χ2 test was performed to verify the link between the responses on safety and the economy in individual and infrastructure well-being, and the null hypothesis was rejected at less than 1%, and it was shown that there is a relationship between the two relative values. For individual well-being, 1051 people answered that safety and the economy are equally important, 1042 people slightly prioritized safety, and there was a slight tendency overall to prioritize safety. By contrast, for infrastructure well-being, 1272 people answered that the two are equally important, 973 people slightly prioritized the economy, and there was a slight tendency overall to prioritize the economy.
From these characteristics of individual and infrastructure well-being, although safety and the economy are both important, we found a change in priorities between individual- and infrastructure-related thinking. Whereas safety is seen as slightly more important for individual well-being, the economy is seen as slightly more important for infrastructure well-being. When individuals make decisions about adopting policies for scientific technology, their priorities differ between the individual dimension, which reflects their personal decisions, and the infrastructure dimension, which does not reflect their decisions directly. In other words, in individuals’ value systems, the direct connections between infrastructure economy and safety and individual economy and safety are weak. Similar points have been made in the environment/energy field, and the lack of “connection” between individual energy use and infrastructure energy use and their relationship to environmental and energy problems has been called the Missing Link [49]. Researchers, including Mälkki and Alanne [50], have stressed the importance of life cycle thinking, which refers to the awareness of the connections between the individual and infrastructure. When performing studies on decision-making related to advanced science and technology based on each aspect of well-being, this background should be seriously considered.
Similarly, the results of the cross-tabulation of economy and relationships and relationships and safety are shown in Appendix A Table A2 and Table A3, respectively. In both cases, the null hypothesis was rejected at less than 1%, and it was shown that there is a relationship between the two relative values. However, unlike the safety and economy results, there is no reversal in the value of individual and infrastructure (Figure 3; whereas safety is seen as slightly more important for individual well-being, the economy is seen as slightly more important for infrastructure well-being.).
4.5. Recommendations for Science and Technology Policy
To determine the effectiveness of this study, we compared it with past studies. Previous works [7,15,16,17,19,20] had three main similarities in how they modeled the individual and infrastructure well-being.
First, they applied preexisting quantitative indicators, using each to represent the affected area. For example, CO2 emissions or waste quantity could be used for environmental impact, while GDP or household income could be used as an economic indicator. This is not only a tendency of the AHP but of multi-criteria decision analysis in general [51]. This quantitative information provides indicators that are easy for decision-makers to understand. However, just as there are many effects associated with the keyword “environment,” people’s value sets vary, and construction of the hierarchical model should take these uncertainties into account. Regarding this point, this study focused on individual and infrastructure well-being, including people’s daily uncertainties.
Second, the evaluation items in these analyses are mainly concerned with the social effects brought about by scientific technology. Otherwise, there is a tendency to treat the evaluation items of individual and infrastructure well-being in parallel. However, scientific technology greatly influences individuals’ lives, and the relationship between individual and infrastructure values, as well as how their trends are similar or different, have not been considered in previous research. In past studies, there has been an assumption that the individual and infrastructure values are constructed independently, but this study has created an additional hierarchy to consider the relative weight of individual and infrastructure values. For example, when decisions have had to be made about the scientific technology used to build a happy life, such as waste incineration plants, sewage treatment plants, and power plants, there have been cases of the public agreeing to the adoption of the technology because the facility was essential for individual livelihoods while simultaneously opposing the construction of the facility within their living zones (i.e., near their homes). The present study compares not only the weights between individual and infrastructure values but also the characteristics of the weights in each category.
Third, many previous analyses have focused on specific scientific technology and have not generalized the value structure of the public. In contemporary cases of advanced adoption of technology, such as renewable energy in Germany and Spain, the analytical evaluation results have shown the subsequent effects, including the environmental, economic, and safety impacts, among others. This allows other countries and regions aiming to adopt the same technology in the future to form concrete policies and make decisions based on the precedents. By contrast, when considering the adoption of advanced science and technology for which there is no specific precedent, it is necessary to clarify the value standards held by those who will use the technology. There is also the possibility that opinions of people with little knowledge about that technology and society may be a hindrance factor in advanced science and technology decision-making [52]. However, as the present study covers people’s daily well-being, it can be used to develop surveys targeting specific technologies.
Based on our findings, we can propose the following for science and technology policy. Conventional science and technology policies have tended to focus on safety and economy. The current study has demonstrated that this is not a bad approach if the aim is to introduce and disseminate technology because the respondents indicated that safety and the economy are relatively important for both individual and infrastructure well-being. However, as other factors have a certain weight in both individual and infrastructure well-being, a science and technology policy considering the balance of the whole is desirable, especially considering the impossibility of carrying out detailed analyses and evaluations for all values. What is important as a first step in science and technology decision-making is to consider what kind of value balance exists between individual and infrastructure well-being from a systematic perspective. As a second step, any decision must consider that safety and the economy are important for both individual and infrastructure well-being, and conduct detailed discussions. These two steps should reduce the possibility of overlooking the important impact of science and technology and lead to balanced decision-making.
5. Conclusions
In this research, we provided a hierarchical model of the values that compose individual and infrastructure well-being, performed a public opinion survey, and analyzed the changes in the magnitudes of well-being by value category and the relative weights of values in 2015. The results show that even when information is very limited at the initial stages of advanced science and technology adoption, it is necessary to consider the effects on various entities and fields in a balanced way and not just the safety of the technology or its effects on the economy. The main characteristics of the analysis results are listed below.
- In the analysis of the magnitudes of individual and infrastructure well-being, no large differences were observed in the average values, but individual well-being may be more polarized than infrastructure well-being.
- While safety and the economy had relatively large weights among all the value categories, other values also had significant weights, showing the importance of considering the overall balance of values in deciding on scientific technology policy.
- The relative weight between individual and infrastructure well-being, which was newly investigated in this research, was approximately 60:40. There was also a difference in characteristics, where the value of the economy was highest in individual well-being while the value of safety was highest in infrastructure well-being. However, the trends in responses differed when considering the individual, which directly reflects personal decisions, versus society, which reflects them less. When interpreting infrastructure surveys and their analysis results, it is important to consider this precondition.
In this research, the value categories were chosen by considering those used in previous research. However, it is possible that value categories have changed over time, and it is also necessary to test the independence of each value category. At the same time, we should consider fuzzy and network logic, which can take into account ambiguous judgments and relationships between values [53,54]. Also, given that this research assumes the value structure of Japanese culture, different countries and cultures may have different results. The hope is to further develop the model in the future by refining the value hierarchy, as well as understanding changes in the weights and structure of values over time so that the values can be even more accurately determined.
Author Contributions
Conceptualization, S.H. and K.N.; methodology, S.H. and K.N.; formal analysis, S.H., K.N., T.S. (Tadahiro Shibutani), T.S. (Takahiro Saigo), and A.M.; writing—original draft preparation, S.H.; writing—review and editing, S.H.; project administration, K.N.
Acknowledgments
This research summarizes the “Questionnaire on Well-Being, 2015,” which was undertaken by Yokohama National University’s Center for Creation of Symbiosis Society with Risk. Furthermore, the detailed analysis in this research was performed in collaboration with Mitsubishi Research Institute, Inc. We would like to thank all the researchers and faculty members who participated in the discussions.
Conflicts of Interest
The authors declare no conflict of interest.
Appendix A

Table A1.
An extract of the second step’s questionnaire.
| Advantage | Slight Advantage | About the Same | Slight Advantage | Advantage | |||
|---|---|---|---|---|---|---|---|
| Q1 | Goods and households | X | Quality time | ||||
| Q2 | Quality time | X | Physical and mental health | ||||
| Q3 | Physical and mental health | X | Human relations | ||||
| Q4 | Human relations | X | Emotion and intelligence | ||||
| Q5 | Emotion and intelligence | X | Goods and households | ||||
| Q6 | Goods and households | X | Physical and mental health | ||||
| Q7 | Physical and mental health | X | Emotion and intelligence | ||||
| Q8 | Emotion and intelligence | Quality time | |||||
| Q9 | Quality time | X | Human relations | ||||
| Q10 | Human relations | X | Goods and households | ||||
| … | … | … | … | … | … | … | … |
Table A2.
Crosstab result between economy and relationships.
| Individual Well-Being | Goods and Households | ⇔ | Human Relations | Total | |||
|---|---|---|---|---|---|---|---|
| Infrastructure Well-Being | Advantage | Slight Advantage | About the Same | Slight Advantage | Advantage | ||
| Economic foundation | Advantage | 110 | 64 | 37 | 10 | 12 | 233 |
| Slight advantage | 67 | 378 | 234 | 35 | 1 | 715 | |
| ⇕ | About the same | 58 | 366 | 714 | 91 | 11 | 1240 |
| International relationship | Slight advantage | 26 | 241 | 250 | 130 | 24 | 671 |
| Advantage | 31 | 16 | 28 | 26 | 40 | 141 | |
| Total | 119 | 292 | 1065 | 1263 | 292 | 88 | |
 : Over 100
  : Over 50.
Table A3.
Crosstab result between relationship and safety.
| Individual Well-Being | Physical and Mental Health | ⇔ | Human Relations | Total | |||
|---|---|---|---|---|---|---|---|
| Infrastructure Well-Being | Advantage | Slight Advantage | About the Same | Slight Advantage | Advantage | ||
| Safety and security | Advantage | 152 | 172 | 174 | 63 | 57 | 618 |
| Slight advantage | 64 | 523 | 496 | 114 | 12 | 1209 | |
| ⇕ | About the same | 36 | 214 | 620 | 61 | 13 | 944 |
| International relationship | Slight advantage | 14 | 84 | 70 | 25 | 3 | 196 |
| Advantage | 13 | 10 | 7 | 1 | 2 | 33 | |
| Total | 279 | 1003 | 1367 | 264 | 87 | 3000 | |
: Over 100 : Over 50.References
- Elkington, J. Towards the Sustainable Corporation: Win-Win-Win Business Strategies for Sustainable Development. Calif. Manag. Rev. 1994, 36, 90–100. [Google Scholar] [CrossRef]
- Stiglitz, J.E.; Sen, A.; Fitoussi, J.P. Report by the Commission on the Measurement of Economic Performance and Social Progress. Available online: http://citeseerx.ist.psu.edu/viewdoc/download?doi=10.1.1.215.58&rep=rep1&type=pdf (accessed on 4 April 2018).
- United Nations. The Sustainable Development Goals Report 2017. Available online: https://unstats.un.org/sdgs/files/report/2017/TheSustainableDevelopmentGoalsReport2017.pdf (accessed on 11 April 2019).
- Dong, Q.; Cooper, O. An orders-of-magnitude AHP supply chain risk assessment framework. Int. J. Prod. Econ. 2016, 182, 144–156. [Google Scholar] [CrossRef]
- Subramanian, N.; Ramanathan, R. A review of applications of Analytic Hierarchy Process in operations management. Int. J. Prod. Econ. 2015, 138, 215–241. [Google Scholar] [CrossRef]
- De Almeida, A.T.; Alencar, M.H.; Garcez, T.V.; Ferreira, R.J.P. A systematic literature review of multicriteria and multi-objective models applied in risk management. IMA J. Manag. Math. 2017, 28, 153–184. [Google Scholar] [CrossRef]
- Stein, E.W. A comprehensive multi-criteria model to rank electric energy production technologies. Renew. Sustain. Energy Rev. 2013, 22, 640–654. [Google Scholar] [CrossRef]
- Ishizaka, A.; Siraj, S.; Nemery, P. Which energy mix for the UK (United Kingdom)? An evolutive descriptive mapping with the integrated GAIA (graphical analysis for interactive aid)–AHP (analytic hierarchy process) visualization tool. Energy 2016, 95, 602–611. [Google Scholar] [CrossRef]
- Saaty, T.L. The Analytic Hierarchy Process; McGraw-Hill: New York, NY, USA, 1980. [Google Scholar]
- Hwang, B.-G.; Zhao, X.; Toh, L.P. Risk management in small construction projects in Singapore: Status, barriers and impact. Int. J. Proj. Manag. 2014, 32, 116–124. [Google Scholar] [CrossRef]
- Taylan, O.; Bafail, A.O.; Abdulaal, R.M.; Kabli, M.R. Construction projects selection and risk assessment by fuzzy AHP and fuzzy TOPSIS methodologies. Appl. Soft Comput. 2014, 17, 105–116. [Google Scholar] [CrossRef]
- Zayed, T.; Amer, M.; Pan, J. Assessing risk and uncertainty inherent in Chinese highway projects using AHP. Int. J. Proj. Manag. 2008, 26, 408–419. [Google Scholar] [CrossRef]
- Ellis, S.C.; Shockley, J.; Henry, R.M. Making sense of supply disruption risk research: A conceptual framework grounded in enactment theory. J. Supply Chain Manag. 2011, 47, 65–96. [Google Scholar] [CrossRef]
- Prakash, A.; Agarwal, A.; Kumar, A. Risk Assessment in Automobile Supply Chain. Mater. Today Proc. 2018, 5, 3571–3580. [Google Scholar] [CrossRef]
- Kinehara, Y.; Noguchi, K.; Inoue, R.; Takahashi, H.; Shibuya, Y.; Nagano, M. New Treatise on How to Enrich Our Country: Based on the Results of a Survey of People’s Awareness of Happiness and Richness as Well as Science and Technology. Available online: https://www.mri.co.jp/NEWS/magazine/journal/47/__icsFiles/afieldfile/2008/10/21/jm06111504.pdf (accessed on 19 March 2019). (In Japanese with English Abstract).
- Noguchi, K. Looking for a Shape of a New Country (1). Available online: http://diamond.jp/articles/-/13390. (accessed on 22 November 2017). (In Japanese).
- World Health Organization. Constitution of the World Health Organization. Available online: http://apps.who.int/gb/bd/PDF/bd47/EN/constitution-en.pdf?ua=1 (accessed on 1 June 2019).
- Ward, G. Happiness and Voting Behaviour. World Happiness Report 2019. Available online: https://media.noticel.com/o2com-noti-media-us-east-1/document_dev/2019/03/20/INFORME%20FELICIDAD%20MUNDIAL_1553097652515_37794149_ver1.0.pdf#page=49 (accessed on 1 June 2019).
- Managi, S.; Kumar, P. (Eds.) Inclusive Wealth Report 2018: Measuring Progress Towards Sustainability; Routledge: Thames River, UK, 2018. [Google Scholar]
- OECD. Better Life Index. Available online: http://www.oecdbetterlifeindex.org/#/11011111111 (accessed on 1 June 2019).
- OECD. How’s Life? 2017: Measuring Well-Being; OECD Publishing: Paris, France, 2017; Available online: https://doi.org/10.1787/how_life-2017-en (accessed on 1 June 2019).
- Legatum Institute. The Legatum Prosperity Index. Available online: https://www.prosperity.com/rankings (accessed on 1 June 2019).
- Mizobuchi, H. Measuring world better life frontier: A composite indicator for OECD better life index. Soc. Indic. Res. 2014, 118, 987–1007. [Google Scholar] [CrossRef]
- Marković, M.; Zdravković, S.; Mitrović, M.; Radojičić, A. An iterative multivariate post hoc I-distance approach in evaluating OECD Better Life Index. Soc. Indic. Res. 2016, 126, 1–19. [Google Scholar] [CrossRef]
- Lorenz, J.; Brauer, C.; Lorenz, D. Rank-optimal weighting or “How to be best in the OECD Better Life Index?”. Soc. Indic. Res. 2017, 134, 75–92. [Google Scholar] [CrossRef]
- Ryan, R.M.; Frederick, C. On Energy, Personality, and Health: Subjective Vitality as a Dynamic Reflection of Well-Being. J. Pers. 1997, 65, 529–565. [Google Scholar] [CrossRef] [PubMed]
- Penedo, F.J.; Dahn, J.R. Exercise and well-being: A review of mental and physical health benefits associated with physical activity. Curr. Opin. Psychiatry 2005, 18, 189–193. [Google Scholar] [CrossRef]
- Diener, E.; Chan, M.Y. Happy People Live Longer: Subjective Well-Being Contributes to Health and Longevity. Appl. Psychol. Health Well-Being 2011, 3, 1–43. [Google Scholar] [CrossRef]
- Obrecht, T.P.; Kunič, R.; Jordan, S.; Dovjak, M. Comparison of Health and Well-Being Aspects in Building Certification Schemes. Sustainability 2019, 11, 2616. [Google Scholar] [CrossRef]
- PricewaterhouseCoopers. Available online: https://www.pwc.com/jp/ja/about-us/well-being.html (accessed on 1 June 2019).
- Edenred-IPOS. Understand and Improve the Wellbeing at Work. Available online: https://www.ipsos.com/sites/default/files/news_and_polls/2016-05/7265-results.pdf (accessed on 1 June 2019).
- University of Michigan. New Well-Being Site for Students on Canvas. Available online: https://www.uhs.umich.edu/well-being (accessed on 1 June 2019).
- Montana State University. HDD Well-Being Model. Available online: https://oxchc.ca/model-of-care/ (accessed on 1 June 2019).
- University of Minnesota. What is wellbeing? Available online: https://www.takingcharge.csh.umn.edu/what-wellbeing (accessed on 1 June 2019).
- Konu, A.; Rimpelä, M. Well-being in schools: A conceptual model. Health Promot. Int. 2002, 17, 79–87. [Google Scholar] [CrossRef]
- Soutter, A.K.; O’Steen, B.; Gilmore, A. The student well-being model: A conceptual framework for the development of student wellbeing indicators. Int. J. Adolesc. Youth 2014, 19, 496–520. [Google Scholar] [CrossRef]
- Helliwell, J.F. How’s life? Combining individual and national variables to explain subjective well-being. Econ. Model. 2003, 20, 331–360. [Google Scholar] [CrossRef]
- Huppert, F.A.; So, T.T. Flourishing across Europe: Application of a new conceptual framework for defining well-being. Soc. Indic. Res. 2013, 110, 837–861. [Google Scholar] [CrossRef] [PubMed]
- Shibuya, Y.; Noguchi, K.; Inoue, R.; Kinehara, Y.; Takahashi, H.; Nagano, M. Transition of “Affluence Discussions”-Transition from Pursuit of Affluence to the Pursuit of Happiness-, Mitsubishi Research Institute, Inc Research Note. Available online: https://www.mri.co.jp/NEWS/magazine/journal/47/__icsFiles/afieldfile/2008/10/21/jm06111503.pdf (accessed on 19 March 2019). (In Japanese with English Abstract).
- Tsutsui, Y.; Ohtake, H.; Ikeda, A. The reason why you are unhappy. Osaka Univ. Econ. 2009, 58, 20–57. Available online: http://www.iser.osaka-u.ac.jp/rcbe/gyoseki/fukou.pdf (accessed on 19 March 2019).
- Scannapieco, D.; Naddeo, V.; Belgiorno, V. Sustainable power plants: A support tool for the analysis of alternatives. Land Use Policy 2014, 36, 478–484. [Google Scholar] [CrossRef]
- Kablan, M.M. Decision support for energy conservation promotion: An analytic hierarchy process approach. Energy Policy 2004, 32, 1151–1158. [Google Scholar] [CrossRef]
- Erol, Ö.; Kılkış, B. An energy source policy assessment using analytical hierarchy process. Energy Convers. Manag. 2012, 63, 245–252. [Google Scholar] [CrossRef]
- Rosso, M.; Bottero, M.; Pomarico, S.; La Ferlita, S.; Comino, E. Integrating multicriteria evaluation and stakeholders analysis for assessing hydropower projects. Energy Policy 2014, 67, 870–881. [Google Scholar] [CrossRef]
- Ahmad, S.; Tahar, R.M. Selection of renewable energy sources for sustainable development of electricity generation system using analytic hierarchy process: A case of Malaysia. Renew. Energy 2014, 63, 458–466. [Google Scholar] [CrossRef]
- Väisänen, S.; Mikkilä, M.; Havukainen, J.; Sokka, L.; Luoranen, M.; Horttanainen, M. Using a multi-method approach for decision-making about a sustainable local distributed energy system: A case study from Finland. J. Clean. Prod. 2016, 137, 1330–1338. [Google Scholar] [CrossRef]
- World Economic Forum. The Global Risks Report 2017, 12th Edition. Available online: http://www3.weforum.org/docs/GRR17_Report_web.pdf (accessed on 2 April 2019).
- Mitsubishi Research Institute Market Intelligence & Forecast. Available online: https://mif.mri.co.jp/ (accessed on 1 June 2019). (In Japanese).
- Hondo, H.; Hirayama, Y.; Nakajima, K.; Yamada, S.; Fukuhara, I. Use of Life Cycle Thinking in Environmental Education: Visualization and Recovery of the Missing Link towards Sustainable Consumption. J. Life Cycle Assess. Jpn. 2008, 4, 279–291. [Google Scholar] [CrossRef] [Green Version]
- Mälkki, H.; Alanne, K. An overview of life cycle assessment (LCA) and research-based teaching in renewable and sustainable energy education. Renew. Sustain. Energy Rev. 2017, 69, 218–231. [Google Scholar] [CrossRef]
- Martín-Gamboa, M.; Iribarren, D.; García-Gusano, D.; Dufour, J. A review of life-cycle approaches coupled with data envelopment analysis within multi-criteria decision analysis for sustainability assessment of energy systems. J. Clean. Prod. 2017, 150, 164–174. [Google Scholar] [CrossRef]
- Assefa, G.; Frostell, B. Social sustainability and social acceptance in technology assessment: A case study of energy technologies. Technol. Soc. 2007, 29, 63–78. [Google Scholar] [CrossRef]
- Banaś, D.; Michnik, J. Evaluation of the Impact of Strategic Offers on the Financial and Strategic Health of the Company—A Soft System Dynamics Approach. Mathematics 2019, 7, 208. [Google Scholar] [CrossRef]
- Jetter, A.J. Fuzzy cognitive maps for engineering and technology management: What works in practice? In Proceedings of the 2006 Technology Management for the Global Future-PICMET 2006 Conference, Istanbul, Turkey, 8–13 July 2006; Volume 2, pp. 498–512. [Google Scholar]
Figure 1.
Model of the hierarchical structure of well-being.

Figure 2.
Magnitudes of individual and infrastructure well-being.

Figure 3.
Weight of individual and infrastructure well-being values in 2015.

| Value | Definition | Elements |
|---|---|---|
| Physical and mental health (Individual safety) | Being physically and mentally healthy and being able to go about one’s life with vitality |
|
| Goods and households (Individual economy) | Owning many products or having a lot of disposable income and being able to live a comfortable and convenient life |
|
| Human relations (Individual relations) | Building up good personal relationships for oneself |
|
| Quality time | Having free time and being able to use it for fulfilling activities |
|
| Emotion and intelligence | Having emotionally moving experiences and discoveries, as well as having appropriate judgment |
|
| Value | Definition | Elements |
|---|---|---|
| Safety and security (Infrastructure safety) | Societal organization that allows people to live peacefully without threats to life and property |
|
| Economic foundation (Infrastructure economy) | Economic foundation that allows national administration and civic life to proceed in a stable way |
|
| Societal system | Reliable societal system in which people’s political participation is guaranteed, a society with order is formed, and people can receive a high level of education |
|
| Sustainability | Society that can be sustained in the future, considering global issues |
|
| International relationship (Infrastructure relationship) | Maintaining good relations with other countries and being held in high regard |
|
Table 3.
Target population of the questionnaire.
| Male | Female | Total | ||||||
|---|---|---|---|---|---|---|---|---|
| Tokyo Area | Nagoya and Osaka Area | OTHER AREAS | Tokyo Area | Nagoya and Osaka Area | Other Areas | |||
| 20–29 years old | University student | 19 | 19 | 37 | 19 | 19 | 37 | 150 |
| University graduate | 75 | 75 | 150 | 75 | 75 | 150 | 600 | |
| 30–39 years old | 94 | 94 | 187 | 94 | 94 | 187 | 750 | |
| 40–49 years old | 94 | 94 | 187 | 94 | 94 | 187 | 750 | |
| 50+ years old | 94 | 94 | 187 | 94 | 94 | 187 | 750 | |
| Total | 376 | 376 | 748 | 376 | 376 | 748 | 3000 | |
Table 4.
Crosstab result between individual and infrastructure well-being.
| Individual Well-Being | Total | |||||||||||
|---|---|---|---|---|---|---|---|---|---|---|---|---|
| 1 | 2 | 3 | 4 | 5 | 6 | 7 | 8 | 9 | 10 | |||
| Infrastructure well-being | 10 | 3 | 0 | 2 | 5 | 15 | 17 | 20 | 37 | 18 | 72 | 39 |
| 9 | 1 | 0 | 6 | 8 | 16 | 25 | 40 | 28 | 18 | 13 | 67 | |
| 8 | 1 | 2 | 8 | 25 | 37 | 79 | 86 | 64 | 26 | 11 | 333 | |
| 7 | 0 | 1 | 9 | 16 | 43 | 104 | 104 | 69 | 11 | 2 | 512 | |
| 6 | 0 | 0 | 16 | 26 | 103 | 204 | 61 | 31 | 1 | 9 | 556 | |
| 5 | 1 | 3 | 24 | 71 | 183 | 153 | 80 | 31 | 6 | 4 | 451 | |
| 4 | 1 | 8 | 45 | 137 | 163 | 88 | 47 | 14 | 8 | 1 | 359 | |
| 3 | 0 | 10 | 72 | 96 | 65 | 49 | 21 | 14 | 5 | 1 | 339 | |
| 2 | 4 | 13 | 13 | 11 | 8 | 6 | 3 | 5 | 2 | 2 | 155 | |
| 1 | 9 | 1 | 8 | 6 | 4 | 5 | 0 | 1 | 0 | 5 | 189 | |
| Total | 20 | 38 | 203 | 401 | 637 | 730 | 462 | 294 | 95 | 120 | 3000 | |
: Over 100 : Over 50.Table 5.
Crosstab result between economy and safety.
| Infrastructure Well-Being | Goods and Households | ⇔ | Physical and Mental Health | Total | |||
|---|---|---|---|---|---|---|---|
| Individual Well-Being | Advantage | Slight Advantage | About the Same | Slight Advantage | Advantage | ||
| Economic foundation | Advantage | 4 | 7 | 5 | 15 | 47 | 334 |
| Slight advantage | 4 | 15 | 71 | 192 | 61 | 973 | |
| ⇕ | About the same | 12 | 96 | 583 | 450 | 131 | 1272 |
| Safety and security | Slight advantage | 26 | 205 | 326 | 342 | 74 | 343 |
| Advantage | 73 | 71 | 66 | 43 | 81 | 78 | |
| Total | 119 | 394 | 1051 | 1042 | 394 | 3000 | |
: Over 100 : Over 50.© 2019 by the authors. Licensee MDPI, Basel, Switzerland. This article is an open access article distributed under the terms and conditions of the Creative Commons Attribution (CC BY) license (http://creativecommons.org/licenses/by/4.0/).
Share and Cite
MDPI and ACS Style
Hienuki, S.; Noguchi, K.; Shibutani, T.; Saigo, T.; Miyake, A. The Balance of Individual and Infrastructure Values in Decisions Regarding Advanced Science and Technology. Sustainability 2019, 11, 3385. https://doi.org/10.3390/su11123385
AMA Style
Hienuki S, Noguchi K, Shibutani T, Saigo T, Miyake A. The Balance of Individual and Infrastructure Values in Decisions Regarding Advanced Science and Technology. Sustainability. 2019; 11(12):3385. https://doi.org/10.3390/su11123385
Chicago/Turabian StyleHienuki, Shunichi, Kazuhiko Noguchi, Tadahiro Shibutani, Takahiro Saigo, and Atsumi Miyake. 2019. "The Balance of Individual and Infrastructure Values in Decisions Regarding Advanced Science and Technology" Sustainability 11, no. 12: 3385. https://doi.org/10.3390/su11123385
Note that from the first issue of 2016, this journal uses article numbers instead of page numbers. See further details here.