Fusion of Remote Sensing and Internet Data to Calculate Urban Floor Area Ratio


1
Beijing Key Laboratery of High Dynamic Navigation Technology, University of Beijing Information Science and Technology, Beijing 100101, China
2
Institute of Remote Sensing and Digital Earth, Chinese Academy of Sciences, Beijing 100094, China
3
Key Laboratory for Agro-ecological Processes in Subtropical Region, Institute of Subtropical Agriculture, Chinese Academy of Sciences, Changsha 410125, China
4
Huanjiang Observation and Research Station for Karst Ecosystem, Chinese Academy of Sciences, Huanjiang, Hechi 547100, China
5
Department of Geography & Geosciences, University of Louisville, Louisville, KY 40292, USA
*
Author to whom correspondence should be addressed.
Sustainability 2019, 11(12), 3382; https://doi.org/10.3390/su11123382
Submission received: 9 April 2019
/
Revised: 6 June 2019
/
Accepted: 14 June 2019
/
Published: 19 June 2019
Abstract
:The floor area ratio is a comprehensive index that plays an important role in urban planning and sustainable development. Remote sensing data are widely used in floor area ratio calculations because they can produce both two-dimensional planar and three-dimensional stereo information on buildings. However, remote sensing is not adequate for calculating the number of floors in a building. In this paper, a simple and practical pixel-level model is established through defining a quantitative relationship among the floor area ratio, building density, and average number of floors (ANF). The floor area ratios are calculated by combining remote sensing data with publicly available Internet data. It incorporates supplemental map data and street-level views from Internet maps to confirm building types and the number of floors, thereby enabling more-accurate floor area ratio calculations. The proposed method is tested in the Tiantongyuan neighborhood, Changping District, Beijing, and the results show that it can accurately approximate the number of floors in buildings. Inaccuracies in the value of the floor area ratio were found to be primarily due to the uncertainties in building density calculations. After performing systematic error correction, the building density (BD) and floor area ratio were each calculated with the relative accuracy exceeding 90%. Moreover, the experiments verified that the fusion of internet map data with remote sensing data has innate advantages for floor area ratio calculations.
1. Introduction
The floor area ratio is the ratio of the floor area of a building to the total area of the construction lot. It is a comprehensive index that reflects the amount of built floor space therein and the distribution of land value. The floor area ratio first became an important index in 1957 when it was used as part of the United States land management system. From that point onward, it has been studied and applied in various ways around the world [1,2]. Existing studies have considered that the floor area ratio could be the second-best policy for discussing issues such as population density, heat island intensity or geology–environmental capacity in a specific area [3,4,5]. Therefore, as an important indicator in planning, the floor area ratio has been widely used in urban management and sustainable development by government and planners [6,7]. Practical use of the floor area ratio depends on its calculation accuracy. The methods used to calculate the floor area ratio have developed in accordance with advancements in technology. Early methods depended on field surveying to obtain the number of floors and construction area data, or collecting the population density, gross domestic product, environmental capacity, and other factors [2]. However, as Dai [8] contended, none of the above methods is practical because of high costs or inaccuracies. Furthermore, traditional methods for extraction of the building footprint mostly require manual calculation [9,10,11], which is time-consuming and not suitable for large-scale building footprint extraction.
Remote sensing technology is a highly efficient and convenient method for obtaining spatial data. It has thus been used in floor area ratio investigations. Based on the remote sensing data, the footprint and the height of a building can be extracted directly, and then the building floor area can be calculated. This approach, based on image segmentation and classification, is a common method of building footprint extraction [12,13]. However, the complexity of buildings and backgrounds has caused this method to be not highly accurate, especially for obtaining the precise contours of the shape of a building [14]. Recent studies [15,16] have proposed a building footprint extraction method based on an object approach. A detection accuracy of 83.8% [17] and 90.5% [18] can be achieved for building objects. However, the extracted building footprints may not be in good agreement with the actual building edges.
Three methods based on the use of remotely sensed data have been used to extract the height of buildings. One method extracts the building height from the length of its shadow in a single image [19,20]. However, in many cases the shadows of buildings and trees may overlap with each other, making it difficult to distinguish and extract the shadow of the building. Another approach to obtaining building heights is the stereo pair method, which relies on classic photogrammetry techniques. It is a more direct and accurate method than the shadow approach [11,21]. Garouani [22] used aerial stereo image pairs with a ground sampling distance of 10 cm to extract the height of the building. The error of the automatic results proved to be ±22 cm. Light detection and ranging (LiDAR) technology is a new method to extract the height information of buildings that measures reflections of emitted lasers to directly obtain building height data and acquire more-accurate results than that from stereo imaging. Application results indicate an accuracy of over 90% [23,24,25]. However, the application of LiDAR technology often required expensive airborne LiDAR surveys compared with using satellite imagery or unmanned aerial vehicle (UAV) images [26].
Although remotely sensed images have been applied to extract the footprint and height of buildings, most existing methods based on remote sensing data divide the extraction of building footprints and building height into two independent processes, making the process of floor area ratio calculation relatively complex and difficult to automate [27,28]. Furthermore, some other limitations still remain in the calculation of the floor area ratio. For example, the footprint and height of a building from remote sensing data would be the most effective data for floor area ratio calculations, if there were a uniform floor height within all kinds of buildings and all buildings had no additional decorative structures [20]. However, decorative structures on rooftops or semi-basements are common. Similarly, buildings with different functions often have different floor heights, and the use of different floor heights in calculations results in different floor area ratios. Therefore, interference of decorative structures and floor heights of different types of buildings might affect the accuracy of floor area ratio calculation while using remote sensing data. Compared with the remote sensing data from vertical observations, some additional data sources from horizontal observations should be better for determining decorative structures and building floor heights and can finally be used in the process of calculating the floor area ratio.
Large amount of street maps are available online. They provide an immense amount of data on the locations, sizes, and uses of innumerable buildings [29,30]. Street-view data from internet maps include 360° views of the surroundings compiled from photographs obtained at the street level. These images include detailed information on building profiles that can be used for determining decorative structures or building types. Therefore, it is important to utilize the data from these maps as complimentary limitations in the remote sensing data used to calculate floor area ratios.
This study attempts to propose a new executable process for calculating floor area ratios. This proposed method modifies the calculation theory to simplify the process of floor area ratios, with pixels used as the smallest unit of a building. It also combines remote sensing with internet map data easily to improve the accuracy of floor area ratio calculation.
2. Test Area and Data
The Tiantongyuan neighborhood of Changping District, Beijing, was used as the test area for this study. This neighborhood is Beijing’s largest, most rapidly developing, and densely populated community. In addition, it has the highest density of buildings of any neighborhood in Beijing. Major development in Tiantongyuan occurred between 1999 and 2010. Its area is approximately 490,000 m2. Its buildings are predominantly residential; however, it also has schools, administration offices, businesses, factories, and so on.
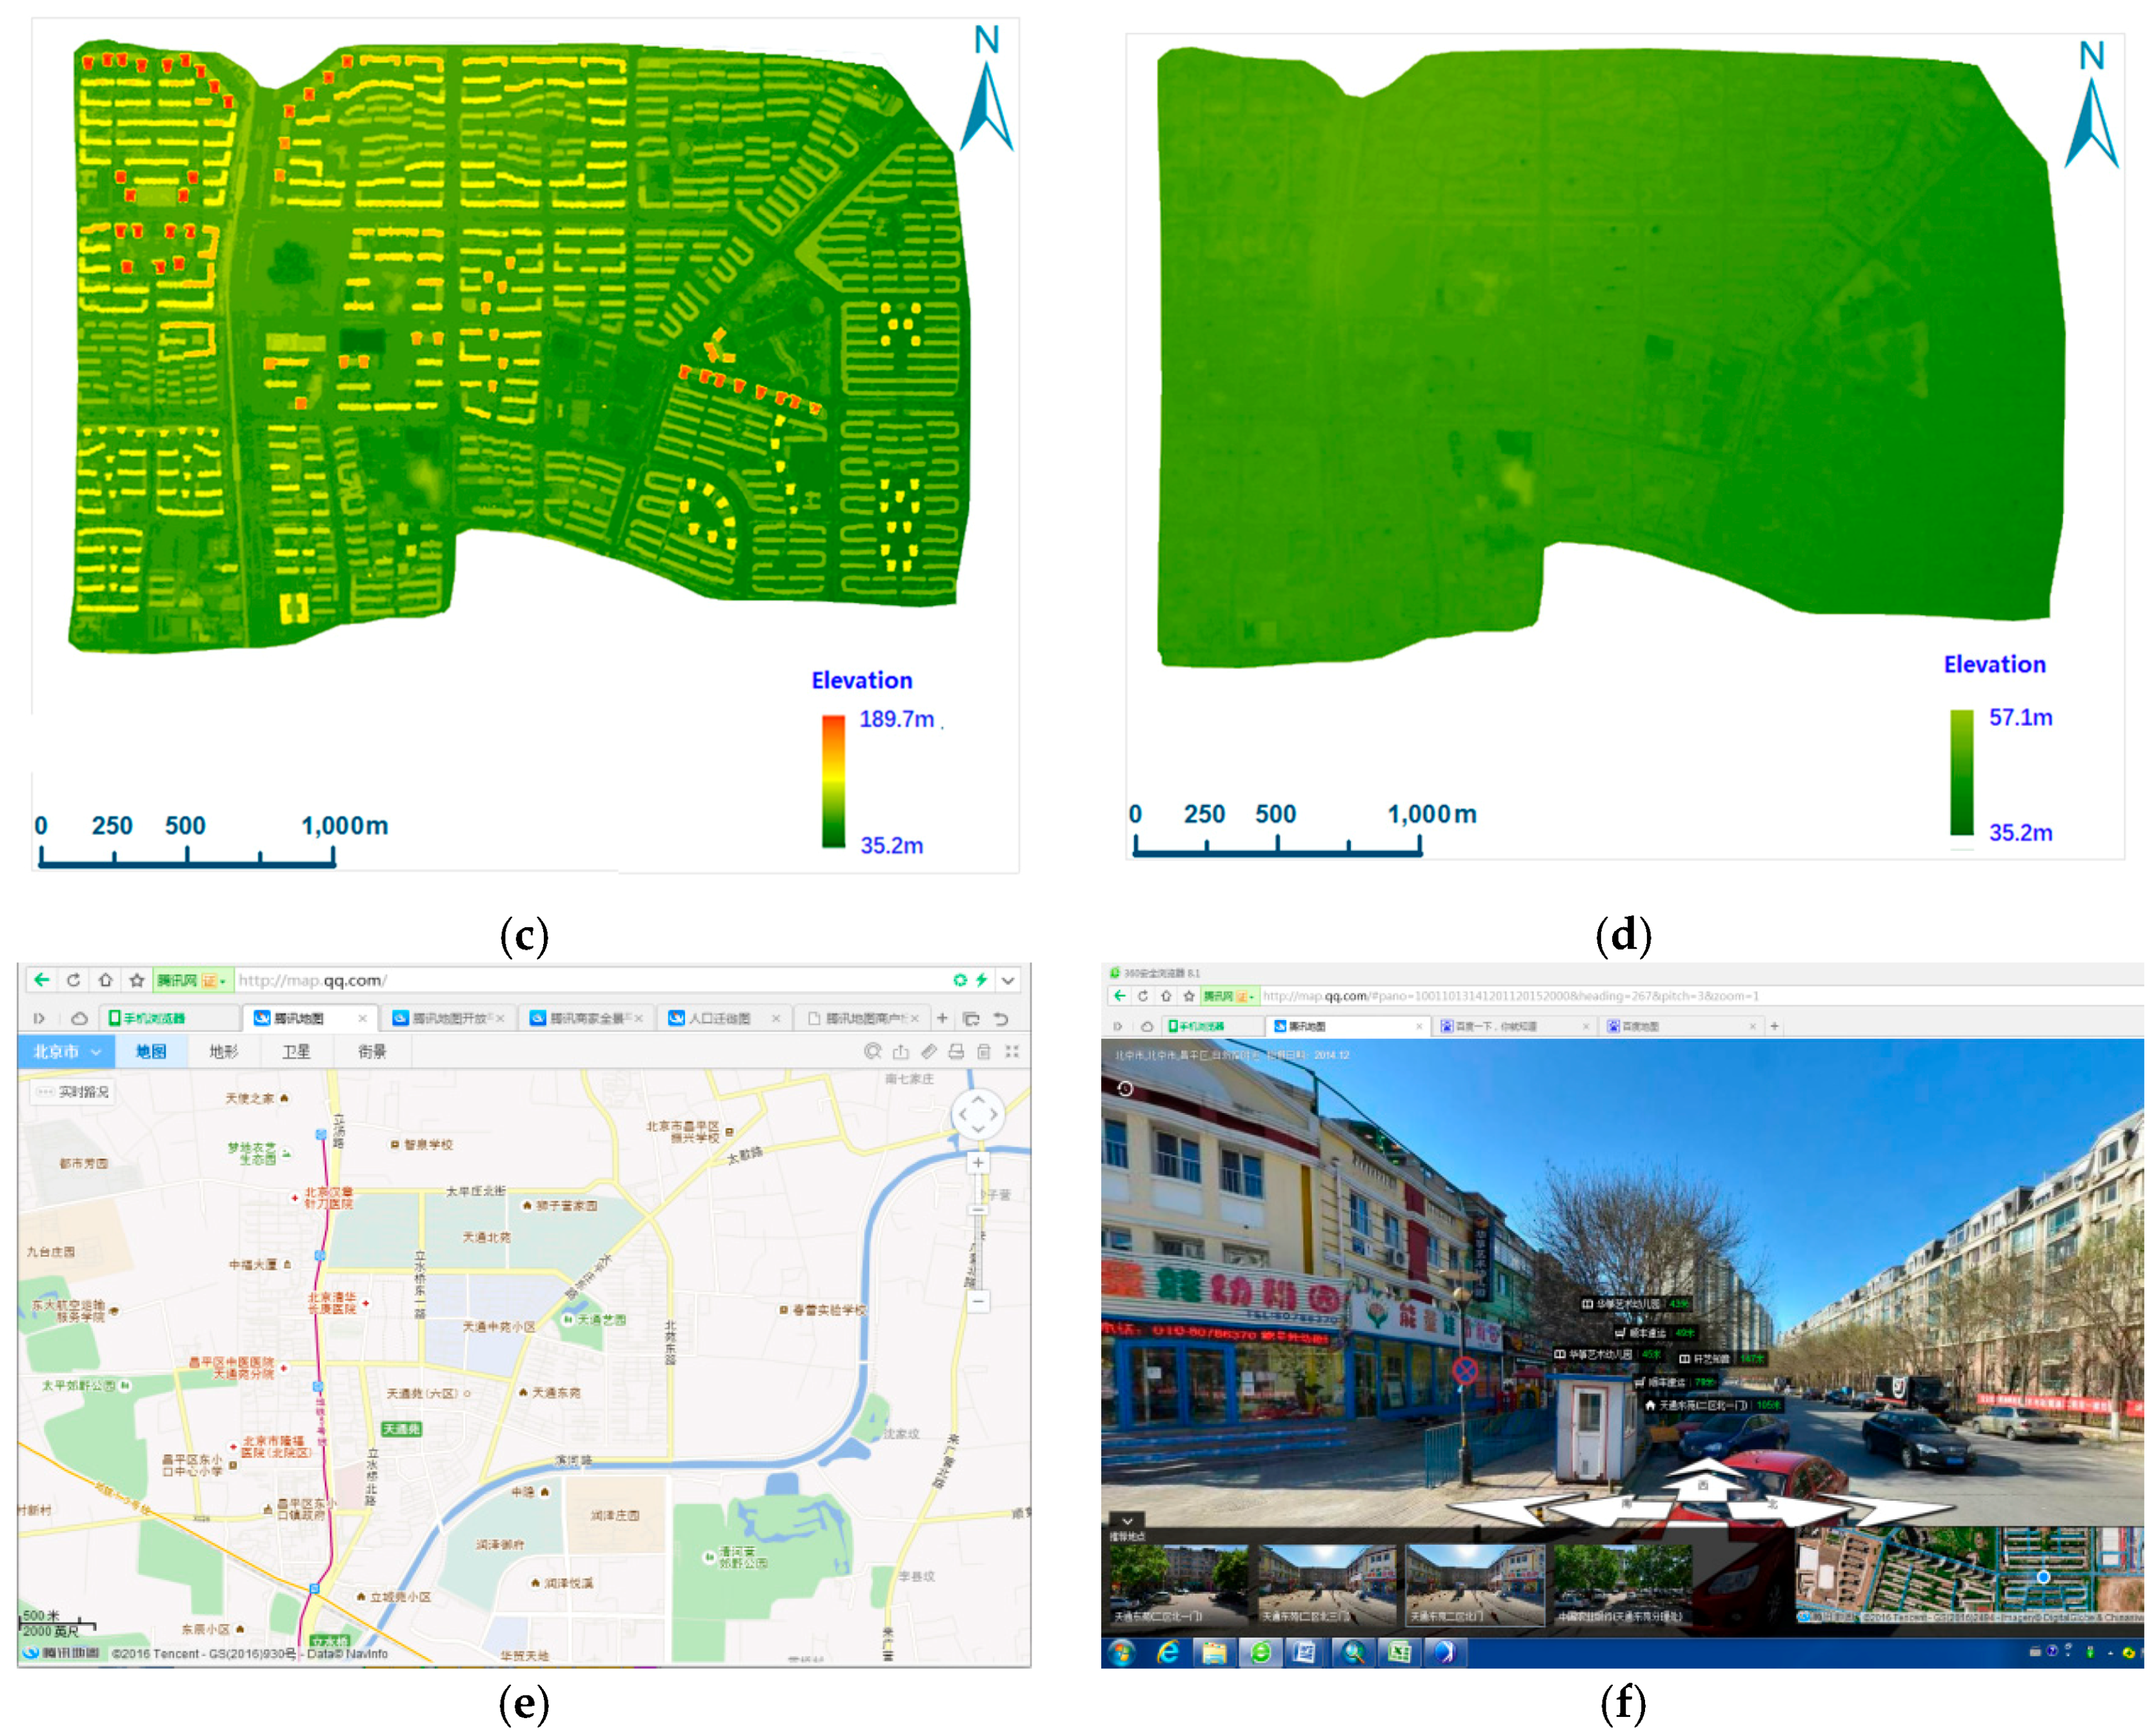
A stereo pair of the area was obtained by the Leica Airborne Digital Sensors 40 (ADS40) in 10 May 2009 with a spatial resolution of 0.5 m. It included blue–green–red and near-infrared bands. After orthorectification, a digital orthophoto map (DOM) was created. A digital surface model (DSM) was generated by dense image matching based on the ENVI software package. Digital terrain models (DTM) were created using a multidirectional slope-dependent (MSD) filtering method [31]. The accuracies of DSM and DTM were validated using 40 collected points (x, y, z) in the field survey. The DOM resolution was 0.5 m (Figure 1a). The absolute positioning accuracy and relative elevation accuracy was approximately 1 m. The digital surface model (DSM) included 3D information about the land surface and the objects on it (Figure 1c). The digital terrain model (DTM) was a filtered DSM that retained 3D information on the land surface but excluded all buildings, vegetation, and so on from the land surface (Figure 1d).
A vector map including neighborhood borders, roads, public parks, place names, building use information, and so on was obtained from Tencent Maps (http:/map.qq.com) (Figure 1e). The supplemental information for calculating the floor area ratio, such as neighborhood boundaries and building usage, was obtained by analyzing the map data. Tencent Maps provided 360° street-level views of the area (Figure 1f) along with information on the number of floors in the buildings. Most of the street scenes in the experimentation area were recorded in March 2012.
To evaluate the calculations in this study, the floor area ratio survey data for the study area were obtained from the Beijing Changping District Urban Planning Commission. The Planning Commission’s survey data, such as vector representations of buildings, building types, building floor heights, and construction dates (Figure 1b), were collected between July 2009 and January 2010. The Planning Commission’s building maps were manually created using remote sensing images, topographical maps, planning maps, and other resources.
3. Methods
3.1. Built New Calculation Theory
The floor area ratio is the ratio of the total floor area of a region to its build-up area. It is important to note that the built-up area (BA) includes all land designated as a construction area, not just the building footprints. In a construction plot, assume there are n pixels of land inside the building footprints, and m pixels of land outside the footprints. Additionally assume that one pixel is the smallest unit of area to be considered, and this one pixel area is defined as Sp. The number of building floors corresponding to the ith pixel is defined as Ni. Accordingly, Equations (1) to (6) are obtained.
The built-up area (BA) of a region is the product of the number of pixels and the area per pixel. That is,
The building density (BD) of a region is the ratio of the area occupied by the buildings to the build-up area (BA). That is,
The floor area (FA) of a region is the sum of the areas of all floors of all buildings in the region. It is calculated by multiplying the number of floors in each building by the footprint of a given building, then summing all the buildings in the region. In this study, FA is the number of floors corresponding to the ith building pixel (Ni) times the area of one pixel (Sp), summed across all (n) building pixels in the region. Therefore,
The average number of floors in the region (ANF) is
According to the floor area ratio definition, one thus has
Equations (2) and (4) are substituted into Equation (5) to obtain:
Equation (6) establishes the relationship between three parameters: the floor area ratio, building density, and average number of floors. The building density describes the 2D distribution characteristics of buildings, and the average number of floors describes the third dimension of buildings, namely the height. Together, these three parameters are convenient for use in urban planning and land management applications.
Equation (6) indicates that when a pixel is used as the smallest unit of a building, the floor area ratio of a region can be produced by two independent parameters (i.e., the building density and the average number of floors of the region). The two parameters are obtained from the scale of the whole region by using Equation (6) to realize the conversion from the pixel scale to the region scale. Through this type of transformation, it is not necessary to perform the calculation for each building at the time of calculating the floor area ratio of a region; rather, the entire region can be considered in one step. This significantly decreases the calculation complexity and simplifies the calculation process. Secondly, Equation (6) divides the floor area calculation into calculations of two independent parameters. These two parameters have a clear physical meaning and can each be calculated in independent ways. Thus, it is very convenient to integrate other non-remote sensing data to improve the accuracy of the results obtained from remote sensing data. This is extremely helpful in controlling the accuracy of the final floor area ratio calculation. For example, street-level view data can be used to correct the average number of floors.
3.2. Calculation process
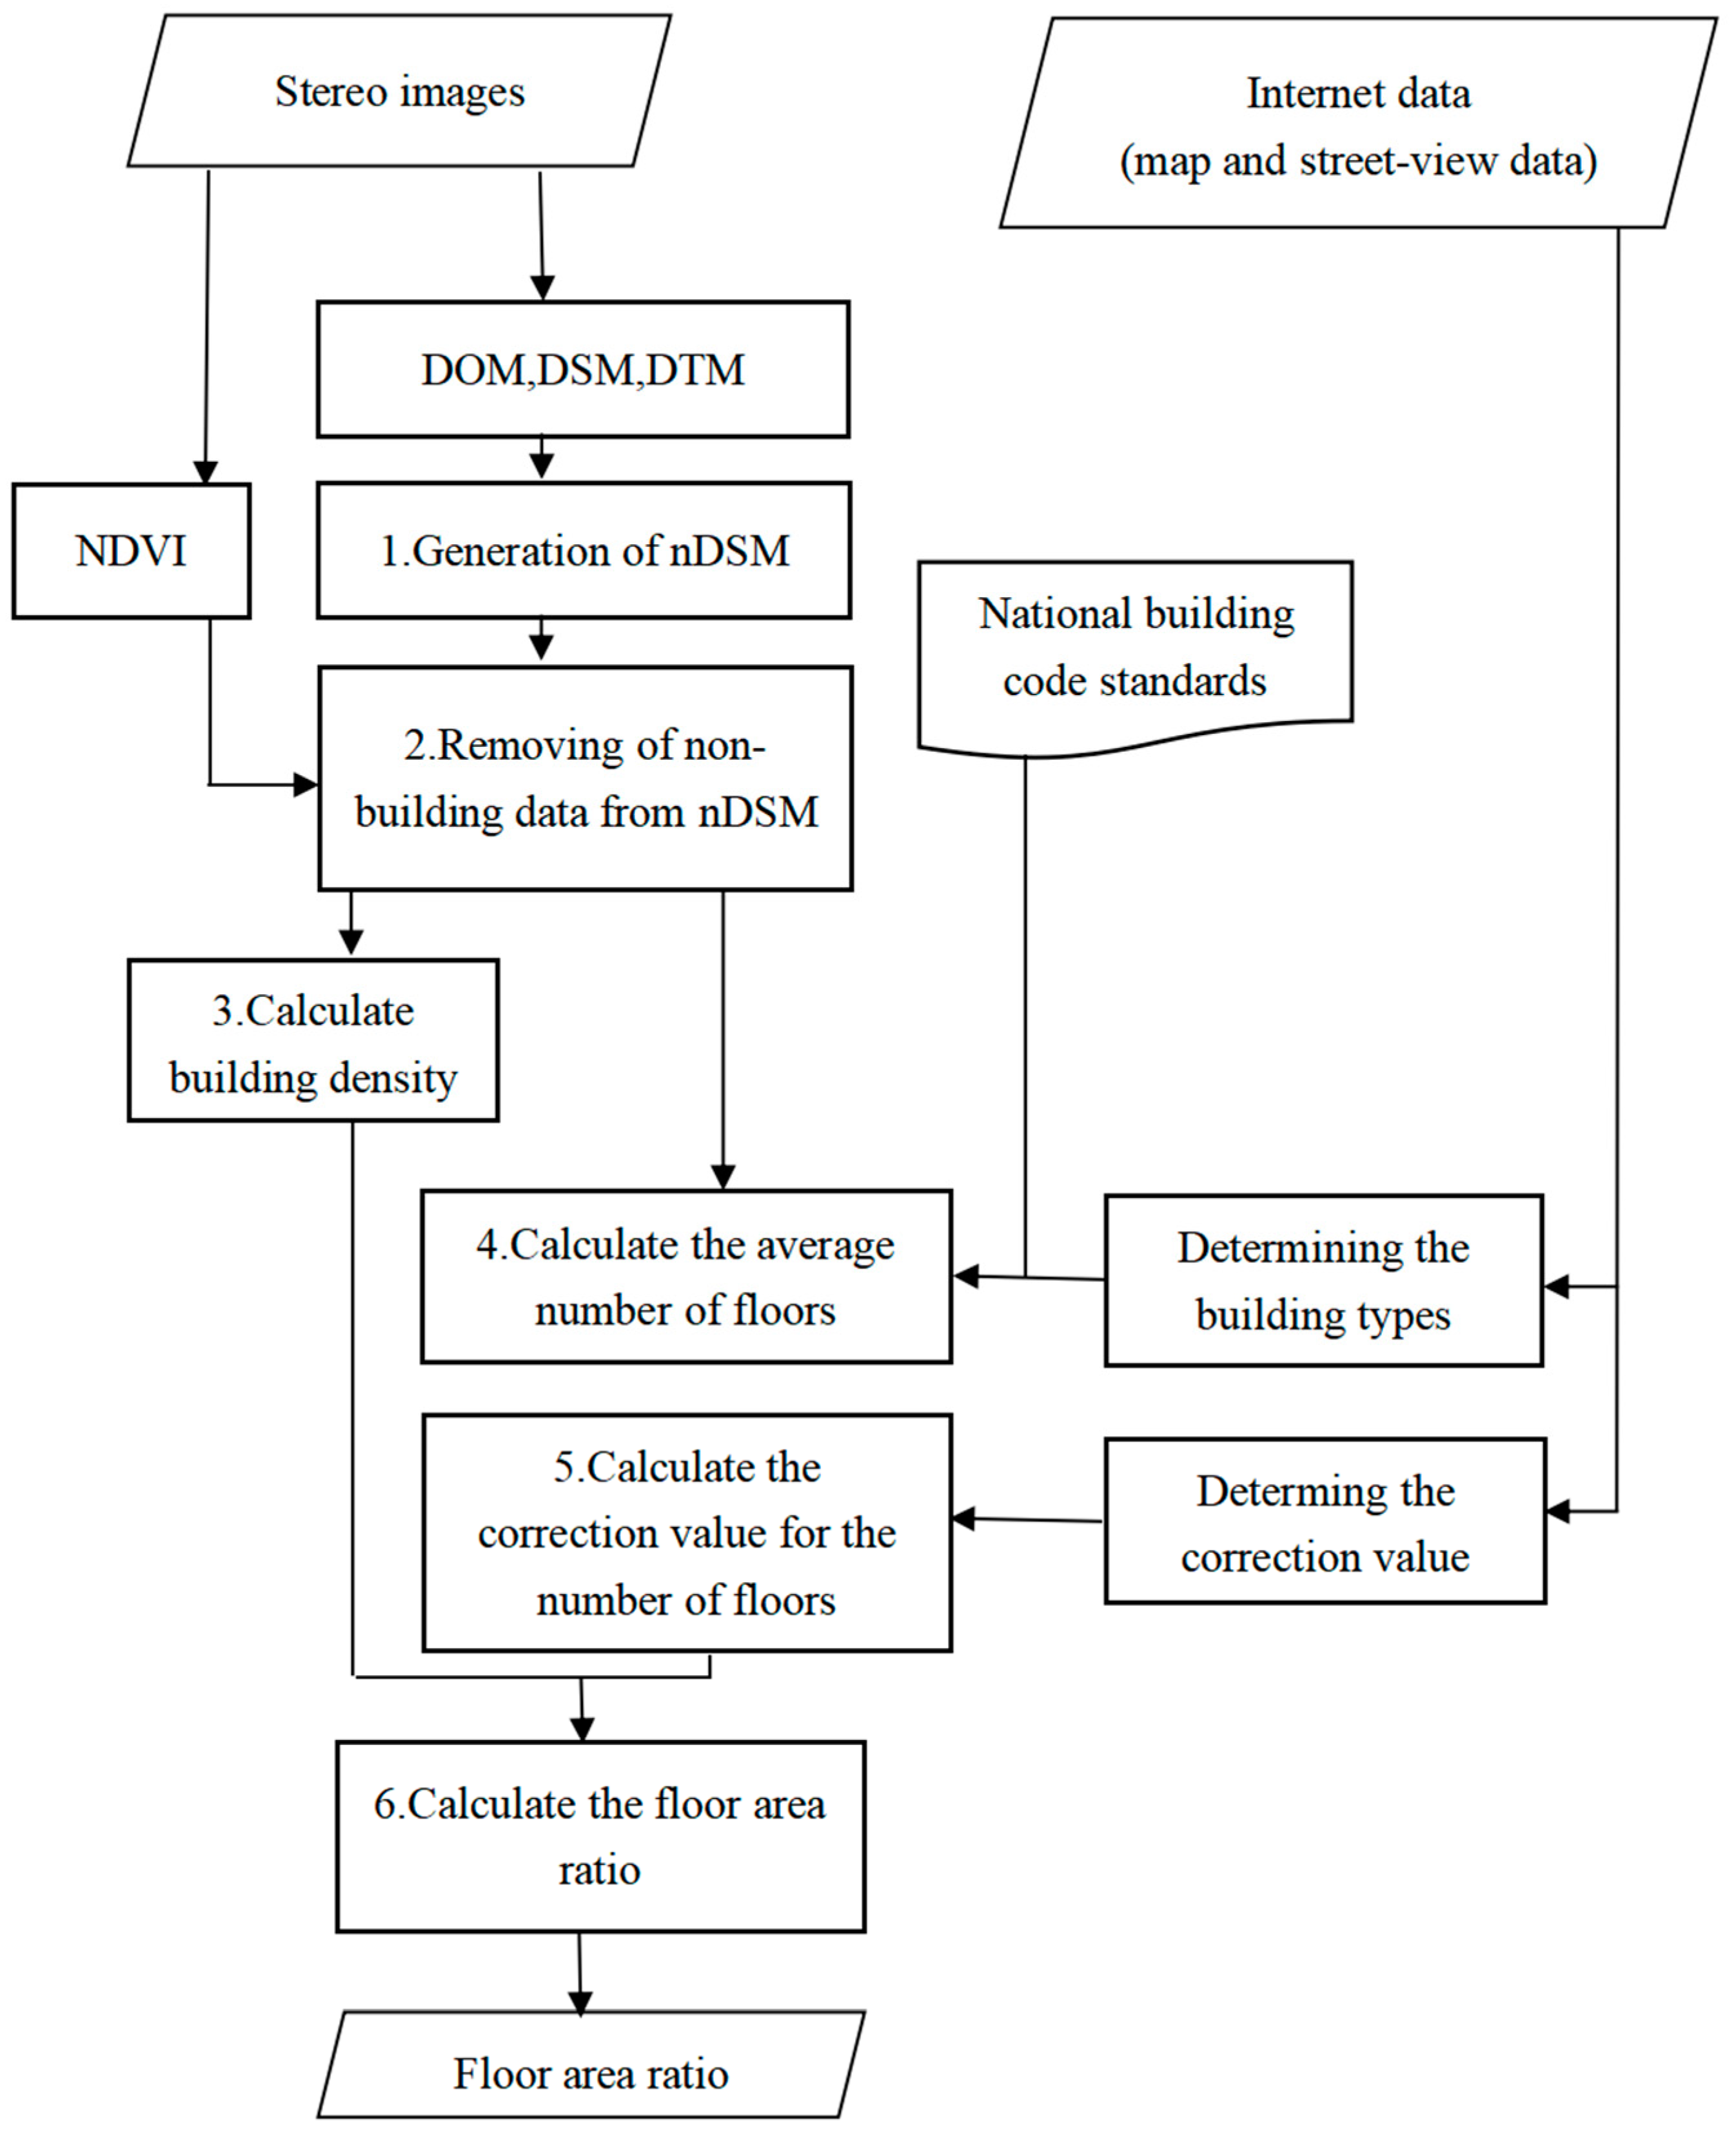
The proposed method employs pixels to calculate the floor area ratio. It is based on remote sensing and internet map data and includes the following six steps (Figure 2):
- (1)
- Generation of a normalized DSM (nDSM): An nDSM was computed as the difference between DSM and DTM [32]. Thus, the ground object net height rather than the absolute elevation was obtained.
- (2)
- Non-building data are removed from the nDSM: In the nDSM, it is necessary to remove noise from the elevation data of non-building targets, such as vegetation and vehicles. Vegetation is removed using a normalized difference vegetation index (NDVI) to isolate targets within a specified value range. The elevation of these targets is then set to zero in the nDSM. After removing vegetation targets, some noise remains at the edges of the vegetation zones. Other small targets on the surface, such as cars, can be regarded as noise. These two noise sources can be filtered using their respective height and area characteristics. Noise from objects beneath a specific height or smaller than a pixel area threshold are removed. The image of net building heights obtained in this way is labeled nDSM_b.
- (3)
- Calculate building density: Separately count the number of building pixels in the region (total number of pixels in nDSM_b with non-zero height values) and the number of non-building pixels in the region (total number of pixels in nDSM_b with height values equal to zero). Use Equation (2) to calculate the building density.
- (4)
- Calculate the average number of floors: To confirm the number of floors, it is necessary to confirm the height of a single floor. This is approximated using a constant that represents the average story height. This value is different for buildings of different types. Since building types cannot be determined using a stereo pair, this study incorporated internet maps as a supplementary source of information to confirm building types. It should be noted that internet maps show borderlines between different land parcels. They also contain abundant information about specific places, such as names and borders. Using these data, it is possible to determine the type and function of the buildings in each land parcel. Then, individual floor heights can be confirmed by referencing national construction code standards. Assuming that the height of the ith building pixel in a neighborhood is Hi, and the floor height corresponding to the type of building at the ith pixel is Ci, then the average number of floors (ANF) for the entire neighborhood is calculated using the following equation:where n is the number of pixels occupied by all the buildings in the given neighborhood.
- (5)
- Calculate the correction value for the number of floors in the neighborhood: In many circumstances, the heights of the pixels in nDSM_b cannot be directly used to calculate the number of floors in pixels occupied by buildings. For example, decorative or functional features added to building rooftops cannot be included in the calculation for the number of floors. In these types of circumstances, it is imperative to make corrections to the height or floor number. According to Equation (6), it is possible to use the average number of floors in the buildings throughout a neighborhood as a single unit in the calculation. The 360° photographs in street-level data from internet maps are an excellent source of information on the actual floor numbers and decorative structures of buildings. By using the street-level views from online maps, the buildings in the given neighborhood can be inspected and the average number of floors can be counted and corrected.
- (6)
- Calculate the floor area ratio: Using Equation (6), the corrected average number of floors in the neighborhood and the neighborhood building density can be multiplied to obtain the floor area ratio.
4. Results
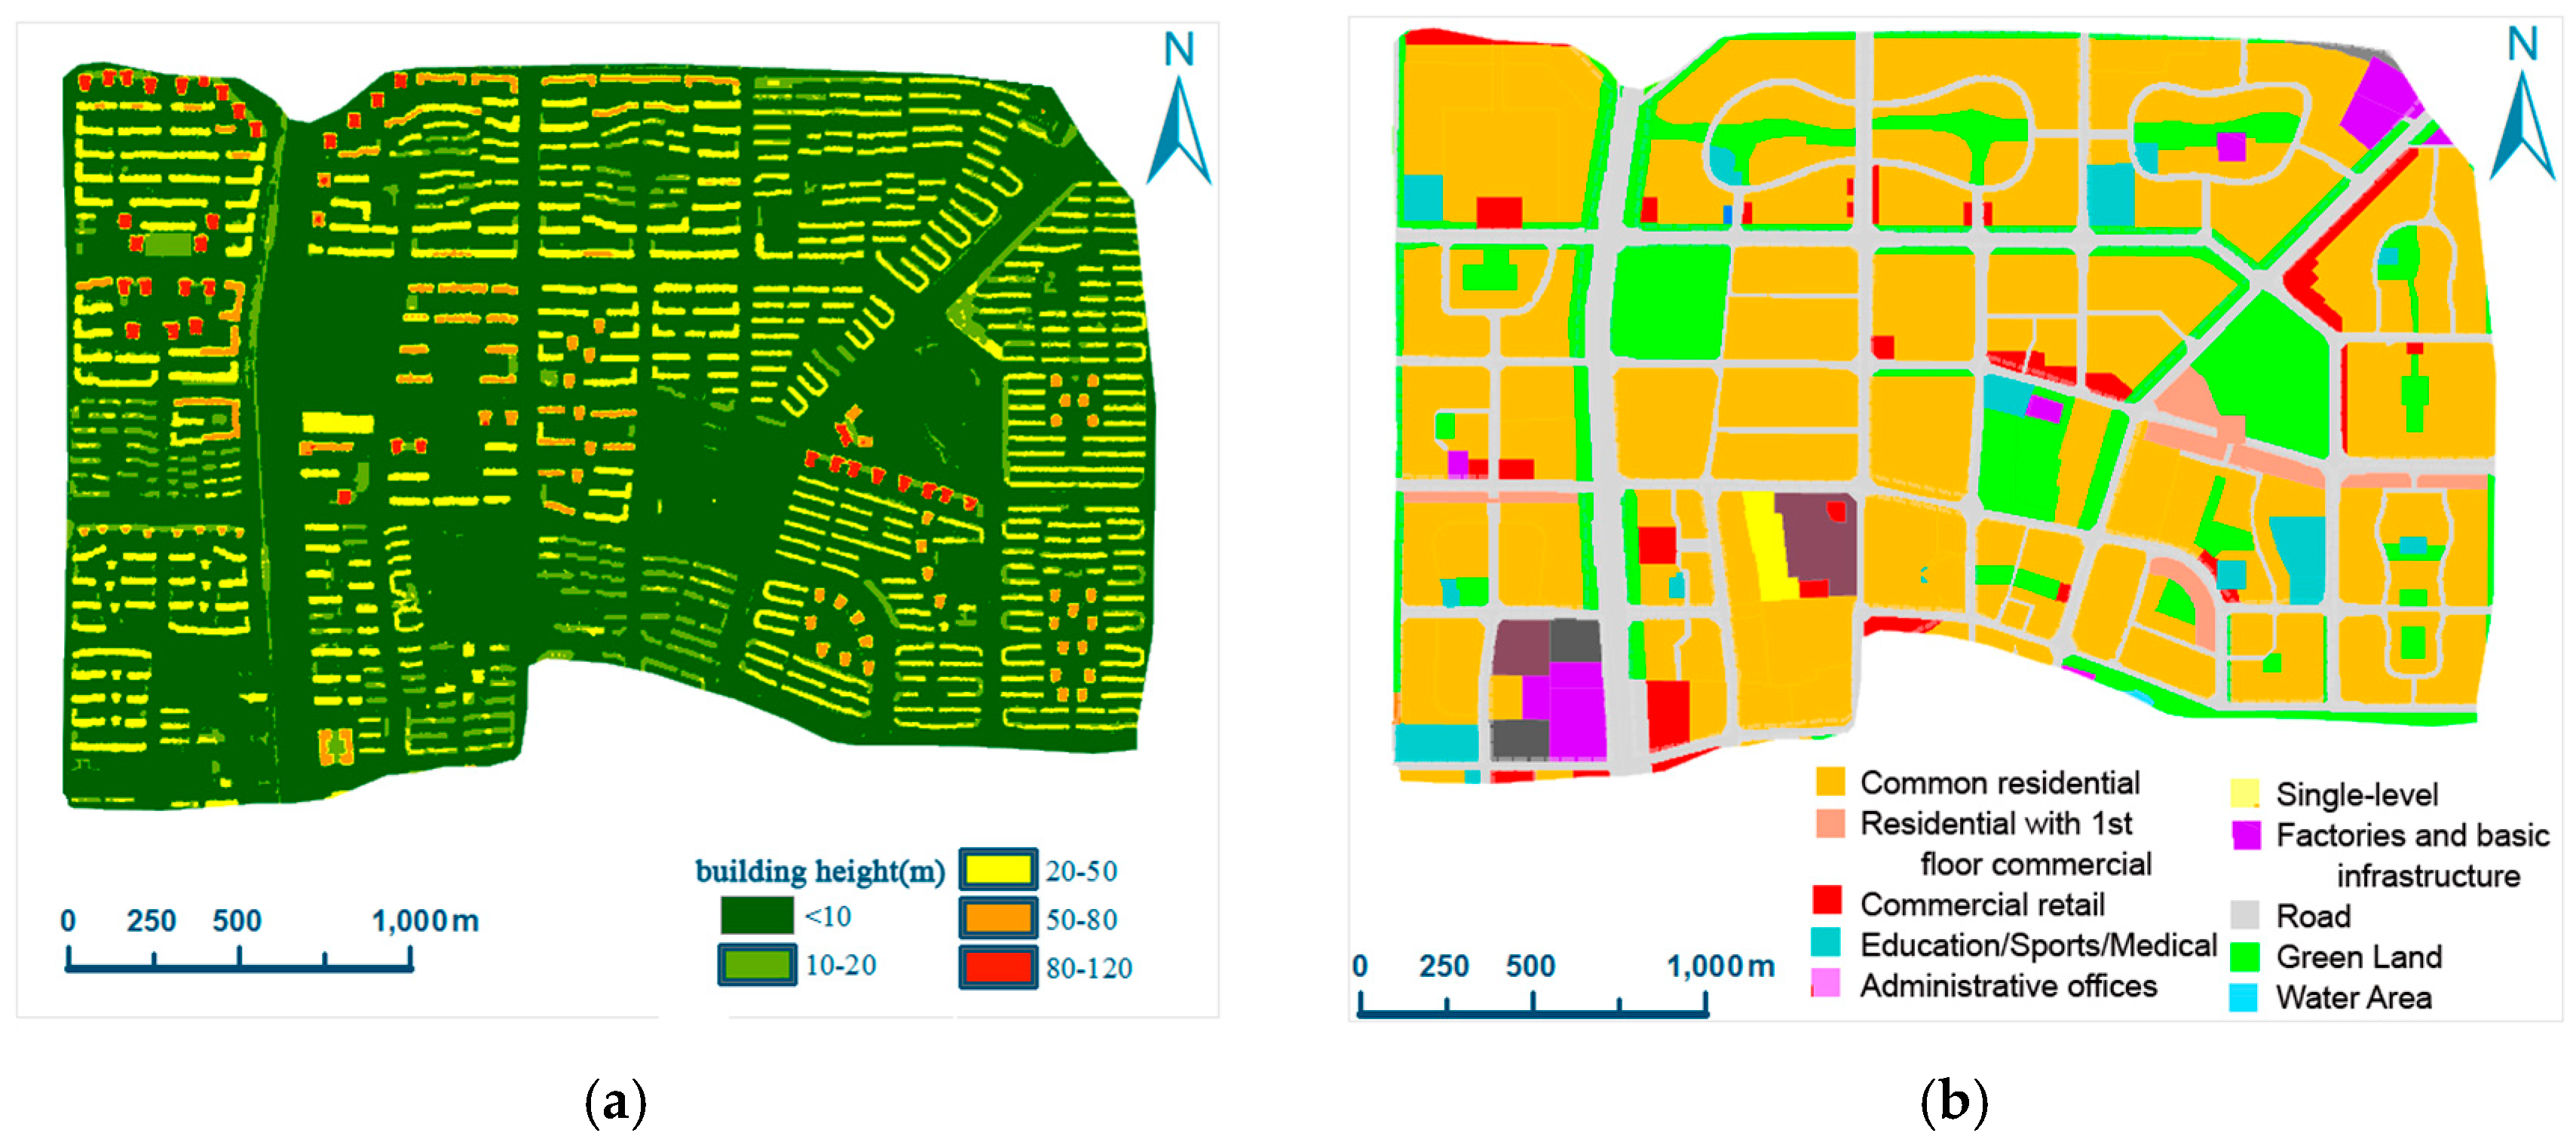
According to the proposed method and calculation process, the image of net building heights (nDSM_b) was produced based on the nDSM after removing the noise from the elevation data of non-building targets. A 3-m height threshold was used to filter pixels with a height value lower than 3 m, then a 50-pixel area threshold (equivalent to 50 m2) was used continuously to filter the noise in this step. Buildings with a height of more than 3 m and an area of more than 50 m2 were reserved (Figure 3a).
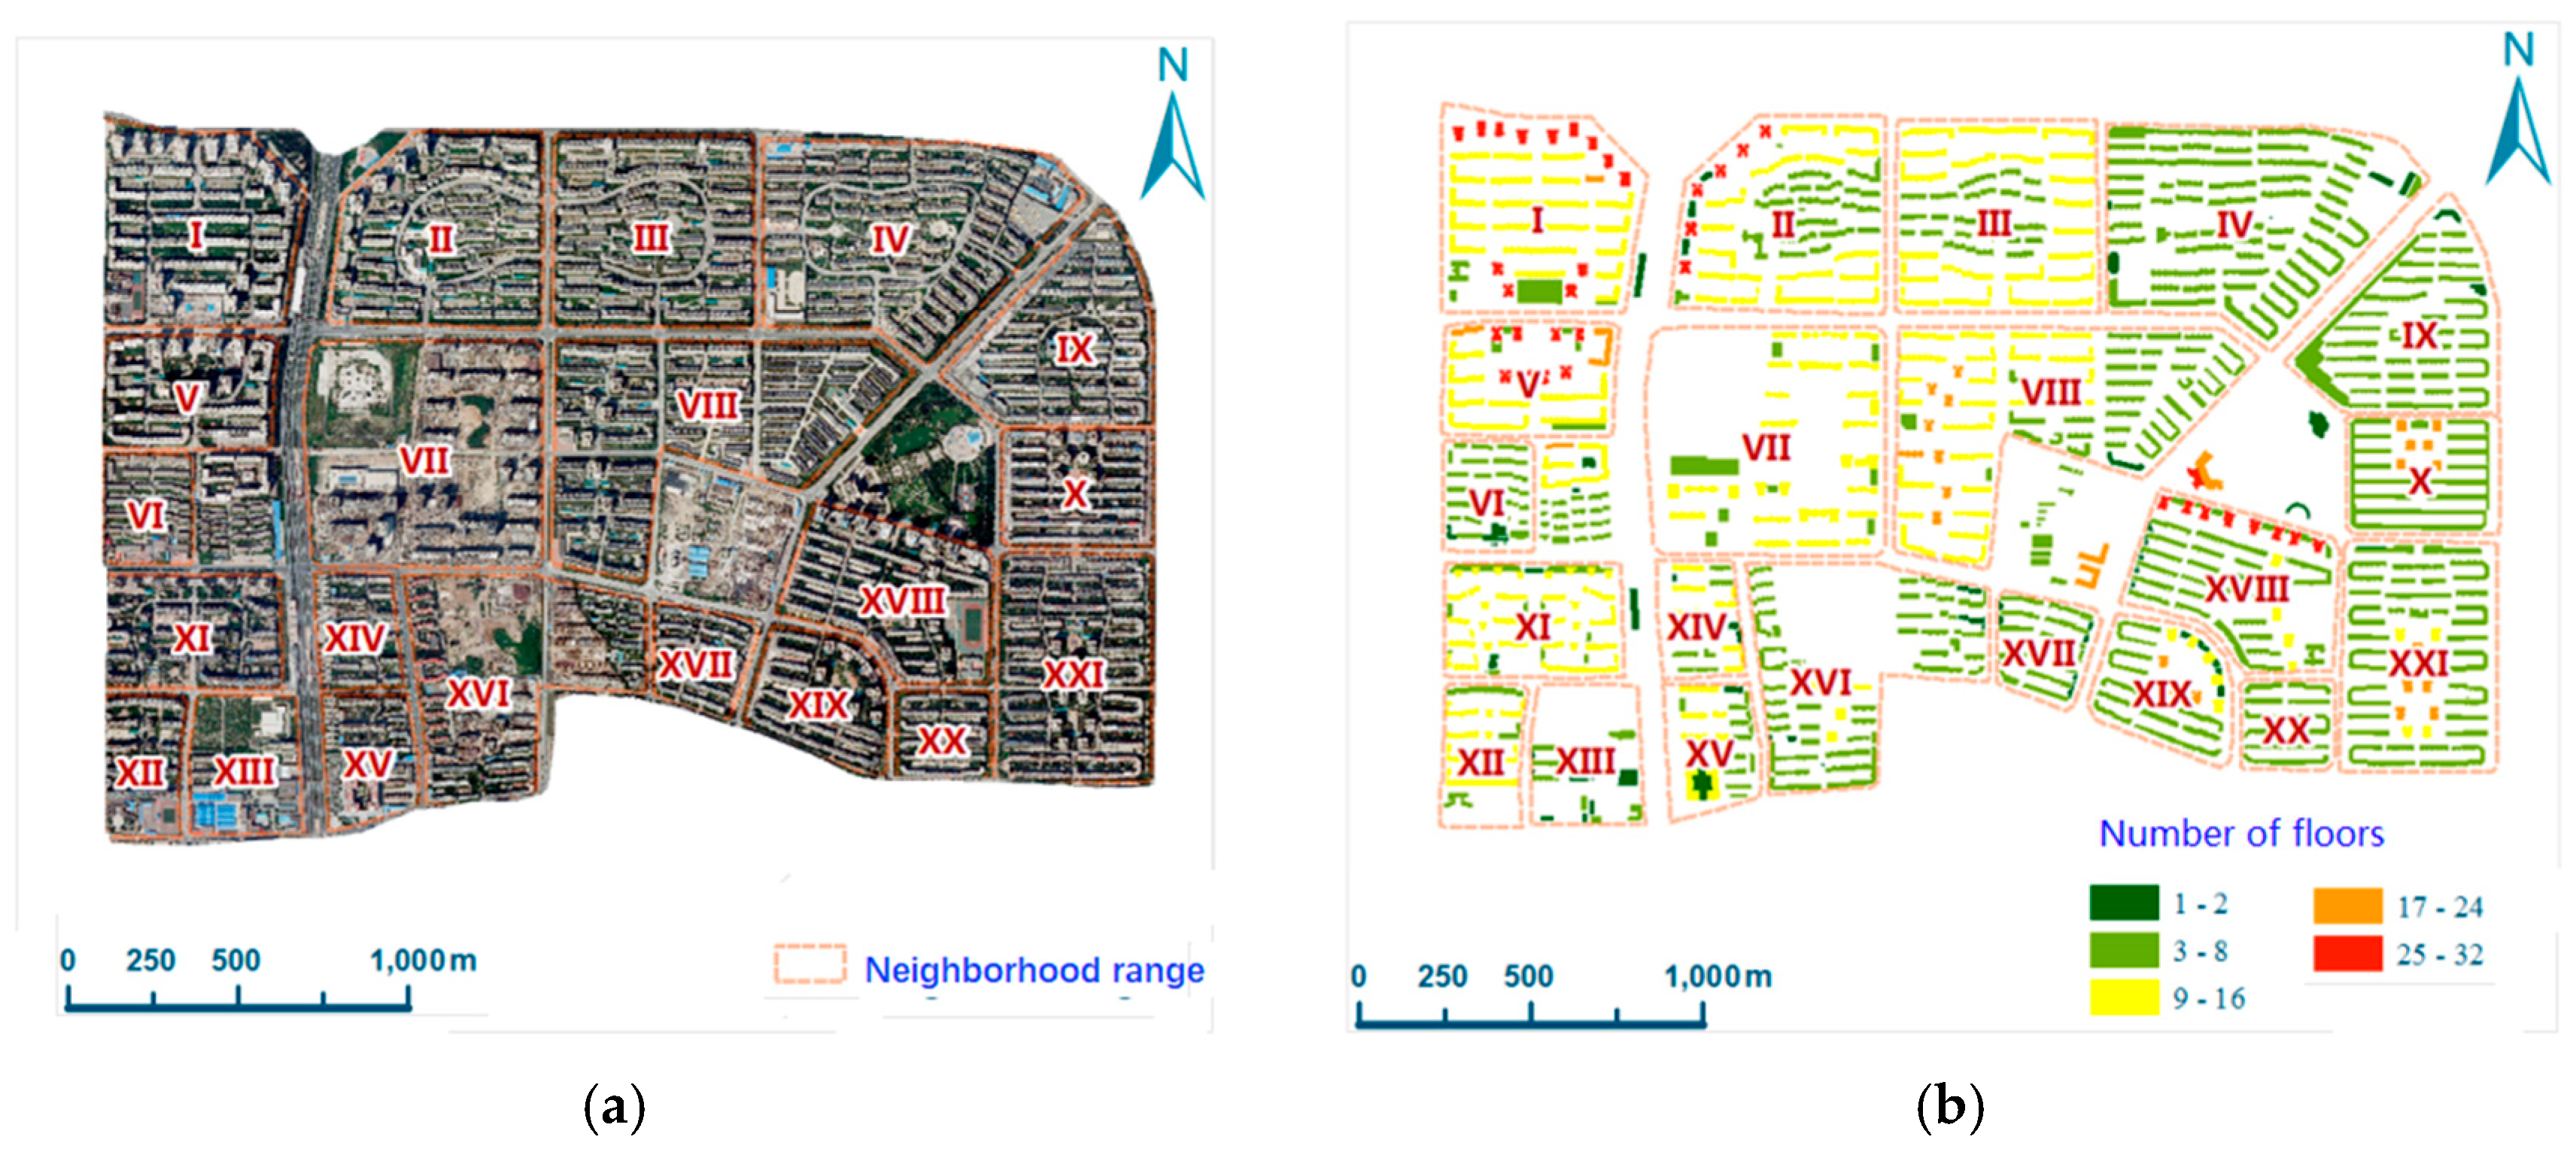
According to the range of surveyed land, the study area was separated into 21 subdivisions (Figure 1a,b). The borders between individual sub-neighborhoods within the study area were manually extracted from the internet maps. The land use types within the study area included construction land, roads, green spaces, and water bodies. The building types mainly included common residential buildings, residential buildings combined with commercial lower levels, commercial/retail buildings, education/sports/medical buildings, administrative office buildings, single-level buildings, factories, and basic infrastructure buildings (Figure 3b). The floor heights for each of these types of building were obtained from the National Building Code Standards [33] (Table 1).
The average numbers of floors of a neighborhood was calculated in two steps. First, the number of floors per pixel was calculated. All pixels in each polygon of Figure 3b are of the same type, and the same value of Ci was used in Equation (7). Then, the average values of all the pixels in the neighborhood were counted according to the boundary of the neighborhood. In theory, all the pixels belonging to the same building should have the same number of floors. In practice, however, the nDSM_b value of the pixels forming part of the same building may be slightly different, resulting in a different number of floors. In order to reduce the error, the nDSM_b was firstly smoothed. Then, the number of floors of each pixel is determined by the value 0.2 × C as a rounding step when it is saved.
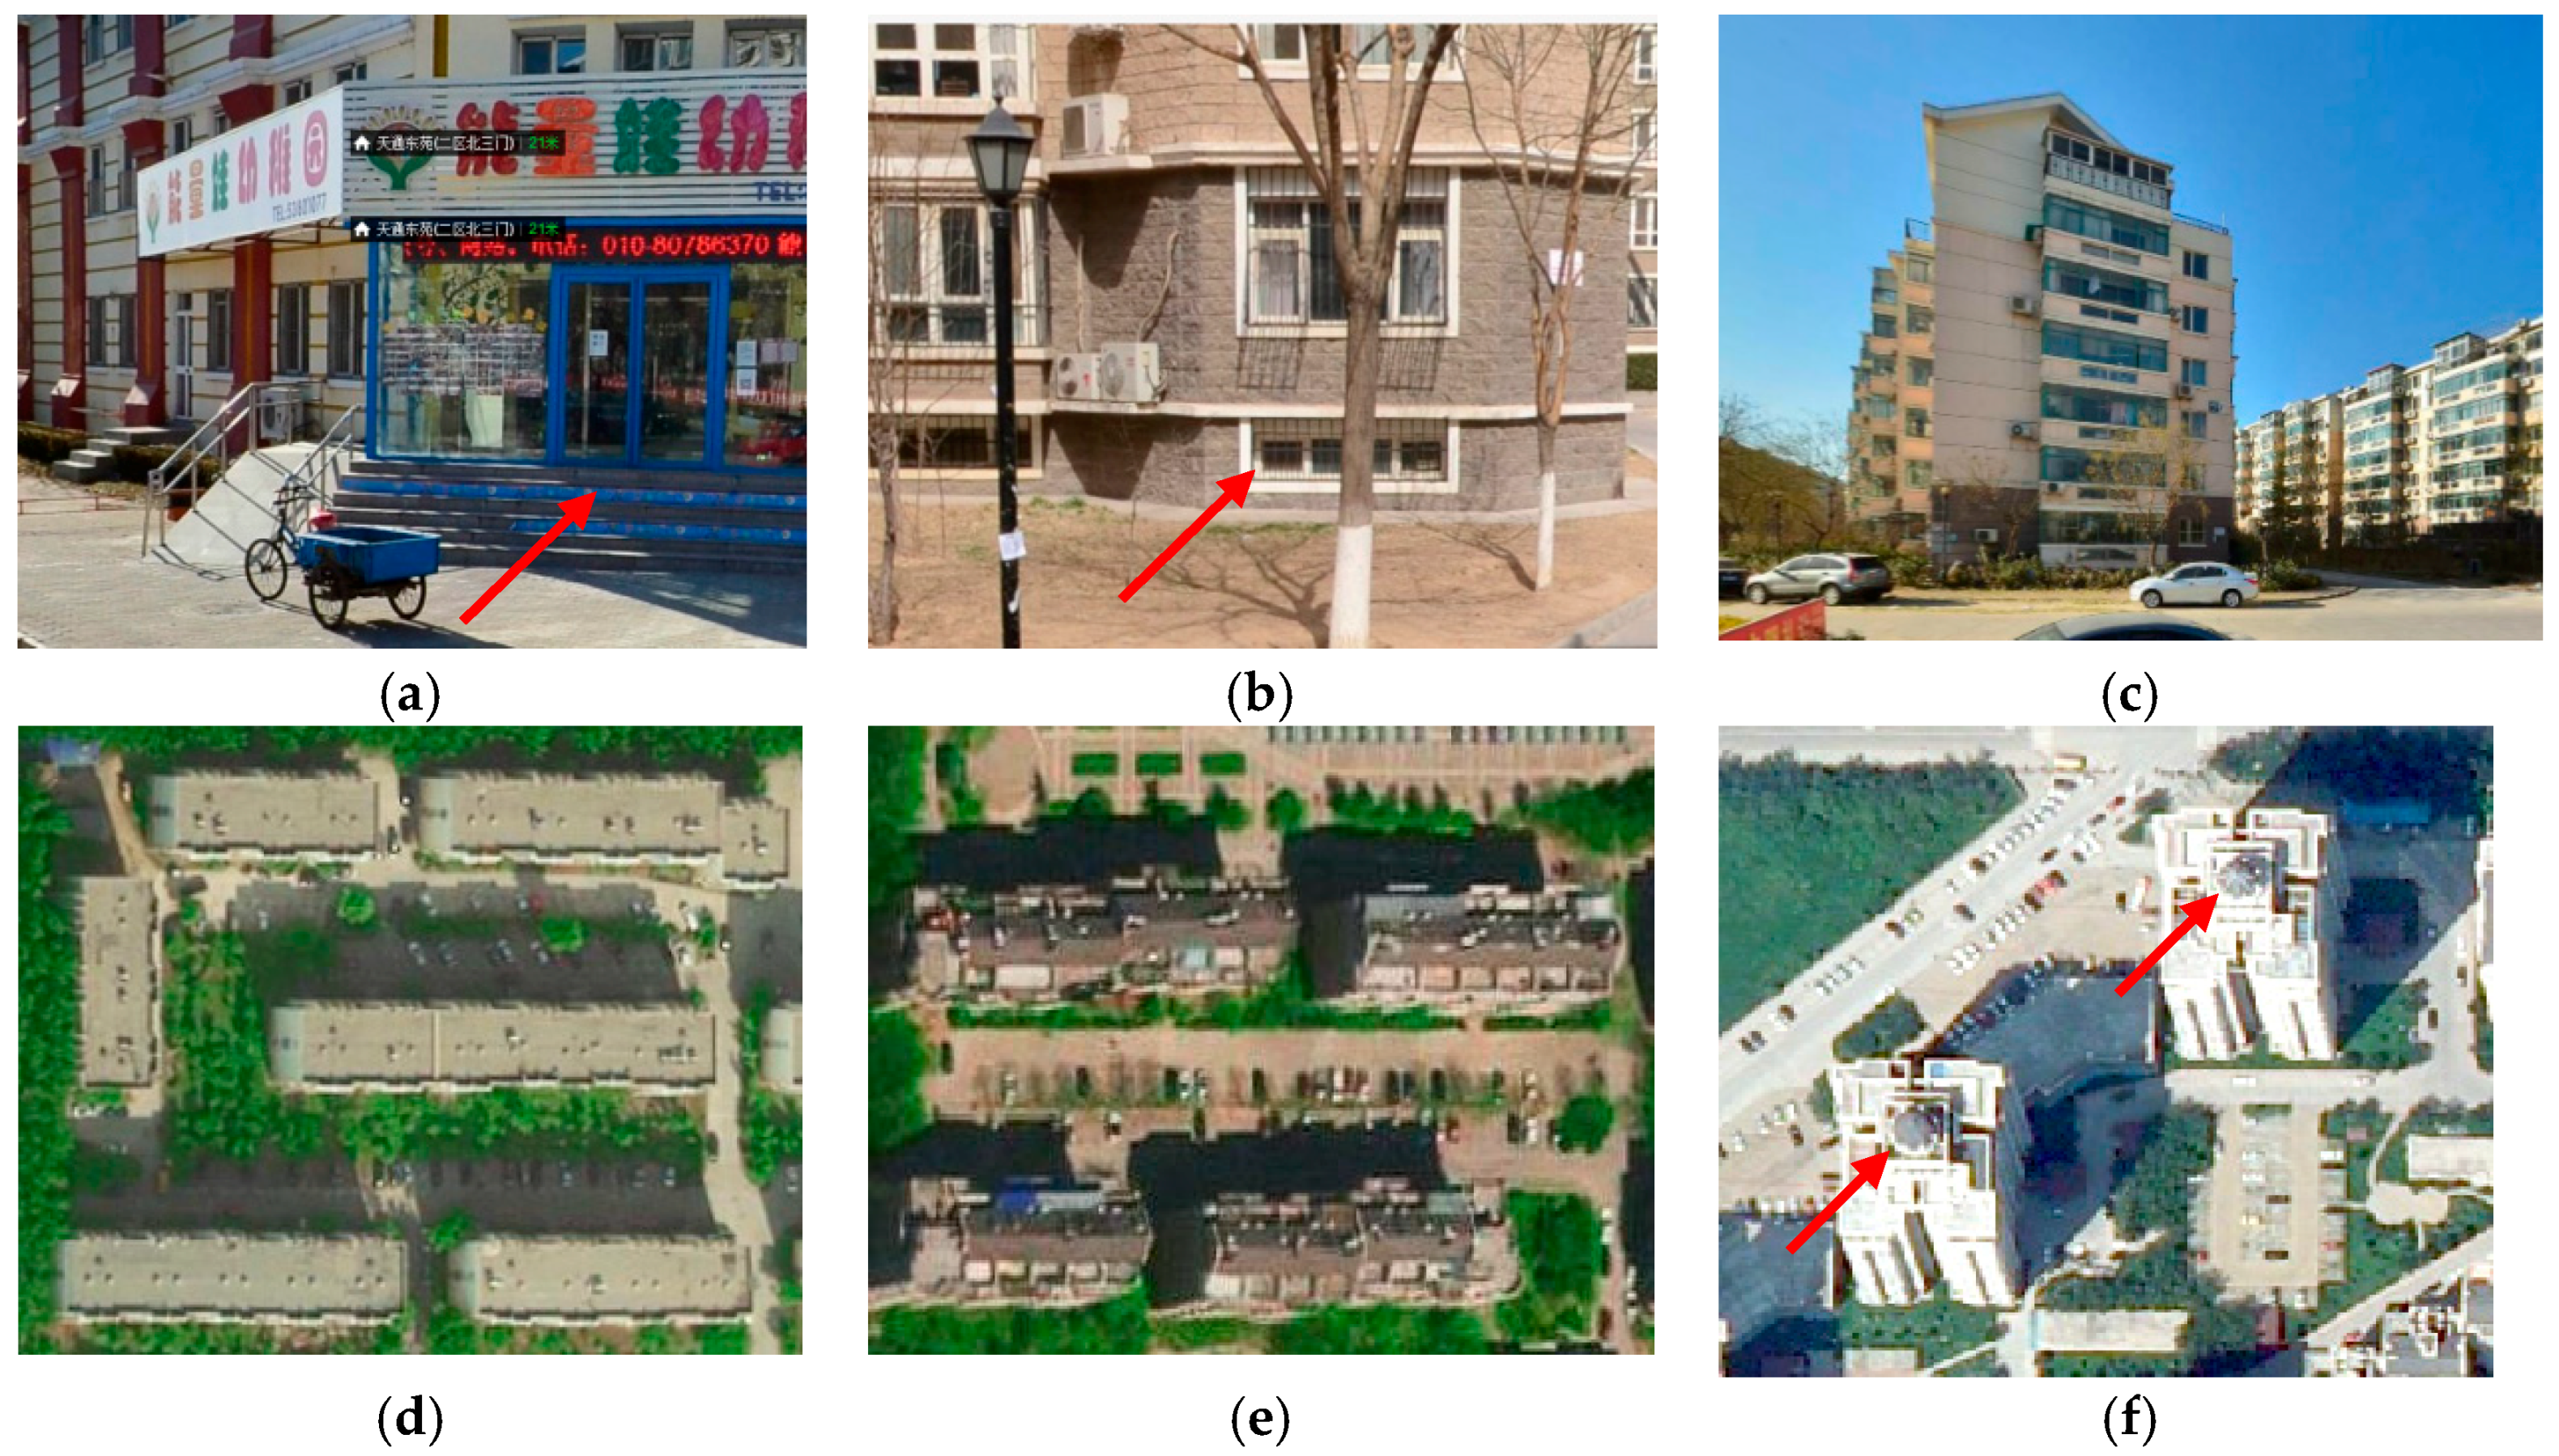
Both the bottom and top parts of the buildings were considered when correcting the number of floors. The bottom parts were examined using street-level views to determine whether the buildings were built on steps (Figure 4a) or had semi-basements (Figure 4b). To consider the tops of buildings, street-level views from internet maps were used to examine their facades (Figure 4c). DOMs were used to examine the roofs to consider whether the building tops were flat (Figure 4d), had lofts (Figure 4e), or had decorative or functional structures (Figure 4f). For high-rise buildings and buildings sheltered by trees, additional correction information was obtained through field investigation. Next, the National Building Code Standards (People’s Republic of China, Ministry of Construction, 2005) were referenced to correct the number of floors (Table 2).
The correction value of the ANF of each neighborhood was calculated in accordance with the following method:Assuming the correction value for each case in Table 2 is ΔFi, the proportion of these types of buildings in this neighborhood to all the buildings in the neighborhood is Ri, and the correction value of the ANF of the neighborhood ΔF is
We referred to the street-level views and DOM data and combined these with the field survey data in the experimentation area to estimate the correction values of the ANF for each neighborhood (Table 5, column 4).
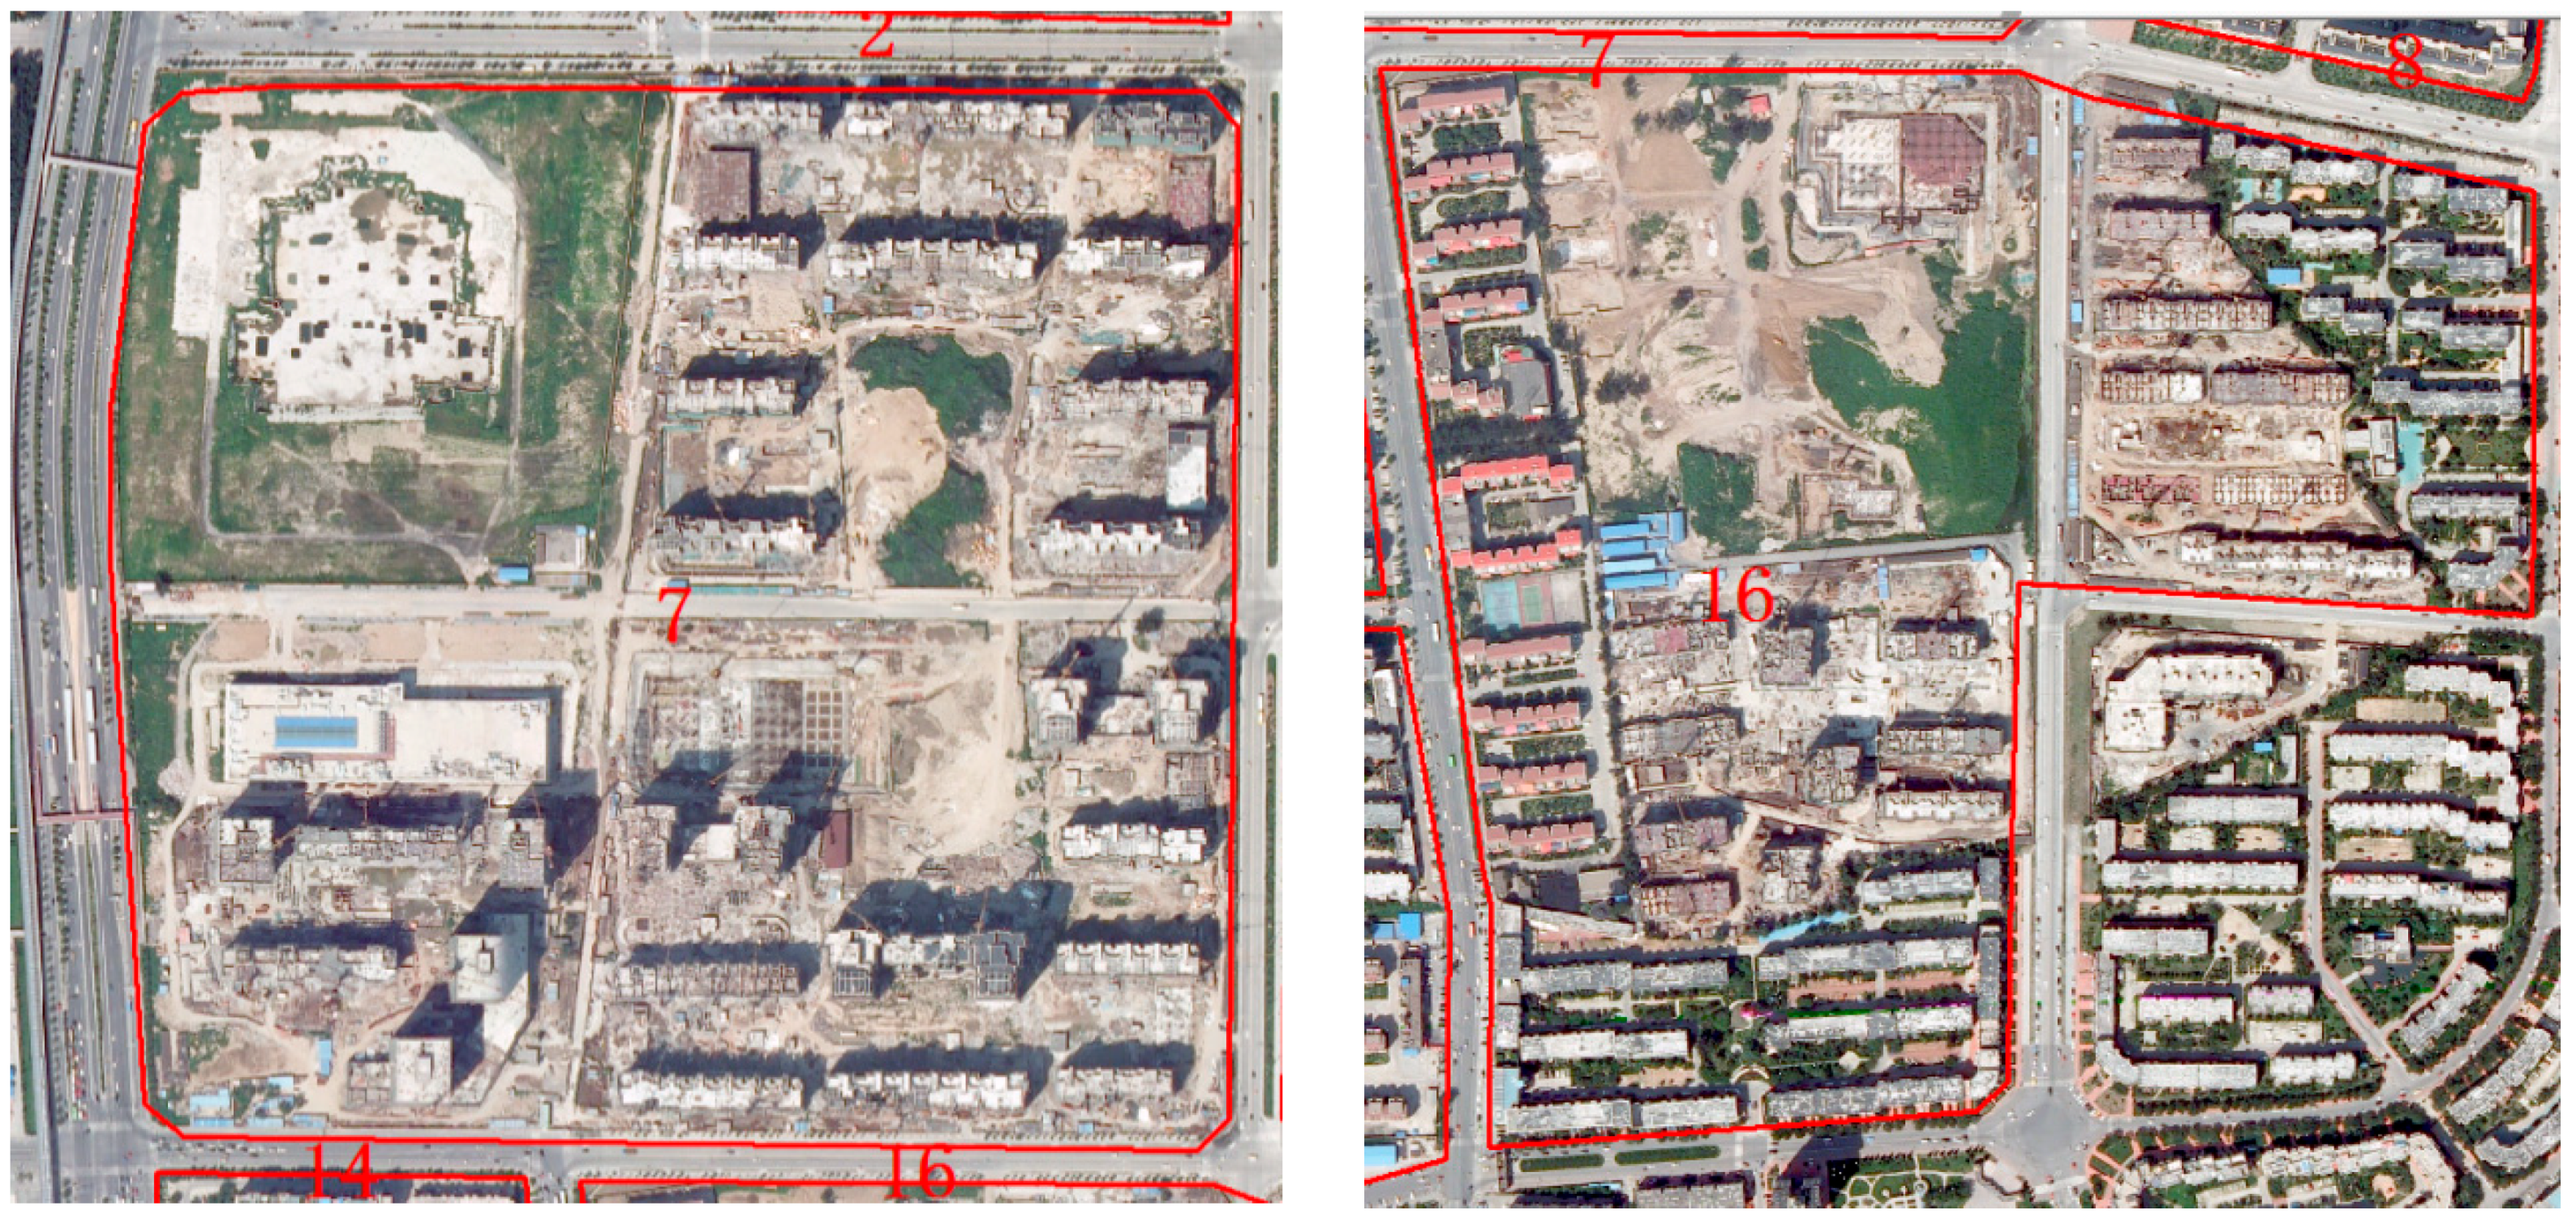
After completing the preparation work described above, the building density, average number of floors, and floor area ratio were calculated for each sub-neighborhood. Table 3 compares the calculated results from each of the 21 sub-neighborhoods in the study area with the corresponding values from the Planning Commission surveys. The relative differences are depicted. As shown in Figure 5, construction work occurred in neighborhoods 7 and 16; thus, the survey data could not be used to evaluate the accuracy of the calculations in those areas.
The results in Table 3 show that the calculation accuracy is similar for 16 neighborhoods. However, neighborhoods 13, 14, and 15 are different: the accuracy in the average number of floors is very high, and the relative error is less than 1% in most cases. The largest relative error is less than 3%. More errors are apparent in the building density calculation. Most of the relative errors are generally between 10% and 20%. The error in the floor area ratio calculation is similar to that of the building density calculation. The relative error is generally between 10% and 20%. Clearly, the building density and floor area ratio calculations resulted in larger values than those found by the Urban Planning Commission. The relative errors are all positive. This might indicate a systematic error in the calculation.
5. Discussion
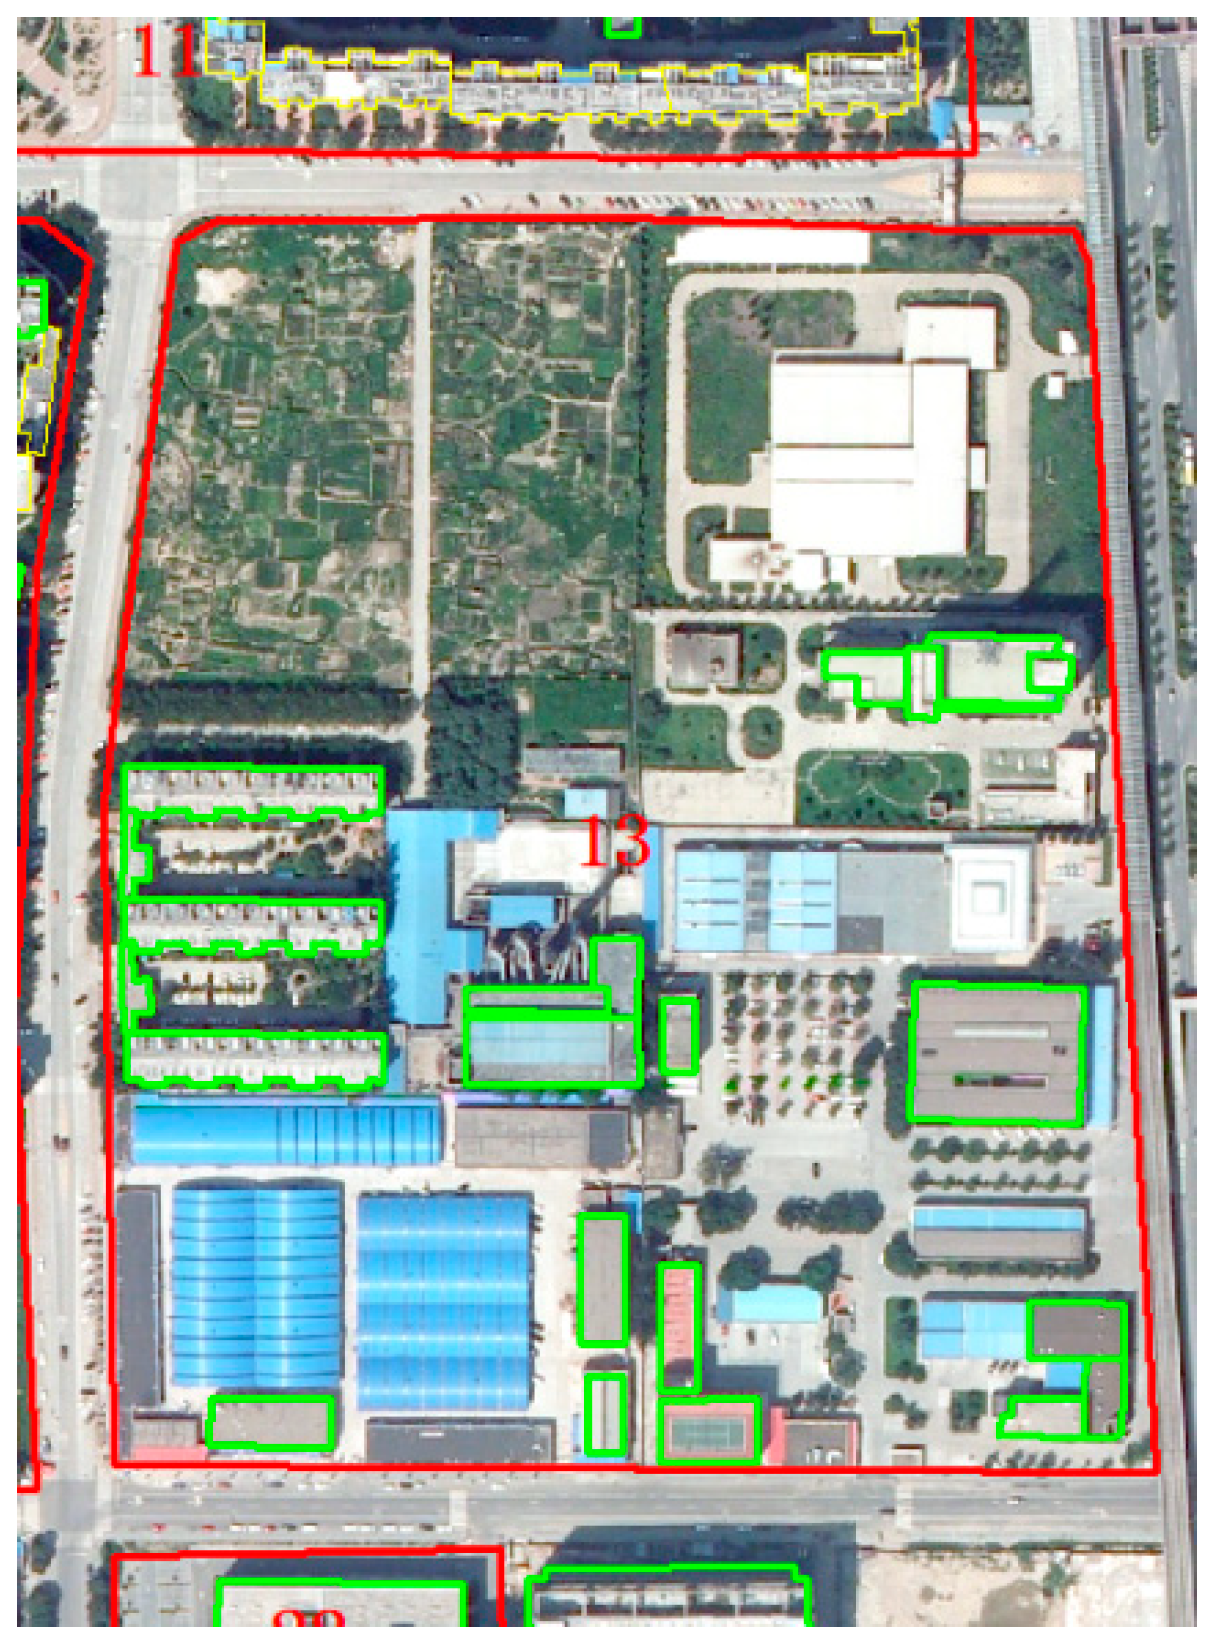
Table 3 shows that the error of the average number of floors and the building density values in calculations from adjacent neighborhoods 13, 14, and 15 are abnormally high. Figure 6 shows the DOM of neighborhood 13 with the surveyed building plots superimposed on it. The figure shows that some buildings were not surveyed, which caused the surveyed building density of the neighborhood to be lower than the actual value. Consequently, the building density calculated using remote sensing data was greater than the survey value. Additionally, the buildings that were excluded from the survey are all relatively low-height buildings for the neighborhood, which caused the average number of floors in the survey data to be greater than the actual value. Therefore, the average number of floors calculated using remote sensing is lower than the survey value.
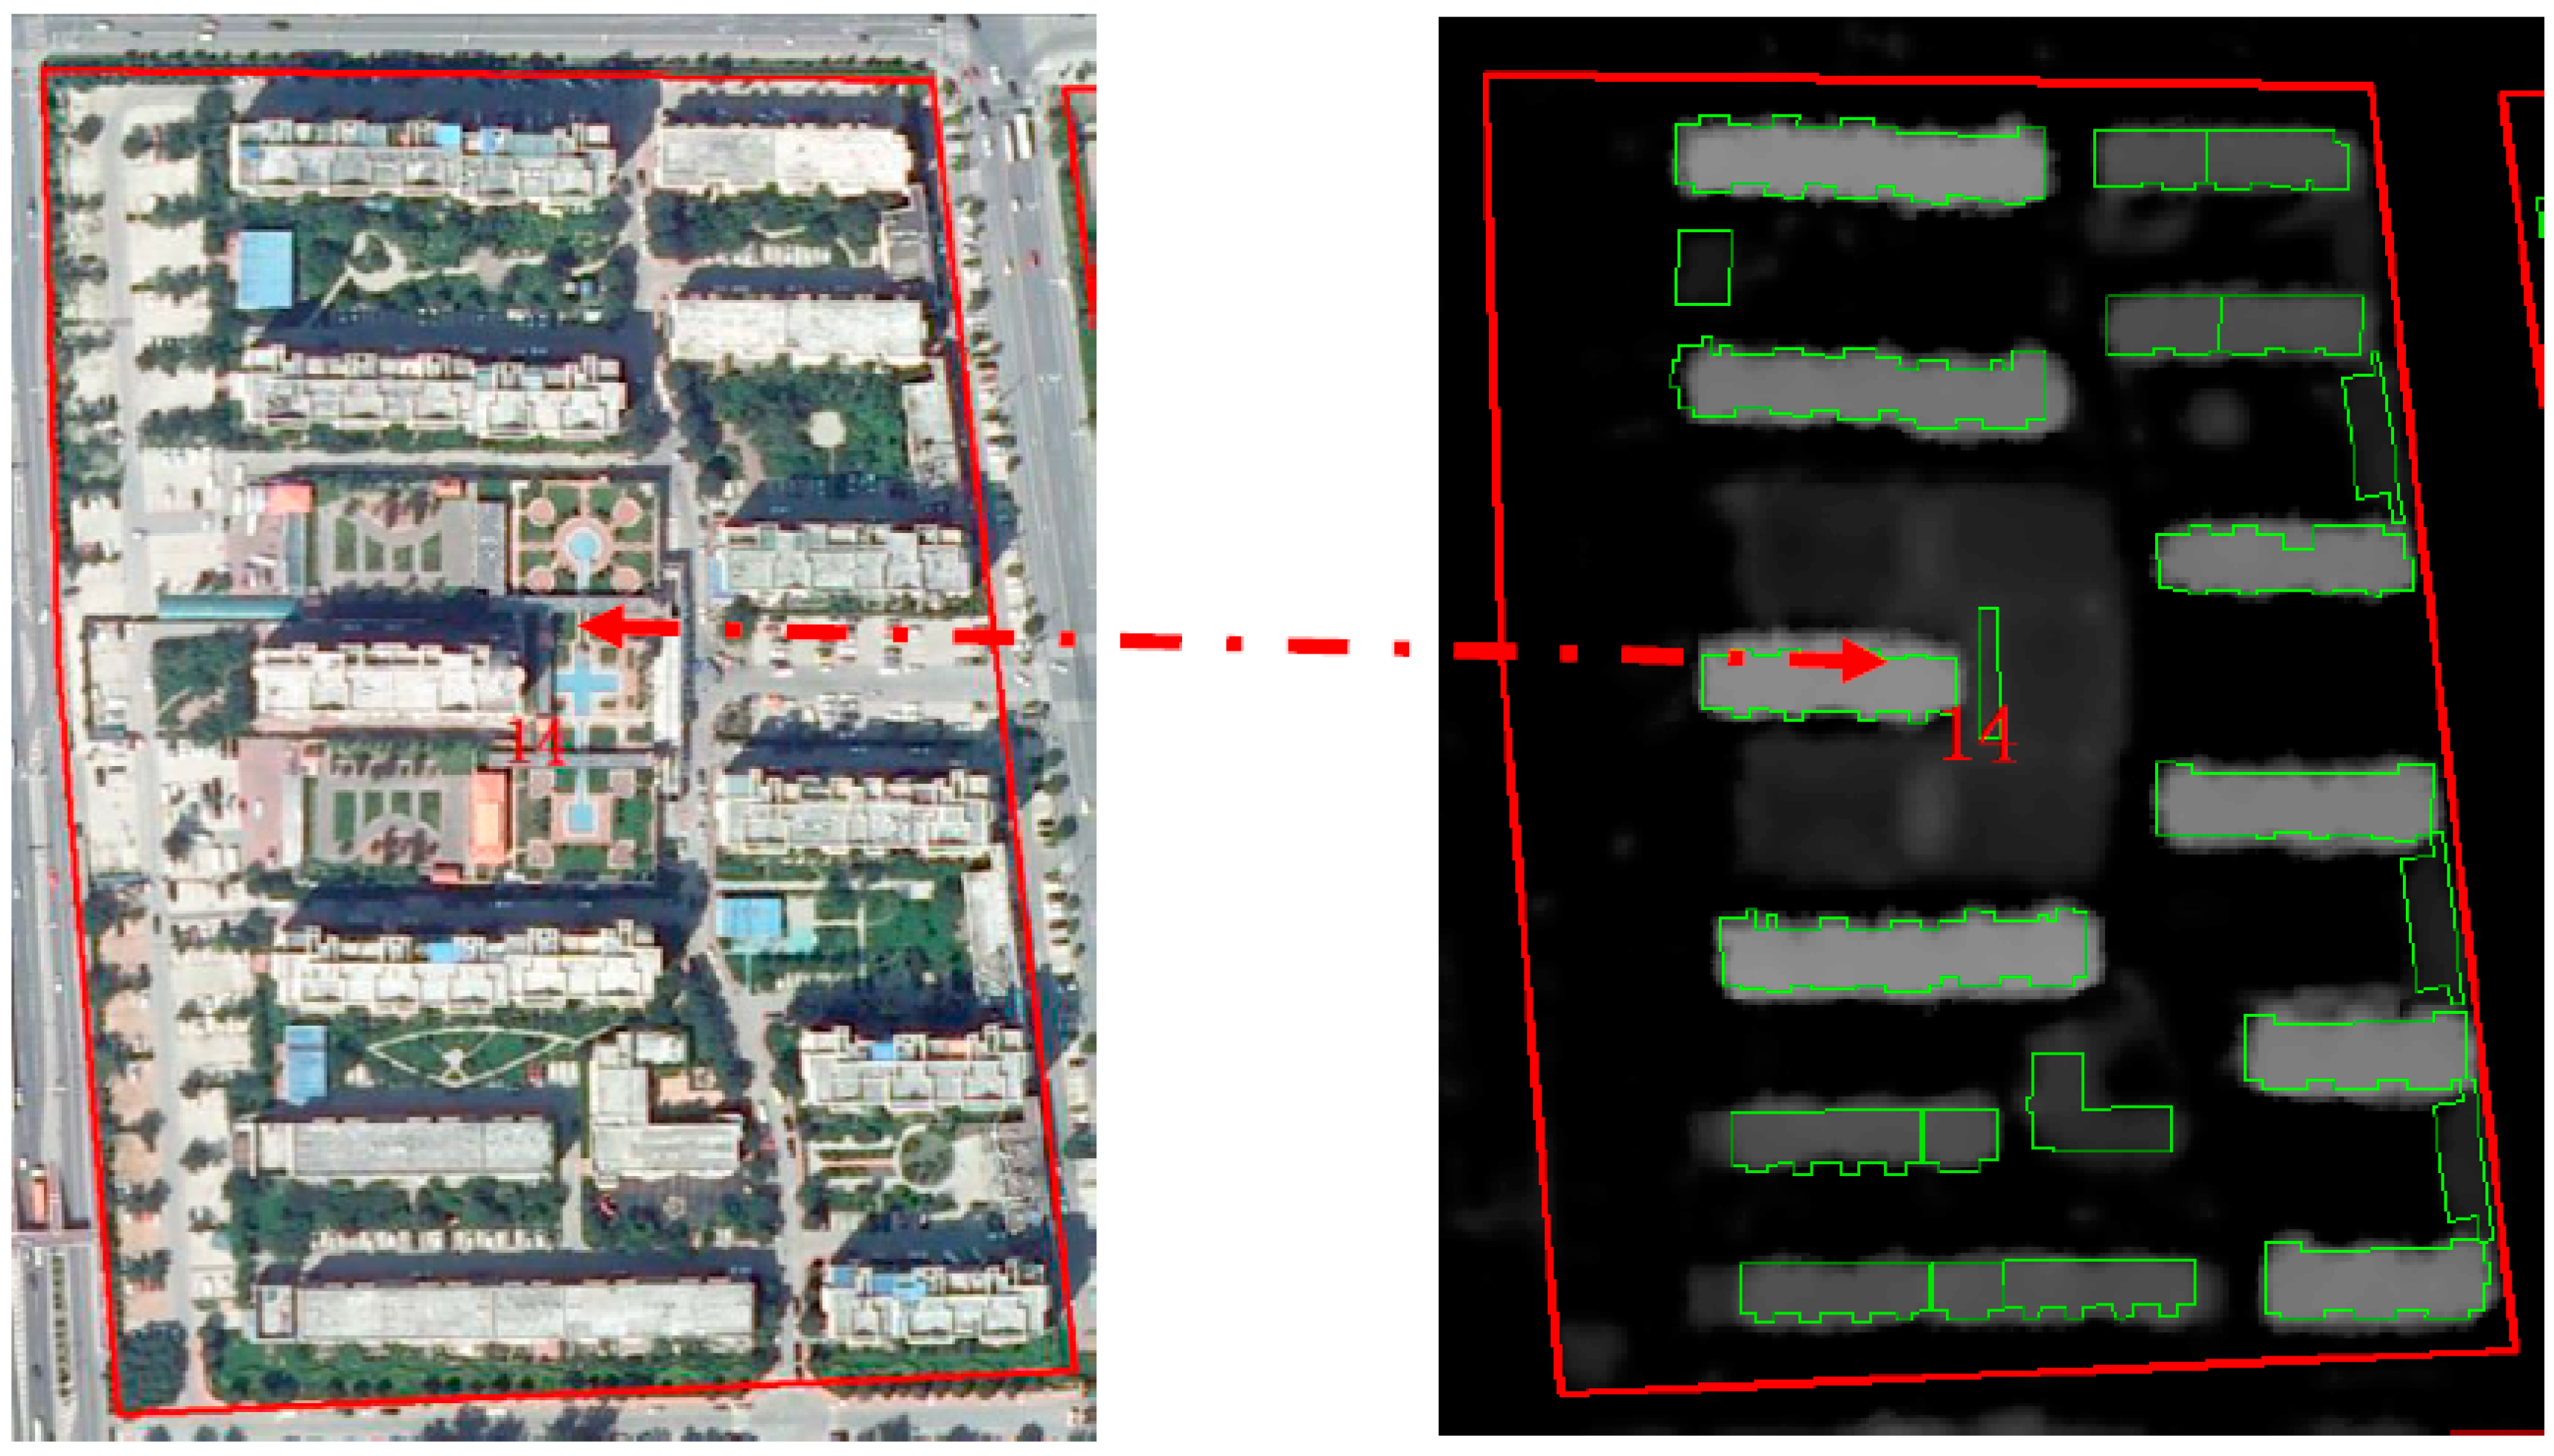
As shown in Figure 7, the DOM for neighborhood 14 is overlaid with surveyed building plots and, compared with nDSM (marked by red lines), it is evident that a building with roof vegetation was excluded from the survey. The building occupies a large plot of land and is not very tall. As in neighborhood 13, this caused the calculated building density to be higher than the survey value, and the calculated average number of floors was thus lower than the surveyed value. Moreover, fewer buildings were excluded from neighborhood 14 than from neighborhood 13. Therefore, the errors in the building density and average number of floors were smaller in neighborhood 14 than in neighborhood 13.
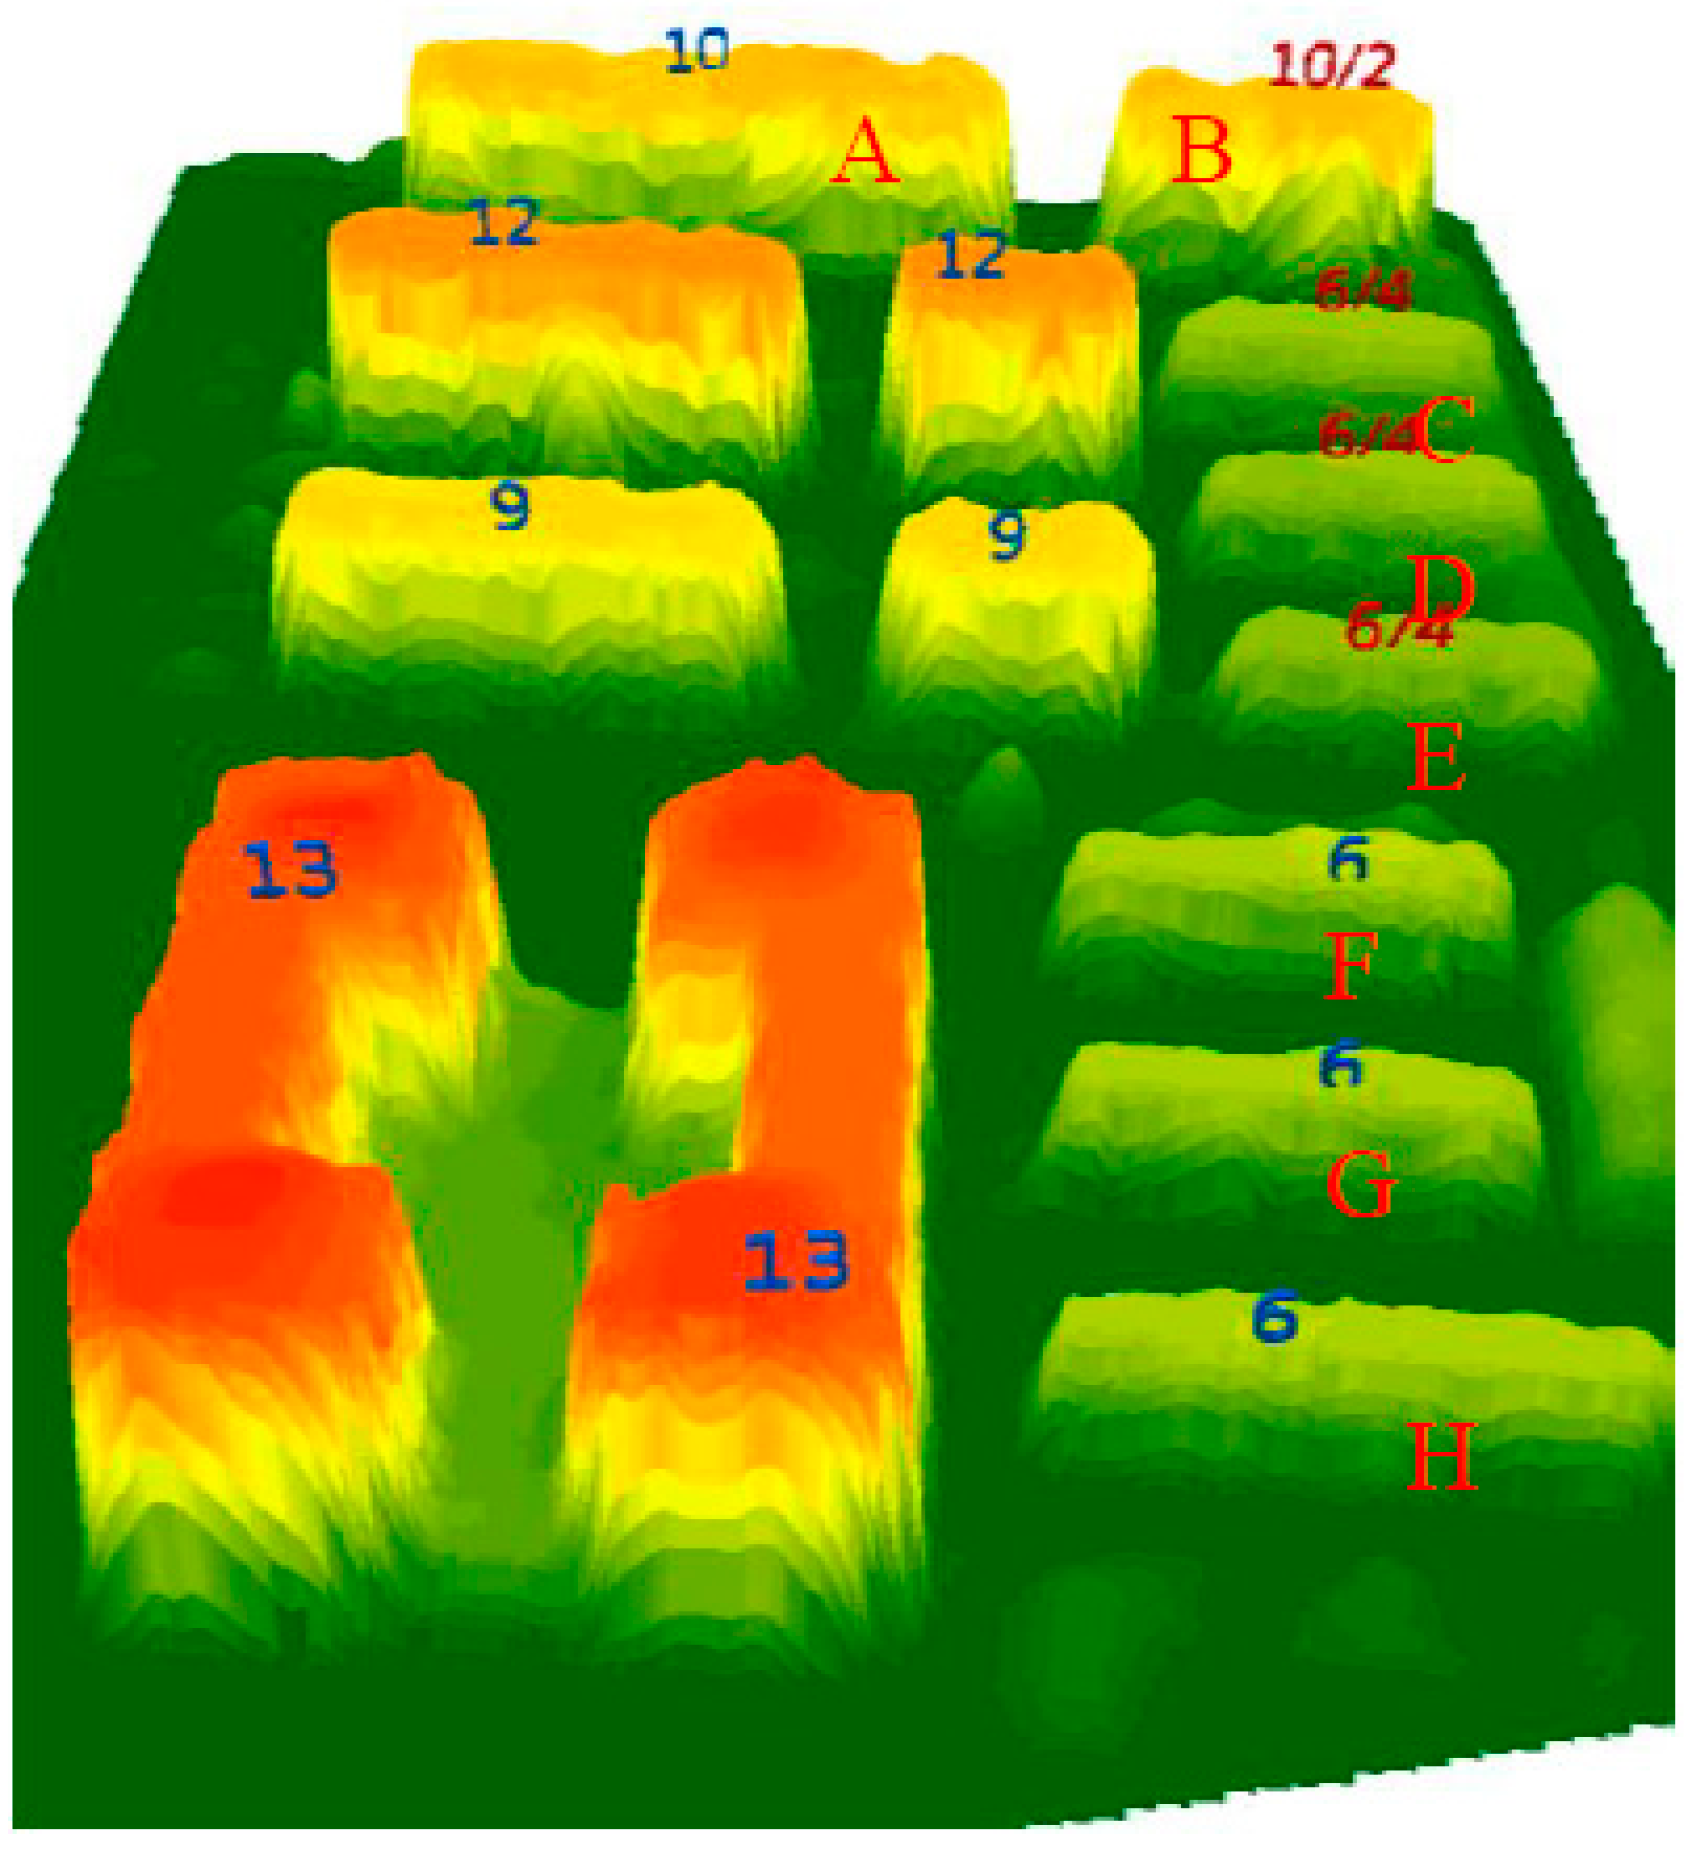
Neighborhood 15 also showed that the calculated building density error was not large. However, the errors in the average number of floors was high. No building was excluded from the survey data; nevertheless, some buildings had incorrect data for the number of floors. Figure 8 displays a 3D building model rendering of the nDSM from neighborhood 15. The figure shows that buildings A and B are both 10-story buildings. However, in the survey, building B was mistakenly listed as a two-story building (the red numbers in the figure are the ratio of the actual number of floors to the number of floors in the survey, 10/2). In the same way, buildings C, D, E, F, G, and H were all six-story buildings; however, buildings C, D, and E were incorrectly listed as four-story buildings in the survey. Clearly, the number of floors in the survey was lower than the actual value. Therefore, the average number of floors in the remote sensing calculation was larger than the survey value.
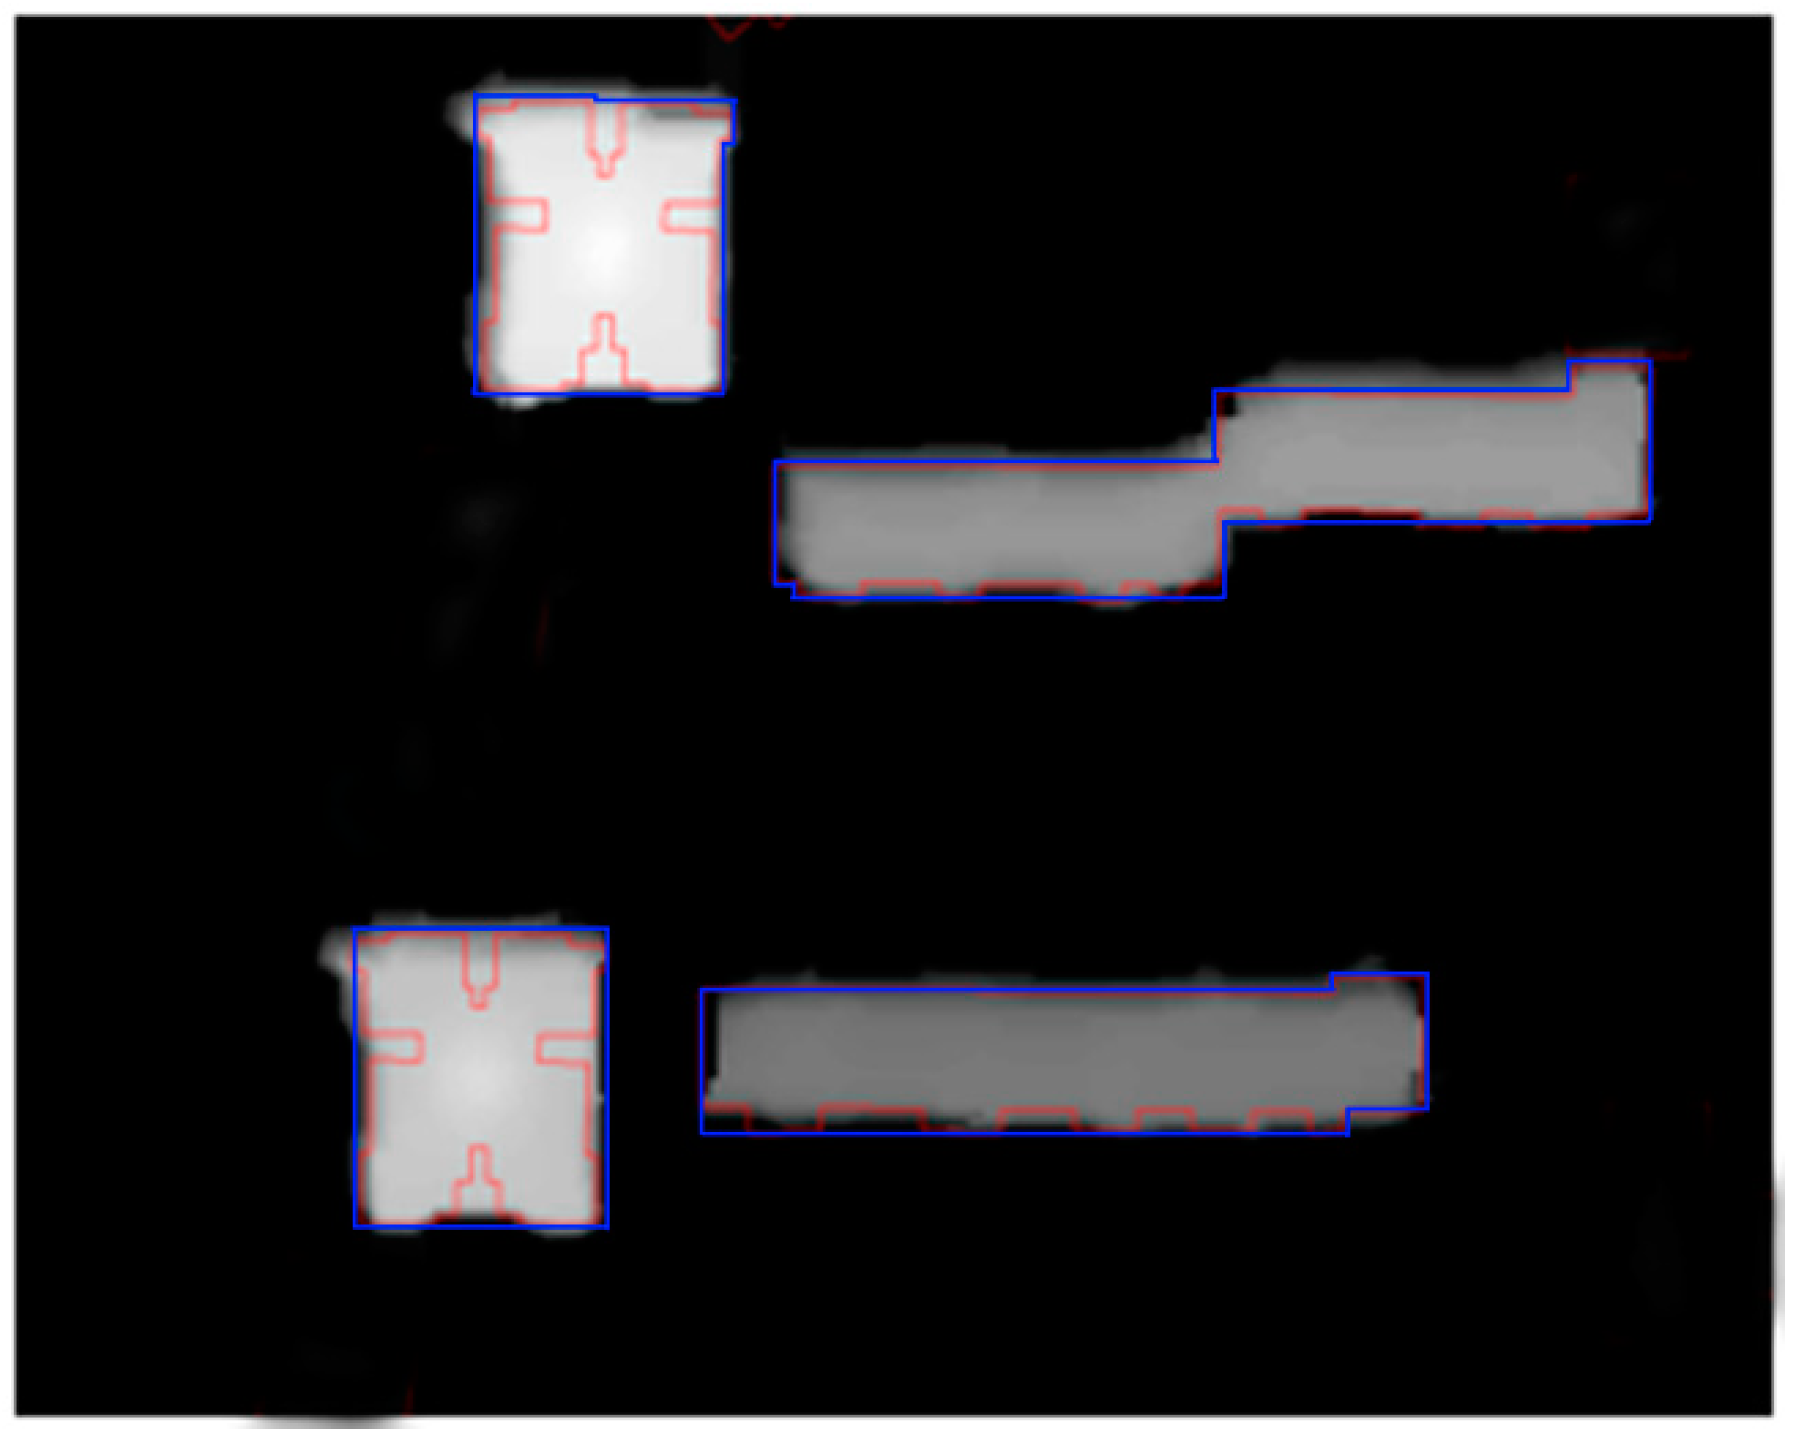
For other neighborhoods, the error in the average number of floors was very small; nonetheless, the building density error was rather large, and there appeared to be strong systematic error characteristics. The error source in the building density calculation was investigated by selecting typical buildings in the study area. In Figure 9, the survey data building plots are compared with nDSM building models. The figure shows that the nDSM building model cannot retain empty spaces or fine indentions within building outlines. Additionally, the building footprints from nDSM models were larger than the building footprints used in the surveys. Thus, the building density calculated using remote sensing data was greater than the actual value. This error was caused by the point diffusion effect of the remote sensing imaging sensor, which manifests as edge blurring in remote sensing images. This issue is inherent in the formation of images using remote sensing technology, and makes building footprints appear larger than they actually are.
To some extent, it is possible to correct for this systematic error. To quantify this type of error, we sampled some typical buildings and calculated the relative error between their external polygons (blue shapes in Figure 9) and their survey data plots (red polygons in Figure 9). Because the building shapes in the study area were quite uniform, we only selected 15 samples for a preliminary calculation. Table 4 shows the results of the calculations. It is evident that the relative error in building footprint calculations for buildings with complex outlines is approximately 10%. This error can be considered as part of the systematic error in calculating the building density based on remote sensing data. It should be possible to subtract it from the results.
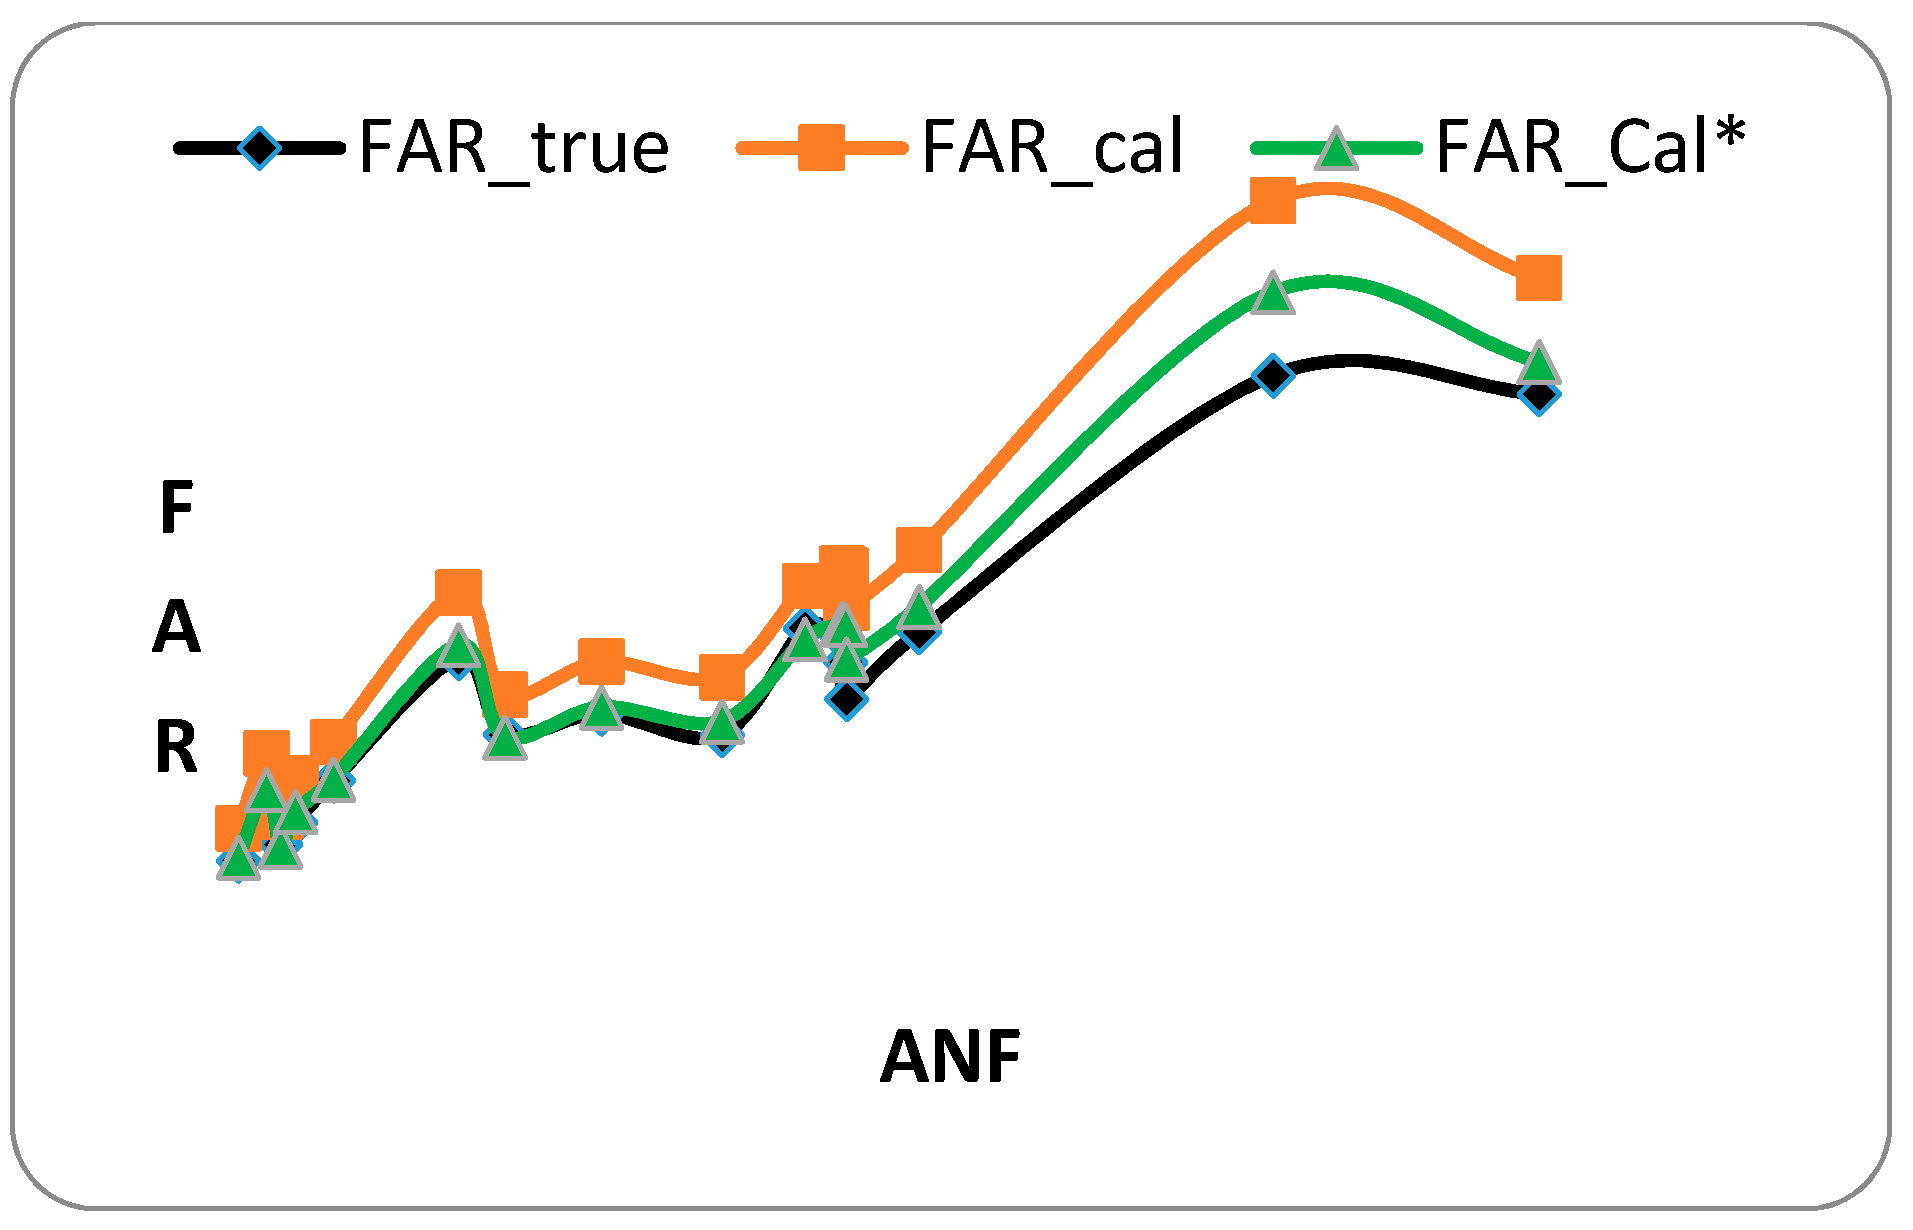
As shown in Table 3, the post-correction error contains a very large systematic error that decreases in both the building density and floor area ratio. The error of most neighborhoods is less than 10%. BD* in the table denotes the results after subtracting 10% from the final calculated building density, and FAR* is the floor area ratio recalculated using BD*. Figure 10 shows the surveyed floor area ratios and floor area ratios calculated before and after systematic error correction. The figure clearly shows that the corrected floor area ratios are much closer to the surveyed floor area ratios.
In order to illustrate the benefits of the introduction of internet data to improve the results, the ANF of each neighborhood was calculated without internet data. Table 5 gives the ANF values calculated in three cases and the relative errors of the true values, where ANF2.9 is the ANF value calculated from all the buildings with a fixed floor height of 2.9 m, and ANF-Ci is the ANF value calculated using the floor heights in Table 1. ANF-Ci-d is the result of the ANF-Ci correction (ANF-Ci-d = ANF-Ci +ΔF). The results in the table indicate that most of the relative errors of ANF2.9 and ANF-Ci (Table 5, Column 6) are less than 3%, whereas the relative errors of neighborhood 13, 14, 15, 16 reach 5%~10%. By comparing the building-type distribution map (Figure 3b) it is not difficult to find that a large number of buildings are under construction in neighborhood 13, whereas neighborhoods 14, 15, 16 have more commercial buildings than other neighborhoods. This shows that the greater the difference between buildings, the greater the impact on the result of the floor area ratio. In addition, comparing the errors of ANF and FAR for the different cases, it can be seen that the correction of ANF can significantly improve the accuracy of the results of ANF and FAR by 5%~10%. The relative errors of neighborhoods 13 and 16 are not calculated according to the previous discussion.
The above analysis shows that the floor area ratios calculated by combining remote sensing data with internet map data were quite reliable. After correction, the floor area ratio calculations were likewise quite accurate. Most of the error in floor area ratio calculations are Less than 10% n the 21 neighborhoods compared with the survey data. Large errors in the data on the number of floors were discovered using internet maps. The proposed method improved the floor number data in two steps. First, information from internet maps was used to determine building usage and building types. This was useful in confirming the story heights of the different buildings. Second, using street-level views and DOMs, height correction values could be confirmed. These two steps were essential in determining the final number of floors in the buildings. Reliable floor area ratio results should be conducive to understanding the architecture and population of a specific area by planers. For example, in our study, high floor area ratios in neighborhood 1 and 5 of the study area are easy to correspond to higher population pressures and lower living comfort. The planers should consider more living facilities such as fitness venues and children’s activity areas to improve the living comfort.
The processes and results of the floor area ratio calculations from the 21 Tiantongyuan neighborhoods show that the pixel-based method of calculating floor area ratios described in this paper has more advantages than the traditional methods. Firstly, the proposed method eliminates the difficult process of calculating floor area ratios for individual buildings. Instead, it simultaneously calculates building densities and the average number of floors over entire neighborhoods. This simplified process is very convenient for program automation. In addition, the proposed method divides the floor area calculation into calculations of two parameters, which are independent of each other and have a clear physical meaning. This enables the use of other sources of information (such as public map data) to correct calculation parameters and guarantee the accuracy of the final calculation.
Although the proposed method simplified the calculation processes and improved the accuracy of floor area ratio calculations, some drawbacks cannot be ignored and should be given attention in further studies. In our study, the buildings in the experimentation area were relatively single, and most of them were not affected by vegetation. Therefore, the NDVI could be used for vegetation removal, and the height and area thresholds could be used to reduce building noise. However, in other complex areas it might not be possible to use this simple method to obtain good results. Again, the use of internet data is a method that requires significant manual processing; thus, to a certain extent, the use of these data reduces computational efficiency. The experimental results of this study furthermore show that the most significant error source when using remote sensing to calculate floor area ratios is extracting building footprints. This type of error is inherent in the formation of remote sensing images and also relates to the shapes of the building footprints. Therefore, controlling errors in building footprint calculations will be emphasized in our future studies on the use of remote sensing technology to calculate floor area ratios. From the perspective of the accurate extraction of building footprints, a higher resolution stereo pair imagery might be tested in further studies.
6. Conclusions
In this paper, we proposed a pixel-based method that defines a quantitative relationship among floor area ratio (FAR), building density (BD), and average number of floors (ANF). The method avoids the need to identify and extract floor area ratios for individual buildings. On the contrary, entire neighborhoods are simultaneously considered. This simplified process is very convenient for program automation. The experiments verified that the proposed concept and method greatly simplify the complexity of the calculations. The combination of remote sensing data and internet map data was applied to calculate urban floor area ratios based on the proposed method. The results showed that most of the calculated FAR had high accuracy and the relative errors were less than 5% compared with the survey data. It was found that extracted building density had a systematic error of approximately 10%. Internet map data and street-level views were used to confirm building types and the number of floors with the correct average number of floors. The correction of ANF can significantly improve the accuracy of the results of ANF and FAR by 5%‒10%. Experimental trials showed that Internet map data and remote sensing data can supplement each other very well. This combination of technologies is expected to be useful to other fields of study. Supplemental information from additional sources, such as internet maps, can be readily used to correct calculation parameters.
Author Contributions
X.Z. and X.Q. conceived the paper and designed the methodology; X.Z., X.Q. and Z.C. prepared the data and conducted the data analysis; Z.C. and Y.Y. investigated and validated the results; X.Z., X.Q. and C.H.Z. wrote the original draft; Z.C. and Y.Y. revised the paper.
Funding
This research was funded by Beijing Natural Science Foundation of China (9182004), National Natural Science Foundation of China (41871348) and the National Key Research and Development Program of China (grant number 2018YFD1100103 and 2016YFC0502400).
Acknowledgments
The authors acknowledge the Beijing Changping District Urban Planning Commission for providing floor area ratio survey data for the study area.
Conflicts of Interest
The authors declare no conflict of interest.
References
- Asami, Y.; Gao, X.; Katsumata, W. Evaluating land-use restrictions concerning the floor area ratio of lots. Environ. Plan. C Gov. Policy 2006, 24, 515–532. [Google Scholar]
- Cao, G.; Shi, Q.; Liu, T. An integrated model of urban spatial structure: Insights from the distribution of floor area ratio in a Chinese city. Appl. Geogr. 2016, 75, 116–126. [Google Scholar] [CrossRef] [Green Version]
- Kono, T.; Kaneko, T.; Morisugi, H. Necessity of minimum floor area ratio regulation: A second-best policy. Ann. Reg. Sci. 2010, 44, 523–539. [Google Scholar] [CrossRef]
- Giridharan, R.; Ganesan, S.; Lau, S. Daytime urban heat island effect in high-rise and high-density residential developments in Hong Kong. Energy Build. 2004, 36, 525–534. [Google Scholar] [CrossRef]
- Cui, Z.D.; Tang, Y.Q.; Yan, X.X.; Yan, C.L.; Wang, H.M.; Wang, J.X. Evaluation of the geology-environmental capacity of buildings based on the ANFIS model of the floor arearatio. Bull. Eng. Geol. Environ. 2010, 69, 111–118. [Google Scholar] [CrossRef]
- Joshi, K.K.; Kono, T. Optimization of floor area ratio regulation in a growing city. Reg. Sci. Urban Econ. 2009, 39, 502–511. [Google Scholar] [CrossRef]
- Khan, A.M. FAR as a Development Control Tool: A New Growth Management Technique for Dhaka City. Jahangirnagar Plan. Rev. 2008, 16, 49–56. [Google Scholar]
- Zhang, G. Application Research of Floor Area Ratio in the Intension Control of Development of Urban Soil. Master’s Thesis, Tianjin University, Tianjin, China, 2006. [Google Scholar]
- Hsing-Fu, K.; Ko-Wan, T. Application of Environmental Change Efficiency to the Sustainability of Urban Development at the Neighborhood Level. Sustainability 2015, 7, 10479–10498. [Google Scholar]
- Jin, H.; Liu, Z.; Jin, Y.; Kang, J.; Liu, J. The Effects of Residential Area Building Layout on Outdoor Wind Environment at the Pedestrian Level in Severe Cold Regions of China. Sustainability 2017, 9, 2310. [Google Scholar] [CrossRef]
- Dai, J. Research on Systematic Development and Application of Far Regulation Techniques of American. Ph.D. Thesis, Harbin Institute of Technology, Harbin, China, 2010. [Google Scholar]
- Chen, J.; Han, X. Semiautomatic Extraction of Floor Area Ratio Based on Construction Shadow in High Resolution Remote Sensing Image; Editorial Board of Geomatics & Information Science of Wuhan University: Wuhan, China, 2012. [Google Scholar]
- Li, X.M. Application of Remote Sensing and Auxiliary Methods to Estimate Floor Area Ratio of Urban and Rural Buildings: Case study of Guangzhou. Master’s Thesis, Guangzhou Unversity, Guangzhou, China, 2012. [Google Scholar]
- Zha, Y. A Study on Remote Sensing Methods in Estimating Urban Built-up Volume Ratio Based on Aerial Photographs. Prog. Geogr. 2001, 20, 378–383. [Google Scholar]
- Belgiu, M.; Drǎgu, L. Comparing supervised and unsupervised multiresolution segmentation approaches for extracting buildings from very high resolution imagery. Isprs J. Photogramm. Remote Sens. 2014, 96, 67–75. [Google Scholar] [CrossRef] [PubMed] [Green Version]
- Vallet, B.; Pierrot-Deseilligny, M.; Boldo, D.; Brédif, M. Building footprint database improvement for 3D reconstruction: A split and merge approach and its evaluation. Isprs J. Photogramm. Remote Sens. 2011, 66, 732–742. [Google Scholar] [CrossRef]
- Jin, X.; Davis, C.H. Automated building extraction from high-resolution satellite imagery in urban areas using structural, contextual, and spectral information: Hindawi Publishing Corp. EURASIP J. Adv. Signal Process. 2005, 2005, 745309. [Google Scholar] [CrossRef]
- Lafarge, F.; Descombes, X.; Zerubia, J.; Pierrot-Deseilligny, M. Automatic building extraction from DEMs using an object approach and application to the 3D-city modeling. Isprs J. Photogramm. Remote Sens. 2008, 63, 365–381. [Google Scholar] [CrossRef] [Green Version]
- Ghaffarian, S.; Ghaffarian, S. Automatic Building Detection based on Supervised Classification using High Resolution Google Earth Images. ISPRS-Int. Arch. Photogramm. Remote Sens. Spat. Inf. Sci. 2014, 40, 101–106. [Google Scholar] [CrossRef]
- Tournaire, O.; Brédif, M.; Boldo, D.; Durupt, M. An efficient stochastic approach for building footprint extraction from digital elevation models. Isprs J. Photogramm. Remote Sens. 2010, 65, 317–327. [Google Scholar] [CrossRef] [Green Version]
- Brédif, M.; Tournaire, O.; Vallet, B.; Champion, N. Extracting polygonal building footprints from digital surface models: A fully-automatic global optimization framework. Isprs J. Photogramm. Remote Sens. 2013, 77, 57–65. [Google Scholar] [CrossRef] [Green Version]
- Comber, A.; Umezaki, M.; Zhou, R.; Ding, Y.; Li, Y.; Fu, H.; Jiang, H.; Tewkesbury, A. Using shadows in high-resolution imagery to determine building height. Remote Sens. Lett. 2012, 3, 551–556. [Google Scholar] [CrossRef]
- Duan, G.; Gong, H.; Liu, H.; Yi, Z.; Chen, B. Establishment of an Improved Floor Area Ratio with High-Resolution Satellite Imagery. J. Indian Soc. Remote Sens. 2017, 46, 1–12. [Google Scholar] [CrossRef]
- Krehl, A.; Siedentop, S.; Taubenböck, H.; Wurm, M. A Comprehensive View on Urban Spatial Structure: Urban Density Patterns of German City Regions. Isprs Int. J. Geo-Inf. 2016, 5, 76. [Google Scholar] [CrossRef]
- El Garouani, A.; Alobeid, A.; El Garouani, S. Digital surface model based on aerial image stereo pairs for 3D building. Int. J. Sustain. Built Environ. 2014, 3, 119–126. [Google Scholar] [CrossRef] [Green Version]
- Charou, E.; Gyftakis, S.; Bratsolis, E.; Tsenoglou, T.; Papadopoulou, T.D.; Vassilas, N. Urban Density Indices Using Mean Shift-Based Upsampled Elevetion Data. In Proceedings of the 36th International Symposium on Remote Sensing of Environment, Berlin, Germany, 11–15 May 2015; Volume XL-7/W3, pp. 1353–1357. [Google Scholar]
- Ma, L. Study of Land Cover and Building Density Based on Airborned Sensor Data in Economic and Technological Development Zone. Ph.D. Thesis, Zhejiang University, Hangzhou, China, 2014. [Google Scholar]
- Sohn, G.; Dowman, I. Data fusion of high-resolution satellite imagery and LiDAR data for automatic building extraction. Isprs J. Photogramm. Remote Sens. 2007, 62, 43–63. [Google Scholar] [CrossRef]
- Moudry, V. Comparison of leaf-off and leaf-on combined UAV imagery and airborne LiDAR for assessment of a post-mining site terrain and vegetation structure: Prospects for monitoring hazards and restoration success. Appl. Geogr. 2019, 104, 32–41. [Google Scholar] [CrossRef]
- Lee, D.S.; Shan, J.; Bethel, J.S. Class-Guided Building Extraction from Ikonos Imagery. Photogramm. Eng. Remote Sens. 2003, 69, 143–150. [Google Scholar] [CrossRef] [Green Version]
- Shao, Y.; Taff, G.N.; Walsh, S.J. Shadow detection and building-height estimation using IKONOS data. Int. J. Remote Sens. 2011, 32, 6929–6944. [Google Scholar] [CrossRef]
- Haala, N.; Brenner, C. Extraction of Buildings and Trees in Urban Environments. ISPRS J. Photogramm. Remote Sens. 1999, 54, 130–137. [Google Scholar] [CrossRef]
- Ministry of Construction of the People’s Republic of China. Residential Building Code; Ministry of Construction of the People’s Republic of China: Beijing, China, 2005.
Figure 1.
Experimental data used in this study. (a) The digital orthophoto map (DOM) with the subdivision range, (b) the number of floors of the survey data with the subdivision range, (c) the digital surface model (DSM), (d) the digital terrain model (DTM), (e) 2D vector map, (f) street-level view.


Figure 2.
Calculation process (nDSM: normalized digital surface model that was computed as the difference between digital surface model and digital terrain model; NDVI: normalized difference vegetation index).
Figure 2.
Calculation process (nDSM: normalized digital surface model that was computed as the difference between digital surface model and digital terrain model; NDVI: normalized difference vegetation index).
Figure 3.
(a) Net building heights (nDSM_b) of the study area. (b) Building types and land use types derived from the internet map.
Figure 3.
(a) Net building heights (nDSM_b) of the study area. (b) Building types and land use types derived from the internet map.
Figure 4.
Examples of typical buildings in the study area. (a) Building on steps, (b) building with semi-basement, (c) building facade from street-view data, (d) flat-roofed buildings, (e) loft-style-roof buildings, (f) buildings with decorative signage on their roofs.
Figure 4.
Examples of typical buildings in the study area. (a) Building on steps, (b) building with semi-basement, (c) building facade from street-view data, (d) flat-roofed buildings, (e) loft-style-roof buildings, (f) buildings with decorative signage on their roofs.

Figure 5.
Orthophotographs of neighborhoods 7 and 16. All buildings in neighborhood 7 (left) and most buildings in neighborhood 16 (right) are in the process of being built.
Figure 5.
Orthophotographs of neighborhoods 7 and 16. All buildings in neighborhood 7 (left) and most buildings in neighborhood 16 (right) are in the process of being built.

Figure 6.
DOM of neighborhood 13 with surveyed building plots (green polygons). Some low buildings were excluded.
Figure 6.
DOM of neighborhood 13 with surveyed building plots (green polygons). Some low buildings were excluded.

Figure 7.
DOM of neighborhood 14 (left) and nDSM of neighborhood 14 overlaid with external polygons of buildings (right). A building (marked by red arrow) with roof vegetation was excluded from the survey.
Figure 7.
DOM of neighborhood 14 (left) and nDSM of neighborhood 14 overlaid with external polygons of buildings (right). A building (marked by red arrow) with roof vegetation was excluded from the survey.

Figure 8.
3D building model rendering of nDSM from neighborhood 15. An incorrect number of floors is given for buildings B, C, D, and E.
Figure 8.
3D building model rendering of nDSM from neighborhood 15. An incorrect number of floors is given for buildings B, C, D, and E.

Figure 9.
nDSM building models overlaid with survey data building plots (red polygons).

Figure 10.
Floor area ratios from survey data (FAR_true) before systematic error correction (FAR_cal) and after systematic error correction (FAR_CaL*) versus the average number of floors (ANF) in the neighborhood.
Figure 10.
Floor area ratios from survey data (FAR_true) before systematic error correction (FAR_cal) and after systematic error correction (FAR_CaL*) versus the average number of floors (ANF) in the neighborhood.


Table 1.
Building types and floor heights in the study area.
| Building Type | Height Per Story |
|---|---|
| Common residential | 2.9 m |
| Residential with first-floor commercial | First floor: 3.5 m; others: 2.9 m |
| Commercial retail | 3.5 m |
| Education/sports/medical | 3 m |
| Administrative offices | 3 m |
| Single-story buildings | 3–5 m |
| Factories and basic infrastructure | Buildings less than 8 m in height were calculated using a single story; those taller than 8 m were calculated as two-story buildings |
Table 2.
Study area building types and story height correction values.
| Building type | Correction values (ΔFi) |
|---|---|
| Built on stairs | −0.1 to −0.5 levels |
| Semi-basement | Buildings with more than 1 m below the surface of +0.5 levels; lower than 1 m below the surface of −0.2 levels |
| Flat roof | 0 |
| Flat roof with waterproofing layer | −0.2 levels |
| Loft-style roof | −0.5 levels |
| Roofs with decorative or functional structures | Estimated based on coverage and height |
Table 3.
Tiantongyuan floor area ratio calculation results and relative errors.
| Neighborhood # | Calculated Value | Planning Commission Value | Relative Error | ||||||||||
|---|---|---|---|---|---|---|---|---|---|---|---|---|---|
| ANF | BD | FAR | BD* | FAR* | ANF | BD | FAR | ANF | BD | FAR | BD* | FAR* | |
| 1 | 13.6866 | 0.3340 | 4.5719 | 0.3006 | 4.1147 | 13.6610 | 0.2709 | 3.6989 | 0.19% | 23.32% | 23.60% | 10.99% | 11.24% |
| 2 | 10.6716 | 0.2651 | 2.8289 | 0.2386 | 2.5460 | 10.7344 | 0.2254 | 2.4178 | −0.59% | 17.62% | 17.00% | 5.86% | 5.30% |
| 3 | 10.0839 | 0.2704 | 2.7267 | 0.2434 | 2.4540 | 10.1280 | 0.2245 | 2.2702 | −0.44% | 20.43% | 20.11% | 8.38% | 8.10% |
| 4 | 5.5470 | 0.3051 | 1.6925 | 0.2746 | 1.5233 | 5.5807 | 0.2634 | 1.4674 | −0.60% | 15.86% | 15.34% | 4.27% | 3.81% |
| 5 | 15.8856 | 0.2635 | 4.1862 | 0.2372 | 3.7676 | 15.8608 | 0.2276 | 3.6062 | 0.16% | 15.76% | 16.08% | 4.19% | 4.47% |
| 6 | 5.1815 | 0.2781 | 1.4408 | 0.2503 | 1.2967 | 5.1105 | 0.2511 | 1.2788 | 1.39% | 10.76% | 12.67% | −0.32% | 1.40% |
| 7 | 12.2357 | 0.1497 | 1.8322 | 0.1348 | 1.6490 | ||||||||
| 8 | 9.2469 | 0.2374 | 2.1952 | 0.2137 | 1.9757 | 9.1047 | 0.2102 | 1.9052 | 1.56% | 12.92% | 15.22% | 1.63% | 3.70% |
| 9 | 5.4207 | 0.3347 | 1.8144 | 0.3012 | 1.6329 | 5.3402 | 0.2865 | 1.5469 | 1.51% | 16.83% | 17.29% | 5.15% | 5.56% |
| 10 | 7.0561 | 0.3708 | 2.6165 | 0.3337 | 2.3548 | 6.9286 | 0.3280 | 2.2887 | 1.84% | 13.04% | 14.32% | 1.73% | 2.89% |
| 11 | 10.1302 | 0.2701 | 2.7359 | 0.2431 | 2.4623 | 10.0983 | 0.2371 | 2.3920 | 0.32% | 13.90% | 14.38% | 2.51% | 2.94% |
| 12 | 10.1827 | 0.2494 | 2.5395 | 0.2245 | 2.2855 | 10.1348 | 0.2056 | 2.0840 | 0.47% | 21.28% | 21.86% | 9.15% | 9.67% |
| 13 | 1.7463 | 0.1771 | 0.3092 | 0.1593 | 0.2783 | 2.3882 | 0.1075 | 0.2585 | −26.88% | 64.73% | 19.60% | 48.26% | 7.64% |
| 14 | 7.1842 | 0.3209 | 2.3056 | 0.2888 | 2.0751 | 8.8740 | 0.2430 | 1.9880 | −19.04% | 32.07% | 15.98% | 18.86% | 4.38% |
| 15 | 9.4830 | 0.3067 | 2.9086 | 0.2760 | 2.6177 | 8.0159 | 0.2881 | 2.3090 | 18.30% | 6.48% | 25.97% | −4.17% | 13.37% |
| 16 | 5.4684 | 0.2118 | 1.1581 | 0.1906 | 1.0422 | ||||||||
| 17 | 5.4647 | 0.2749 | 1.5020 | 0.2474 | 1.3518 | 5.4581 | 0.2511 | 1.3619 | 0.12% | 9.47% | 10.29% | −1.47% | −0.74% |
| 18 | 10.0602 | 0.2633 | 2.6484 | 0.2369 | 2.3836 | 9.7941 | 0.2506 | 2.4385 | 2.72% | 5.07% | 8.61% | −5.44% | −2.25% |
| 19 | 8.3110 | 0.2733 | 2.2714 | 0.2460 | 2.0443 | 8.1110 | 0.2490 | 2.0123 | 2.47% | 9.76% | 12.88% | −1.21% | 1.59% |
| 20 | 6.0457 | 0.3100 | 1.8739 | 0.2790 | 1.6865 | 5.8932 | 0.2861 | 1.6782 | 2.59% | 8.33% | 11.66% | −2.50% | 0.49% |
| 21 | 7.4031 | 0.2846 | 2.1068 | 0.2561 | 1.8961 | 7.3134 | 0.2613 | 1.9076 | 1.23% | 8.93% | 10.45% | −1.96% | −0.60% |
Notes: Relative error = (calculated value − survey value)/survey value × 100%. ANF: average number of floors; BD: building density; BD*: result is a 10% reduction based on the building density obtained by calculation; FAR*: plot ratio recalculated by using BD*.
Table 4.
Relative error between the area of building plots from survey data and that of their external polygons.
Table 4.
Relative error between the area of building plots from survey data and that of their external polygons.
| Sample ID | Area of Building Plot | Area of External Polygon | Relative Error |
|---|---|---|---|
| 1 | 2089.784 | 2306.530 | 10.37% |
| 2 | 1016.870 | 1116.320 | 9.78% |
| 3 | 1104.025 | 1279.040 | 15.85% |
| 4 | 966.741 | 1153.600 | 19.33% |
| 5 | 966.748 | 1167.240 | 20.74% |
| 6 | 2751.052 | 3044.340 | 10.66% |
| 8 | 1011.639 | 1182.210 | 16.86% |
| 9 | 1618.220 | 1829.690 | 13.07% |
| 10 | 2370.102 | 2715.080 | 14.56% |
| 11 | 1260.535 | 1369.950 | 8.68% |
| 12 | 1057.238 | 1119.810 | 5.92% |
| 13 | 1056.009 | 1113.850 | 5.48% |
| 14 | 1125.124 | 1210.800 | 7.61% |
| 15 | 1124.223 | 1232.330 | 9.62% |
| Average relative error | 12.04% | ||
Table 5.
Results of ANF and their relative errors under three conditions.
| Neighborhood # | Calculated Value | Relative Error | |||||||
|---|---|---|---|---|---|---|---|---|---|
| ANF2.9 | ANF-Ci | ΔF | ANF-Ci-d | ANF2.9/ANF-Ci | ANF-Ci/ANF-T | ANF-Ci-d/ANF-T | FAR- ANF-Ci | FAR- ANF-Ci-d | |
| 1 | 14.4265 | 14.1866 | −0.5 | 13.6866 | 1.69% | 3.85% | 0.19% | 28.10% | 23.60% |
| 2 | 11.491 | 11.2016 | −0.53 | 10.6716 | 2.58% | 4.35% | −0.59% | 22.82% | 17.00% |
| 3 | 10.7897 | 10.7839 | −0.7 | 10.0839 | 0.05% | 6.48% | −0.44% | 28.45% | 20.11% |
| 4 | 6.2132 | 6.172 | −0.625 | 5.547 | 0.67% | 10.60% | −0.60% | 28.33% | 15.34% |
| 5 | 16.7159 | 16.6006 | −0.715 | 15.8856 | 0.69% | 4.66% | 0.16% | 21.30% | 16.08% |
| 6 | 5.463 | 5.3815 | −0.2 | 5.1815 | 1.52% | 5.30% | 1.39% | 17.03% | 12.67% |
| 7 | 12.4973 | 12.2357 | 12.2357 | 2.14% | |||||
| 8 | 9.7737 | 9.7169 | −0.47 | 9.2469 | 0.58% | 6.72% | 1.56% | 21.08% | 15.22% |
| 9 | 6.0644 | 5.9707 | −0.55 | 5.4207 | 1.57% | 11.81% | 1.51% | 29.19% | 17.29% |
| 10 | 7.5545 | 7.5461 | −0.49 | 7.0561 | 0.11% | 8.91% | 1.84% | 22.26% | 14.32% |
| 11 | 10.6393 | 10.5752 | −0.445 | 10.1302 | 0.61% | 4.72% | 0.32% | 19.41% | 14.38% |
| 12 | 10.6982 | 10.6377 | −0.455 | 10.1827 | 0.57% | 4.96% | 0.47% | 27.31% | 21.86% |
| 13 | 2.0035 | 1.8213 | −0.075 | 1.7463 | 10.00% | ||||
| 14 | 7.9934 | 7.6192 | −0.435 | 7.1842 | 4.91% | ||||
| 15 | 10.7524 | 10.083 | −0.6 | 9.483 | 6.64% | ||||
| 16 | 5.8026 | 5.4684 | 5.4684 | 6.11% | |||||
| 17 | 5.8098 | 5.6647 | −0.2 | 5.4647 | 2.56% | 3.79% | 0.12% | 14.34% | 10.29% |
| 18 | 10.6888 | 10.4592 | −0.399 | 10.0602 | 2.20% | 6.79% | 2.72% | 12.93% | 8.61% |
| 19 | 8.9588 | 8.856 | −0.545 | 8.311 | 1.16% | 9.19% | 2.47% | 20.28% | 12.88% |
| 20 | 6.6496 | 6.5957 | −0.55 | 6.0457 | 0.82% | 11.92% | 2.59% | 21.84% | 11.66% |
| 21 | 8.072 | 8.0281 | −0.625 | 7.4031 | 0.55% | 9.77% | 1.23% | 19.77% | 10.45% |
© 2019 by the authors. Licensee MDPI, Basel, Switzerland. This article is an open access article distributed under the terms and conditions of the Creative Commons Attribution (CC BY) license (http://creativecommons.org/licenses/by/4.0/).
Share and Cite
MDPI and ACS Style
Zhang, X.; Chen, Z.; Yue, Y.; Qi, X.; Zhang, C.H. Fusion of Remote Sensing and Internet Data to Calculate Urban Floor Area Ratio. Sustainability 2019, 11, 3382. https://doi.org/10.3390/su11123382
AMA Style
Zhang X, Chen Z, Yue Y, Qi X, Zhang CH. Fusion of Remote Sensing and Internet Data to Calculate Urban Floor Area Ratio. Sustainability. 2019; 11(12):3382. https://doi.org/10.3390/su11123382
Chicago/Turabian StyleZhang, Xiaoyong, Zhengchao Chen, Yuemin Yue, Xiangkun Qi, and Charlie H. Zhang. 2019. "Fusion of Remote Sensing and Internet Data to Calculate Urban Floor Area Ratio" Sustainability 11, no. 12: 3382. https://doi.org/10.3390/su11123382
Note that from the first issue of 2016, this journal uses article numbers instead of page numbers. See further details here.