Chicago’s Urban Cemeteries as Habitat for Cavity-Nesting Birds


1
Department of Biological Sciences, University of Illinois at Chicago, Chicago IL 60607, USA
2
Institute for Environmental Science and Policy, University of Illinois at Chicago, Chicago IL 60607, USA
*
Author to whom correspondence should be addressed.
Sustainability 2019, 11(12), 3258; https://doi.org/10.3390/su11123258
Submission received: 4 April 2019
/
Revised: 4 June 2019
/
Accepted: 10 June 2019
/
Published: 13 June 2019
(This article belongs to the Special Issue Biodiversity Conservation and Sustainable Urban Development)
Abstract
:Although not explicitly managed for conservation, urban cemeteries may provide a reserve of dead and dying trees for cavity-nesting birds. However, the ability of urban cemeteries to support these birds on current landscapes is largely unknown. We surveyed cavity-nesting birds and their habitat in 18 cemeteries in Chicago, Illinois (USA). At each location, we examined vegetation, availability of gravestones and monuments for perches, and landscape-level environmental conditions. We tested the importance of these variables for presence of individual bird species, and for overall richness of native cavity-nesting birds. We also assessed the availability and characteristics of tree cavities and their distribution among different tree species. We found that most cemeteries contained at least one dead or dying tree. Across all sampled areas, we detected 207 naturally-occurring and 77 excavated tree cavities. Tree species generally supported cavities in proportion to their abundance. We observed 12 native and two non-native cavity-nesting bird species in the cemeteries. Cavity-nesting bird species richness was best explained by landscape-level variables such as canopy cover and distance to water, but local-level variables (e.g., number of graves in a 50 m radius) influenced habitat selection for some species. Based on our results, we make suggestions for how both existing cemeteries and new “green” cemeteries can support biodiversity conservation.
1. Introduction
Globally, almost 1900 species of birds rely on tree cavities [1]. Cavity-nesting birds are taxonomically diverse, including members of such groups as woodpeckers (family Picidae), warblers (in family Parulidae), waterfowl (in family Anatidae), owls (in families Strigidae and Tytonidae), tits (in family Paridae), and swallows (in family Hirundinidae). Some of these species (primary cavity nesters) excavate their own nesting cavities, while others (secondary cavity nesters) nest in either naturally-occurring cavities (due to decay or injury of a tree) or in cavities previously excavated by other species. All of these species benefit from standing dead or dying trees (also called “snags”), which are preferred as nest sites by many cavity nesters and also used for foraging opportunities [2].
Snag availability is often restricted in urban areas [3,4]. In part this is because there are fewer trees in a city than in a natural forest, but also because there are social pressures to remove dead and dying trees. A snag standing in a residential neighborhood, for example, may be removed for aesthetic reasons or because it poses a legal liability. Under existing management practices, the availability of large old trees in urban green spaces is predicted to decline by 87% over the next 300 years [5]. Reduction of snags and other changes in vegetation structure underlie some of the impacts of urbanization on bird communities [6].
Yet in other aspects, cavity-nesting birds are shielded from some of the ways that urbanization negatively impacts birds that have cup or ground nests. Cavity nests are rarely hosts to the brown-headed cowbird (Molothrus ater) [7], an urban-adapted brood parasite. Cavity nests are also less vulnerable to nest predation [8] by mesopredators such as raccoons (Procyon lotor), which thrive in urban areas [9]. Provided sufficient nesting sites, cities offer reasonably good habitat to cavity-nesting birds. Some studies have even concluded that cavity-nesting birds have an advantage in urban areas (e.g., [10,11]), although other studies have come to the opposite conclusion (e.g., [4,12]). Artificial cavities can also be abundant in cities (e.g., chimneys, building crevices, and nest boxes), but only some species make use of these [2].
Urban cemeteries are recognized to be incidental nature preserves [13] and may provide a reserve of dead and dying trees that provide nesting sites for cavity-nesting birds [14], even without explicit conservation management. In cemeteries, where snags are unlikely to fall on homes, cars, or people, social pressure to remove snags is lessened and they may go unnoticed. A snag may even fit the aesthetic of a cemetery where headstones are commonly made to look like dead trees.
Other unique cemetery features may be beneficial to breeding birds. For example, headstones and other monuments could serve as perches for hawking (taking short flights from a perch to catch prey) or vocalizing. Along with the trees and shrubs, these perches contribute to the overall structure of these urban forests. Forest structure and composition are known to influence bird community composition [15], and this is no less true for cavity-nesting birds. The landscape surrounding a cemetery—such as the amount of tree canopy and distance to the nearest road—is also likely to be important [16,17]. However, the ability of urban cemeteries to provide habitat for cavity-nesting birds is largely unknown.
In this study, we surveyed cavity-nesting birds and their habitat in urban cemeteries in Chicago, Illinois (USA). Our goal was to better understand the capacity of urban cemeteries to support cavity-nesting birds. We characterized forest structure and composition in the cemeteries, focusing on habitat attributes known to be important to cavity-nesting birds, including not only snag availability, but also attributes relevant to foraging such as perches for hawking, shrubs for safety from predators [18], and native trees, which support greater numbers of insect prey compared to non-native trees [19]. We assessed the availability and characteristics (entrance diameter and height above ground) of tree cavities, their capacity to serve the nesting needs of the cavity-nesting birds in our region, and how the cavities are distributed among different tree species and genera. Finally, we evaluated the effects of local and landscape-level habitat features on individual species’ habitat selection and cavity-nesting species richness (number of cavity-nesting species). We discuss our results in the context of how both existing cemeteries and new “green” cemeteries can best support conservation of cavity-nesting birds.
2. Materials and Methods
2.1. Study Sites
The city of Chicago, IL (USA; 41.8781° N, 87.6298° W) is situated on the coast of Lake Michigan, on Potawatomi land in the Great Lakes Region [20]. Home to more than 2.7 million people, Chicago is the third most populous city in the United States [21]. Chicago has a humid continental climate, marked by hot summers and cold winters. Prior to European settlement, Chicago was dominated by prairie, but also featured oak savanna, marsh, maple-basswood forest, and oak-hickory forest [20].
The spatial distribution of Chicago’s cemeteries is in part a product of the city’s establishment and growth during the 19th century [22]. Chicago was granted its first town charter in 1835, shortly after the start of the “rural cemetery” movement [23]. When many of the cemeteries were created, the city was approximately the size of what is now the central business district, and the cemeteries were miles outside of the city. As the city expanded, the cemeteries remained, functioning as incidental conservation land [13].
Twenty-two cemeteries fall within Chicago city limits, and together they comprise approximately 700 ha of Chicago’s nearly 60,000 ha of land. Median year of establishment for all of Chicago’s cemeteries is 1871. Union Ridge, established 1838, is the oldest of these cemeteries, while Saint Nicholas, established 1925, is the youngest. We selected 18 cemeteries as study sites. The remaining four cemeteries were not sampled because two of them were too near existing sample points (<250 m) and the other two we were unable to access.
We placed 34 sample points in the 18 cemeteries, with each point at least 250 m from the next point to allow for the points to be statistically independent [24]. Other than ensuring this minimum distance, the points were randomly placed. The number of points established in each cemetery increased with cemetery area. Only one point was established in each cemetery under 20 ha (9 cemeteries), two points were established in each cemetery between 20 and 40 ha (5 cemeteries; 10 points), and three points were established in each cemetery between 40 and 60 ha (2 cemeteries; 6 points). The two largest cemeteries are 71 ha (Oak Woods) and 141 ha (Rosehill), in which four and five points were established, respectively.
2.2. Local-Scale Habitat Assessment
At each of the 34 sample points, we assessed the habitat characteristics within a 50 m radius circle centered on the point. In two of the smaller cemeteries, where a 50 m radius circle would not fit within the cemetery boundaries, we instead assessed a rectangle of the same area (0.785 ha). In total, we sampled 26.7 ha of land. All habitat assessments were conducted by the same observer.
Within the sample area, we recorded the number of shrubs and identified and measured the diameter at breast height (DBH) of all trees. We classified a plant as a shrub (rather than as a tree) if it was woody but without a distinct central trunk. Most trees were identified to species, but in a few cases we were only able to identify them to genus. At each tree we searched for cavities and visually estimated the size of each cavity entrance (using a ruler when we could reach it), its height above ground, and whether the cavity was natural (occurring due to injury, decay, or limb loss; examples include hollows and crevices) or excavated. Excavated cavities were distinguished from natural cavities by their regular shapes and comparatively smooth margins.
We also recorded the number of graves or monuments taller than 2 m in the sample area. These taller structures were less common than shorter graves or monuments and provide a more reliable aid to visibility (from the perspective of a foraging bird) across the cemeteries than the shorter structures. Shorter graves and monuments sometimes numbered in the hundreds, and at such densities they would function more as a visual obstacle than aid.
We classified each tree in one of 8 growth/decay stages according to Imbeau and Desrochers [25]. Stage 1 trees are alive and healthy with greater than 95% foliage and no signs of deterioration, while stage 8 trees are merely a stump less than 2 m tall. Trees of stages 3 (dying, <20% foliage remaining) through 7 (decomposed wood, broken top, less than 50% of height of trees with the same diameter) are considered snags.
We estimated tree density (trees/ha) by dividing the number of trees of all life stages in a sampled area by the area. For snags, we used the measured DBH to estimate the basal area of each snag using the formula for the area of a circle. Snag basal area, in m2, provides an estimate of the land area covered by snags. The basal area of all trunks of stages 3 through 7 were summed and divided by the sampled area to estimate snag basal area per hectare (in m2/ha).
2.3. Landscape-Scale Habitat Assessment
In ArcGIS (version 10.5) [26] we calculated the distance from each sample point to a primary (1°) or secondary (2°) road (using TIGER/Line shapefile data, [27]), the distance from each point to a body of water (including streams, rivers, ponds, and lakes, [28]), and the percentage of canopy cover within 1 km of each point (based on 0.6 m QuickBird satellite imagery, [29]). The 1 km radius circle in which canopy cover was calculated always extended outside the boundaries of the cemetery.
2.4. Point Counts
To detect birds in the cemeteries, we conducted three rounds of 10-minute, fixed-radius point counts at each point according to methods recommended by Nur et al. [30] and Ralph et al. [24]. Each round took approximately 6–9 days of fieldwork. The first round of point counts began in mid-June, in order to exclude birds passing through during migration. The third round concluded at the end of July. All point counts were conducted on days without rain or excessive wind, between 07:30 and 10:00 AM. We recorded birds heard or observed within a 100 m radius. Flyovers were recorded but excluded from analyses. All point counts were conducted by the same observer.
2.5. Analysis
2.5.1. Cavities
We compared excavated to natural cavities in terms of entrance diameter and height above ground using the Wilcoxon test [31]. To determine if cavity excavators select some tree species over others, we used a proportion test (prop.test function in R; [32]) to determine if the proportion of excavated cavities found in a given tree species and the proportion of all trees that the species comprises were truly different based on Pearson’s chi-squared test.
To assess species-specific cavity availability, we plotted each observed cavity with height above ground on the y-axis and entrance diameter on the x-axis. This plot overlaid species-specific cavity requirements for 16 cavity-nesting bird species in the Chicago region. Cavity requirements for 16 species were synthesized from Jackson [33], Scott et al. [2], Stokes and Stokes [34], and the Cornell Lab of Ornithology [35], and are detailed in Table A1 of Appendix A. We did not include birds that live in wetlands or water bodies, and we could not find cavity requirements for the one remaining cavity-nesting species that breeds in our study area, the turkey vulture (Cathartes aura).
2.5.2. Habitat Selection Models for Individual Cavity-Nesting Bird Species
We used classification trees [36] to determine which variables, and at which values, best predicted the presence or absence of a given cavity-nesting bird species at a point. Classification trees are an intuitive way to model the decision-making aspect of habitat selection and can help identify thresholds, which can be useful for management decisions. A bird species was considered “present” at a given point if it was detected within 100 m during any of the three point counts conducted at that point. The candidate variables used in these analyses include cemetery characteristics as well as the site-level and landscape-level variables described above (Table 1).
Classification tree models work by binary recursive partitioning. They split the response variable into increasingly homogeneous sets (in this case, locations with and without the focal species). At each turn, the model identifies the explanatory variable—and the specific value of that variable—that best splits the response variable. The tree continues to grow in size until all subsets of the data are homogeneous (i.e., either all presence or all absence), but typically the tree is subsequently “pruned” to a smaller size to avoid over-fitting the data.
We constructed the classification trees using the R package “rpart” [37]. The rpart package has built-in ten-fold cross-validation. This means that the data are split into a training set to train the model, and a testing set to evaluate the model [36]. This process is repeated ten times, and the cross-validation error is the average proportion of incorrect predictions across all ten tests. We pruned the trees to the smallest tree with the lowest cross-validation error. If the tree with the lowest cross-validation error was the saturated model, we chose a smaller tree with a cross-validation error within one standard error of the lowest (as with the downy woodpecker). If the tree with the lowest cross-validation error was one with no splits (the null model), we do not present a tree for that species. For each model, we report the model error as the portion of sample locations that are predicted incorrectly.
2.5.3. Richness of Cavity-Nesting Bird Species
To determine what influences cavity-nesting bird species richness, we evaluated linear regression models with richness as a function of the same environmental variables used in the classification trees (Table 1). Our response variable (cavity-nesting species richness) was normally distributed, therefore we felt linear models were adequate. Additionally, we used the Shapiro–Wilk test to test for normality of regression residuals for all linear models. For all models, the sample size was 34 sample points.
We then used an Akaike information criterion (AIC, [38]) model selection framework (package AICcmodavg in R, [39]) to select the best linear model, using AIC with a correction for small sample sizes (AICc). First, we ran single-variable linear models for each of our eight explanatory variables. For comparison, we also ran a null model. We identified all single-variable models that performed better than the null model, as indicated by a lower AICc value. We then ran a “combined model” that included all variables that performed better than the null model. We ranked all single-variable models, and the combined model, according to AICc. Finally, we used Moran’s I to test for spatial autocorrelation in the residuals of the combined model, using the function Moran.I in the “ape” package in R [40].
3. Results
We identified at least 44 tree species in 32 genera across all sampled areas (Table A2 in Appendix B). The median tree generic richness (number of genera) for all sampled areas was 6 (min. = 2, max. = 10, mean ± SD = 5.9 ± 1.9). Silver maples (Acer saccharinum) were found in the most points (23 of 34). Oaks (Quercus spp.) were only found in 13 points, yet they comprised nearly 20% of the total basal area for all trees. Median tree density was 25.5 trees/ha (min. = 6.4, max. = 42.0, mean ± SD = 23.3 ± 9.0), and median density of native trees was 15.4 trees/ha (min. = 2.6 trees/ha, max. = 39.7 trees/ha, mean ± SD = 16.7 ± 8.9).
We encountered trees at all life stages (1–8), but the median tree life stage was 2 (declining with remaining foliage between 20% and 95%). Snags were present in 28 of the 34 sampled areas, and median snag availability was 0.6 m2/ha (min. = 0 m2/ha, max. = 2.6 m2/ha, mean ± SD = 0.8 ± 0.8) and 1.9 trees/ha (min. = 0 trees/ha, max. = 10.2 trees/ha, mean ± SD = 2.6 ± 2.5).
We detected 41 bird species, including 12 native cavity-nesting species (Table 2). The median native cavity-nesting species richness at a given point was 4 species (min. = 1 species, max. = 7 species, mean ± SD = 3.8 ± 1.5). Black-capped chickadees (Poecile atricapillus) were the most widespread of the native cavity-nesters, detected at 30 of the 34 points. Four of the five woodpecker species that breed in the Chicago region were detected. Two non-native cavity-nesting species, the house sparrow (Passer domesticus) and the European starling (Sturnus vulgaris), were also detected at 21 and 16 points, respectively.
3.1. Cavities
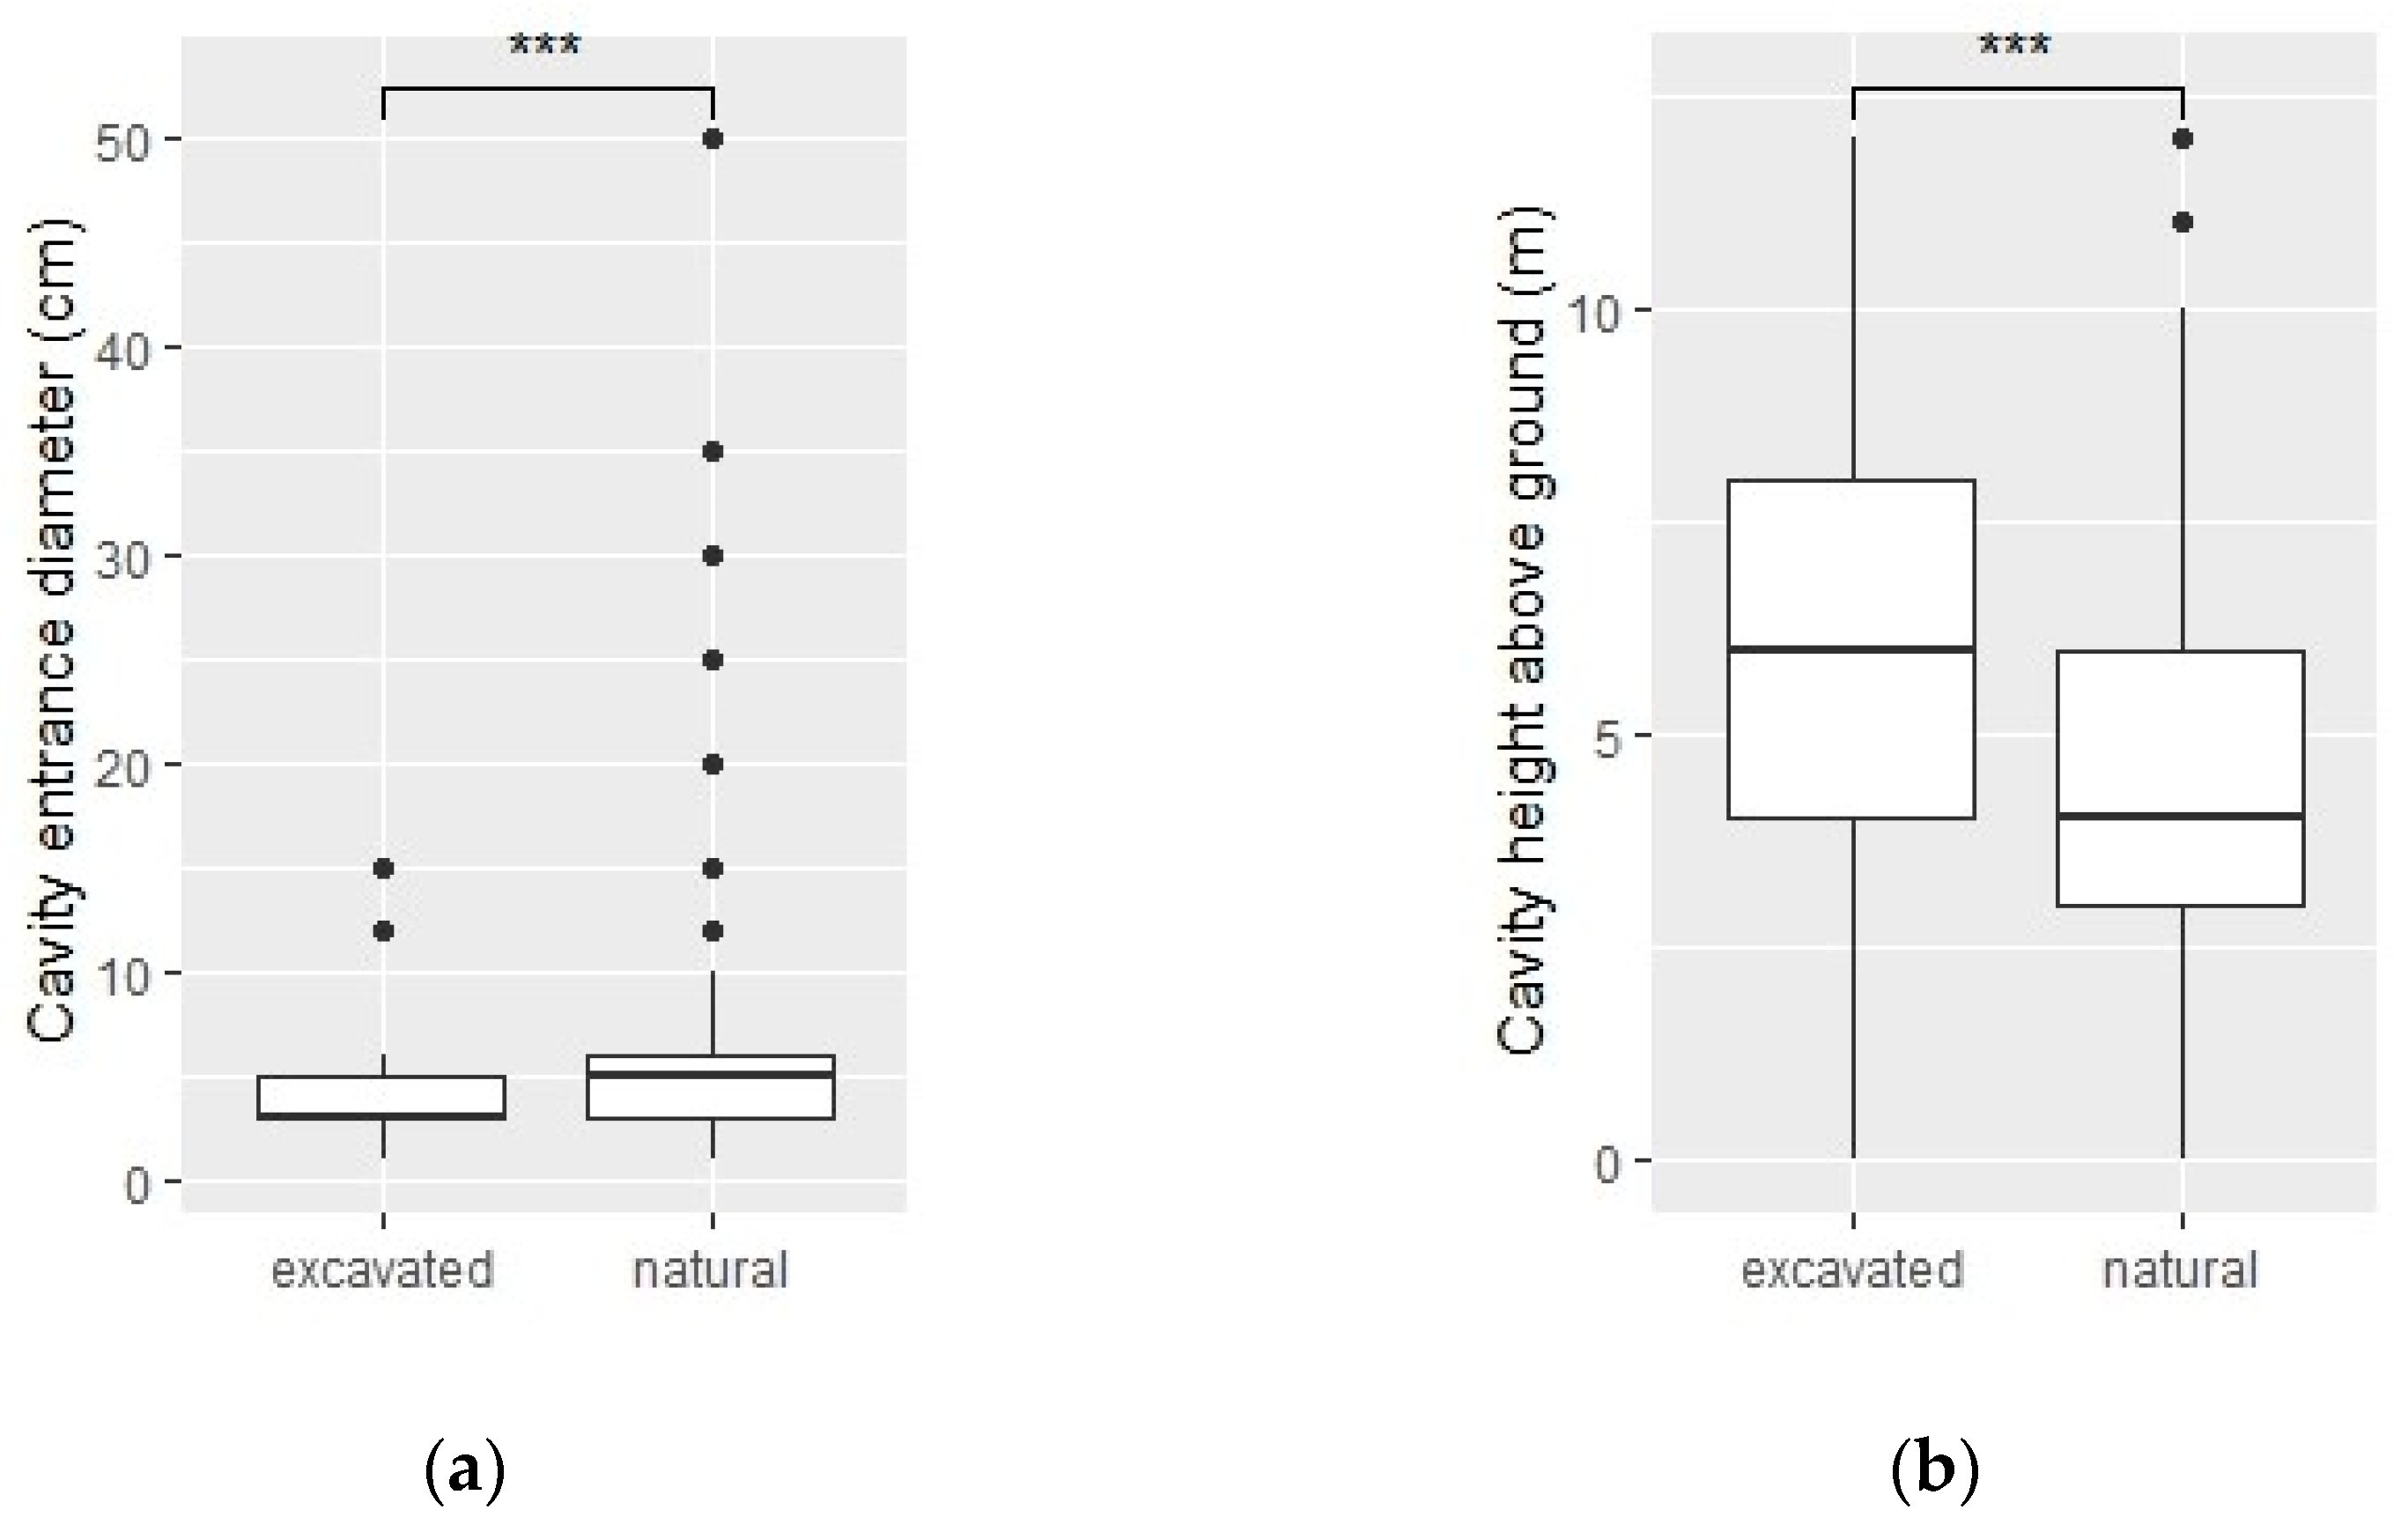
Across all sampled areas, we detected 284 tree cavities, 77 of which were excavated. Excavated cavities were typically smaller (W = 5728.5, p < 0.001; Figure 1a) and higher above ground (W = 10,397, p < 0.001; Figure 1b) than naturally occurring cavities, with a median entrance diameter of 3 cm and a median height of 6 m (compared to 5 cm and 4 m, respectively, for naturally occurring cavities). The data only support potential excavator selection for black locust (Robinia pseudoacacia; 12% of excavated cavities but only 4% of all trees, X2 = 6.64, p < 0.01) and American elm (Ulmus americana; 5% of excavated cavities but only 0.8% of all trees, X2 = 7.24, p < 0.01). Norway spruce (Picea abies) appears to be highly undesirable to excavators, as no excavated cavities were found in Norway spruce even though the species comprised more than 12% of all trees (X2 = 9.47, p < 0.01).
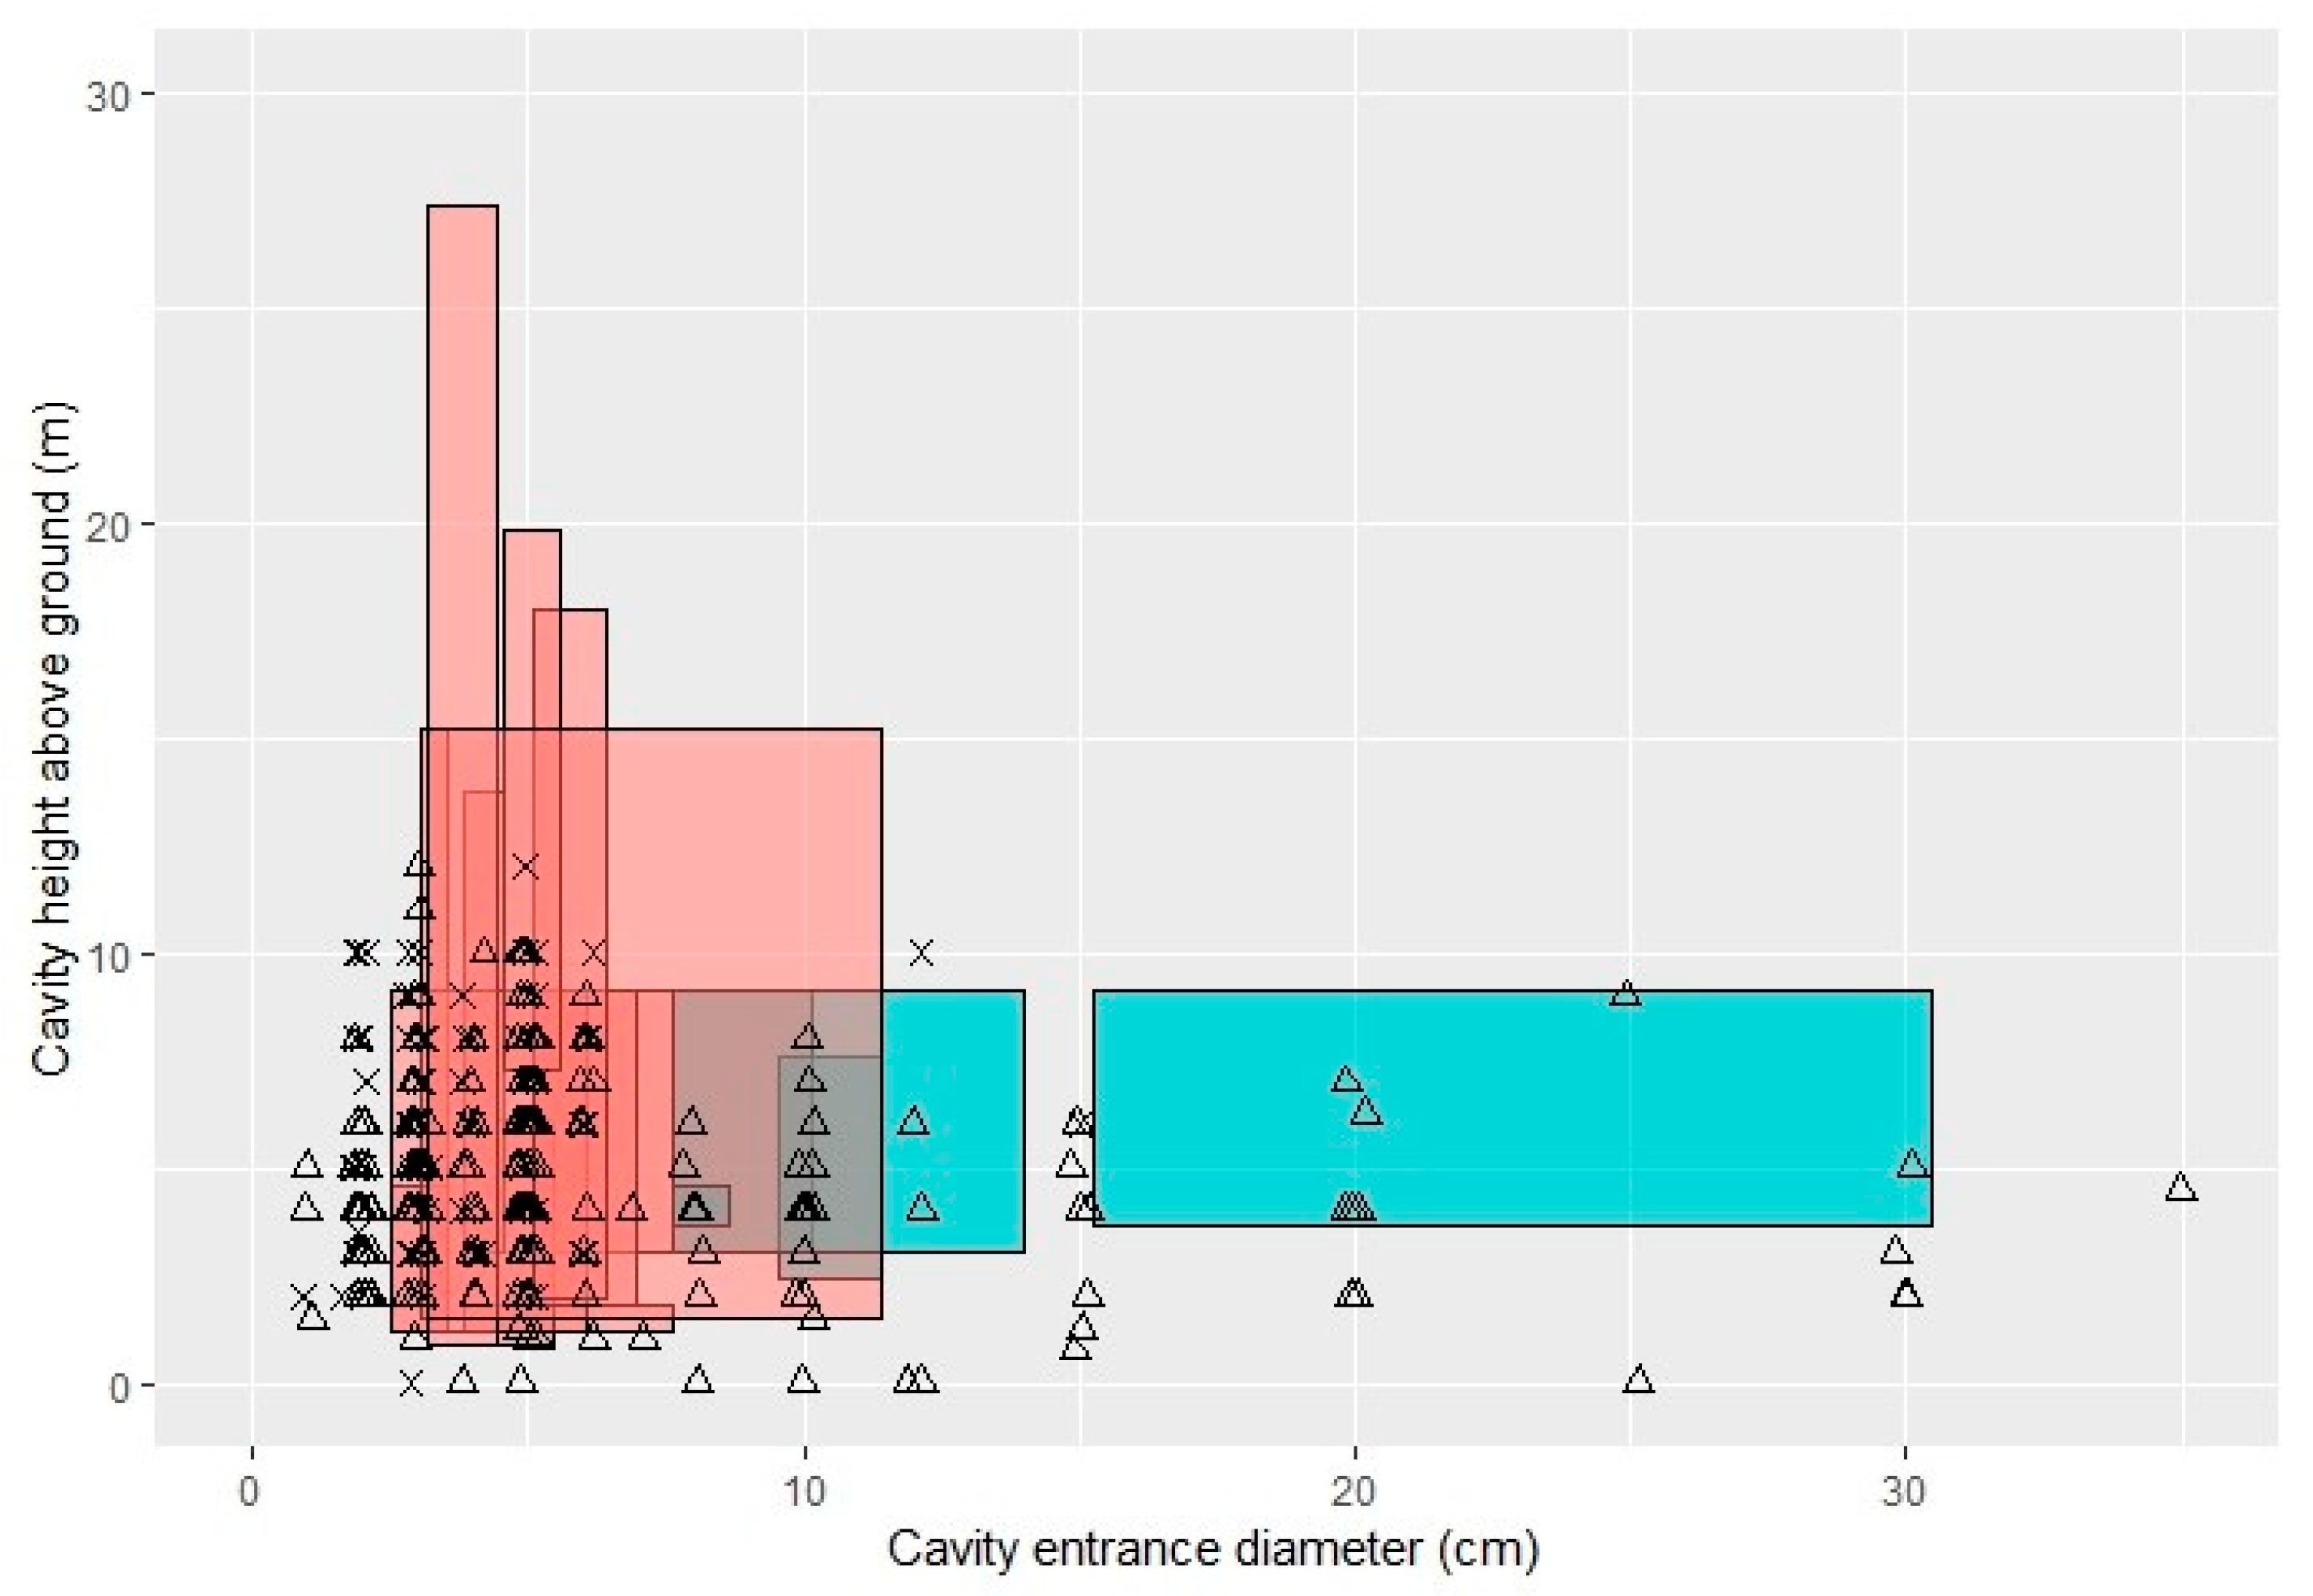
A total of 206 of the 284 cavities we observed fall within the highly overlapping region of suitability for birds in our study area (Figure 2), and would therefore serve a diversity of local species (Table A1). It is highly likely that at least some of the smaller cavities are suitable for our two smallest species (house wrens and black-capped chickadees) but, to be conservative, we excluded 43 cavities that were approximately 2 cm in diameter from our count of usable cavities. Although we did not survey nocturnal birds, another twelve of the cavities we observed would be suitable for barred owls, and smaller owl species fall into the aforementioned overlapping region.
3.2. Habitat Selection Models
Of the 12 cavity-nesting species, three were too rare (four or fewer sample locations) and two were too widespread (21 or more sample locations) to develop models robust to cross-validation error. For rarely encountered species, the null model (to always predict the species’ absence) had such low error that it could not be improved upon. Similarly, for widespread species the best model was the null model of always predicting the species’ presence. For three of the other species, the cross-validation error was high for unclear reasons and we rejected classification trees for these species. Thus, we present classification trees (Figure 3) for the four remaining species: Northern flickers (Colaptes auratus), house wrens (Troglodytes aedon), downy woodpeckers (Picoides pubescens), and eastern bluebirds (Sialia sialis).
Northern flickers were most likely to be encountered at points with greater than 32% canopy within 1 km, and with fewer than 22 shrubs in the sample area (model error = 0.029). House wrens were most likely to be encountered at points at least 1 km from a major road and with 5 or more headstones or other monuments taller than 2 m in the sample area (model error = 0.059). Downy woodpeckers were most likely to be encountered at points with at least 0.06 m2/ha of dead or dying trees (model error = 0.265). Eastern bluebirds were most likely to be encountered at points with more than 15 headstones or other monuments taller than 2 m in the sample area (model error = 0.147). More detailed results are shown in Figure 3.
3.3. Richness of Cavity-Nesting Birds
Regression residuals were normally distributed for all linear regression models (Shapiro–Wilk test: p > 0.05). Landscape-level variables best explained native cavity-nesting species richness. All three landscape-level single-variable models performed better than the null model. Richness of native cavity-nesting birds was positively associated with canopy cover within 1 km of the sample point and distance to a primary or secondary road, and was negatively associated with distance to a body of water. The only local-level variable that out-performed the null model was tree density, which was positively associated with richness of cavity-nesting birds (Table 3). The combined model explained 39% of the variation in richness and outperformed the single variable models. There was no significant spatial autocorrelation in the residuals of the combined model (Moran’s I = 0.08, p = 0.20).
4. Discussion
Cemeteries form an important but largely unstudied component of urban green space. There has been growing momentum in creating and managing cemeteries with more explicit conservation and environmental objectives [43], and our research can inform these efforts by identifying characteristics that make cemeteries attractive to birds. Our results show that Chicago’s cemeteries provide habitat for a diversity of birds, including 12 native cavity-nesting bird species. Landscape-level variables best predicted cavity-nesting species richness, but local-level variables influenced habitat selection for at least some species. Therefore it is worthwhile for even a small cemetery surrounded by dense urbanization to take conservation initiatives. Here we discuss our results in light of ways that cemeteries can support cavity-nesting bird conservation.
4.1. Site Selection for Establishment of New Cemeteries
Interestingly, cemetery size was not a good predictor of cavity-nesting species richness, nor was it an important factor in any of our classification trees. In our largest cemetery (Rosehill, 141 ha), the highest richness we detected in any of the five points sampled was 4 cavity-nesting species. In contrast, the sample point with the highest cavity-nesting species richness (7 species) was in a below-average sized cemetery (Mt. Greenwood, 30.4 hectares). One possible explanation is that larger cemeteries experience higher levels of noise disturbance from mowing. A groundskeeper at Graceland cemetery (46.7 ha) told us that they mow a different section of the cemetery every day during the summer. Some green cemeteries use the revenues from graves on a small section of land to conserve a larger section of land [44]. Recognizing that land area is generally important for biodiversity conservation [45], this design strategy would allow for a large preserve with only a small area that would be mowed, decreasing noise disturbance.
Landscape-scale features are generally beyond the control of cemetery land managers, especially in the case of older, established cemeteries. However, they might inform decisions about where to establish new cemeteries. Establishing a conservation burial ground in an area with high canopy cover, close to a body of water, and far from a major road would support greater species richness and may influence habitat selection by species such as house wrens and northern flickers.
4.2. Snag Provisioning
For many cavity-nesting species, adequate snag availability could be ensured with only modest management actions. For example, we never detected downy woodpeckers at sampled points with a snag basal area less than 0.06 m²/ha. This is a relatively low threshold value, which can be met by a single, modestly-sized (~28 cm DBH) snag per hectare. Attracting downy woodpeckers—and other woodpeckers—can benefit other species as well. Downy woodpeckers excavate their own cavities and typically do not reuse them [46], providing nesting opportunities for secondary cavity-nesters. In North America, 77% of cavities used by secondary cavity-nesters are excavated (as opposed to naturally-occurring) [47]; the estimates are lower for other continents. Globally, the majority of secondary cavity-nesters reuse woodpecker-excavated cavities rather than cavities excavated by other groups (e.g., in families Paridae and Sittidae) [1]. The excavated cavities that we observed were smaller and higher above ground than naturally-occurring cavities (Figure 1), so they may be less susceptible to nest predation.
Intentionally creating snags from living trees offers a way to increase snag availability where they are lacking. Of the methods they tested, Bull and Partridge found that topping trees with a saw provided the best potential foraging and nesting sites [48]. We suggest targeting invasive tree species for snag creation. Invasive tree species [49] comprised nearly one fifth of all the trees in our sampled areas, both by number of trees (120 trees of 623 trees total) and by basal area (42.2 of 216.1 m2). At least one invasive species was encountered at 26 of the 34 sampled areas. The most common invasive tree species encountered was Norway maple (Acer platanoides; Table A2 of Appendix B), which has wind-dispersed seeds and shade-tolerant seedlings. These traits allow the species to invade even intact forests [50]. Creating snags from Norway maples would be a service not only to cavity-nesting birds, but also to nearby forest preserves, if present. Cemeteries could also provide nest boxes, which house a subset of cavity-nesting species such as eastern bluebirds [35].
4.3. Headstones and Monuments
Eastern bluebirds selected habitat where headstones and other monuments provided sufficient perches for foraging by hawking. It is likely these perches would benefit other hawking species, and other species (such as the house wren) could use the perches for vocalizing. In a manipulative experiment, increasing the number of perches in a landscape decreased the territory sizes of individual loggerhead shrikes (Lanius ludovicianus), allowing a greater abundance of loggerhead shrikes to be supported by the same area of land [51]. Headstones and other monuments are common in older urban cemeteries, but many of the newer green cemeteries discourage them in favor of “naturalistic vistas” [43]. We suggest that while headstones may look unnatural, they benefit some wildlife, and a compromise could be reached where they are allowed in some designated areas and/or designed to fit a naturalistic aesthetic.
4.4. Landscaping Decisions
We only found weak evidence that primary cavity excavators selected specific tree species for cavity excavation, although they seemed to avoid Norway spruce. Another possibility is that holes had been excavated in Norway spruce but did not persist. In a study in Poland, woodpecker cavities in Norway spruce had the shortest lifespans of all trees surveyed [52]. When cemetery land managers have the option to choose trees for landscaping, we suggest prioritizing native trees that host a diversity of insect prey for breeding birds [19], rather than prioritizing tree species that might be attractive to excavators.
Other than wetland species, which would not use cemeteries as habitat, and nocturnal species, which we did not survey, the only local cavity-nesting bird species that we did not encounter was the red-headed woodpecker (Melanerpes erythrocephalus). Their absence is even more conspicuous because we observed 30 cavities suitable for the species in terms of diameter and height above ground. This is not entirely surprising because the species has been steadily declining [53]. King et al. [54] observed that red-headed woodpecker nests were more likely to be encountered in high densities of “decadent trees” (trees with dead limbs). At a density of 100 decadent trees per hectare, the probability of the authors encountering a nest increased to nearly 50% [54]. The highest density of all trees (decadent and otherwise) that we measured in our sampled areas was 42 trees/ha, so Chicago’s cemeteries might not provide suitable habitat for red-headed woodpeckers. We recommend planting trees in a few high-density clusters; as the trees age they may attract and support red-headed woodpeckers.
We had included number of shrubs as a variable because shrubs are beneficial to many species of birds, providing cover from predators [18]. However, an excess of shrubs deterred northern flickers according to our classification tree. This result makes sense because northern flickers are ground foragers so they prefer open areas [55]. While shrubs offer benefits to birds and other wildlife, such as cover from predators while foraging [18] as well as foraging and nesting opportunities, there might be diminishing returns at high densities of shrubs. We expect that this variable would have been more important if our study examined the rest of the bird community, since some species (such as the gray catbird [56]) make their nests in shrubs.
4.5. Cemeteries as Urban Habitat
Although we have shown that cemeteries provide important habitat to cavity-nesting birds, it is worthwhile to note that our results might not hold true everywhere. While park-like cemeteries such as the ones in Chicago are relatively common in much of the world, South American cemeteries are commonly highly hardscaped and lacking in vegetation. For example, the famous La Recoleta cemetery in Buenos Aires, Argentina, has less than 10% vegetation cover [57]. These cemeteries are likely of lower conservation value to cavity-nesting birds, which is unfortunate because South America hosts the highest richness of cavity-nesting birds globally, as well as the highest number of threatened cavity-nesting bird species [1].
Chicago’s cemeteries comprise a relatively small area of the city. Yet to cavity-nesting birds they offer unique, high-quality habitat that is difficult to find in the rest of the city. Despite the continued growth of Chicago, these cemeteries have persisted in part because of their value as sacred spaces. Our study shows that urban cemeteries provide important habitat for cavity-nesting birds and therefore their value as conservation spaces deserves greater recognition.
Author Contributions
Conceptualization, A.D.S.; formal analysis, A.D.S.; investigation, A.D.S.; methodology, A.D.S.; supervision, E.M.; visualization, A.D.S.; writing—original draft, A.D.S.; and writing—review and editing, A.D.S. and E.M.
Funding
This research received no external funding.
Acknowledgments
Alexis D. Smith would like to thank Henry Howe for assigning her a teaching assistantship that would accommodate summer fieldwork, and Megan Garfinkel and Chris Whelan for their very helpful discussions regarding study design.
Conflicts of Interest
The authors declare no conflict of interest.
Appendix A

Table A1.
Cavity requirements or recommendations for 16 cavity-nesting species that breed in the Chicago region. Information in this table was used to create the polygons in Figure 2.
Table A1.
Cavity requirements or recommendations for 16 cavity-nesting species that breed in the Chicago region. Information in this table was used to create the polygons in Figure 2.
| Species | Minimum Diameter (cm) | Maximum Diameter (cm) | Minimum Height (m) | Maximum Height (m) | Source(s) |
|---|---|---|---|---|---|
| American Kestrel (Falco sparverius) | 5.08 | 10.16 | 3.05 | 9.14 | [34,35] |
| Barn Owl (Tyto alba) | 9.53 | 11.43 | 2.44 | 7.62 | [35] |
| Barred Owl (Strix varia) | 15.24 | 30.48 | 3.66 | 9.14 | [34,35] |
| Black-capped Chickadee (Poecile atricapillus) | 2.54 | 3.54 | 1.22 | 4.57 | [34,35] |
| Downy Woodpecker (Picoides pubescens) | 3.05 | 3.56 | 1.52 | 15.24 | [2,34] |
| Eastern Bluebird (Sialia sialis) | 3.81 | 7.62 | 1.22 | 1.83 | [34,35] |
| Eastern Screech Owl (Megascops asio) | 7.62 | 13.97 | 3.05 | 9.14 | [34,35] |
| Great Crested Flycatcher (Myiarchus crinitus) | 4.45 | 5.45 | 0.91 | 6.10 | [35] |
| Hairy Woodpecker (Picoides villosus) | 3.81 | 4.57 | 3.05 | 13.72 | [2,34] |
| House Wren (Troglodytes aedon) | 2.54 | 6.08 | 1.22 | 9.14 | [34,35] |
| Northern Flicker (Colaptes auratus) | 5.08 | 6.99 | 1.83 | 9.14 | [2,34,35] |
| Northern Saw-whet owl (Aegolius acadicus) | 7.62 | 8.62 | 3.66 | 4.57 | [35] |
| Red-bellied Woodpecker (Melanerpes carolinus) | 5.10 | 6.40 | 2.00 | 18.00 | [33] |
| Red-headed Woodpecker (Melanerpes erythrocephalus) | 4.57 | 5.57 | 7.32 | 19.81 | [2] |
| Tufted Titmouse (Baelophus bicolor) | 3.18 | 4.45 | 0.91 | 27.43 | [34,35] |
| White-breasted Nuthatch (Sitta carolinensis) | 3.18 | 11.43 | 1.52 | 15.24 | [34,35] |
Appendix B
Table A2.
Tree taxa encountered across all 34 cemetery sample points. Invasive species are marked with an asterisk [49].
Table A2.
Tree taxa encountered across all 34 cemetery sample points. Invasive species are marked with an asterisk [49].
| Tree Taxon | Number of Points Where Encountered | Number of Trees | Total Basal Area (m2) |
|---|---|---|---|
| Acer platanoides* | 17 | 52 | 15.60 |
| Acer rubrum | 4 | 4 | 0.35 |
| Acer saccharinum | 23 | 65 | 35.29 |
| Acer saccharum | 11 | 19 | 4.47 |
| Aesculus glabra | 4 | 11 | 4.37 |
| Aesculus hippocastanum | 2 | 4 | 1.57 |
| Ailanthus altissima* | 4 | 9 | 5.52 |
| Betula alleghaniensis | 1 | 1 | 0.13 |
| Betula nigra | 1 | 1 | 0.11 |
| Betula papyrifera | 1 | 1 | 0.22 |
| Catalpa speciosa | 6 | 40 | 14.21 |
| Celtis occidentalis | 11 | 15 | 6.49 |
| Crataegus crus-galli | 2 | 5 | 0.28 |
| Fagus sylvatica | 1 | 1 | 0.01 |
| Fraxinus americana | 9 | 18 | 4.51 |
| Fraxinus pennsylvanica | 1 | 2 | 0.06 |
| Ginkgo biloba | 1 | 1 | 0.17 |
| Gleditsia triacanthos | 14 | 28 | 11.68 |
| Gymnocladus dioicus | 1 | 1 | 0.35 |
| Juglans nigra | 1 | 1 | 0.10 |
| Juniperus virginiana | 12 | 28 | 2.85 |
| Liliodendron tulipifera | 1 | 2 | 2.13 |
| Liquidambar styraciflua | 1 | 1 | 0.23 |
| Maclura pomifera* | 1 | 1 | 0.30 |
| Magnolia liliiflora | 2 | 2 | 0.24 |
| Malus spp. | 1 | 1 | 0.16 |
| Metasequoia glyptostroboides | 1 | 1 | 0.24 |
| Morus alba* | 10 | 26 | 7.98 |
| Picea abies | 20 | 77 | 10.00 |
| Pinus resinosa | 4 | 10 | 2.49 |
| Pinus sylvestris | 1 | 1 | 0.24 |
| Planera aquatica | 1 | 1 | 0.16 |
| Platanus occidentalis | 7 | 8 | 4.09 |
| Populus deltoides | 3 | 5 | 4.21 |
| Prunus spp. | 4 | 5 | 1.46 |
| Quercus spp. | 13 | 88 | 40.49 |
| Robinia pseudoacacia* | 2 | 26 | 10.15 |
| Thuja occidentalis | 3 | 15 | 2.06 |
| Tilia americana | 13 | 28 | 11.78 |
| Tilia cordata | 1 | 1 | 0.52 |
| Ulmus americana | 4 | 5 | 3.73 |
| Ulmus pumila* | 5 | 6 | 2.67 |
| Ulmus rubra | 5 | 5 | 1.93 |
| Ulmus thomasii | 1 | 1 | 0.53 |
References
- Van der Hoek, Y.; Gaona, G.V.; Martin, K. The diversity, distribution and conservation status of the tree-cavity-nesting birds of the world. Divers. Distrib. 2017, 23, 1120–1131. [Google Scholar] [CrossRef] [Green Version]
- Scott, V.E.; Evans, K.E.; Patton, D.R.; Stone, C.P. Cavity-Nesting Birds of North American Forests; Agricultural Handbook; U.S. Department of Agriculture: Washington, DC, USA, 1977; Volume 511, pp. 1–97.
- LaMontagne, J.M.; Kilgour, R.J.; Anderson, E.C.; Magle, S. Tree cavity availability across forest, park, and residential habitats in a highly urban area. Urban Ecosyst. 2015, 18, 151–167. [Google Scholar] [CrossRef]
- Blewett, C.M.; Marzluff, J.M. Effects of urban sprawl on snags and the abundance and productivity of cavity-nesting birds. Condor 2005, 107, 678–693. [Google Scholar] [CrossRef]
- Le Roux, D.S.; Ikin, K.; Lindenmayer, D.B.; Manning, A.D.; Gibbons, P. The future of large old trees in urban landscapes. PLoS ONE 2014, 9, e99403. [Google Scholar] [CrossRef] [PubMed]
- Beissinger, S.R.; Osborne, D.R. Effects of urbanization on avian community organization. Condor 1982, 84, 75–83. [Google Scholar] [CrossRef]
- Strausberger, B.M.; Ashley, M.V. Community-wide patterns of parasitism of a host “generalist” brood-parasitic cowbird. Oecologia 1997, 112, 254–262. [Google Scholar] [CrossRef] [PubMed]
- Fontaine, J.J.; Martel, M.; Markland, H.M.; Niklison, A.M.; Decker, K.L.; Martin, T.E. Testing ecological and behavioral correlates of nest predation. Oikos 2007, 116, 1887–1894. [Google Scholar] [CrossRef]
- Crooks, K.R.; Soulé, M.E. Mesopredator release and avifaunal extinctions in a fragmented system. Nature 1999, 400, 563–566. [Google Scholar] [CrossRef]
- Croci, S.; Butet, A.; Clergeau, P. Does urbanization filter birds on the basis of their biological traits? Condor 2008, 110, 223–240. [Google Scholar] [CrossRef]
- Lancaster, R.K.; Rees, W.E. Bird communities and the structure of urban habitats. Can. J. Zool. 1979, 57, 2358–2368. [Google Scholar] [CrossRef]
- Lim, H.C.; Sodhi, N.S. Responses of avian guilds to urbanisation in a tropical city. Landsc. Urban Plan. 2004, 66, 199–215. [Google Scholar] [CrossRef]
- Lussenhop, J. Urban cemeteries as bird refuges. Condor 1977, 79, 456–461. [Google Scholar] [CrossRef]
- Bovyn, R.A.; Lordon, M.C.; Grecco, A.E.; Leeper, A.C.; LaMontagne, J.M. Tree cavity availability in urban cemeteries and city parks. J. Urban Ecol. 2019, 5, juy030. [Google Scholar] [CrossRef]
- James, F.C.; Wamer, N.O. Relationships between temperate forest bird communities and vegetation structure. Ecology 1982, 63, 159–171. [Google Scholar] [CrossRef]
- Wiens, J.A. Habitat fragmentation: Island v landscape perspectives on bird conservation. Ibis 2008, 137, S97–S104. [Google Scholar] [CrossRef]
- Warren, T.L.; Betts, M.G.; Diamond, A.W.; Forbes, G.J. The influence of local habitat and landscape composition on cavity-nesting birds in a forested mosaic. Ecol. Manag. 2005, 214, 331–343. [Google Scholar] [CrossRef]
- Brown, J.S.; Kotler, B.P. Hazardous duty pay and the foraging cost of predation: Foraging cost of predation. Ecol. Lett. 2004, 7, 999–1014. [Google Scholar] [CrossRef]
- Burghardt, K.T.; Tallamy, D.W. Plant origin asymmetrically impacts feeding guilds and life stages driving community structure of herbivorous arthropods. Divers. Distrib. 2013, 19, 1553–1565. [Google Scholar] [CrossRef]
- Greenberg, J. A Natural History of the Chicago Region; University of Chicago Press: Chicago, IL, USA, 2002; Volume 219, pp. 1–15. [Google Scholar]
- United States Census Bureau. Annual Estimates of the Resident Population for Incorporated Places of 50,000 or More, Ranked by July 1, 2017 Population: April 1, 2010 to July 1, 2017; United States Census Bureau: Hutland Sutherland, MD, USA. Available online: https://factfinder.census.gov/faces/tableservices/jsf/pages/productview.xhtml?src=bkmk. (accessed on 12 November 2018).
- Pattison, W.D. The cemeteries of Chicago: A phase of land utilization. Ann. Assoc. Am. Geogr. 1955, 45, 245–257. [Google Scholar] [CrossRef]
- French, S. The cemetery as cultural institution: The establishment of Mount Auburn and the “rural cemetery” movement. Am. Q. 1974, 26, 37–59. [Google Scholar] [CrossRef]
- Ralph, C.J.; Droege, S.; Sauer, J.R. Managing and monitoring birds using point counts: Standards and applications. In Monitoring Bird Populations by Point Counts; USDA Forest Service General Technical Report; US Department of Agriculture, Forest Service, Pacific Southwest Research Station: Albany, CA, USA, 1995; pp. 161–168. [Google Scholar]
- Imbeau, L.; Desrochers, A. Foraging ecology and use of drumming trees by three-toed woodpeckers. J. Wildl. Manag. 2002, 66, 222–231. [Google Scholar] [CrossRef]
- ESRI. ArcGIS Desktop: 10.5; Environmental Systems Research Institute: Redlands, CA, USA, 2017. [Google Scholar]
- United States Census Bureau. TIGER/Line® Shapefiles; United States Census Bureau: Hutland Sutherland, MD, USA. Available online: https://www.census.gov/geo/maps-data/data/tiger-line.html (accessed on 15 October 2017).
- United States Geological Survey. USGS National Hydrography Dataset (NHD); United States Geological Survey: Reston, VA, USA. Available online: https://www.usgs.gov/core-science-systems/ngp/national-hydrography (accessed on 15 October 2017).
- O’Neil-Dunne, J. Cook County Land Cover. Available online: http://www.uvm.edu/~joneildu/downloads/CookCounty/ (accessed on 22 November 2017).
- Nur, N.; Jones, S.L.; Geupel, G.R. Statistical Guide to Data Analysis of Avian Monitoring Programs; U.S. Department of the Interior, Fish and Wildlife Service: Washington, DC, USA, 1999; pp. 1–46.
- Hollander, M.; Wolfe, D. Nonparametric Statistical Methods; Wiley: New York, NY, USA, 1973; pp. 68–75. [Google Scholar]
- R Core Team. R: A Language and Environment for Statistical Computing; R Foundation for Statistical Computing: Vienna, Austria, 2018. [Google Scholar]
- Jackson, J.A. A comparison of some aspects of the breeding ecology of red-headed and red-bellied woodpeckers in Kansas. Condor 1976, 78, 67–76. [Google Scholar] [CrossRef]
- Stokes, D.; Stokes, L. Stokes Nature Guides: A Guide to Bird Behavior; Little, Brown and Company: Boston, MA, USA, 1979; Volume I–III. [Google Scholar]
- Cornell Lab of Ornithology. All about Birdhouses; Cornell Lab of Ornithology: Ithaca, NY, USA; Available online: https://nestwatch.org/learn/all-about-birdhouses/ (accessed on 22 March 2019).
- De’ath, G.; Fabricius, K.A. Classification and regression trees: A powerful yet simple technique for ecological data analysis. Ecology 2000, 81, 3178–3192. [Google Scholar] [CrossRef]
- Therneau, T.; Atkinson, B. Rpart: Recursive Partitioning and Regression Trees, R Package Version 4.1-13. 2018.
- Anderson, D.R. Model Based Inference in the Life Sciences: A Primer on Evidence; Springer Science and Business Media: New York, NY, USA, 2008; pp. 1–184. [Google Scholar]
- Mazerolle, M. AICcmodavg: Model Selection and Multimodel Inference Based on (Q)AIC(c); R Package Version 2.1-1. 2017; Available online: https://www.fwspubs.org/doi/suppl/10.3996/102016-JFWM-079/suppl_file/10.3996102016-jfwm-079.s6.pdf (accessed on 10 June 2019).
- Paradis, E.; Schliep, K. ape 5.0: An environment for modern phylogenetics and evolutionary analyses in R. Bioinformatics 2018, 35, 526–528. [Google Scholar] [CrossRef] [PubMed]
- Ahlmann-Eltze, C. Ggsignif: Significance Brackets for “ggplot2”; R Package Version 0.4.0. 2017; Available online: https://cran.r-project.org/web/packages/ggsignif/ggsignif.pdf (accessed on 10 June 2019).
- Wickham, H. Ggplot2: Elegant Graphics for Data Analysis; Springer: New York, NY, USA, 2016. [Google Scholar]
- Green Burial Council. Our Standards. Available online: https://www.greenburialcouncil.org/our_standards.html (accessed on 22 March 2019).
- Basmajian, C.; Coutts, C. Planning for the disposal of the dead. J. Am. Plan. Assoc. 2010, 76, 305–317. [Google Scholar] [CrossRef]
- Lomolino, M.V. Ecology’s most general, yet protean pattern: The species-area relationship. J. Biogeogr. 2000, 27, 17–26. [Google Scholar] [CrossRef]
- Jackson, J.A.; Ouellet, H.R. Downy woodpecker (Dryobates pubescens). Birds N. Am. Online 2018. [Google Scholar] [CrossRef]
- Cockle, K.L.; Martin, K.; Wesołowski, T. Woodpeckers, decay, and the future of cavity-nesting vertebrate communities worldwide. Front. Ecol. Environ 2011, 9, 377–382. [Google Scholar] [CrossRef]
- Bull, E.L.; Partridge, A.D. Methods of killing trees for use by cavity nesters. Wildl. Soc. Bull. 1986, 14, 142–146. [Google Scholar]
- Swearingen, J.; Bargeron, C. Trees: Invasive Plant Atlas of the United States. Available online: https://www.invasiveplantatlas.org/trees.cfm (accessed on 22 March 2019).
- Martin, P.H.; Marks, P.L. Intact forests provide only weak resistance to a shade-tolerant invasive Norway maple (Acer platanoides L.). J. Ecol. 2006, 94, 1070–1079. [Google Scholar] [CrossRef]
- Yosef, R.; Grubb, T.C. Resource dependence and territory size in loggerhead shrikes (Lanius ludovicianus). Auk 1994, 111, 465–469. [Google Scholar] [CrossRef]
- Wesołowski, T. “Lifespan” of woodpecker-made holes in a primeval temperate forest: A thirty year study. Ecol. Manag. 2011, 262, 1846–1852. [Google Scholar] [CrossRef]
- Frei, B.; Smith, K.G.; Withgott, J.H.; Rodewald, P.G.; Pyle, P.; Patten, M.A. Red-headed woodpecker (Melanerpes erythrocephalus). Birds N. Am. 2000, 518, 28. [Google Scholar] [CrossRef]
- King, R.S.; Brashear, K.E.; Reiman, M. Red-headed woodpecker nest-habitat thresholds in restored savannas. J. Wildl. Manag. 2007, 71, 30–35. [Google Scholar] [CrossRef]
- Wiebe, K.L.; Moore, W.S. Northern flicker (Colaptes auratus). Birds N. Am. 2008, 166a, 167–173. [Google Scholar] [CrossRef]
- Smith, R.J.; Hatch, M.I.; Cimprich, D.A.; Moore, F.R. Gray catbird (Dumetella carolinensis). Birds N. Am. 1995. [Google Scholar]
- Vezzani, D.; Velázquez, S.M.; Soto, S.; Schweigmann, N.J. Environmental characteristics of the cemeteries of Buenos Aires City (Argentina) and infestation levels of Aedes aegypti (Diptera: Culicidae). Mem. Inst. Oswaldo Cruz 2001, 96, 467–471. [Google Scholar] [CrossRef] [PubMed]
Figure 1.
Box plots comparing excavated to naturally-occurring tree cavities in terms of their (a) entrance diameter and their (b) height above ground using the Wilcoxon test. In both comparisons, p < 0.001, as indicated by the asterisks. The box shows the interquartile range of the data (25th–75th percentile), with the line in the middle indicating the median. The “whiskers” (lines) extend to points within 1.5 times the interquartile range while the dots show outliers. Sample sizes = 77 (excavated cavities) and 207 (natural cavities). This figure was made using the R packages “ggsignif” [41] and “ggplot2” [42].
Figure 2.
Observed cavities in the context of their suitability to locally breeding cavity-nesting birds. Each polygon represents cavity requirements (or in some cases, recommendations) for a different cavity-nesting species in our region. Diurnal species are in pink and nocturnal species are in blue. Cavity polygon parameters for each species are from the literature [2,33,34,35] and are listed in Table A1 in Appendix A. Observed excavated (X’s) and naturally-occurring (triangles) cavities, recorded as part of the current study, are plotted over these polygons. One 50 cm diameter cavity (2 m above ground) was removed from the plot to improve image clarity. Data points have been “jittered” in order to show multiple cavities with the same dimensions. This figure was made with the R package “ggplot2” [42].
Figure 3.
Classification trees for four of the cavity-nesting species: (a) northern flicker; (b) house wren; (c) downy woodpecker; and (d) eastern bluebird. The shaded area in each top bar represents the proportion of points in which the species was detected (out of 34 total). At each subsequent level, the data are split according to the variable and level shown in the bar above, and the shaded area in the bars show the proportion of sites within those parameters in which each species was detected.
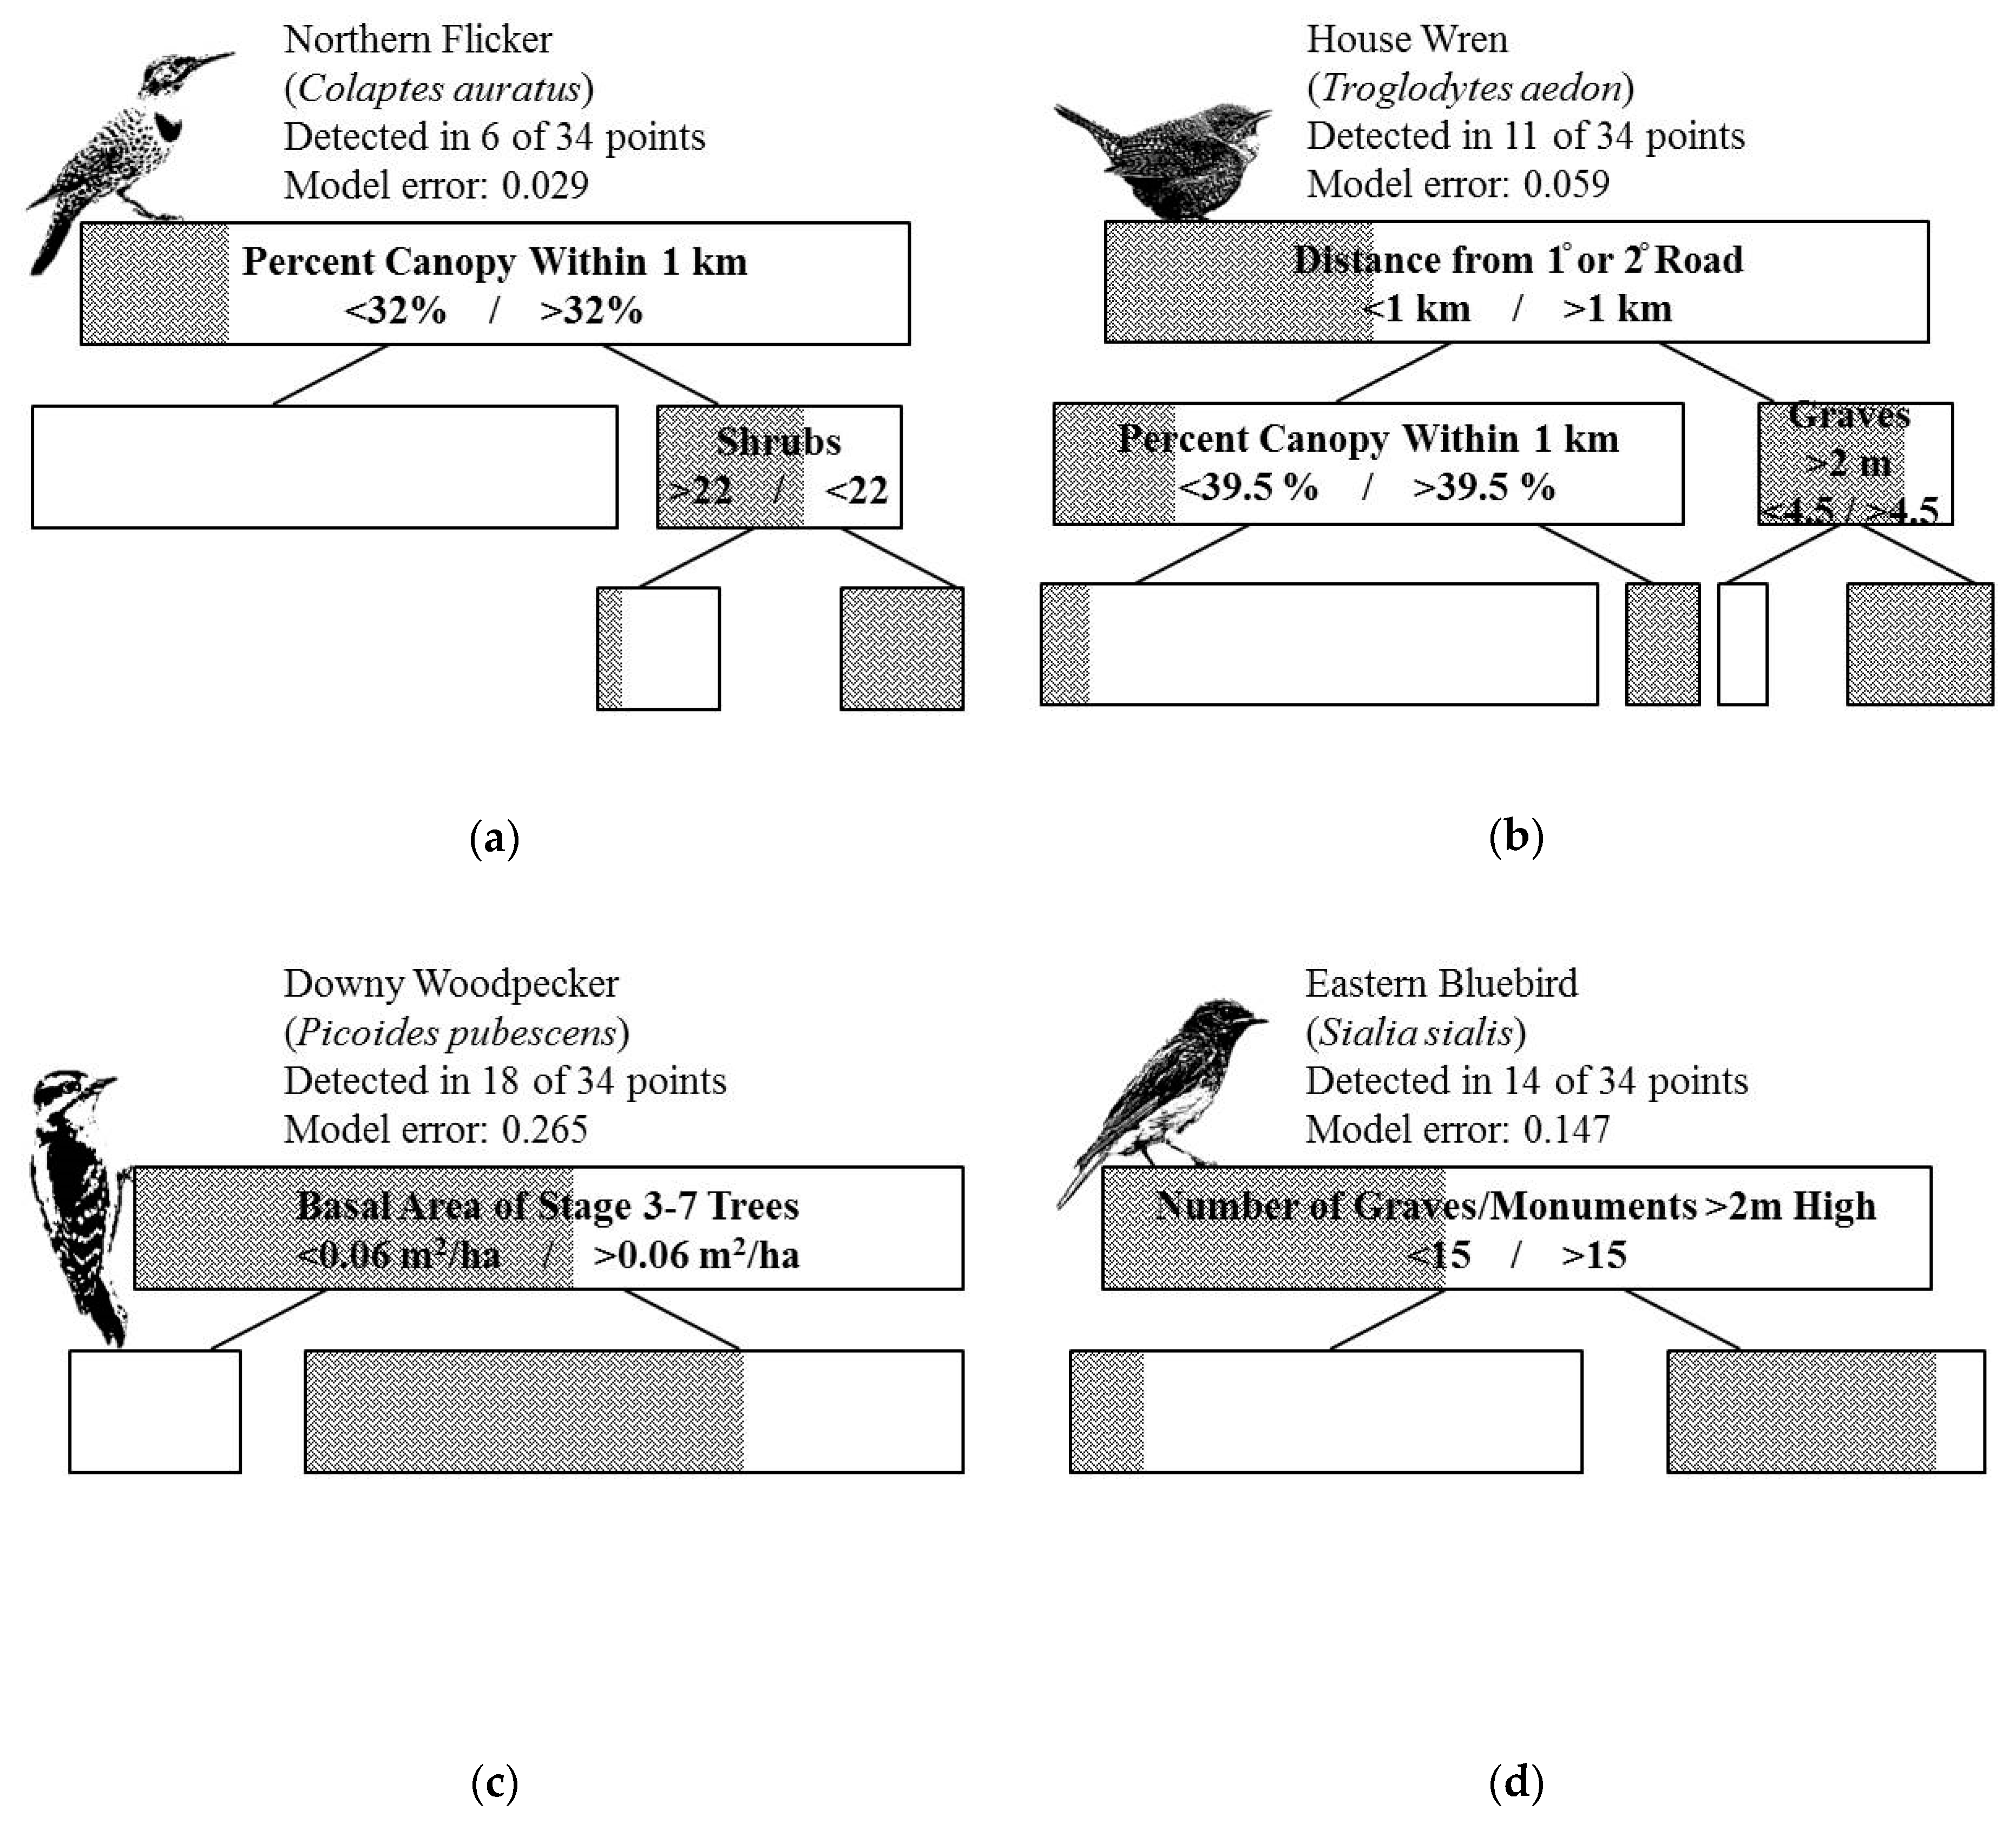
Table 1.
Characteristics of the cemetery sampled areas (N = 34). These eight variables were used in both our classification trees and the AICc model selection. SD = standard deviation of the sample.
Table 1.
Characteristics of the cemetery sampled areas (N = 34). These eight variables were used in both our classification trees and the AICc model selection. SD = standard deviation of the sample.
| Variable | Minimum | Median | Maximum | Mean ± SD |
|---|---|---|---|---|
| Tree density (trees/ha) | 6.4 | 25.5 | 42.0 | 23.3 ± 9.0 |
| Snag basal area per hectare (m2/ha) | 0 | 0.6 | 2.6 | 0.8 ± 0.8 |
| Cemetery area (ha) | 0.9 | 35.7 | 141 | 48.9 ± 44.0 |
| Number of shrubs | 0 | 15.5 | 39 | 15.6 ± 11.9 |
| Number of headstones taller than 2 m | 0 | 11 | 77 | 17.1 ± 19.6 |
| Distance from a 1° or 2° road (km) | 0.1 | 0.7 | 3.4 | 0.9 ± 0.9 |
| Distance from a body of water (km) | 0.1 | 0.4 | 2.1 | 0.6 ± 0.5 |
| Percent canopy cover within 1 km (%) | 18 | 29 | 51 | 29.1 ± 8.0 |
Table 2.
Native cavity-nesting bird species detected and the number of sample points (out of 34) in which they were detected. Birds are listed from most to least widespread.
Table 2.
Native cavity-nesting bird species detected and the number of sample points (out of 34) in which they were detected. Birds are listed from most to least widespread.
| Common Name | Scientific Name | Number of Points |
|---|---|---|
| Black-capped Chickadee | Poecile atricapillus | 30 |
| White-breasted Nuthatch | Sitta carolinensis | 21 |
| Downy Woodpecker | Picoides pubescens | 18 |
| Eastern Bluebird | Sialia sialis | 14 |
| Red-bellied Woodpecker | Melanerpes carolinus | 12 |
| House Wren | Troglodytes aedon | 11 |
| Northern Flicker | Colaptes auratus | 6 |
| Great Crested Flycatcher | Myiarchus crinitus | 6 |
| Hairy Woodpecker | Picoides villosus | 6 |
| American Kestrel | Falco sparverius | 4 |
| Tufted Titmouse | Baeolophus bicolor | 1 |
| Turkey Vulture | Cathartes aura | 1 |
Table 3.
Model selection table for linear models predicting native cavity-nesting species richness. Models are listed in rank order of AICc. The “combined model” is a linear model that includes all four of the variables that performed better than the null model. Coefficients are reported as the estimate ± the standard error. Coefficient of the null model is the intercept. K = number of parameters, and LL = log likelihood.
| Model | K | AICc | ΔAICc | AICc Weight | LL | Adjusted r2 | Coefficient of Variable in Single Variable Model | Coefficient of Variable in Combined Model |
|---|---|---|---|---|---|---|---|---|
| Combined model | 6 | 119.12 | 0.00 | 0.88 | −52.00 | 0.39 | N/A | N/A |
| Canopy within 1 km | 3 | 124.55 | 5.43 | 0.06 | −58.88 | 0.17 | 0.09 ± 0.03 | 0.04 ± 0.03 |
| Distance to a body of water | 3 | 125.27 | 6.15 | 0.04 | −59.23 | 0.15 | −1.24 ± 0.47 | −0.97 ± 0.41 |
| Tree density | 3 | 127.58 | 8.47 | 0.01 | −60.39 | 0.09 | 0.06 ± 0.03 | 0.06 ± 0.03 |
| Distance to a 1° or 2° road | 3 | 128.39 | 9.27 | 0.01 | −60.79 | 0.07 | 0.54 ± 0.29 | 0.60 ± 0.24 |
| Null | 2 | 129.51 | 10.40 | 0.00 | −62.56 | 0.00 | 3.82 ± 0.27 | N/A |
| Snag basal area | 3 | 131.33 | 12.22 | 0.00 | −62.27 | −0.01 | 0.26 ± 0.34 | N/A |
| Number of shrubs | 3 | 131.61 | 12.49 | 0.00 | −62.41 | −0.02 | −0.01 ± 0.02 | N/A |
| Cemetery area | 3 | 131.66 | 12.54 | 0.00 | −62.43 | −0.02 | 0.00 ± 0.01 | N/A |
| Number of headstones >2m | 3 | 131.88 | 12.77 | 0.00 | −62.54 | −0.03 | 0.00 ± 0.01 | N/A |
© 2019 by the authors. Licensee MDPI, Basel, Switzerland. This article is an open access article distributed under the terms and conditions of the Creative Commons Attribution (CC BY) license (http://creativecommons.org/licenses/by/4.0/).
Share and Cite
MDPI and ACS Style
Smith, A.D.; Minor, E. Chicago’s Urban Cemeteries as Habitat for Cavity-Nesting Birds. Sustainability 2019, 11, 3258. https://doi.org/10.3390/su11123258
AMA Style
Smith AD, Minor E. Chicago’s Urban Cemeteries as Habitat for Cavity-Nesting Birds. Sustainability. 2019; 11(12):3258. https://doi.org/10.3390/su11123258
Chicago/Turabian StyleSmith, Alexis D., and Emily Minor. 2019. "Chicago’s Urban Cemeteries as Habitat for Cavity-Nesting Birds" Sustainability 11, no. 12: 3258. https://doi.org/10.3390/su11123258
Note that from the first issue of 2016, this journal uses article numbers instead of page numbers. See further details here.