Article

A Sustainable Transport Competitiveness Analysis of the China Railway Express in the Context of the Belt and Road Initiative

1
School of Traffic and Transportation, Beijing Jiaotong University, Beijing 100044, China
2
Changchun No. 8 High school, Changchun 13000, China
3
Zhongshan Institute, University of Electronic Science and Technology, Zhongshan 528400, China
4
China Civil Aviation Environment and Sustainable Development Research Center, Tianjin 300300, China
*
Authors to whom correspondence should be addressed.
Sustainability 2019, 11(10), 2896; https://doi.org/10.3390/su11102896
Submission received: 17 April 2019 / Revised: 5 May 2019 / Accepted: 20 May 2019 / Published: 22 May 2019

Abstract

:
The implementation of China’s Belt and Road Initiative macro strategy has promoted exchanges and cooperation between China and Europe and countries along the route. The operation of the China Railway Express provides a new transportation platform for China–Europe trade. The sustainable development of the China Railway Express has a great significance in terms of promoting the growth of China–Europe trade and meeting the demand for freight in Asia and Europe. Its time-saving advantage over shipping and its economic advantage over air transport cannot be ignored. This paper is based on the discrete selection model of stochastic utility theory. The paper constructs a multi-logit model based on generalized cost functions, including economics, timeliness, reliability, convenience, safety, and environmental protection. To calculate the market share of the China Railway Express and China–Europe Shipping, the paper conducts a quantitative analysis of the market competitiveness of the China Railway Express. Then, the sensitivity analysis and elastic analysis are carried out on the China Railway Express freight rate, the Chinese road freight rate, the China Railway Express service fee, the China Railway Express travelling speed, the China Railway Express sending operation time at the departure station, the China Railway Express transportation time error, the China Railway Express transportation frequency, and the China Railway Express carbon emissions per unit. Finally, based on the analysis results, suggestions for promoting the sustainable development of the China Railway Express are given.

1. Introduction

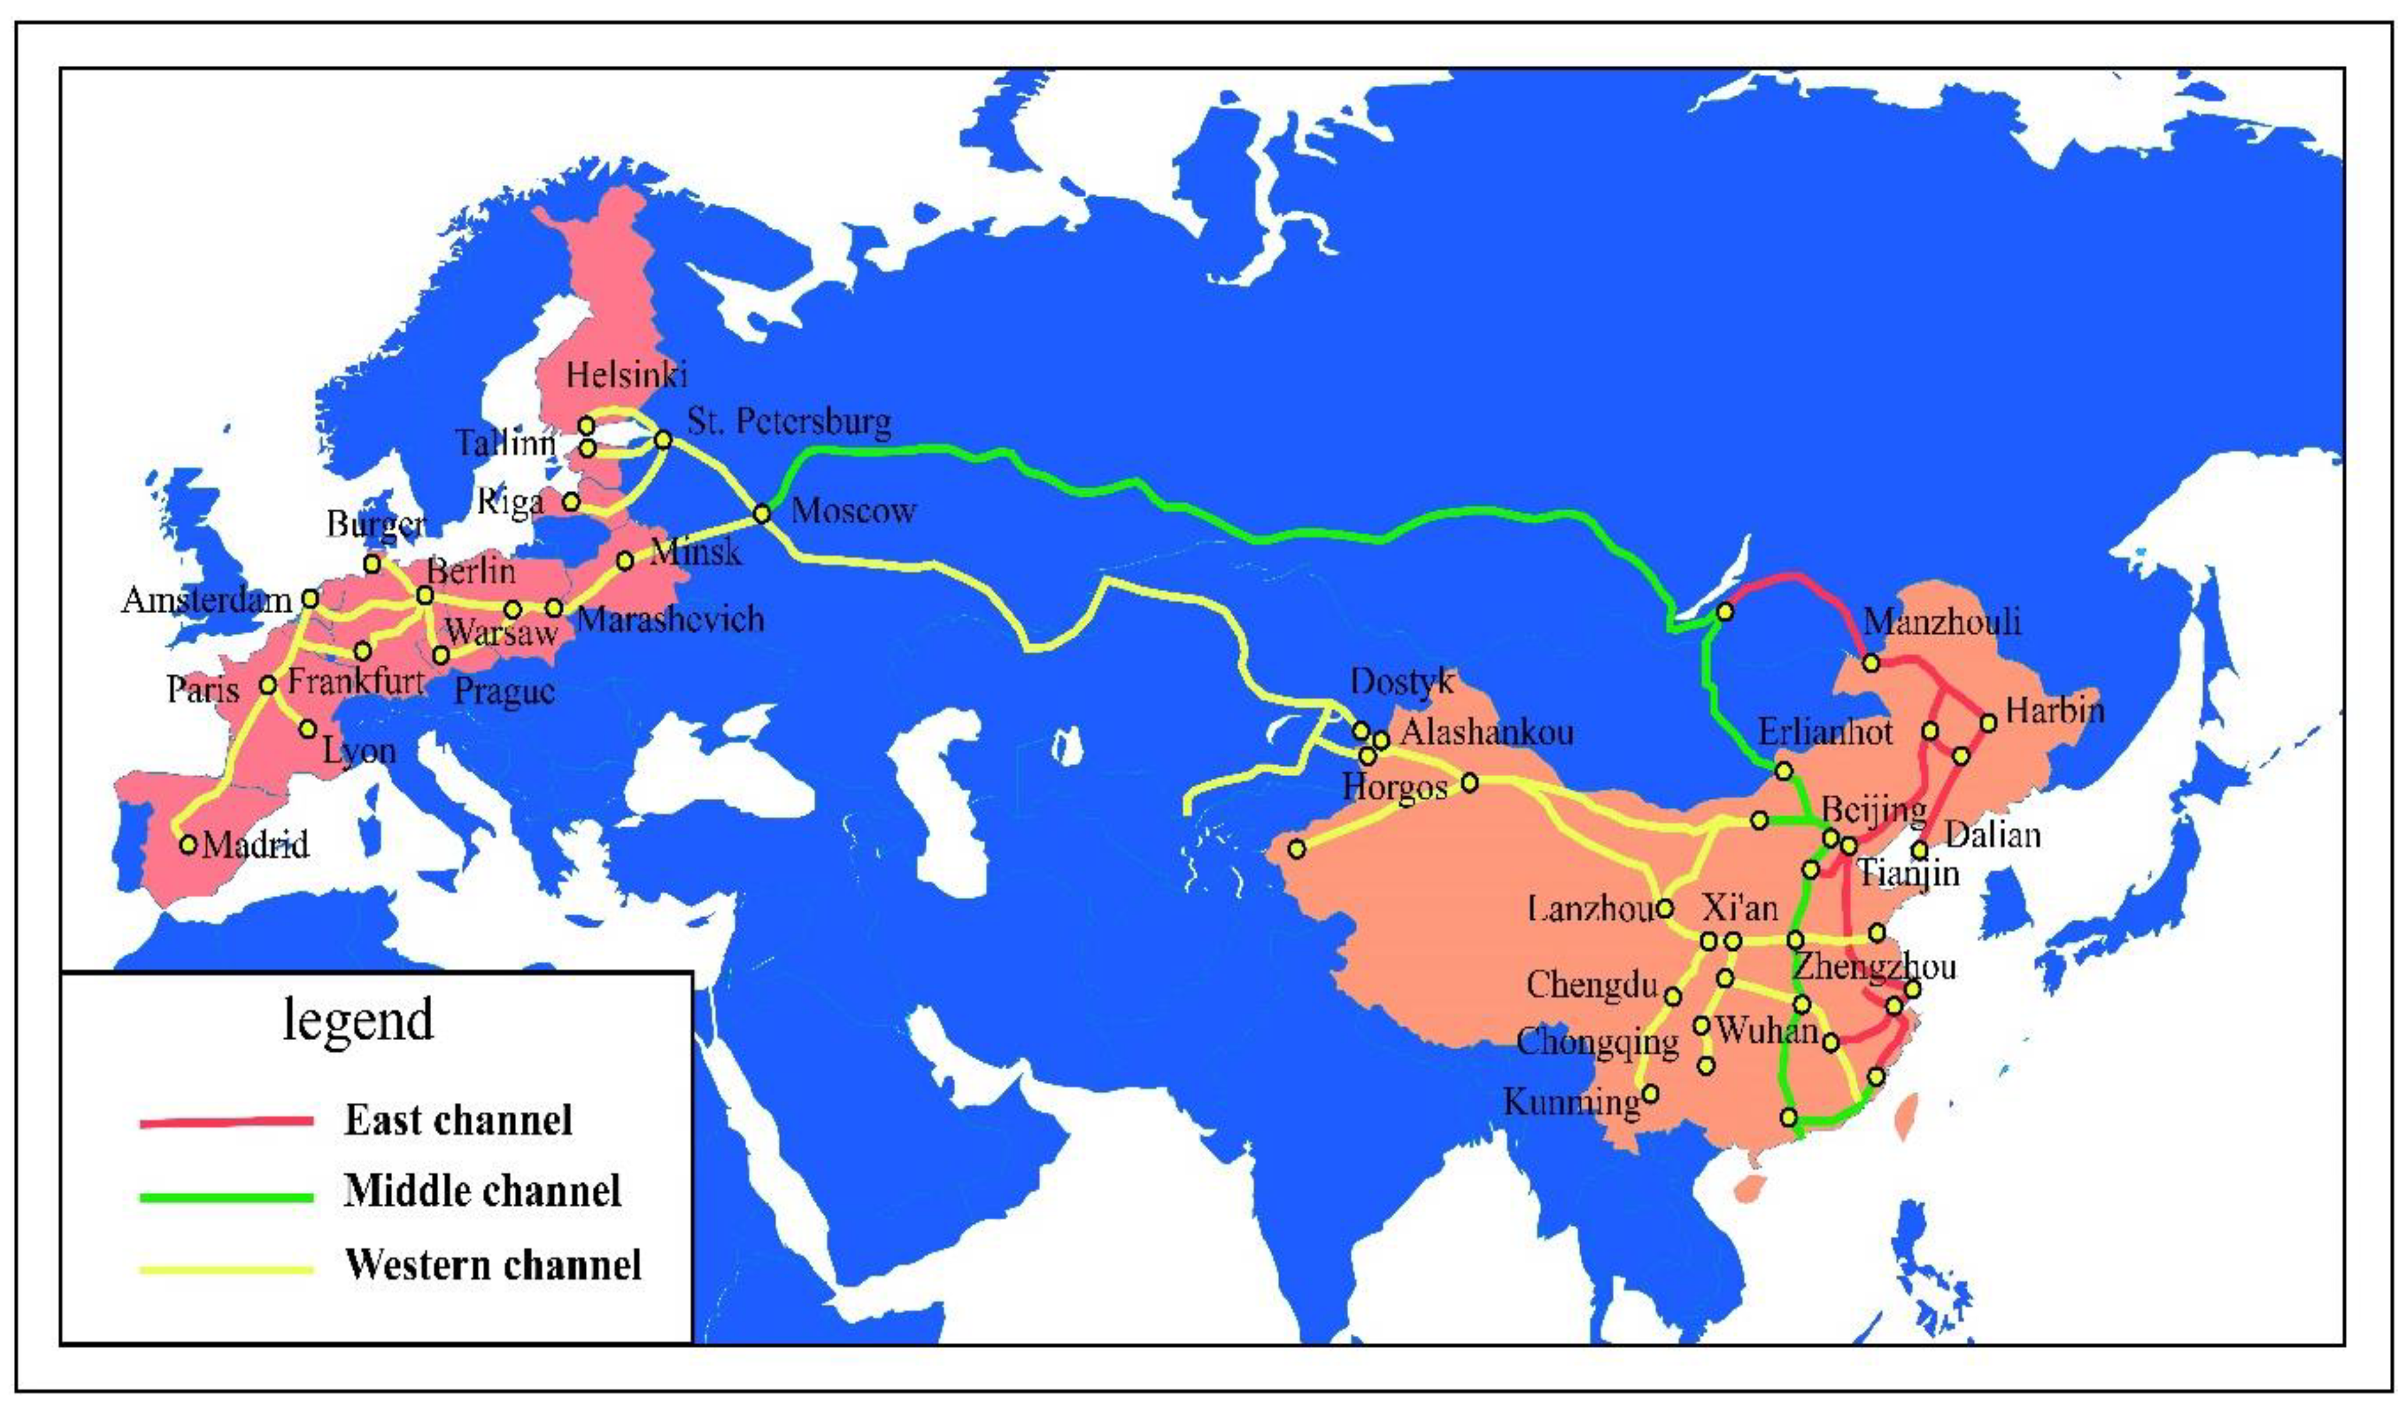
For a long time, China–Europe trade mainly relied on shipping. With the Belt and Road Initiative strategy proposed by China, the Silk Road Economic Belt and the 21st Century Maritime Silk Road have been established, which have promoted exchanges and cooperation between China and Europe and countries along the route. As an important part of the Belt and Road Initiative macro-strategy, the China Railway Express trains are operated in accordance with the conditions of fixed trains, routes, schedules, and full-time operation times, and are transported to and from China and Europe. From the first train from Chongqing to Duisburg in Germany in March 2011 to the last train at the end of 2018, 12,937 railway container trains have already finished their journey. At present, China has established three major passages of east, middle, and west through Manzhouli, Erlianhot, Alataw Pass, and Horgos. There are 48 domestically operated cities, and 42 reached cities in 14 European countries. The operated lines are shown in Figure 1.
The successful opening of the China Railway Express has provided a third choice for China–Europe international trade, beside shipping and air transport. It has also brought a strong demand for cargo transportation for Asia-Europe economic and trade growth. Compared to traditional shipping, the average railway transportation distance between China and Europe is less than 9000 km. It has the advantages of fast transportation speed, short time (only one-third of shipping), no weather influence, a high safety factor, and green environmental protection. Compared to air transport, China Railway Express has obvious economic advantages (the freight rate is only one-fifth of air transport). With the Belt and Road Initiative strategy, in recent years, China Railway Express has developed rapidly, and with its outstanding transportation advantages, it has gradually improved its competitiveness in China–Europe trade. However, there are still some problems with the China Railway Express, including the issue that the market competitiveness is low, the overall freight volume is small, the demand for cargo transportation is lower, the originating container center stations are scattered, and the whole transportation cost is higher. At present, China Railway Express very much relies on a great deal of subsides from the Chinese government. However, with the reduction of those subsides, the market share of China Railway Express will be affected, which will have a negative impact on the sustainable development of China Railway Express.
Therefore, in order to promote the sustainable development of China Railway Express and further enhance the market competitiveness of China Railway Express, this paper analyzes the detailed transportation process of China Railway Express and China–Europe Shipping, and builds a China Railway Express competitiveness model based on generalized costs. Additionally, through an analysis of the influencing factors, it puts forward relevant suggestions to enhance the market competitiveness of China Railway Express from various aspects and specific optimization measures for the sustainable development of China Railway Express.
This paper mainly studies the competitiveness comparison of China Railway Express and China–Europe Shipping. The paper considers the six influencing factors of economy, timeliness, reliability, convenience, safety, and environmental protection, uses multiple Logit models to solve the sharing ratio, conducts the sensitivity analysis and elasticity analysis on different influencing factors to understand the impact of various factors on competitiveness, and then proposes countermeasures that are conducive to promoting the sustainable development of China Railway Express. The research content of other parts of this paper is as follows. The second part is a literature review of the sustainable development of China Railway Express and the competitiveness model based on multiple Logit models. The third part builds a utility function based on a generalized cost considering different influencing factors and establishes a transportation market share rate multiple logit model to describe the competitiveness of both. The fourth part analyzes the example of China Railway Express, and organizes the entire process of China Railway Express and China–Europe Shipping, and in this part, the maximum likelihood estimation method is used to calibrate the model parameters to solve the transportation market share of China Railway Express and China–Europe Shipping. The fifth part conducts a sensitivity analysis and elasticity analysis of different influencing factors. The last part puts forward relevant countermeasures and suggestions for the sustainable development of China Railway Express.

2. Literature Review

Domestic and foreign scholars have conducted relevant research on the sustainable development of China Railway Express. Qin [1] used the value analysis theory of goods to determine the potential supply of China Railway Express from the perspective of the goods category. Li [2] proposed the optimization strategy of China Railway Express from the aspects of optimizing node construction, strengthening the facilities and equipment of the station, improving service quality, and enriching transportation products. Besharati [3] analyzed the reasons for the rapid development of China Railway Express transportation and detailed the subsidy policy provided by the Chinese provincial government to China Railway Express. Li [4] used the product life cycle theory to divide the life cycle of China’s railway express transportation and analyzed its stage characteristics and planning objectives. Huang [5] and Sun [6] conducted a Strengths Weaknesses Opportunities Threats (SWOT) analysis of the lines in Zhengzhou and Xiamen on the China Railway Express. Wang [7] analyzed the economic adaptation area of international container land transportation from transportation cost and transportation time and proposed a comparative advantage area of China railway express transportation. The above scholars have presented qualitative analyses of the sustainable development of China Railway Express from the perspective of its own development.
Kostrzewski [8] introduced the case of a transport system in trade and manufacturing across Eurasia, and evaluated the transport system from the aspects of efficiencies and priorities for sustainable development. They chose certain technical and economic indicators for the research, such as transport duration, transport cost per shipping unit, transport cost per distance units, average commercial speed, etc. This research was based on sustainable development, especially sustainable transportation. Fu [9] constructed a value model from the aspects of location conditions, transportation costs, transportation time, and service level, and used the seven China Railway Express Lines as an example to calculate the value cost and screen out the optimal line arrangement. Zhao [10], based on the government policy orientation and the status quo of China Railway Express operation, used complex network theory to evaluate 27 pre-candidate cities, and then used mixed integer programming to identify 10 cities as the optimal consolidation with the Technique for Order Preference by Similarity to an Ideal Solution (TOPSIS) model and cargo rates to evaluate the networks. Wen [11] started from the idea of collecting and transporting and established the optimization model of the International Transportation Network in China–Europe based on the location selection of the minimum cost. Based on the principle of discrete particle swarm optimization, Wen optimized the Chinese railway express transportation network. Wu [12] proposed that the core problem of the sustainable development of China Railway Express is the lack of capacity, and then used a simple planning method and the axis-one-wave network planning method to optimize the Chinese railway express transportation network. By combining statistical analysis with a time value model and combining the breakpoint model with Geographic Information System (GIS), the appropriate cargo, a suitable transportation area, and a corresponding comparative advantage boundary of China Railway Express were determined. The above scholars have conducted quantitative analyses from the perspectives of China Railway Express node construction, line comparison, and network optimization.
Chen X. [13] compared the current development history and current situation of the four channels between China and Europe of the Maritime Silk Road, the China Railway Express, railway and ship combined transportation via Gwadar Port, and the Ice Silk Road, and analyzed the advantages and disadvantages of the transportation method, route, time, safety, product type and development trend, and potentiality. Sun [14] analyzed the specific impact of China Railway Express development on port water transport and proposed that the overall scale of China Railway Express is small, and the impact on coastal port traffic is small, which has great market potential and development space. Wang [15] proposed that China Railway Express would only be profitable when used to transport suitable goods (such as high value-added products) or in appropriate regional environments (such as inland areas far from the seaport), and China Railway Express would only ever serve to supplement ocean shipping and can never replace it. Jiang [16] compared the selection probability of China Railway Express and shipping according to the binary logit model. The results showed that the government’s subsidies to China Railway Express operators would help to reduce the freight rate of the Central European trains by 60%. Compared with other products, shippers of IT products were more likely to choose China Railway Express. The above scholars analyzed the sustainable development of China Railway Express from the perspective of external competition.
The sustainable development of railway transportation involves many aspects of research, such as the sustainable condition monitoring system. Kostrzewski and Chudzikiewicz [17] first presented a detailed discussion on the definition of sustainable development, and put forward that the least harmful mode of transportation to the natural environment is railway transportation. Then, an example of this type of execution, the Rail Vehicle’s and Rail Track Monitoring System, was considered in the paper. Chudzikiewicz [18] demonstrated the possibilities of estimating the track condition using axle-boxes and car-body motions described by acceleration signals.
China Railway Express operates as an international transportation product that competes with shipping. The most direct manifestation of its competitiveness is its market share or its probability of being selected by the consignor. The most common and effective model for describing the selection of China Railway Express in different modes of transport is the Discrete Choice Model. The discrete selection model is derived from the "utility maximization theory" [19], and it is widely used in transportation mode selection, career selection, and residents’ shopping selection. The study of discrete selection models has been seen since the 19th century. With the complication of research questions and the refinement of model settings, a series of models have been produced: the Binary Logit Model, Multinomial Logit Model (MNL), Conditional Logit Model (CL), Nested Logit Model (NL), Mixed Logit Model (MXL), Generalized Mixed Logit Model (GMXL), Ranked-ordered Logit (RL), Latent Class Model (LC), and others.
In the research of passenger competitiveness based on the Logit model, Wang [20] designed a two-stage passenger flow sharing rate calculation method based on supply and demand matching, and built a logit model to calculate the passenger flow sharing rate, correcting it according to the supply situation. Zhou [21] established an intercity passenger transportation mode selection behavior model based on the multinomial Logit model, and studied the important factors affecting passengers’ choice of Combined Bus and Airline Mode, conducting a sensitivity analysis of influencing factors. Chen [22] established a multi-logit selection behavior model based on passenger psychology perception with the travel time and transfer time as the generalized cost, and applied the model solving algorithm to the analysis of Chongqing rail transit. Liu [23] organized traveler information data, including the socio-economic and personal information, travel characteristics, and mode selection of travelers in short-distance, medium-distance, and long-distance travel distance scenarios. A nested logit model was established, and time estimation and sensitivity analyses were performed for each influencing factor. Zhou [24] explored the factors that influence the choice of college students’ travel modes and applied advanced statistical models (multinomial Logit model and nested logit models) to analyze the data. Czwajda [25] identified the relevant problem areas of demand forecasting for disassembly enterprises based on previously conducted research and observations. The desk-research method was used to verify current knowledge on the forecasting methodology. Wang [26] constructed a bilevel programming model considering carbon emissions in order to optimize the operation scheme of water transportation. At the upper level, the model established a multi-objective model that considered carbon emissions and the interests of both the supply and demand. At the lower layer, the model built a nested Logit model, which was then solved by the non-dominated sorting genetic algorithm-II (NSGA-II) algorithm. Han [27] used safety, comfort, convenience, flexibility, and economy to reflect passengers’ satisfaction with public transport service levels, discussed satisfaction and potential variables based on the Structural Equation Modeling (SEM)-Logit model, and finally verified the feasibility of the model, taking Jinan City as an example.
In the research of freight competitiveness based on the Logit model. Larranaga [28] determined the parameters of multiple Logit models by the Stated Preference (SP) method, and analyzed the competition relationship between road, intermodal considering rail, and intermodal considering inland waterway transport in Rio Grande do Sul, Brazil. It was concluded that the most important influencing factors were transportation reliability, and secondly, transportation cost. Arunotayanun [29] constructed multinomial Logit models and mixed Logit models, including transportation time, transportation cost, service quality, and service flexibility, and found that the factors affecting the shipper’s choice of transportation mode were related to their own characteristics and environment. Nader M. [30] introduced a comparison and evaluation of two intermodal transport technologies. The author presented general characteristics of chosen intermodal freight transport technologies in the form of a brief description of both intermodal technologies. Zhang [31] established the Multinomial Logit Model and Mixed Multinomial Logit Model by selecting punctuality, total transportation chain time, total transportation chain cost, and safety as utility function variables. The results showed that both time and cost played a key role in the transportation mode selection process, and the share rate of railway was higher. Tang [19] built a competitiveness model of Rail–Road Intermodal Transport according to random utility theory based on truck-only transport and Rail–Road Intermodal Transport’s generalized cost function, and analyzed the impact of eight influencing factors on Rail–Road Intermodal Transport’s competitiveness, including the truck-only transport basic rate, road drayage rate, etc. Bergantino [32] introduced the perceived importance index as a characteristic variable of the utility function to study the shipper’s preference heterogeneity, and based on the Revealed Preference/Stated Preference (RP/SP) survey data to calibrate the mixed Logit model. The results showed that the calibrated hybrid Logit model was more convincing after considering the different perceived importance of different shippers for transportation time, punctuality, and cargo damage. Feo [33] selected four factors, including transportation time, transportation cost, reliability, and frequency as characteristic variables, and constructed a binary Logit model to study freight transport choice between road haulage and short sea shipping. Manchala [34] used a nested Logit-based bi-level programming model to study the transport options for export goods in the Indian outback. The research conclusions showed that transportation time and cost were important factors in the choice of influencing mode. Samimia [35] used shipment-specific variables (e.g., distance, weight, and value) and mode-specific variables (e.g., haul time and cost) as characteristic variables of the utility function when studying the competitive relationship between road transport and rail transport in the United States. The binary Logit model and the binary probit model were respectively calibrated using the network survey data, and the impacts of different factors on the choice of transportation methods were analyzed. The study concluded that transportation time and transportation costs were the most important factors. Wang [36] constructed a nested Logit model only considering transportation price and time, and combined with fixed point equations, analyzed the transportation route selection of multimodal transport operators. Nugroho [37] identified the critical factors influencing the port and inland mode choice from the perspective of shippers and forwarders, and used four models (Multinomial Logit, Nested Logit, Mixed Multinomial Logit, and Mixed Nested Logit models) to conduct the parameters estimation.
The review found that domestic and foreign scholars’ research on the sustainable development of China Railway Express has mostly focused on the relevant countermeasures and suggestions after analyzing the status quo and the problems. Some scholars have used mathematical models to conduct research [38,39,40,41,42]. However, it has also focused on research on the development of China Railway Express itself, such as comparing the competitiveness of its different lines and analyzing the radiation areas of China and Europe. Less research on the sustainable development of China Railway Express from the perspective of the transportation market has been conducted [43,44,45,46]. Although some scholars have studied the impact of China–Europe Shipping on the sustainable development of China Railway Express, it is not clear what the specific impact factors are [47,48,49]. This paper sorts out the research on the competitiveness of domestic and foreign scholars using the Logit model in different scenarios, including the choice of passenger travel modes, the choice of cargo transportation modes, etc. By constructing different generalized cost function models in the study, the factors that influence the choice of transportation mode are analyzed. Based on this research system, the competitiveness of the sustainable development of China Railway Express is studied.

3. China Railway Express Competitiveness Model Construction Based on Generalized Cost

The economic, timeliness, reliability, convenience, safety, environmental protection, and other factors of different modes of transportation are the main factors that affect their competitiveness.
The generalized cost can approximate the “comprehensive cost” paid by the shipper to choose a certain mode of transportation and is closely related to the market share of various modes of transport within the transport corridor. The calculation of generalized expenses generally includes two algorithms of addition and multiplication. If the effects of each factor are independent of each other, the addition factors can be used to combine the influencing factors. If the influence of a factor can be applied to other factors, the multiplication rule can be used to solve it.
In this paper, the generalized cost function of China Railway Express and China–Europe Shipping consists of six parts: economy, timeliness, reliability, convenience, safety, and environmental protection, among which economy, timeliness, reliability, convenience, and environmental protection are independent of each other and each has a certain impact on the competitiveness of the transportation mode, while safety has a certain impact on other factors. Therefore, this paper constructs a generalized cost function using additive multiplication to solve it.

3.1. Utility Function Building Based on Generalized Cost

In order to compare the competitiveness of China Railway Express and China–Europe Shipping, the concept of the share ratio is introduced here. The Logit model is used to solve the transportation market share ratio. As a quantitative indicator of competitiveness, a utility function based on generalized cost is established.
V i = ( θ 1 C i + θ 2 T i + θ 3 R i + θ 4 F i + θ 5 E i ) / S i i = 1 , 2
In Equation (1), V i represents the fixed utility value of the i-th transport mode; C i , T i , R i , F i , S i , and E i represent the utility values of the economy, timeliness, reliability, convenience, safety, and environmental protection of the i-th transportation mode, respectively; and θ 1 , θ 2 , θ 3 , θ 4 , and θ 5 represent economic-, timeliness-, reliability-, convenience-, and environmental protection-related parameters, respectively.
For the value of economic C i , the main cost incurred by the transportation of goods is mainly considered, including road transportation fees, China Railway Express or China–Europe Shipping transportation fees, export service fees, and handling fees. C i j represents the cost of the j-th type of operation of the i-th transport mode.
C i = j C i j
For the value of timeliness T i , the total time required for the whole process of cargo transportation is mainly considered, including sending operation time, transportation operation time, transfer operation time, and arrival operation time. T i j represents the operation time of the j-th stage of the i-th transport mode.
T i = j T i j
For the value of the reliability R i , the difference between the expected transportation time and the actual transportation time is mainly considered. In the case of cargo transportation, if there is an early arrival, it may cause additional inventory costs to the shipper. Conversely, i there is a delay in arrival, it may cause the shipper to miss the schedule and stock out, affecting the sales plan. Therefore, the absolute value of the difference between the expected transit time T e i and the actual transit time T i is expressed as the reliability R i .
R i = | T e i T i |
For the value of the convenience F i , the operating frequency of different modes of transportation in the statistical period is mainly considered.
For the value of safety S i , the transportation efficiency of goods with different modes of transportation is mainly considered. In the process of cargo transportation, due to the difference between the carrying tools and the operating procedures, there are certain differences in the cargo damage rate D i generated during the loading and unloading and transportation of different transport modes.
S i = 1 D i
For the value of environmental protection E i , the carbon emissions generated by different modes of transportation during the whole process of transportation are mainly considered. Carbon emissions play a crucial role in the sustainable development of different modes of transportation. For the calculation of carbon emissions, this paper uses a standard container as the statistical unit to calculate the average carbon emissions of the whole process of transportation.
E i = Y i L i M
Here, Y i represents the carbon emissions per ton-kilometer of the i-th transport mode, L i indicates the transportation mileage of the i-th transportation mode, and M represents the average weight of a standard container.

3.2. Transportation Market Share Rate Model Building

This paper constructs a discrete selection model using random utility theory and determines the transportation market share rate of China Railway Express. The basic principle of stochastic utility theory is that when decision makers face multiple choices, the option with the most utility is always chosen. In the choice of mode of transportation of goods between China and Europe, the shipper also has a perceptual utility for each mode of transportation. According to the theory of random utility maximization, if, and only if, Equation (7) is true, the m-th selector will choose the i-th option.
U i m > U k m i , k n i k
In Equation (7), i and k are alternatives, and n is an alternative set, where U i m and U k m represent the utility of the selected i and k schemes, respectively. The utility of the selection scheme is a random variable that consists of a fixed utility term V i m and a random utility term error ε i m . The fixed term is the opposite of the generalized cost function, and the random utility error is used to describe the effect of unobservable factors on the utility of the program. Its random utility can be expressed as
U i m = V i m + ε i m
It is assumed that the random terms ε i m in the utility function are independent of each other and obey the same Gumbel distribution. According to the general form of the Logit model, the sharing rate of the i-th transport mode selected is
P i = exp ( U i ) i = 1 n exp ( U i )
P i indicates the probability that the i-th transport mode is selected, which needs to satisfy
{ 0 P i 1 i = 1 n P i = 1

3.3. Model Solving Method

The maximum likelihood method is a method for solving unknown parameter estimates in the overall distribution. The method was first proposed by C.F. Gauss of Germany in 1821. It was re-proposed and developed by British statistician R.A. Fisher in 1922. The method is based on the principle of maximum likelihood, as follows. Let a random experiment have a number of possible outcomes, A 1 , …, A k , …. If A 1 appears in an experiment, it is considered that the experimental conditions are the most beneficial to A 1 . That is, A 1 has the highest probability of occurrence.
For calibration of the parameter, θ a ( a = 1 , 2 , , l ) in the transportation market share rate model. In this paper, the maximum likelihood method is used to solve the problem.
When the shipper chooses the mode of transportation, each choice can be seen as independent of each other. Therefore, X-time selection can be regarded as the X-time Bernoulli test. The overall X is the discrete random variable. Its distribution rate is P { X = x } = p ( x ; θ 1 , θ 2 , , θ l ) ; θ 1 , θ 2 , , θ l are m unknown parameters to be estimated; X 1 , X 2 , , X n are samples from the population X, which indicate that the number of times the i-th transportation mode is selected in the X-time choices is X 1 , X 2 , , X n , respectively. After conducting an experiment to obtain the observed values x 1 , x 2 , , x n of the sample, the probability that ( X 1 , X 2 , , X n ) falls within the neighborhood of ( x 1 , x 2 , , x n ) is i = 1 n p ( x ; θ 1 , θ 2 , , θ l ) . For fixed observations x 1 , x 2 , , x n , this probability is a function of θ 1 , θ 2 , , θ l . According to the principle of maximum likelihood, θ 1 , θ 2 , , θ l should be chosen to make this probability reach the maximum value. This means that the function
L ( θ 1 , θ 2 , , θ l ) = Λ = i = 1 n p ( x ; θ 1 , θ 2 , , θ l )
reaches the maximum. The functions L ( θ 1 , θ 2 , , θ l ) in Equation (11) are called likelihood functions. In this article, they are indicated by Λ . The values θ 1 , θ 2 , , θ l that make the likelihood function reach the maximum value are the estimated values of the parameters. Recorded as θ 1 ^ ( x 1 , x 2 , , x n ) , , θ l ^ ( x 1 , x 2 , , x n ) , they are called maximum likelihood estimate values of θ 1 , θ 2 , , θ l , and θ 1 ^ ( X 1 , X 2 , , X n ) , , θ l ^ ( X 1 , X 2 , , X n ) are the maximum likelihood estimators of θ 1 , θ 2 , , θ l .
Expanding the joint probability of selecting the i-th transport mode in the X-time choices X 1 , X 2 , , X n can provide Equation (12).
Λ = P ( X 1 , X 2 , , X n | θ 1 , θ 2 , , θ l ) = X ! X 1 ! X 2 ! X n ! i = 1 n P i X i = X ! X 1 ! X 2 ! X n ! i = 1 n exp ( a = 1 l θ i a A i a ) i = 1 n exp ( a = 1 l θ i a A i a ) X i
In Equation (12), X i represents the number of times the i-th transportation mode is selected in the X-time choices, P i represents the probability of selecting the i-th transportation mode, and A i a represents the a-th influencing factor of the i-th transportation mode.
After solving the logarithm of the two sides and reducing the constant term, Equation (13) can be obtained.
ln Λ = i = 1 n X i ln ( P i )
As the likelihood function Λ can differentiate θ a ( a = 1 , , l ) , we use the general method of calculus to find the extreme value of the function to solve the system of equations.
As the likelihood function Λ can differentiate θ a ( a = 1 , , l ) , we use calculus to find the general method of function extremum, so θ 1 ^ , θ 2 ^ , , θ l ^ can be obtained by solving Equation (14).
Λ θ a = 0 , ( a = 1 , , l )
Equation (14) is called a likelihood equation system.
As lnx is a monotonic function of x, the θ 1 ^ , θ 2 ^ , , θ l ^ of ln ( θ 1 ^ , θ 2 ^ , , θ l ^ ) = max θ 1 ^ , θ 2 ^ , , θ l ^ ln Λ also makes L ( θ 1 ^ , θ 2 ^ , , θ l ^ ) = max θ 1 ^ , θ 2 ^ , , θ l ^ Λ valid. For the convenience of calculation, θ 1 ^ , θ 2 ^ , , θ l ^ can be obtained by solving Equation (15).
ln Λ θ a = 0 , ( a = 1 , , l )
Equation (15) is called a log-likelihood equation system. Equation (15) is derived from the logarithm of Equation (14).
According to the basic principle of the maximum likelihood method, MATLAB is used to solve the maximum value of ln Λ . By determining the value of each parameter θ a , the sharing rate of different modes of transportation can be solved.

4. The Analysis of the Case of China Railway Express

This paper analyzes the competitiveness of China Railway Express and China–Europe Shipping, mainly for the domestic cargo export business from China to Europe.

4.1. Process Analysis

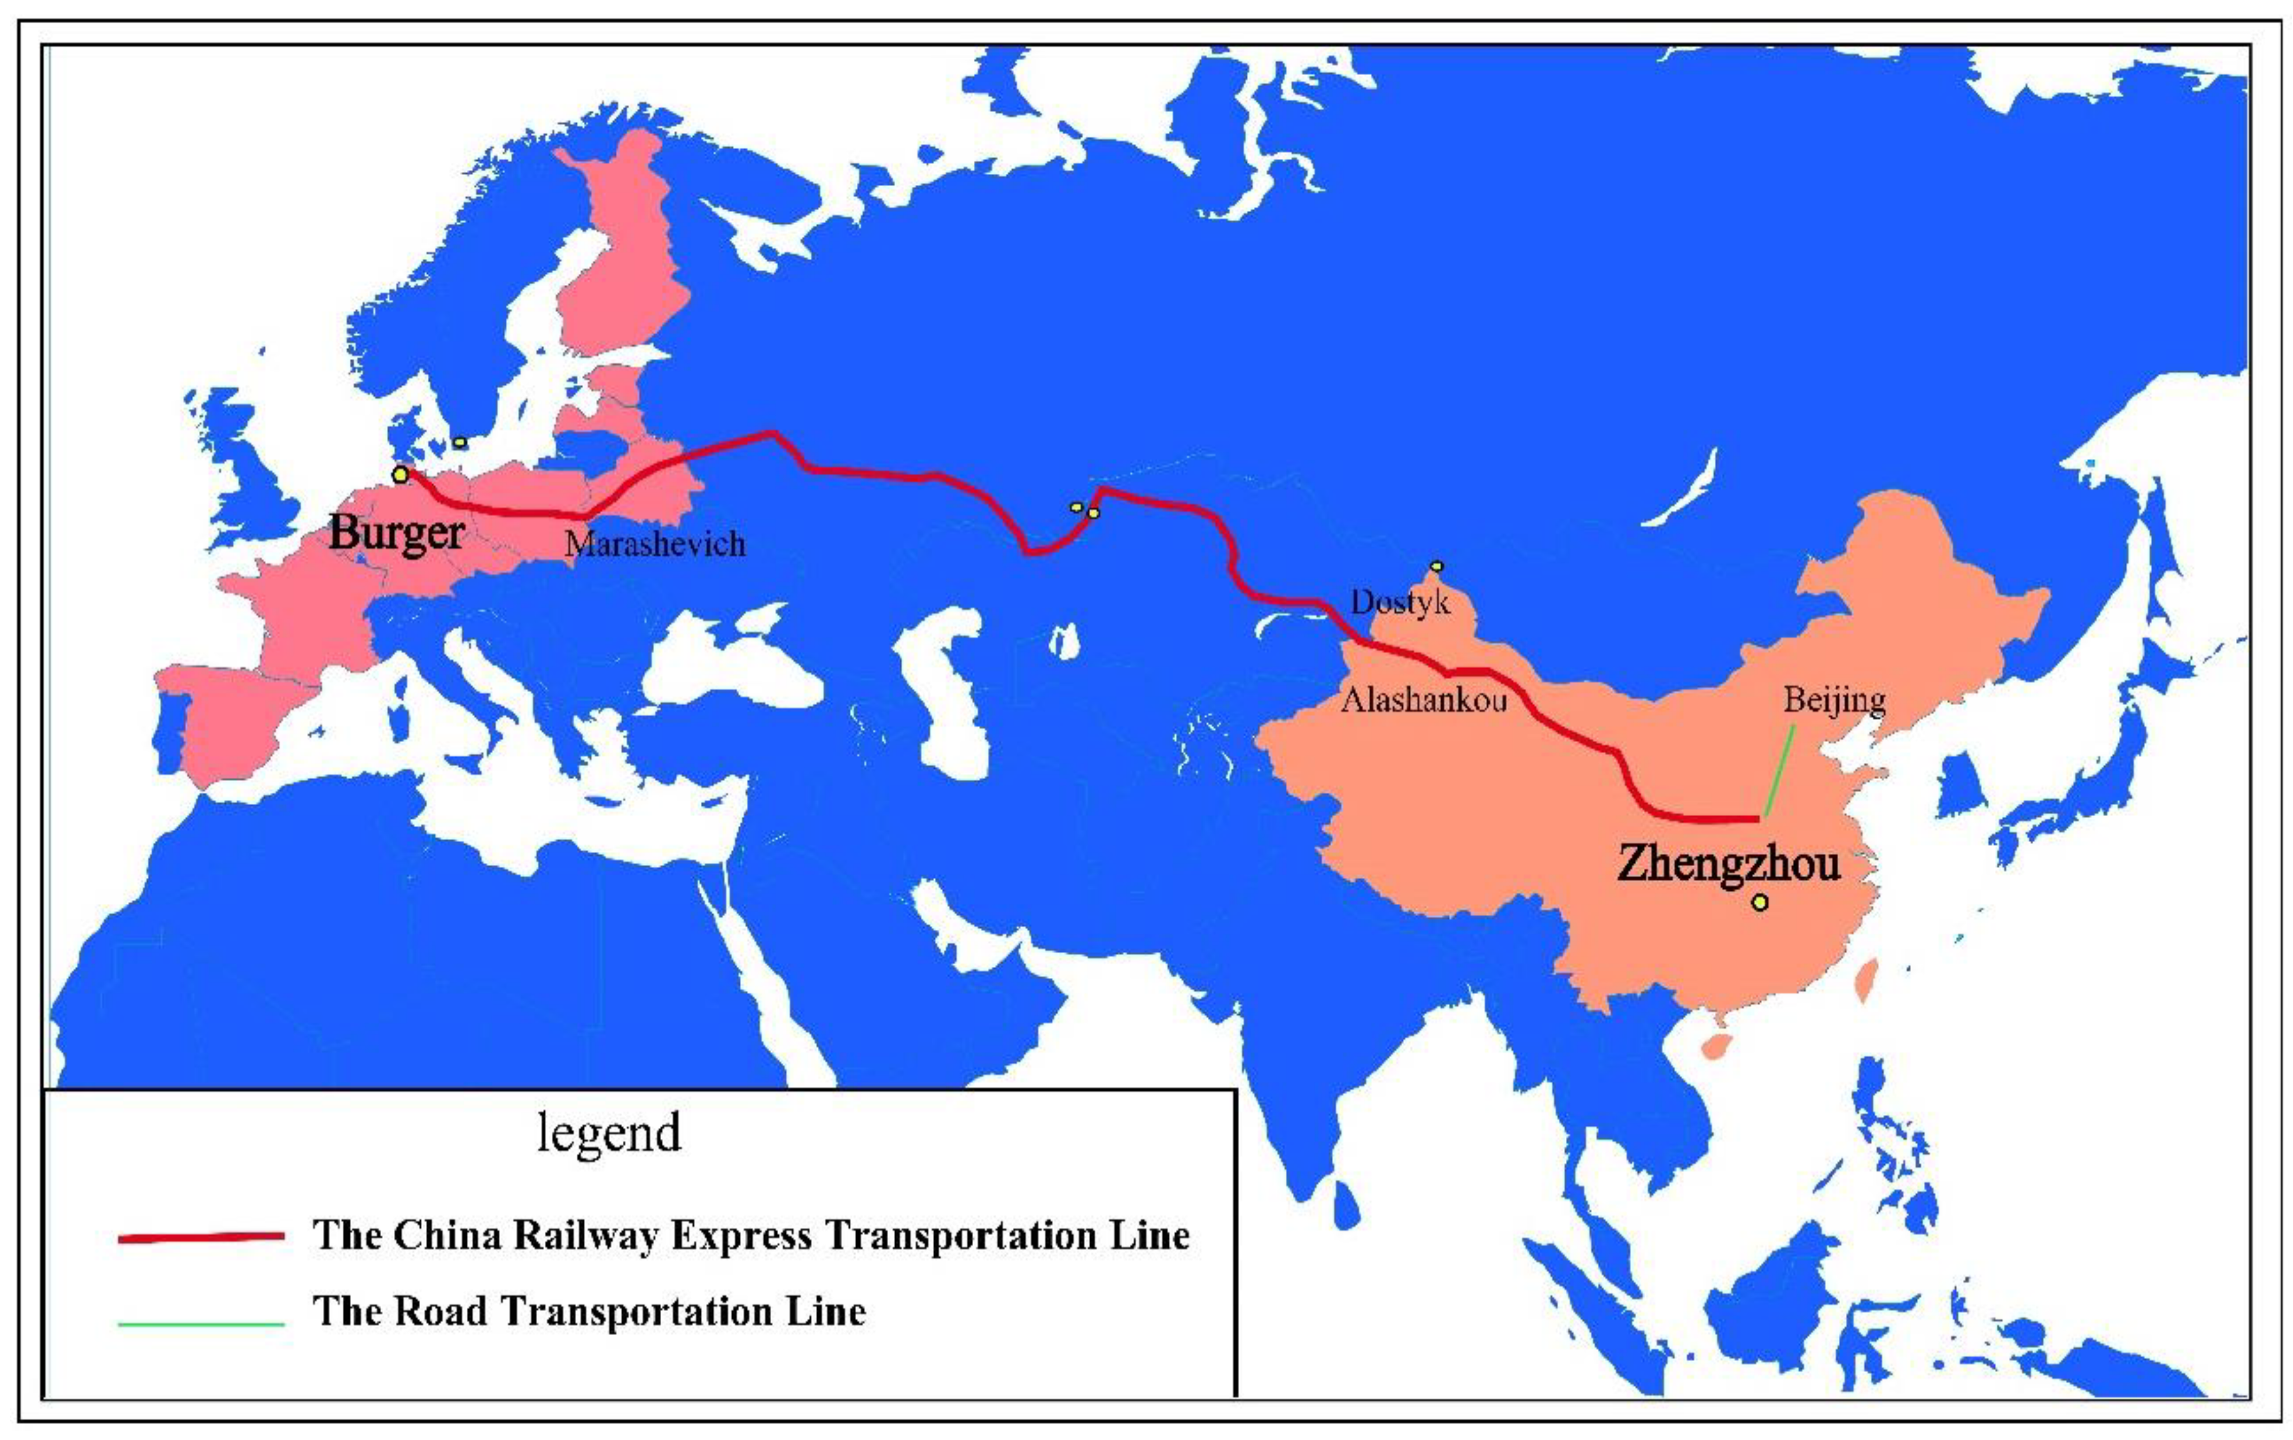
From the perspective of transportation, China Railway Express and China–Europe Shipping can be divided into three parts: sending operation, transportation operation, and arrival operation. The China Railway Express Transportation Line is shown in Figure 2.
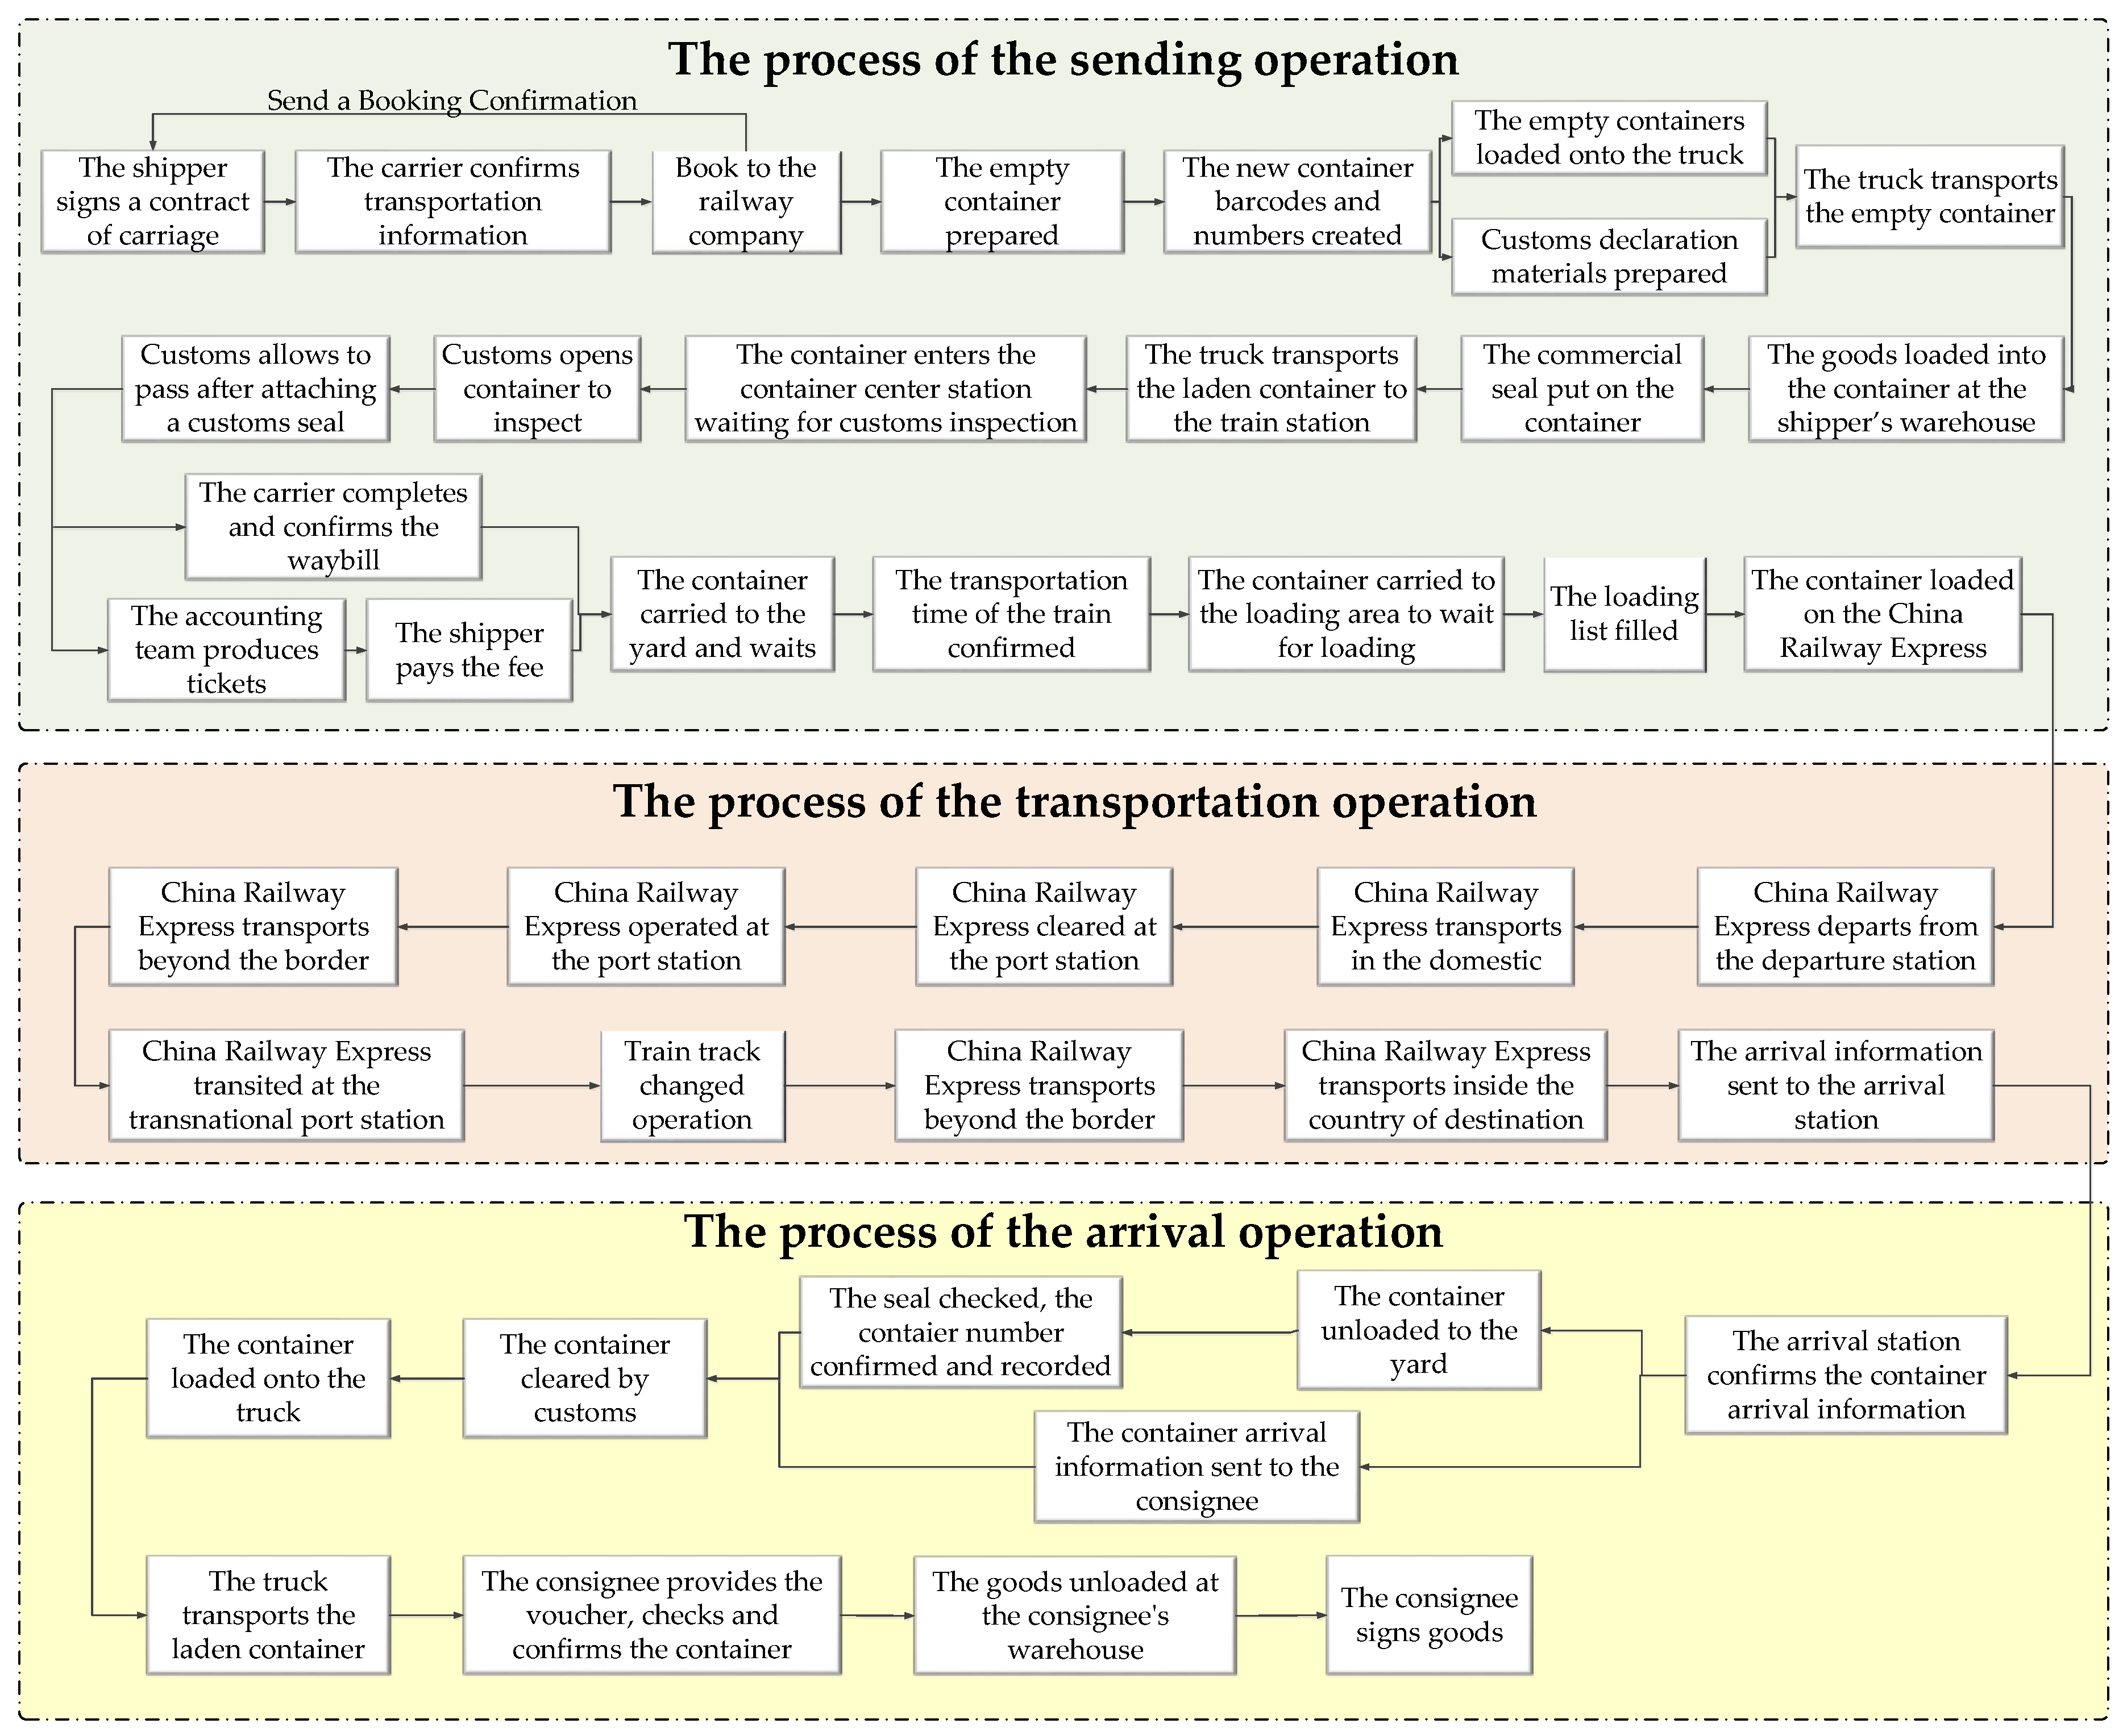
The whole process of China Railway Express is shown in Figure 3.
The sending operation mainly includes shipper booking, preparation of the empty container, the loading of goods into the container, road transportation, customs inspection, waiting for loading, the loading of the container onto the train, and other links.
The transportation operation mainly includes railway transportation in the domestic area, China Railway Express being cleared and operated at the port stations, railway transportation beyond the border, transfer operation, and other links.
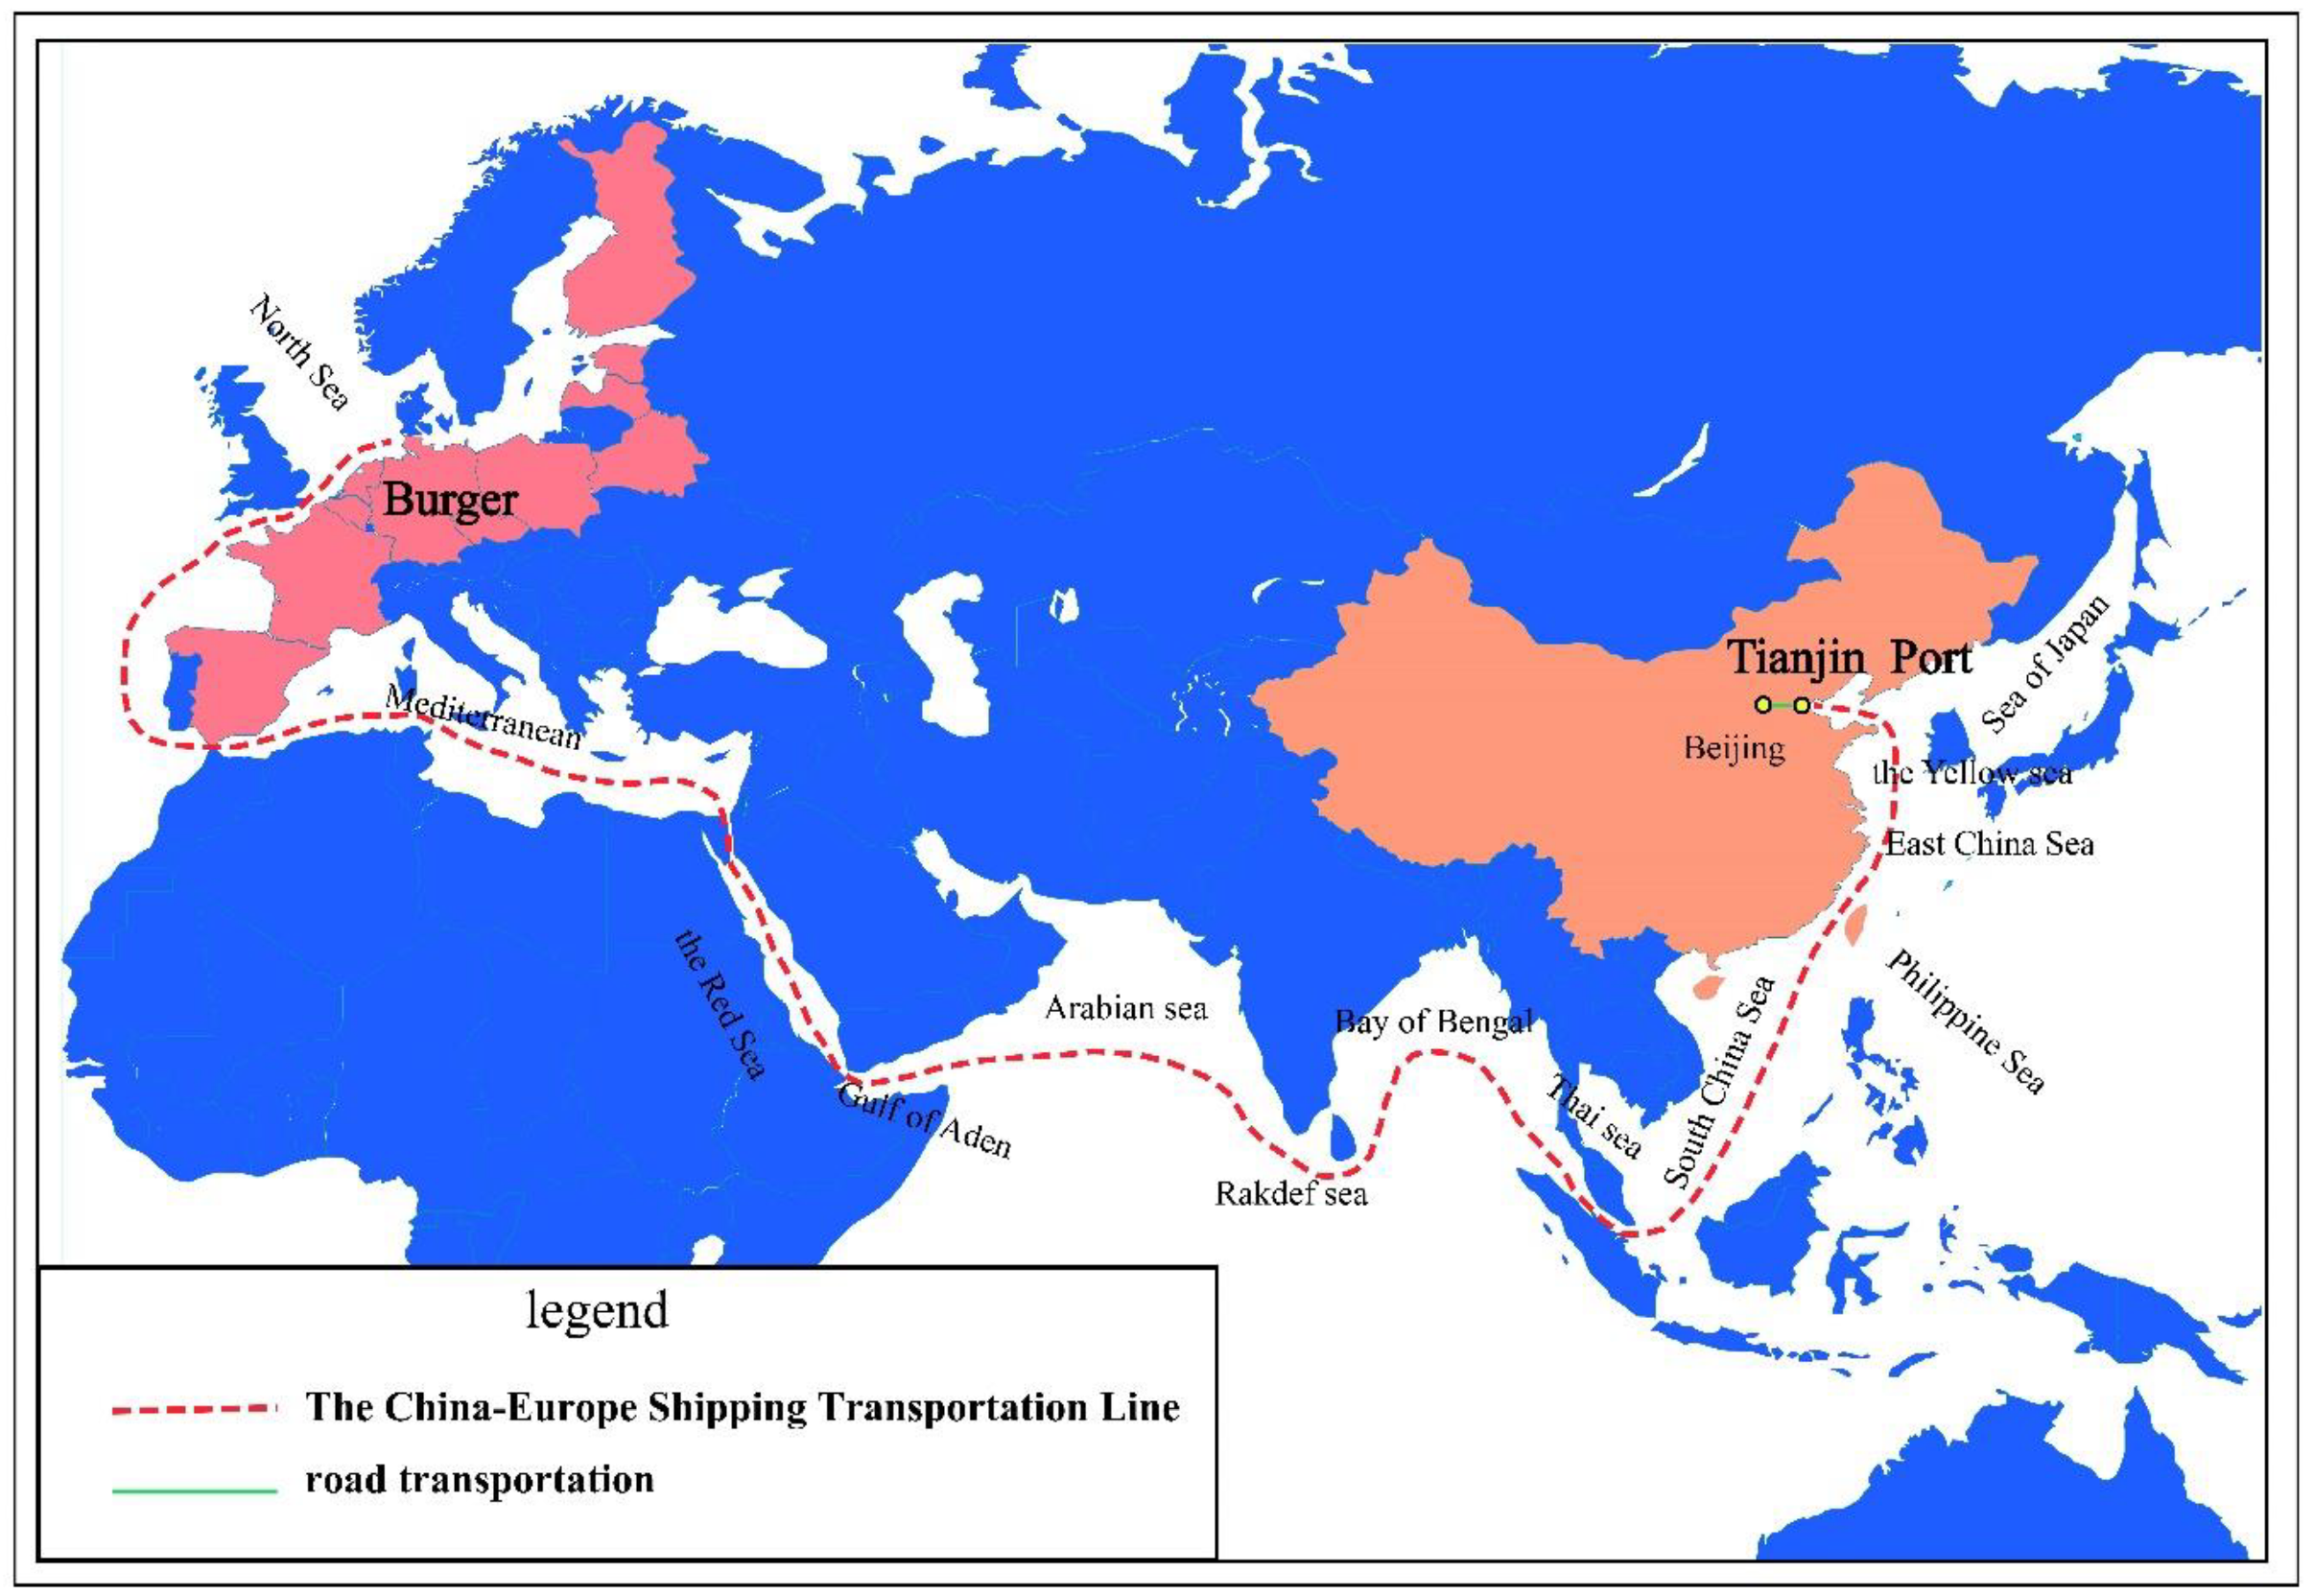
The arrival operation mainly includes the container being unloaded from the train, customs clears operation, road transportation, the goods being unloaded from the container, and other links. The China–Europe Shipping Transportation Line is shown in Figure 4.
The whole process of China–Europe Shipping is shown in Figure 5.
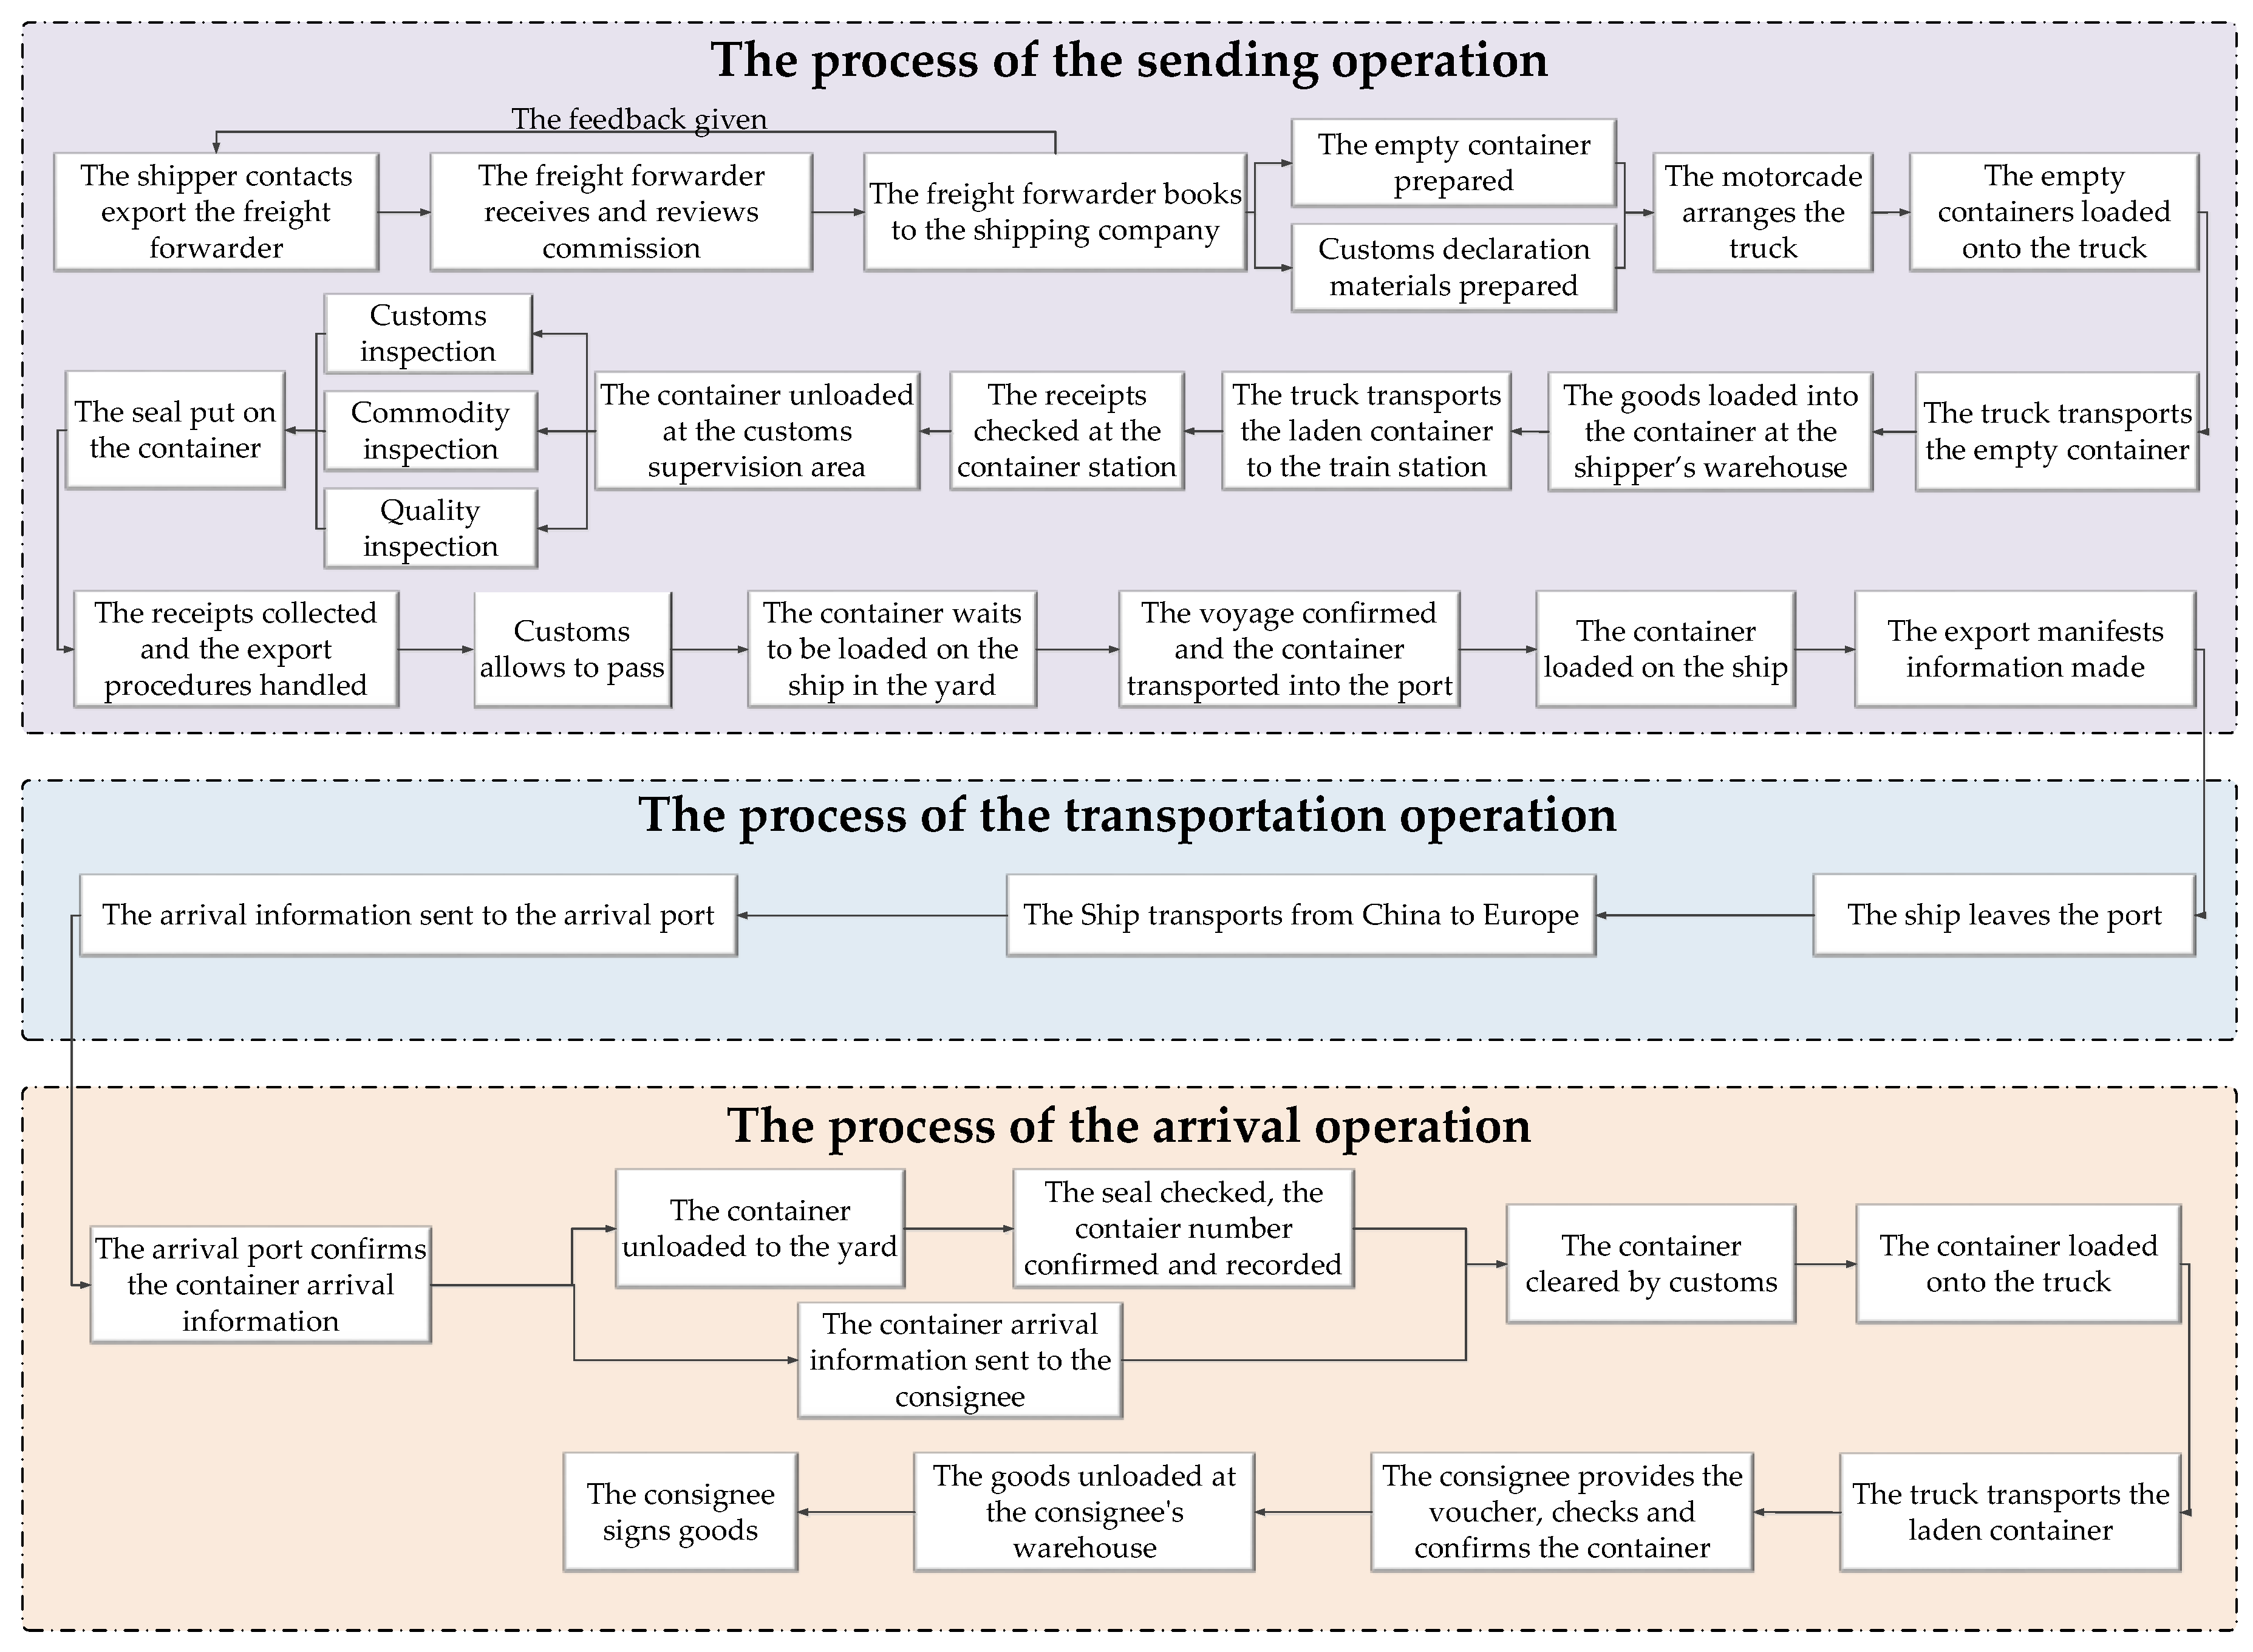
The sending operation mainly includes shipper booking, the empty container being prepared, the goods being loaded into the container, road transportation, waiting for the voyage, the container being loaded on the ship, and other links.
The transportation operation mainly includes the ship leaving the port, shipping to Europe, and other links.
The arrival operation mainly includes the container being unloaded from the ship, customs clears operation, road transportation, the goods being unloaded from the container, and other links.

4.2. Parameter Values of Influencing Factors

From the perspective of the whole process, China Railway Express is similar to China–Europe Shipping, and their main distinction is the transportation operation. When comparing the competitiveness of China Railway Express and China–Europe Shipping, this paper selects the Beijing-Tianjin-Hebei region as the major source area of the goods and Hamburg, Germany, as the destination. The main operations studied are from the goods loaded into the container at the shipper’s warehouse to the container arriving in Hamburg, Germany. The arrival operation in the country of destination is not researched in detail. This paper collects 5109 sets of the whole process of transportation data for export goods in a certain period of time. When the statistical calculation of different influencing factors is carried out, the goods of every 20 feet of a standard container are regarded as the selected unit and brought into the sharing rate model for parameter solving.
After organizing the sample data of 5109 sets transported from the Beijing-Tianjin-Hebei region to Hamburg, Germany, the following relevant data are calculated. In the 5109 sets of the China–Europe container transportation cases, 1642 containers were transported by China Railway Express, and another 3467 containers were transported by China–Europe Shipping.

4.2.1. Economic

The economic data of China Railway Express and China–Europe Shipping are composed of three main parts, including road transportation costs in the domestic area, services fees, and China Railway Express/China–Europe Shipping transportation fees. The specific parameters are shown in Table 1.

4.2.2. Timeliness

The timeliness data of China Railway Express and China–Europe Shipping are composed of three main parts, including the road short-distance transportation time, station or port sending time, and China Railway Express or China–Europe Shipping transportation time. The specific parameters are shown in Table 2.

4.2.3. Reliability

According to the statistical data of 5109 sets of container transportation from China to Europe, the absolute value of the difference between the expected transportation time T e 1 of China Railway Express and the actual transportation time T 1 is about 0.54 days, and the absolute value of the difference between the expected transportation time T e 2 of China–Europe Shipping and the actual transportation time T 2 is about 4.13 days.

4.2.4. Convenience

According to the information of the schedule of China Railway Express train operation in 2018, it is known that the number of trains transported from Zhengzhou to Hamburg is seven per week. The shipping schedule of China–Europe Shipping from Tianjin Port to Hamburg Port is about one per week.

4.2.5. Safety

For the data value of the cargo damage rate, the cargo damage rate of China Railway Express is 0.15% and the cargo damage rate of China–Europe Shipping is 0.4%.

4.2.6. Environmental protection

The environmental protection data of China Railway Express and China–Europe Shipping are mainly calculated by the carbon emissions generated in the transportation process. Among them, the environmental protection data of the China Railway Express includes the carbon emissions generated by China Railway Express railway transportation and the road transportation. The environmental protection data of China–Europe Shipping includes the carbon emissions generated by China–Europe Shipping transportation and the road transportation.
This paper refers to the method provided in the 2016 IPCC Guidelines for National Greenhouse Gas Inventories issued by the Intergovernmental Panel on Climate Change to calculate transportation carbon emissions, as follows:
Recommended emission coefficient = original emission coefficient × China’s calorific value × carbon oxidation factor
Unit transportation emission CO 2 = recommended emission coefficient × unit emission source activity intensity
The emission source activity intensity is the unit fuel usage.
Transportation carbon emission = unit transportation emissions CO 2 × transportation volume × transportation distance
The carbon emission parameters for different modes of transportation are shown in Table 3.
The Environmental protection parameter values are shown in Table 4.

4.3. Solving of Unknown Parameters

The values of the influencing factor parameters in Section 4.2 are brought into Equation (15). The maximum likelihood method is used to solve the values of the parameters θ 1 , θ 2 , θ 3 , θ 4 , and θ 5 .
{ ln Λ θ 1 = ( X 1 ln P 1 + X 2 ln P 2 ) θ 1 = 0 ln Λ θ 2 = ( X 1 ln P 1 + X 2 ln P 2 ) θ 2 = 0 ln Λ θ 3 = ( X 1 ln P 1 + X 2 ln P 2 ) θ 3 = 0 ln Λ θ 4 = ( X 1 ln P 1 + X 2 ln P 2 ) θ 4 = 0 ln Λ θ 5 = ( X 1 ln P 1 + X 2 ln P 2 ) θ 5 = 0
The calculation Equation (16) is solved by MATLAB and the five parameters obtained are θ 1 is −0.7599, θ 2 is −0.2315, θ 3 is −0.4381, θ 4 is 0.3985, and θ 5 is −0.1375.
The parameters are brought into the logit model for the solution, and the influencing factors’ utility values and the sharing rate results are shown in Table 5.

5. The Analysis on Influencing Factors of China Railway Express Transportation Market Share Rate

5.1. Sensitivity Analysis on Influencing Factors

In order to quantify the relationship between the various influencing factors and China Railway Express transportation market share rate, this part analyzes the sensitivity of some parameters in the generalized cost function of the China Railway Express transportation market share rate, including the China Railway Express freight rate, the Chinese road freight rate, the China Railway Express service fee, the China Railway Express travelling speed, the China Railway Express sending operation time at the departure station, the China Railway Express transportation time error, the China Railway Express transportation frequency, and the China Railway Express carbon emissions per unit etc. The market positioning and development strategy are analyzed with the change law of the China Railway Express transportation market share rate. The sensitivity of each influencing factor is analyzed for different combinations of trunk line transportation distances and road transportation distances. The road transportation distance varies between 250–450 km and its step length is 50 km, and the China Railway Express trunk line transportation distance varies between 7000–14,000 km and its step length is 1000 km.

5.1.1. The China Railway Express freight rate

The other parameters are fixed. The China Railway Express freight rate varies in the interval [2.516, 2.924] and its step length is 0.068. The unit is yuan/(TEU·km). For different combinations of trunk line transportation distances and road transportation distances, the share rate equation is used to analyze the impact of the change of the China Railway Express freight rate on the China Railway Express transportation market share rate. The results are shown in Figure 6.
It can be seen from Figure 6 that when the China Railway Express freight rate takes different values, at different road transportation distances, the China Railway Express transportation market share rate decreases with an increase in the trunk line transportation distance. Similarly, at different China Railway Express trunk line transportation distances, the China Railway Express transportation market share rate decreases with an increase in the road transportation distance. The sensitivity analyses of other influencing factors display a similar phenomenon.
Additionally, when the China Railway Express freight rate is decreased from 2.924 yuan/(TEU·km) to 2.516 yuan/(TEU·km), the proportion of the China Railway Express market share rate will be increased in the range of 13.6–68.8%.
Furthermore, when the trunk line transportation distance is 11,000 km and the China Railway Express freight rate is decreased from 2.924 yuan/(TEU·km) to 2.516 yuan/(TEU·km), the China Railway Express market share will be increased by 68.8%, 64.7%, 56.7%, 46.2%, and 35.0%, respectively, when the road transportation distances are 250 km, 300 km, 350 km, 400 km, and 450 km. It can be seen that the shorter the road transportation distance is, the more effective the reduction of the China Railway Express freight rate is. There are similar phenomena for the trunk line transportation distance of 11,000–14000 km. However, when the trunk distance is 7000 km, the longer the road transportation distance is, the more effective the reduction of the China Railway Express freight rate is.
When the road transportation distance is 350 km and the China Railway Express freight rate is decreased from 2.924 yuan/(TEU·km) to 2.516 yuan/(TEU·km), the China Railway Express market share is increased by 39.1%, 52.3%, 60.2%, 61.2%, 56.7%, 48.7%, 39.3%, and 30.1%, respectively, when the trunk line transportation distances of China Railway Express are 7000 km, 8000 km, 9000 km, 10,000 km, 11,000 km, 12,000 km, 13,000 km, and 14,000 km. It can be seen that when the trunk line transportation distance of China Railway Express is 10,000 km, the increase in the China Railway Express market share rate is mostly affected by the reduction of the China Railway Express freight rate, and whether the trunk line transportation distance increases or decreases, the effect of the decrease in the China Railway Express freight rate will be weakened. When the road transportation distances are 250 km, 300 km, 400 km, and 450 km, the increase in the China Railway Express transportation market share rate will be the most obvious at trunk line transportation distances of 11,000 km, 10,000 km, 9000 km, and 8000 km, respectively, and whether the trunk line transportation distance increases or decreases, the effect of the decrease on the China Railway Express freight rate will be weakened.
At present, the China Railway Express freight rate is 2.716 yuan/(TEU·km). When the freight rate is decreased by 0.068 yuan/(TEU·km) (2.652 yuan/(TEU·km)), the China Railway Express transportation market share rate is increased by 11.7% (the road transportation distance is 350 km, as shown in Figure 4c The road transportation distance is 350 km.) at the trunk line transportation distance of 10,000 km. While continuing to drop by 0.068 yuan/(TEU·km) (that is 2.584 yuan/(TEU·km)), the share rate will be increased by 12.8%. It shows that the gradual decline in the China Railway Express freight rate can help the China Railway Express market share rate increase more significantly. When the trunk line transportation distance is 7000 km, the gradual decline in the China Railway Express freight rate to the China Railway Express market share rate is weakened. When the trunk distances are more than 11,000 km, the gradual decline in the China Railway Express freight rate to the China Railway Express market share rate is more significant.
It can be seen that for the sustainable development of China Railway Express, the Chinese government has adopted economic subsidies and other means to decrease the China Railway Express freight rate, which has a certain improvement effect of an increase in the China Railway Express market share. However, blindly reducing the China Railway Express freight rate may not be able to achieve the best effect of an increase of the China Railway Express market share. Therefore, it is necessary to combine the actual situation of the trunk line transportation distances and the road transportation distances to formulate a relatively suitable adjustment strategy for the China Railway Express freight rate. This can take the form of segmented billing. At the different transportation distances, the different freight rate adjustment mechanisms are formulated according to the lifting effect of freight rate reduction.

5.1.2. The Chinese Road Freight Rate

The other parameters are fixed. The Chinese road freight rate varies in the interval (4.5–7.5) and its step length is 0.5. The unit is yuan/tkm. The share rate equation is used to analyze the impact of the change of the Chinese road freight rate on the China Railway Express transportation market share rate. The results are shown in Figure 7.
It can be seen from Figure 7 that when the road freight rate is decreased from 7.5 yuan/tkm to 4.5 yuan/tkm, the proportion of the China Railway Express market share rate will be increased in the range of 2–25%.
Although the change of the road freight rate is not as significant as that of the China Railway Express freight rate in promoting the China Railway Express market share rate, the two have similar influencing trends. When the trunk line transportation distance is 10,000 km and the road transportation distance is 350 km, a gradual decrease of the road freight rate will increase the China Railway Express market share rate, and whether or not the increase is in the trunk line transportation distance or road transportation distance, it has the same effect. With the decrease in the trunk line transportation distance or the road transportation distance, the gradual decrease of the road freight rate will weaken the effect of the increase in the China Railway Express market share rate.
Since the road transportation distance is much shorter than the trunk line transportation distance, and the road freight rate borne by China Railway Express and China–Europe Shipping is the same in the sending operation phase, the impact of the change in road freight rate on the China Railway Express market share rate is not as obvious as the change in the China Railway Express freight rate. However, according to the change in the trunk line transportation distances and the road transportation distances, with appropriate adjustment of the road freight rate, an increase of the China Railway Express market share rate can be achieved to some extent.

5.1.3. The China Railway Express Service Fee

The other parameters are fixed. The China Railway Express service fee varies in the interval (1600, 2200) and its step length is 100. The unit is yuan. The share rate equation is used to analyze the impact of the change of the China Railway Express service fee on the China Railway Express transportation market share rate. The results are shown in Figure 8.
It can be seen from Figure 8 that in general, an increase or decrease of the China Railway Express service fee has a relatively small impact on the China Railway Express market share rate. When the China Railway Express service fee is decreased from 2200 yuan to 1600 yuan, the proportion of the China Railway Express market share rate will be increased in the range of 0.8–11.3%.
It can be seen that, at this stage, the service quality of China–Europe trains is good, and the best state of operation has basically been achieved. If we continue to strengthen the quality of service and invest a lot of capital, the effect of promoting the sustainable development of China Railway Express will be relatively small.

5.1.4. The China Railway Express Travelling Speed

The other parameters are fixed. The China Railway Express travelling speed varies in the interval (25.079, 33.434) and its step length is 1.3925. The unit is km/h. The share rate equation is used to analyze the impact of the change of the China Railway Express travelling speed on the China Railway Express transportation market share rate. The results are shown in Figure 9.
It can be seen from Figure 9 that when the China Railway Express travelling speed is increased from 25.079 km/h to 33.434 km/h, the proportion of the China Railway Express market share rate will be increased in the range of 3–23.9%.
The influencing trend of the China Railway Express travelling speed is similar to the China Railway Express freight rate and the road freight rate. After the acceleration of the China Railway Express Transportation, the market share rate shows a fluctuation of increasing and then dropping with the increase in the trunk line transportation distance.
For the sustainable development of China Railway Express, a small speed increase of the China Railway Express travelling speed at present can improve the China Railway Express Transportation Market share rate. If the China Railway Express travelling speed is increased continually, the China Railway Express Transportation Market share rate will not increase so significantly. It can be seen that at present, there is still a certain range of room for improvement. Updating the carrying equipment, improving the train speed, optimizing the operation process of China Railway Express’s port station, and speeding up its operation at the transfer station are beneficial for the sustainable development of China Railway Express.

5.1.5. The China Railway Express Sending Operation Time at the Departure Station

The other parameters are fixed. The China Railway Express sending operation time at the departure station varies in the interval (0.5, 2.3) and its step length is 0.3. The unit is day. The share rate equation is used to analyze the impact of the change of the sending operation time at the departure station on the China Railway Express transportation market share rate. The results are shown in Figure 10.
It can be seen from Figure 10 that in general, the increase or decrease of the China Railway Express sending operation time at the departure station has a relatively small impact on the China Railway Express market share rate. When the sending operation time at the departure station is decreased from 2.3 days to 0.5 days, the proportion of the China Railway Express market share rate will be increased in the range of 0.7–10.4%.
It can be seen that at this stage, the China Railway Express sending operation at the departure station has been relatively complete, and it can guarantee the rapid and efficient delivery of goods. Therefore, the current investment income for the optimization of the China Railway Express sending operation at the departure station is relatively small.

5.1.6. The China Railway Express Transportation Time Error

The other parameters are fixed. The China Railway Express transportation time error varies in the interval (0, 3) and its step length is 0.5. The unit is day. The share rate equation is used to analyze the impact of the change of the China Railway Express transportation time error on the China Railway Express transportation market share rate. The results are shown in Figure 11.
It can be seen from Figure 11 that when the China Railway Express transportation time error is decreased from 3 days to 0 days, the proportion of the China Railway Express market share rate will be increased in the range of 1.7–31.7%. The influencing trend of the China Railway Express transportation time error is similar to the China Railway Express travelling speed.
The significant advantage of China Railway Express is that it is not affected by the weather and has high reliability in terms of the transportation time. For the sustainable development of China Railway Express, reducing the China Railway Express transportation time error can improve the China Railway Express share rate. Although the effect is relatively low, it still needs to ensure a smooth transportation process and avoid the negative effect of an increase in the average error. Therefore, with the premise of standardizing the operation process of China Railway Express, strengthening its transportation organization, and ensuring that the China Railway Express transportation time error does not increase, further reducing the error time will promote the sustainable development of China Railway Express.

5.1.7. The China Railway Express Transportation Frequency

The other parameters are fixed. The China Railway Express transportation frequency varies in the interval (3, 9) and its step length is 1. The unit is train/week. The share rate equation is used to analyze the impact of the change of the China Railway Express transportation frequency on the China Railway Express transportation market share rate. The results are shown in Figure 12.
It can be seen from Figure 12 that when the China Railway Express transportation frequency is increased from 3 trains/week to 9 trains/week, the proportion of the China Railway Express market share rate will be increased in the range of 3.7–53.5%. The influencing trend of China Railway Express transportation frequency is similar to the China Railway Express freight rate.
Transportation frequency is a reflection of the China Railway Express capacity. The lack of the China Railway Express capacity is one of the key issues that constrain its development. For the sustainable development of China Railway Express, at the present stage, the increase in the China Railway Express transportation frequency will increase the share of the China Railway Express market.

5.1.8. The China Railway Express Carbon Emissions Per Unit

The other parameters are fixed. The China Railway Express carbon emissions per unit value varies in the interval (1.95, 3.15) and its step length is 0.2. The unit is kg/(TEU·km). The share rate equation is used to analyze the impact of the change of the China Railway Express carbon emissions per unit on the China Railway Express transportation market share rate. The results are shown in Figure 13.
It can be seen from Figure 13 that when the China Railway Express carbon emissions per unit value is decreased from 3.15 kg/(TEU·km) to 1.95 kg/(TEU·km), the proportion of the China Railway Express market share rate will be increased in the range of 5.1–42.2% The influencing trend of the China Railway Express carbon emission per unit is similar to the China Railway Express freight rate.
The impact of carbon emissions factors is more reflected by its social benefits on the sustainable development of China Railway Express. Therefore, the carbon emissions do not intuitively affect the choice of the transport mode from the perspective of the shipper. However, when analyzed from the perspective of social benefits, green environmental protection is one of the most significant advantages of China Railway Express. At the present stage, reducing the carbon emissions per unit can increase the share of the China Railway Express market, and the result will be better if carbon emissions can be continued to be reduced. Therefore, from the perspective of social benefits, further optimization of the environmental protection of China Railway Express and the usage of more eco-friendly equipment can have a positive impact on the sustainable development of China Railway Express.

5.2. Elasticity Analysis on Influencing Factors

5.2.1. Derivation process of elasticity analysis

Elasticity is used to measure the sensitivity of a variable to another variable, which is the degree of reflection of another variable caused by the change of one variable. The value is the ratio of the rate of change of two variables, called the elastic coefficient, expressed by e.
This paper conducts an elastic analysis of the main factors affecting the competitiveness of China Railway Express. The calculation Equation (17) of factor A ’s elasticity coefficient of the China Railway Express transportation market share rate is as follows:
e P 1 A = lim Δ A 0 Δ P 1 / P 1 Δ A / A = lim Δ A 0 Δ P 1 Δ A A P 1
In Equation (17), Δ A represents the amount of change in the influencing factor A , and Δ P 1 represents the amount of change in the China Railway Express transportation market share rate relative to Δ A .
The elasticity coefficient is a measure of the degree of response of the China Railway Express Transportation Market share to changes in influencing factors. In economics, according to the absolute value of the elastic coefficient, it is divided into five categories, as follows. When | e P 1 A | = 0 , it is perfectly inelastic; when 0 < | e P 1 A | < 1 , it is inelastic; when | e P 1 A | = 1 , it is unitarily elastic; when 1 < | e P 1 A | < + , it is elastic; and when | e P 1 A | = + , it is perfectly elastic.
The impact of one of the influencing factors A 1 a on the China Railway Express Transportation Market Share Rate P 1 will be taken as an example. According to Equation (9), the functional relationship between the China Railway Express Transportation Market Share Rate P 1 and the influencing factor A 1 a is as follows:
P 1 = exp ( a = 1 l θ 1 a A 1 a ) i = 1 n exp ( a = 1 l θ i a A i a )
Assume that when A 1 a changes Δ A 1 a , it can be shown by Equation (17) that the elasticity of A 1 a to China Railway Express transportation market share rate P 1 is
e P 1 A 1 a = lim Δ A 1 a 0 Δ P 1 / P 1 Δ A 1 a / A 1 a = lim Δ A 1 a 0 Δ P 1 Δ A 1 a A 1 a P 1 = A 1 a P 1 d P 1 d A 1 a
= A 1 a P 1 exp ( a = 1 l θ 1 a A 1 a ) θ 1 a i = 1 n exp ( a = 1 l θ i a A i a ) exp ( a = 1 l θ 1 a A 1 a ) θ 1 a exp ( a = 1 l θ 1 a A 1 a ) { i = 1 n exp ( a = 1 l θ i a A i a ) } 2
= A 1 a P 1 θ 1 a exp ( a = 1 l θ 1 a A 1 a ) [ i = 1 n exp ( a = 1 l θ i a A i a ) exp ( a = 1 l θ 1 a A 1 a ) ] { i = 1 n exp ( a = 1 l θ i a A i a ) } 2
= A 1 a P 1 θ 1 a P 1 ( 1 P 1 ) = A 1 a θ 1 a ( 1 P 1 ) ( i = 1 , 2 , , n ; a = 1 , 2 , , l )
It can be demonstrated from Equation (19) that the elastic coefficient of the influencing factors can be recorded as
e P 1 A = A 1 a θ 1 a ( 1 P 1 ) ( a = 1 , 2 , , l )

5.2.2. Elastic Analysis of Different Influencing Factors

In this paper, the elastic coefficient Equation (20) is used to calculate the elastic coefficients of the China Railway Express transportation market share rate at different transportation distances, including the China Railway Express freight rate elastic coefficient, the Chinese road freight rate elastic coefficient, the China Railway Express service fee elastic coefficient, the China Railway Express travelling speed elastic coefficient, the China Railway Express sending operation time at the departure station elastic coefficient, the China Railway Express transportation time error elastic coefficient, the China Railway Express transportation frequency elastic coefficient, and the China Railway Express carbon emissions per unit elastic coefficient, as shown in Figure 14.
It should be noted that the China Railway Express freight rate elasticity coefficient of the China Railway Express transportation market share rate shows how a change of the China Railway Express transportation market share ratio (dependent variable) will affect the change of the China Railway Express freight rate (independent variable). For the convenience of description, the China Railway Express freight rate elasticity coefficient of the China Railway Express transportation market share rate is abbreviated as the China Railway Express freight rate elasticity coefficient, the meanings of other types of elastic coefficients are similar, and similar abbreviations are also made.
It can be seen from Figure 14 that with different trunk line transportation distances or road transportation distances, the impact of the same influencing factors on the China Railway Express transportation market share rate is different.
The elastic coefficient of the influencing factors is positive, indicating that as the value of the influencing factors increases, the China Railway Express transportation market share will increase. The elastic coefficient is negative, indicating that as the value of the influencing factors increases, the China Railway Express transportation market share will decrease. The influencing factors of which the elastic coefficient is positive include the China Railway Express travelling speed and China Railway Express transportation frequency. The elastic coefficient of the other influencing factors is negative.
According to the classification method of the elastic coefficient, with different trunk line transportation distances or road transportation distances, the absolute value of the transportation time error elastic coefficient (−0.0262, −0.2495) and sending operation time at the departure station elastic coefficient (−0.0243, −0.2318) are between (0, 1), which shows that these two kinds of influencing factors are inelastic for the China Railway Express transportation market share rate. The absolute value of the China Railway Express freight rate elastic coefficient (−1.4848, −28.3104) is greater than 1, which shows that this influencing factor is elastic for the China Railway Express transportation market share rate. That is to say, the China Railway Express transportation market share rate is very sensitive to the change of China Railway Express freight rate. The road freight rate elastic coefficient (−0.1171, −2.0103), the service fee elastic coefficient (−0.1484, −1.4146), the travelling speed elastic coefficient (0.2490, 4.7485), the transportation frequency elastic coefficient (0.2867, 2.7331), and the carbon emissions per unit elastic coefficient (−0.2526, −4.8160) will only be greater than 1 (flexible) in some cases. The common feature of these five types of influencing factors is that the larger the trunk line transportation distance and the road transportation distance is, the greater the absolute value of their elastic coefficients will be. That is to say, the change in the percentage of the influencing factors has a greater impact on the percentage change of the China Railway Express transportation market share rate.

6. Conclusions

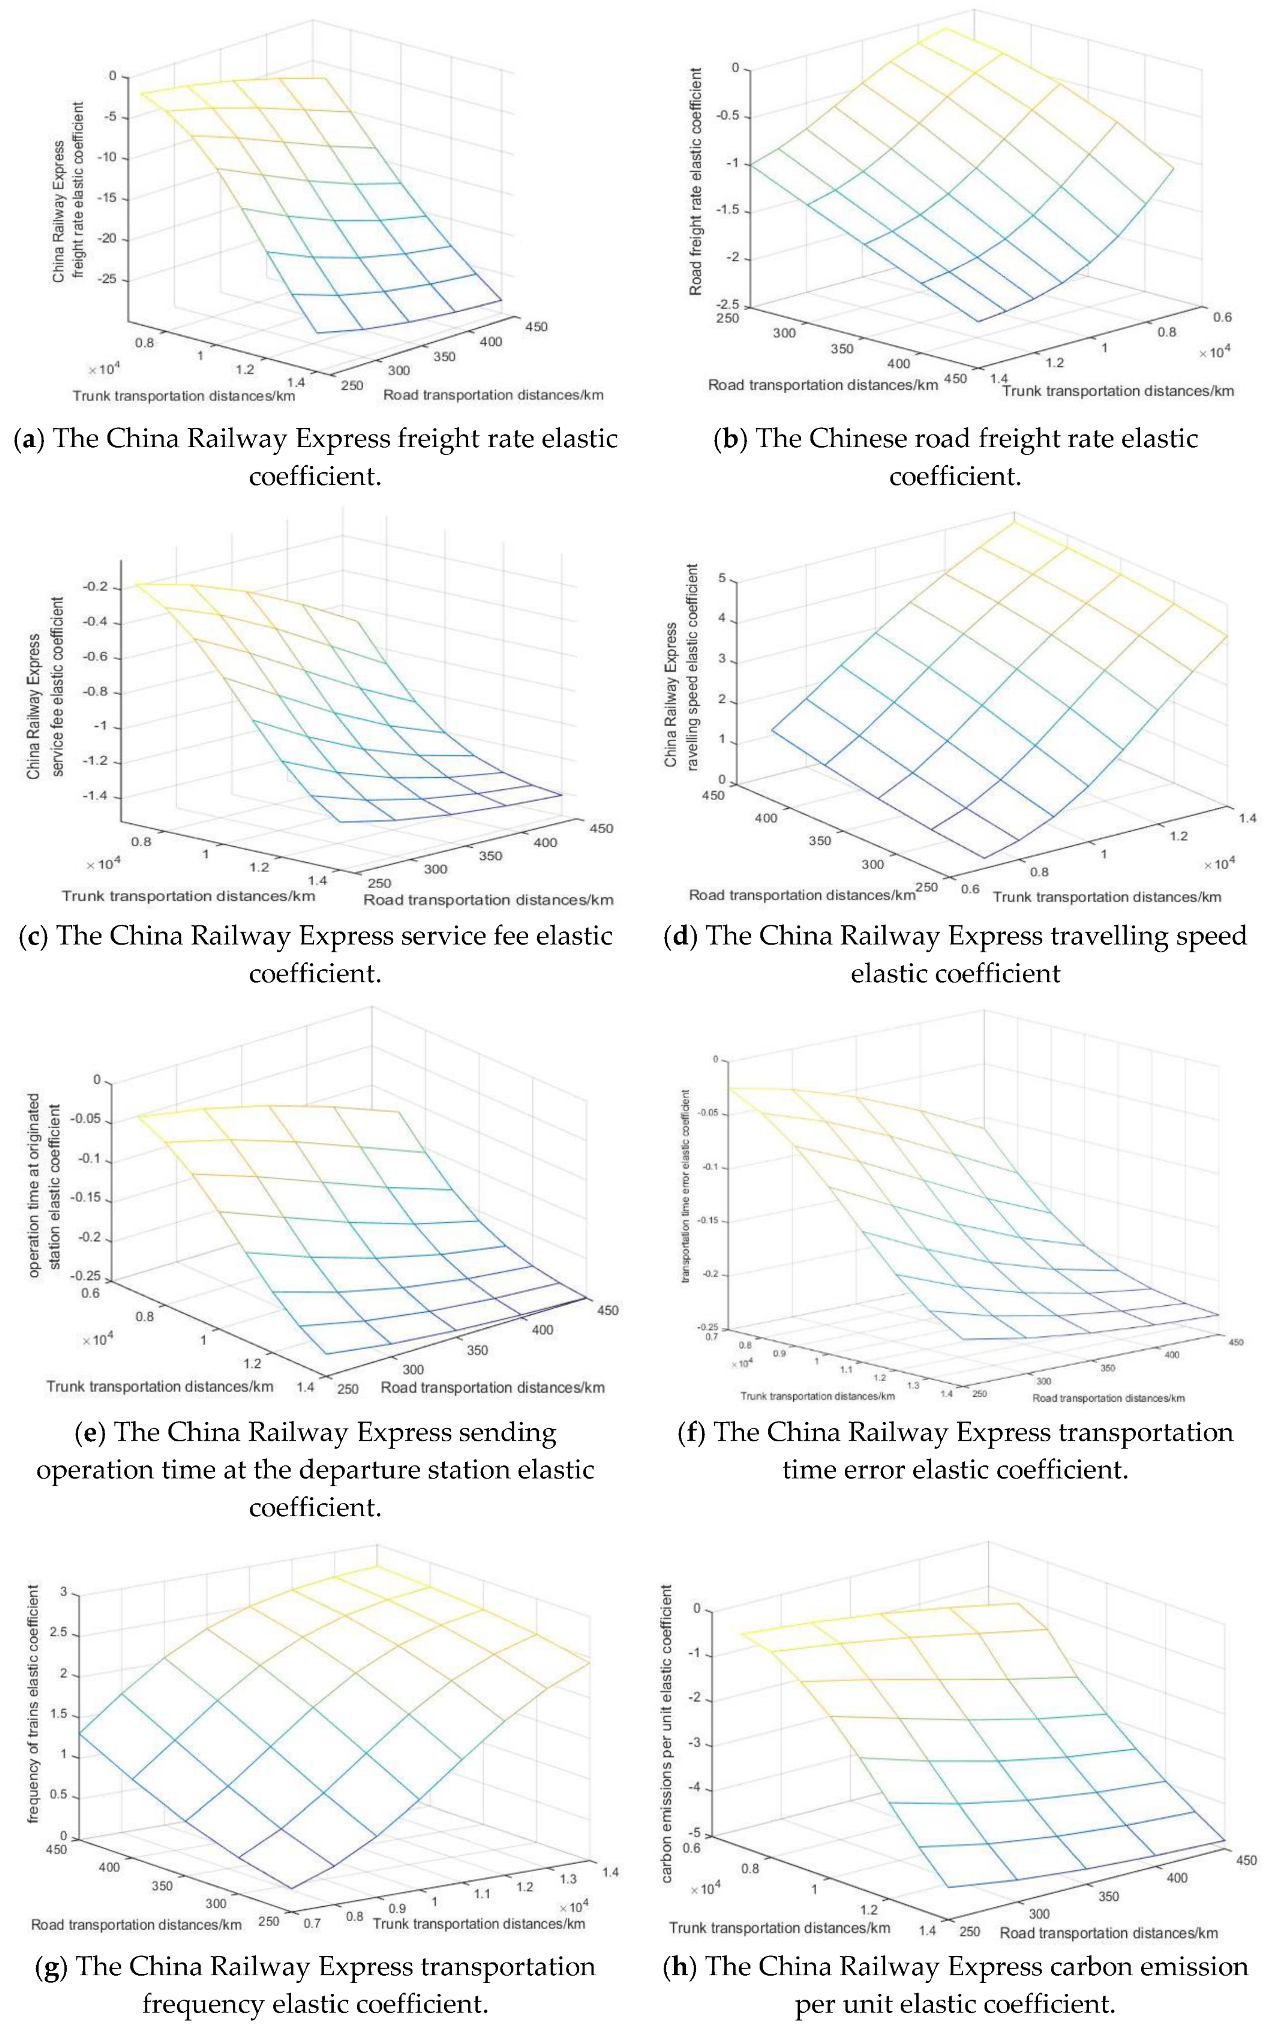
In order to promote the sustainable development of the China Railway Express, based on the generalized cost function, the stochastic utility theory is used to construct the competitiveness model of China Railway Express, and the whole process of China Railway Express and China–Europe Shipping is analyzed in detail. The relevant parameters of the model are calibrated using the freight transport data from the Beijing-Tianjin-Hebei region to Hamburg, Germany. Then, a sensitivity analysis is carried out by selecting eight factors that have impacts on the China Railway Express transportation market share rate, including the China Railway Express freight rate, the Chinese road freight rate, the China Railway Express service fee, the China Railway Express travelling speed, the China Railway Express sending operation time at the departure station, the China Railway Express transportation time error, the China Railway Express transportation frequency, and the China Railway Express carbon emissions per unit. In addition, considering the dimension and value range of each influencing factor, this paper draws on the elastic coefficient analysis method in economics, and further analyzes the degree of response of changes in the China Railway Express transportation market share rate to changes in various influencing factors. The main conclusions obtained are as follows.
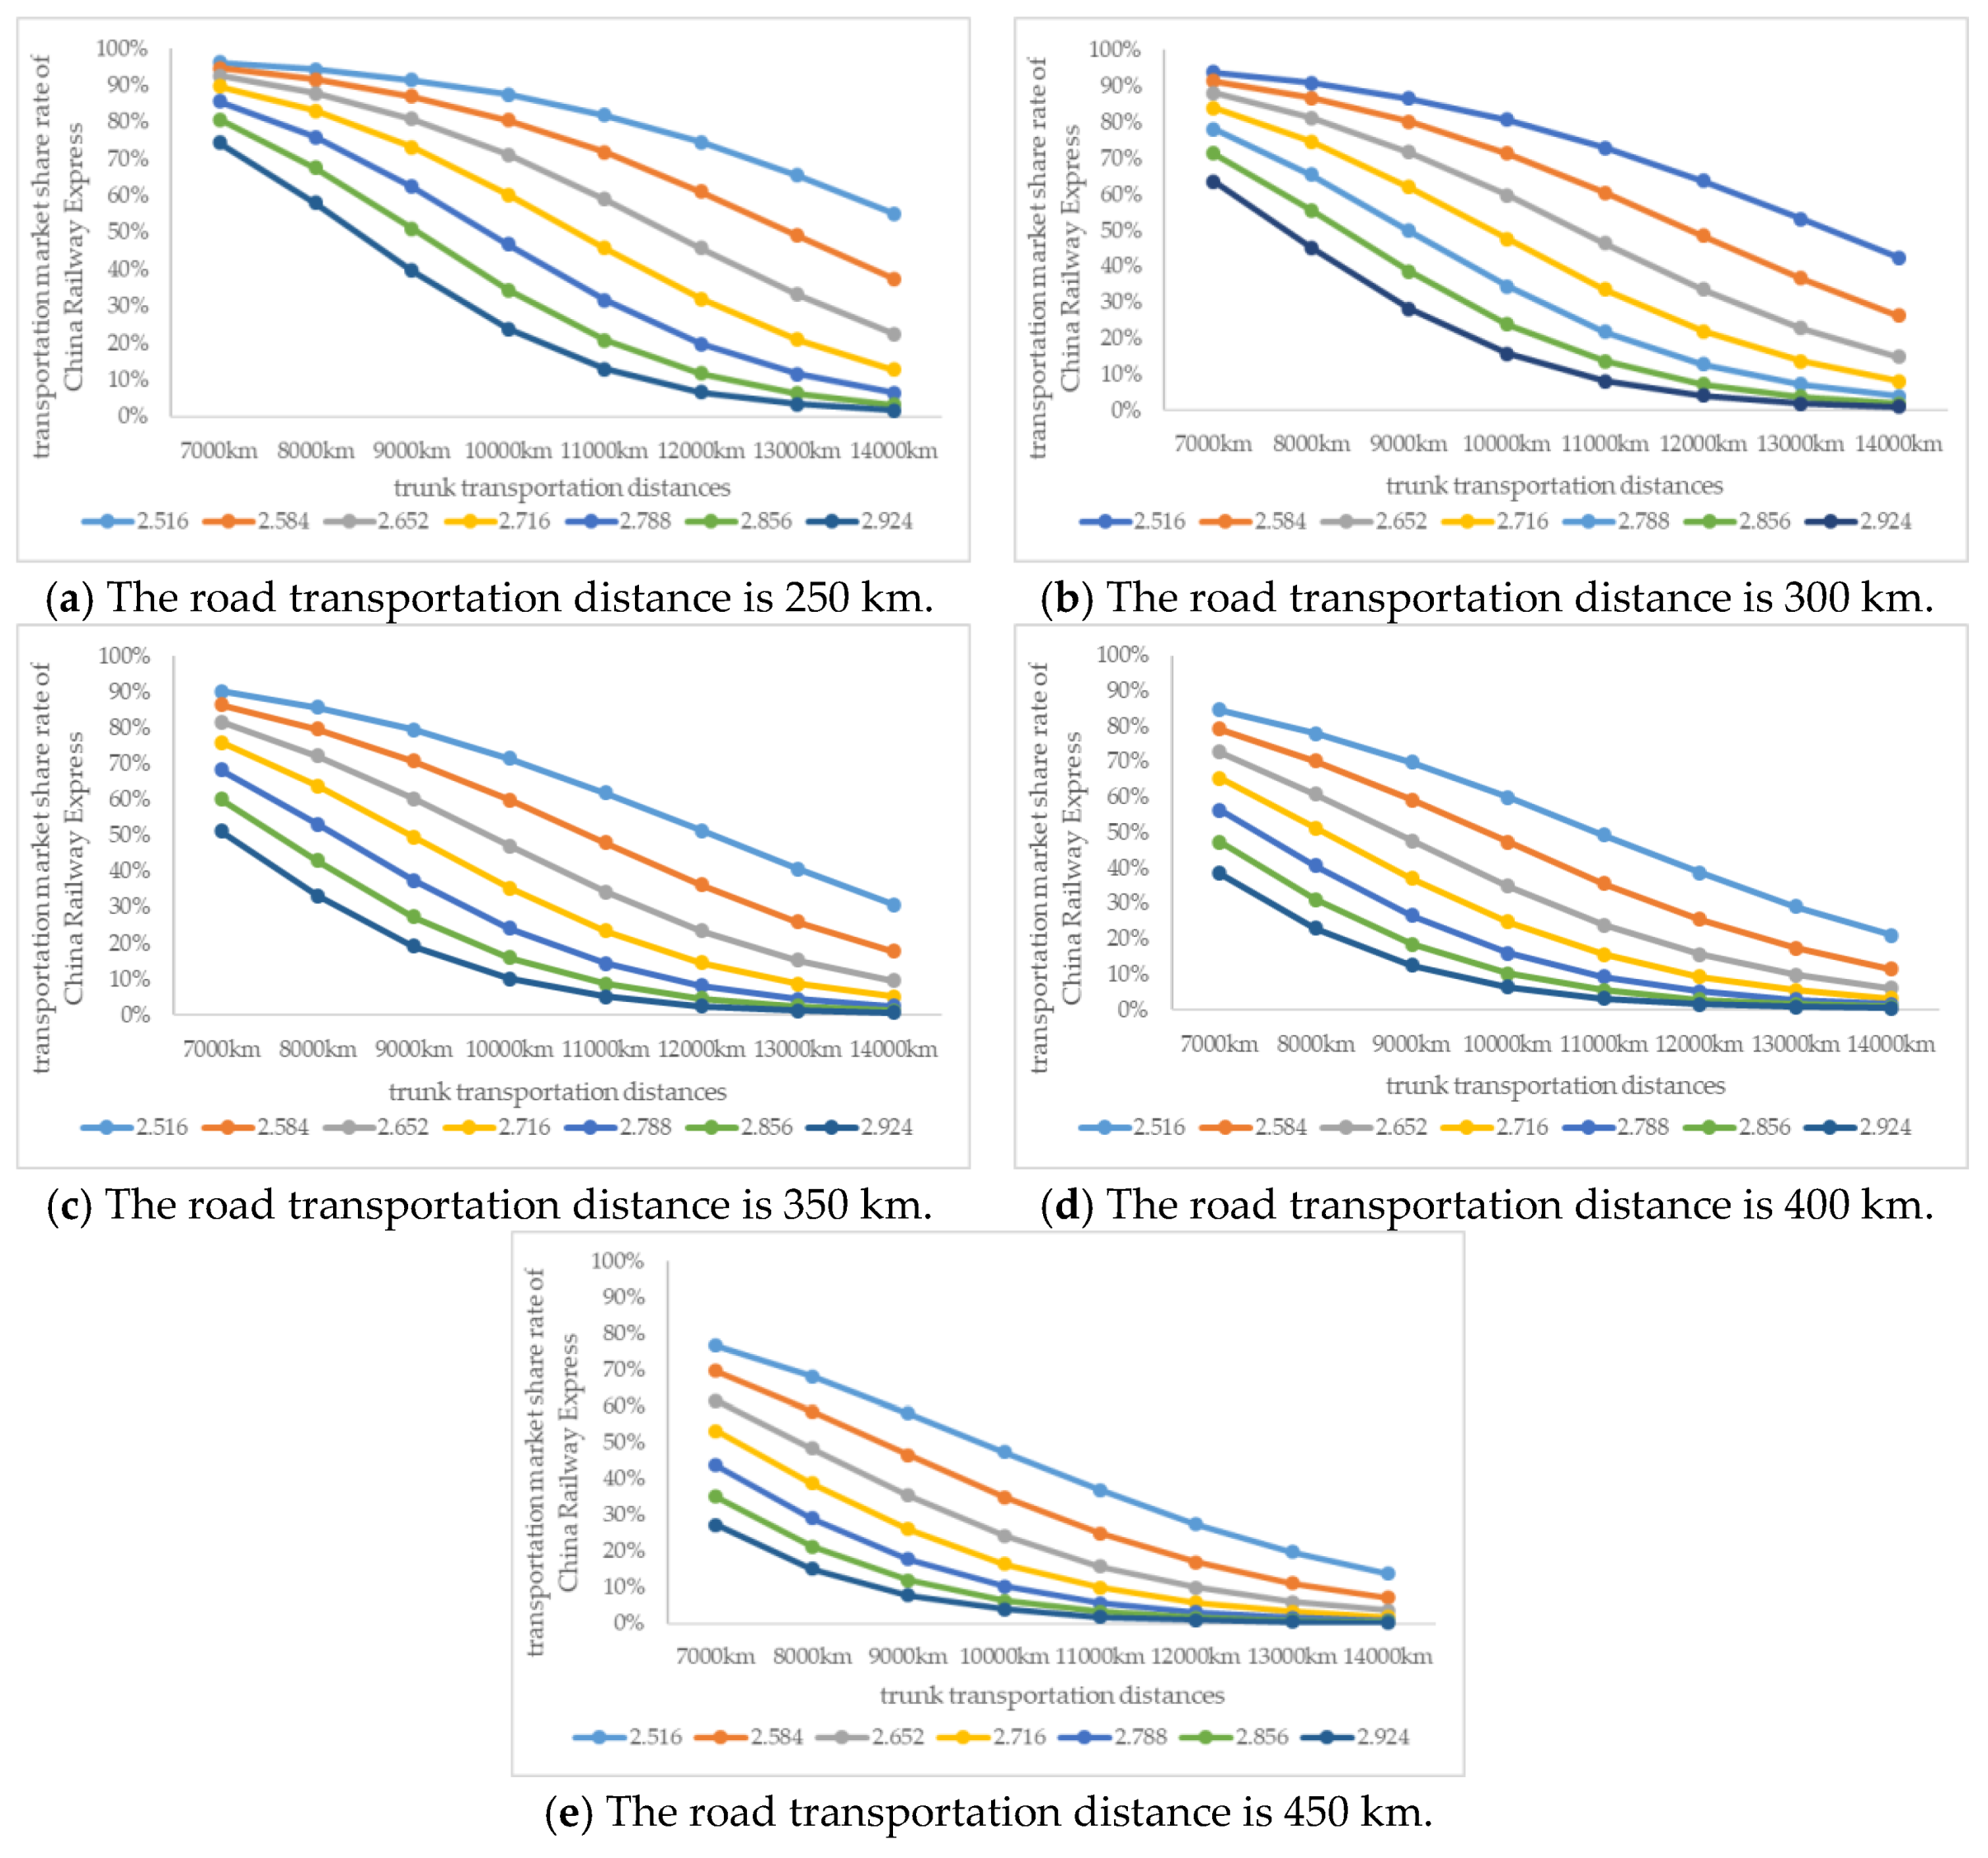
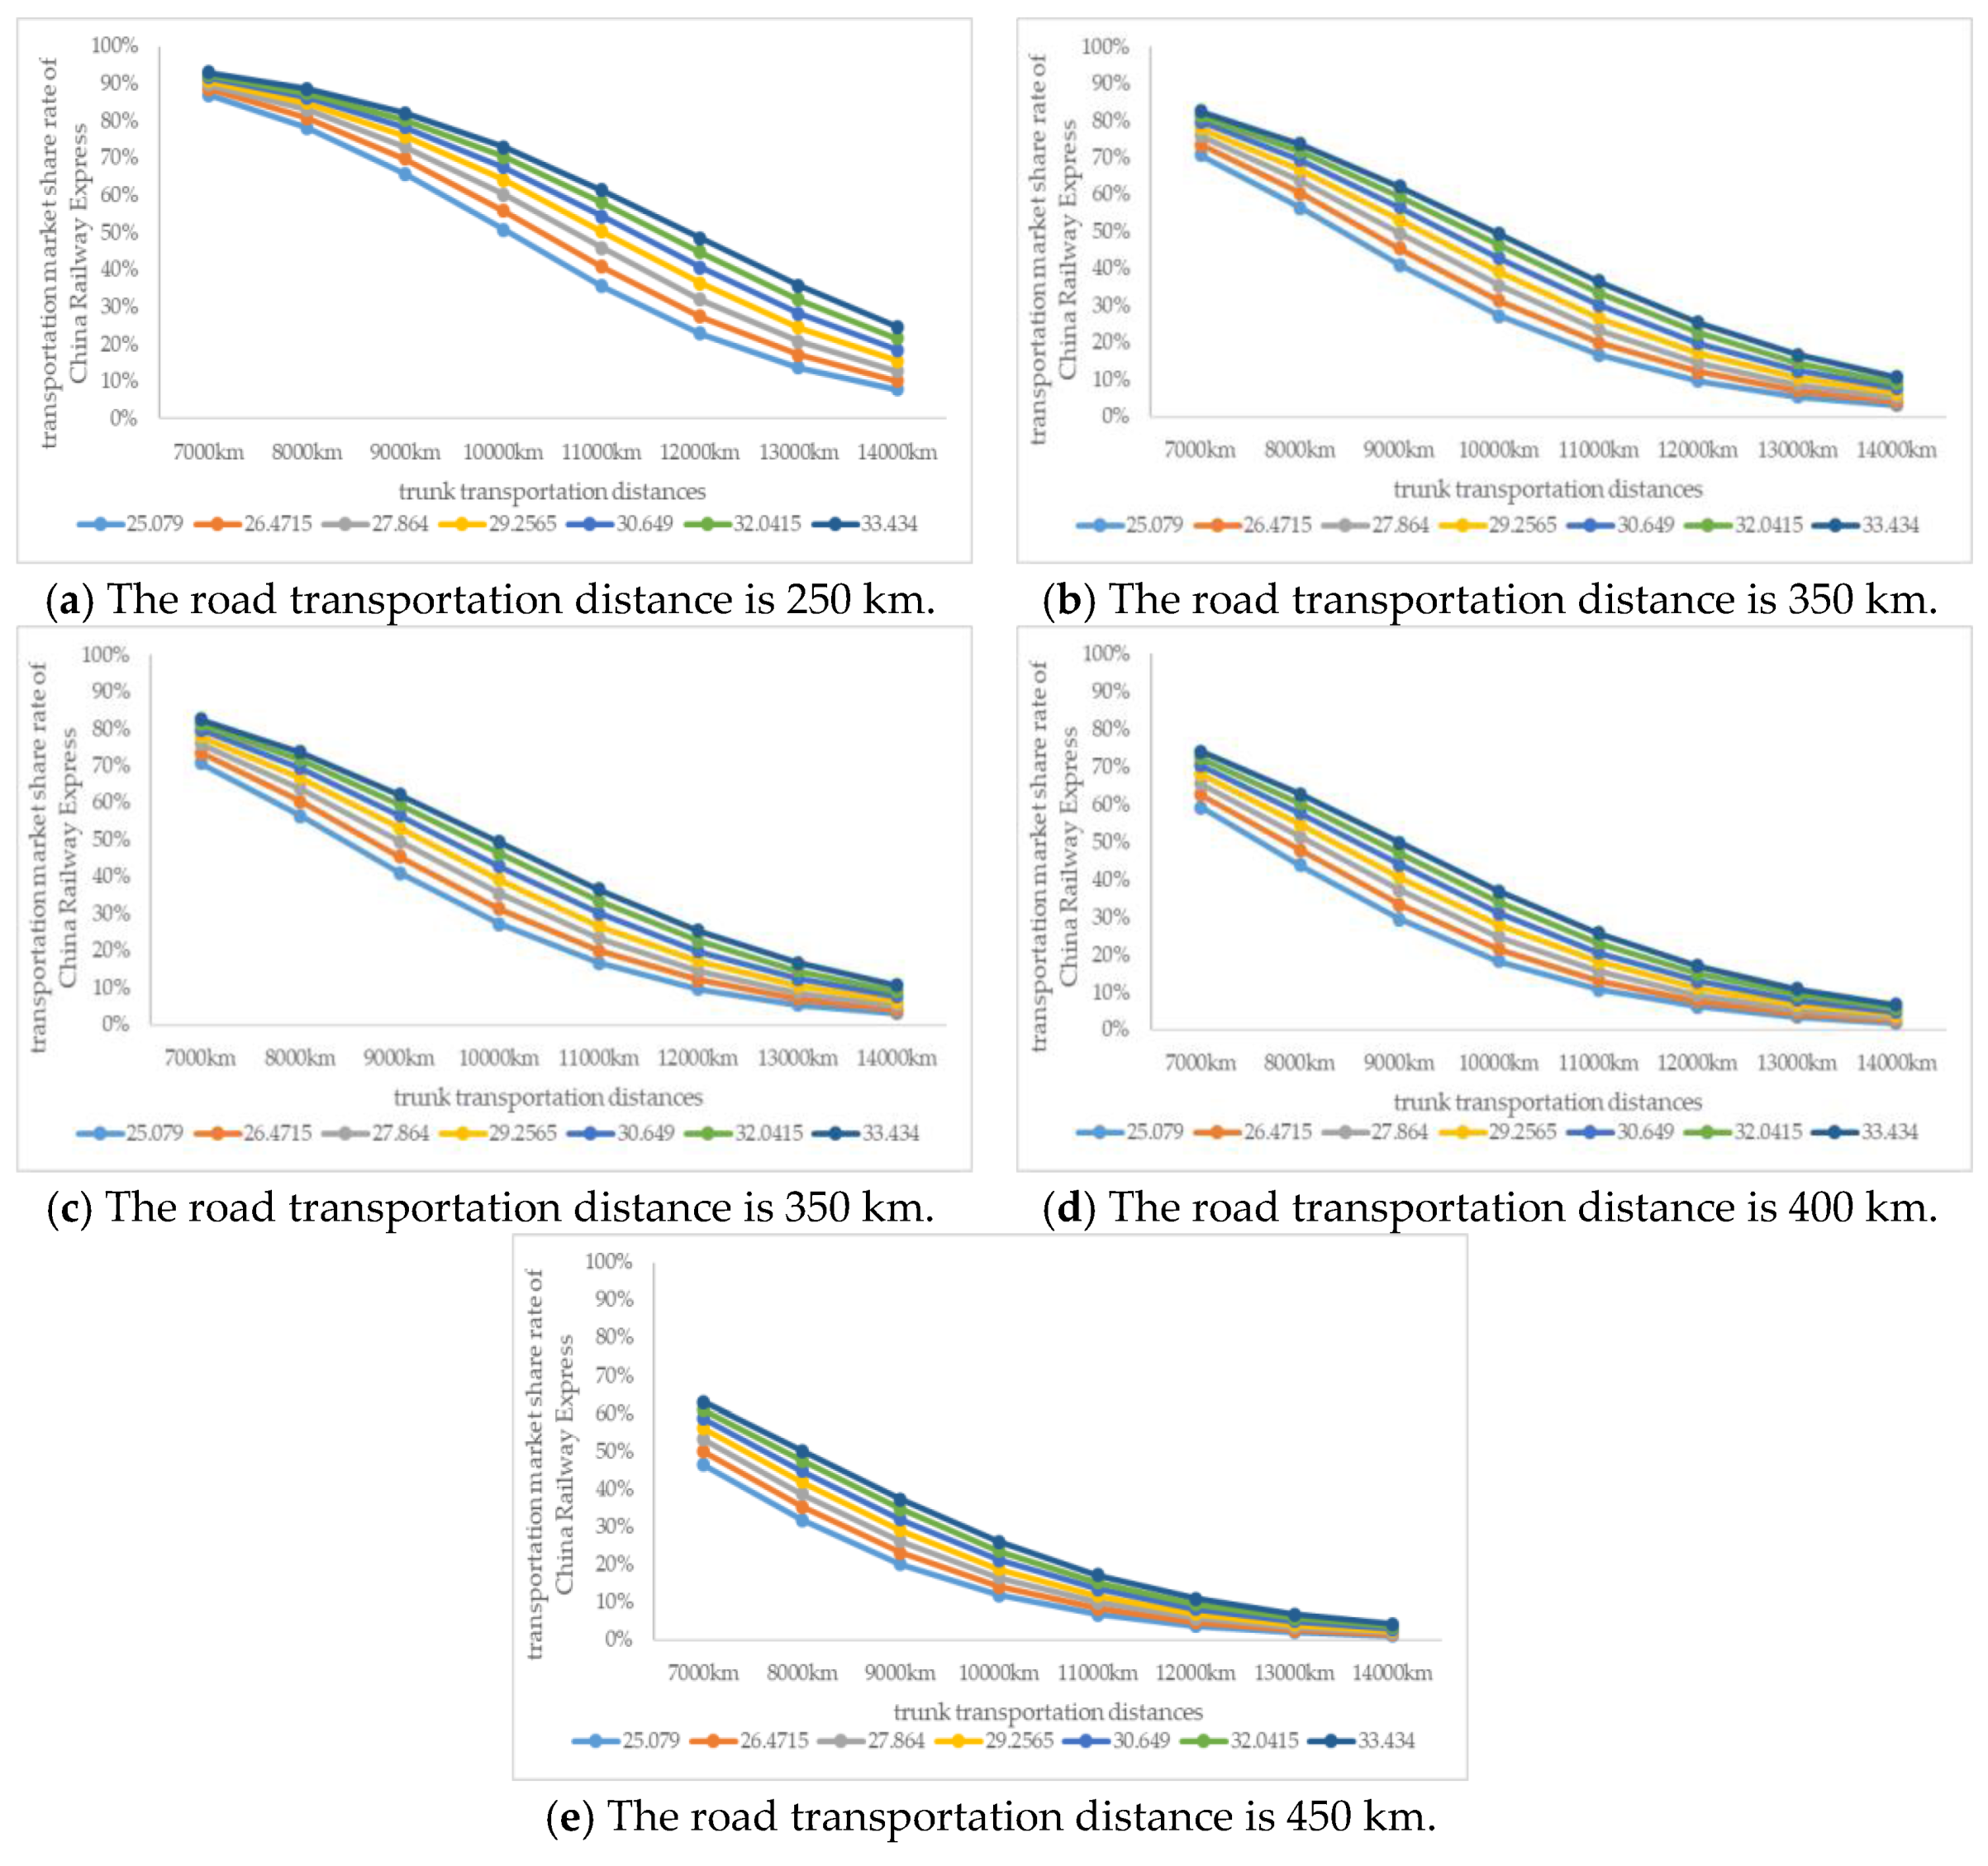
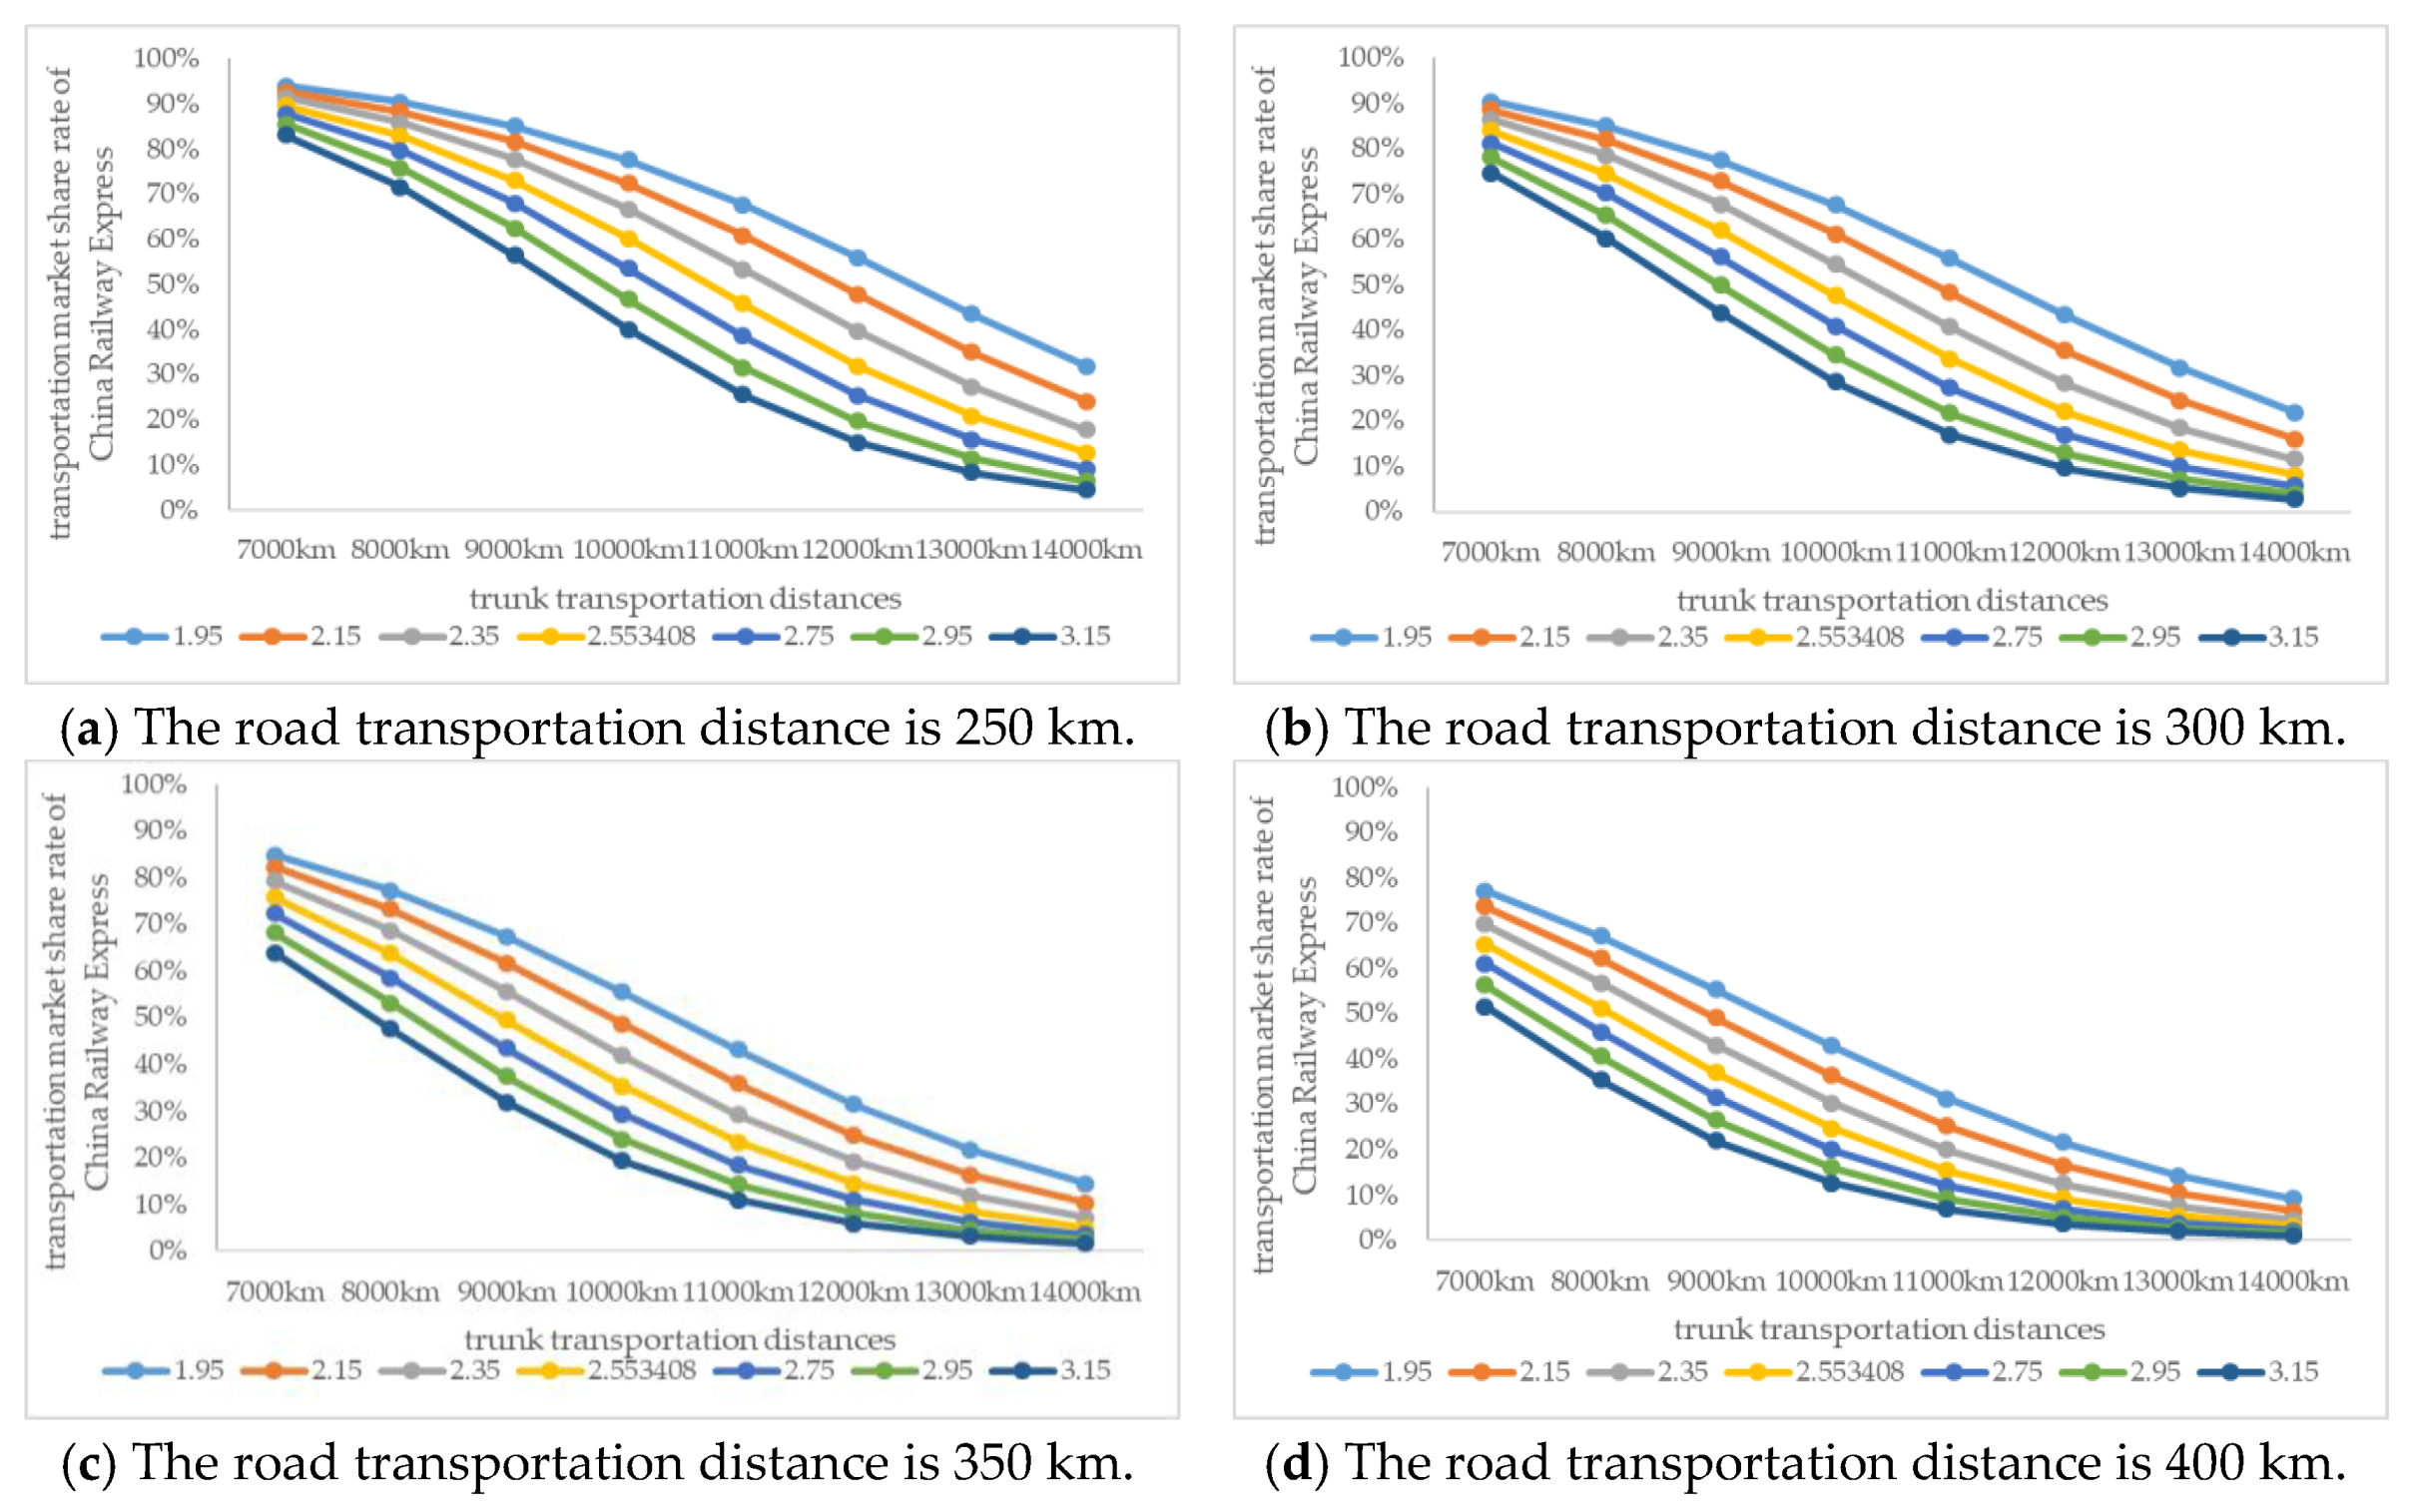
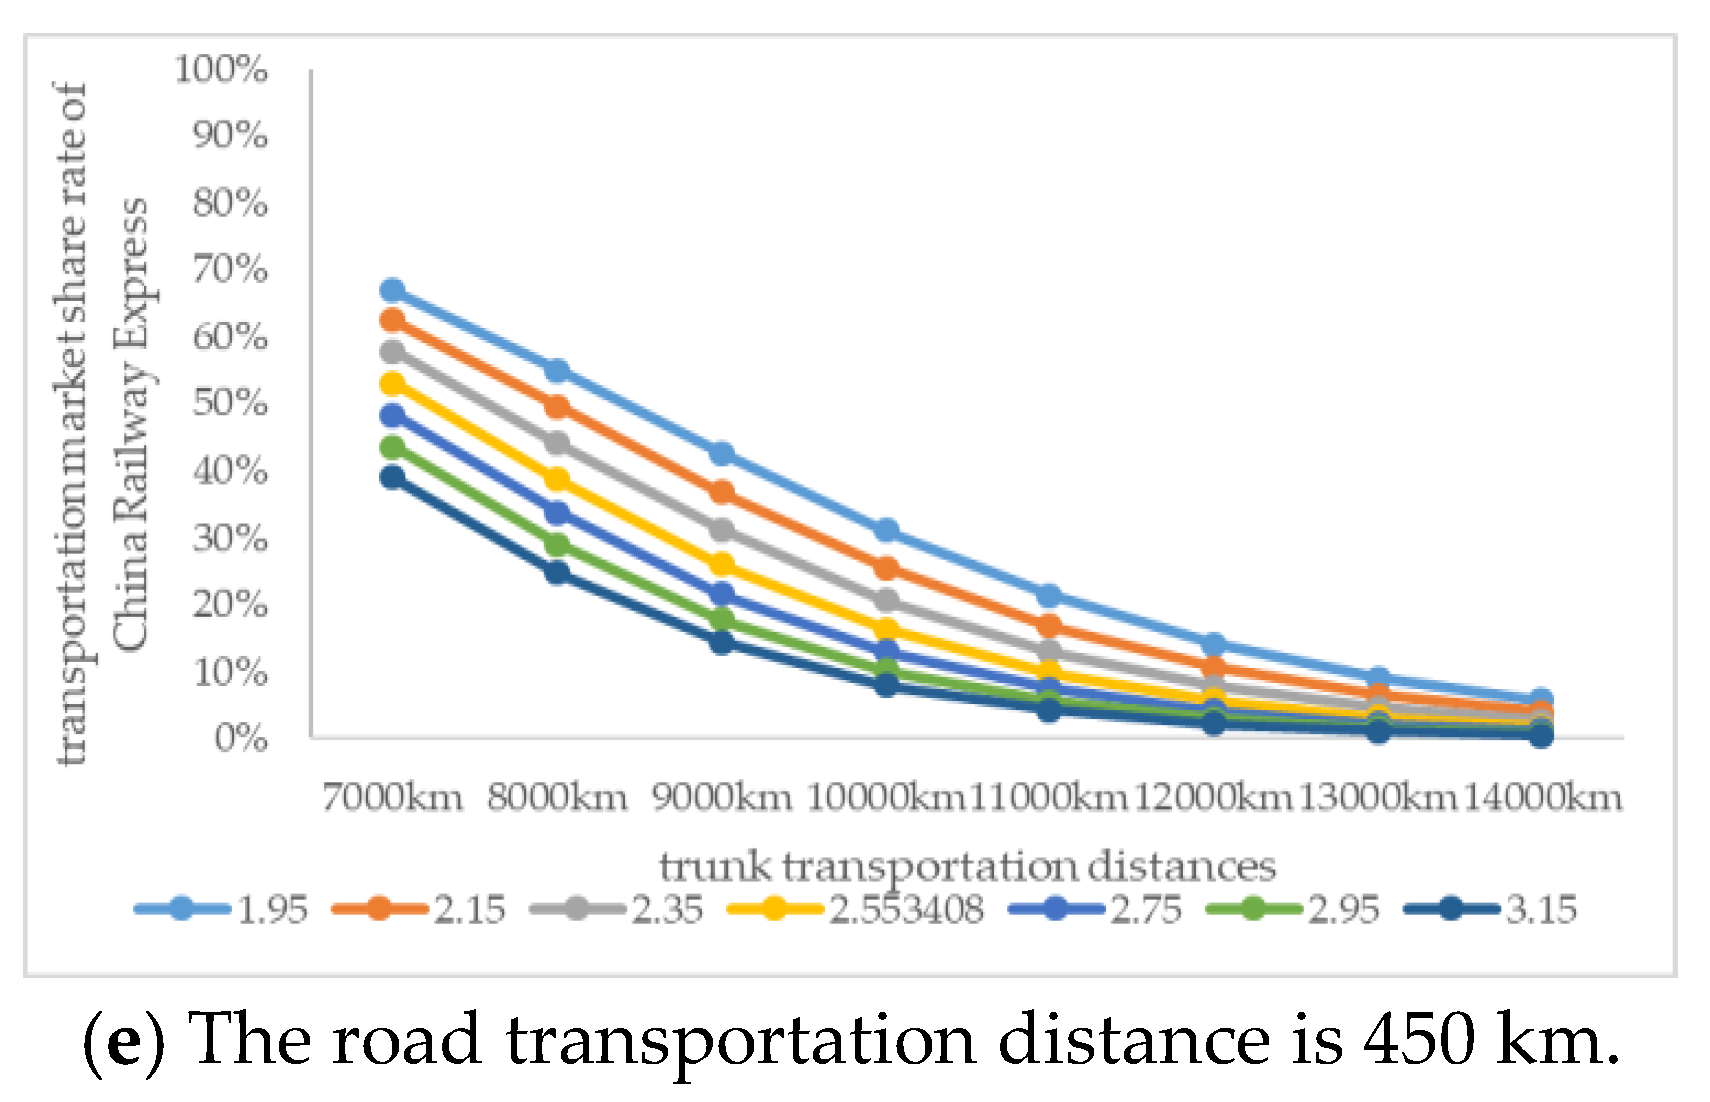
In the analysis of the factors affecting the China Railway Express transportation market share rate, when the China Railway Express freight rate has different values, the China Railway Express transportation market share rate will continue to decrease with the increase in the China Railway Express trunk line transportation distance and the increase in the road transportation distance. Compared with China–Europe Shipping, China Railway Express has a competitive advantage in the relatively low range of transportation. It can be seen that China Railway Express should choose the relatively low range of transportation as its main market for the sake of its sustainable development.
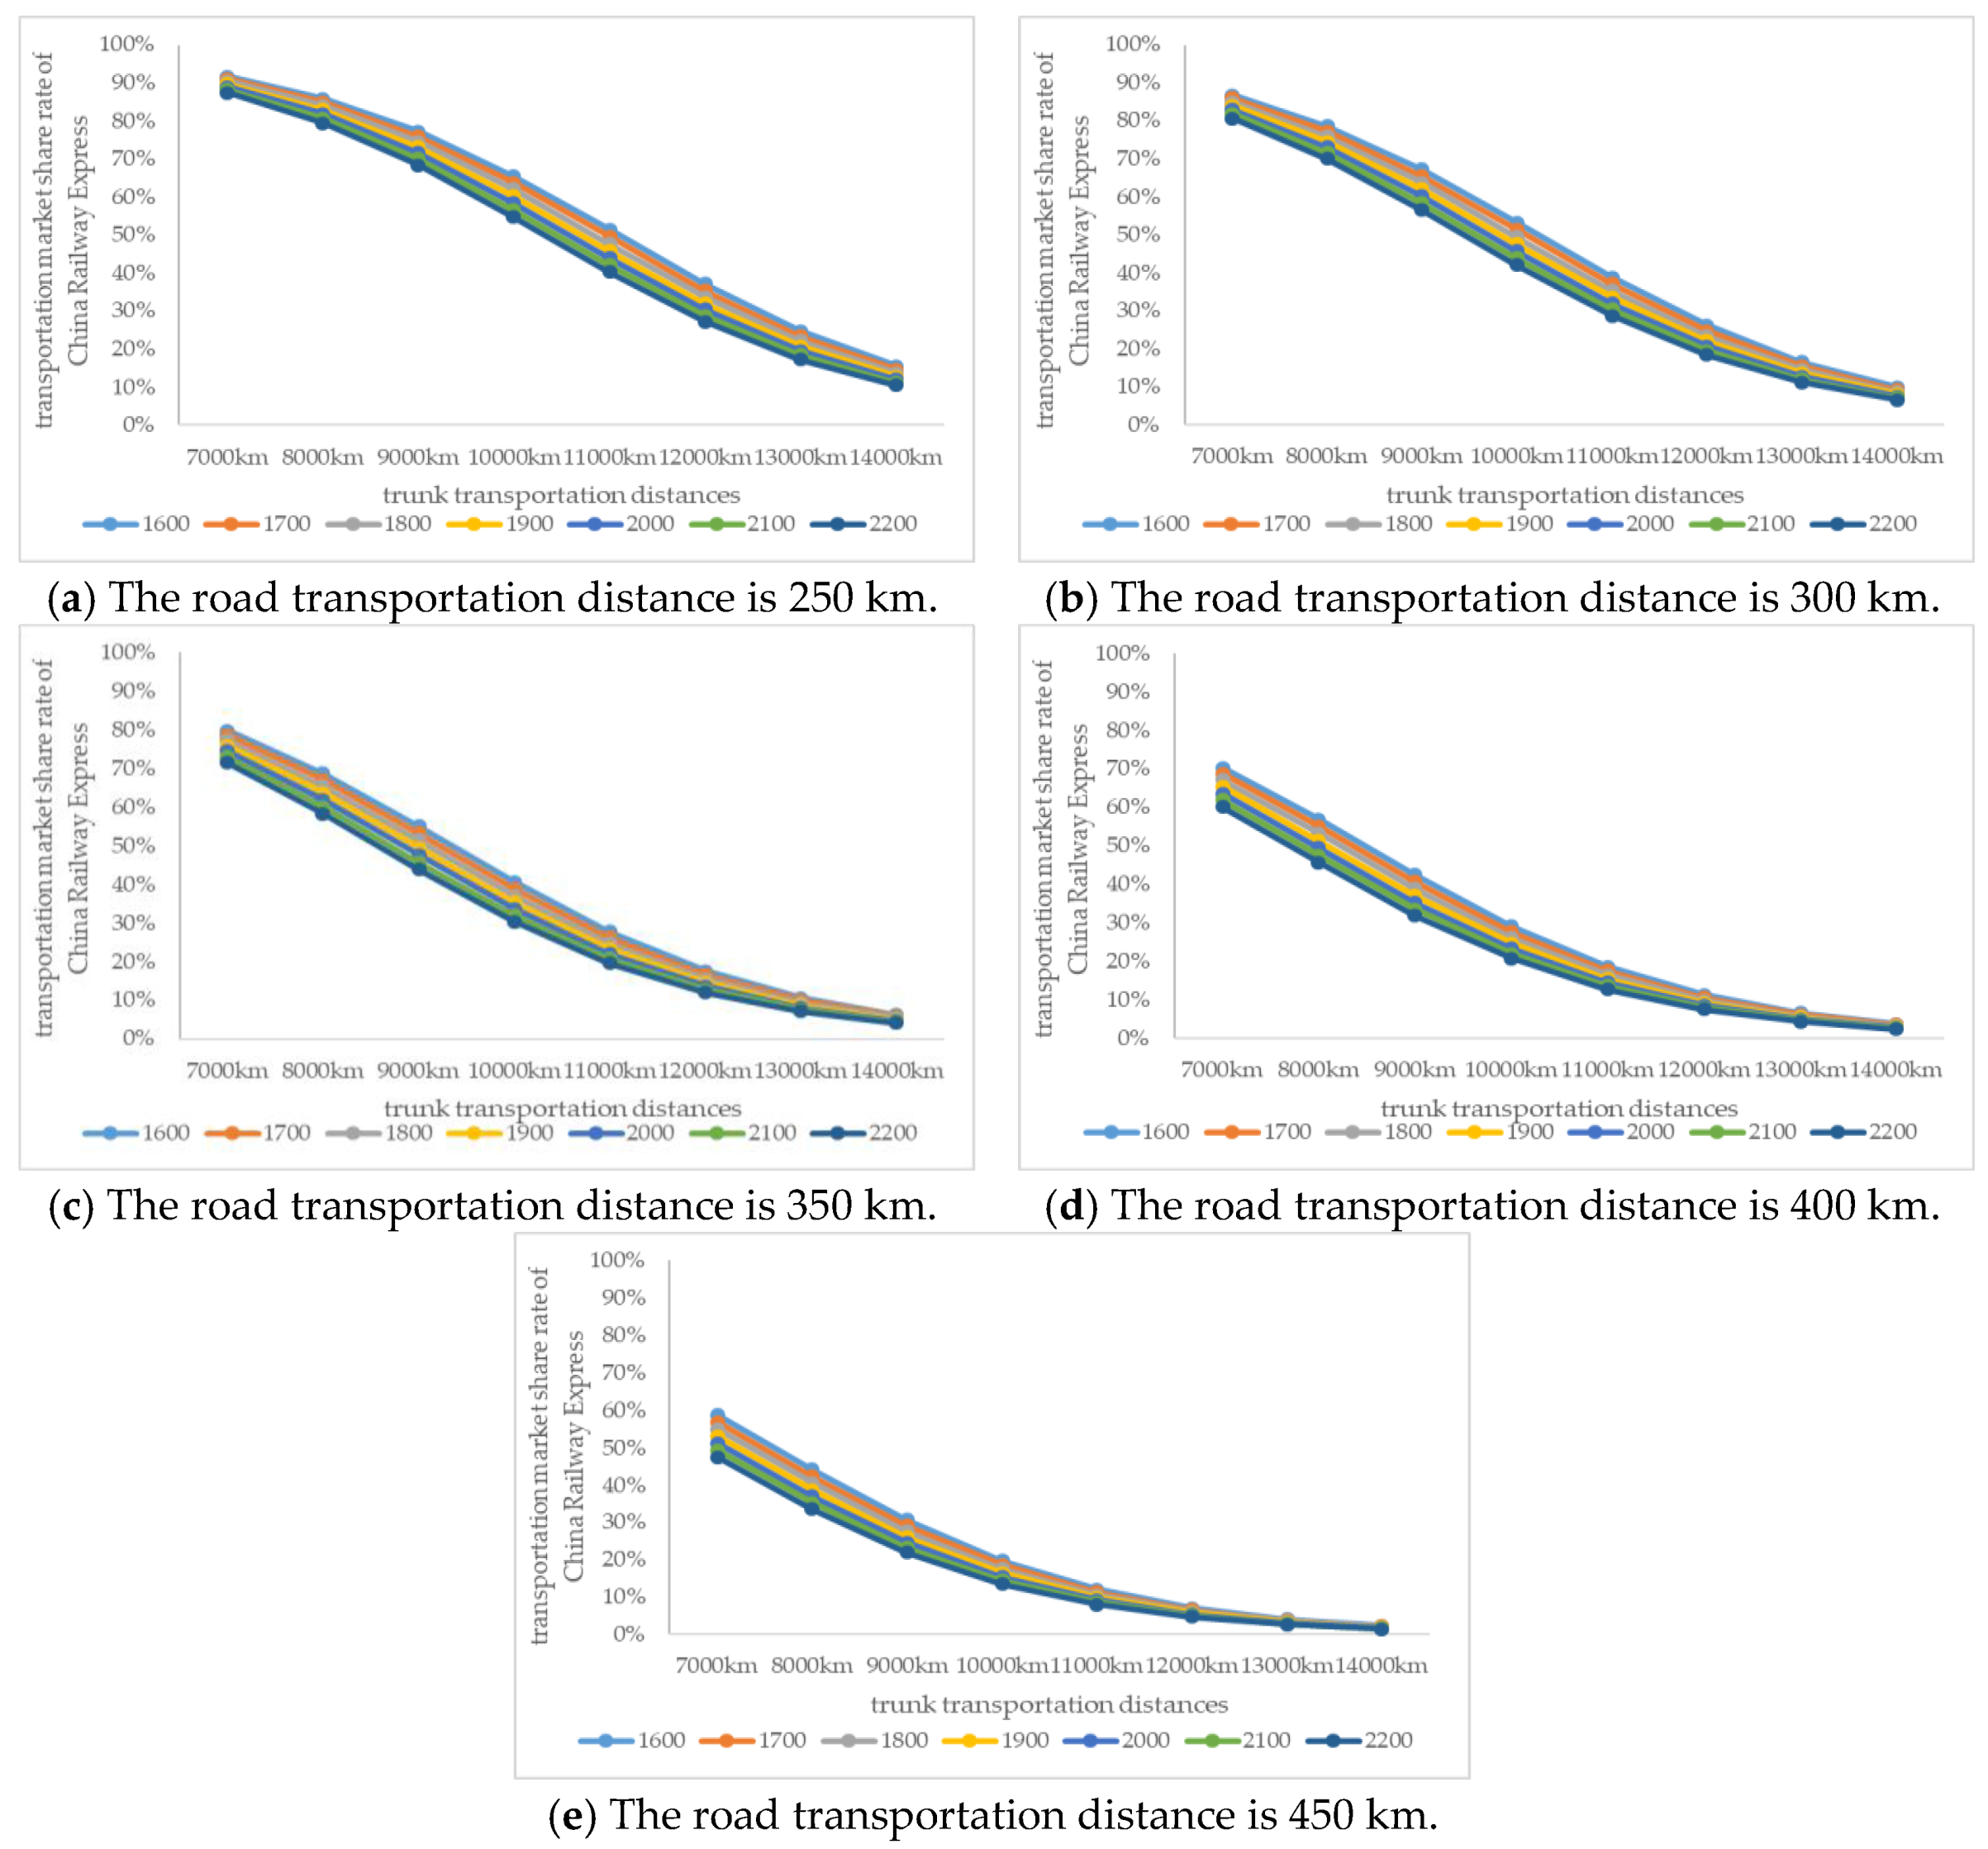
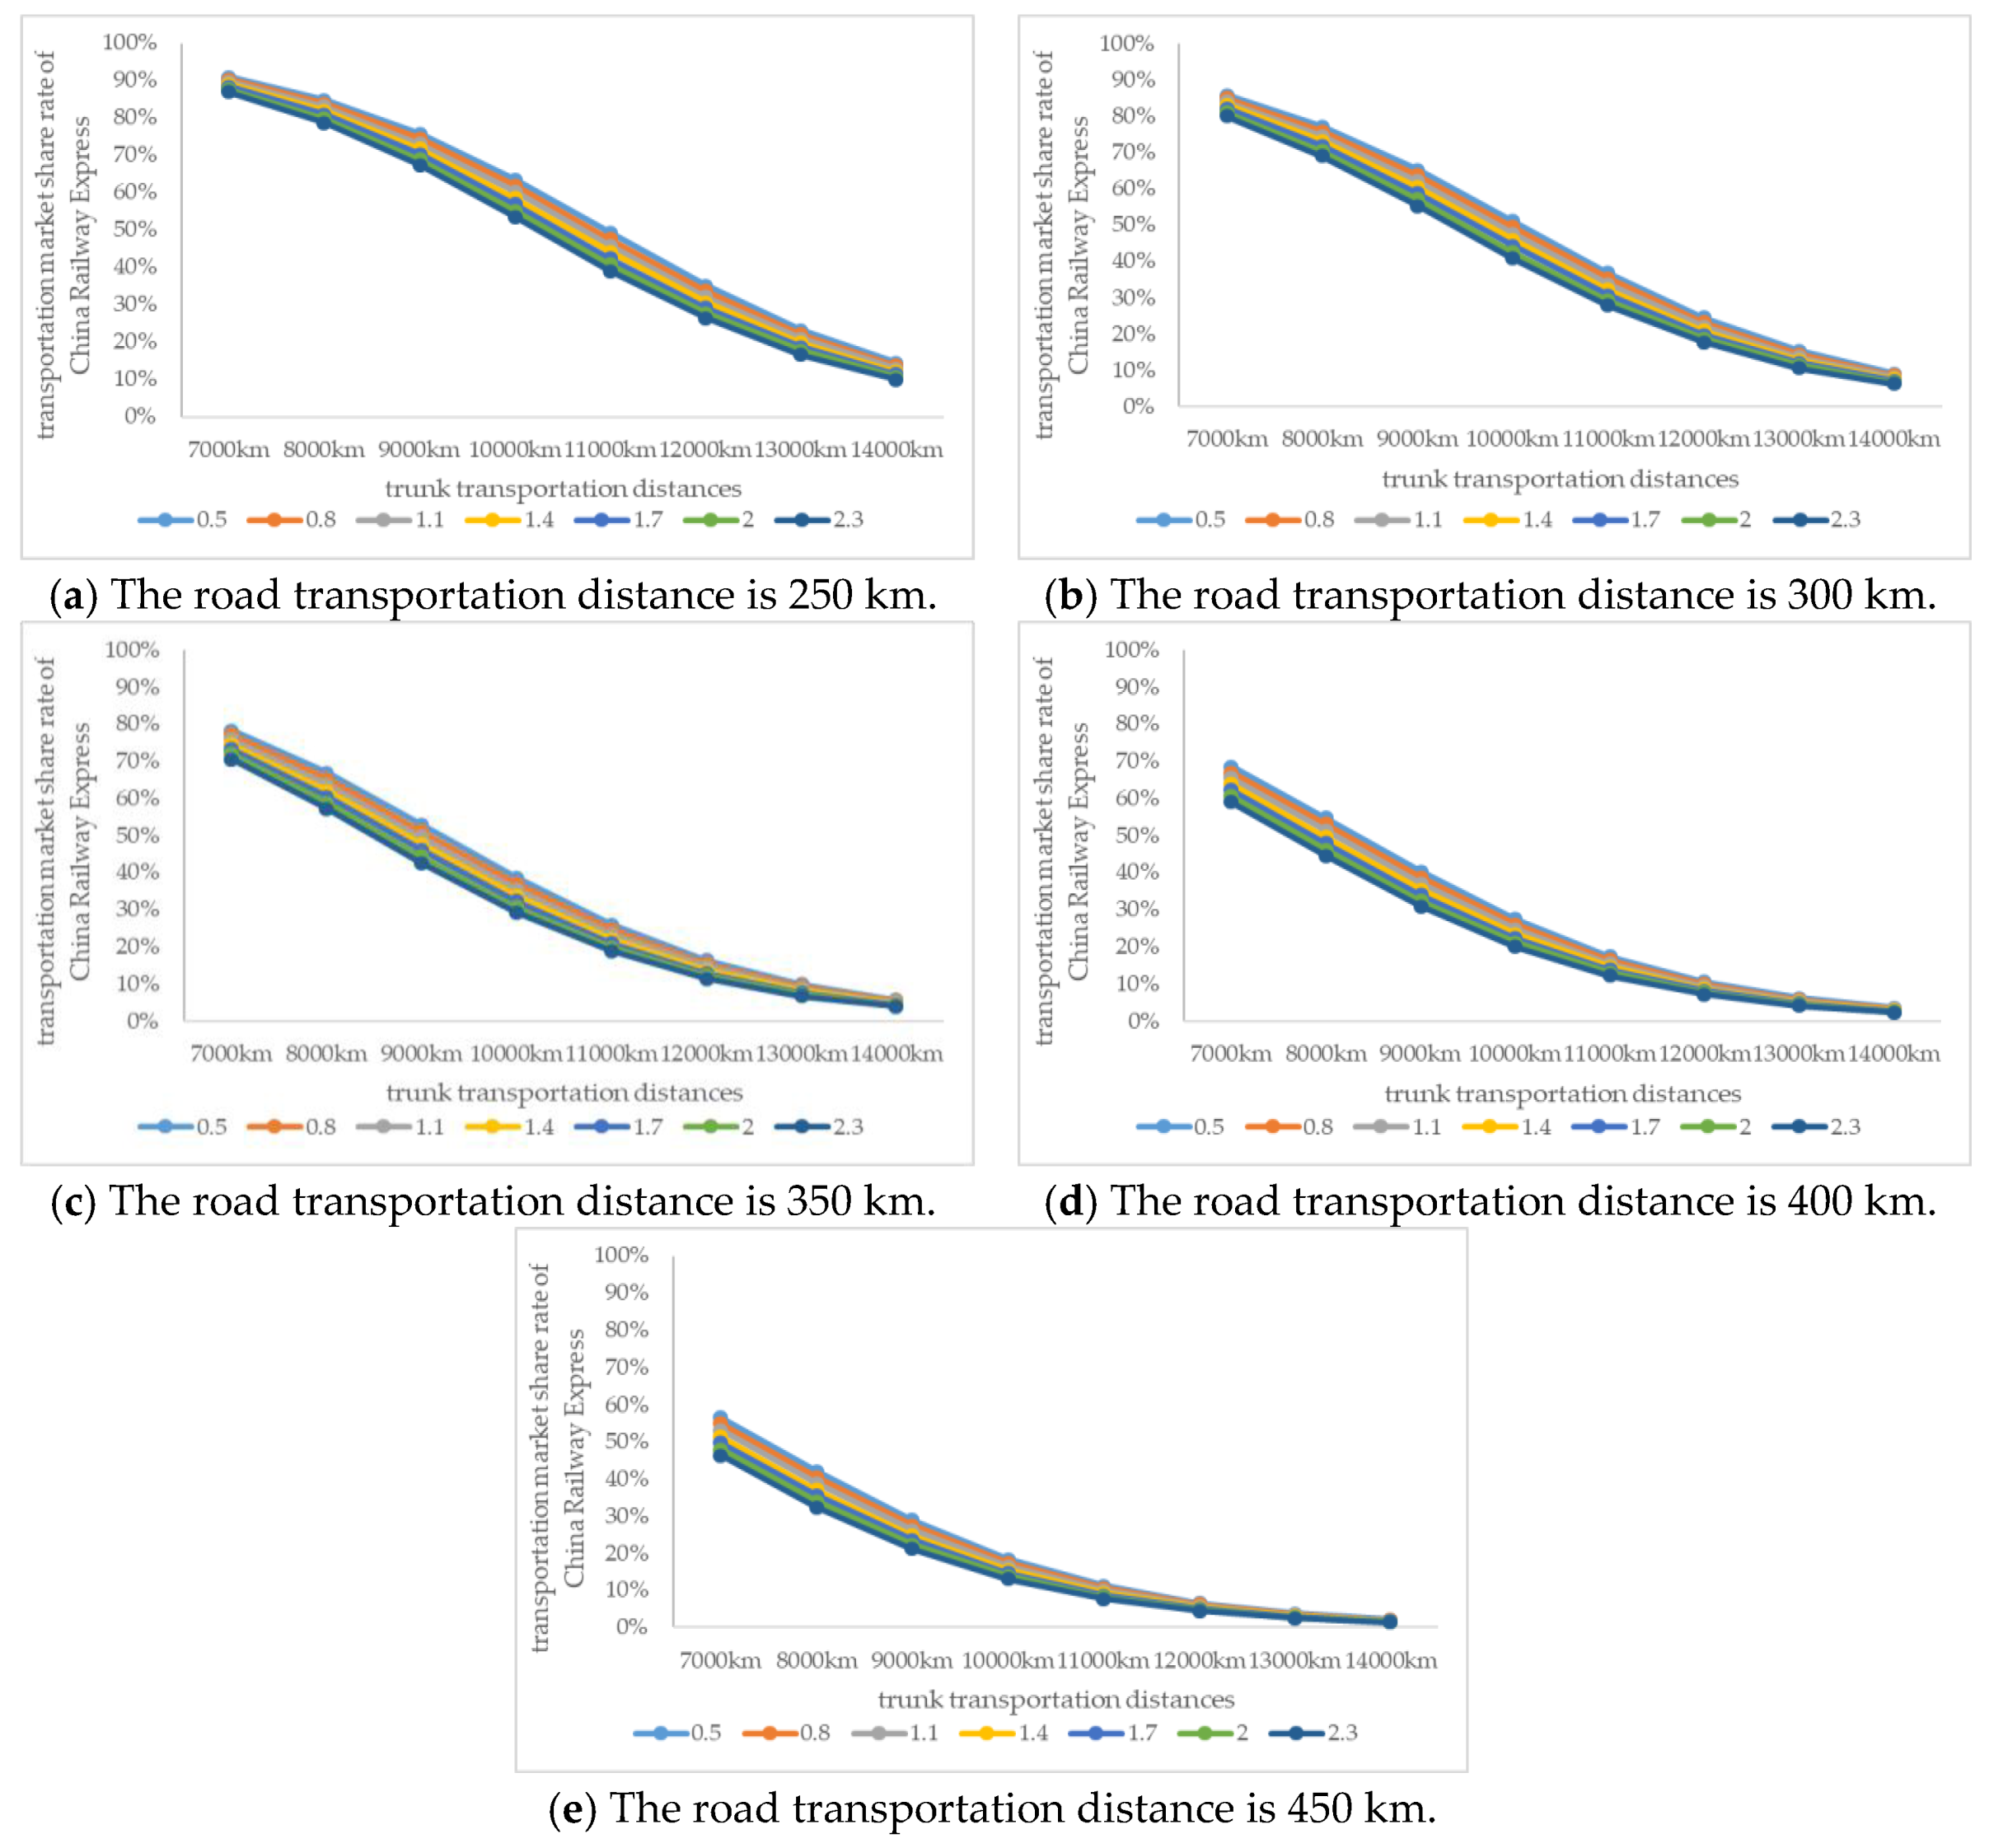
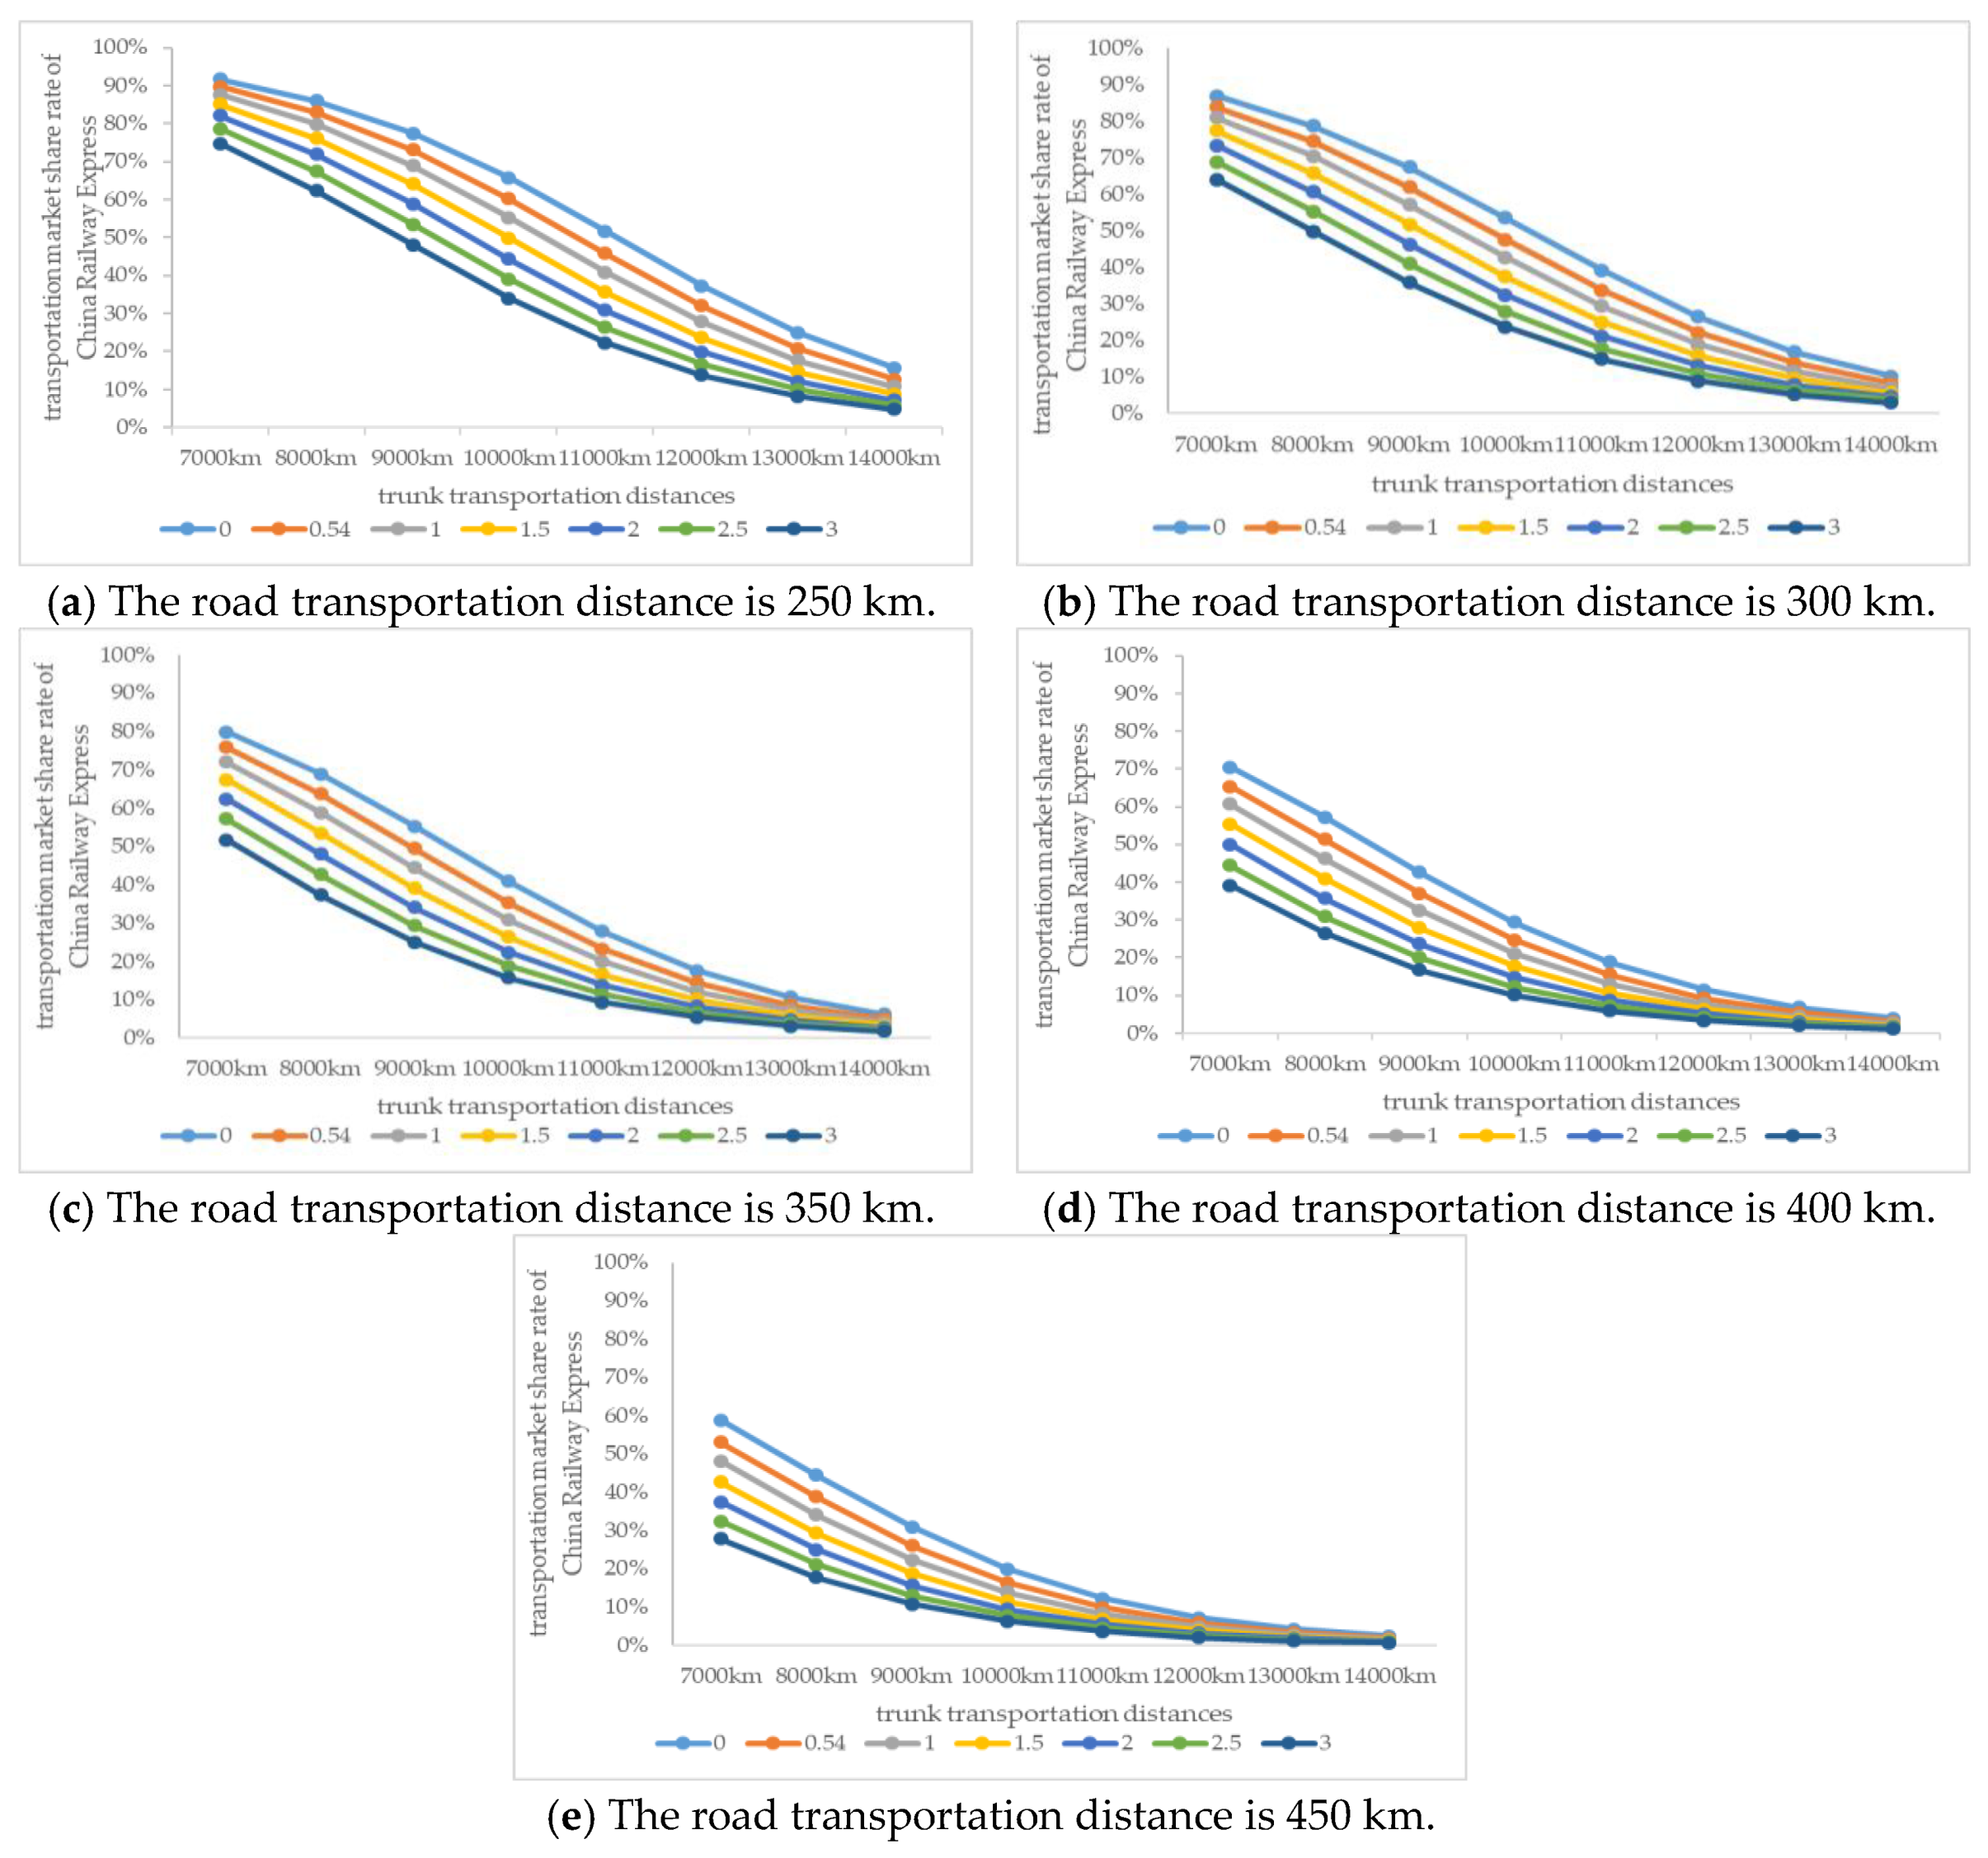
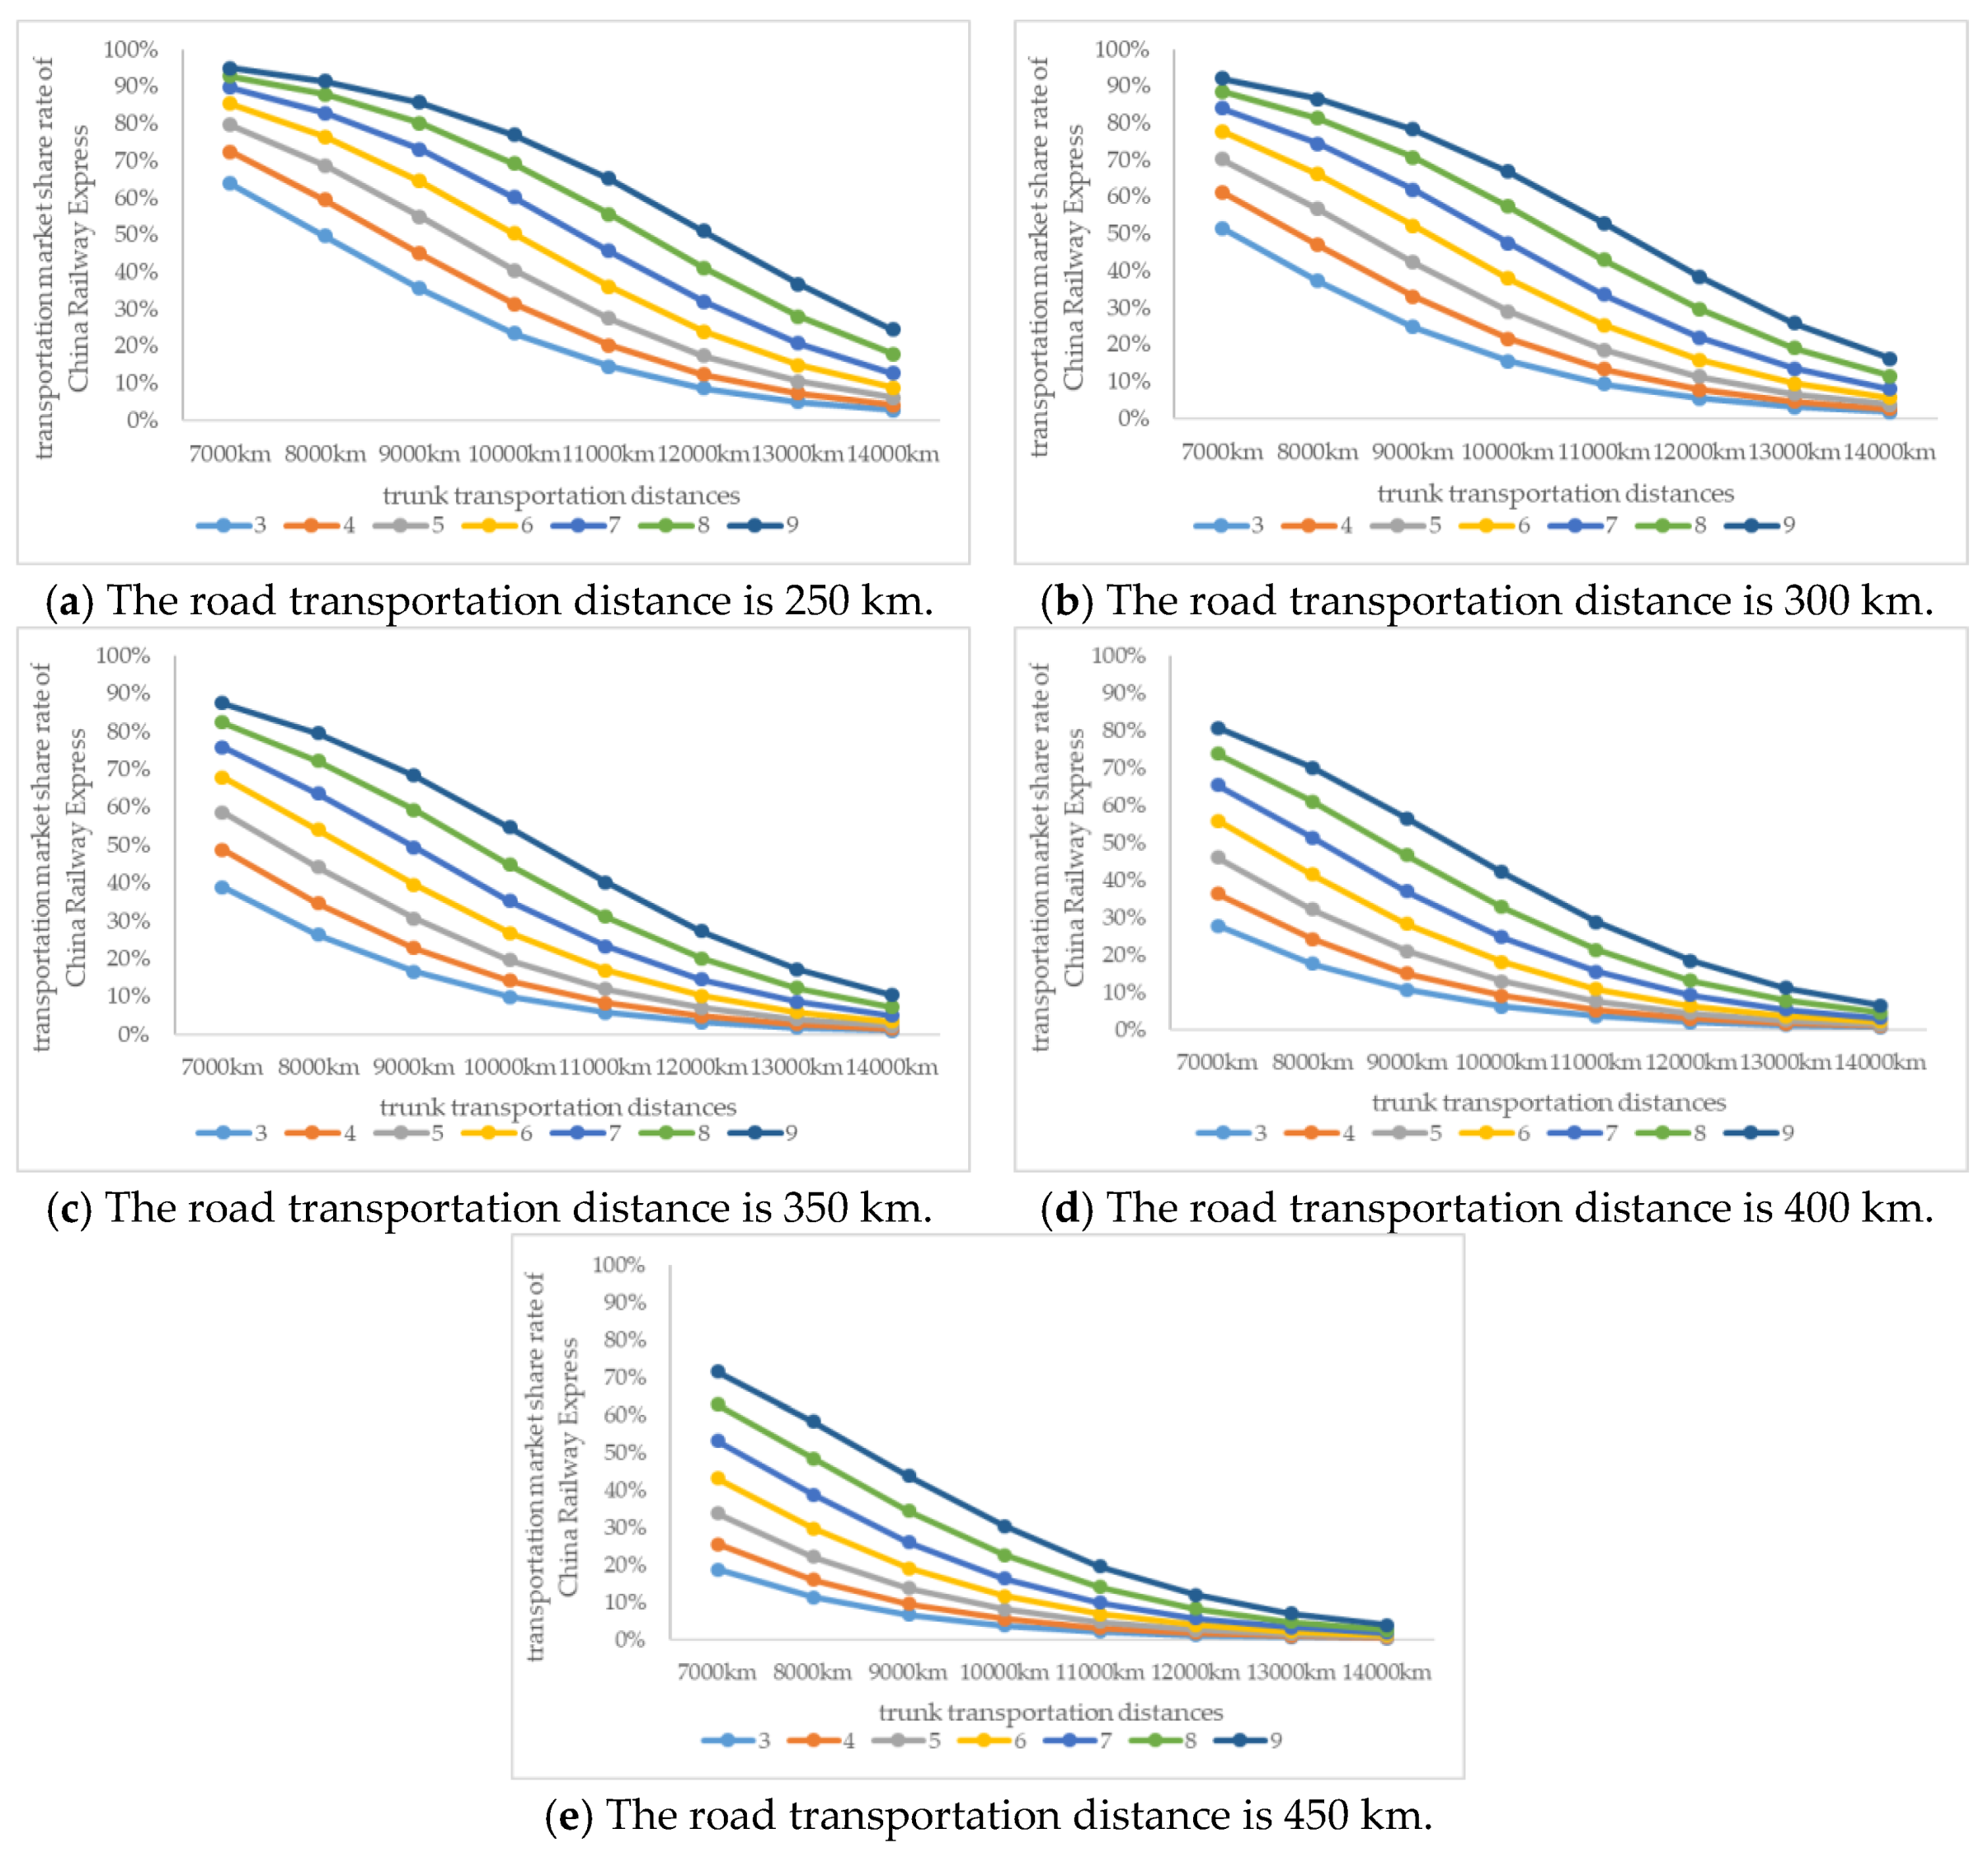
When different influencing factors change in the direction of being beneficial to the sustainable development of China Railway Express, with the different trunk line transportation distances and road transportation distances, the degrees of influence on the China Railway Express transportation market share rate are different. The optimization adjustment of the China Railway Express freight rate helps increase the China Railway Express transportation market share rate the most, the improvement range of which is between 13.6–68.8%. The following factors are the China Railway Express transportation frequency and the China Railway Express carbon emissions per unit. The increases in the share ratio are between 3.7–53.5% and 5.1–42.2%. The optimization adjustment of the China Railway Express service fee and sending operation time at the departure station produces relatively small increases in the share ratio, ranging from (0.8%, 11.3%) and (0.7%, 10.4%). It can be seen that in order to promote the sustainable development of China Railway Express, enhance its competitiveness, and increase the China Railway Express transportation market share ratio, we can select the influencing factors with a better lifting effect to optimize and adjust. The China Railway Express freight rate and carbon emissions per unit are mainly focused on optimizing the adjustment and measuring changes, such as reducing the freight rate, and improving transportation facilities and equipment to reduce carbon emissions, which can effectively increase the China Railway Express transportation market share.
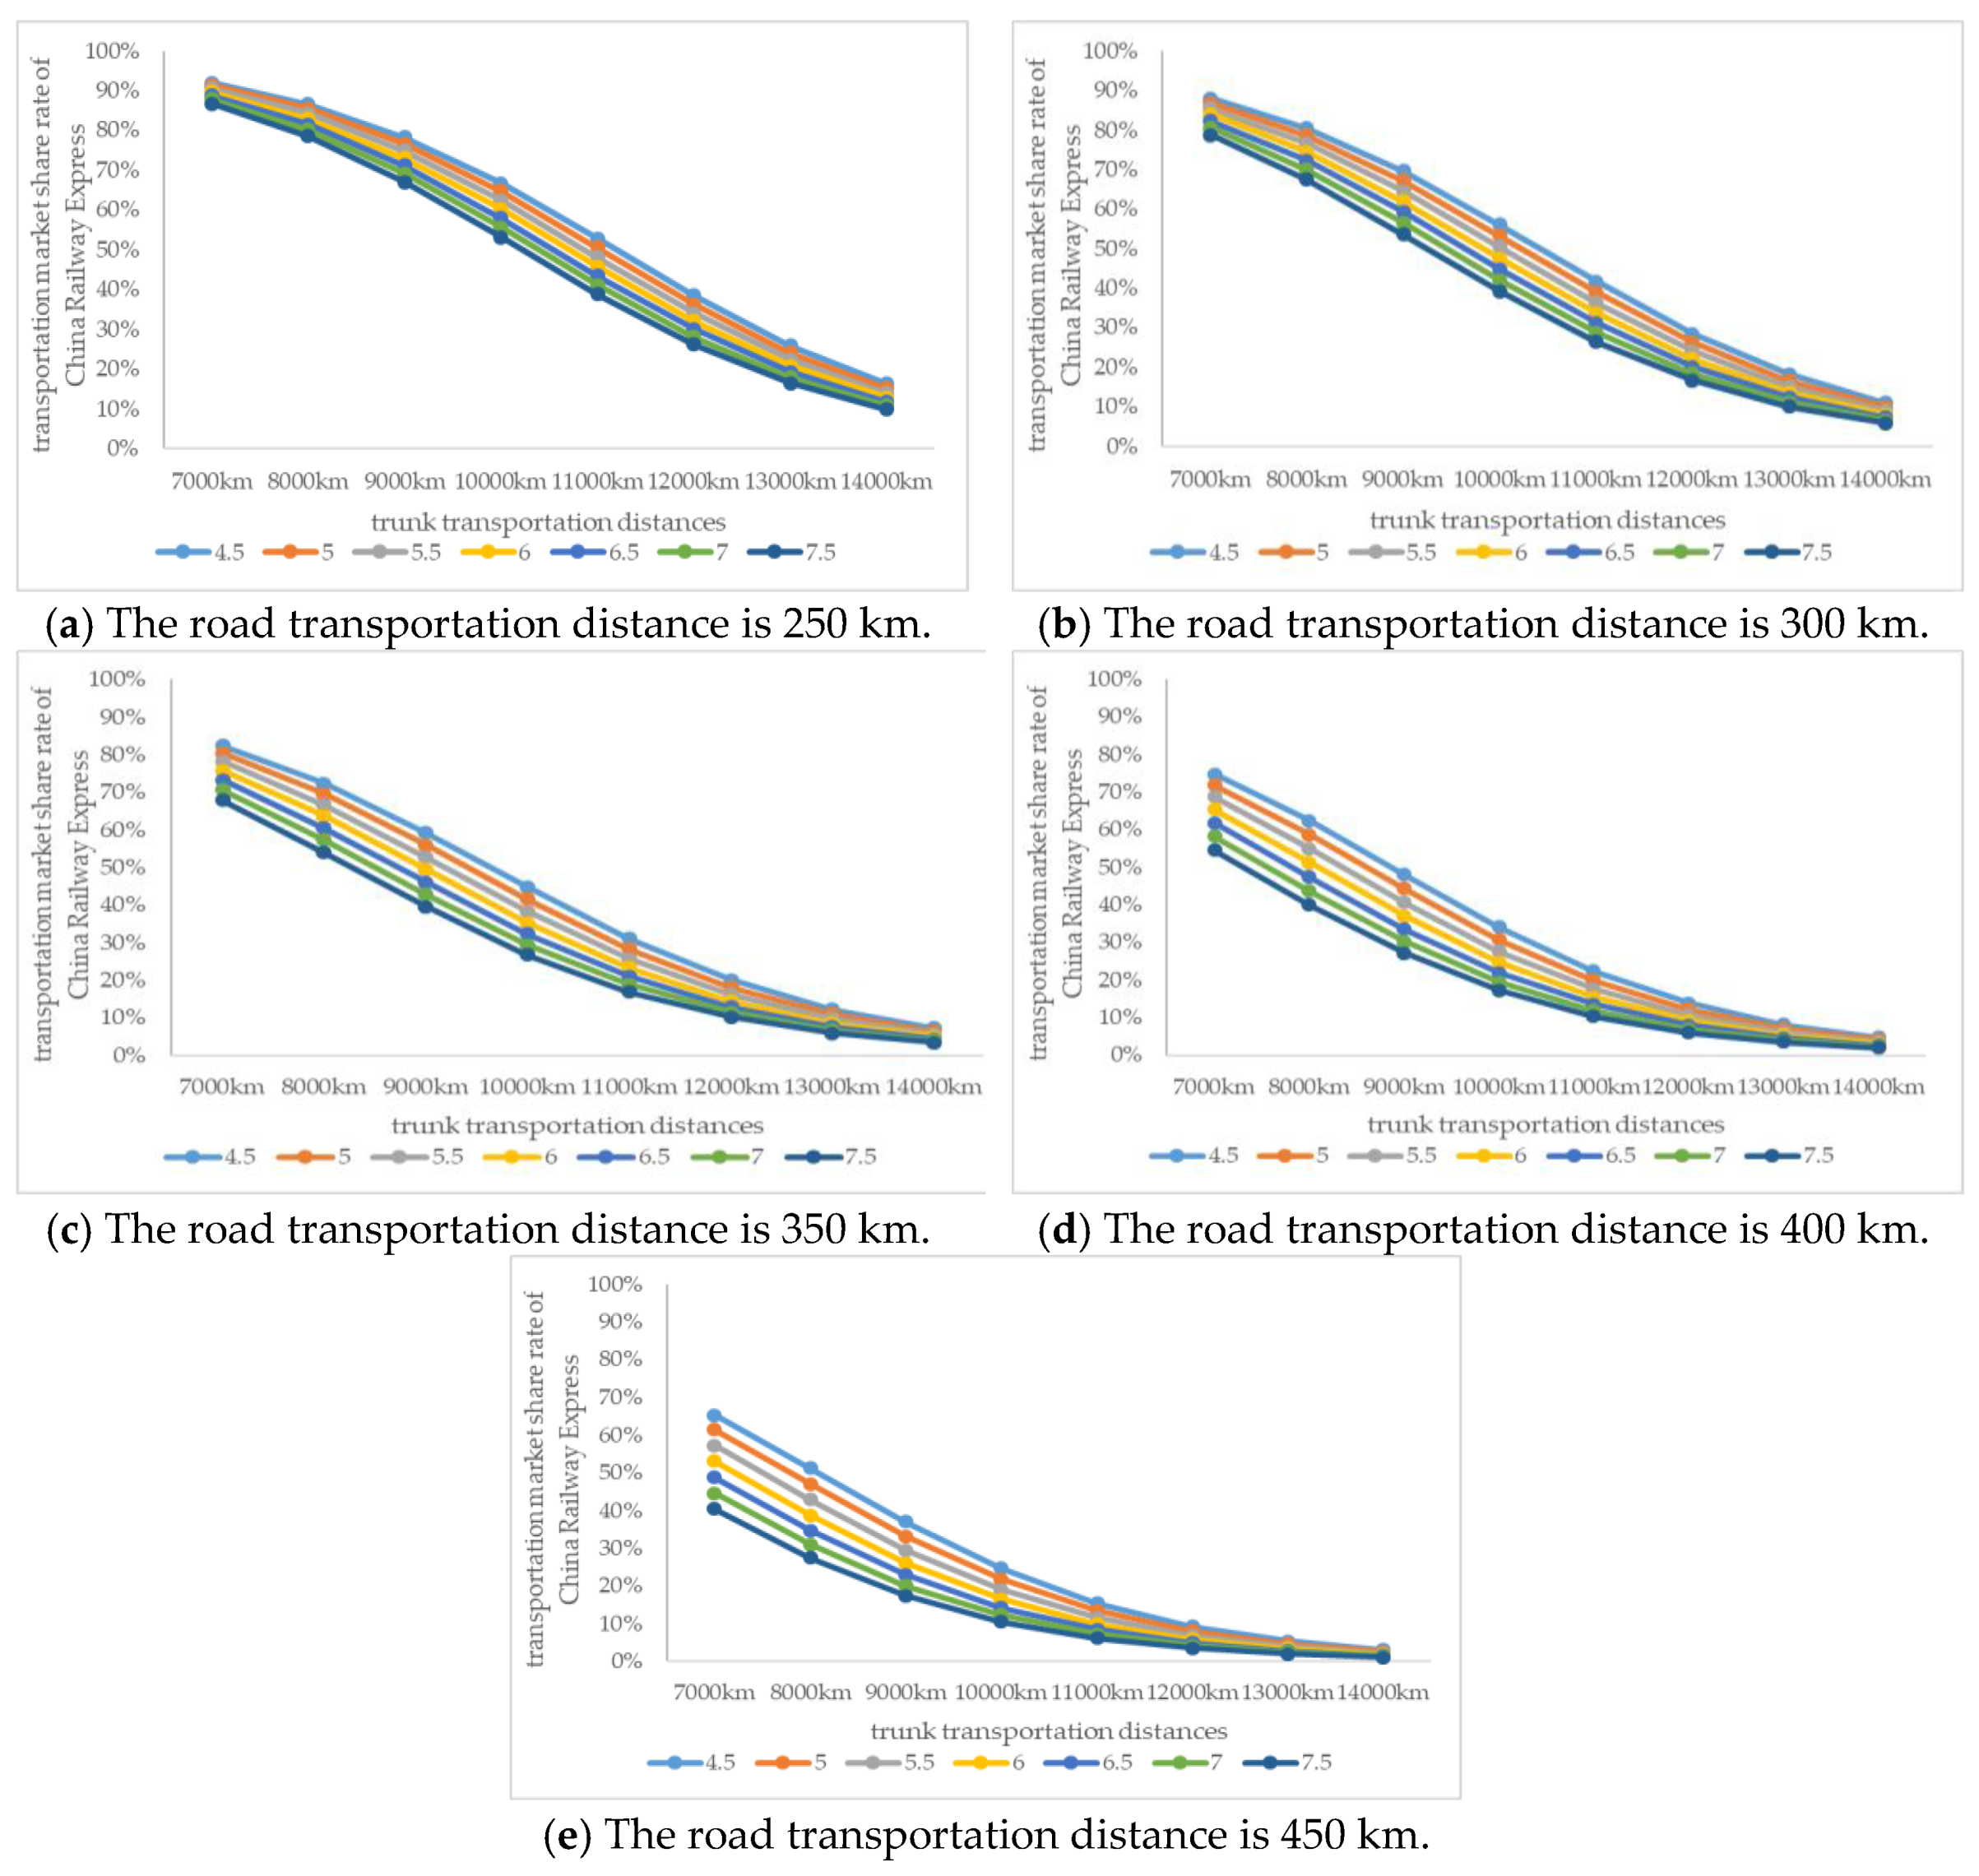
As for the eight influencing factors, when they change in the direction of being beneficial to the sustainable development of China Railway Express, they have different effects on the market share rate as different trunk line transportation distances and road transportation distances. It can be seen that in order to promote the sustainable development of China Railway Express, the optimization and adjustment of various influencing factors need to be closely combined with the actual situation of different trunk line transportation distances and road transportation distances, and based on the impact effects of influencing factors, different adjustment factors should be developed to optimize the adjustment strategy.
Through the elastic analysis of the factors affecting the competitiveness of China Railway Express, it is found that with the different combinations of China Railway Express trunk line transportation distances and road transportation distances, the China Railway Express sending operation time at the departure station and the transportation time error are inelastic for the China Railway Express transportation market share rate, but the China Railway Express freight rate is elastic. In the case of certain combinations of China Railway Express trunk line transportation distances and road transportation distances, the road freight rate, the Express service fee, the travelling speed, the transportation frequency, and the carbon emissions per unit for the China Railway Express transportation market share rate are elastic. This further illustrates that the optimization and adjustment of the freight rate of China Railway Express at the present stage can maximally promote the competitiveness of China Railway Express and its sustainable development.

Author Contributions

Writing, S.L. and M.L. Provision of case and idea, X.Y., M.Z., and M.J. Revision advice, S.T., C.-K.W., and F.B.

Funding

This research received no external funding.

Acknowledgments

Supported by National Key R&D Program of China (2016YFE0201700), National Key R&D Program of China (2018YFB1201402), Zhongshan City Science and Technology Bureau Project (No. 2017B1015), and 2018 Zhongshan Innovation and Development Research Center.

Conflicts of Interest

The authors declare no conflict of interest.

References

  1. Qin, H.; Qin, S.; Zheng, P. Analysis of Supply of Goods for China-Europe Block Train Based on Freight Value. Railw. Freight Transp. 2016, 34, 13–19. [Google Scholar]
  2. Li, J. Study on Countermeasures of Optimizing China-Europe Block Trains under “the Belt and Road” Strategy. Railw. Transp. Econ. 2016, 38, 41–45. [Google Scholar]
  3. Besharati, B.; Gansakh, G.; Zhang, X.; Liu, F.; Xu, M. The Ways to Maintain Sustainable China-Europe Block Train Operation. Bus. Manag. Stud. 2017, 3, 25. [Google Scholar] [CrossRef]
  4. Li, X. Study on Strategies of Improving CHINA RAILWAY Express Based on Product Life Cycle Theory. In Proceedings of the 2018 International Conference on E-commerce and Contemporary Economic Development (ECED 2018), Hangzhou, China, 21 April 2018. [Google Scholar]
  5. Huang, W.; Zhang, X.; Yang, Z. Sustainable Development Model of CHINA RAILWAY Express. In Proceedings of the 2017 International Conference on Economic Development and Education Management (ICEDEM 2017), Dalian, China, 16 December 2017. [Google Scholar]
  6. Sun, X.; Wang, H.; Tong, P. The Analysis on Competitive Environment and Development Strategy of CHINA Railway Express (Xiamen). In Proceedings of the IOP Conference Series: Materials Science and Engineering, Zhuhai, China, 22 June 2018; Volume 392. [Google Scholar]
  7. Wang, J.; Jing, Y.; Wang, C. Study on Better Organization of China-Europe Express Train. Bull. Chin. Acad. Sci. 2017, 32, 370–376. [Google Scholar]
  8. Kostrzewski, M.; Wrona, K. An Evaluation of the Efficiencies and Priorities for Sustainable Development in the Transportation System for the Manufacturing and Trade Industry. Econ. Environ. Stud. 2017, 17, 577–595. [Google Scholar] [CrossRef]
  9. Fu, X.; Zhang, X.; Zou, M.; Fan, D. Analysis on Economics of China-Europe Block Trains based on the Value Model. Railw. Transp. Econ. 2016, 38, 1–5. [Google Scholar]
  10. Zhao, L.; Zhao, Y.; Hu, Q.; Li, H.; Stoeter, J. Evaluation of consolidation center cargo capacity and loctions for China railway express. Transp. Res. Part E Logist. Transp. Rev. 2018, 117, 58–81. [Google Scholar] [CrossRef]
  11. Wen, S.; Zhang, J. Research on Optimization of International Transportation Network in Sino-Europe Based on Location Selection. J. Chongqing Technol. Bus. Univ. (Nat. Sci. Ed.) 2018, 35, 88–96. [Google Scholar]
  12. Wu, G.; Chen, L.; Guo, Q.; Zhang, Y. A Study on the Sustainable Development of China Railway Express in the Strategy of “The Belt and Road”. J. Transp. Eng. Inf. 2017, 15, 1–10. [Google Scholar]
  13. Chen, X. Comparative Research of Multiple Transportation Corridors for Sino-EU Trade in the Background of the Belt and Road Initiative. Logist. Eng. Manag. 2018, 40, 7–11. [Google Scholar]
  14. Sun, H.; Yan, L. The influence of the development of China-European class on the coastal ports of China. China Ports 2018, 311, 27–30. [Google Scholar]
  15. Wang, J.; Jiao, J.; Ma, L. An organizational model and border port hinterlands for the China-Europe Railway Express. J. Geogr. Sci. 2018, 28, 1275–1287. [Google Scholar] [CrossRef] [Green Version]
  16. Jiang, Y.; Sheu, J.; Peng, Z.; Yu, B. Hinterland patterns of China Railway (CR) express in China under the Belt and Road Initiative: A preliminary analysis. Transp. Res. Part E Logist. Transp. Rev. 2018, 119, 189–201. [Google Scholar] [CrossRef]
  17. Kostrzewski, M.; Chudzikiewicz, A. Rail Vehicle and Rail Track Monitoring System—A Key Part in Transport Sustainable Development. Zesz. Nauk. Wyższej Szk. Bank. Wrocławiu 2015, 15, 59–74. [Google Scholar]
  18. Chudzikiewicz, A.; Bogacz, R.; Kostrzewski, M.; Konowrocki, R. Condition monitoring of railway track systems by using acceleration signals on wheelset axle-boxes. Transport 2018, 33, 555–566. [Google Scholar] [CrossRef]
  19. Tang, J. Competitiveness of Container Rail-road Intermodal Transport and Its Improving Strategies in China; Beijing Jiaotong University: Beijing, China, 2018. [Google Scholar]
  20. Wang, Y.; Hao, D.; Li, H.; Luan, X.; Wang, H. Research on Share Rate of Passenger Flow in Railway Transportation Corridor Based on Matching between Supply and Demand. J. China Railw. Soc. 2014, 36, 1–5. [Google Scholar]
  21. Zhou, J.; Li, Z. Forecasting Travel Demand for Combined Bus and Airline Mode: A Case Study of Hubei Province. J. Transp. Syst. Eng. Inf. Technol. 2015, 15, 232–237. [Google Scholar]
  22. Chen, J.; Wang, M.; Li, H.; Duan, L. Choice Behavior of Passenger Transfer Route for Urban Rail Transit Network. J. Transp. Syst. Eng. Inf. Technol. 2017, 17, 235–241. [Google Scholar]
  23. Liu, Y.; Chen, J.; Wu, W.; Ye, J. Typical Combined Travel Mode Choice Utility Model in Multimodal Transportation Network. Sustainability 2019, 11, 549. [Google Scholar] [CrossRef]
  24. Zhou, J.; Wang, Y.; Wu, J. Mode Choice of Commuter Students in a College Town: An Exploratory Study from the United States. Sustainability 2018, 10, 3316. [Google Scholar] [CrossRef]
  25. Czwajda, L.; Kosacka-Olejnik, M.; Kudelska, I.; Kostrzewski, M.; Sethanan, K.; Pitakaso, R. Application of prediction markets phenomenon as decision support instrument in vehicle recycling sector. LogForum 2019, 15, 265–278. [Google Scholar]
  26. Wang, J.; Guan, F.; Li, T.; Wang, C.; Han, Q.; Yu, B. Optimization of the Waterbus Operation Plan Considering Carbon Emissions: The Case of Zhoushan City. Sustainability 2015, 7, 10976–10993. [Google Scholar] [CrossRef] [Green Version]
  27. Han, Y.; Li, W.; Wei, S.; Zhang, T. Research on Passenger’s Travel Mode Choice Behavior Waiting at Bus Station Based on SEM-Logit Integration Model. Sustainability 2018, 10, 1996. [Google Scholar] [CrossRef]
  28. Larranaga, A.M.; Arellana, J.; Senna, L.A. Encouraging intermodality: A stated preference analysis of freight mode choice in Rio Grande do Sul. Transp. Res. Part A Policy Pract. 2017, 102, 202–211. [Google Scholar] [CrossRef]
  29. Arunotayanun, K.; Polak, J.W. Taste heterogeneity and market segmentation in freight shippers’ mode choice behaviour. Transp. Res. Part E Logist. Transp. Rev. 2011, 47, 138–148. [Google Scholar] [CrossRef]
  30. Nader, M.; Kostrzewski, A.; Kostrzewski, M. Technological conditions of intermodal transhipment terminals in Poland. Arch. Transp. 2017, 41, 73–88. [Google Scholar] [CrossRef]
  31. Zhang, R.; Zhu, L.; Tao, X. Analysis of Rao Yong Transportation Chain Choice Based on Mixed Multinomial Logit Model. J. Transp. Syst. Eng. Inf. Technol. 2014, 14, 138–143. [Google Scholar]
  32. Bergantinoa, A.S.; Bierlaireb, M.; Catalanoc, M.; Migliorec, M.; Amorosoc, S. Taste heterogeneity and latent preferences in the choice behavior of freight transport operators. Transp. Policy 2013, 30, 77–91. [Google Scholar] [CrossRef]
  33. Feo, M.; Raquel Espino, R.; García, L. An stated preference analysis of Spanish freight forwarders modal choice on the south-west Europe Motorway of the Sea. Transp. Policy 2011, 18, 60–67. [Google Scholar] [CrossRef]
  34. Manchala, R. A nested logit model of mode choice for inland movement of export shipments: A case study of containerized export cargo from India. Res. Transp. Econ. 2013, 38, 91–100. [Google Scholar]
  35. Samimia, A.; Kawamurab, K.; Mohammadianc, A. A behavioral analysis of freight mode choice decisions. Transp. Plan. Technol. 2011, 34, 857–869. [Google Scholar] [CrossRef]
  36. Wang, X.; Meng, Q. Discrete intermodal freight transportation network design with route choice behavior of intermodal operators. Transp. Res. Part B Methodol. 2017, 95, 76–104. [Google Scholar] [CrossRef]
  37. Nugroho, M.T.; Whiteing, A.; Jong, G. Port and Inland Mode Choice from the Exporters’ and Forwarders’ Perspectives: Case Study-Java, Indonesia. Res. Transp. Bus. Manag. 2016, 19, 73–82. [Google Scholar] [CrossRef]
  38. Tsai, S.-B. Using the DEMATEL Model to Explore the Job Satisfaction of Research and Development Professionals in China’s Photovoltaic Cell Industry. Renew. Sustain. Energy Rev. 2018, 81, 62–68. [Google Scholar] [CrossRef]
  39. Lee, Y.C.; Hsiao, Y.C.; Peng, C.F.; Tsai, S.B.; Wu, C.H.; Chen, Q. Using Mahalanobis-Taguchi System, Logistic Regression and Neural Network Method to Evaluate Purchasing Audit Quality. Proc. Inst. Mech. Eng. Part B J. Eng. Manuf. 2015, 229, 3–12. [Google Scholar] [CrossRef]
  40. Lee, Y.C.; Chen, C.Y.; Tsai, S.B.; Wang, C.T. Discussing green environmental performance and competitive strategies. Pensee 2014, 76, 190–198. [Google Scholar]
  41. Liu, B.; Li, T.; Tsai, S.B. Low carbon strategy analysis of competing supply chains with different power structures. Sustainability 2017, 9, 835. [Google Scholar] [CrossRef]
  42. Qu, Q.; Tsai, S.B.; Tang, M.; Xu, C.; Dong, W. Marine ecological environment management based on ecological compensation mechanisms. Sustainability 2016, 8, 1267. [Google Scholar] [CrossRef]
  43. Lee, Y.C.; Wang, Y.C.; Chien, C.H.; Wu, C.H.; Lu, S.C.; Tsai, S.B.; Dong, W. Applying revised gap analysis model in measuring hotel service quality. SpringerPlus 2016, 5, 1191. [Google Scholar] [CrossRef] [Green Version]
  44. Wang, J.; Yang, J.M.; Chen, Q.; Tsai, S.B. Collaborative Production Structure of Knowledge Sharing Behavior in Internet Communities. Mob. Inf. Syst. 2016, 2016, 8269474. [Google Scholar] [CrossRef]
  45. Tsai, S.B.; Lee, Y.C.; Guo, J.J. Using modified grey forecasting models to forecast the growth trends of green materials. Proc. Inst. Mech. Eng. Part B J. Eng. Manuf. 2014, 228, 931–940. [Google Scholar] [CrossRef]
  46. Tsai, S.B.; Zhou, J.; Gao, Y.; Wang, J.; Li, G.; Zheng, Y.; Ren, P.; Xu, W. Combining FMEA with DEMATEL Models to Solve Production Process Problems. PLoS ONE 2017, 12, 0167710. [Google Scholar] [CrossRef] [PubMed]
  47. Ge, B.; Jiang, D.; Gao, Y.; Tsai, S.B. The influence of legitimacy on a proactive green orientation and green performance: A study based on transitional economy scenarios in China. Sustainability 2016, 8, 1344. [Google Scholar] [CrossRef]
  48. Wang, J.; Yang, J.; Chen, Q.; Tsai, S.B. Creating the sustainable conditions for knowledge information sharing in virtual community. SpringerPlus 2016, 5, 1019. [Google Scholar] [CrossRef] [PubMed]
  49. Guo, X. Route Optimization of China-EU Container Multimodal Transport Considering Various Factors; Zhengzhou University: Zhengzhou, China, 2017. [Google Scholar]
Figure 1. China Railway Express line layout.
Sustainability 11 02896 g001
Figure 2. The China Railway Express Transportation Line.
Sustainability 11 02896 g002
Figure 3. The whole process of China Railway Express.
Sustainability 11 02896 g003
Figure 4. The China–Europe Shipping Transportation Line.
Sustainability 11 02896 g004
Figure 5. The whole process of China–Europe Shipping.
Sustainability 11 02896 g005
Figure 6. The impact of the China Railway Express freight rate on the transportation market share rate.
Sustainability 11 02896 g006
Figure 7. The impact of the road freight rate on the transportation market share rate.
Sustainability 11 02896 g007
Figure 8. The impact of the China Railway Express service fee on the transportation market share rate.
Sustainability 11 02896 g008
Figure 9. The impact of the China Railway Express travelling speed on the transportation market share rate.
Sustainability 11 02896 g009
Figure 10. The impact of the sending operation time at the departure station on the transportation market share rate.
Sustainability 11 02896 g010
Figure 11. The impact of the China Railway Express transportation time error on the transportation market share rate.
Sustainability 11 02896 g011
Figure 12. The impact of the China Railway Express transportation frequency on the transportation market share rate.
Sustainability 11 02896 g012
Figure 13. The impact of the China Railway Express carbon emissions per unit on the transportation market share rate.
Sustainability 11 02896 g013aSustainability 11 02896 g013b
Figure 14. Elastic analysis of the different influencing factors of the China Railway Express transportation market share rate.
Sustainability 11 02896 g014
Table 1. Economic parameter values.
Road Freight 1: yuan/TEU 5Road Freight 2: yuan/(TEU·km)Services Fees: yuanTrunk Line Transportation Fee: yuan/(TEU·km)Average Road Distance: kmAverage Trunk Distance: kmTotal: yuan
Railway 1561900 12.716 3350 41024531840.4
Shipping1563237 20.2903502131311532.8
1 China Railway Express service fees include the customs declaration fee, customs clearance fee, container loaded fee, document fee, customs sealing fee, other operations fee, etc. 2 China–Europe Shipping service fees include the booking fee, port operation fee, customs declaration fee, document fee, customs sealing fee, container operation fee, information entry fee, customs clearance fee, container loaded fee, etc. 3 China Railway Express trunk line transportation fee contains domestic government subsidies. 4 The average road distance is half of the distance between the Zhengzhou departure station of China Railway Express and Tianjin Port. 5 The TEU means twentyfoot equivalent unit.
Table 2. Timeliness parameter values. Unit: day.
Road Short-Distance Transportation Time 1Sending Time 2Trunk Line Transportation TimeTotal
China Railway Express11.1115.3217.43
China–Europe Shipping12.335.4138.71
1 Road short-distance transportation time includes the goods loaded into the container time, the road transportation time, and the container arriving in the station or port time. 2 Sending time includes the customs inspection time and the container loaded operation time.
Table 3. Carbon emission parameters for different modes of transportation.
Modes of TransportationUnit Fuel Usage 1: kg/tkm2Calorific Value: Kcal/kgOriginal Emission Coefficient of Diesel Fuel: kg CO 2 /KcalCarbon Oxidation Factor
Railway transportation0.046888000.000311
Road transportation0.073388000.000311
Shipping0.059288000.000311
1 The values of unit fuel usage are from reference [38]. 2 The tkm means ton kilometer.
Table 4. Environmental protection parameter values.
Average Trunk Distance: kmAverage Road Distance: km20-foot Standard Container Average Weight: tCarbon Emissions Total: kg CO 2
Railway10,2453502027,559.40
Shipping21,3133502070,239.70
Table 5. The Parameters Solving of China Railway Express and China–Europe Maritime Competitiveness Model.
Economic UtilityTimeliness UtilityReliability UtilityConvenience UtilityEnvironmental Protection UtilitySafetyGeneralized Cost UtilityTransportation Market Share
Railway −24.20−4.04−0.242.79−3.7999.85%−29.4731.21%
Shipping−8.76−8.96−1.810.40−9.6699.60%−28.6868.79%

