Article

Research on the Spatial–Temporal Synthetic Measurement of the Coordinated Development of Population-Economy-Society-Resource-Environment (PESRE) Systems in China Based on Geographic Information Systems (GIS)

1
College of Geography and Environmental Science, Northwest Normal University, Lanzhou 730070, China
2
Information Center for Global Change Studies, Lanzhou Information Center of Chinese Academy of Sciences, Lanzhou 730000, China
3
Institute for County Economy Developments & Rural Revitalization Strategy, Lanzhou University, Lanzhou 730000, China
*
Authors to whom correspondence should be addressed.
Sustainability 2019, 11(10), 2877; https://doi.org/10.3390/su11102877
Submission received: 8 April 2019 / Revised: 18 May 2019 / Accepted: 20 May 2019 / Published: 21 May 2019

Abstract

:
The issue of how to realize the coordinated development of various elements in human–land systems, or, in other words, how to achieve the coordinated development of population-economy-society-resource-environment (PESRE) systems, has become an important topic, which has received global attention. This study takes 31 provinces in China as the research objects, and carries out the research on the spatial–temporal synthetic measurement of the coordinated development of PESRE systems. The conclusions are as follows. From 1995 to 2015, the process of change of coupling coordination degree of China’s PESRE systems can be divided into two types: Rising first and then declining, and fluctuant continuously. The number of provinces of the first type was higher, and most provinces were on the verge of uncoordinated development status or in a weakly coordinated development status. The coupling degree of PESRE systems at the provincial level in China generally shows some positive spatial correlations, and the level of coordinated development displays some obvious spatial aggregation patterns. Moreover, the degree of such aggregation first increases and then weakens. The eastern parts of China represent the main “high-high” type aggregation regions. The central and western parts of China represent the main “low-low” types, account for the largest proportion, and display obvious aggregation characteristics.

1. Introduction

Since the start of the Industrial Revolution in the 18th century, mankind has made some amazing achievements in transforming nature and promoting economic development. However, rapid global economic growth has also put tremendous pressure on the resource environment [1]. As economic and social development continues, environmental issues and problems keep emerging. In this context, the world’s limited natural resources are in danger of being depleted due to overexploitation, and the deteriorating environment could significantly reduce ecosystem functions and services. The conflicts of various elements in human–land systems are becoming more prominent, and the effects of negative feedback are accumulating [2]. Therefore, the issue of how to realize the coordinated development of various elements in human–land systems, or, in other words, how to achieve the coordinated development of population-economy-society-resource-environment (PESRE) systems, has become an important topic, which has received global attention [3]. The meaning of coordinated development is a complex interaction between the subsystems of population, economy, society, resources, and environment. Since China has reformed and opened up its economy, it has achieved great economic prosperity. However, its emerging ecological and environmental problems are worsening, and the development of its population, economy, society, natural resources, and ecological environment have become unbalanced [4]. Therefore, the successful coordination of the relationship between development (i.e., population, economic, and societal development) and protection (i.e., natural resource utilization and environmental protection), and the effective resolution of conflicts within the above-mentioned five systems, has become one of the most urgent challenges facing China [5]. Thus, the coordinated and sustainable development of China’s PESRE systems has become the basic guiding ideology for its economic and social development, and is currently the basic strategy for national development. This is also called the Chinese term “eco-civilization”. This study focuses on the patterns and processes that link human and natural systems and the reciprocal interactions and feedbacks (both the effects of humans on the environment and the effects of the environment on humans) based on the theory of Coupled Human and Natural Systems (CHANS), which are systems about human and natural components interact. And then, the problems of existing in CHANS are found, so as to draft effective prevention and control strategies [6].
Thinking about the coordinated development of PESRE systems originated in the late 1950s–1970s as people began to have a deeper understanding of resource and environmental issues [7]. During this period, the economy grew rapidly, but the weakness of the traditional economic development models also became increasingly apparent. Thus, how to achieve a coordinated development that sustains economic and social development, while simultaneously protecting natural resources and the ecological environment, has become an important topic [8]. From the 1980s to the mid-1990s, with the concept of sustainable development proposed for the first time, our understanding of the relationship between population, economy, society, natural resources, and the ecological environment increased gradually. Many scholars tend to agree that the coordinated development between population, economy, society, natural resources, and the ecological environment is essential [9,10,11]. In 1987, the concept of sustainable development was first proposed in the World Commission on Environment and Development (WCED) report “Our Common Future” [12]. Since then, the entire world has begun to consider the coordinated development of human–land compound systems based on the idea of sustainable development. In 1990, Norgaard [13] argues that a common development of the social and the ecological subsystem can take place by feedback loops. It is believed that through such feedback loops, mutual development can be achieved between ecological and social systems. Since the mid-1990s, research on the coordinated development of PESRE systems has experienced rapid growth. With the gradual expansion of relevant research, the quantitative measurement of the coordinated development levels of population-economic-social-resource-environment systems has become a central topic in the field, and a range of research findings on coordinated development measurement theory and practice have emerged [14,15,16,17]. The key part of the quantitative measurement of coordinated development degree is the establishment of measurement models and index systems. Therefore, the primary focus of most research is on the development of relevant models and index systems. Research on measurement models mainly focuses on neoclassical growth models, endogenous growth models, input–output models, environmental computable general equilibrium (CGE) models, environmental Kuznets curve models, and comprehensive evaluation models [18,19,20,21]. On the one hand, the existing models are adjusted, revised and expanded, whereas on the other hand, new models are established and developed. In general, these evaluation models for PESRE systems coordinated development mainly focus on the single method, and rarely combine multiple methods for consideration, so which cannot evaluate PESRE systems-coordinated development comprehensively. As for index systems, the core research area and major challenge lies in identifying the specific correlation between various indexes and the overall goal of coordinated development, as well as the weighted values and threshold of these indexes [22,23,24]. Consequently, a large number of studies have been carried out, and different countries, regions, research institutions, and scholars have proposed and developed their own index systems. For example, the United Nations Commission on Sustainable Development (CSD) has developed a set of index systems that can be applied worldwide, which include 134 indexes that belong to four dimensions; namely, social, economic, environmental, and institutional dimensions [25]. The European Parliament proposed the index systems for European regions, which is based on 42 structural indexes [26]. Additionally, the United Kingdom, Germany, the United States, and several other European and American countries have also proposed their own index systems [27,28,29]. From an international perspective, how to establish a feasible measurement model and index system for the assessment of the coordinated development degree, and how to decide whether human activities have promoted the realization of the coordinated development of regional PESRE systems, are some of the main and most important topics for the current research on coordinated development.
Since the mid-1980s, research on the coordinated development of China’s PESRE systems has begun to track the trend of international research [30]. Mao [3] first proposed the theory of coordinated development of the population-resources-environment-development (PRED) system in 1991, and provided the main criteria for deciding whether the regional PRED system is developed in a coordinated manner. At present, research on the coordinated development of China’s PESRE systems is generally consistent with the global trends, with the quantitative measures of coordinated development as the primary focus. Specifically, the main research areas include the establishment of measurement models and index systems from both theoretical and practical aspects. The theoretical work mainly focuses on the revision of relevant theoretical models, the development of the design evaluation systems, and the widening of the research scope. Furthermore, the development of index systems for assessing the coordinated development degree [31,32], the theoretical analysis of the coordinated development of the PRED system [33,34], and the evaluation and discrimination methods of coordinated development are all major research topics [35,36]. Practical research includes the testing the coordinated development levels of local PRED systems [37,38], and the evolution of regional coordination development through time [39,40]. There are some similarities between the coordinated development analysis used in this paper and other methods of measuring sustainable development. For example, sustainable wellbeing index (SWI) covers three aspects which are economy, nature, and society; ecological footprint (EF) includes the consumption of resources and the quantity of land and water; and the human sustainable development index (HSDI) also includes three aspects which are economy, society, and environment [14,41]. The coordinated development analysis of this paper also includes these aspects, and furthermore, we can find out whether the development of each subsystem is harmonious or not, and which subsystem needs to be improved by the analysis of coordinated development.
Most of the current research is conducted along the dimension of either time or space. Additionally, a larger number of studies are conducted along the temporal dimension than along the spatial dimension. Moreover, synthetic measurements that considers spatial–temporal dimensions, especially synthetic measurement studies that apply geographic information systems (GIS) technology and test the evolution patterns and characteristics of coordinated development along spatial–temporal dimensions, are very limited. This study aims to make up for such a gap in the extant research.
Our study takes 31 provinces (municipalities and autonomous regions) in China as the research objects, establishes measurement models and index systems based on GIS technology and a range of quantitative analysis methods, and carries out the research on the spatial–temporal synthetic measurement of the coordinated development of PESRE systems by these models and methods. On the one hand, this research supplements and improves current studies on the human–land relationship from both theoretical and empirical perspectives, and can help enrich the theoretical content of human geography with a strong theoretical significance. On the other hand, it can provide theoretical support and a decision-making basis for China’s coordinated development within human–land systems and for the country’s development in a sustainable manner. Therefore, our study also has a strong practical significance.

2. Research Methods and Collected Data

2.1. Research Index and Data

2.1.1. The Index System and Data Sources

Due to the ambiguity of sustainable development, the plurality of purpose in characterizing and measuring sustainable development, and the confusion of terminology, data, and methods of measurement, there are no indicator sets that are universally accepted, and different regions, countries, and organizations have formulated their own indicators to evaluate it, as well as some scholars having conducted research and evaluation on these indicators [42]. Based on the findings of the existing research [43,44,45], with a full consideration of the characteristics of China’s actual development, and following the principles of comprehensiveness, effectiveness, systematicity, representativeness, independence, and accessibility, and a more comprehensive evaluation index system was established, which could reflect the coordinated development level of China’s population, economy, society, natural resources, and environmental systems. In this paper, the indicators were obtained by integrating the indicators in existing literature achievements which did not fully involve the five aspects of population, economy, society, resources, and environment. The indicators including all five subsystems were also established, which are more comprehensive.
The coordinated development evaluation index system includes five systems which are population, economy, society, resources, and environment. There were nine indexes selected in population system, based on population size, structure, and quality. There were eight indexes selected in economy system, based on economic size, structure, and benefit. There were 11 indexes selected in society system, based on people’s quality of life and social development level. There were 8 indexes selected in resources system, based on resource conditions and resource utilization. There were 14 indexes selected in environment system, based on environmental pollution, environment protection and management, and ecological environment construction (Table 1).
Relevant data from the years 1995, 2000, 2005, 2010, and 2015 were selected for the present study. The data were obtained from the China Statistical Yearbook, China Environmental Statistics Yearbook, Statistical Collection of Sixty Years of New China, and statistical yearbooks of provinces, municipalities, and autonomous regions, statistical bulletins for national economic and social development, and environmental quality bulletins [46,47,48]. The original data are listed in the Supplementary Materials.

2.1.2. Data Standardization

To ensure data quality and reduce unnecessary variation, the original data need to be standardized, with the calculation formula as References [40,49]:
Positive   index :   r i j = x i j x m i n x m a x x m i n
Negative   index :   r i j = x m a x x i j x m a x x m i n
where rij represents the standardized value of xij; xij represents the actual value of the ith index in jth research area; and xmax and xmin refer to the maximum and minimum value of the same index at different times, respectively.

2.2. The Coupling Coordination Degree Measurement

2.2.1. Coupling Coordination Models

Coupling coordination models were introduced following the basic steps shown below [50]:
1)
Calculate the comprehensive evaluation index of each subsystem using the following formula:
U g = i = 1 m μ i r i j
where μ i is the weighted value of the ith index; rij is the standardized value of the ith index within the jth research area; m is the number of index in subsystem; and U g is the synthetic assessment index of the gth subsystem.
2)
Calculate the coupling degree of the five major systems, namely, population, economy, society, resources, and environment systems using the following formula:
C = { M   ×   N   ×   X   ×   Y   ×   Z [ ( M + N + X + Y + Z ) / 5 ] 5 } 1 / 5
where C is the coupling degree, with its value in the range of 0 and 1; and M ,   N ,   X ,   Y ,   and   Z represent the synthetic assessment index of the population, economy, society, resources, and environment subsystems, respectively.
3)
Calculate the coupling coordination degree in order to evaluate the level of the coupling coordinated development between systems using the following formula:
D = C T
T = a M + b N + c X + d Y + e Z
where D is the coupling coordination degree; T is the synthetic assessment index of the five systems; and a, b, c, d, and e represent the undetermined coefficients. Given that the factors of population, economy, society, resources, and environment are equally important, and based on information provided by the relevant references [3,31,32], the undetermined coefficients are defined as a = b = c = d = e = 0.2 .
According to the existing categorization methodology, the coupling coordination degree between systems is divided into five levels (Table 2): Uncoordinated development status, on the verge of uncoordinated development status, weakly coordinated development status, well-coordinated development status, and perfectly coordinated development status [51].

2.2.2. Weight Determination

The analytic hierarchy process (AHP) method based on subjective weighting and the entropy method based on objective weighting are combined in this paper, in order to improve the accuracy of weight determination and credibility of evaluation results.
Firstly, the weight of evaluation index,   λ i , based on AHP is obtained using the software named yaahp10.5. This method establishes the index evaluation system with clear structure, compares the indexes of each layer between pairings, obtains the judgment matrix of the pairwise comparison of the indexes in each layer, and then carries out the consistency test. It can be thought that the λ i is reasonable if the consistency is passed.
Secondly, the weight of evaluation index, ω i , based on the entropy method is obtained. It can be calculated by the following formula:
H i = k j = 1 n f i j ln f i j ,   ( i   =   1 ,   2 , ,   m ;   j   =   1 ,   2 , ,   n )
where H i is information entropy of ith index; m is the number of indices; n is the number of research areas. In this formula, f i j = r i j / j = 1 n r i j , k = 1 / ln n , and if f i j = 0 , f i j ln f i j = 0 . Furthermore, the entropy weight of ith index is as follows:
ω i = 1 H i / m i = 1 m H i
Finally, combining the λ i obtained using the AHP method and the ω i obtained using the entropy method, the synthetic weighted value of the ith index can be obtained [52]:
μ i = λ i ω i i = 1 m λ i ω i

2.3. Spatial Autocorrelation Analysis Models

2.3.1. The Global Moran’s I

The global Moran’s I is a measure of global spatial autocorrelation. The formula is as follows [53]:
I = i = 1 n j = 1 n w i j ( x i x ¯ ) ( x j x ¯ ) S 2 i = 1 n j = 1 n w i j
where x ¯ = 1 n i = 1 n x i ; S 2 = 1 n i = 1 n ( x i x ¯ ) 2 ; n is the number of evaluation objects; x i   and   x j are the attribute values of the evaluation objects i and j, respectively; and w i j is the spatial weight matrix. When i and j are close to one another, w i j = 1 . Otherwise, w i j = 0 .

2.3.2. The Local Moran’s I

The local Moran’s I is a measure of local spatial autocorrelation. The formula is as follows [54,55]:
I = ( x i x ¯ ) j = 1 n w i j ( x j x ¯ ) S 2
where x ¯ = 1 n i = 1 n x i ; S 2 = 1 n 1 j = 1 ,   j i n ( x j x ¯ ) 2 ; n is the number of evaluation objects; x i   and   x j are the attribute values of the evaluation objects i and j, respectively; and w i j is the spatial weight matrix. When i and j are close to one another,
w i j = 1 . Otherwise, w i j = 0 .
According to the calculation results, four spatial correlation types can be categorized; namely, the high-high (H-H) type, low-high (L-H) type, high-low (H-L) type, and low-low (L-L) type. Among these four types, H-H and L-L represent the types with a positive spatial autocorrelation, and L-H and H-L represent the types with a negative spatial autocorrelation.

3. Results and Discussion

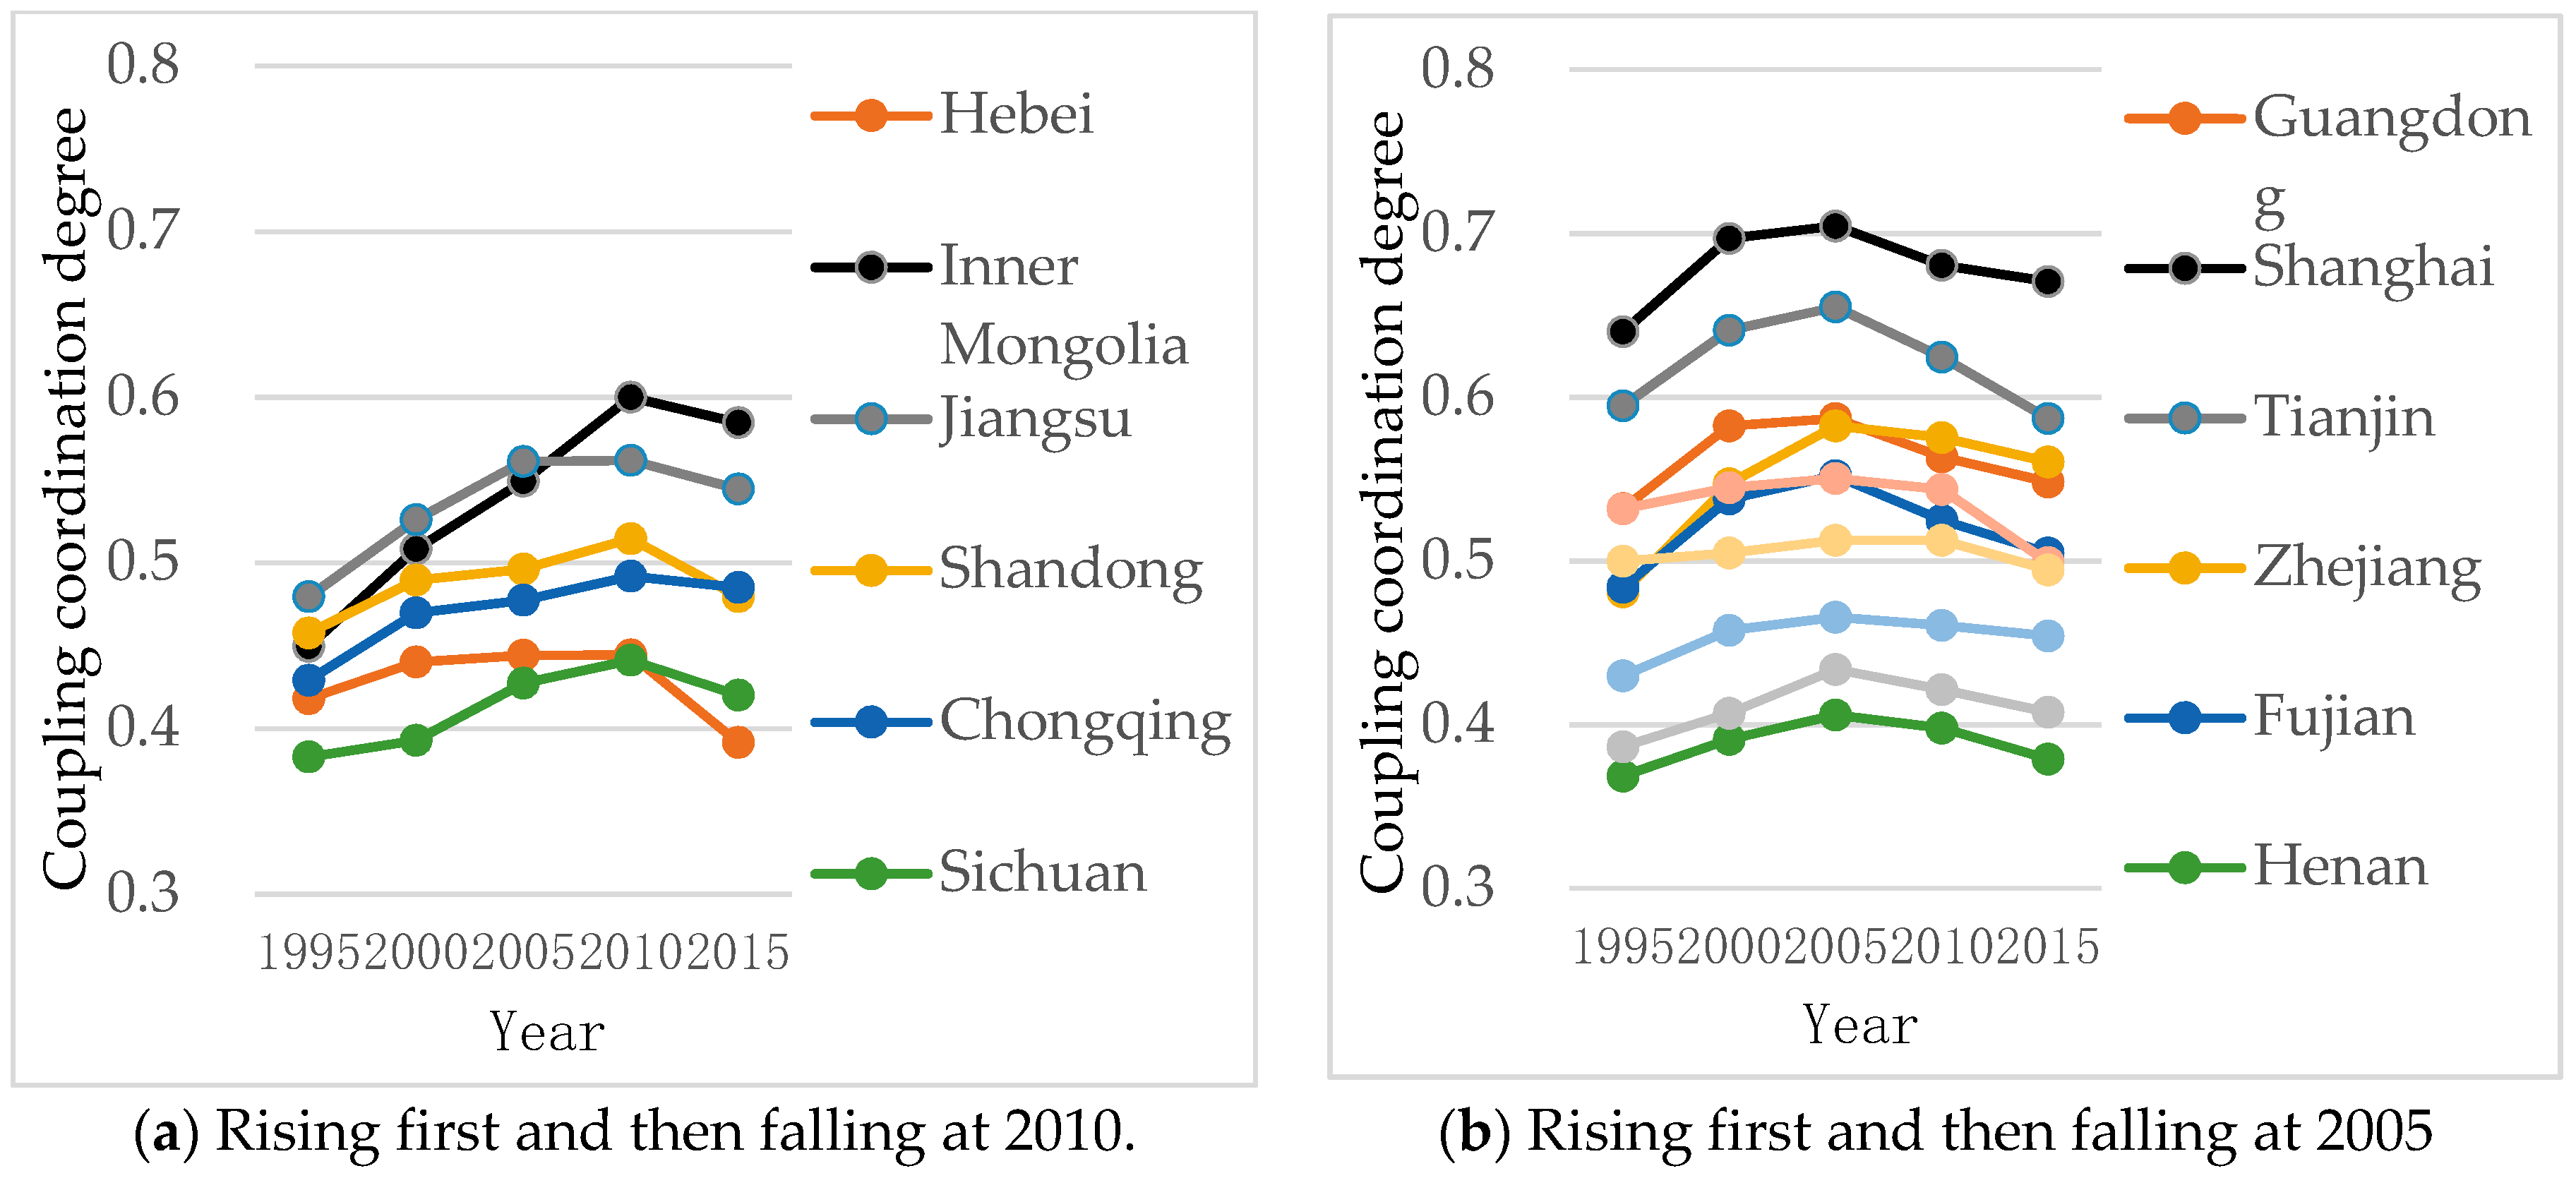
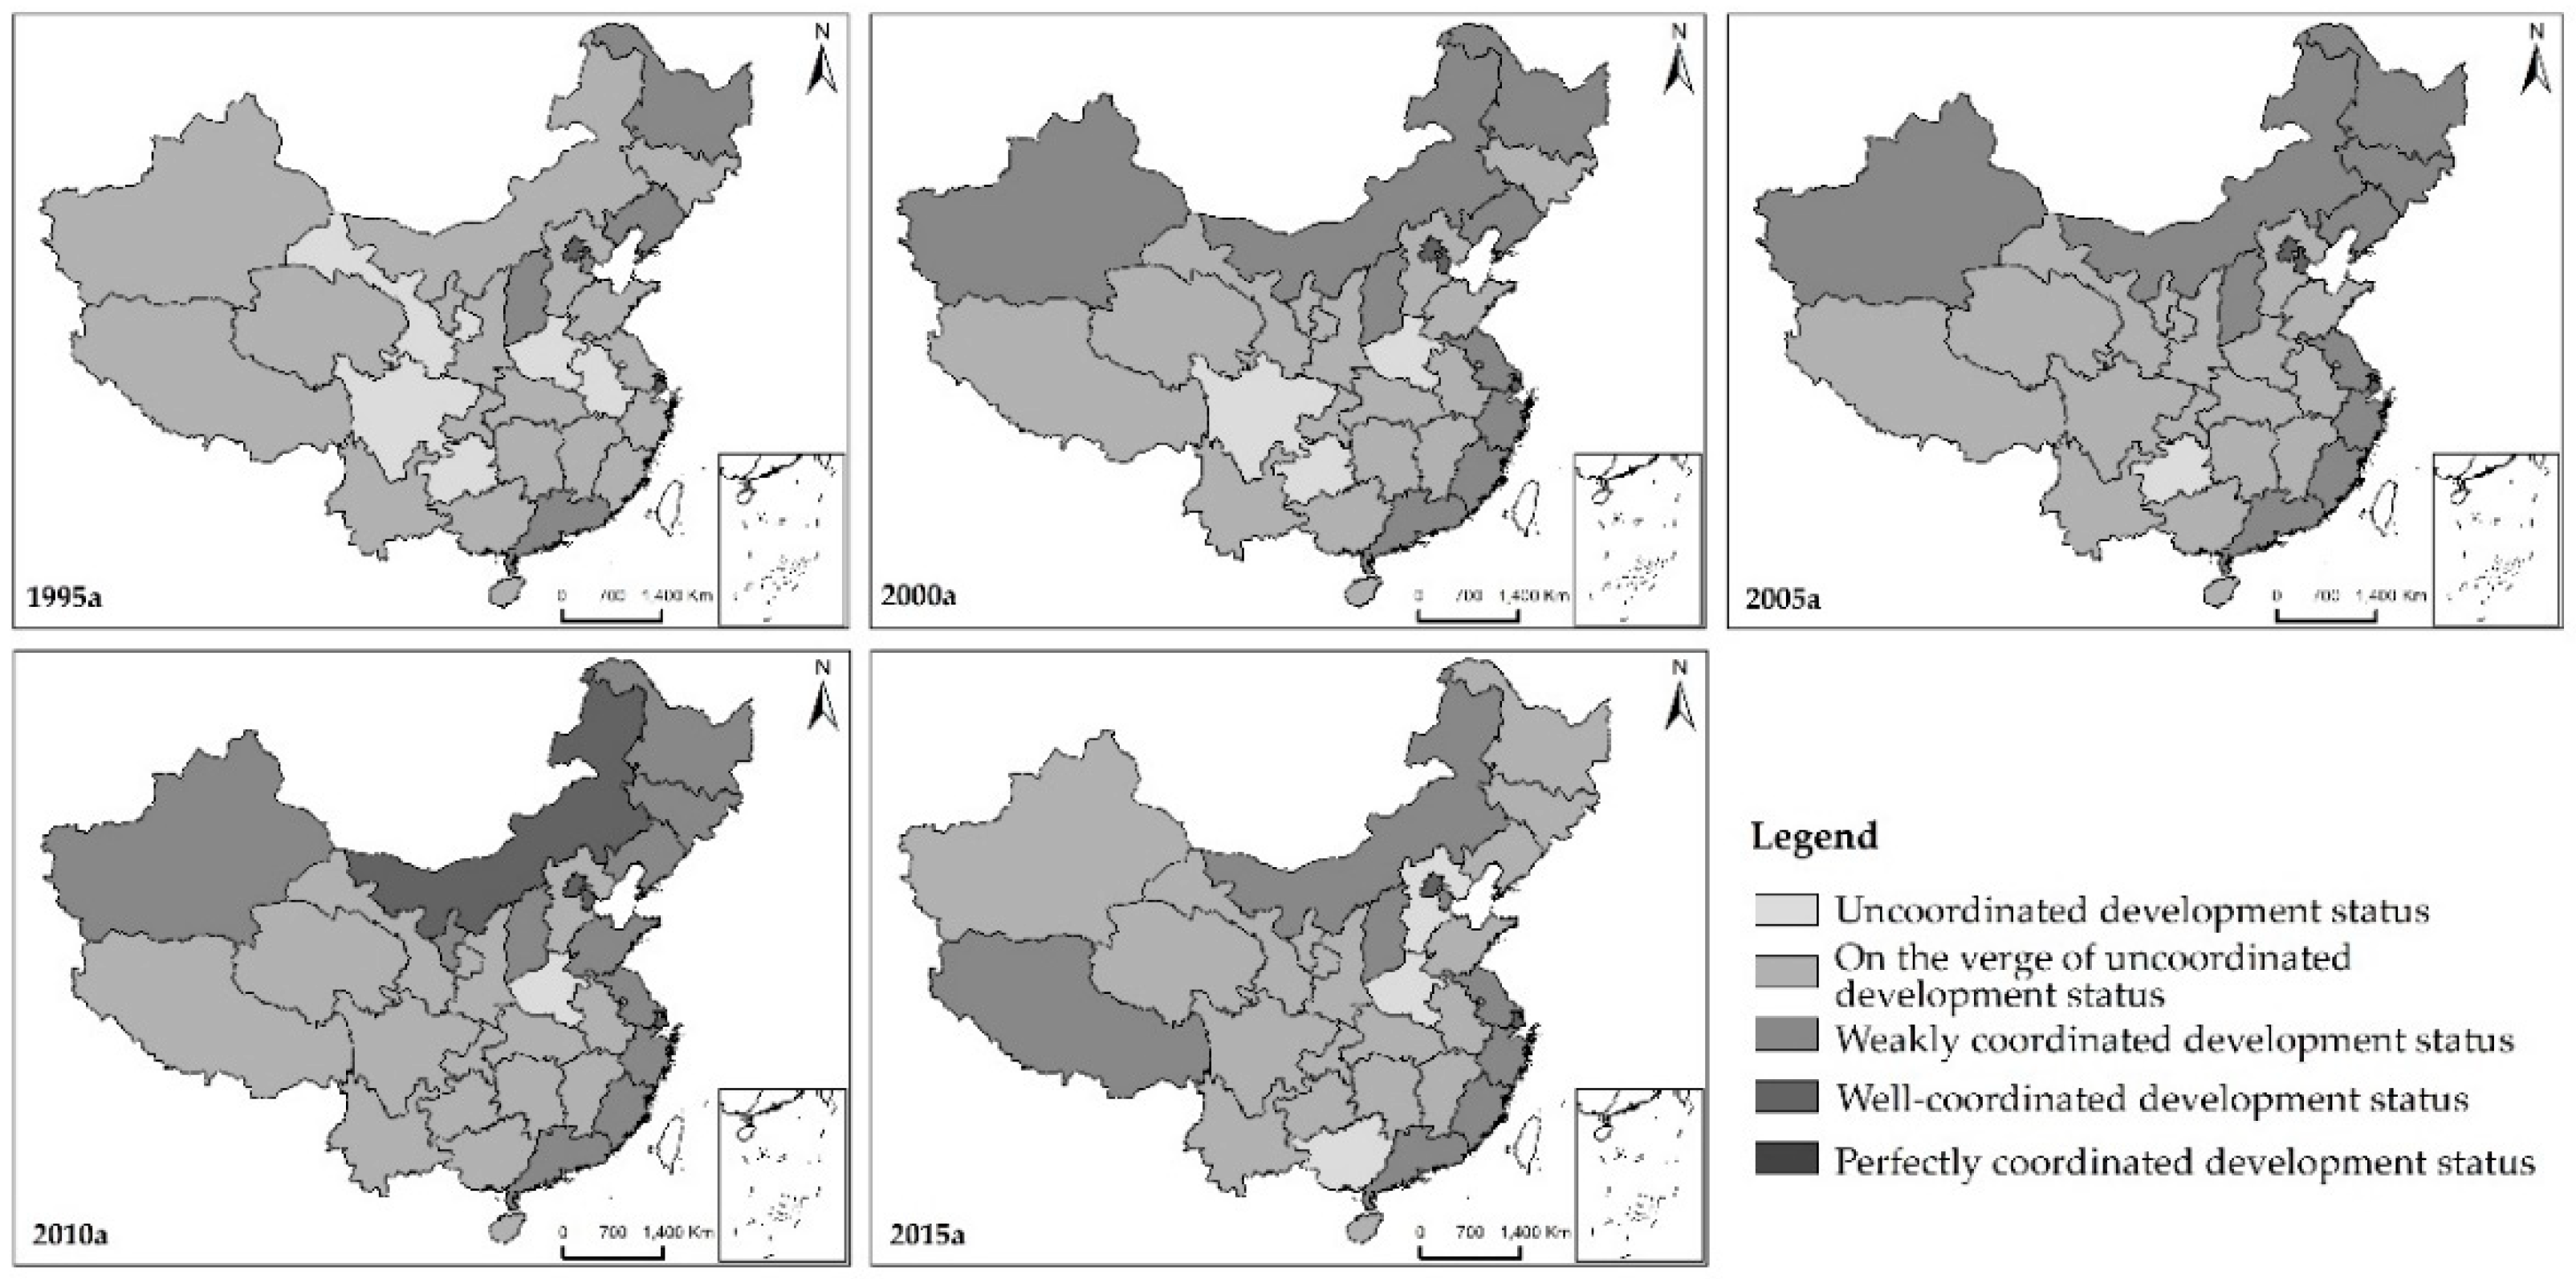
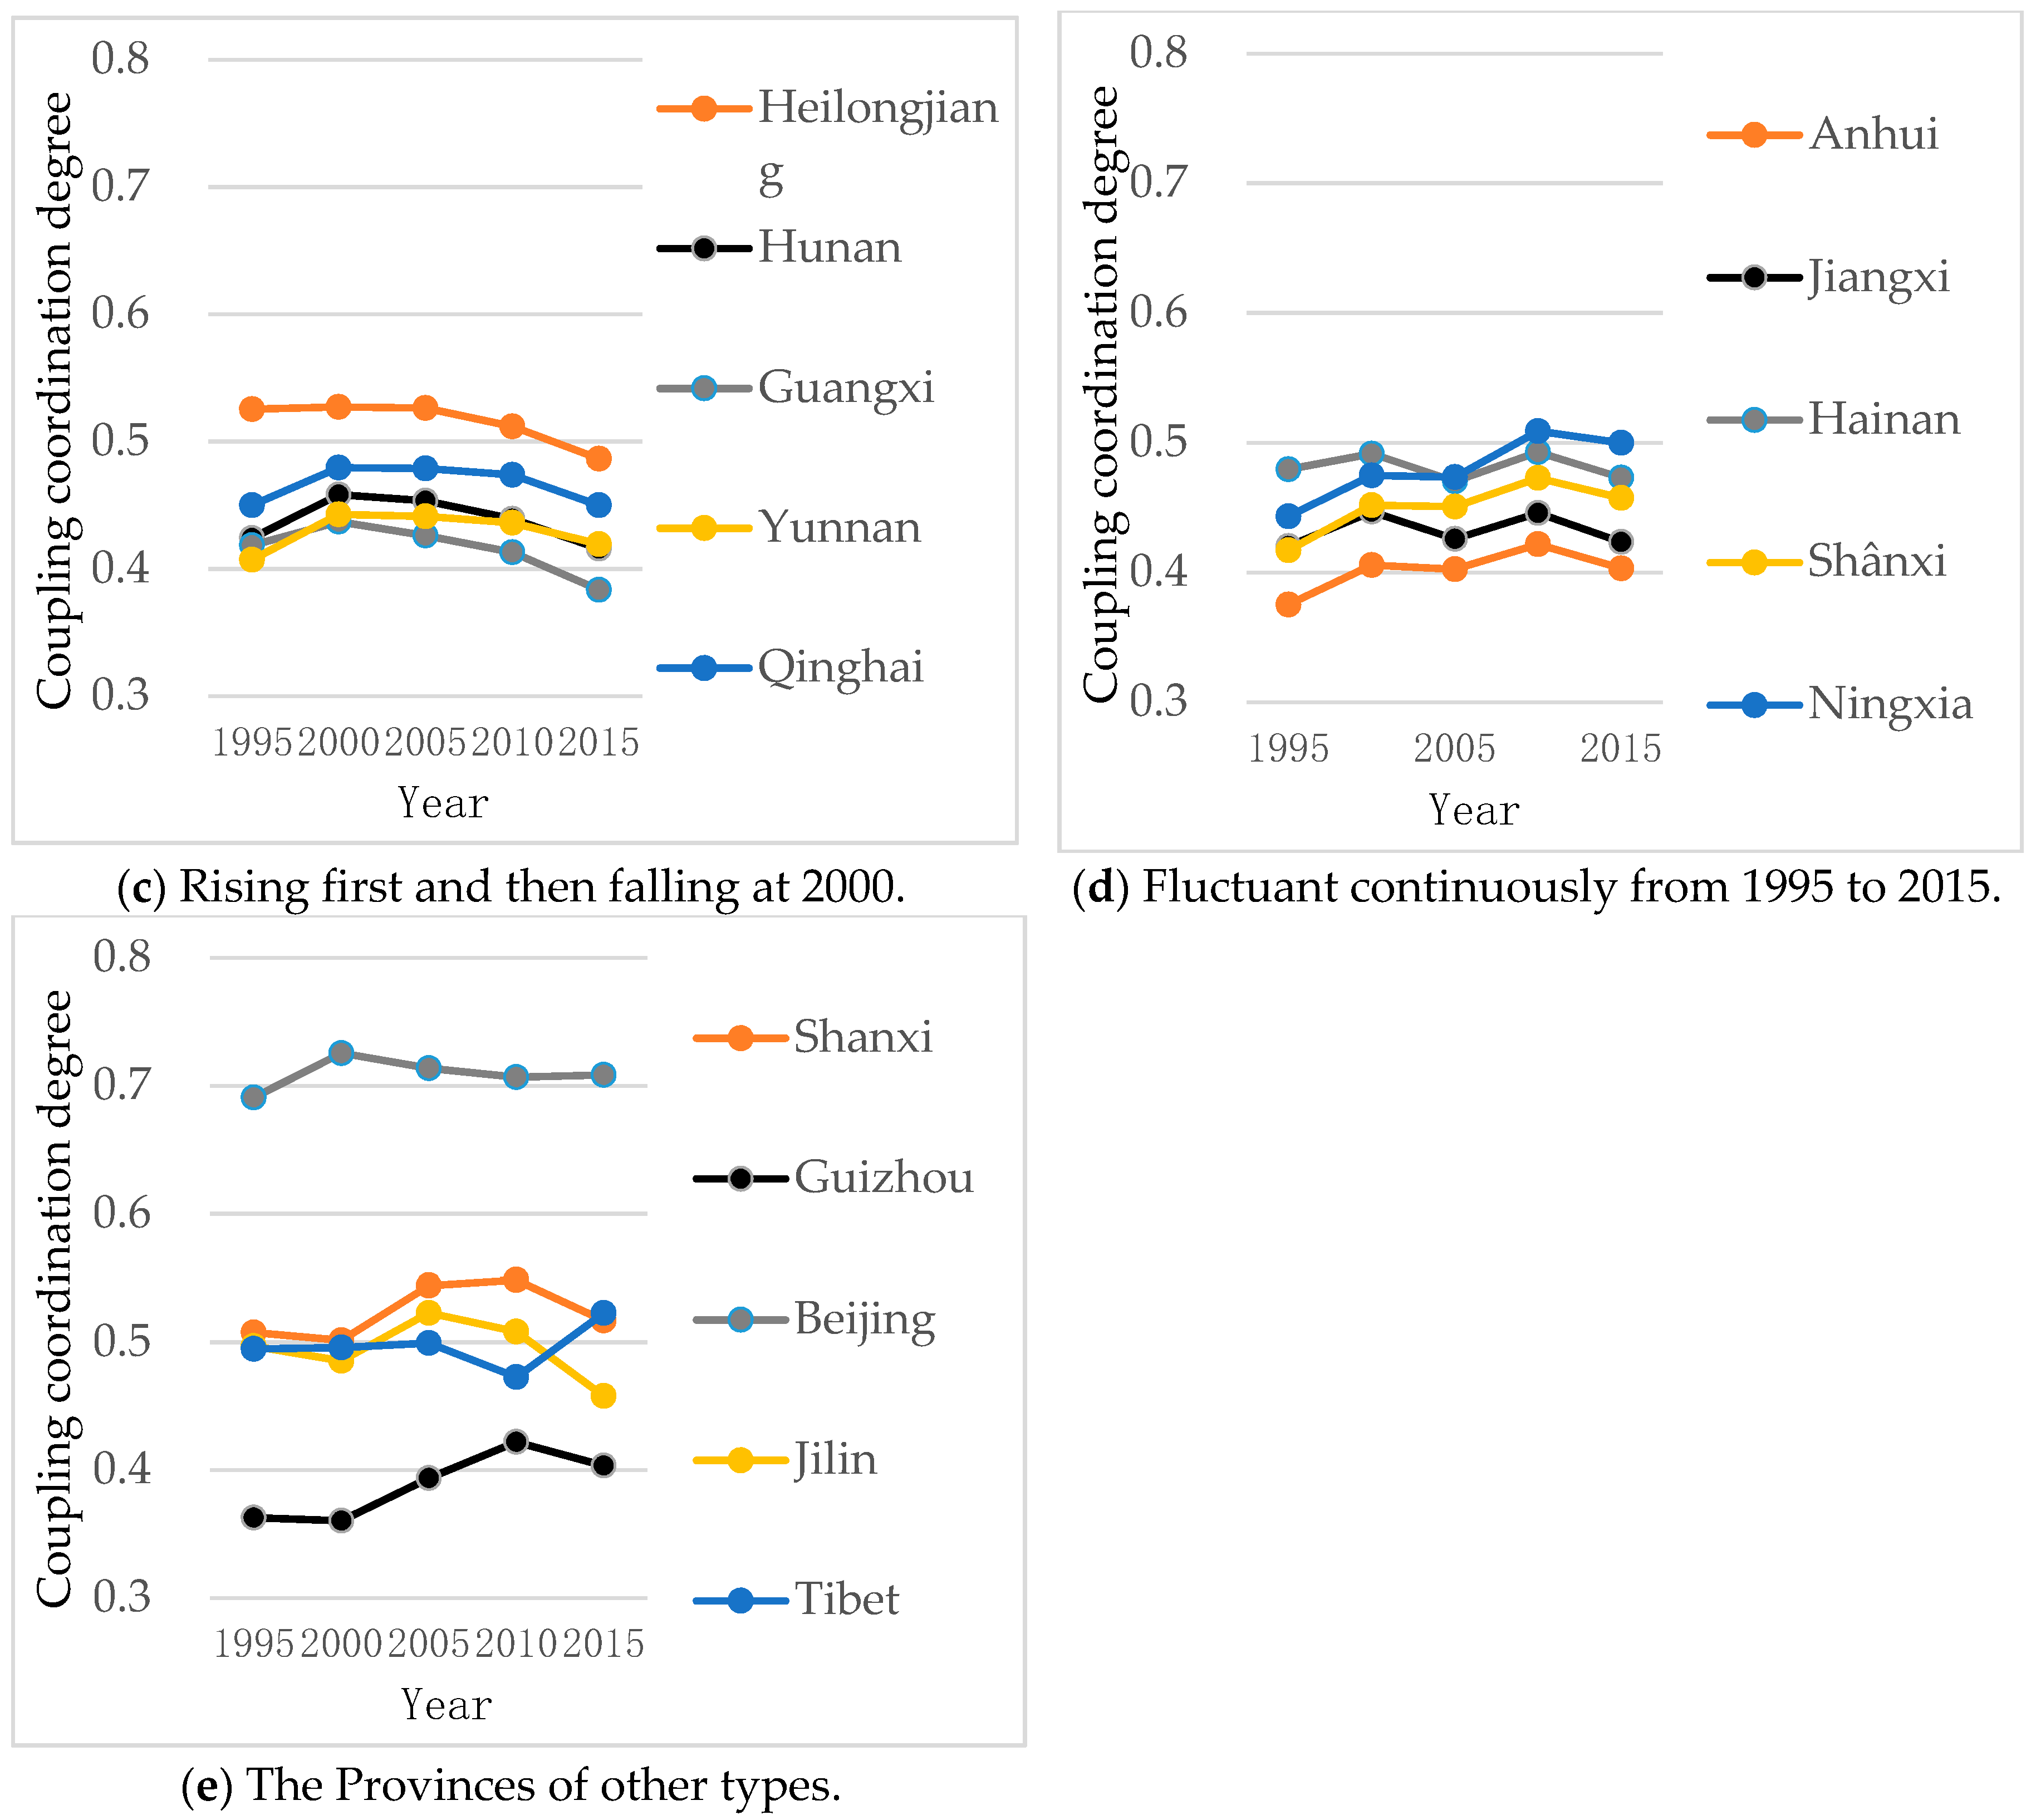
3.1. The Analysis of the Coupling Coordinated Development

Based on the results of comprehensive evaluation index of each subsystem, it is showed that the comprehensive evaluation index of environmental subsystem is the highest, and the comprehensive evaluation index of resource subsystem is the lowest as a whole. And clearly, the comprehensive evaluation indices of economy, society, and environment subsystems in most provinces are decreasing from 2010 to 2015. On the contrary, the comprehensive evaluation index of population subsystem in most provinces is rising. The results of comprehensive evaluation of the subsystems are listed in the Supplementary Materials.
The coupling coordination degree of China’s PESRE systems generally shows a trend of rising first and then declining. Most regions are in line with this trend, but in which year the falling begins is not always the same. And a small number of provinces show a trend of fluctuation (Table 3). By analyzing the trend of coupling coordination degree in each province for nearly 20 years, it can be roughly divided into the following types. (1) Rising first and then falling. This type includes Hebei, Guangdong, Heilongjiang, and other 21 provinces, accounting for about 67% of all research regions. Further, there are differences in the specific trend changes in these provinces. First, from 1995 to 2010, the coupling coordination degree of PESRE systems of Hebei, Inner Mongolia, Jiangsu, Shandong, Chongqing, and Sichuan are rising continuously and then decreasing after 2010 (Figure 1a). Second, from 1995 to 2005, the coupling coordination degree of PESRE systems of Guangdong, Shanghai, Tianjin, Zhejiang, Fujian, Henan, Hubei, Liaoning, Gansu, and Xinjiang are rising continuously and then decreasing after 2005 (Figure 1b). Third, from 1995 to 2000, the coupling coordination degree of PESRE systems of Heilongjiang, Hunan, Guangxi, Yunnan, and Qinghai are rising and then decreasing continuously after 2000 (Figure 1c). (2) Fluctuant continuously. This type includes Anhui, Jiangxi, Hainan, Shaanxi, and Ningxia, the coupling coordination degree of PESRE systems of these provinces are rising from 1995 to 2000 and from 2005 to 2010, and decreasing from 2000 to 2005 and from 2010 to 2015 (Figure 1d). (3) The coupling coordination degree of PESRE systems of Shanxi, Guizhou, Beijing, Jilin, and Tibet are obviously different from other provinces (Figure 1e). Among them, Shanxi and Guizhou show a slight decline from 1995 to 2000, then a clear upward trend from 2000 to 2010, and a clear downward trend from 2010 to 2015; Beijing shows a clear upward trend from 1995 to 2000, then a more obvious downward trend from 2000 to 2010, and a slight increase from 2010 to 2015; Jilin shows a more obvious downward trend from 1995 to 2000, then an obvious increase trend from 2000 to 2005, and continues to decline from 2005 to 2015; Tibet shows a slight increase from 1995 to 2005, then an obvious downward trend from 2005 to 2010, and a very obvious increase from 2010 to 2015. On the whole, the coupling coordination degrees of PESRE systems of China’s provinces have obvious decline around 2010, except Beijing and Tibet, which is closely related to the financial crisis all over the world in 2008. As the development of resources and environmental systems were basically stable and rising unsteadily for nearly 20 years, the financial crisis led to a decline in the level of development of China’s overall economic system. Although there was a brief recovery, the government began to implement a slowing economic policy overall, which made the level of social system development to have a large-scale decline in the same period. Contrarily, the level of population system development in this period had a marked increase. All of these reasons led to the coupling coordination degrees of PESRE system of various regions in China to have significant decline around 2010.
All the provinces studied are classified according to the classification criteria of the coupling coordination degree (Figure 2). The following points can be made. (1) Five provinces were in uncoordinated development status in 1995, but the count was reduced to 3, 1, and 1 in 2000, 2005, and 2010, respectively. However, the count went up to 3 again in 2015. Most of these provinces are located in the central and western regions of China with a relatively slow economic growth, among which Henan experienced the longest uncoordinated development status period. (2) In 1995, 19 provinces were on the verge of uncoordinated development status, accounting for 61.29% of all provinces. The distribution range of these provinces is relatively wide, and includes the central, western, and eastern coastal regions of China. The count was 16, 17, and 15 in 2000, 2005, and 2010, respectively, and most of these provinces are distributed in the central and western regions of China. In 2015, the count increased to 18, and most of the provinces were mainly distributed in the central, western, and northeast regions of China, except for Tibet. (3) In 1995, five provinces were in a weakly coordinated development status, and most of them were sporadically distributed in the eastern and northeastern regions of China. The count was 9, 10, 11 in 2000, 2005, and 2010, respectively, and most of these provinces were distributed in the northern and eastern coastal regions of China. In 2015, the count was reduced to 8, with most of these provinces distributed in the northern and eastern coastal regions of China. (4) In 1995, Beijing and Shanghai were in a well-coordinated development status. Tianjin joined them in 2000 and 2005, and Inner Mongolia joined them in 2010. However, only Beijing and Shanghai remained in this status in 2015. It is well-known that Beijing, Shanghai, and Tianjin are municipalities controlled directly by the Central Government. In particular, Beijing and Shanghai represent the political and financial center of China. (5) In 1995, 2000, 2005, 2010, and 2015, there was not any province in a perfectly coordinated development status.
When the number of provinces with different levels of coordinated development was compared, it can be seen that between 1995 and 2015, the number of provinces that were either in uncoordinated development status or on the verge of uncoordinated development status firstly decreased and then increased. By contrast, the number of provinces that were either in a weakly or well-coordinated development status first increased and then decreased. Overall, the level of coordinated development of the five major systems across China’s provinces has been gradually improving in a benign development direction. However, a backlash during the development process is possible, which has been particularly obvious in recent years.
When the geographical locations of provinces with different levels of coordinated development were analyzed, it can be seen that provinces that were either in uncoordinated development status or on the verge of uncoordinated development status were mainly distributed in the central and western regions of China, whereas provinces that were either in a weakly or well-coordinated development status were mainly distributed in the eastern and northern regions of China. Therefore, a preliminary conclusion might be made that certain spatial connections exist between China’s five major systems as far as their coordinated development is concerned. However, the exact model that can help explain such connections needs further verification, and a spatial correlation analysis can be used to identify such connections.
In recent years, other scholars have also conducted similar studies. For example, Hong et al. [56] quantitatively assessed the coordinated development level of resource-environment-economy- society systems of six provinces in central China, and their findings were similar to ours. They believed that Hubei, Hunan, and Henan provinces were basically in a coordinated development status, whereas Jiangxi, Shanxi, and Anhui were in a less-coordinated development status. Ren et al. [57] analyzed the coupling coordinated relationships and spatial patterns between China’s economic, social, and environmental systems, and obtained similar results. They believed that the eastern coastal regions of China were in a coordinated development status, the northwestern, northeast, and central regions were in a weakly coordinated development status, and a few southern regions were in a mildly uncoordinated development status. Furthermore, Aiyetan and Olomola [18] studied the relationship between carbon dioxide emissions, energy consumption, population growth, and economic growth in Nigeria, and confirmed the validity of the environmental Kuznets curve hypothesis. Xie et al. [58] quantitatively evaluated the level of coordinated development of resource, environment, ecology, economic, and social subsystems of China’s 31 provinces in 2013, and obtained similar results with this paper. They found that the coordinated development provinces are mainly concentrated in the eastern coastal areas of China, while the central and western regions are low-coordinated and uncoordinated development provinces.

3.2. Spatial Autocorrelation Analysis

3.2.1. Global Spatial Autocorrelation

The global Moran’s I of the coupling coordination degree over the years was calculated, with the results shown in Table 4. The z-test values over the years were greater than the testing threshold value of 1.96, and the results were statistically significant (p < 0.05). It can be seen that for each province, the coupling coordinated degree of the five major systems showed signs of a positive spatial autocorrelation, and certain spatial aggregation characteristics could be found on the provincial scale. In other words, the coupling coordinated degree is not randomly distributed, but rather, spatial aggregation characteristics were noticeable. Specifically, provinces with a higher coupling coordination degree tended to be adjacent to each other, whereas provinces with a lower coupling coordination degree were closer to each other. Judged from the trend of the global Moran’s I, the spatial autocorrelation first increased and then decreased, suggesting that provinces with either the highest or lowest coupling coordination degree first display a strengthening trend, followed by a weakening trend.

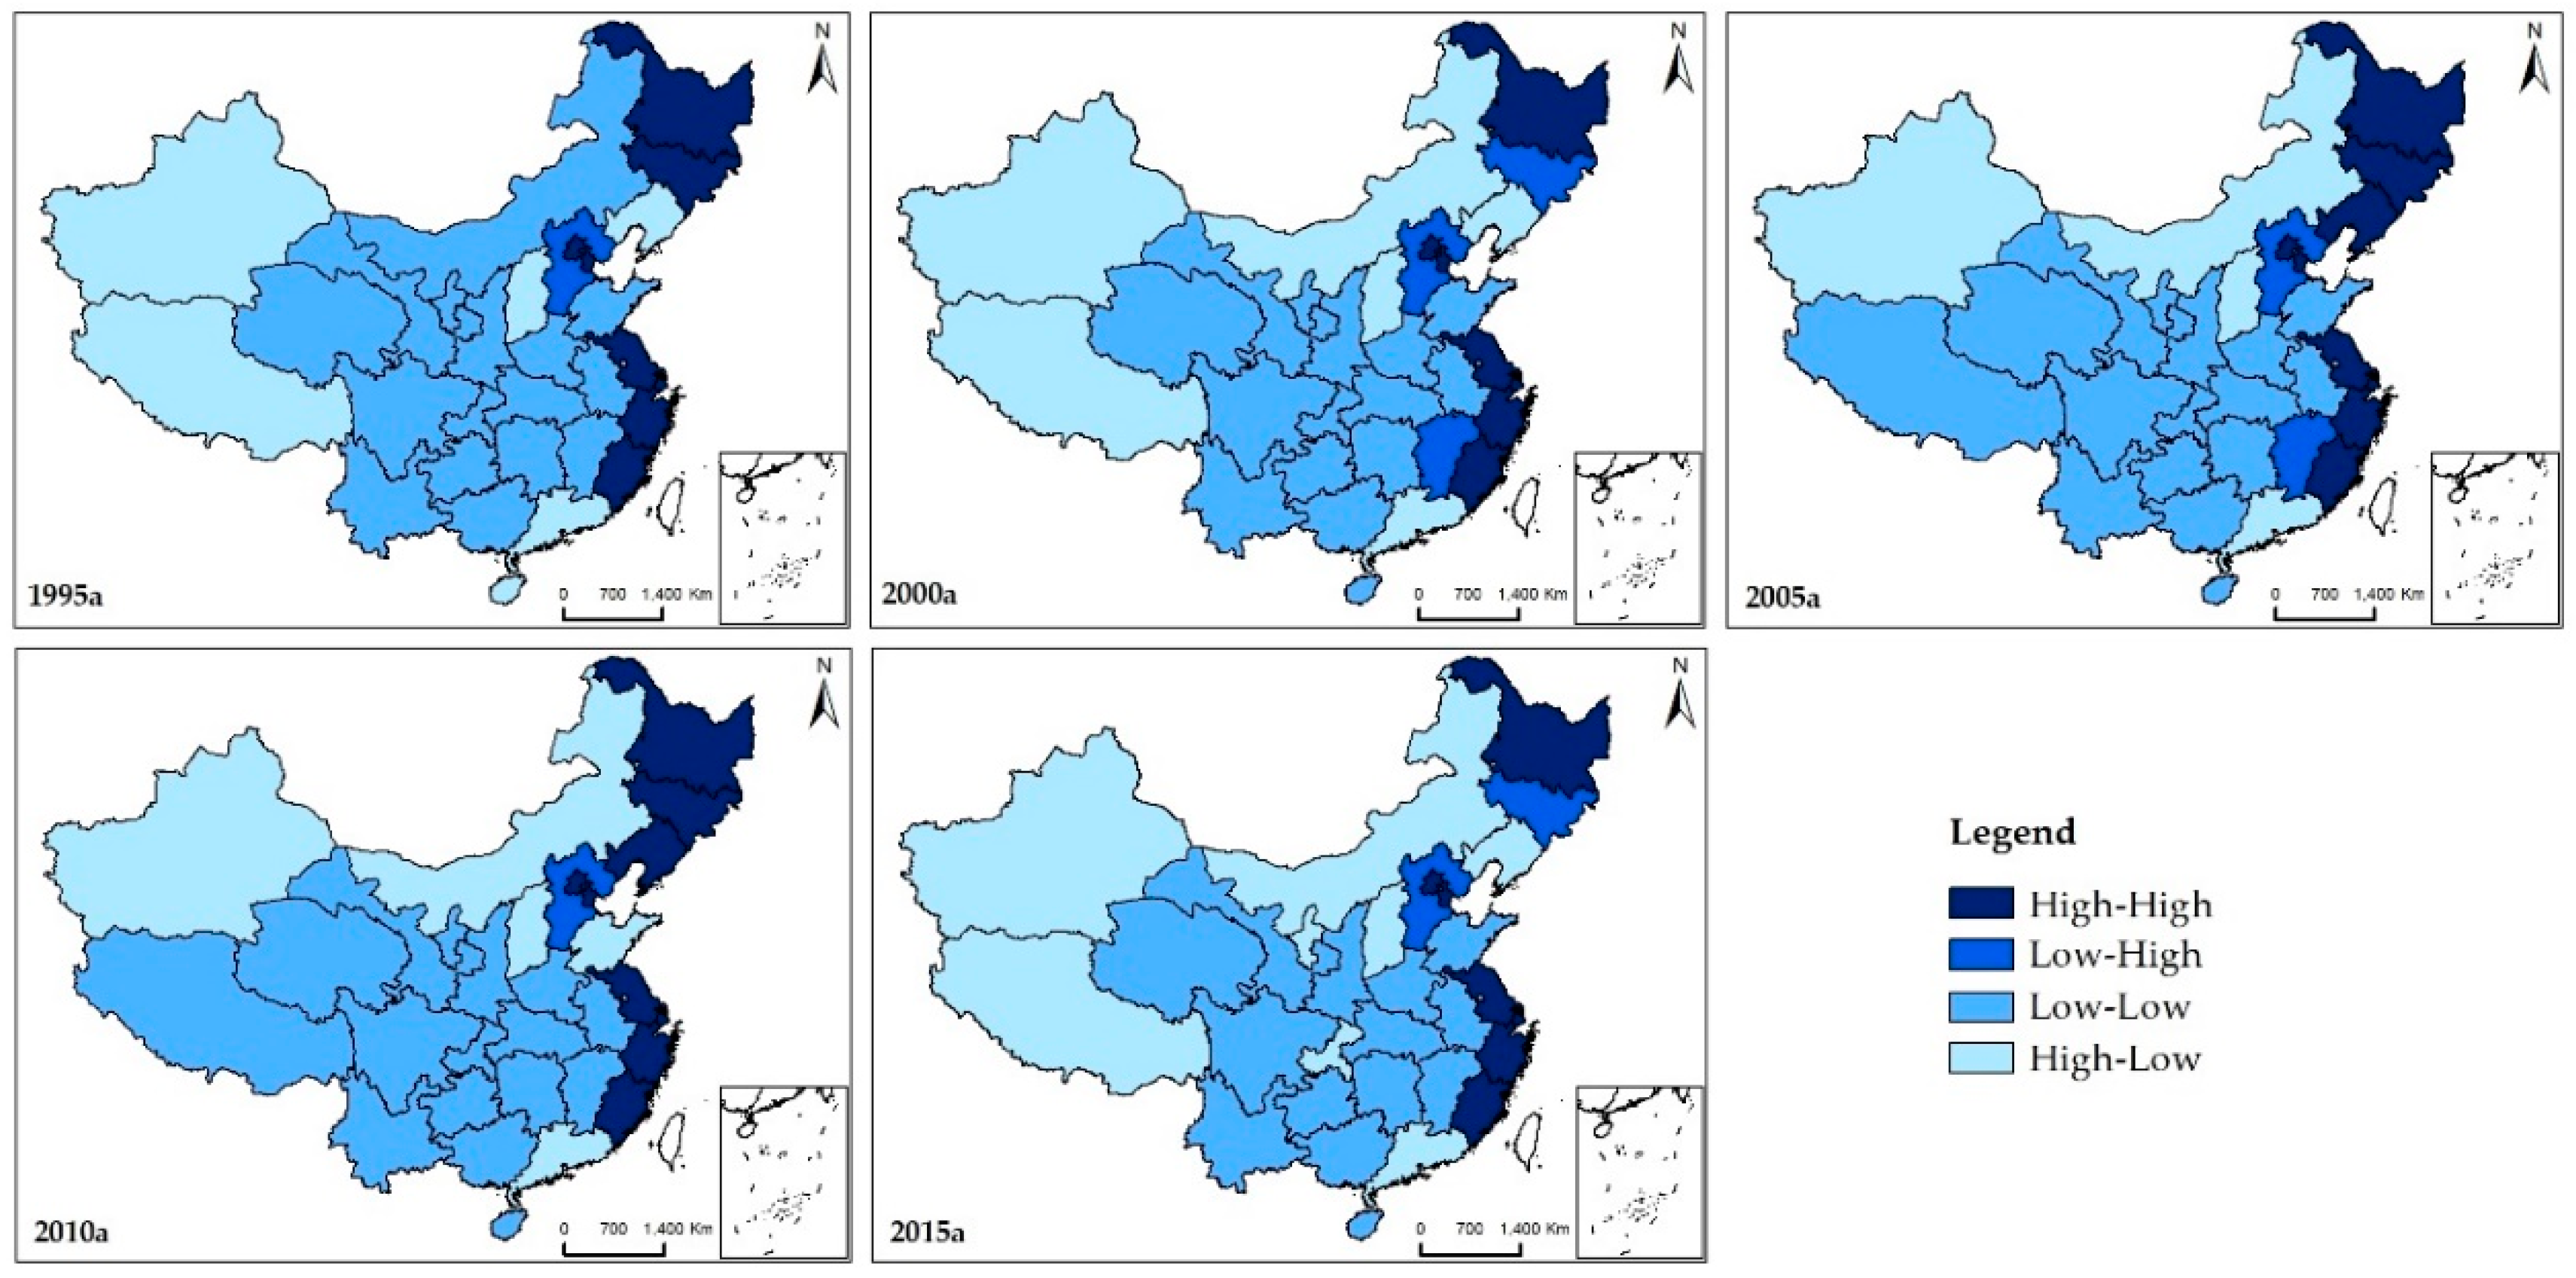
3.2.2. Local Spatial Autocorrelation

In this study, the representative years were selected, and a local spatial autocorrelation analysis of the coupling coordination degree was conducted. The local Moran’s I was statistically significant (p < 0.05). It can be seen from Figure 3 that the coupling coordination degree of various provinces in China displayed obvious spatial aggregation characteristics, including a strong spatial dependence and spatial heterogeneity. In 1995, 2000, 2005, 2010, and 2015, provinces characterized as “high-high” or “low-low” types were dominant, for which the count for the “high-high” type was 8, 7, 9, 9, and 7, respectively, and the count for the “low-low” type was 16, 15, 16, 16, and 14, respectively. Provinces characterized as “low-low” types displayed obvious aggregation characteristics. By contrast, the number of provinces characterized either as “low-high” or “high-low” types was relatively small, for which the count for the “low-high” type was 1, 3, 2, 1, and 2, respectively, and the count for the “high-low” type was 6, 6, 4, 5, and 8, respectively. Moreover, the number of provinces characterized as “high-low” types was slightly higher.
(1) Regions characterized as “high-high” types are mostly distributed in eastern China, and these provinces are closer to each other, forming connected regions with relatively high levels of coordinated development. Most of these provinces are areas with flourishing economic, good social development, and superior geographical position. The narrowing of the number of these provinces mainly appears in the northeast regions, which is related to the economic weakness and population loss. (2) Regions characterized as “low-low” types are mainly distributed in the central and western regions of China, forming a continuous distribution. These provinces account for the largest proportion, such as Gansu, Qinghai, and Ningxia, suggesting that there are still many provinces with relatively low levels of coordinated development between the five major systems. Moreover, these provinces displayed obvious spatial aggregation characteristics. Most of these provinces are areas with moderate or lower levels of economic and social development, and complex ecological environment. The narrowing of the number of these provinces mainly appears in more resource-rich areas such as Inner Mongolia, Ningxia, and Tibet. (3) Regions characterized as “low-high” types are small in number and distributed in a scattering manner. The coordinated development level of such provinces is relatively weak, and they are often surrounded by provinces with higher coordinated development levels, especially around regions known as “high-high” types. Although they are close to regions with high levels of coordinated development, any positive radiation effects are limited. For example, although Hebei is close to Beijing and Tianjin, these two cities do not impose much of a positive impact on Hebei. (4) Regions characterized as “high-low” types increase gradually in number, and they are often close to regions characterized as “low-low” types. Although these provinces have relatively high levels of coordinated development, they do not act as a motivator for the development of neighboring provinces. On the contrary, these provinces often attract a large number of resources from regions characterized as “low-low” types, and thus further extend the gaps with surrounding regions, such as Guangdong, Chongqing, Xinjiang, Inner Mongolia, and Shanxi. The formation of “low-high” type and “high-low” type are related to the strength of radiation in the high coordination areas and the strength of the low coordination areas’ self-development ability. The “high-low” type provinces are mainly Guangdong, Chongqing, and Xinjiang. These provinces are developing rapidly in both economic and society systems, attracting a large number of talented people and have good conditions in technology, resources, and environment, and then, there will be a clear gap between these provinces and the surrounding areas. It can be seen that the coupling coordinated degree of China’s provinces displays obvious spatial aggregation patterns, characterized by the transition from high-value clusters in eastern regions towards low-value clusters in western regions. Clearly, geological locations have an important impact on the degree of coupling coordinated development.
In recent years, other scholars have also conducted related studies, although the numbers are still very limited. For example, Peng et al. [59] applied an exploratory spatial data analysis (ESDA), and found that the overall development capacity of 280 cities in China showed a positive spatial autocorrelation, although the correlation gradually weakened, and these findings are consistent with ours. Jiang et al. [60] used the spatial autocorrelation method to analyze the coupling coordinated development of China’s provinces in terms of economic development, resource endowment and ecological environment, and found that the coupling degree displayed some obvious spatial aggregation patterns, which was also consistent with our findings. Based on the spatial analysis method, Shaker and Sirodoev [61] discovered that the coordinated development of Moldova’s economy, society, and environment also showed some obvious spatial aggregation patterns. Wei et al. [62] evaluated the coordination degree of 31 provinces in China from 2005 to 2015 in terms of economic, political, cultural, social, and ecological aspects quantitatively. They found that the coordination degree positively presented space correlation. The eastern coastal areas were “high-high” type and the western regions were “low-low” type, and the scope of these two types had significant shrinkage as time went on. The “low-high” type was mainly located in the central regions, and the number increased. The “high-low” type was only Guangdong in 2005 and Chongqing in 2015. Compared with the results of this study, the changes in the number of “high-high” and “low-low” type are more consistent.

4. Conclusions

From 1995 to 2015, the change of coupling coordination degree of China’s PESRE system can be divided into two types: Rising first and then declining, and fluctuant continuously. The number of provinces of first type was higher, but in which year the falling begins was not always the same. On the whole, there was a very obvious decrease after 2010 except Beijing and Tibet. Overall, provinces that are either in uncoordinated development status or on the verge of uncoordinated development status are mainly distributed in the central and western regions of China, whereas provinces that are either in a weakly or well-coordinated development status are mainly distributed in the eastern and northern regions of China. Most provinces fall into two categories, namely, on the verge of uncoordinated development status or in a weakly coordinated development status. And unfortunately, there is no province in a perfectly coordinated development status between 1995 and 2015.
The coupling degree of PESRE systems at the provincial level in China generally shows some positive spatial correlations, and the level of coordinated development displays some obvious spatial aggregation patterns. Moreover, the degree of such aggregation first increases and then weakens. Provinces characterized as “high-high” or “low-low” types are dominant, and provinces characterized as “low-low” types display strong aggregation patterns. Provinces characterized as “low-high” or “high-low” types are small in number. The eastern parts of China represent the main “high-high” type aggregation regions, forming connected regions with relatively high levels of coordinated development. By contrast, the central and western parts of China represent the main “low-low” types, and account for the largest proportion and display obvious aggregation characteristics. Therefore, for most provinces in China, the coordinated development degree of the five major systems remains low, and further improvement is urgently needed.
In order to further improve the level of the coordinated development between systems (PESRE), as population, economic, and social development is further improved, it is necessary to pay equal attention to the conservation and utilization of natural resources, as well as the protection and management of the natural environment. Specifically, although one of the main tasks for eastern regions is to maintain their high economic growth, they should also strive to promote the level of coordinated development of surrounding areas, and to improve the integration efficiency of resources, elements, and space. The more-developed central regions should fully emphasize the important role of the economic system in supporting the social and environmental systems, improve public services and facilities, increase environmental protection and management, optimize industrial structures, and promote scientific and technological innovations. By contrast, the less developed central and western regions should not only focus on economic development but also pay special attention to resource conservation and environmental protection. By doing so, the long-term cost of economic development could be reduced, social services and population quality could be improved, talent could be attracted, and funds could be secured.

Supplementary Materials

The following are available online at https://www.mdpi.com/2071-1050/11/10/2877/s1. Table S1: The original data of all indicators; Table S2: The results of the comprehensive evaluation of subsystems.

Author Contributions

C.y.L. (Chenyu Lu) and C.p.L. (Chengpeng Lu) designed the study and wrote the paper. J.Y. and M.P. analyzed the data. H.L. and S.J. contributed to data collection and processing. All authors read and approved the manuscript.

Funding

This research was funded by [National Natural Science Foundation of China] grant number [41561110], [41701142], [41261112]; by [Science and Research Program in colleges and universities of Gansu Province] grant number [2018F-05]; by [Science and Technology Support Program of Gansu Province] grant number [1304FKCA067].

Acknowledgments

Thanks to the anonymous reviewers and all the editors in the process of revision.

Conflicts of Interest

The authors declare no conflicts of interest.

References

  1. Grossman, G.M.; Krueger, A.B. Economic Growth and the Environment. NBER Work. Pap. 1994, 110, 353–377. [Google Scholar]
  2. Daly, H.E. Beyond Growth: The Economics of Sustainable Environment; Beacon Press: Boston, MA, USA, 1996; Volume 29, p. 6. [Google Scholar]
  3. Mao, H.Y. Study on Coordinating Development of Economic, Social Growth with Population, Resources and Environment at County Level. Acta Geogr. Sin. 1991, 4, 385–395. (In Chinese) [Google Scholar]
  4. Li, Q.; Hu, H.; Li, M.S.; Zhang, Y.J.; Song, J.P.; Zhang, J.H.; Zhang, F.Y. Ecological civilization evaluation and coordinated development between environment, economy and society. Resour. Sci. 2015, 37, 1444–1454. (In Chinese) [Google Scholar]
  5. Shi, P.J.; Yang, Y.F.; Wu, Y.F. The Coordinated-evaluation model of urban sustainable development based on a compound system. Stat. Decis. 2010, 14, 36–38. (In Chinese) [Google Scholar]
  6. Liu, J.G.; Dietz, T.; Carpenter, S.R.; Folke, C.; Alberti, M.; Redman, C.L.; Schneider, S.H.; Ostrom, E.; Pell, A.N.; Lubchenco, J.; et al. Coupled human and natural systems. AMBIO J. Hum. Environ. 2008, 36, 639–649. [Google Scholar] [CrossRef]
  7. Desai, M.; Victor, P.A. Pollution: Economy and Environment. Economica 1974, 41, 350. [Google Scholar] [CrossRef]
  8. Joselow, M.M.; Tobias, E.; Koehler, R.; Coleman, S.; Bogden, J.; Gause, D. Manganese Pollution in the City Environment and Its Relationship to Traffic Density. Am. J. Public Health 1978, 68, 557–560. [Google Scholar] [CrossRef] [PubMed]
  9. Culbertson, J.M. Economic growth population, and the environment. Popul. Environ. 1990, 11, 83–100. [Google Scholar] [CrossRef]
  10. Secretariat, A. The Impact of Expanding Population and Economic Growth on Food, Energy, and the Environment; APEC Economic Committee: Singapore, 1998. [Google Scholar]
  11. Newlyn, W.T. Population Growth and Economic Development: Policy Questions. Popul. Resour. Chang. World Curr. Read. 1989, 82, 1180. [Google Scholar] [CrossRef]
  12. World Commission on Environment and Development. Our Common Future; Oxford University Press: Oxford, UK, 1987. [Google Scholar]
  13. Norgaard, R.B. Economic indicators of resource scarcity: A critical essay. J. Environ. Econ. Manag. 1990, 19, 19–25. [Google Scholar] [CrossRef]
  14. Bell, S.; Morse, S. (Eds.) Routledge Handbook of Sustainability Indicators; Routledge Taylor & Francis Group: London, UK; New York, NY, USA, 2018. [Google Scholar]
  15. Frugoli, P.A.; Almeida, C.M.V.B.; Agostinho, F.; Giannetti, B.F.; Huisingh, D. Can measures of well-being and progress help societies to achieve sustainable development? J. Clean. Prod. 2015, 90, 370–380. [Google Scholar] [CrossRef]
  16. Bell, S.; Morse, S. Sustainability Indicators Past and Present: What Next? Sustainability 2018, 10, 1688. [Google Scholar] [CrossRef]
  17. Xing, L.; Xue, M.G.; Hu, M.S. Dynamic simulation and assessment of the coupling coordination degree of the economy–resource–environment system: Case of Wuhan City in China. J. Environ. Manag. 2019, 230, 474–487. [Google Scholar] [CrossRef] [PubMed]
  18. Aiyetan, I.R.; Olomola, P.A. Environmental degradation, energy consumption, population growth and economic growth: Does Environmental Kuznets curve matter for Nigeria? Econ. Policy Rev. 2017, 16, 2. [Google Scholar]
  19. Bastianoni, S.; Coscieme, L.; Pulselli, F.M. The input-state-output model and related indicators to investigate the relationships among environment, society and economy. Ecol. Model. 2016, 325, 84–88. [Google Scholar] [CrossRef]
  20. Tapia, G.; José, A.; Ionides, E.L. Population health and the economy: Mortality and the Great Recession in Europe. Health Econ. 2017, 26, 219–235. [Google Scholar] [CrossRef] [PubMed]
  21. Yahoo, M.; Othman, J. Employing a CGE model in analysing the environmental and economy-wide impacts of CO2 emission abatement policies in Malaysia. Sci. Total Environ. 2017, 584–585, 234–243. [Google Scholar] [CrossRef] [PubMed]
  22. Raborar, K.J.F. Sustainable development, education for sustainable development and Philippine community. Manag. Sustain. Dev. 2017, 8, 29–34. [Google Scholar] [CrossRef]
  23. Šipilova, V.; Ostrovska, I.; Jermolajeva, E. Evaluation of Sustainable Development in Rural Territories in Latgale Region (Latvia) by Using the Conception of Smart Specialization. J. Teach. Educ. Sustain. 2017, 19, 82–105. [Google Scholar] [CrossRef] [Green Version]
  24. Tan, S.T.; Yang, J.; Yan, J.Y. A holistic low carbon city indicator framework for sustainable development. Appl. Energy 2017, 185, 1919–1930. [Google Scholar] [CrossRef]
  25. United Nations Commission on Sustainable Development. Indicators of Sustainable Development: Framework and Methodologies; United Nations: New York, NY, USA, 1996. [Google Scholar]
  26. The Administrative Center for China’s Agenda 21. Theory and Practice of Indicators Systems for Sustainable Development; Social Sciences Academic Press: Beijing, China, 2004; p. 150. (In Chinese) [Google Scholar]
  27. Hillman, M. Department of the Environment. Indicators of Sustainable Development for the United Kingdom. Policy Stud. 1996, 17, 248–249. [Google Scholar]
  28. Hoffman, J. The Roots Index: Exploring Indices as Measures of Local Sustainable Development, New York City: 1990–95. Soc. Indic. Res. 2000, 52, 95–134. [Google Scholar] [CrossRef]
  29. Leukhardt, F.; Allen, S. How environmentally focused is the German sustainability strategy? A critical discussion of the indicators used to measure sustainable development in Germany. Environ. Dev. Sustain. 2013, 15, 149–166. [Google Scholar] [CrossRef]
  30. Zeng, R.; Wei, Y.M.; Fan, Y.; Li, Z.J.; Xu, W.X. System Analysis of Harmonization Development among Population, Resource, Environment and Economy. Syst. Eng. Theory Pract. 2000, 20, 1–6. (In Chinese) [Google Scholar]
  31. Wu, M.R.; Zhao, M. Research on Chinese Different Regional Sustainable Development Capacity and its Spatial Differentiation. Shanghai J. Econ. 2016, 10, 84–92. (In Chinese) [Google Scholar]
  32. Sun, X.; Hao, Z.Y.; Chen, P.A. A Case Study on Shandong Province: Temporal-Spatial Difference of Sustainable Development. Resour. Ind. 2013, 15, 13–18. (In Chinese) [Google Scholar]
  33. Xue, B.; Zhang, Z.L.; Guo, X.J.; Chen, X.P.; Geng, Y. A study on the coupling relationships between regional economic growth and environmental pressure: Case of Ningxia Autonomous Region. Ecol. Environ. Sci. 2010, 19, 1125–1131. (In Chinese) [Google Scholar]
  34. Tan, F.F.; Zhang, M.; Li, H.R.; Lu, Z.H. Assessment on coordinative ability of sustainable development of Beijing-Tianjin-Hebei Region based on set pair analysis. Acta Ecol. Sin. 2014, 11, 3090–3098. (In Chinese) [Google Scholar]
  35. Dong, Y.H.; Zhong, D.S.; Lu, X.L. Comparative study of the application of PCA and AHP to the analysis and evaluation of the regional sustainable development. J. Saf. Environ. 2016, 16, 359–365. (In Chinese) [Google Scholar]
  36. Chou, F.D. On Comprehensive Evaluation of county sustainable Development. Econ. Geogr. 2003, 3, 319–322. (In Chinese) [Google Scholar]
  37. Ye, S.J.; Yan, Z.Q.; Yang, Q.L. A Case Study on Nanning City: Regional PRED Comprehensive Coordination Based on Entropy and Comprehensive Evaluation. Resour. Ind. 2015, 17, 82–87. (In Chinese) [Google Scholar]
  38. Liu, Y.H.; Ye, G.H. PRED analysis and scenario simulation study of North Guangxi Gulf Economic Zone on the basis of SD. Rural Econ. Sci. Technol. 2018, 29, 148–151. (In Chinese) [Google Scholar]
  39. Kong, W.; Ren, L.; Wang, S.J.; Liu, Y.F. Spatial and temporal evolution of the ecological environment and economy coordinated development in Hebei Province, China. Chin. J. Appl. Ecol. 2016, 27, 2941–2949. (In Chinese) [Google Scholar]
  40. Lu, C.Y.; Zhu, W.L.; Li, H.J.; Xue, B.; Zhang, Z.L. Study on Comprehensive Measurement of Regional Sustainable Development in the Loess Plateau of East Gansu Province—A Case Study of Qingyang City. Res. Soil Water Conserv. 2015, 22, 210–217. (In Chinese) [Google Scholar]
  41. Costanza, R.; Daly, L.; Fioramonti, L.; Giovannini, E.; Kubiszewski, I.; Mortensen, L.F.; Pickett, K.E.; Ragnarsdottir, K.V.; Vogli, R.D.; Wilkinson, R. Modelling and measuring sustainable wellbeing in connection with the UN Sustainable Development Goals. Ecol. Econ. 2016, 130, 350–355. [Google Scholar] [CrossRef]
  42. Parris, T.M.; Kates, R.W. Characterizing and measuring sustainable development. Annu. Rev. Environ. Resour. 2003, 28, 559–586. [Google Scholar] [CrossRef]
  43. Sinha, B.S.; Datta, S.K. Revisiting the link between socio-economic development and environmental status indicators—Focus on panel data. Environ. Dev. Sustain. 2015, 17, 567–586. [Google Scholar] [CrossRef]
  44. Qin, S.G.; Duan, H.M.; Li, Z.J. Study on Coordinated Development of Population, Economy and Environment in Resource: Taking Karamay City as an Example. Ecol. Econ. 2016, 32, 93–97. (In Chinese) [Google Scholar]
  45. Lu, C.Y.; Li, W.L.; Li, H.J.; Lu, C.P.; Zhang, Z.L. Study on Comprehensive Measurement of Coordinated Development of Economy-Society-Resource-Environment—A Case Study of Qingyang City, Gansu Province. Resour. Dev. Mark. 2017, 33, 916–921. (In Chinese) [Google Scholar]
  46. National Bureau of Statistics. China Statistical Yearbook; China Statistics Press: Beijing, China, 2016. (In Chinese)
  47. National Bureau of Statistics; Ministry of Environment Protection. China Statistical Yearbook on Environment; China Statistics Press: Beijing, China, 2016. (In Chinese)
  48. Department of Comprehensive Statistics of National Bureau of Statistics. China Compendium of Statistics 1949–2008; China Statistics Press: Beijing, China, 2010. (In Chinese)
  49. Ding, Y.; de Vries, B.; Han, Q. Measuring Regional Sustainability by a Coordinated Development Model of Economy, Society, and Environment: A Case Study of Hubei Province. Procedia Environ. Sci. 2014, 22, 131–137. [Google Scholar] [CrossRef] [Green Version]
  50. Chen, D.L.; Peng, B.F.; Xiong, J.X. The Coupling Characteristics of Eco-economic System in Dongting Lake Area. Sci. Geogr. Sin. 2013, 33, 1338–1346. (In Chinese) [Google Scholar]
  51. Jiang, W.J. Coupling Coordination Degree Analysis of Population—Regional economy—Environment Development. Stat. Decis. 2017, 15, 101–104. (In Chinese) [Google Scholar]
  52. Zhou, G.P. The Research on the Evaluation System of Economic Development Based on the Method of Entropy and AHP. Master’s Degree, Dalian University of Technology, Dalian, China, 2007. (In Chinese). [Google Scholar]
  53. Wang, S.X.; Wang, X.F.; Chang, Y.M. Study on the coordination of population and economic system based on Moran’s I and LISA. Stat. Decis. 2014, 6, 90–93. (In Chinese) [Google Scholar]
  54. Ren, P.; Wu, T.; Zhou, J.M. Analysis of spatial distribution pattern and evolutionary characteristics of cultivated lands based on spatial autocorrelation model and GIS platform—A case study of Longquanyi District, Chengdu, China. Chin. J. Eco-Agric. 2016, 24, 325–334. (In Chinese) [Google Scholar]
  55. Tiefelsdorf, M.; Boots, B. A Note on the Extremities of Local Moran’s Iis and Their Impact on Global Moran’s I. Geogr. Anal. 2010, 29, 248–257. [Google Scholar] [CrossRef]
  56. Hong, K.R.; Huan, X.X.; Sun, Q. Quantitative Evaluation and Comparative Analysis for Coordinated Development of Resource, Environment, Economy and Society in Central China. Econ. Geogr. 2013, 33, 16–23. (In Chinese) [Google Scholar]
  57. Ren, M.; Ren, J.L.; Liu, K. Coupling Between Subsystems and the Spatial Pattern of China’s Sustainable Development. J. Ludong Univ. 2017, 33, 55–60. (In Chinese) [Google Scholar]
  58. Xie, M.X.; Wang, J.Y.; Chen, K. Coordinated development analysis of the “resources-environment-ecology-economy-society” complex system in China. Sustainability 2016, 8, 582. [Google Scholar] [CrossRef]
  59. Peng, C.; Chen, Z.F.; Wu, H.R.; Sun, X.; Yao, N. Spatial-temporal Differentiation of Urban Sustainable Development in China based on ESDA. China Popul. Resour. Environ. 2016, 26, 144–151. (In Chinese) [Google Scholar]
  60. Jiang, L.; Bai, L.; Wu, Y.M. Coupling and Coordinating Degrees of Provincial Economy, Resources and Environment in China. J. Nat. Resour. 2017, 32, 788–799. (In Chinese) [Google Scholar]
  61. Shaker, R.R.; Sirodoev, I.G. Assessing sustainable development across Moldova using household and property composition indicators. Habitat Int. 2016, 55, 192–204. [Google Scholar] [CrossRef]
  62. Wei, C.; Wang, Z.Q.; Lan, X.; Zhang, H.W.; Meng, J.F. The Spatial-Temporal Characteristics and Dilemmas of Sustainable Urbanization in China: A New Perspective Based on the Concept of Five-in-One. Sustainability 2018, 10, 4733. [Google Scholar] [CrossRef]
Figure 1. The trend of coupling coordination degree of different provinces in China.
Sustainability 11 02877 g001aSustainability 11 02877 g001b
Figure 2. The distribution map of coupling coordination degree in China.
Sustainability 11 02877 g002
Figure 3. The map of spatial correlation types in China.
Sustainability 11 02877 g003
Table 1. The developed index system used for assessing the coordinated development level of population-economy-society-resource-environment (PESRE) systems.
The Target LayerThe System LayerThe Criteria LayerThe Index LayerIndex Attribute
The coordinated development of population, economy, society, resource, and the environmentPopulation systemPopulation sizePopulation count
Population density
Natural rate of population growth
Population structureProportion of nonagricultural population+
Overall dependency ratio
Aging coefficient
Population qualityAverage life expectancy+
Years of education per capita+
Proportion of those with a college degree and above+
Economic systemEconomic sizeGDP per capita+
Fiscal revenue per capita+
Social investment in fixed assets per capita+
Total retail sales of consumer goods per capita+
Economic structurePercentage of primary industry output values to GDP
Percentage of tertiary industry output values to GDP+
Foreign trade dependence+
Economic benefitInput–output ratio+
Social systemPeople’s quality of lifeDisposable income of urban residents per capita+
Net income of rural residents per capita+
Engel coefficient of urban residents
Engel coefficient of rural residents
Floor area of residential building per capita+
Social development levelUrban employment rate+
Road transport mileage per capita+
Volume of postal and telecommunication services per capita+
Number of health technicians per 10,000 people+
Number of public libraries per 10,000 people+
Percentage of social security expenditure to GDP+
Resource systemResource conditionsCultivated area per capita+
Energy production per capita+
Water resources per capita+
Forest stock per capita+
Resource utilizationWater consumption per 10 thousand Yuan GDP
Energy consumption per 10 thousand Yuan GDP
Grain yield per unit area+
Industrial water reuse efficiency+
Environmental systemEnvironmental pollutionTotal wastewater discharge
Total industrial gas emissions
Total industrial solid waste discharge
Domestic waste discharge in China
Fertilizer application intensity
Environment protection and managementIndustrial wastewater discharge compliance rate+
Urban sewage treatment rate+
Industrial gas purification treatment rate+
Comprehensive utilization rate of industrial solid waste+
Harmless treatment rate of domestic garbage in China+
Ecological environment constructionForest cover rate+
Public green area per capita+
Green coverage rate in built-up areas+
The percentage of environmental protection investment to GDP+
Table 2. The classification standard of the coupling coordination degree.
Coupling Coordination Degree(0, 0.4)(0.4, 0.5)(0.5, 0.6)(0.6, 0.8)(0.8, 1)
LevelUncoordinated development statusOn the verge of uncoordinated development statusWeakly coordinated development statusWell-coordinated development statusPerfectly coordinated development status
Table 3. The results of coupling coordination degree.
Province19952000200520102015
Beijing0.69080.72550.71370.70660.7084
Tianjin0.59480.64090.65510.62460.5870
Hebei0.41800.44010.44420.44440.3916
Shanxi0.50740.50140.54420.54840.5168
Inner Mongolia0.44960.50840.54940.60000.5846
Liaoning0.53190.54480.55050.54380.4990
Jilin0.49690.48530.52280.50810.4579
Heilongjiang0.52540.52720.52630.51190.4865
Shanghai0.64010.69700.70460.68060.6707
Jiangsu0.47960.52600.56130.56190.5447
Zhejiang0.48110.54720.58250.57550.5605
Anhui0.37530.40560.40240.42170.4030
Fujian0.48410.53790.55220.52500.5050
Jiangxi0.42030.44680.42580.44580.4234
Shandong0.45770.48970.49620.51460.4797
Henan0.36870.39110.40600.39790.3789
Hubei0.42990.45770.46570.46080.4542
Hunan0.42420.45830.45350.43930.4159
Guangdong0.53210.58260.58710.56350.5482
Guangxi0.41840.43710.42630.41320.3835
Hainan0.47950.49150.47030.49280.4731
Chongqing0.42920.46980.47750.49200.4852
Sichuan0.38290.39300.42740.44130.4201
Guizhou0.36280.36040.39360.42200.4035
Yunnan0.40720.44290.44120.43620.4194
Tibet0.49460.49580.49920.47260.5227
Shanxi0.41710.45170.45070.47280.4573
Gansu0.38660.40700.43380.42140.4078
Qinghai0.45000.47950.47880.47390.4499
Ningxia0.44330.47480.47350.50890.4998
Xinjiang0.49990.50500.51270.51260.4947
Average0.46710.49430.50410.50430.4849
Table 4. The results of global Moran’s I.
Year19952000200520102015
I0.28860.32080.33640.30370.1953
Z2.82843.11673.20272.91501.9924

