Application of a Smart City Model to a Traditional University Campus with a Big Data Architecture: A Sustainable Smart Campus


Abstract
:1. Introduction
2. Preliminary Concepts
2.1. Big Data
- The content format;
- The type of data;
- The frequency with which the data is made available;
- The intention: how the data should be processed (ad hoc query in the data, for example);
- Volume: the size of the data that can come from multiple sources;
- Velocity: the speed with which data arrives using units such as terabytes, petabytes or exabytes;
- Variety: structured, semi-structured, and unstructured.
2.2. Smart Campus
2.3. Smart Cities
2.4. Internet of Things
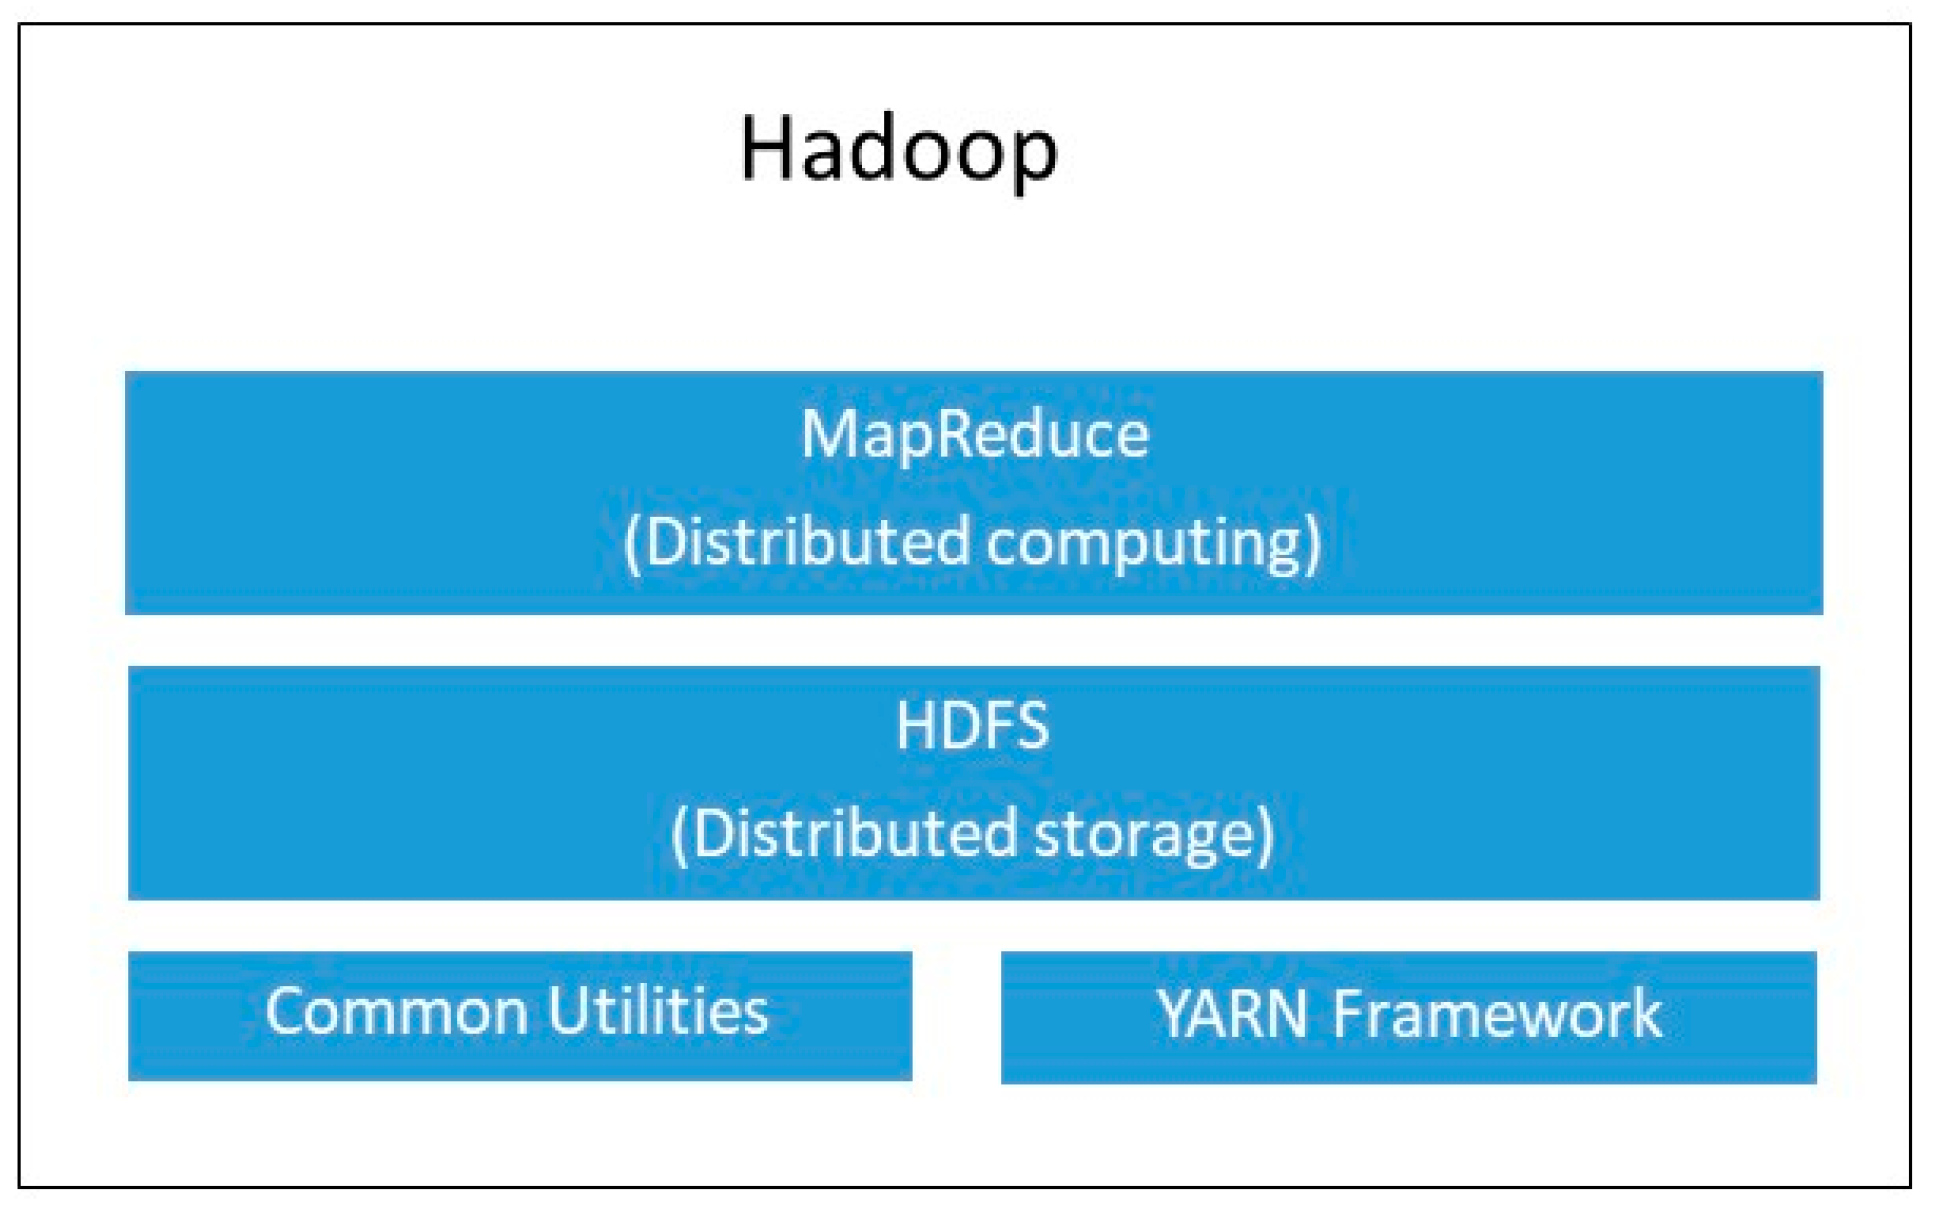
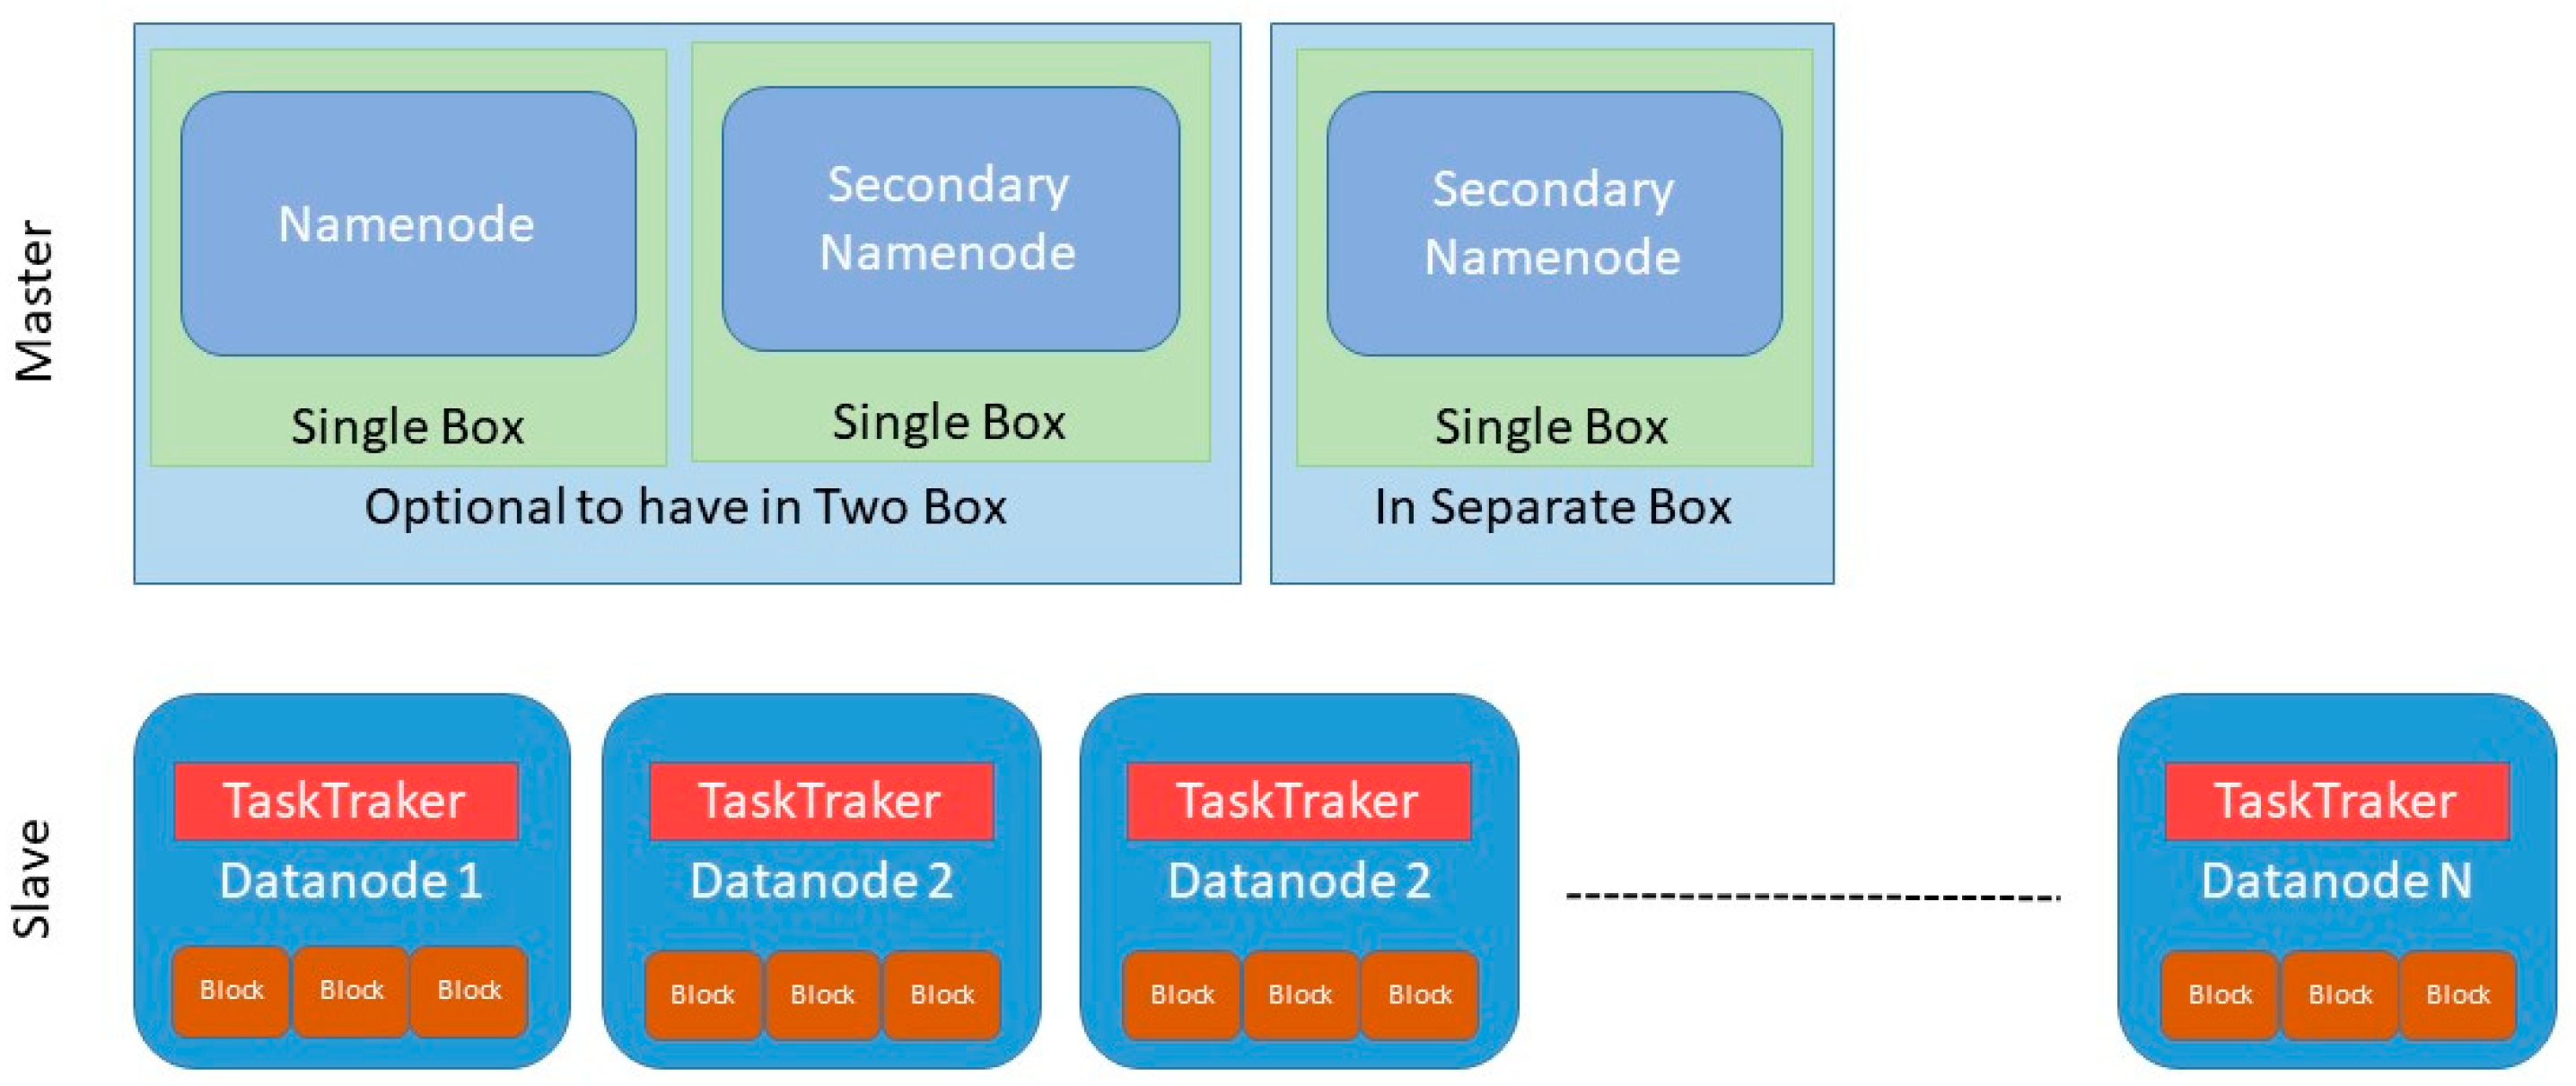
2.5. Hadoop
2.6. Definition of the Problem
3. Related Work
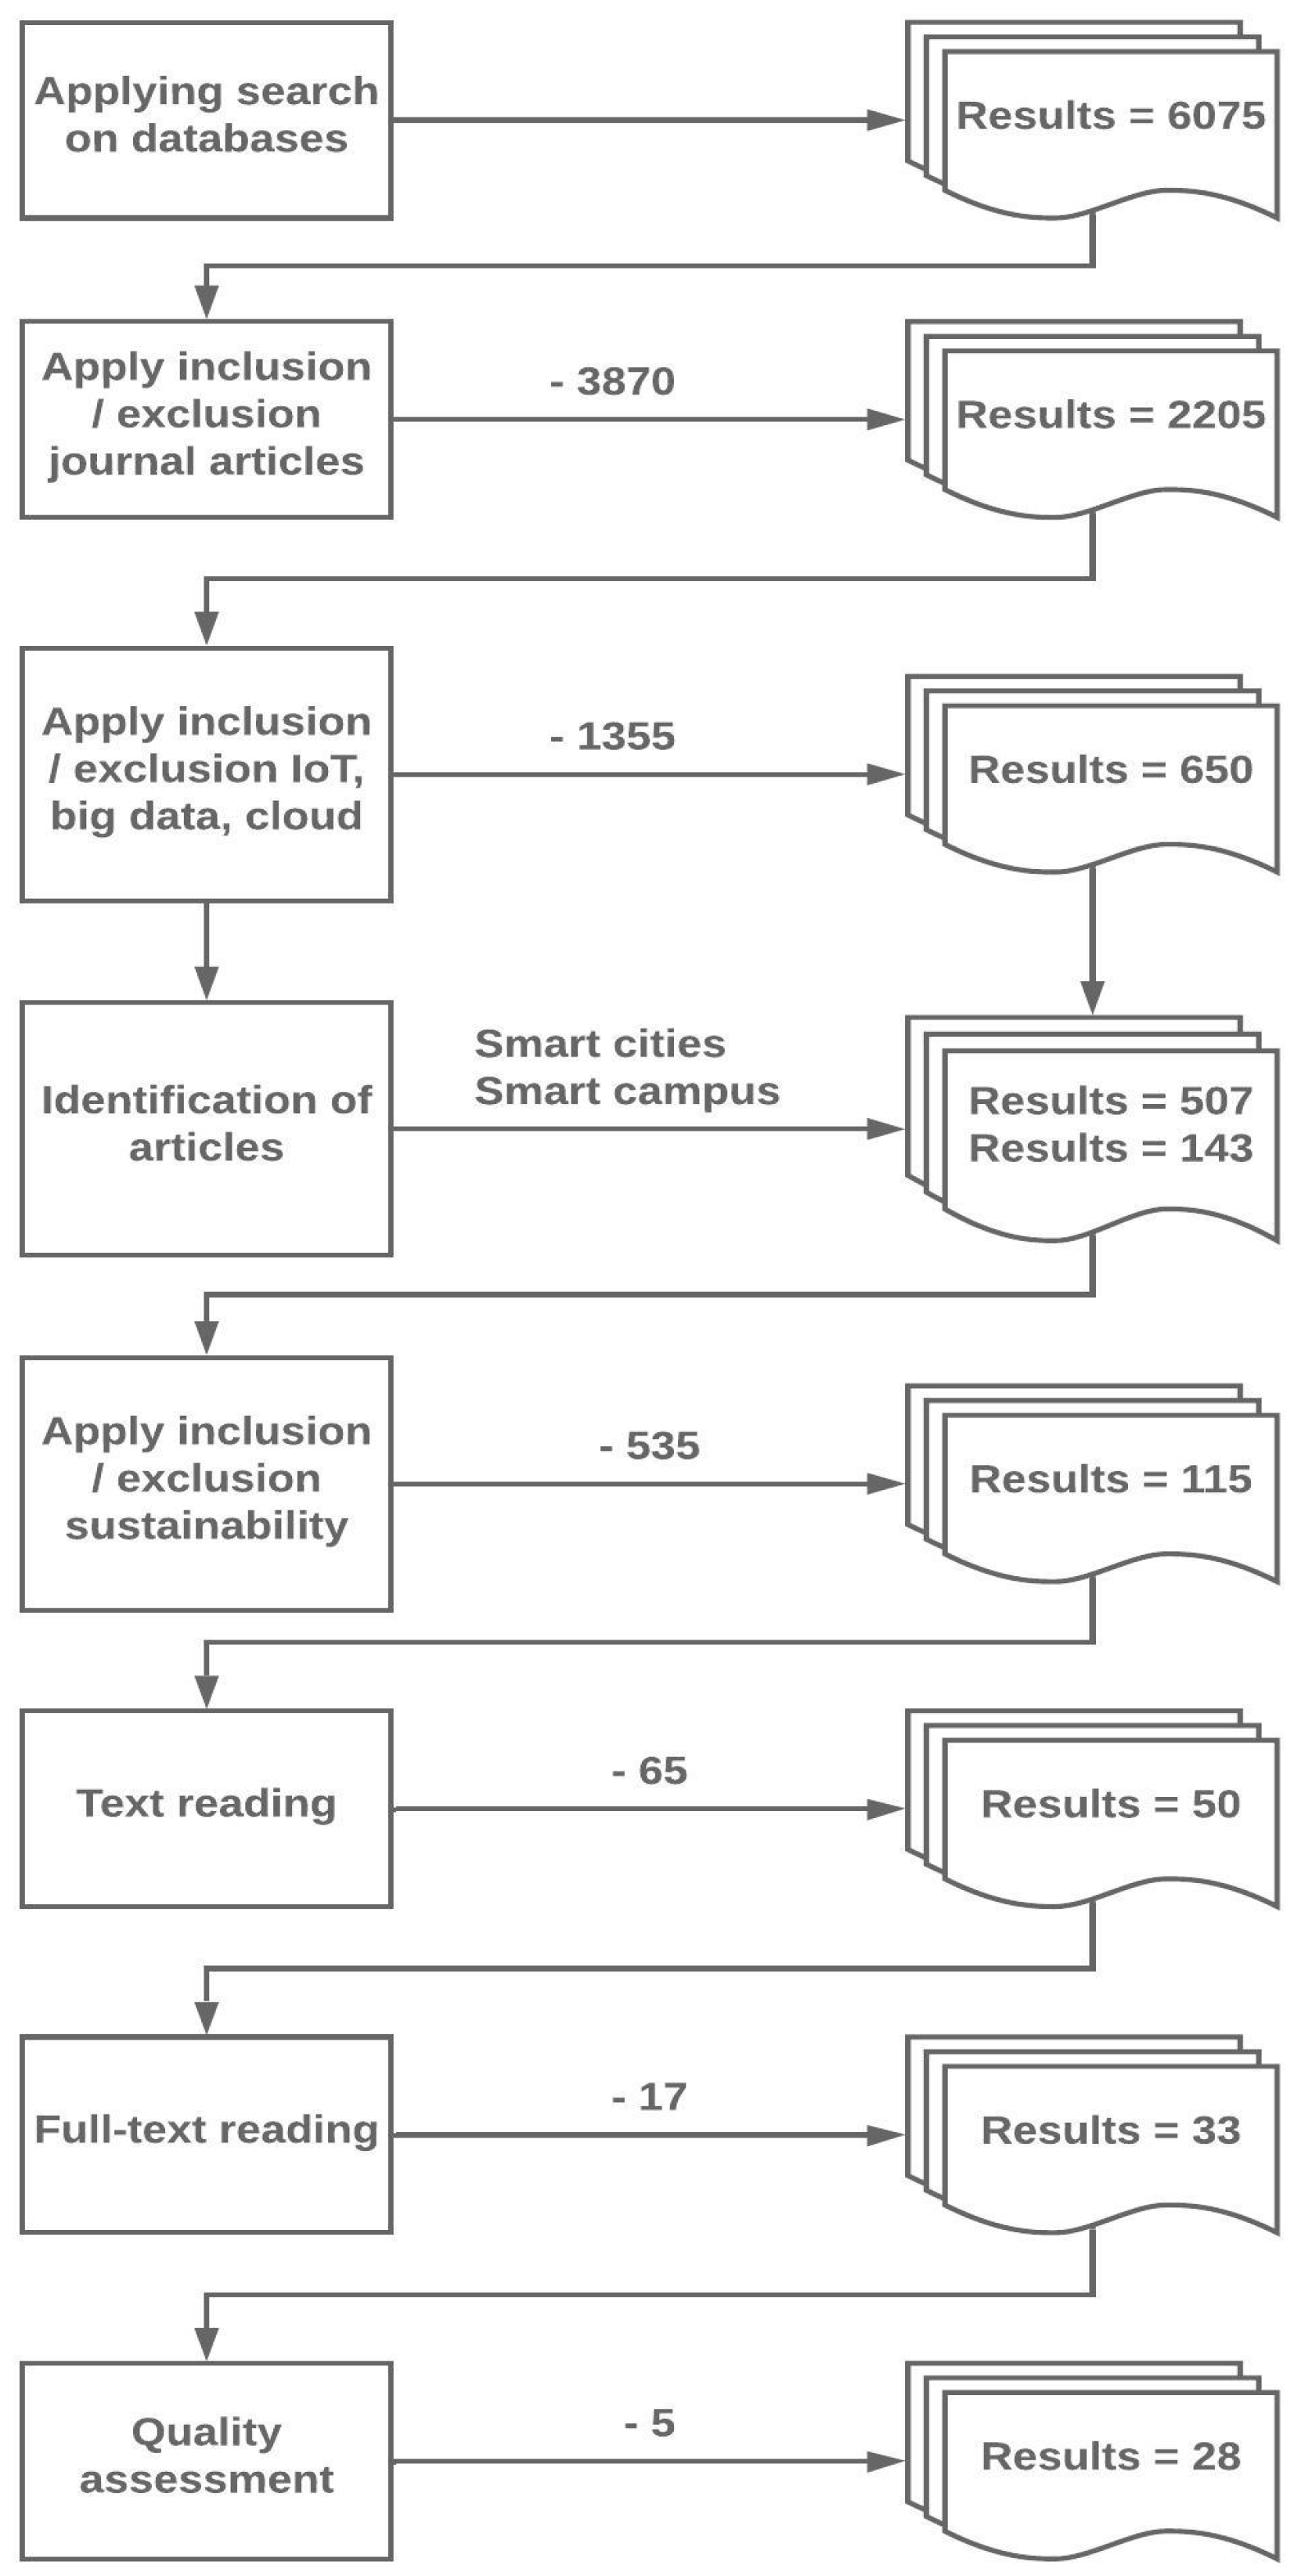
4. Method
4.1. Characteristic Features of University Campuses
- Complexity: One of the main challenges facing university campuses is the level of complexity of the processes that take place within their limits, and in their area of closest influence. So-called “complexity science” is understood as a set of ideas about the self-organizational capacity and the adaptive nature of some complex systems. Complex systems include the climate, natural ecosystems, the economy, and in this case, university campuses.
- Diversity: The campuses differ among themselves because of their geographical location, their academic vocations, or their socio-economic structure. At the same time, very different spaces coexist within each campus. The more sophisticated and disparate the functions of a campus, the more diverse the agents involved in them will be. If the dimension factor is added to this condition, then the greater the size and functional complexity, the greater the number of agents that will have to be counted when formulating policies.
- Uncertainty: For planners, the uncertainty that surrounds the future of university campuses is a constant consideration. Any projection is faced with the task of foreseeing the future of a campus in ten or twenty years. The current limitations of forecasting tools have greater weight in situations that worsen if one operates in a constantly changing environment.
- Sustainability: A university campus generates a significant change in an environment, the installed infrastructure; the consumption of energy, the interaction of people with the environment must be controlled through institutional policies. New technologies provide sufficient means and processes to find a balance between the environment and the consumption of natural resources [43]. Sustainable development must be included in the design of smart campuses, where the needs of all its stakeholders are met without compromising the development of new generations and natural resources.
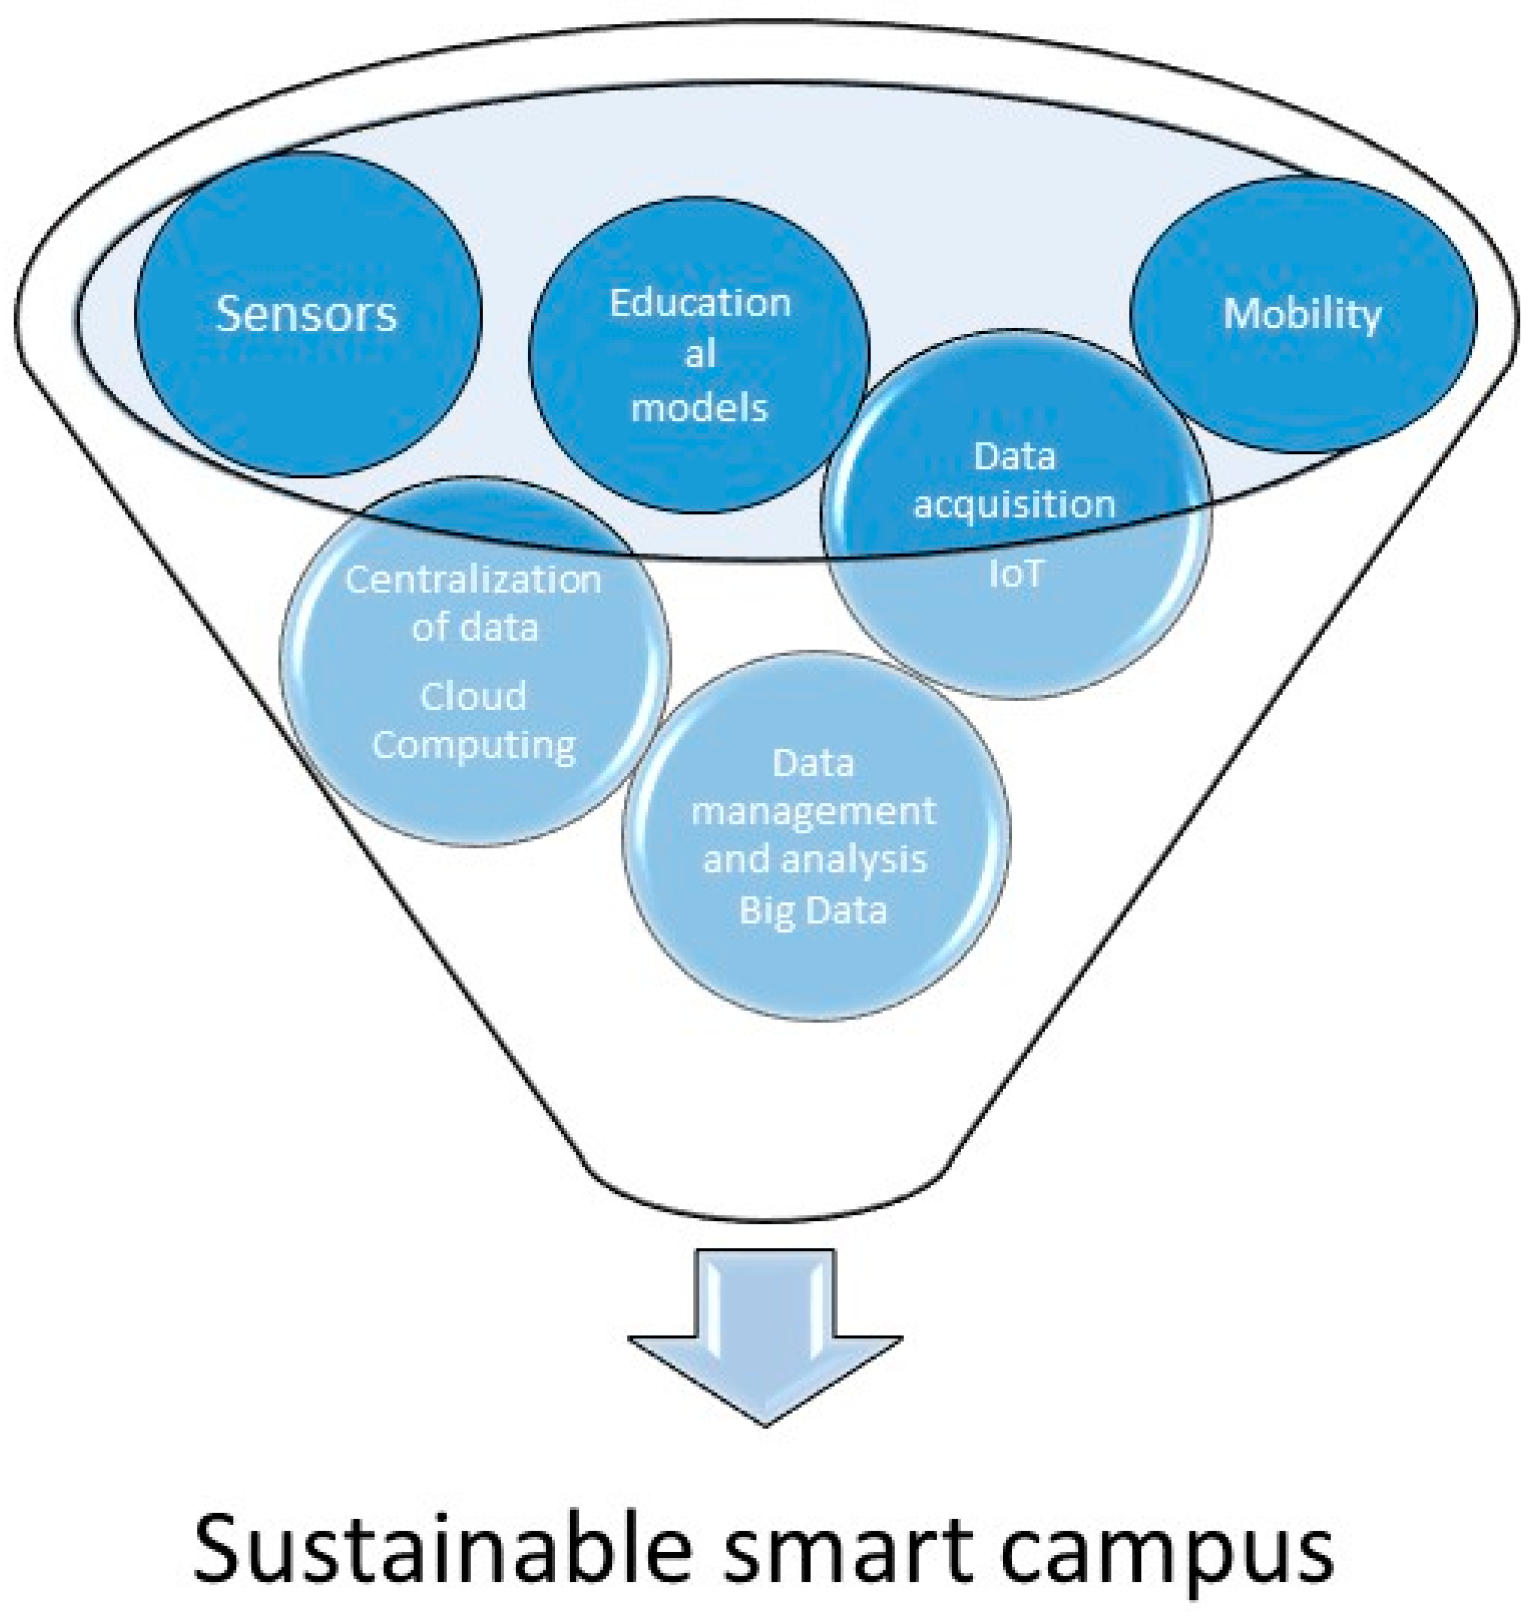
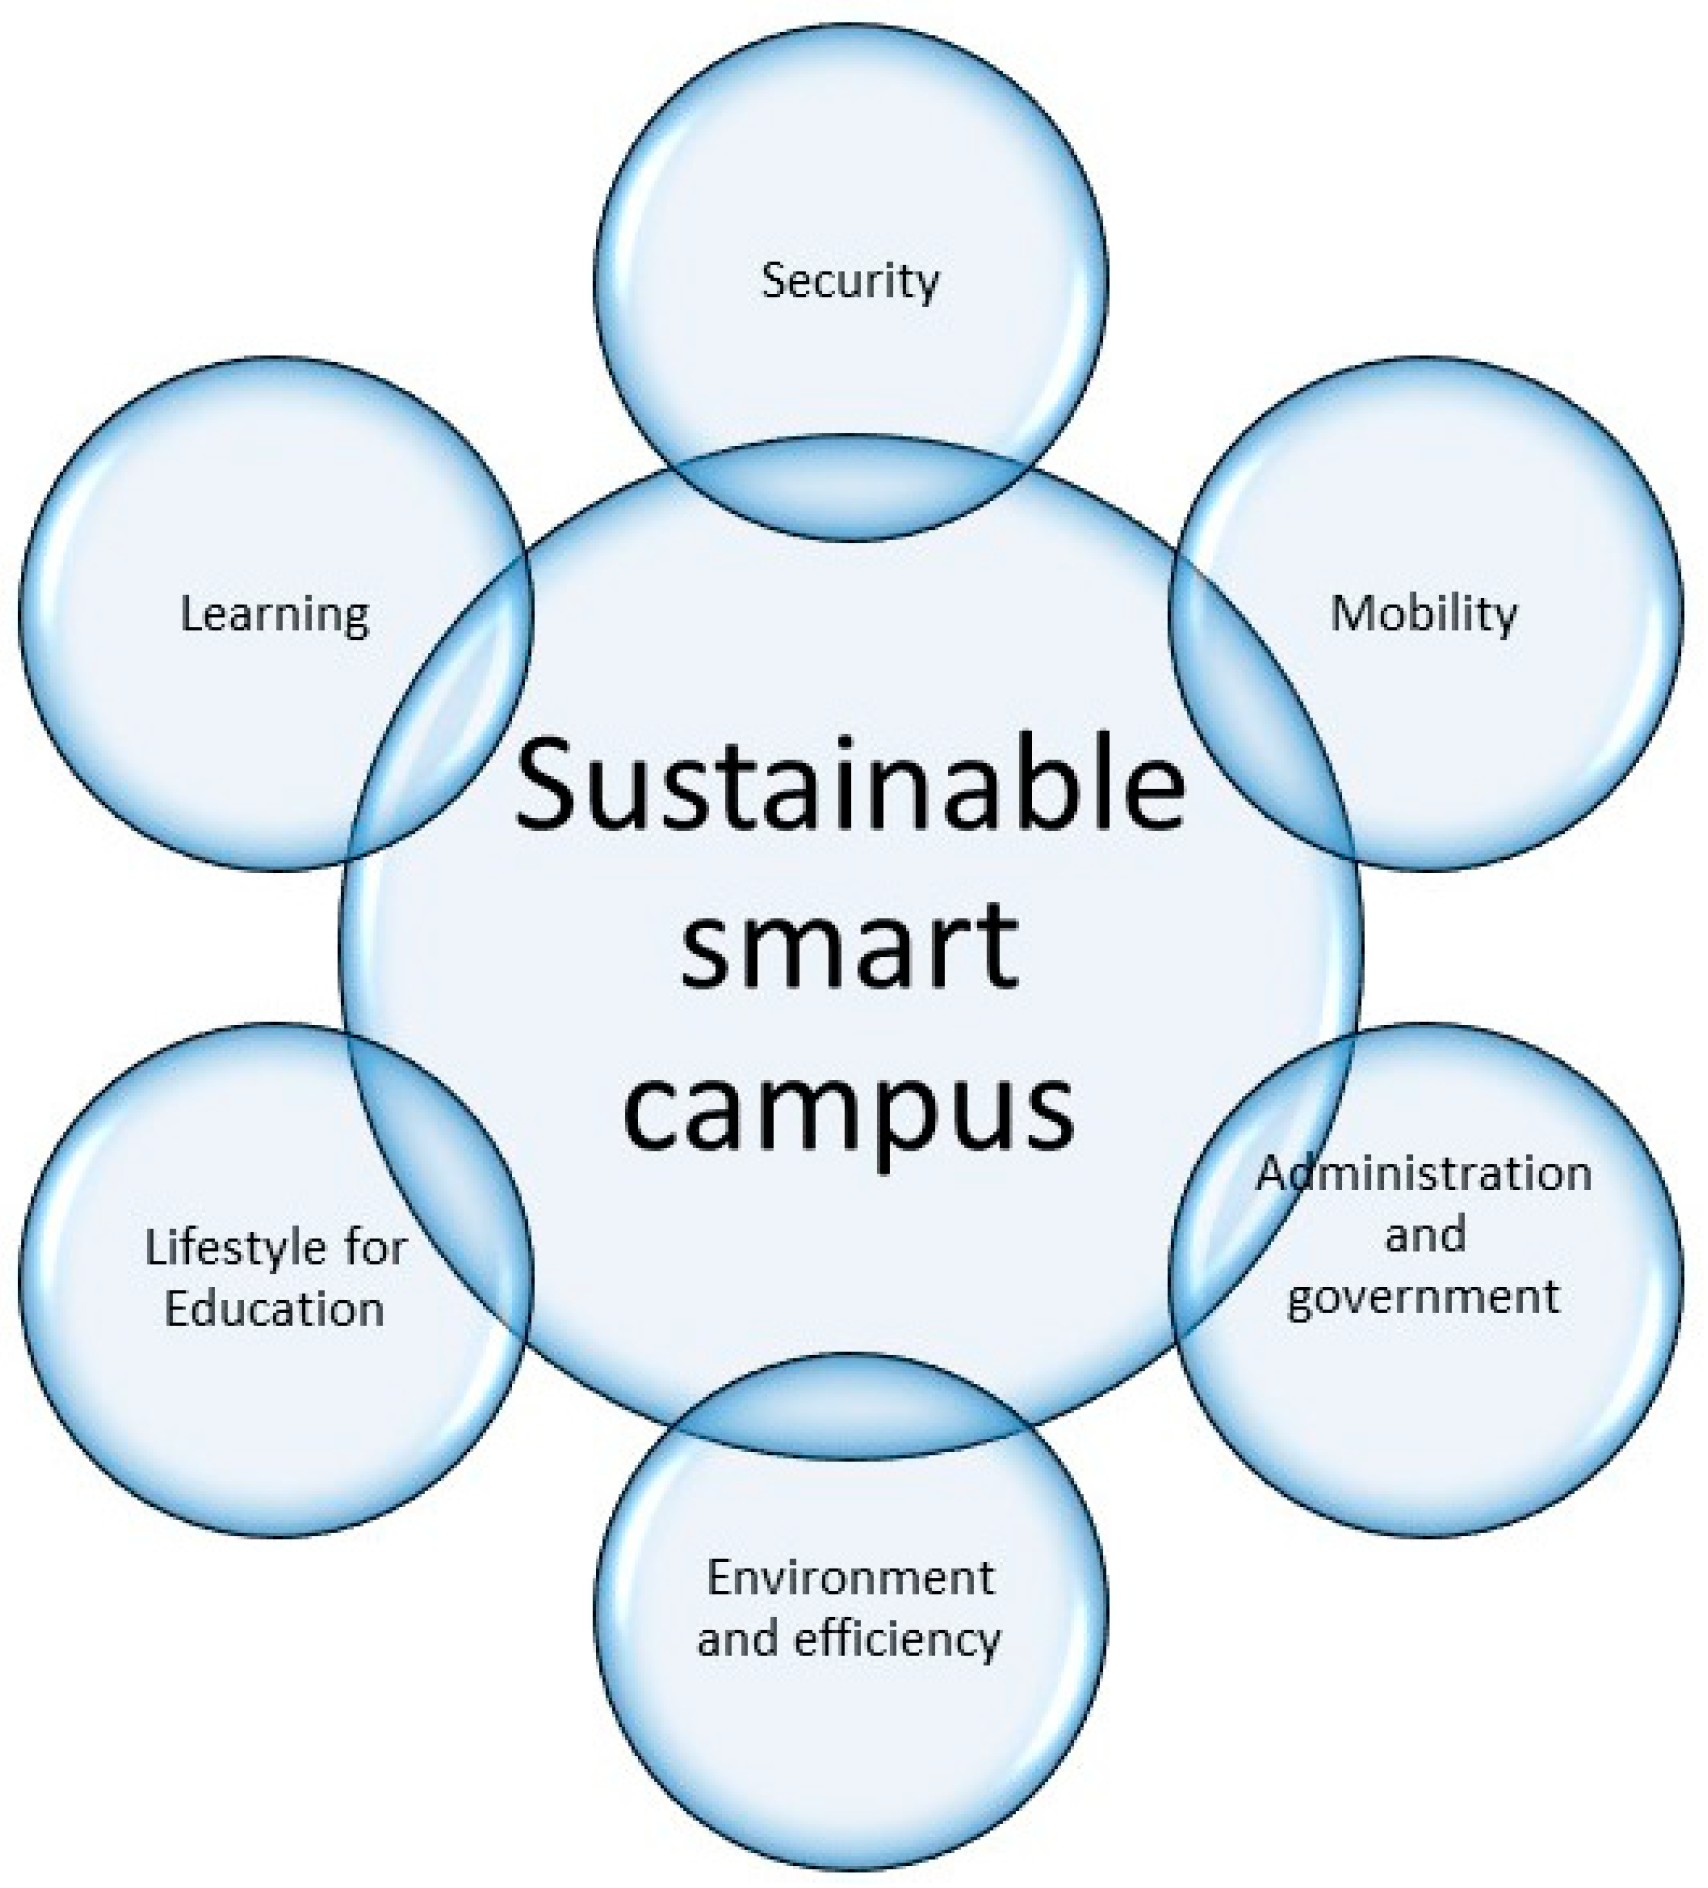
4.2. Components of a Smart Campus
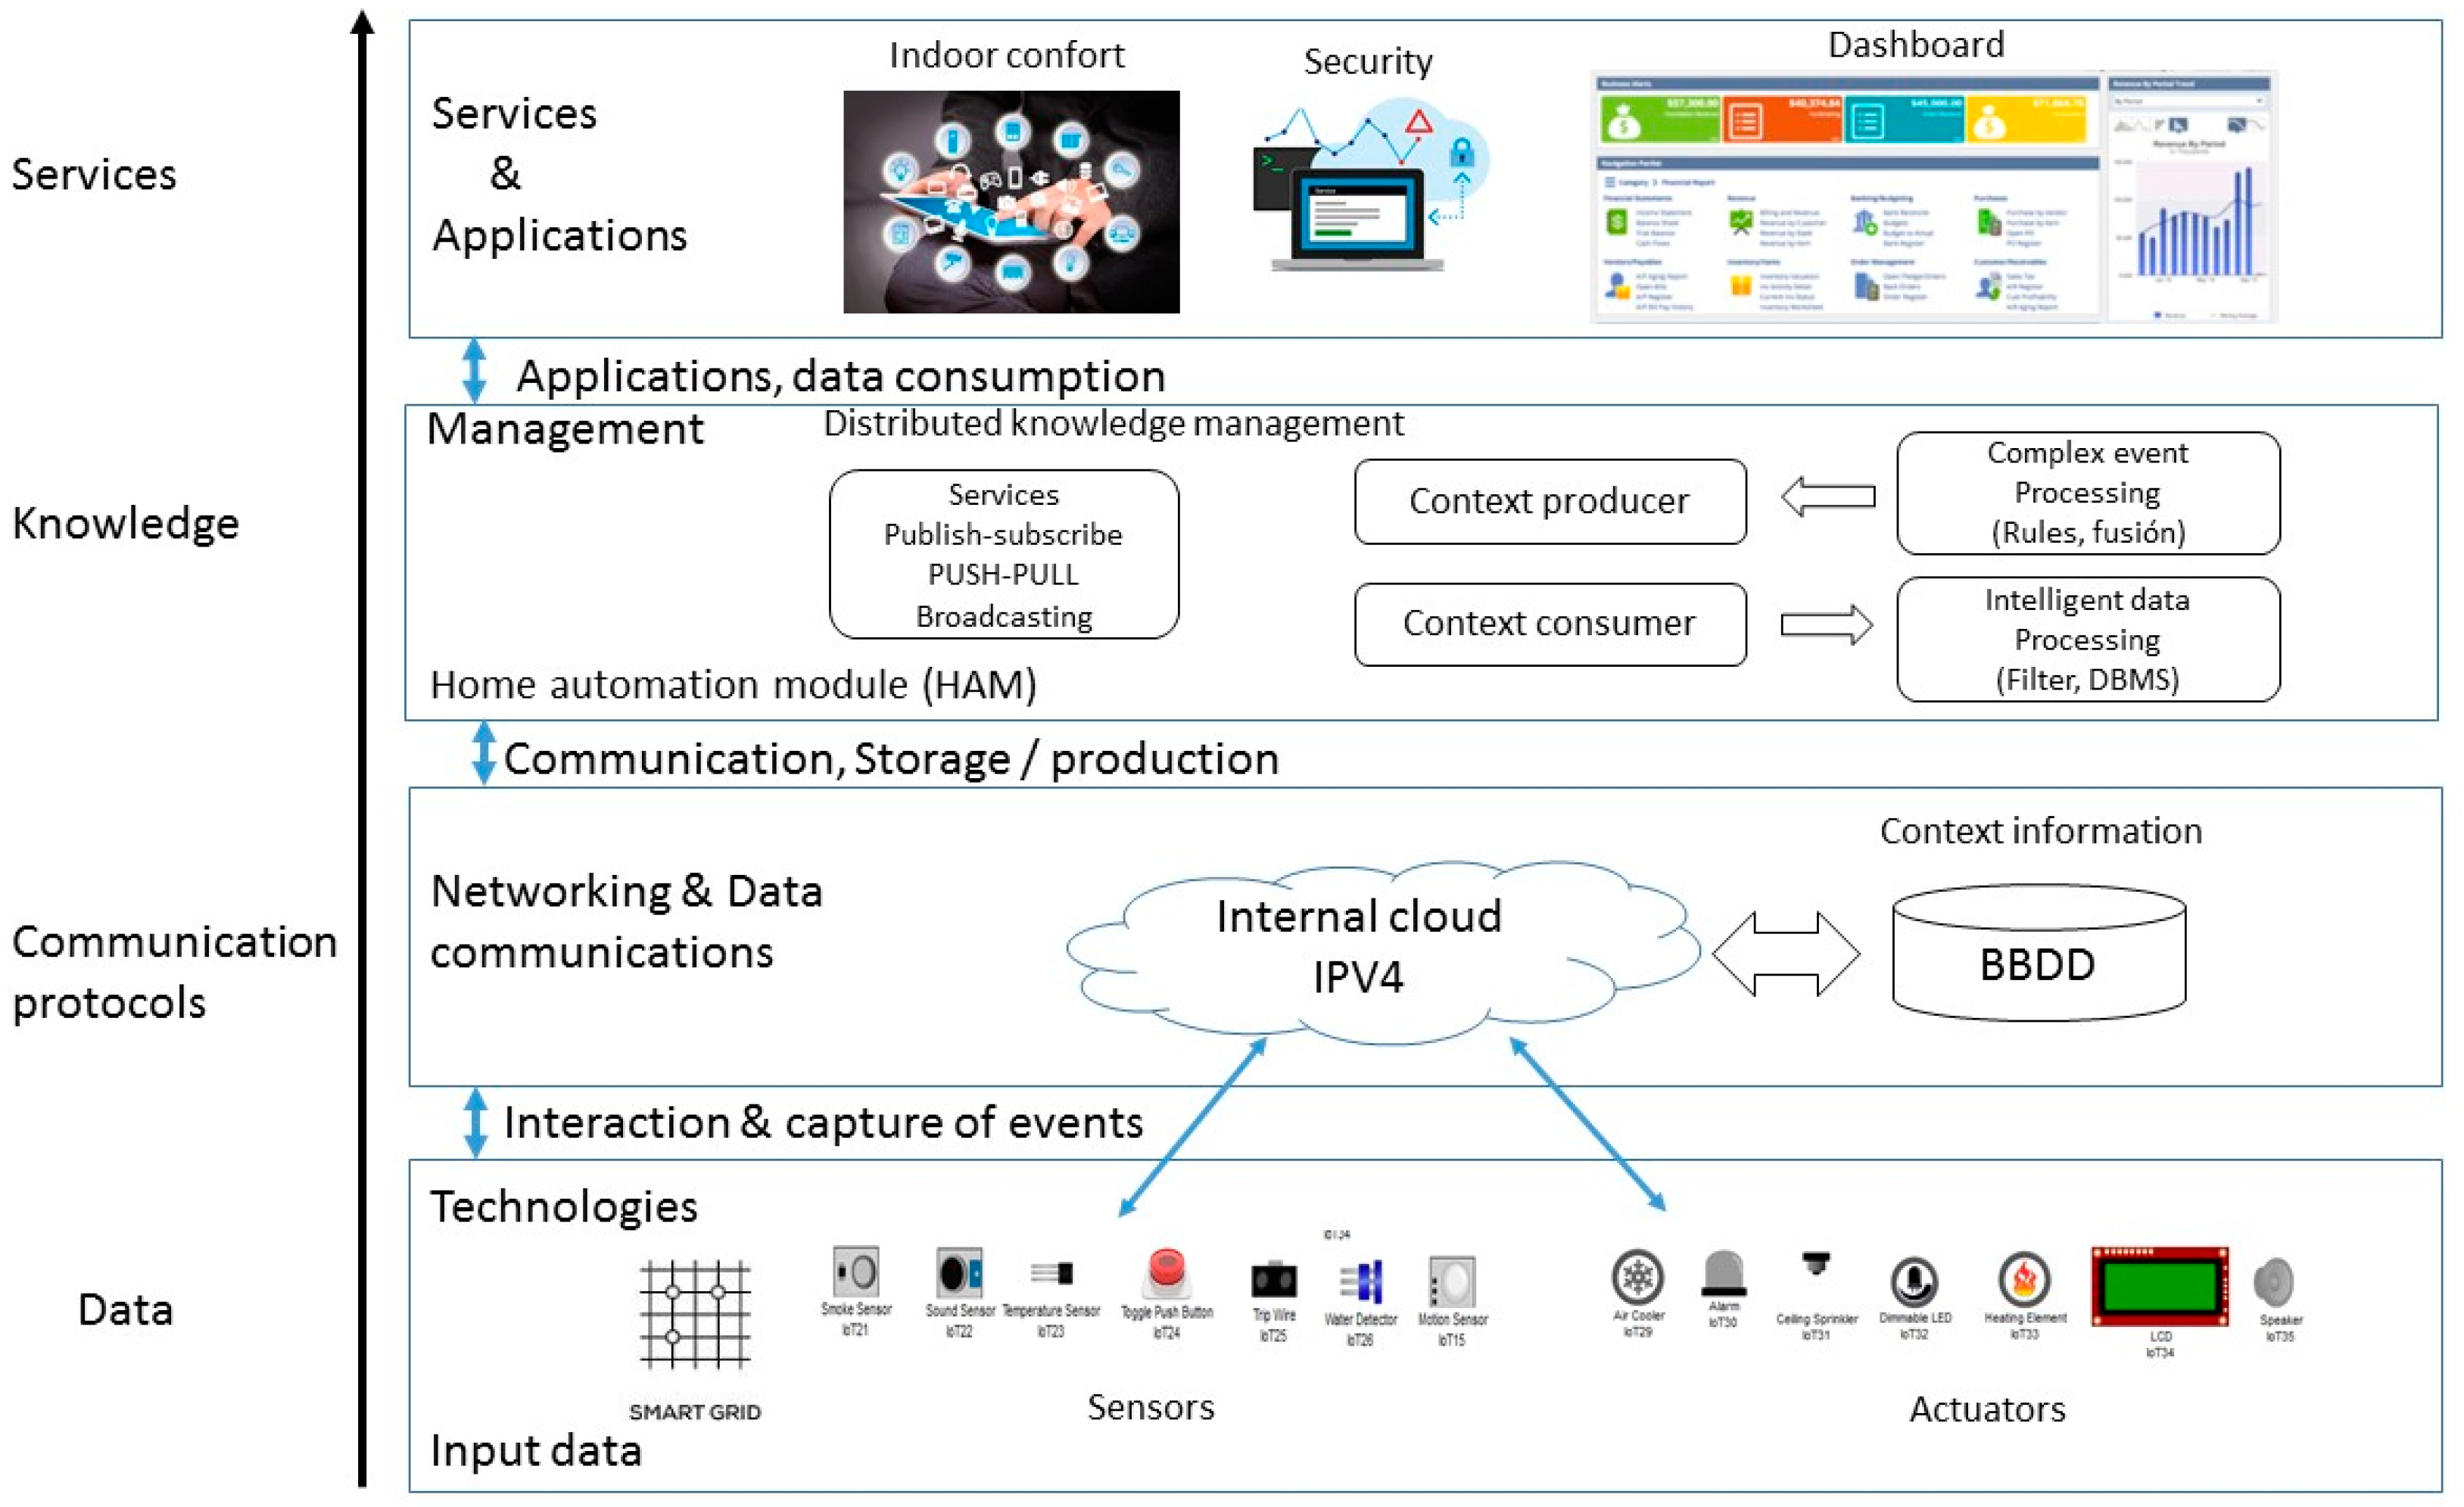
4.2.1. IoT Data Acquisition
- Access control systems: Biometric sensors or RFID readers control the security of the university campus. When detecting any event, the sensors activate the different actuators located strategically in the smart campus [29].
- Automation systems: The university infrastructure is complemented directly with autonomous systems. These systems seek to reduce energy waste, as well as improve the quality of life of the university population. Several of these systems are integrated into the data analysis architecture that helps manage resources efficiently [42].
- Security systems: Security is vital in a university campus, and for this, there are systems of sensors or video surveillance systems that generate information about any event 24 h a day. The potential of these systems allows their data to be used for other activities, such as detecting trends or identifying special needs of the population. The monitoring capacity added to the analysis process allows autonomous control of the services offered by the university.
- Automatic dispensing system: Automatic dispensers are widely used in university campuses and are devices that have relevant information on the trends of the population that consumes these products. The analysis of these data can reveal which product is the most consumed in different periods.
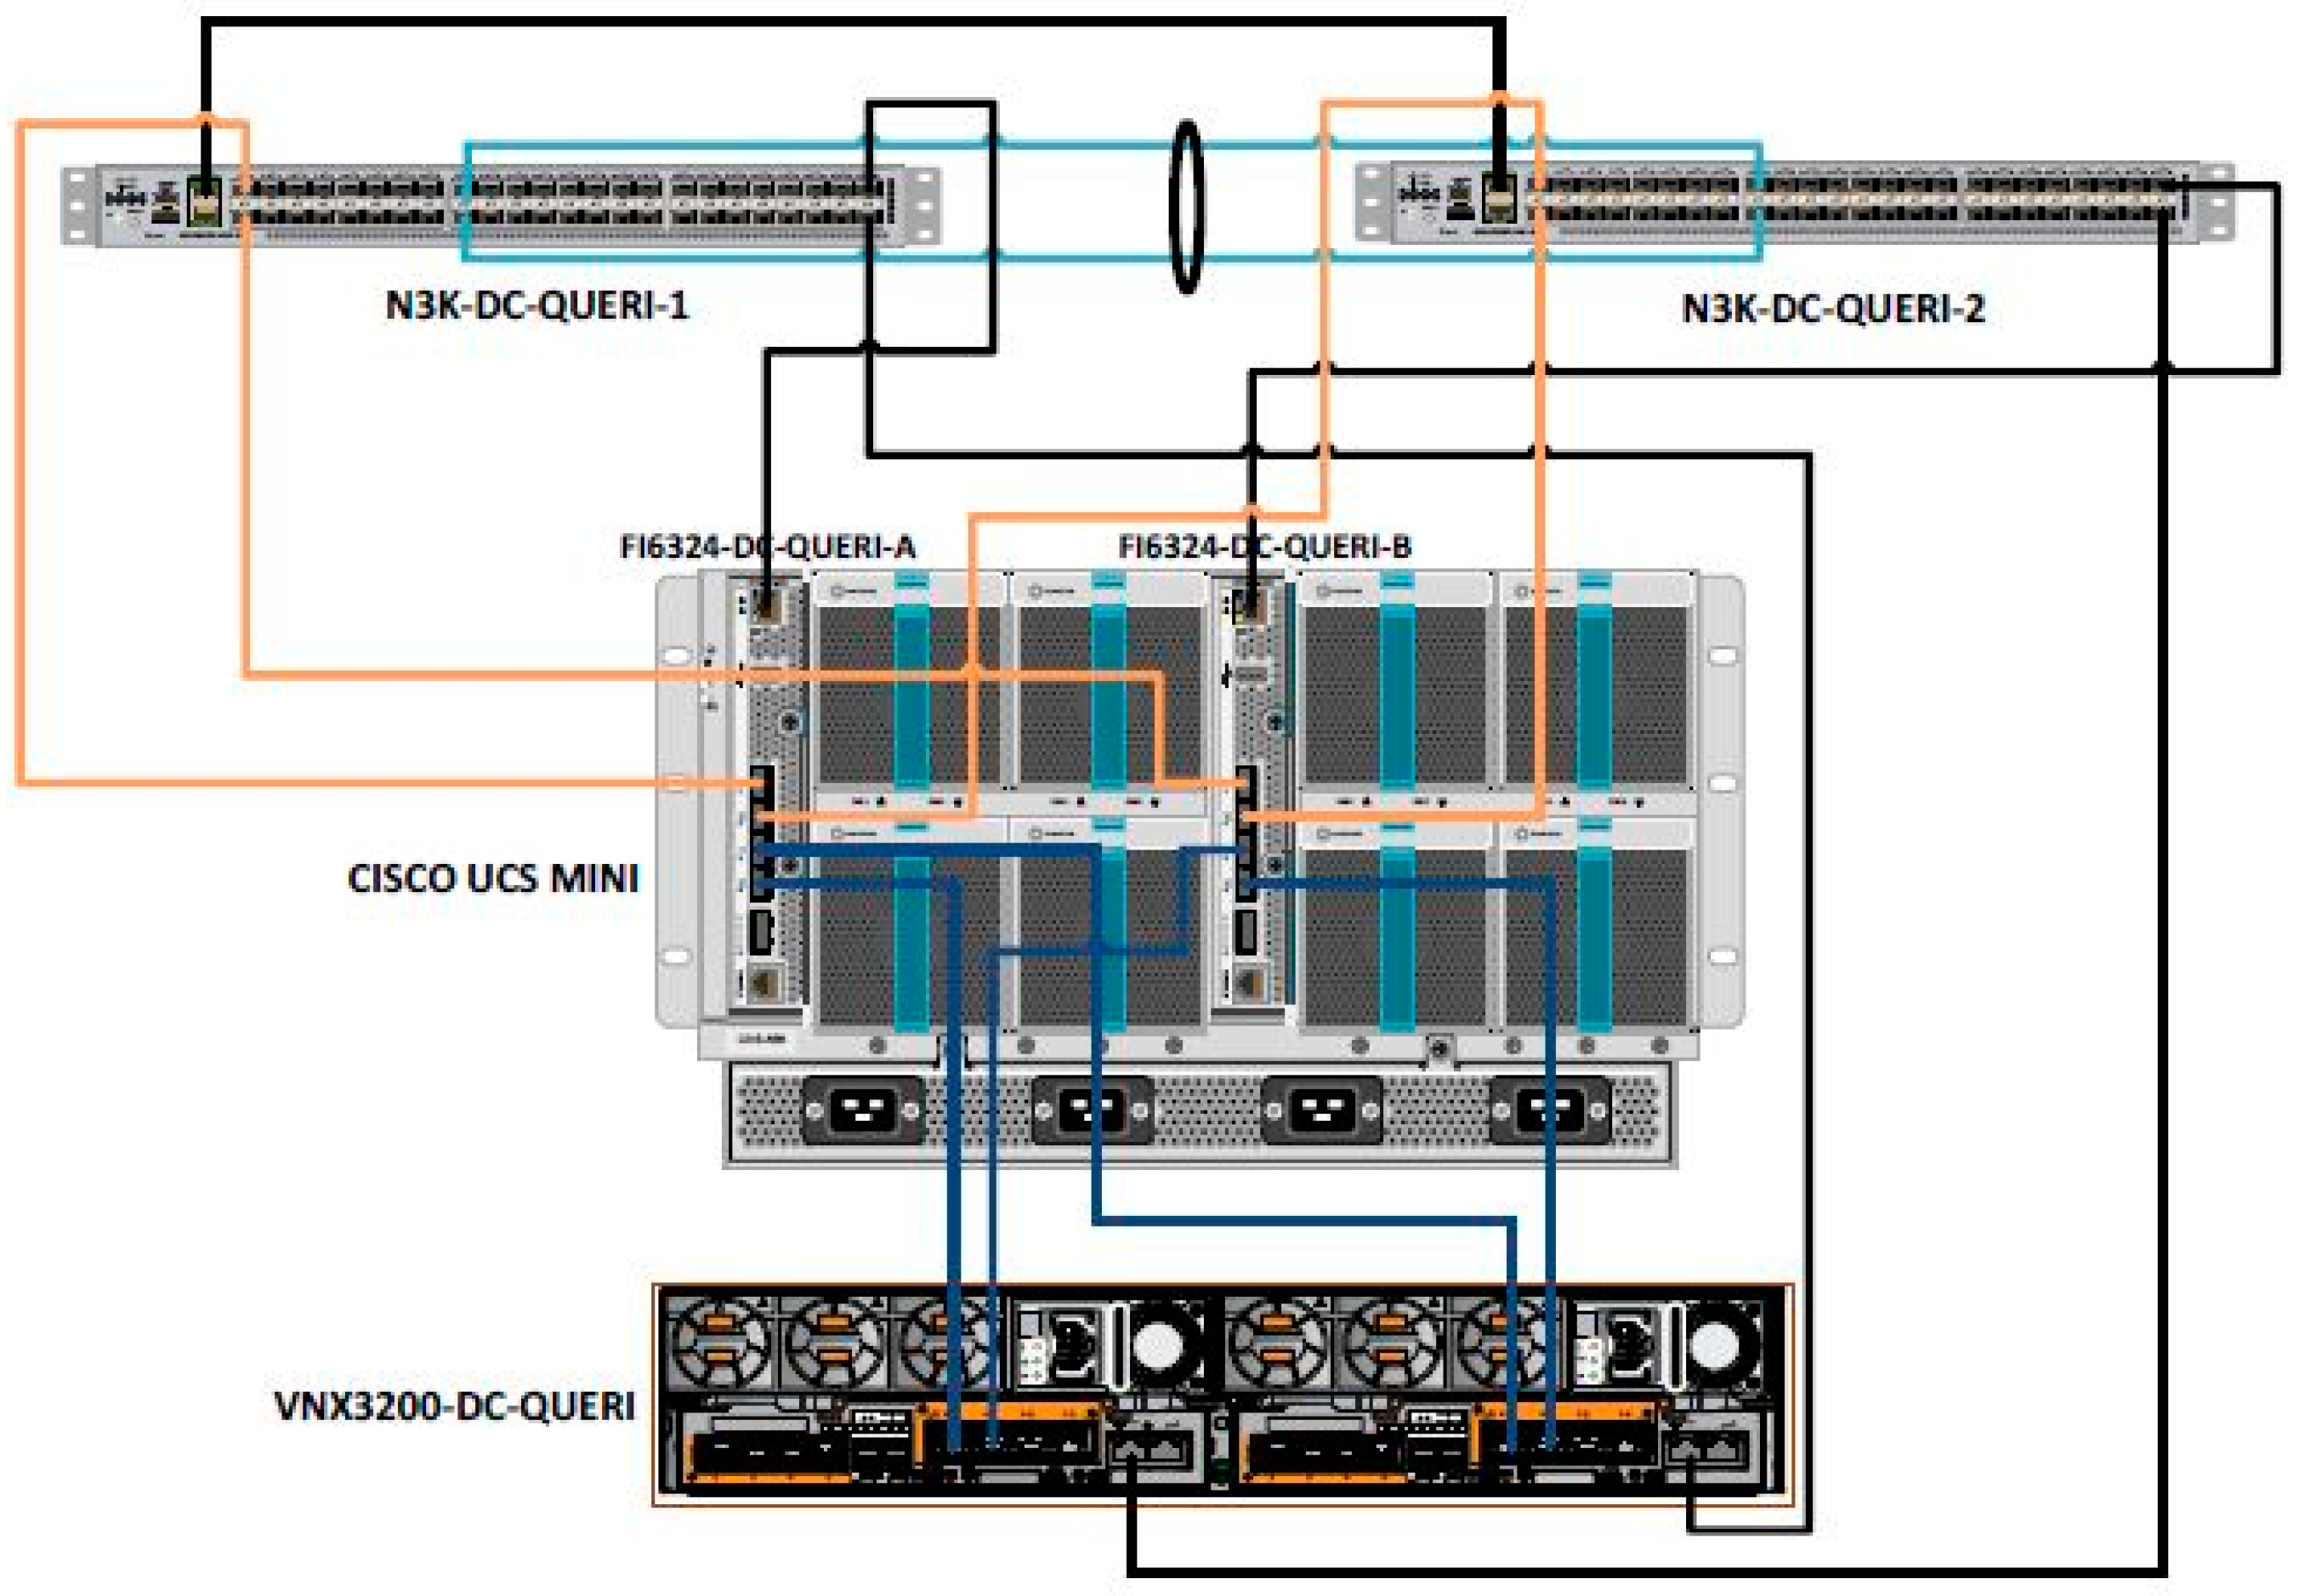
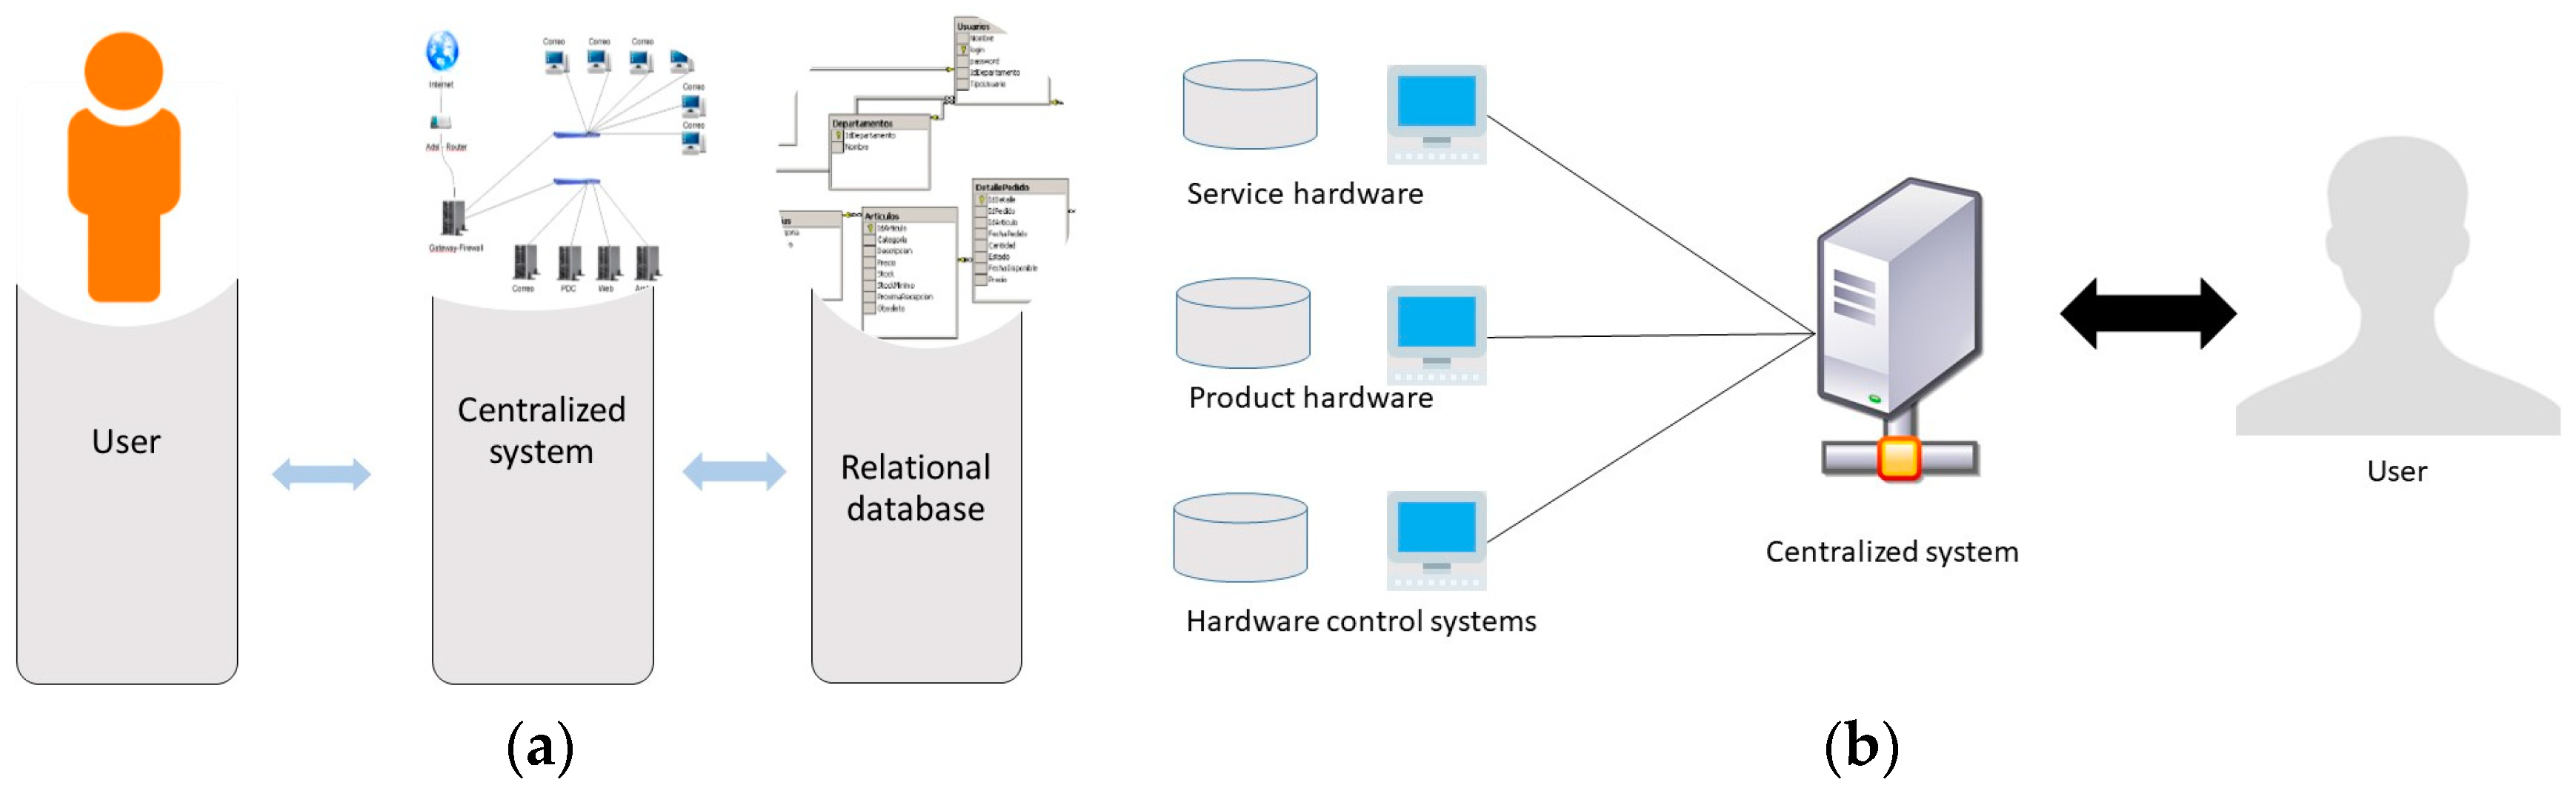
4.2.2. Cloud Computing and Centralization of Data
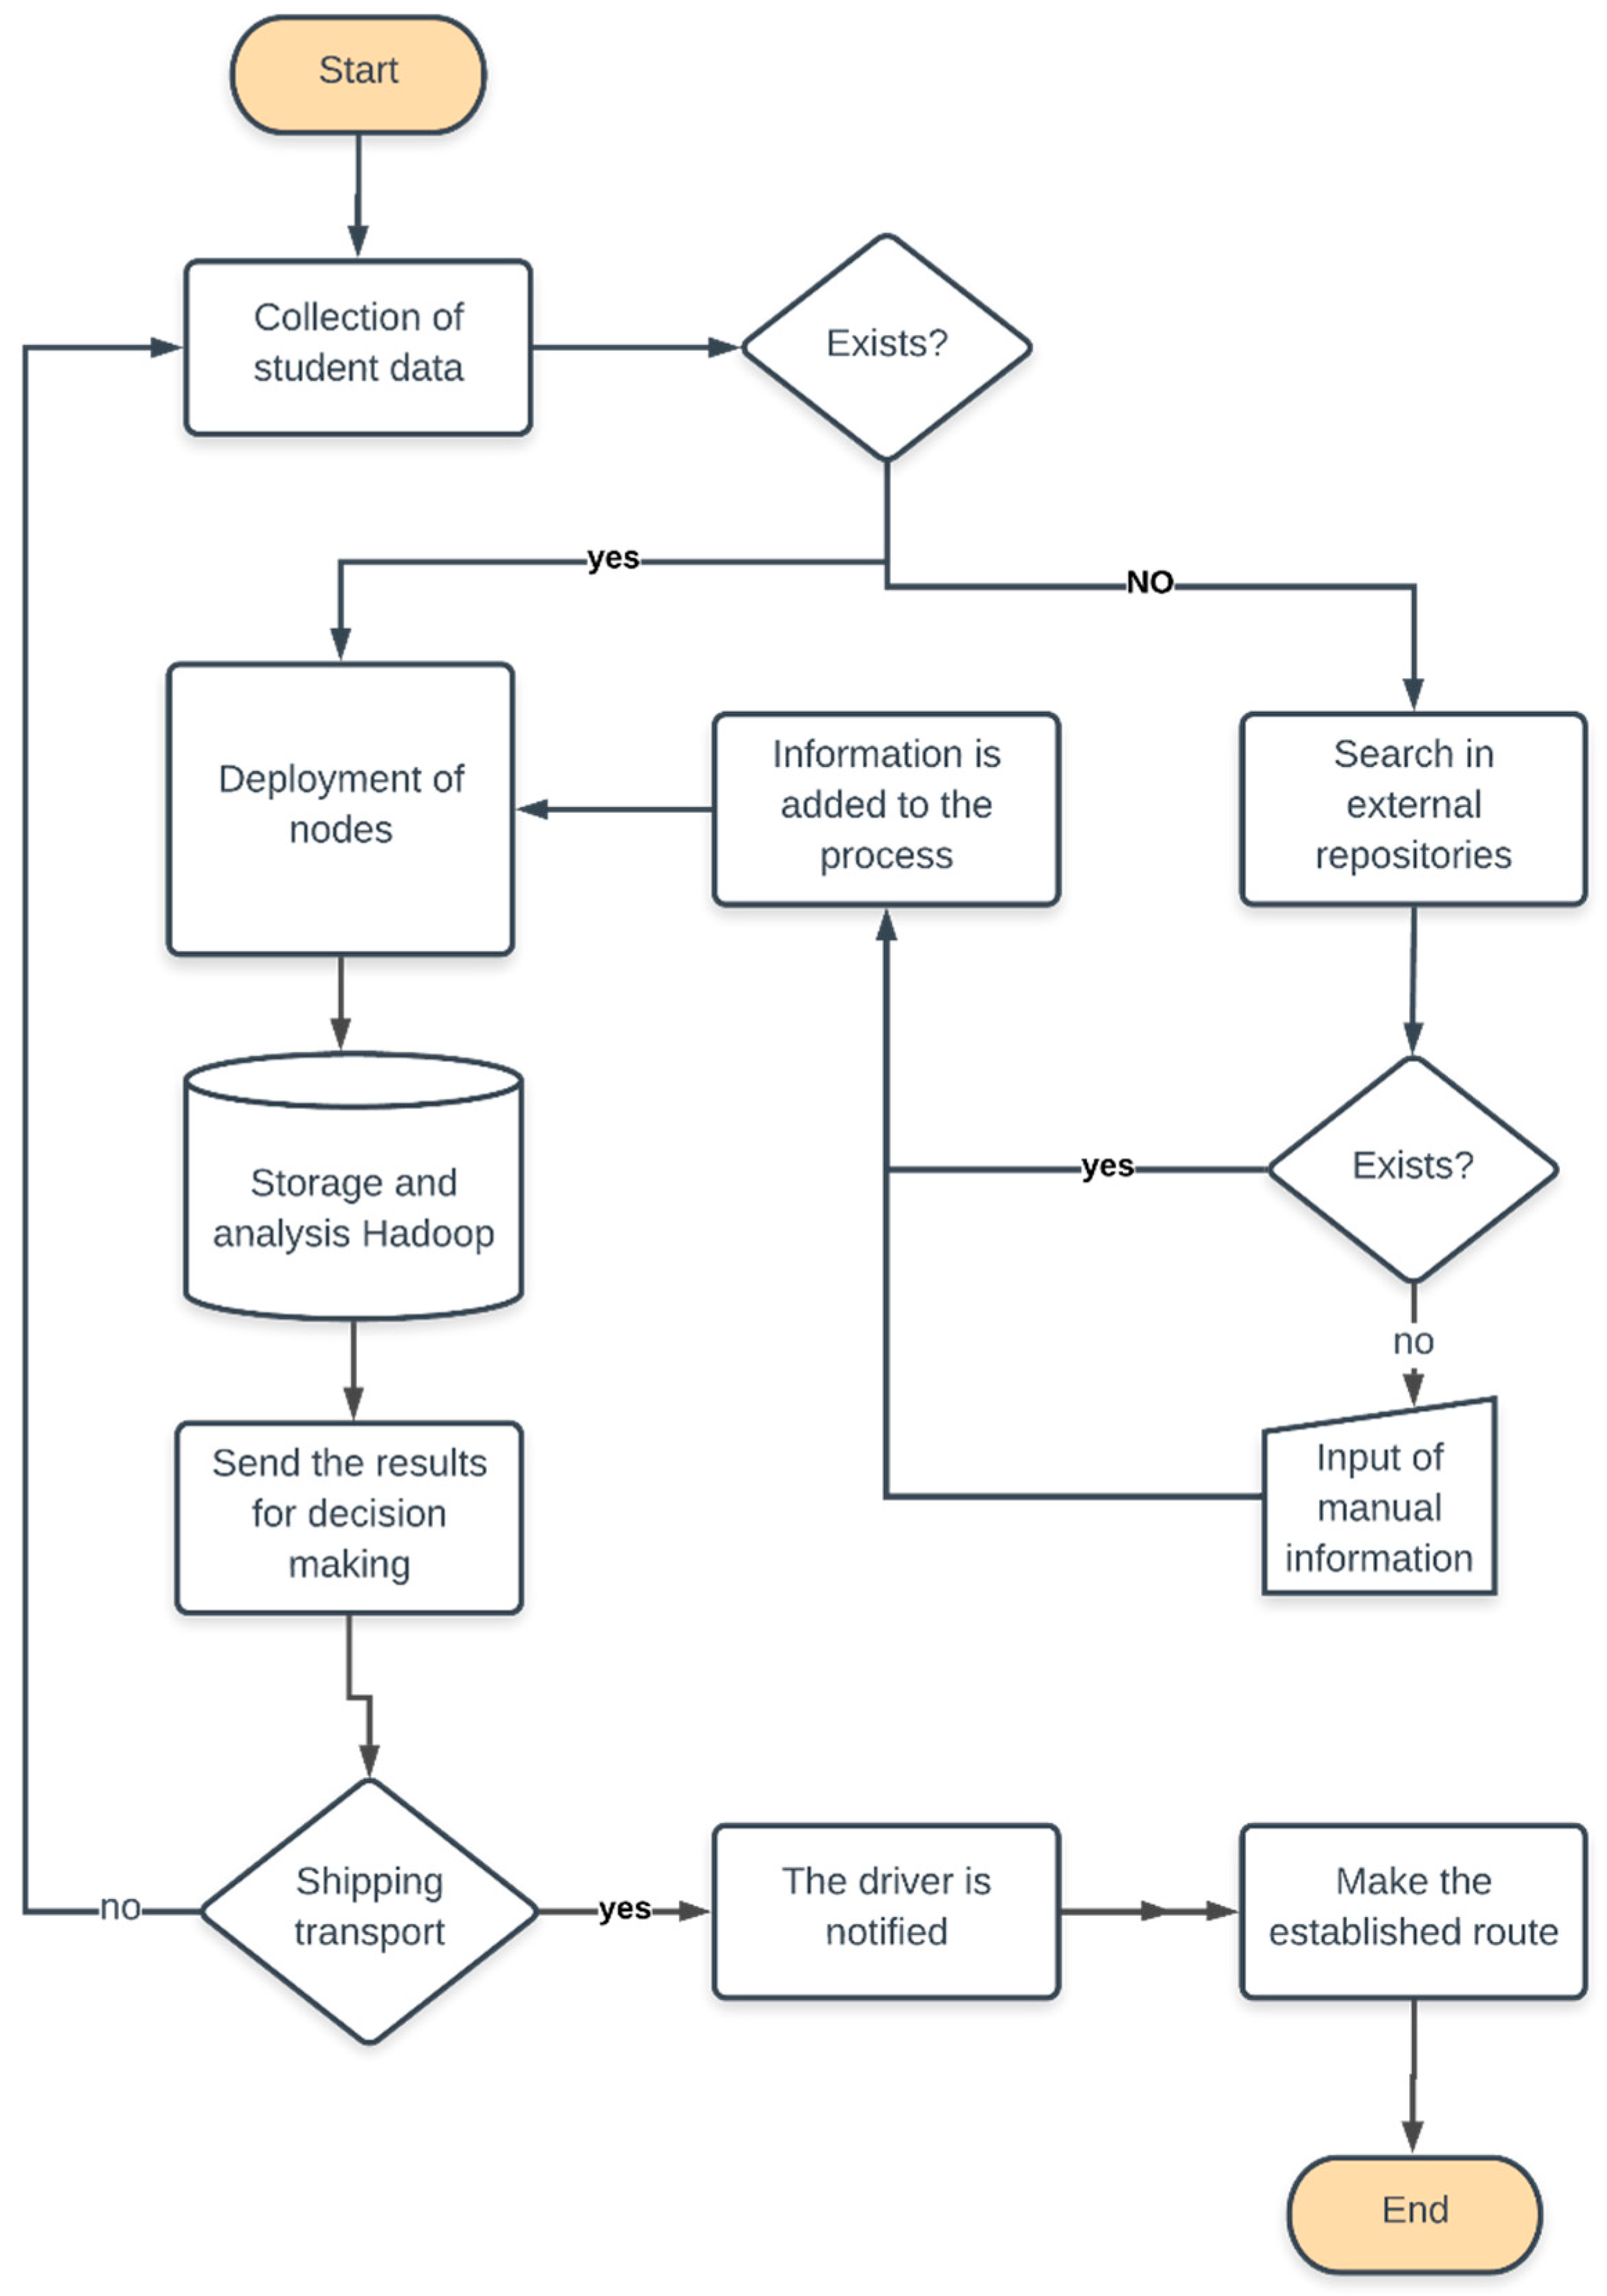
4.2.3. Data Management and Analysis of Big Data
- Data capture;
- Storage;
- Filtering out;
- Transfer;
- Analysis;
- Presentation.
- Which are the beverages that present the higher indices of consumption in examination seasons in the campus?
- Which are the places in the campus with the highest population density in winter and summer?
- What are the activities that generate greater knowledge in students in the campus?
5. Discussion
6. Conclusions
Author Contributions
Funding
Conflicts of Interest
References
- Swilling, M.; Hajer, M.; Baynes, T.; Bergesen, J.; Labbé, F.; Musango, J.K.; Ramaswami, A.; Robinson, B.; Salat, S.; Suh, S.; et al. The Weight of Cities Resource Requirements Of Future Urbanization. Available online: https://europa.eu/capacity4dev/unep/documents/weight-cities-resource-requirements-future-urbanization (accessed on 1 April 2019).
- Atzori, L.; Iera, A.; Morabito, G. The Internet of Things: A survey. Comput. Netw. 2010, 54, 2787–2805. [Google Scholar] [CrossRef]
- Morales Lucas, C.; de Mingo López, L.; Gómez Blas, N. Natural Computing Applied to the Underground System: A Synergistic Approach for Smart Cities. Sensors 2018, 18, 4094. [Google Scholar] [CrossRef]
- Vasileva, R.; Rodrigues, L.; Hughes, N.; Greenhalgh, C.; Goulden, M.; Tennison, J. What Smart Campuses Can Teach Us about Smart Cities: User Experiences and Open Data. Information 2018, 9, 251. [Google Scholar] [CrossRef]
- Nie, X. Constructing Smart Campus Based on the Cloud Computing Platform and the Internet of Things. In Proceedings of the 2nd International Conference on Computer Science and Electronics Engineering (ICCSEE 2013), Hangzhou, China, 22–23 March 2013; pp. 1576–1578. [Google Scholar]
- Hannan, A.; Arshad, S.; Azam, M.A.; Loo, J.; Ahmed, S.H.; Majeed, M.F.; Shah, S.C. Disaster management system aided by named data network of things: Architecture, design, and analysis. Sensors 2018, 18, 2341. [Google Scholar] [CrossRef]
- Wang, K.; Wang, Y.; Hu, X.; Sun, Y.; Deng, D.-J.; Vinel, A.; Zhang, Y. Wireless Big Data Computing in Smart Grid. IEEE Wirel. Commun. 2017, 24, 58–64. [Google Scholar] [CrossRef]
- Britt, J.; Matsumura, S.; Forood, H.; Zimmerman, S.; Myles, P.; Zawicki, S.; Kutami, D. Internet of Things Platforms, Apparatuses, and Methods. Available online: https://patents.google.com/patent/US20160147506 (accessed on 17 May 2019).
- Sotres, P.; Lanza, J.; Sánchez, L.; Santana, J.R.; López, C.; Muñoz, L. Breaking Vendors and City Locks through a Semantic-enabled Global Interoperable Internet-of-Things System: A Smart Parking Case Pablo. Sensors 2019, 19, 229. [Google Scholar] [CrossRef]
- Morales, R.; Badesa, F.J.; García-Aracil, N.; Perez-Vidal, C.; Sabater, J.M. Distributed smart device for monitoring, control and management of electric loads in domotic environments. Sensors (Switzerland) 2012, 12, 5212–5224. [Google Scholar] [CrossRef]
- Ray, P.P. A survey of IoT cloud platforms. Futur. Comput. Inform. J. 2016, 1, 35–46. [Google Scholar] [CrossRef]
- Villegas-Ch, W.; Luján-Mora, S. Analysis of data mining techniques applied to LMS for personalized education. In Proceedings of the 2017 IEEE World Engineering Education Conference (EDUNINE), Santos, Brazil, 19–22 March 2017. [Google Scholar]
- Hsinchun, C.; Roger, H.L.C.; Veda, C.S. Business Intelligence and Analytics: From Big Data To Big Impact. MIS Q. 2018, 36, 1293–1327. [Google Scholar]
- Kim, T.; Lim, J. Designing an Efficient Cloud Management Architecture for Sustainable Online Lifelong Education. Sustainability 2019, 11, 1523. [Google Scholar] [CrossRef]
- Provost, F.; Fawcett, T. Data Science and its Relationship to Big Data and Data-Driven Decision Making. Big Data 2013, 1, 51–59. [Google Scholar] [CrossRef] [PubMed]
- Ellaway, R.H.; Pusic, M.V.; Galbraith, R.M.; Cameron, T. Developing the role of big data and analytics in health professional education. Med. Teach. 2014, 36, 216–222. [Google Scholar] [CrossRef]
- Popoola, S.I.; Atayero, A.A.; Badejo, J.A.; John, T.M.; Odukoya, J.A.; Omole, D.O. Learning analytics for smart campus: Data on academic performances of engineering undergraduates in Nigerian private university. Data Br. 2018, 17, 76–94. [Google Scholar] [CrossRef] [PubMed]
- Cormack, A.N. See No…, Hear No…, Track No…: Ethics and the Intelligent Campus. J. Inf. Rights Policy Pract. 2019, 41, 1–23. [Google Scholar]
- Batty, M.; Axhausen, K.W.; Giannotti, F.; Pozdnoukhov, A.; Bazzani, A.; Wachowicz, M.; Ouzounis, G.; Portugali, Y. Smart cities of the future. Eur. Phys. J. Spec. Top. 2012, 214, 481–518. [Google Scholar] [CrossRef] [Green Version]
- Gubbi, J.; Buyya, R.; Marusic, S.; Palaniswami, M. Internet of Things (IoT): A vision, architectural elements, and future directions. Futur. Gener. Comput. Syst. 2013, 29, 1645–1660. [Google Scholar] [CrossRef] [Green Version]
- Batty, M. Big data, smart cities and city planning. Dialogues Hum. Geogr. 2013, 3, 274–279. [Google Scholar] [CrossRef] [PubMed] [Green Version]
- Sundorph, E.; Mosseri-Marlio, W. Smart campuses: How big data will transform higher education. Accenture 2016, 1–8. Available online: https://reform.uk/sites/default/files/2018-10/Smart%20campuses_WEB%20final.pdf (accessed on 20 May 2019).
- Boiten, E. 9 Squares: Framing Data Privacy Issues Eerke. J. Inf. Rights Policy Pract. 2016, 1–10. [Google Scholar] [CrossRef]
- Turner, M.; Bailey, J.; Linkman, S.; Budgen, D.; Pearl Brereton, O.; Kitchenham, B. Systematic literature reviews in software engineering—A systematic literature review. Inf. Softw. Technol. 2008, 51, 7–15. [Google Scholar]
- Boran, A.; Bedini, I.; Matheus, C.J.; Patel-Schneider, P.F.; Keeney, J. A smart campus prototype for demonstrating the semantic integration of heterogeneous data. In Proceedings of the International Conference on Web Reasoning and Rule Systems, Berlin/Heidelberg, Germany, 29–30 August 2011; pp. 238–243. [Google Scholar]
- Pinto, L.G.P.; Romano, R.R.; Tomoto, M.A. From the University to Smart Cities—How Engineers Can Construct Better Cities in BRIC’s Countries: A Real Case from Smart Campus FACENS. Adv. Hum. Side Serv. Eng. 2018, 347–354. [Google Scholar]
- Abdrabbah, S.B.; Ayachi, R.; Amor, N.B. Social Activities Recommendation System for Students in Smart Campus. Smart Innov. Syst. Technol. 2015, 40. [Google Scholar] [CrossRef]
- Dong, X.; Kong, X.; Zhang, F.; Chen, Z.; Kang, J. OnCampus: A mobile platform towards a smart campus. Springerplus 2016, 5, 974. [Google Scholar] [CrossRef]
- Luo, L. Data Acquisition and Analysis of Smart Campus Based on Wireless Sensor. Wirel. Pers. Commun. 2018, 102, 2897–2911. [Google Scholar] [CrossRef]
- Liu, M.; Li, L. The construction of smart campus in universities and the practical innovation of student work. In Proceedings of the 2018 International Conference on Information Management & Management Science, Chengdu, China, 25–27 August 2018; pp. 154–157. [Google Scholar]
- Zhicheng, D.; Feng, L. Evaluation of the Smart Campus Information Portal. In Proceedings of the 2018 2nd International Conference on Education and E-Learning, Bali, Indonesia, 5–7 November 2019; pp. 73–79. [Google Scholar]
- Aion, N.; Helmandollar, L.; Wang, M.; Ng, J.W.P. Intelligent campus (iCampus) impact study. In Proceedings of the IEEE/WIC/ACM International Conferences on Web Intelligence and Intelligent Agent Technology (WI-IAT), Macau, China, 4–7 December 2012; pp. 291–295. [Google Scholar]
- Yan, H.; Hu, H. A study on association algorithm of smart campus mining platform based on big data. In Proceedings of the 2016 International Conference on Intelligent Transportation, Big Data & Smart City (ICITBS), Changsha, China, 17–18 December 2016; pp. 172–175. [Google Scholar]
- Malatji, E.M. The development of a smart campus—African universities point of view. In Proceedings of the 2017 8th International Renewable Energy Congress (IREC), Amman, Jordan, 21–23 March 2017. [Google Scholar]
- Pompei, L.; Mattoni, B.; Bisegna, F.; Nardecchia, F.; Fichera, A.; Gagliano, A.; Pagano, A. Composite Indicators for Smart Campus: Data Analysis Method. In Proceedings of the 2018 IEEE International Conference on Environment and Electrical Engineering and 2018 IEEE Industrial and Commercial Power Systems Europe (EEEIC/I&CPS Europe), Palermo, Italy, 12–15 June 2018; pp. 1–6. [Google Scholar]
- Pibyl, O.; Opasanon, S.; Horak, T. Student perception of smart campus: A case study of Czech Republic and Thailand. In Proceedings of the 2018 Smart City Symposium Prague (SCSP), Prague, Czech Republic, 24–25 May 2018; pp. 1–7. [Google Scholar]
- Atif, Y.; Mathew, S.S.; Lakas, A. Building a smart campus to support ubiquitous learning. J. Ambient Intell. Humaniz. Comput. 2015, 6, 223–238. [Google Scholar] [CrossRef]
- Prandi, C.; Monti, L.; Ceccarini, C.; Salomoni, P. Smart Campus: Fostering the Community Awareness Through an Intelligent Environment. Mob. Netw. Appl. 2019. [Google Scholar] [CrossRef]
- Tseng, W.S.W.; Hsu, C.W. A Smart, Caring, Interactive Chair Designed for Improving Emotional Support and Parent-Child Interactions to Promote Sustainable Relationships Between Elderly and Other Family Members. Sustainability 2019, 11, 961. [Google Scholar] [CrossRef]
- Jethro, O.O.; Grace, A.M.; Thomas, A.K. E-Learning and Its Effects on Teaching and Learning in a Global Age. Int. J. Acad. Res. Bus. Soc. Sci. 2012, 2, 203–210. [Google Scholar]
- Barth, M.; Burandt, S. Adding the “e-” to Learning for Sustainable Development: Challenges and Innovation. Sustainability 2013, 5, 2609–2622. [Google Scholar] [CrossRef] [Green Version]
- Pugna, I.B.; Duţescu, A.; Stanila, O.G. Corporate attitudes towards Big Data and its impact on performance management: A qualitative study. Sustainability 2019, 11, 684. [Google Scholar] [CrossRef]
- Van Hoek, R.; Johnson, M. Sustainability and energy efficiency Research implications from an academic. Int. J. Phys. Distrib. Logist. Manag. 2010, 40, 148–158. [Google Scholar] [CrossRef]
- Lee, J.; Song, H.D.; Hong, A.J. Exploring factors, and indicators for measuring students’ sustainable engagement in e-learning. Sustainability 2019, 11, 985. [Google Scholar] [CrossRef]
- Ma, L.; Zhai, Y.; Wu, T. Operating Charging Infrastructure in China to Achieve Sustainable Transportation: The Choice between Company-Owned and Franchised Structures. Sustainability 2019, 11, 1549. [Google Scholar] [CrossRef]
- Bascopé, M.; Perasso, P.; Reiss, K. Systematic review of education for sustainable development at an early stage: Cornerstones and pedagogical approaches for teacher professional development. Sustainability 2019, 11, 719. [Google Scholar] [CrossRef]
- Wright, T.S.A. Definitions and frameworks for environmental sustainability in higher education. High. Educ. Policy 2002, 15, 105–120. [Google Scholar] [CrossRef]
- Sitepu, R.K.-K. The Impact of Modern Markets on The Performance of Micro, Small and Medium Enterprises. J. Ekon. Bisnis 2011, 16, 10–24. [Google Scholar]
- Trindade, E.P.; Hinnig, M.P.F.; da Costa, E.M.; Marques, J.S.; Bastos, R.C.; Yigitcanlar, T. Sustainable development of smart cities: A systematic review of the literature. J. Open Innov. Technol. Mark. Complex. 2017, 3, 11. [Google Scholar] [CrossRef]
- Nam, T.; Pardo, T.A. Conceptualizing Smart City with Dimensions of Technology, People, and Institutions. In Proceedings of the 12th Annual International Conference on Digital Government Research, DG.O 2011, College Park, MD, USA, 12–15 June 2011; pp. 282–291. [Google Scholar]
- Angelidou, M. Smart city policies: A spatial approach. Cities 2014, 41, S3–S11. [Google Scholar] [CrossRef]
- Cole, L. Assessing Sustainability on Canadian University Campuses: Development of a Campus Sustainability Assessment Framework. Unpublished Thesis, Royal Roads University, Victoria, BC, Canada, 2003; pp. 1–66. [Google Scholar]
- Charles, D. Universities as key knowledge infrastructures in regional innovation systems. Innovation 2006, 19, 117–130. [Google Scholar] [CrossRef]
- Shannon, T.; Giles-Corti, B.; Pikora, T.; Bulsara, M.; Shilton, T.; Bull, F. Active commuting in a university setting: Assessing commuting habits and potential for modal change. Transp. Policy 2006, 13, 240–253. [Google Scholar] [CrossRef]
- Cook, D.J.; Augusto, J.C.; Jakkula, V.R. Ambient intelligence: Technologies, applications, and opportunities. Pervasive Mob. Comput. 2009, 5, 277–298. [Google Scholar] [CrossRef] [Green Version]
- Pagliaro, F.; Mattoni, B.; Gugliermenti, F.; Bisegna, F.; Azzaro, B.; Tomei, F.; Catucci, S. A roadmap toward the development of Sapienza Smart Campus. In Proceedings of the International Conference on Environment and Electrical Engineering, Florence, Italy, 7–10 June 2016; pp. 1–6. [Google Scholar]
- Alvarez-Campana, M.; López, G.; Vázquez, E.; Villagrá, V.A.; Berrocal, J. Smart CEI moncloa: An iot-based platform for people flow and environmental monitoring on a Smart University Campus. Sensors 2017, 17, 2856. [Google Scholar] [CrossRef] [PubMed]
- Montori, F.; Bedogni, L.; Bononi, L. A Collaborative Internet of Things Architecture for Smart Cities and Environmental Monitoring. IEEE Internet Things J. 2018, 5, 592–605. [Google Scholar] [CrossRef]
- Talari, S.; Shafie-Khah, M.; Siano, P.; Loia, V.; Tommasetti, A.; Catalão, J.P.S. A review of smart cities based on the internet of things concept. Energies 2017, 10, 421. [Google Scholar] [CrossRef]
- Tan, L.; Wang, N. Future Internet: The Internet of Things. ICACTE 2010—2010 3rd Int. Conf. Adv. Comput. Theory Eng. Proc. 2010, 5, 376–380. [Google Scholar]
- Kamilaris, A.; Pitsillides, A.; Prenafeta-Bold, F.X.; Ali, M.I. A Web of Things based eco-system for urban computing—Towards smarter cities. In Proceedings of the 2017 24th International Conference on Telecommunications (ICT), Limassol, Cyprus, 3–5 May 2017. [Google Scholar]
- Li, Y.; Dai, W.; Member, S.; Ming, Z.; Qiu, M.; Member, S. Privacy Protection for Preventing Data Over-Collection in Smart City. IEEE Trans. Computers 2016, 65, 1339–1350. [Google Scholar] [CrossRef]
- Chen, Y.S.; Tsai, Y.T. A mobility management using follow-me cloud-cloudlet in fog-computing-based RANs for smart cities. Sensors 2018, 18, 489. [Google Scholar] [CrossRef]
- Jadeja, Y.; Modi, K. Cloud computing—Concepts, architecture and challenges. In Proceedings of the 2012 International Conference on Computing, Electronics and Electrical Technologies (ICCEET), Kumaracoil, India, 21–22 March 2012; pp. 877–880. [Google Scholar]
- Weber, R.H. Internet of things: Privacy issues revisited. Comput. Law Secur. Rev. Int. J. Technol. Law Pract. 2015, 31, 618–627. [Google Scholar] [CrossRef]
- White, M. Protection by Judicial Oversight, or an Oversight in Protection? J. Inf. Rights Policy Pract. 2016, 1–42. Available online: https://www.google.com.tw/url?sa=t&rct=j&q=&esrc=s&source=web&cd=2&ved=2ahUKEwjNp9WvoaniAhWRdHAKHXOLCu0QFjABegQIARAC&url=https%3A%2F%2Fjirpp.winchesteruniversitypress.org%2Farticles%2F10%2Fgalley%2F10%2Fdownload%2F&usg=AOvVaw1PuaR_LjxtPwARkuyuX5sw (accessed on 20 May 2019).
- Buenaño-Fernandez, D.; Villegas-CH, W.; Luján-Mora, S. The use of tools of data mining to decision making in engineering education—A systematic mapping study. Comput. Appl. Eng. Educ. 2019, 10, 4040. [Google Scholar] [CrossRef]
- Palacios-Pacheco, X.; Villegas-Ch, W.; Luján-Mora, S. Application of Data Mining for the Detection of Variables that Cause University Desertion. Commun. Comput. Inf. Sci. 2019, 895, 510–520. [Google Scholar]
- Villegas-Ch, W.; Lujan-Mora, S.; Buenano-Fernandez, D. Towards the Integration of Business Intelligence Tools Applied to Educational Data Mining. In Proceedings of the IEEE World Engineering Education Conference, Santa Cruz de Tenerife, Spain, 17–20 April 2018; pp. 1–5. [Google Scholar]
- Silva, B.N.; Khan, M.; Jung, C.; Seo, J.; Muhammad, D.; Han, J.; Yoon, Y.; Han, K. Urban planning and smart city decision management empowered by real-time data processing using big data analytics. Sensors 2018, 18, 2994. [Google Scholar] [CrossRef]
- Debortoli, S.; Müller, O.; Vom Brocke, J. Comparing business intelligence and big data skills: A text mining study using job advertisements. Bus. Inf. Syst. Eng. 2014, 6, 289–300. [Google Scholar] [CrossRef]
- Khalifa, S.; Elshater, Y.; Sundaravarathan, K.; Bhat, A. The Six Pillars for Building Big Data Analytics Ecosystems. ACM Comput. Surv. 2016, 49, 1–36. [Google Scholar] [CrossRef]
- Shvachko, K.; Kuang, H.; Radia, S.; Chansler, R. The Hadoop Distributed File System. In Proceedings of the 2010 IEEE 26th Symposium on Mass Storage Systems and Technologies (MSST), Incline Village, NV, USA, 3–7 May 2010; Volume 26, pp. 1–10. [Google Scholar]
- Patel, A.B.; Birla, M.; Nair, U. Addressing big data problem using Hadoop and Map Reduce. In Proceedings of the 2012 Nirma University International Conference on Engineering (NUiCONE), Ahmedabad, India, 6–8 December 2012; pp. 6–8. [Google Scholar]
- Blanas, S.; Patel, J.M.; Ercegovac, V.; Rao, J.; Shekita, E.J.; Tian, Y. A Comparison of Join Algorithms for Log Processing in MapReduce. In Proceedings of the SIGMOD’10, Indianapolis, IN, USA, 6–11 June 2010; pp. 1–12. [Google Scholar]
- Shan, Y.; Yan, J.; Wang, Y.; Xu, N. FPMR: MapReduce Framework on FPGA A Case Study of RankBoost Acceleration. In Proceedings of the 18th Annual ACM/SIGDA International Symposium on Field Programmable Gate Arrays, Monterey, CA, USA, 21–23 February 2010; pp. 93–102. [Google Scholar]
- Wang, J.; Crawl, D.; Altintas, I. Kepler + Hadoop: A General Architecture Facilitating Data-Intensive Applications in Scientific Workflow Systems. In Proceedings of the 4th Workshop on Workflows in Support of Large-Scale Science, Portland, OR, USA, 16 November 2009; pp. 1–8. [Google Scholar]
- Dean, J.; Ghemawat, S. MapReduce: Simplified Data Processing on Large Clusters. Commun. ACM 2008, 51, 107–113. [Google Scholar] [CrossRef]
- Dai, W.; Ji, W. A mapreduce implementation of C4.5 decision tree algorithm. Int. J. Database Theory Appl. 2014, 7, 49–60. [Google Scholar] [CrossRef]
- Hammoud, S.; Li, M.; Liu, Y.; Alham, N.K.; Liu, Z. MRSim: A discrete event based MapReduce simulator. In Proceedings of the 2010 Seventh International Conference on Fuzzy Systems and Knowledge Discovery, Yantai, China, 10–12 August 2010; Volume 6, pp. 2993–2997. [Google Scholar]
- Chauhan, A. Master Slave Architecture in Hadoop. Available online: https://blogs.msdn.microsoft.com/avkashchauhan/2012/02/24/master-slave-architecture-in-hadoop/ (accessed on 5 February 2019).
- Cohen, J.; Acharya, S. Towards a more secure Apache Hadoop HDFS infrastructure: Anatomy of a targeted advanced persistent threat against HDFS and analysis of trusted computing based countermeasures. In Network and System Security. NSS 2013; Springer: Berlin/Heidelberg, Germany, 2013; Volume 7873, pp. 735–741. [Google Scholar]
- Toutouh, J.; Arellano, J.; Alba, E. BiPred: A Bilevel Evolutionary Algorithm for Prediction in Smart Mobility. Sensors 2018, 18, 4123. [Google Scholar] [CrossRef]
- Kamilaris, A.; Pitsillides, A. The impact of remote sensing on the everyday lives of mobile users in urban areas. In Proceedings of the 2014 Seventh International Conference on Mobile Computing and Ubiquitous Networking (ICMU), Singapore, 6–8 January 2014; pp. 153–158. [Google Scholar]
- Fathema, N.; Shannon, D.; Ross, M. Expanding The Technology Acceptance Model (TAM) to Examine Faculty Use of Learning Management Systems (LMSs) In Higher Education Institutions. J. Online Learn. Teach. 2015, 11, 210–232. [Google Scholar]


| REF | Title | Type of Research | Type of Contribution |
|---|---|---|---|
| [25] | A smart campus prototype for demonstrating the semantic integration of heterogeneous data | Proposed solution | Process |
| [26] | From the university to smart cities—how engineers can construct better cities in BRIC’s countries: a real case from smart campus FACENS | Evaluation research | Model |
| [27] | Social activities recommendation system for students in smart campus | Proposed solution | Tool |
| [28] | OnCampus: a mobile platform towards a smart campus | Proposed solution | Process |
| [4] | What smart campuses can teach us about smart cities: user experiences and open data | Evaluation research | Model |
| [29] | Data acquisition and analysis of smart campus based on wireless sensor | Proposed solution | Process |
| [17] | Learning analytics for smart campus: data on academic performances of engineering undergraduates in Nigerian private university | Evaluation research | Model |
| [30] | The construction of smart campus in universities and the practical innovation of student work | Proposed solution | Process |
| [31] | Evaluation of the smart campus information portal | Evaluation research | Model |
| [32] | Intelligent campus (ICampus) impact study | Evaluation research | Model |
| [33] | A study on association algorithm of smart campus mining platform based on big data | Evaluation research | Model |
| [34] | The development of a smart campus—African universities point of view | Proposed solution | Process |
| [35] | Composite indicators for smart campus: data analysis method | Proposed solution | Model |
| [36] | Student perception of smart campus: a case study of Czech republic and Thailand | Evaluation research | Process |
| [37] | Building a smart campus to support ubiquitous learning | Evaluation research | Model |
| [38] | Smart campus: fostering the community awareness through an intelligent environment | Evaluation research | Process |
| [5] | Constructing smart campus based on the cloud computing platform and the internet of things | Evaluation research | Process |
| [39] | A smart, caring, interactive chair designed for improving emotional support and parent–child interactions to promote sustainable relationships between elderly and other family members | Evaluation research | Process |
| [40] | E-Learning and Its Effects on Teaching and Learning in a Global Age | Evaluation research | Process |
| [41] | Adding the “e-” to learning for sustainable development: challenges and innovation | Proposed solution | Model |
| [42] | Corporate attitudes towards big data and its impact on performance management: a qualitative study | Proposed solution | Model |
| [14] | Designing an efficient cloud management architecture for sustainable online lifelong education | Evaluation research | Process |
| [43] | Sustainability and energy efficiency research implications from an academic | Proposed solution | Model |
| [44] | Exploring factors, and indicators for measuring students’ sustainable engagement in e-learning | Evaluation research | Process |
| [45] | Operating charging infrastructure in China to achieve sustainable transportation: the choice between company-owned and franchised structures | Proposed solution | Model |
| [46] | Systematic review of education for sustainable development at an early stage: cornerstones and pedagogical approaches for teacher professional development | Evaluation research | Process |
| [47] | Definitions and frameworks for environmental sustainability in higher education | Proposed solution | Model |
| [48] | The impact of modern markets on the performance of micro, small and medium enterprises | Proposed solution | Model |
| Period | Type of Drink | Percentage |
|---|---|---|
| 07:00–11:00 | Coffee | 60% |
| 07:00–11:00 | Coca-cola | 25% |
| 07:00–11:00 | Juices | 10% |
| 07:00–11:00 | Others | 5% |
| 11:00–15:00 | Coffee | 53% |
| 11:00–15:00 | Coca-cola | 30% |
| 11:00–15:00 | Juices | 11% |
| 11:00–15:00 | Others | 6% |
| 15:00–19:00 | Coffee | 42% |
| 15:00–19:00 | Coca-cola | 39% |
| 15:00–19:00 | Juices | 15% |
| 15:00–19:00 | Others | 4% |
| Number of Users in Summer per Week | Number of Users in Summer per Week | |||||||
|---|---|---|---|---|---|---|---|---|
| Areas | Week 1 | Week 2 | Week 3 | Week 4 | Week 5 | Week 6 | Week 7 | Week 8 |
| Playground | 6450 | 6098 | 5493 | 4536 | 4839 | 3927 | 2983 | 1826 |
| Green areas | 2983 | 4997 | 5382 | 6113 | 5487 | 4387 | 3762 | 2873 |
| Coffee shops | 502 | 493 | 650 | 528 | 638 | 936 | 1182 | 1382 |
| Laboratories | 392 | 182 | 293 | 387 | 508 | 1029 | 1603 | 2083 |
| Libraries | 932 | 670 | 398 | 732 | 736 | 1283 | 1893 | 3072 |
| Buildings | 1982 | 805 | 1038 | 963 | 973 | 1562 | 1793 | 1923 |
| Total | 13,241 | 13,245 | 13,254 | 13,259 | 13,181 | 13,124 | 13,216 | 13,159 |
© 2019 by the authors. Licensee MDPI, Basel, Switzerland. This article is an open access article distributed under the terms and conditions of the Creative Commons Attribution (CC BY) license (http://creativecommons.org/licenses/by/4.0/).
Share and Cite
Villegas-Ch, W.; Palacios-Pacheco, X.; Luján-Mora, S. Application of a Smart City Model to a Traditional University Campus with a Big Data Architecture: A Sustainable Smart Campus. Sustainability 2019, 11, 2857. https://doi.org/10.3390/su11102857
Villegas-Ch W, Palacios-Pacheco X, Luján-Mora S. Application of a Smart City Model to a Traditional University Campus with a Big Data Architecture: A Sustainable Smart Campus. Sustainability. 2019; 11(10):2857. https://doi.org/10.3390/su11102857
Chicago/Turabian StyleVillegas-Ch, William, Xavier Palacios-Pacheco, and Sergio Luján-Mora. 2019. "Application of a Smart City Model to a Traditional University Campus with a Big Data Architecture: A Sustainable Smart Campus" Sustainability 11, no. 10: 2857. https://doi.org/10.3390/su11102857