Article

HEREVEA Tool for Economic and Environmental Impact Evaluation for Sustainable Planning Policy in Housing Renovation

by
María Rocío Ruiz-Pérez
,
Mª Desirée Alba-Rodríguez
,
Raúl Castaño-Rosa
,
Jaime Solís-Guzmán
and
Madelyn Marrero
*
Departamento de Construcciones Arquitectónicas 2, Escuela Técnica Superior de Ingeniería de Edificación, Universidad de Sevilla, 41012 Sevilla, Spain
*
Author to whom correspondence should be addressed.
Sustainability 2019, 11(10), 2852; https://doi.org/10.3390/su11102852
Submission received: 16 April 2019 / Revised: 14 May 2019 / Accepted: 15 May 2019 / Published: 19 May 2019

Abstract

:
Dwelling renovation has gained major importance in the European Union due to the current need for the urban regeneration of many cities, most of whose existing buildings (approximately 60%) were built in the 1960s to 1980s. These renovations require improvements in aspects such as structural integrity, accessibility, and the updating of deteriorated or obsolescent installations. This reveals that building renovations constitute a key factor in the future of the European building sector and must be included in strategies both for the reduction of this sector’s environmental impact and for climate change mitigation. In order to determine the effectiveness of renovations and their impact, the HEREVEA (Huella Ecológica de la Rehabilitacion de Viviendas en Andalucia or Ecological Footprint of the Renovation of Dwellings in Andalusia) model is proposed on data obtained from the project’s bill of quantities, its ecological footprint is assessed, and the economic-environmental feasibility of different proposals are evaluated simultaneously. The resulting model is integrated into a geographic information system, which allows georeferenced results. The tool can be used for sustainable and resilient planning policy-making at all government levels, and for the decision-making processes. In this paper, economic and environmental indicators are, for the first time, simultaneously assessed through statistical normalization obtained from 50 cases analyzed in the city of Seville. Furthermore, five case studies are assessed in detail in order to determine the sensitivity of the model. These renovations represent less than 30% of the cost and 6% of the ecological footprint of a new construction project. During the subsequent 25 years, the energy efficiency improvements could significantly reduce the CO2 emissions that are due to direct consumption.

1. Introduction

Approximately 60% of the existing building stock in the European Union was built during the period from the 1960s to the 1980s. This percentage rises to 70–75% in Mediterranean countries, such as Greece, Spain, and Portugal [1]. Furthermore, the current stock of buildings is expected to increase at a rate of 1% per year due to new construction [2], but building renovations will increase at a rate of 2–3% by 2020 [3]. Therefore, building renovations will become a key factor in the future of the European building sector and must be included in strategies to reduce their environmental impact and to reach the global objectives of climate change mitigation.
In the particular case of dwellings in Spain, interventions in existing buildings are not only due to their precarious state but as a reactivating agent of the construction sector, thereby promoting integrated regeneration and energy efficiency in Law 8/2013, of June 26, for rehabilitation, regeneration, and urban renewal [4]. This normative framework includes urbanistic criteria and sustainability of built heritage, and, as is the case in most European countries, renovations are no longer considered a minor activity with respect to the construction of new buildings [5].
For the correct analysis of this type of intervention, it is necessary to first clarify the term renovation. According to Vilches et al. [6], the terms refurbishment, renovation, retrofitting, repair, and restoration can all be used interchangeably. The European Commission uses “Holistic and Deep Renovation” in the 2014–2015 Work Program for Horizon 20/20 [3] regarding building operations, which considers both a significant energy reduction and district energy systems. The Building Research Establishment [7] defines a major refurbishment project as an activity that results in the provision, extension, or alteration of thermal components or building services and fittings.
In rehabilitation projects, seriously damaged buildings are assessed. Almeida et al. [8] studied various sustainability evaluation systems and a model was cross-checked with current European and national urban rehabilitation in order to define a simplified method for the sustainability assessment for rehabilitation in old urban centers. Erlandsson et al. [9] compared the environmental impact of rebuilding and new construction by conducting an LCA of a multi-dwelling building built in 1966 in Sweden. In the case of single-family dwellings, Gaspar et al. [10] compared the impact associated with total demolition to a refurbishment scenario of an old detached house in Portugal.
In addition to the environmental evaluation, economic aspects are also key factors of the assessment, and tend to tip the balance towards actions of building renovation rather than demolition and new construction. This is due to the increasing value of the building and the quality of its constructive elements [11,12,13]. Other evaluation methods of renovation projects analyzed an economically optimal combination of energy-saving measures, and concluded that the decision for renovation rather than demolition is influenced by the investment cost and the market value of the buildings [14].
Recent studies have shown a methodological framework for conducting an economic cost–benefit analysis in the Energy Efficiency Retrofit (EER) of existing buildings, based on the calculation of costs and benefits over their life cycle [15]. Through cost curves of investments, Toleikyte et al. [16] analyzed potential energy savings for the building sector by implementing energy efficiency solutions. Final energy demand can be reduced by 56% by the year 2030 if the lowest-cost energy efficiency solutions are implemented. At the neighborhood level, the economic benefit is also higher than that of individual buildings; however, there are positive indications that individual property values may be enhanced in the future [17].
The geographical consideration also constitutes an important aspect that can be addressed simultaneously. The use of geographical information systems (GIS) makes it possible to relate the use of geo-information and governance, and several studies affirm that these initiatives promote accountability, transparency, legitimacy, and other dimensions of governance [18]. Several groups of researchers have developed hybrid models that combine the application of GIS and multi-criteria decision analysis, and they conclude that their models can be used in their decision-making processes for sustainable and resilient policy planning at all government levels [19,20]. Other authors suggest that GIS can be employed to improve land use, urban planning and renewal, and housing policy [21].
In the HEREVEA project (Huella Ecológica de la Rehabilitacion de Viviendas en Andalucia or Ecological Footprint of the Renovation of Dwellings in Andalusia), georeferencing has been used together with ecological footprint (EF) analysis instead of LCA methodology. The EF indicator [22] assesses the amount of land that would be required to provide the resources (grain, feed, firewood, fish, and urban land) and absorb the emissions (CO2) of humanity. The EF, along with the CF, have become two of the most widespread indicators thanks to the simplicity of their concept. The EF has been employed for construction projects [23,24,25,26,27].
The EF methodology by Solís-Guzmán et al. [28] has been adapted in order to measure the whole life cycle of the building: urbanization [29], use [30], maintenance [31], and the rehabilitation or demolition [32].
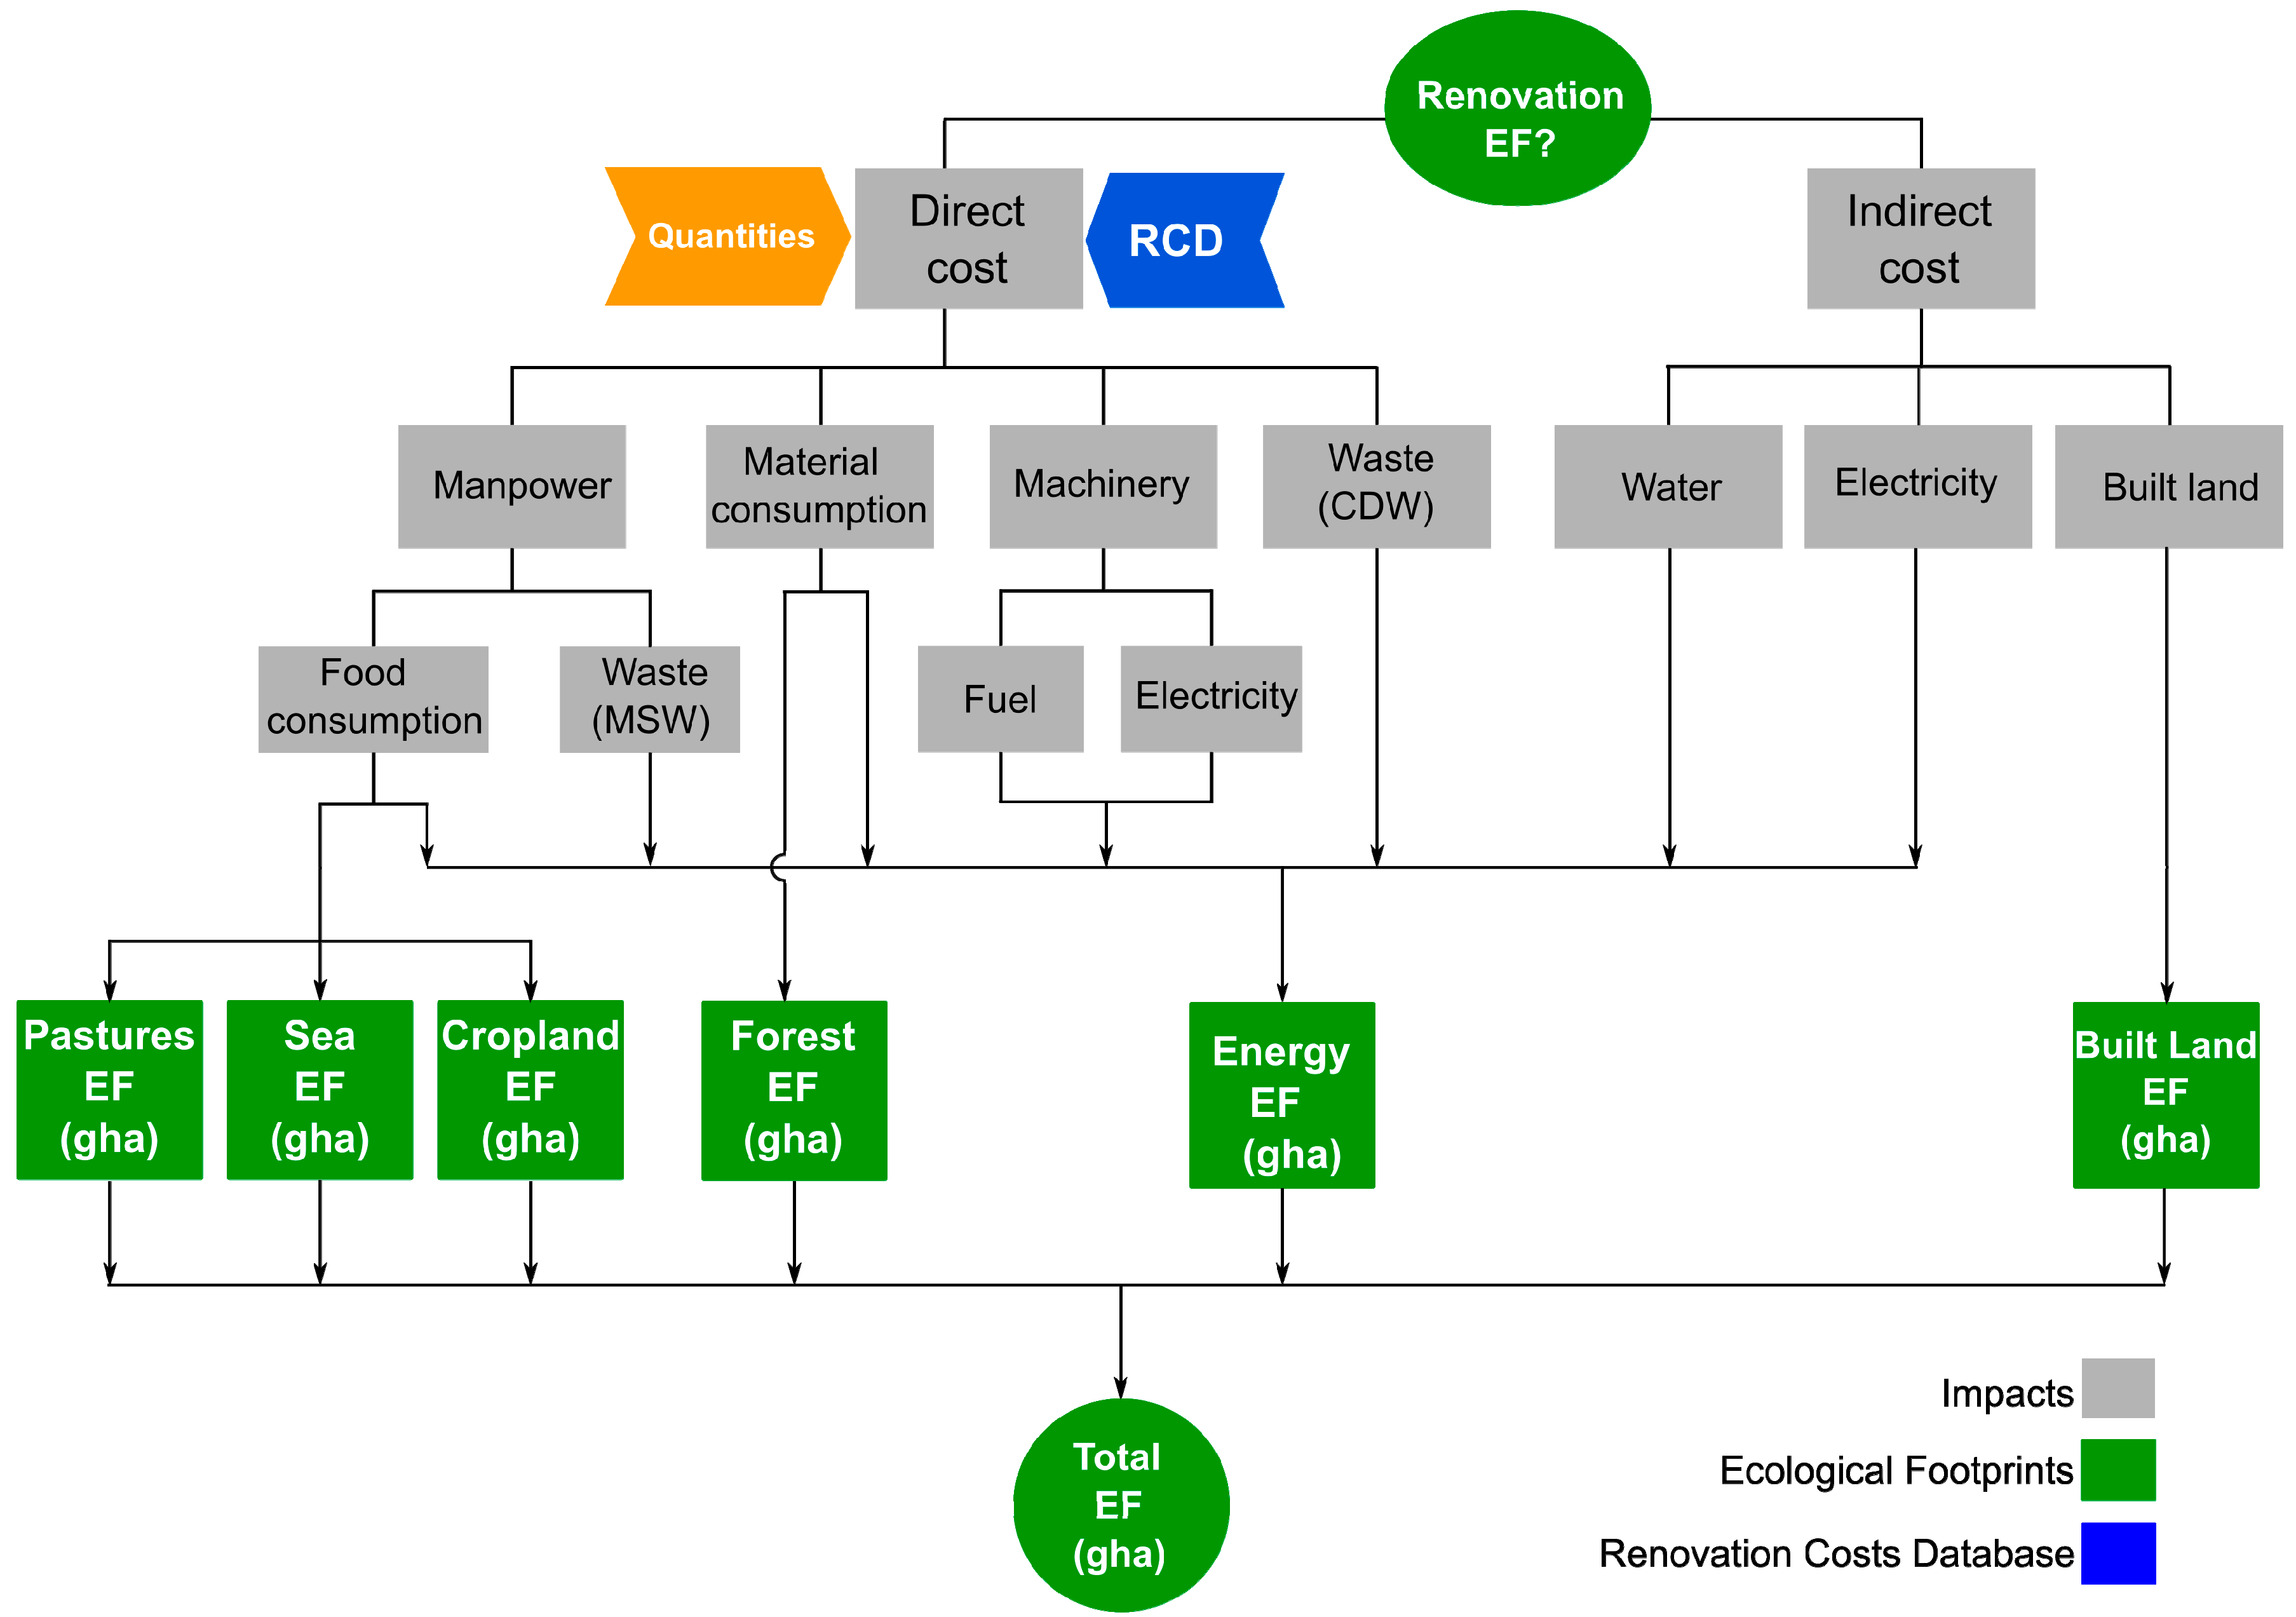
In the particular case of housing renovation, the HEREVEA project [33] takes advantage of the model by Alba-Rodríguez et al. [
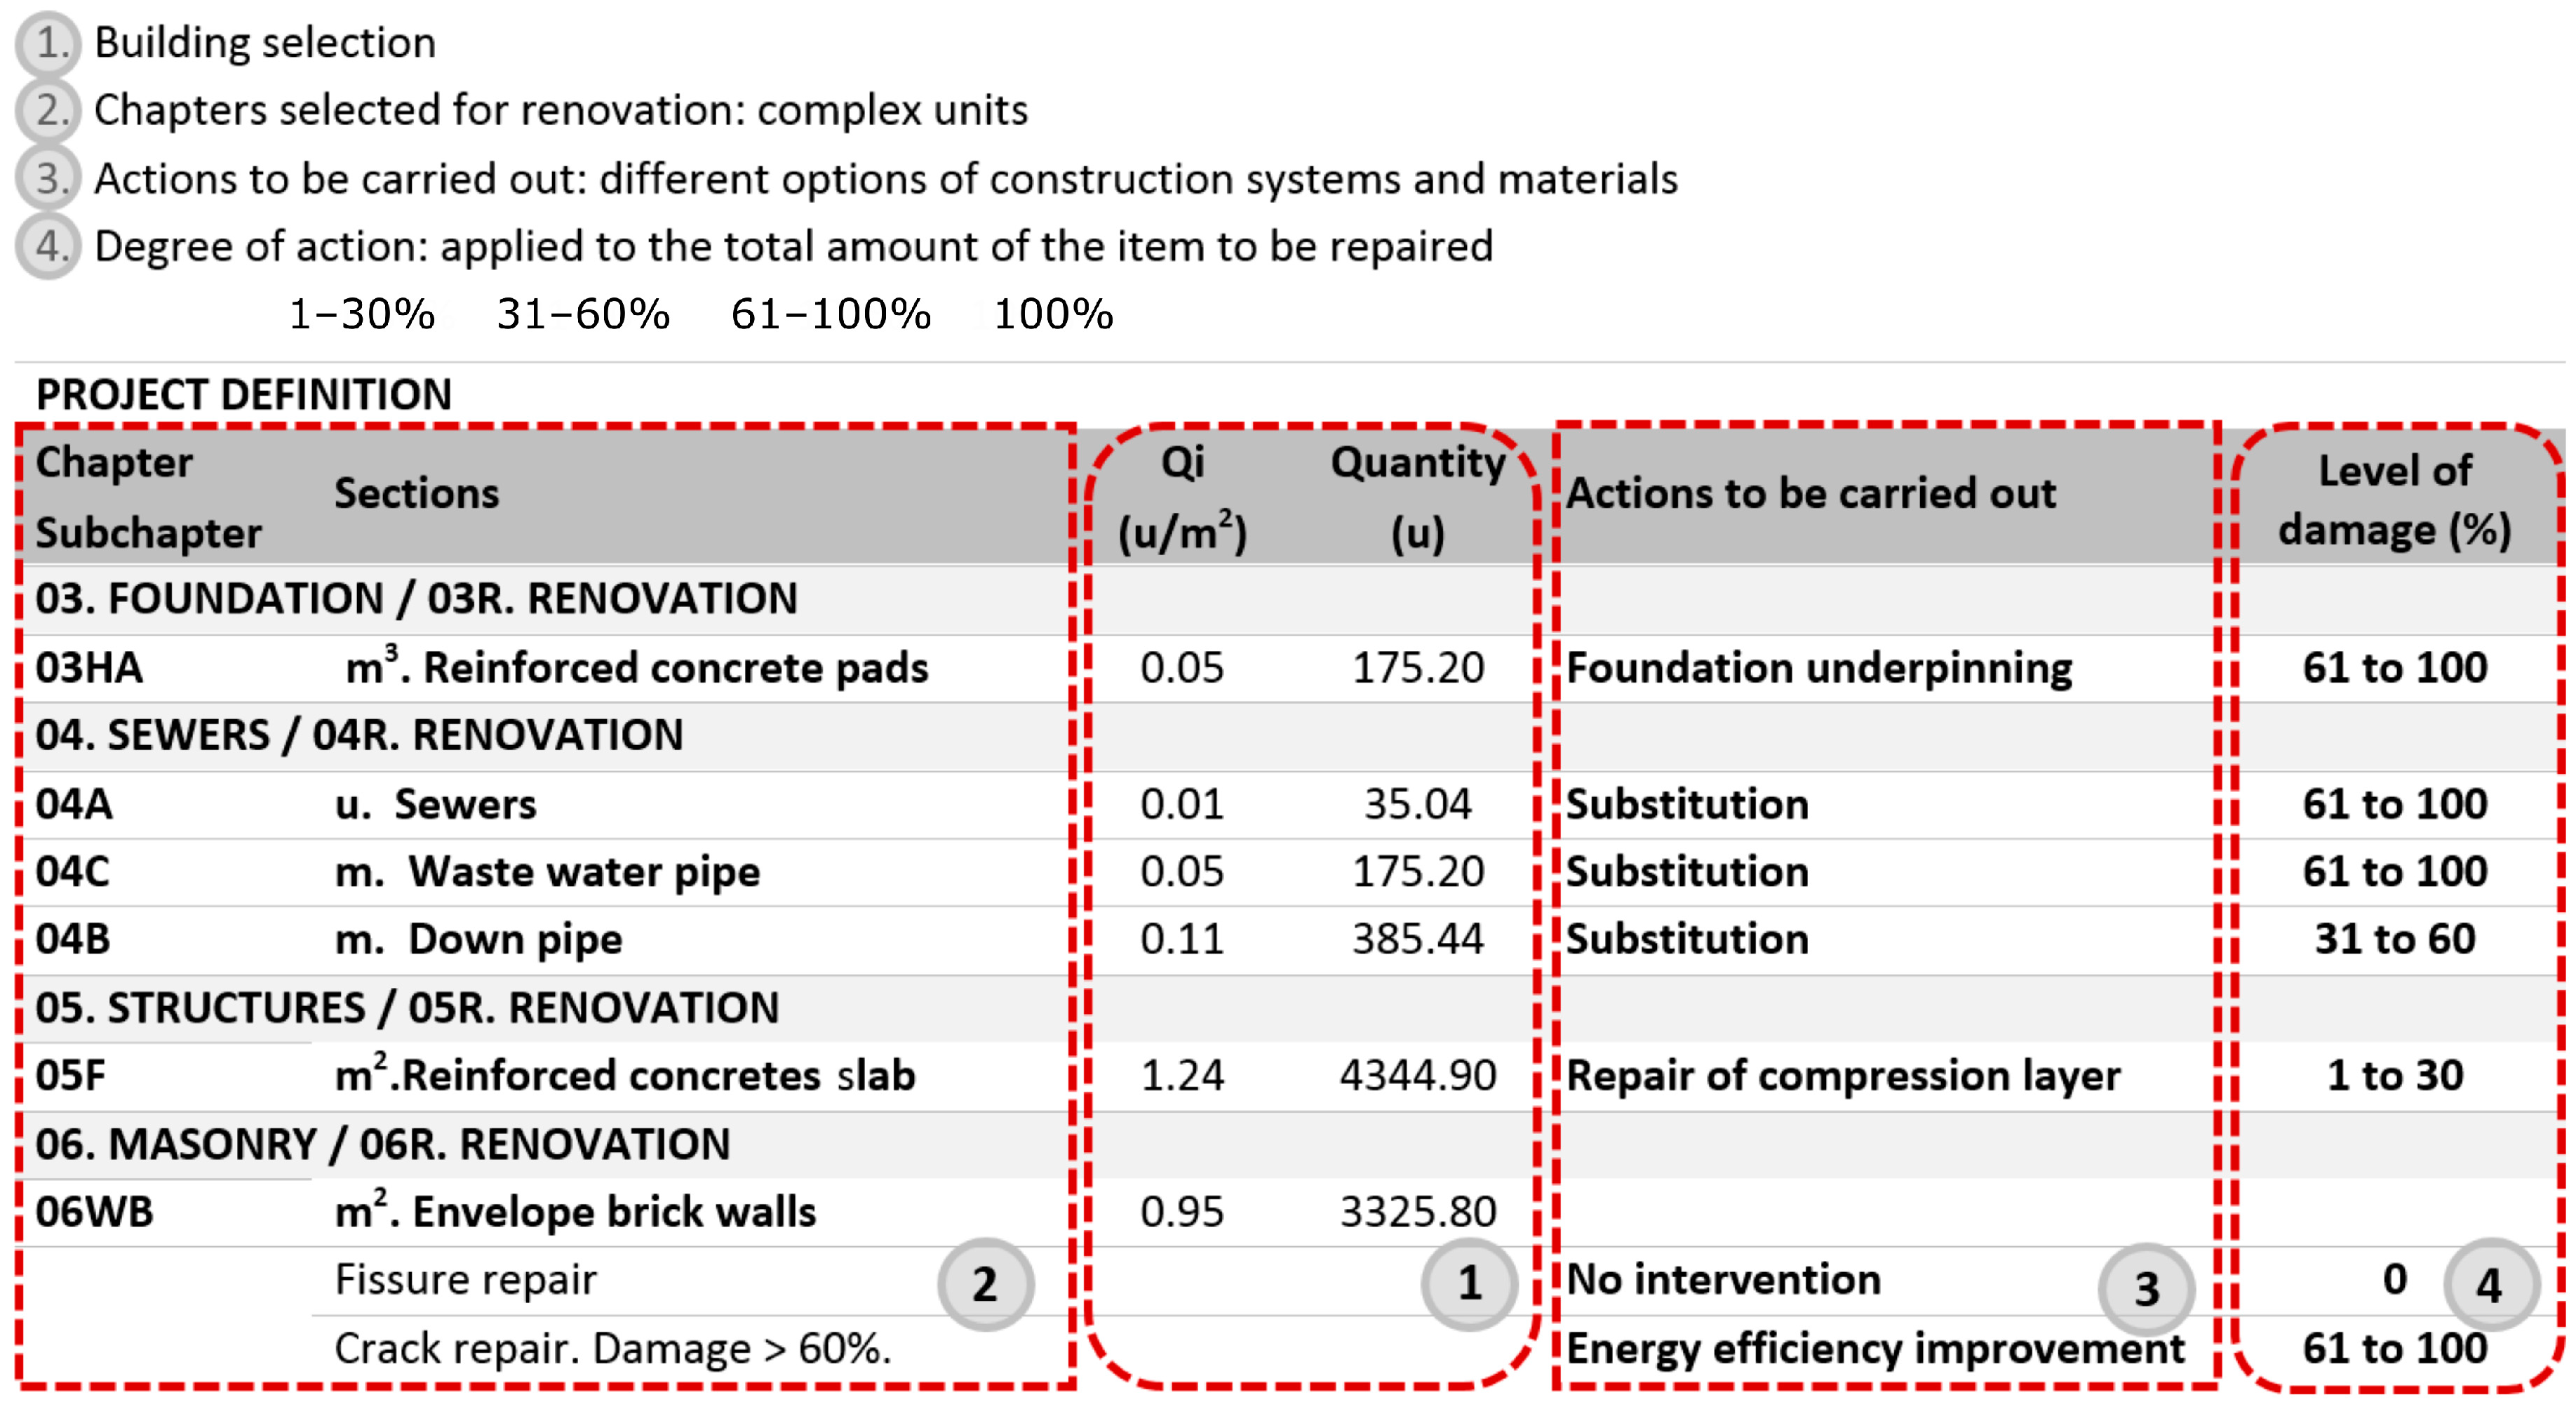
32] to adapt it to fit other buildings. Their model, also called HEREVEA, starts from the constructive description of the renovation project, its budget, and its bill of quantities. Emission or embodied energy factors are then applied to those quantities, which are subsequently converted into environmental impacts. The HEREVEA model is applied for the first time to evaluate the impact of the renovation of actual buildings in Seville, Spain. The EF assessment of construction projects developed by the authors in previous works is adapted to fit renovation projects for the first time, and is based on other research carried out for the assessment of rehabilitation or reconstruction of a building following a major accident. In the latter case, the building was seriously damaged and needed such major reconstruction and repair that it could not be considered a mere renovation; demolition was also considered. In the present work, the methodology is employed for small projects, many of which have insufficient entity to be considered a construction project by itself, but, instead, maintenance and repair work. The Andalusian Construction Cost Database [34] (ACCD) is used for the cost assessment, and new renovation costs, which are not included in the database, are created based on the work breakdown system of ACCD. First, 50 buildings are studied in order to statistically normalize the EF and cost. Secondly, five specific cases are studied in depth. This model not only enables the most important pathologies to be analyzed in terms of costs and EF, but it also determines the elements that control the impacts in each project. A comparison with the results of previous studies means that the influence of the building materials that control these impacts can be analyzed [35,36,
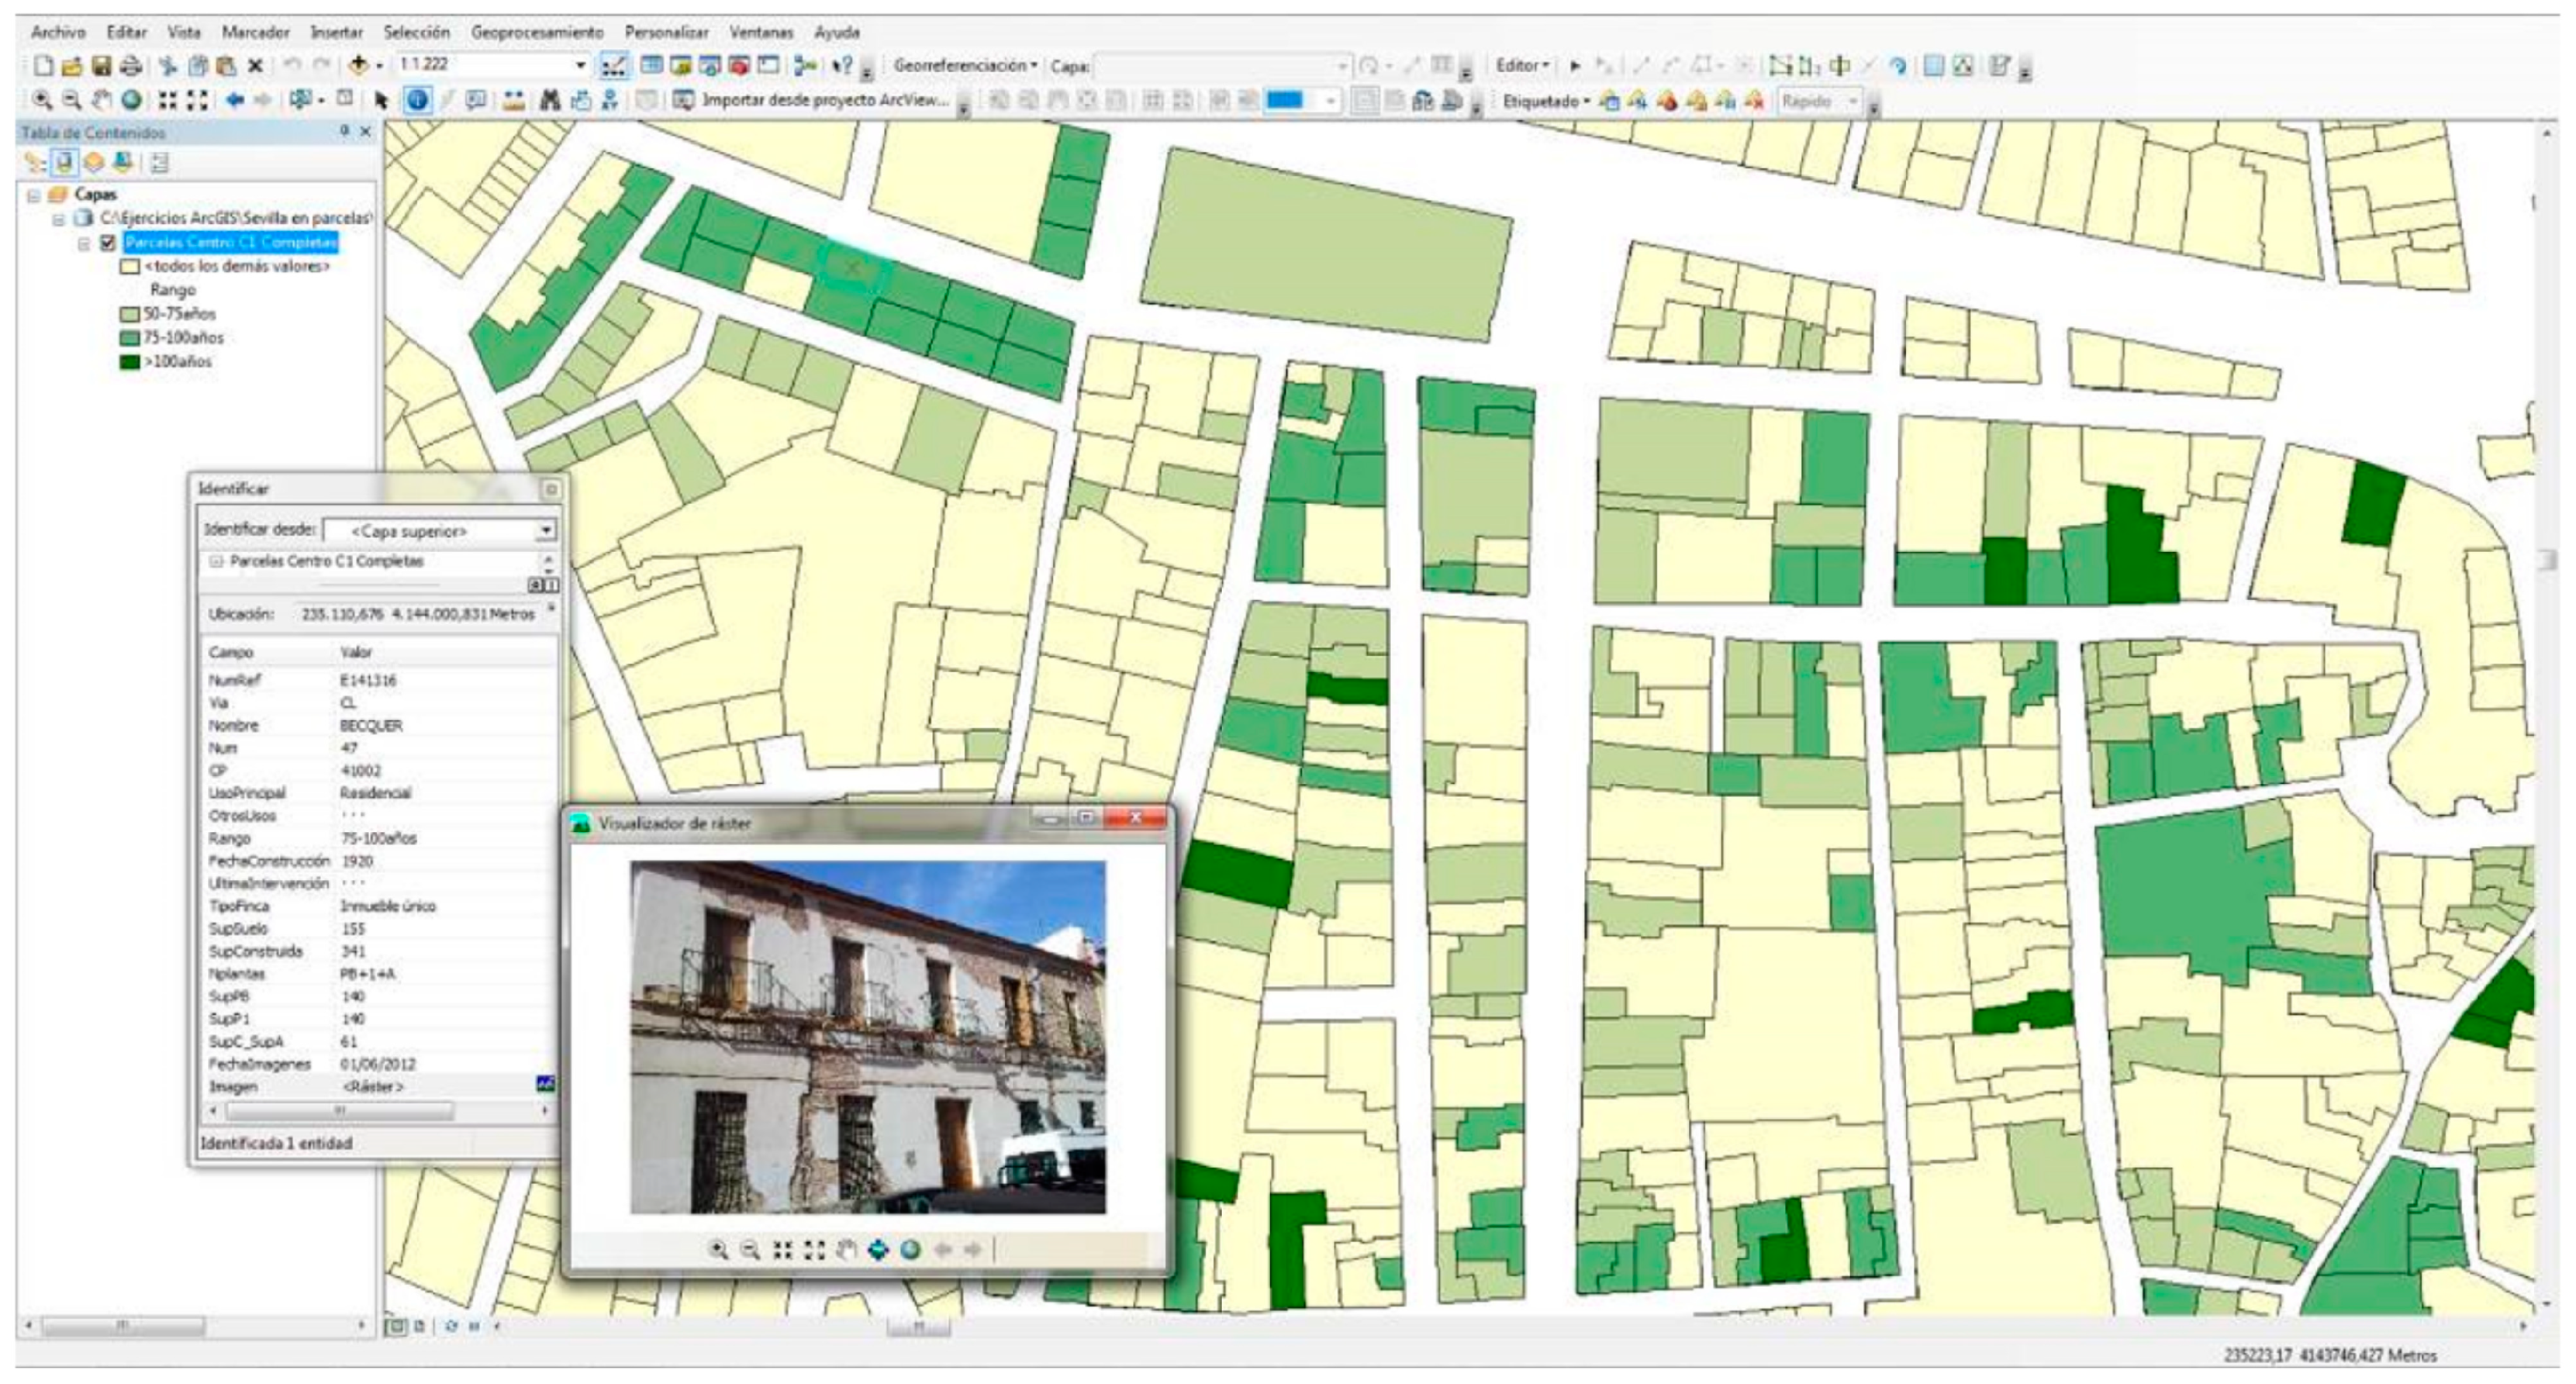
37]. The impacts are visualized simultaneously by combining the economic and environmental impact graphically. The HEREVEA tool has been integrated into a GIS in order to generate georeferenced results. Even in these small projects, the methodology has proved itself to be effective in detecting the level of environmental impact and allows comparisons to be made between various renovation projects.

2. Materials and Methods

2.1. System Boundaries

The renovation of a building takes place when deterioration or obsolescence occurs in its functionality. The UNE-EN15978 standard, Sustainability of construction works. Assessment of environmental performance of buildings. Calculation Method. [38], establishes at this point whether the building needs either maintenance or substitution of certain elements.
Regarding the transversal boundaries, those aspects and elements that interact with the building during this phase must be studied, namely, utility consumption, and the manpower, materials, and machinery necessary to carry out the renovation are attributed to the building [31].
In all the projects analyzed, it is considered that the only activity that takes place on the land is that undertaken by the renovation work. This impact lasts a year or less, i.e., the time taken for the renovation to be completed.

2.2. EF Methodology

For the environmental evaluation of the projects, the EF indicator adapted to buildings is used This article is a continuation of a previous study [32], where a residential building, composed of 40 flats situated by the Guadalquivir River, is rehabilitated after an accident that seriously affected the safety of the tenants.
Impact sources are identified according to the bill of quantities of each project; the elements that form part of the work units and the corresponding yields and quantities of resources used are thereby ascertained (Figure 1). The main sources of impact are the workforce, the building materials, the machinery used in the work, the construction and demolition waste (CDW), and the on-site consumption of water, power, and land. The EF calculation model (Figure 1) determines the total footprint, which in turn consists of various partial impacts: energy (fossil), pastures, fisheries, crops, and forests.

2.2.1. Energy Consumption

The power that is consumed on site is due to electrical machinery and combustion engines, and depends on the machine working hours within the work units (Equation (1) of Table 1).

2.2.2. Water Consumption

The amount of water employed for the in situ fabrication of mortar and concrete is obtained from the work units, and its energy and emissions are calculated as for any other construction material. Finally, the water consumed is transformed into CO2 emissions, as indicated in Equation (2) of Table 1.

2.2.3. Built-Up Land

The EF methodology takes into account the land that is directly occupied (two possible types of territory: forests or crops), since this land will be biologically unproductive from the moment it is urbanized. In our case, the area considered is of crops, because Seville is located on originally agricultural land. In the present analysis, the lot size corresponds to the plot where the project is located and the EF is calculated using Equation (3) of Table 1.

2.2.4. Manpower

The analysis of the impacts generated by the construction workers includes the generation of MSW and food consumption. Footprints generated according to the type of food (pastures EF from meat, productive sea EF from seafood, cropland EF from crops) are calculated by taking the diet into account [45] and by using the factor of equivalence of each productive territory (see Table 2). All food also produces an energy footprint due to the energy consumed in its transformation. The equivalence factors used [41] are implicit in the calculation of the EF (gha/person and year) (see Equation (4) of Table 1). In the generation of MSW, a coefficient is used that indicates the average MSW generated per worker [43] (Equation (5) of Table 1).

2.2.5. Materials

Building materials, through manufacturing, transport, and installation processes, consume energy from various sources. In order to obtain the EF of each constructive element, the basic unit (m3, m2, meters, tons, thousands of units, etc.) is transformed into a volume (m3) and the corresponding weight is obtained from each element density. Finally, the databases of life cycle analysis (LCA) define the CO2 emissions for each kg of material. The database used in the present work is that of Ecoinvent (implemented in SimaPro v8 and developed by the Swiss Centre for Life Cycle Inventories (The University of Edinburgh, Edinburgh, Scotland, UK) due to its transparency in the development of processes [47]. In order to obtain CO2 emissions, the Life Cycle Inventory of the materials is analyzed using the IPCC 100a methodology [48] and Equation (6) of Table 1 is applied. The EF of forests produced by the consumption of wooden materials depends on the productivity of the forest according to its typology and the corresponding equivalence factor (Equation (7) of Table 1). Through Equation (8), the EF of transport of manufactured materials for their delivery to the construction site is determined (trucks transport a maximum of 24 tons, and travel an average distance (back and forth) of 100 km).

2.2.6. Machinery

The footprint caused by the use of machinery is analyzed by means of its energy consumption (either fuel or electricity), and it is then linked with the power of its engine. The CO2 emissions generated by the production of one kWh by the Spanish power system are employed (Equation (9) of Table 1).

2.2.7. Construction and Demolition Waste (CDW)

In order to account for the CDW impact, it is essential to include these activities in the project budget separately in their corresponding chapter. This is mandatory in Spain by Royal Decree 105/2008, which regulates the production and management of construction and demolition waste [49]. The CDW impact includes the machinery and operators used in handling and transporting waste to the treatment plants.

2.3. Cost Model

An important aspect regarding the incorporation of environmental impact into the project budgets involves its incorporation into the construction work breakdown systems (WBS) or classification systems, such as MasterFormat [50], Uniformat [51], Standard Method of Measurement of Civil Engineering [52], CI/SfB [53], and Uniclass [54].
In the present work, the model developed by Ramírez-de-Arellano-Agudo [55] is followed. This model focuses on the measurement of any component of the execution units by means of their decomposition into materials, labor, and machinery in accordance with the systematic classification developed in the Andalusia Construction Cost Database [34], which is the most widely used tool for the evaluation of construction costs in the region.
Given the uniqueness of the renovation work complex units have been chosen, which consider constructive elements formed by a set of basic, auxiliary, and unitary elements. These constructive elements form a set that brings together the execution procedures, activities, and materials necessary to perform the various tasks involved in the renovation actions (Figure 2).
In order to take into account all the components involved in a complex unit of a constructive renovation action, the first step is to describe the current state of the item to be repaired and the final state after having been repaired. The execution process is then defined—starting from the demolition or dismantling of the elements that are part of the system to be recovered; continuing with the specific recovery work; and finishing with the replacement of each element that had to be removed at the beginning of the work [56]. A database is created through the definition of 350 new unit costs and 33 new basic costs, which are subsequently employed for the definition of 68 complex unit costs.

2.4. HEREVEA Tool

In the HEREVEA tool, developed by the authors for the Regional Ministry of Housing in Andalusia, the introduction of data referring to the interventions is performed by selecting the actions and their intensities as a percentage based on the area damaged with respect to the total of the foundations, structures, roofs, masonry, installations, carpentry, and accessibility, as well as on the definition of other geometric data, such as average height from floor to ceiling, and the total height of the building [33].
In Figure 3, the tool, after having input the building characteristics (1), looks for the most similar project among the 94 previously measured projects in its database by matching the number of storeys, the type of roof, type of structure, and underground parking, among other characteristics, and then the average quantities (Qi) per floor area can be applied. The family group (or budget chapter) to be retrofitted (2), the action to be carried out (3), and its degree of damage (4) are subsequently selected. Actual cases are employed to define the most representative actions, and social housing data from the city of Seville are applied.

2.5. Normalization of Variables

After the economic and environmental values from the HEREVEA tool have been attained, the values are statistically normalized so that both aspects can be directly compared, since their scales and units differ. For the normalization of variables, the sample is based on a study carried out on the market of dwellings susceptible to renovation in Seville; more specifically, these are in the historical center, where there are the largest concentration of old buildings in Spain and one of the largest in Europe. First, the study groups dwellings according to their age: between 50–75, 75–100, and over 100 years old. Second, georeferenced information regarding the general constructive characteristics and their conservation status is obtained from a field study, thereby allowing the most degraded areas, neighborhoods or streets requiring priority action to be identified in an easy and reliable way [57], see Figure 4.
The instances of damage are defined regarding their initial state, which will produce different renovation projects, with the objective of evaluating the sources of economic and environmental impacts. The various affected parts of a deteriorated building are correlated, that is, whether it is necessary to perform a foundation underpinning due to the detection of cracks in the façade and/or roofs. The definition of the scenarios takes into account these combinations and relationships, and results in a number of variables that can be altered in a consistent manner. Similarly, although the analysis of scenarios does not take into account the probability of the cases occurring, it does take into account that the same types of buildings are not repeated, which provides the sample with a wider variety of work units.
The values obtained from the application of the tool for the evaluation of the economic and environmental impact of the renovation work are calculated for each project per floor area, and are respectively compared to those of a new building of similar characteristics to be constructed on the same plot as calculated in González-Vallejo et al. [58] (Equations (10) and (11) in Table 3).
As stated above, the economic and environmental indicators are expressed in different units (€/m2 and gha/m2, respectively), therefore they cannot be directly compared; moreover, they are also in different magnitudes. In order to relate these indicators, standard deviations of the Z statistical values are used (Equations (12) and (13) in Table 3).
The indicators Z_costi and Z_EFi can now be compared. A Z-value indicates how many units of standard deviation a given value contains, that is, the Z value of an X value of a data set is the distance at which X is above or below the mean, measured in units of standard deviation; if the value is positive, the deviation is above the mean, and if it is negative, then it is below the mean. To represent the proportion that the economic value supposed in the recovery of each project against the environmental value, the normalization of the economic and environmental variables is carried out (Equations (14) and (15) in Table 3). Obtained the normalized values N_costi and N_EFi for each project, it is possible to appreciate the significance that each indicator acquires against the other.

2.6. Case Studies

First, the methodology of HEREVEA is applied to 50 renovation projects (Table 4) located in the city of Seville, all of which are formed of multifamily dwellings of 2 to 5 storeys, which are the most representative [59]. In the chosen area, that of the northern part of city’s historical center of Seville (postal codes 41003 and 41002), an analysis of the previous state of the building stock was made, which responds to the elements susceptible to renovation due to their poor maintenance, and which forms part of the most representative building typologies. This work was coordinated and promoted by the Regional Ministry of Housing and Territorial Planning, and was focused mainly on the renovation of public and privately-owned dwellings. Low-income families live therein and several buildings are maintained by the city of Seville. The significance of the Seville projects is that these are representative of Mediterranean construction in southern Europe, as many European projects focus on the similarities between countries [60].
The pathologies and corresponding level of damage are summarized in Figure 5.
Second, the methodology of HEREVEA is applied to five cases that are analyzed in depth; the dwelling pathologies are summarized in Figure 6. In general, the state of conservation of the enclosures is good except for small fissures of exposed bricks and detachment of the plaster, and a number of areas with localized humidity stains and mold. However, in case 5, a differential settlement of the foundation has caused cracks and fissures in walls, and severe humidity is present. The details of the interventions for each of the projects, the pathologies, and the level of damage in the five cases studied are summarized in Figure 7.

3. Results and Discussion

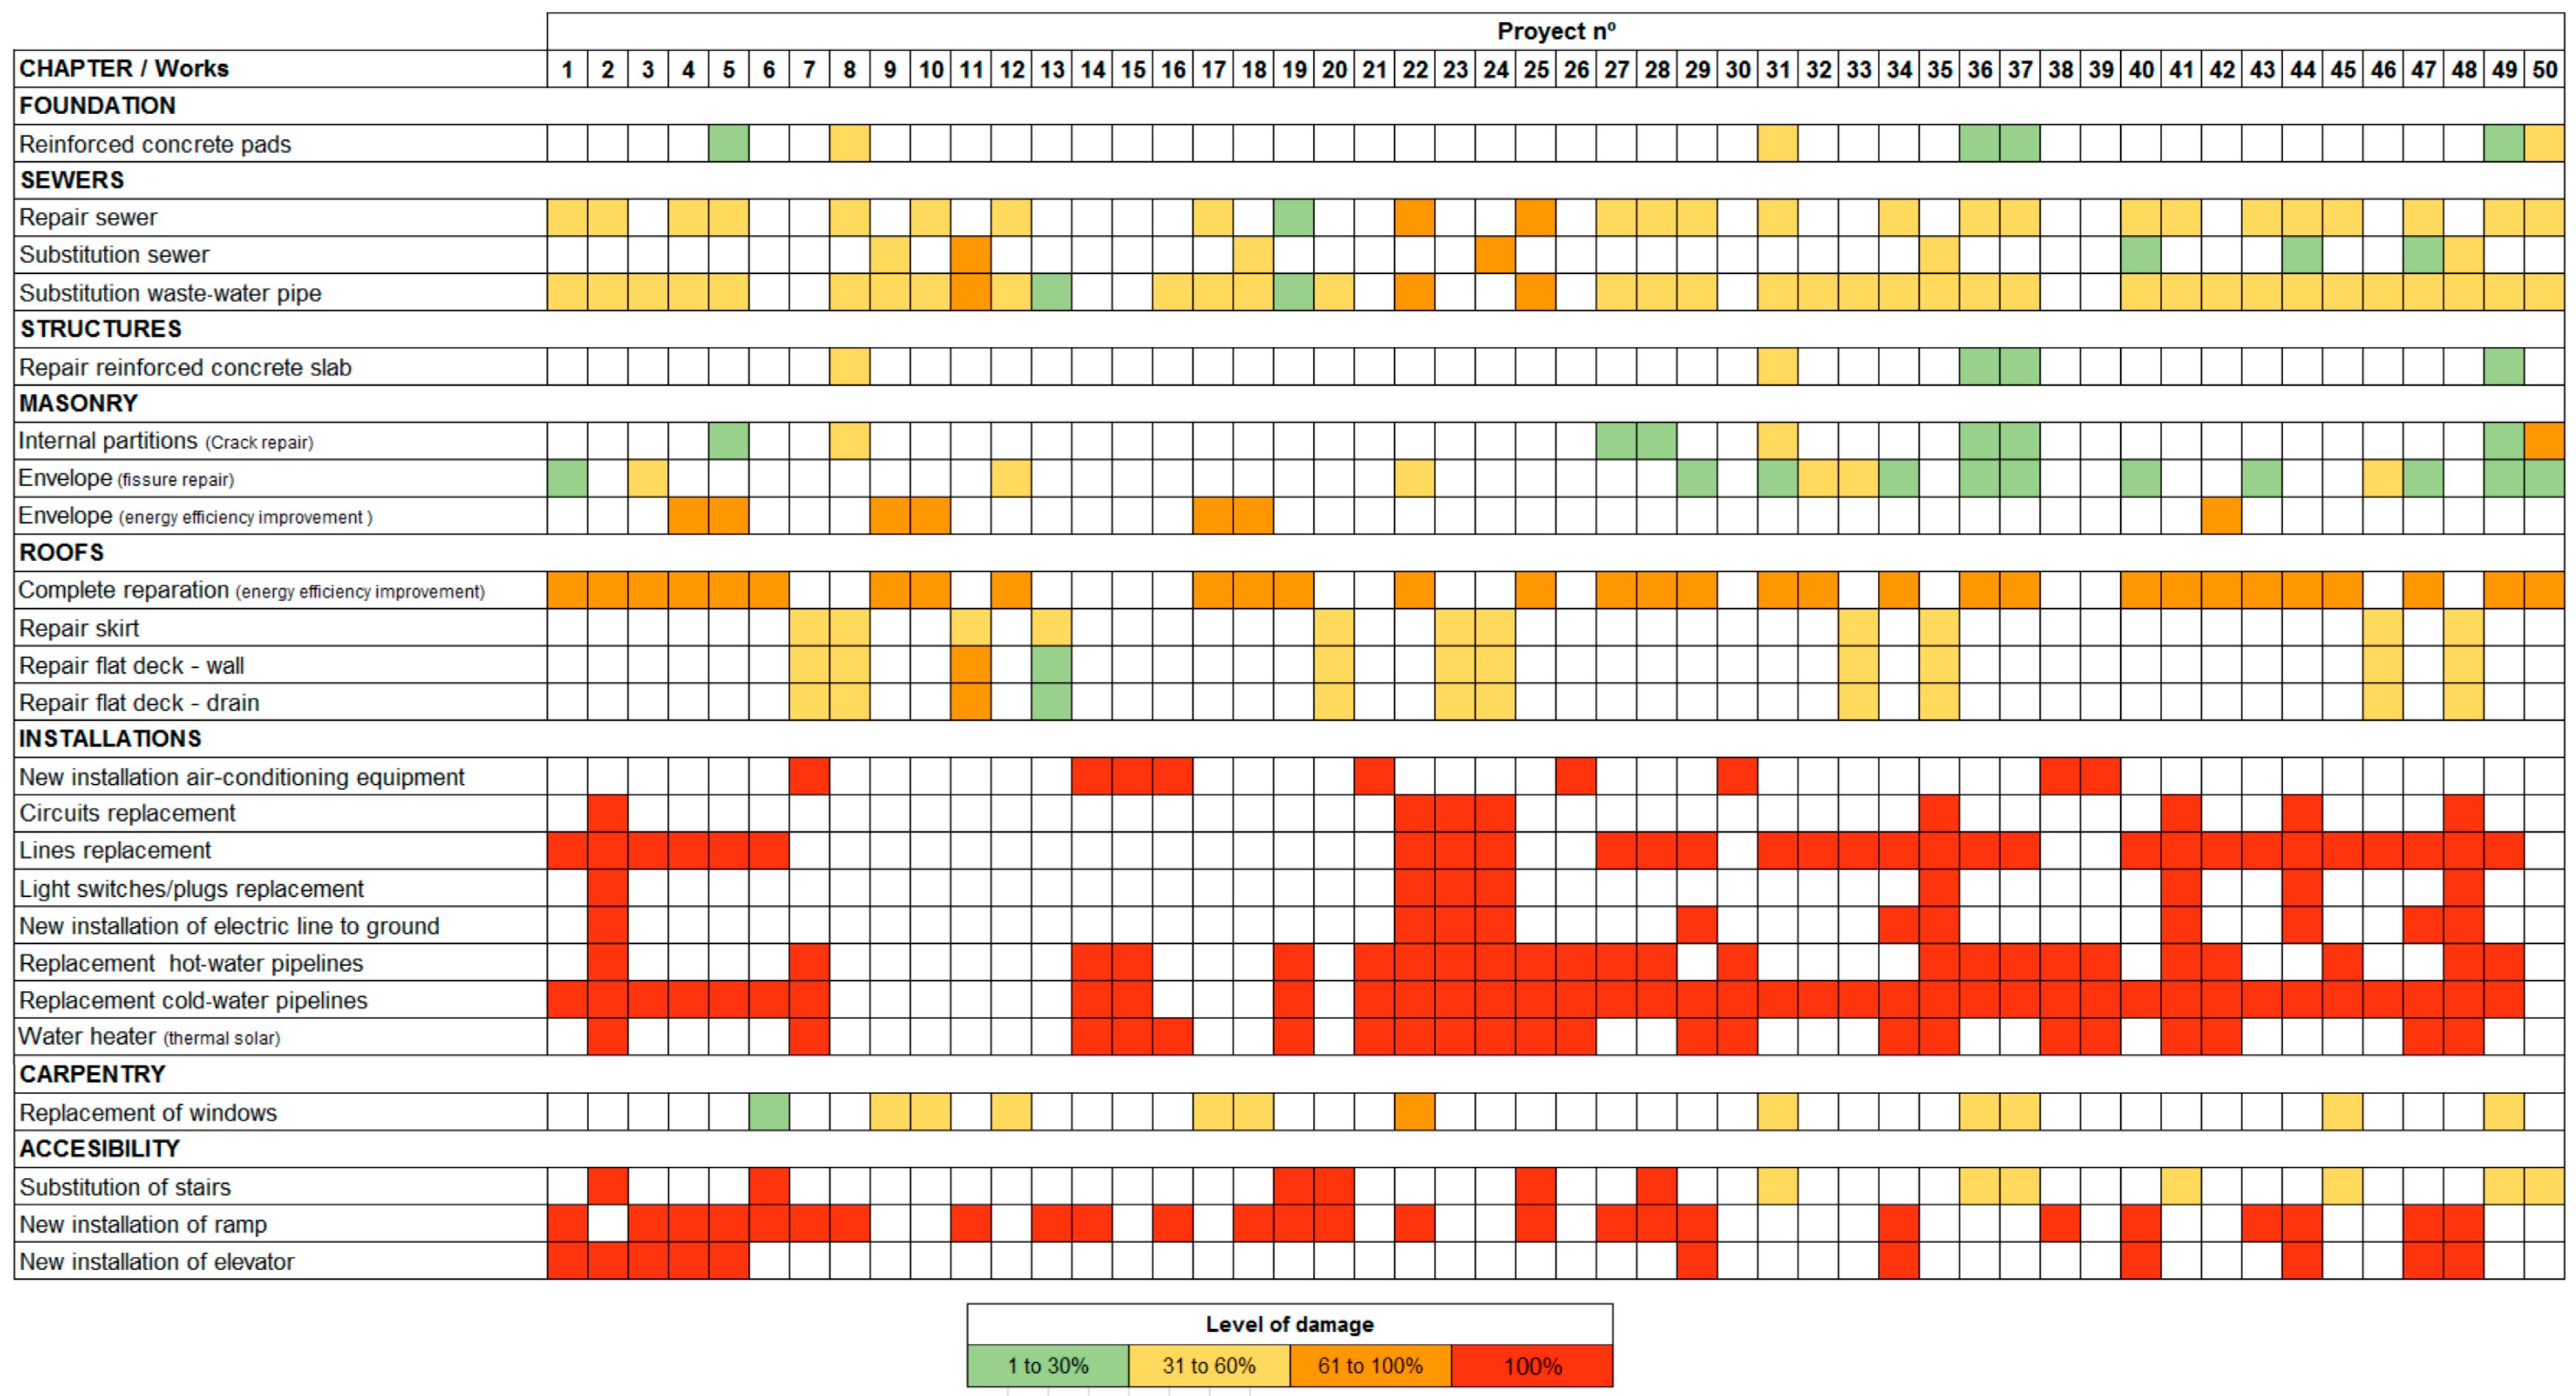
The HEREVEA tool analyzed 50 dwellings located within the same urban area whose state of conservation is susceptible to submission for renovation.
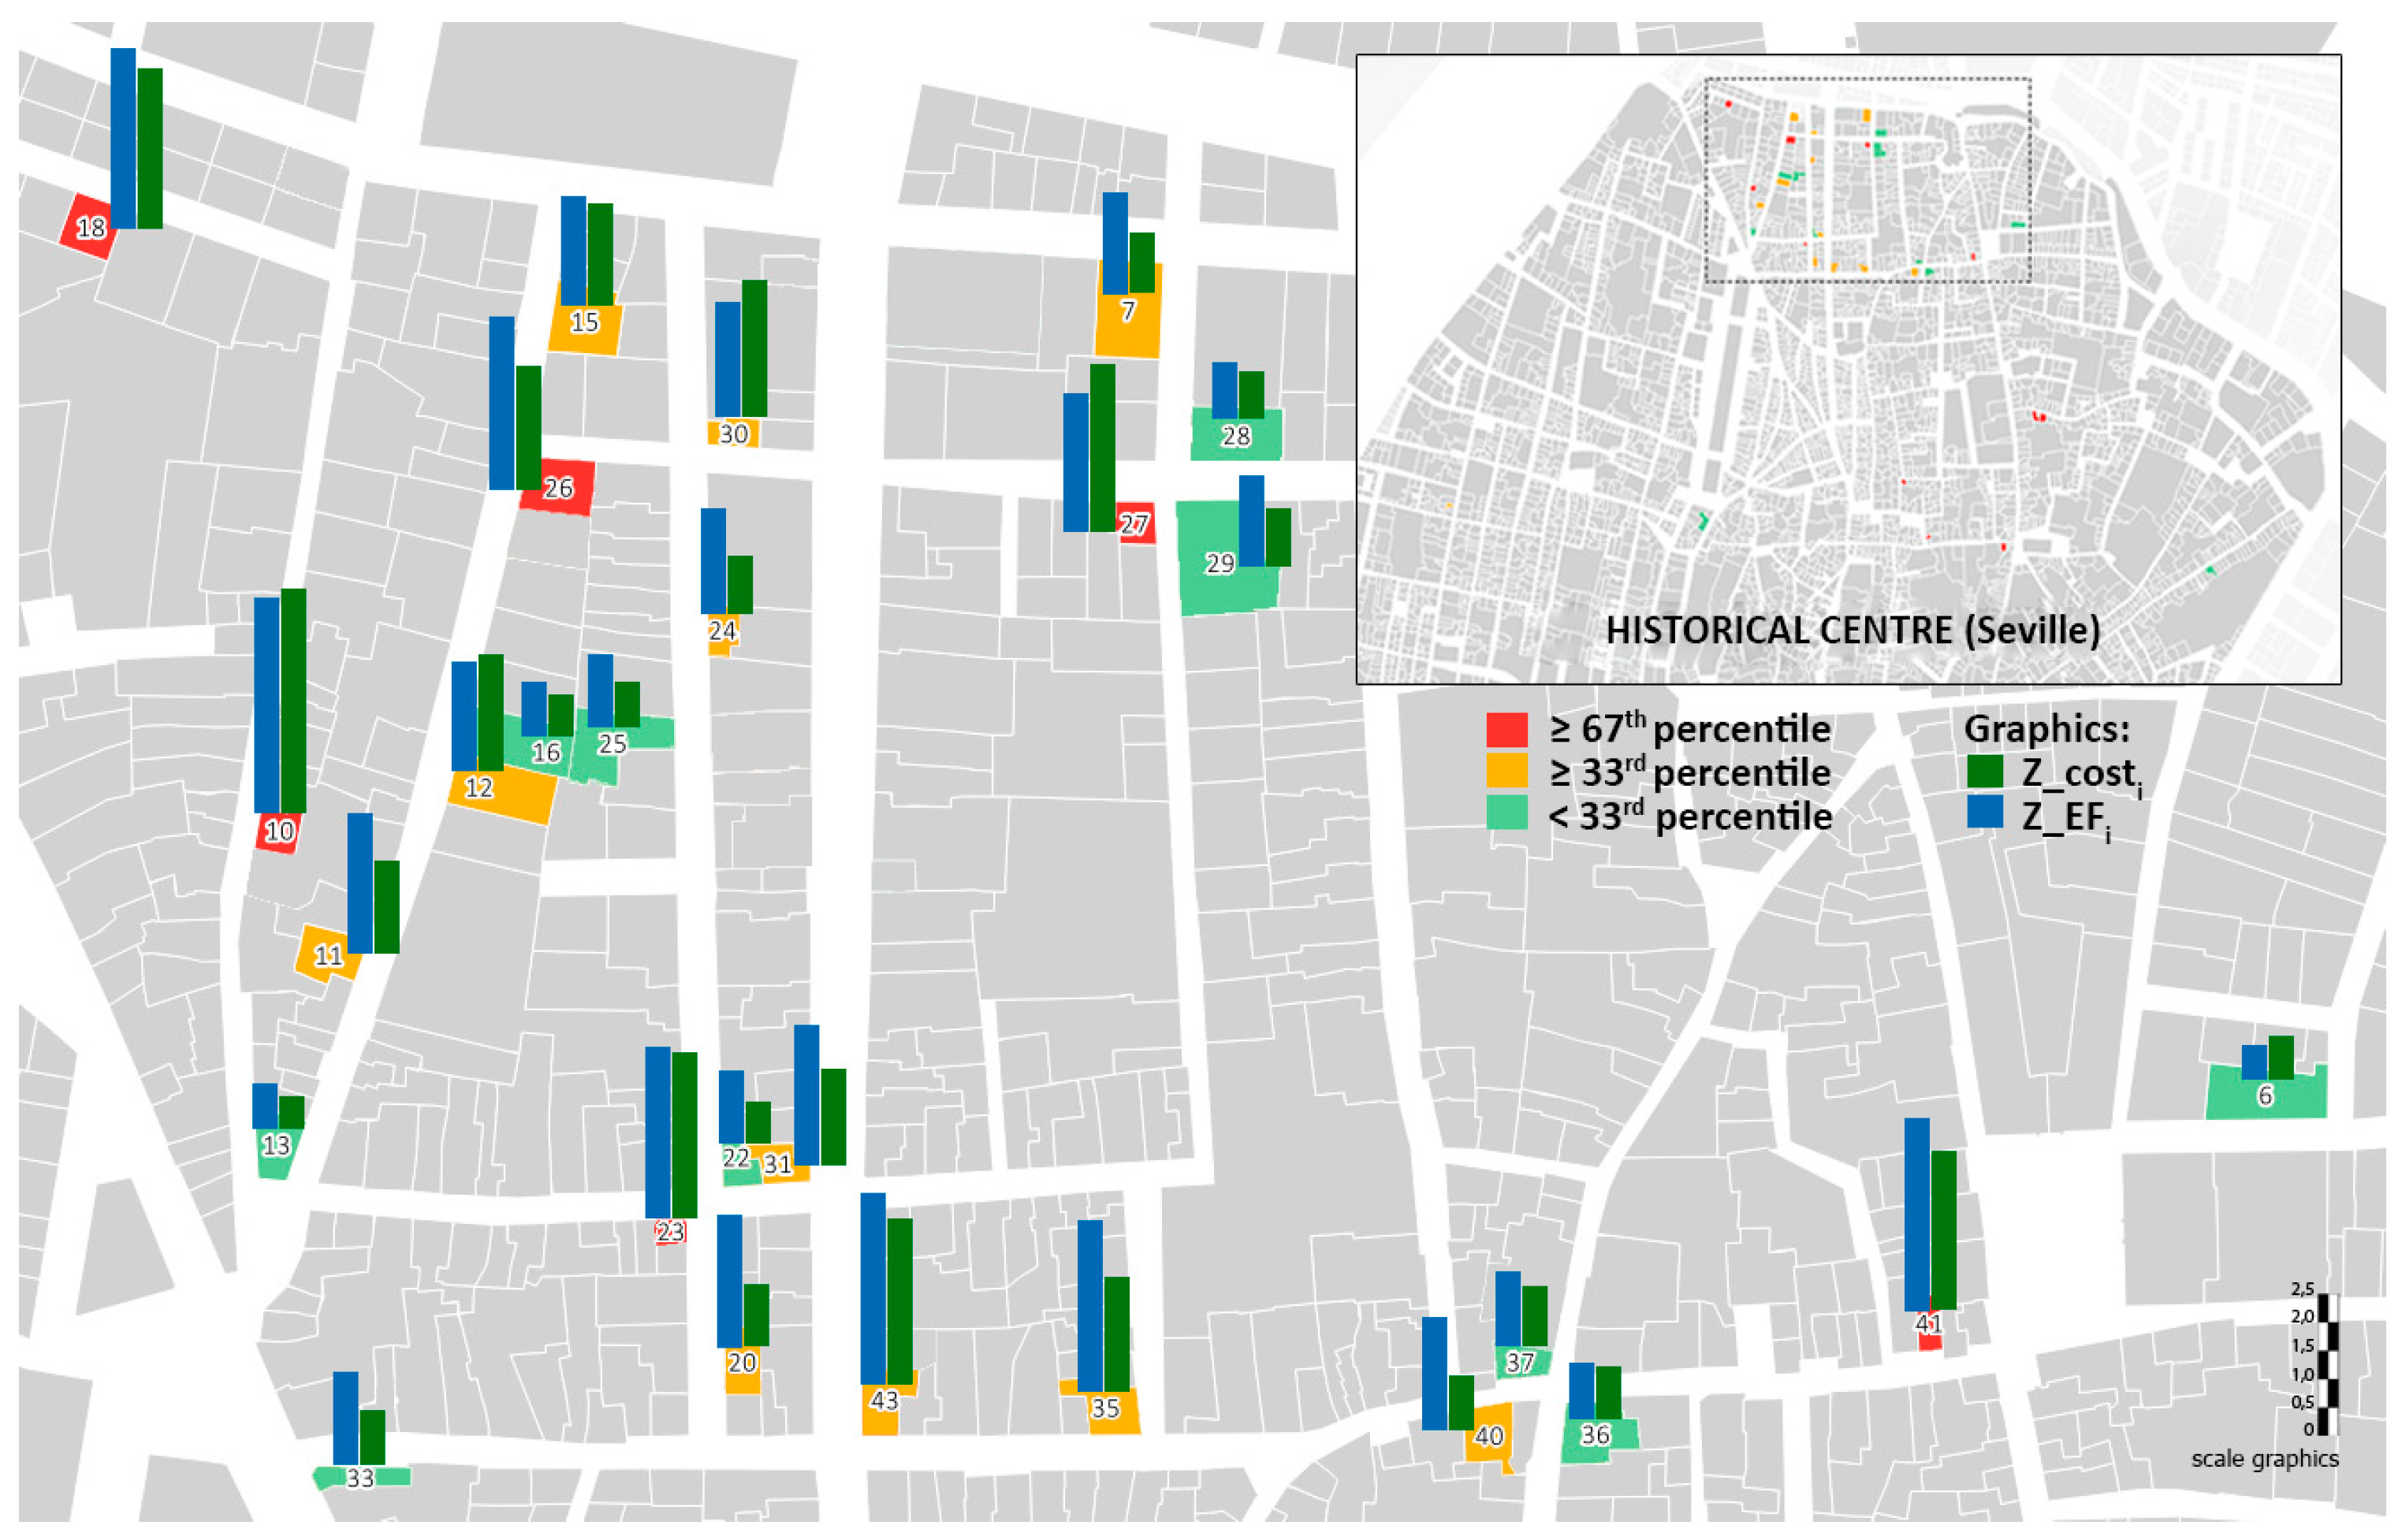
Figure 8 shows a sample of 27 plots out of 50 cases analyzed (number of the colored plot). Each dwelling analyzed is identified in red, yellow, or green. The color represents how the value of the sum of the two normalized indicators (N_costi + N_EFi) is positioned with respect to the complete sample of 50 cases (for which the distribution of the two populations is similar). The percentile has been used because it relates each value to the sample by providing a measure of the group and the values within the group, whereby percentile 0 represents the lowest value of the sample, and 100 the highest. Pi is the i–th percentile, where i takes values from 1 to 100. Of the sample values, i% are lower than Pi and the remaining (100 − i)% are greater. In this way, a scale is set: those above or equal to P67 (red plots), above or equal to P33 (yellow plots), and below P33 (green plots) are shown in Figure 8. Therefore, in the aerial view of the sample, plots are colored with respect to the corresponding sum of normalized economic and environmental indicators. For each plot, the graphical representation of the data also includes the information referring to the comparison of N_costi and N_EFi in a bar chart, blue for cost, and green for the EF, whereby the green column of plot 50 is equal to one standard deviation.
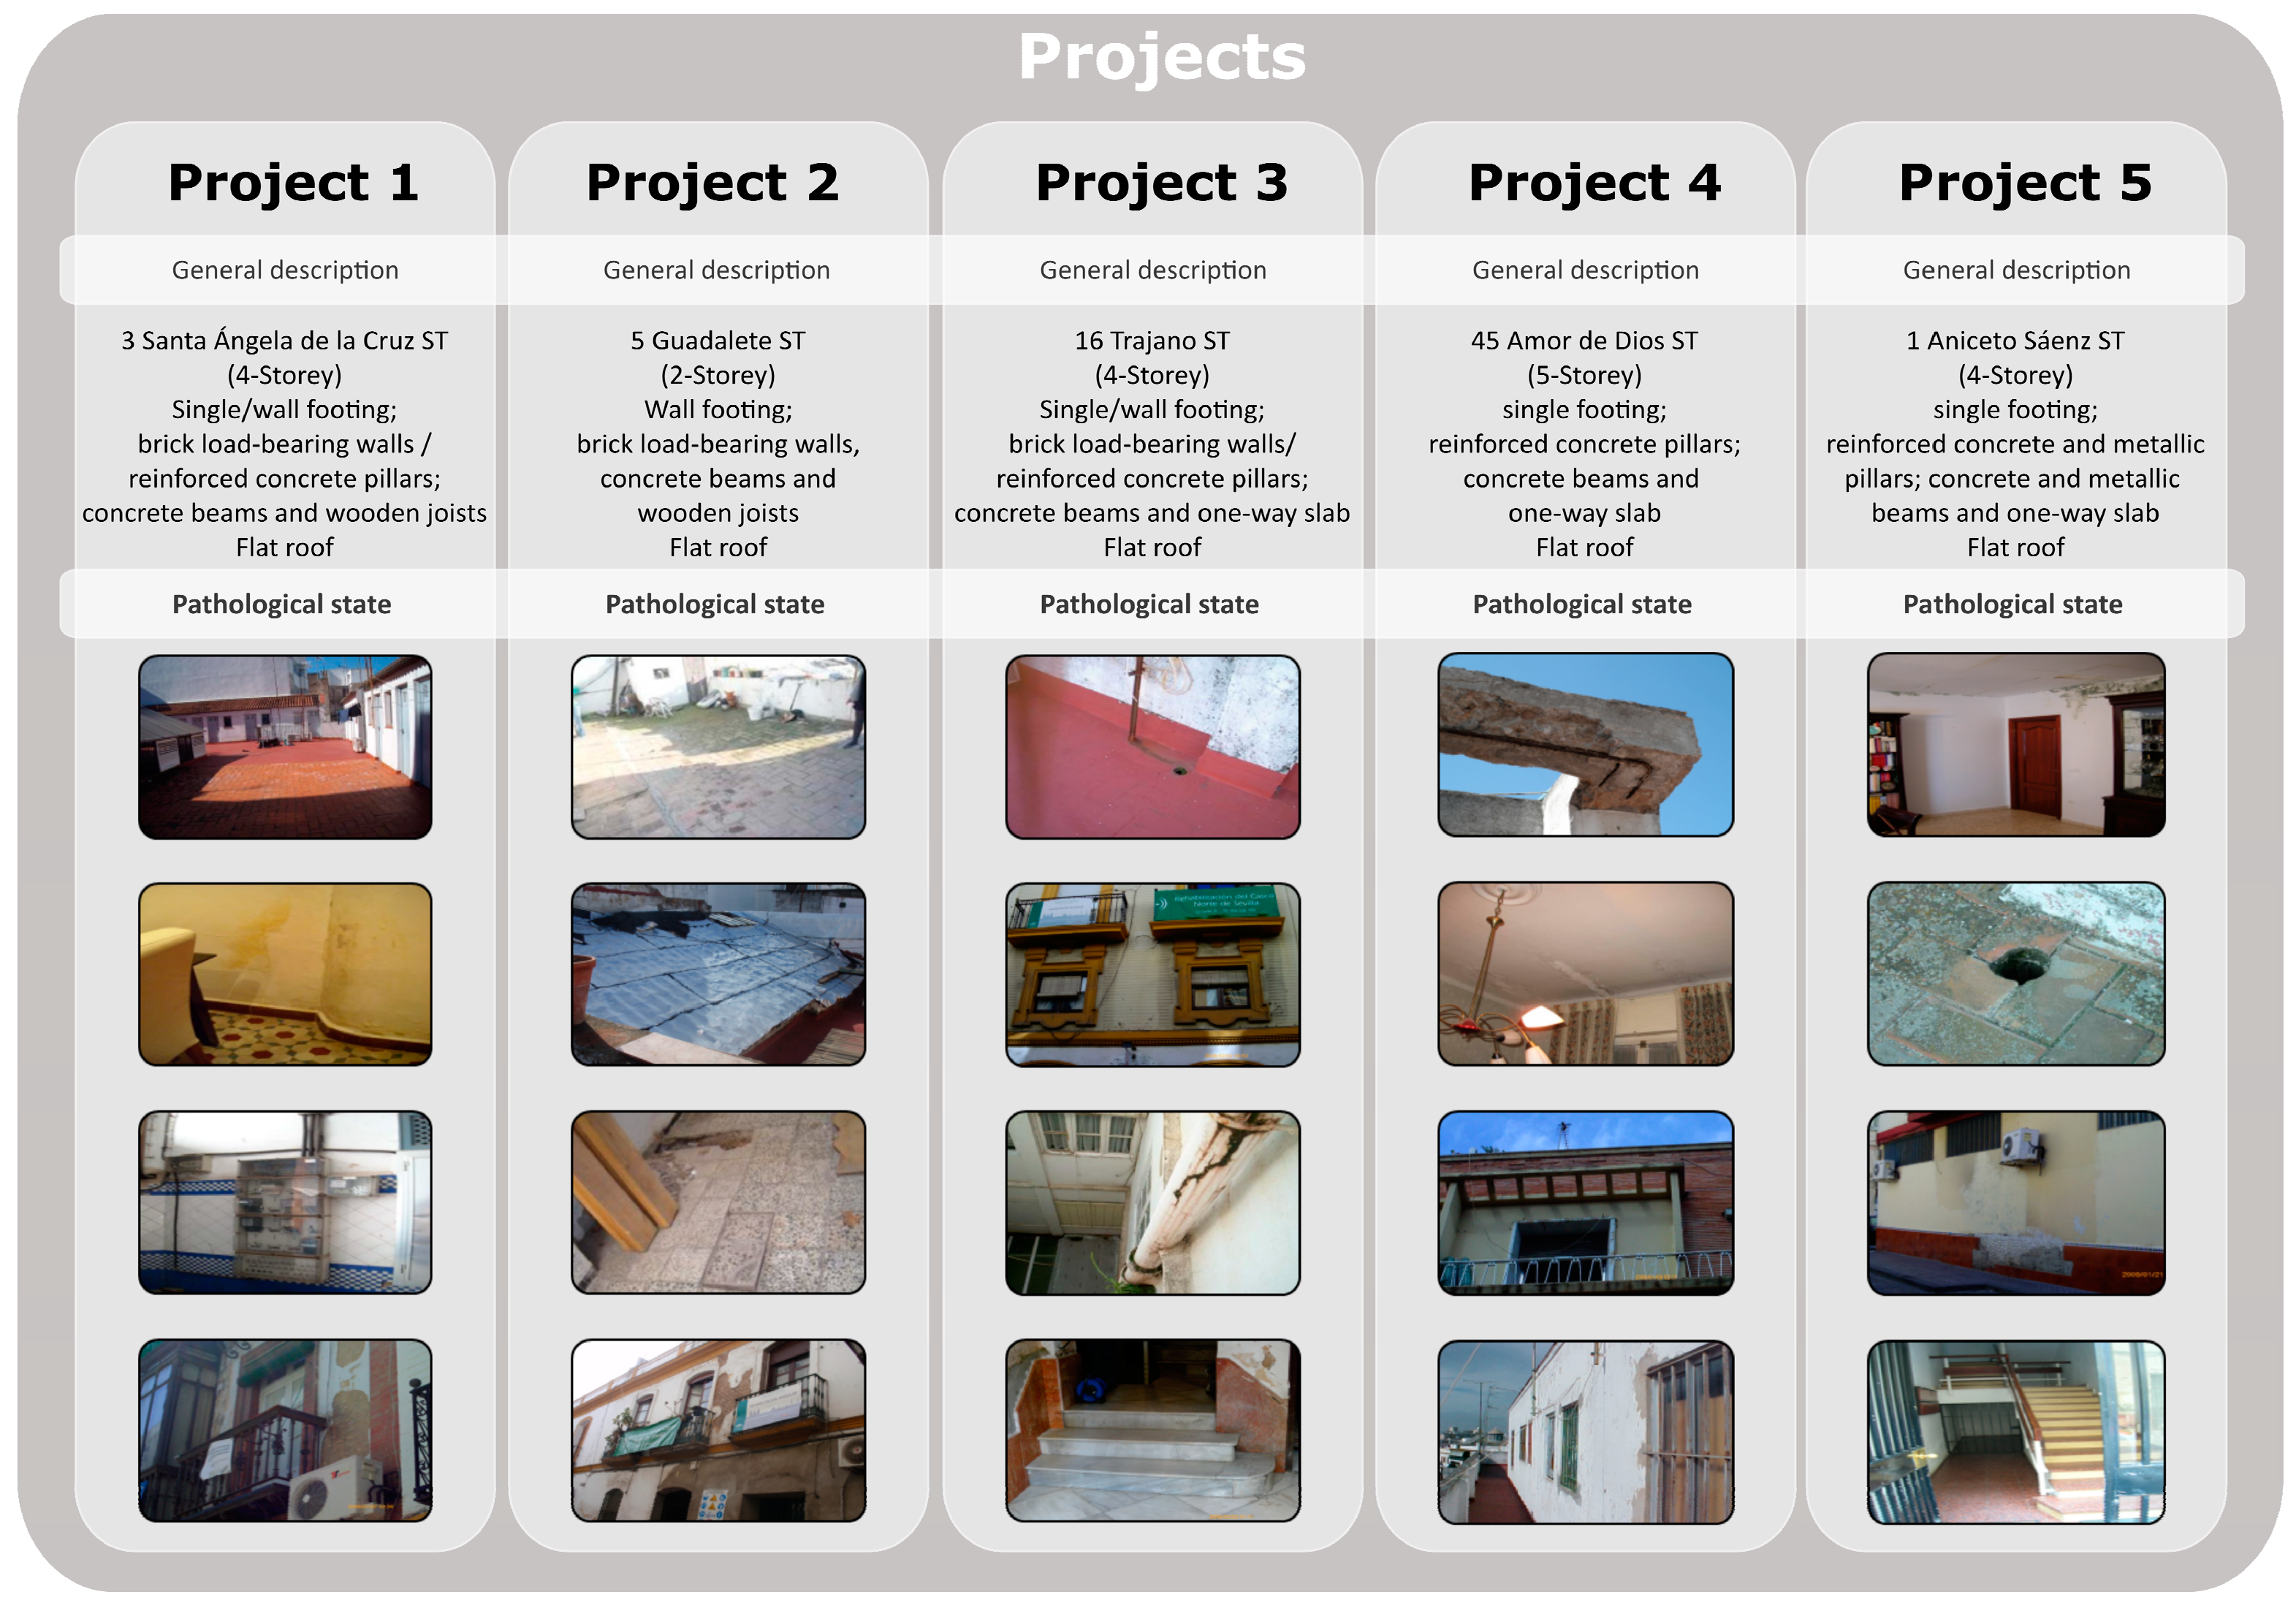
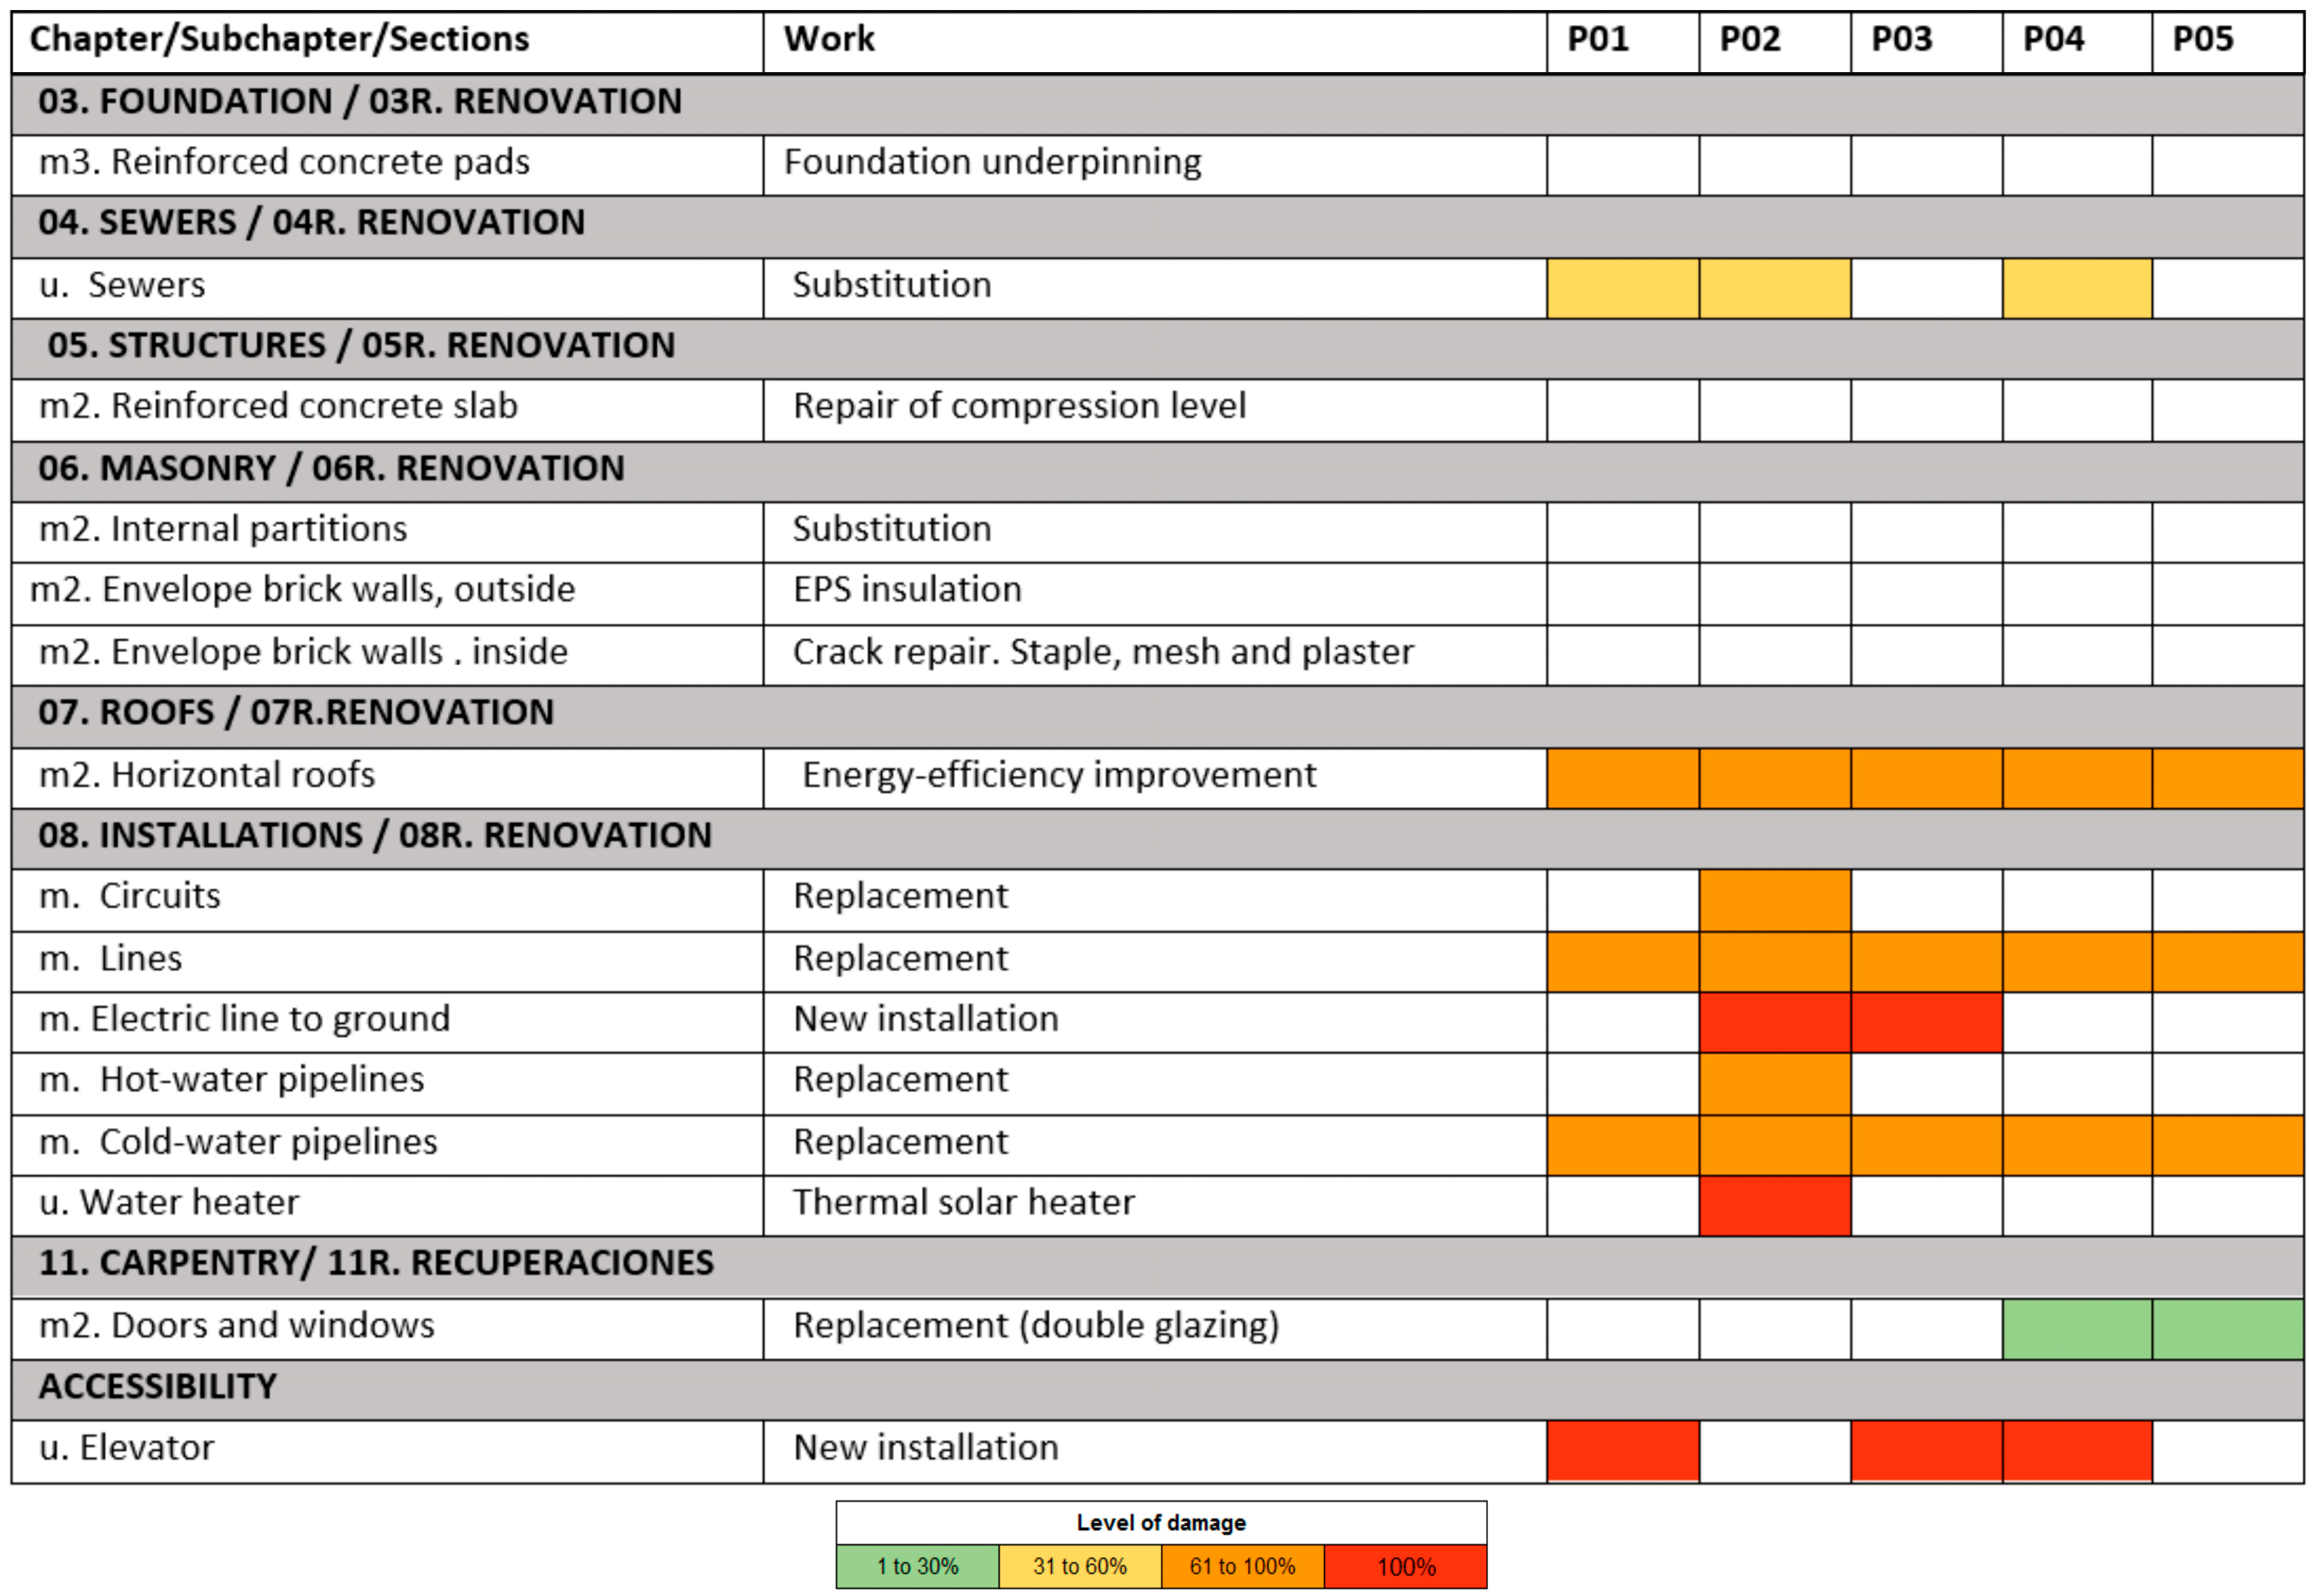
In order to represent the significance of the normalized economic and environmental variables, the five projects from Figure 6 and Figure 7 are summarized in Table 5. It is noteworthy that the environmental aspect is as significant as the economic impact. Only the environmental impact of project 2 is above the average. This indicates that all projects evaluated are not seriously damaged with respect to the population; all are close to the average values.
A more in-depth analysis can be performed on the five projects. 
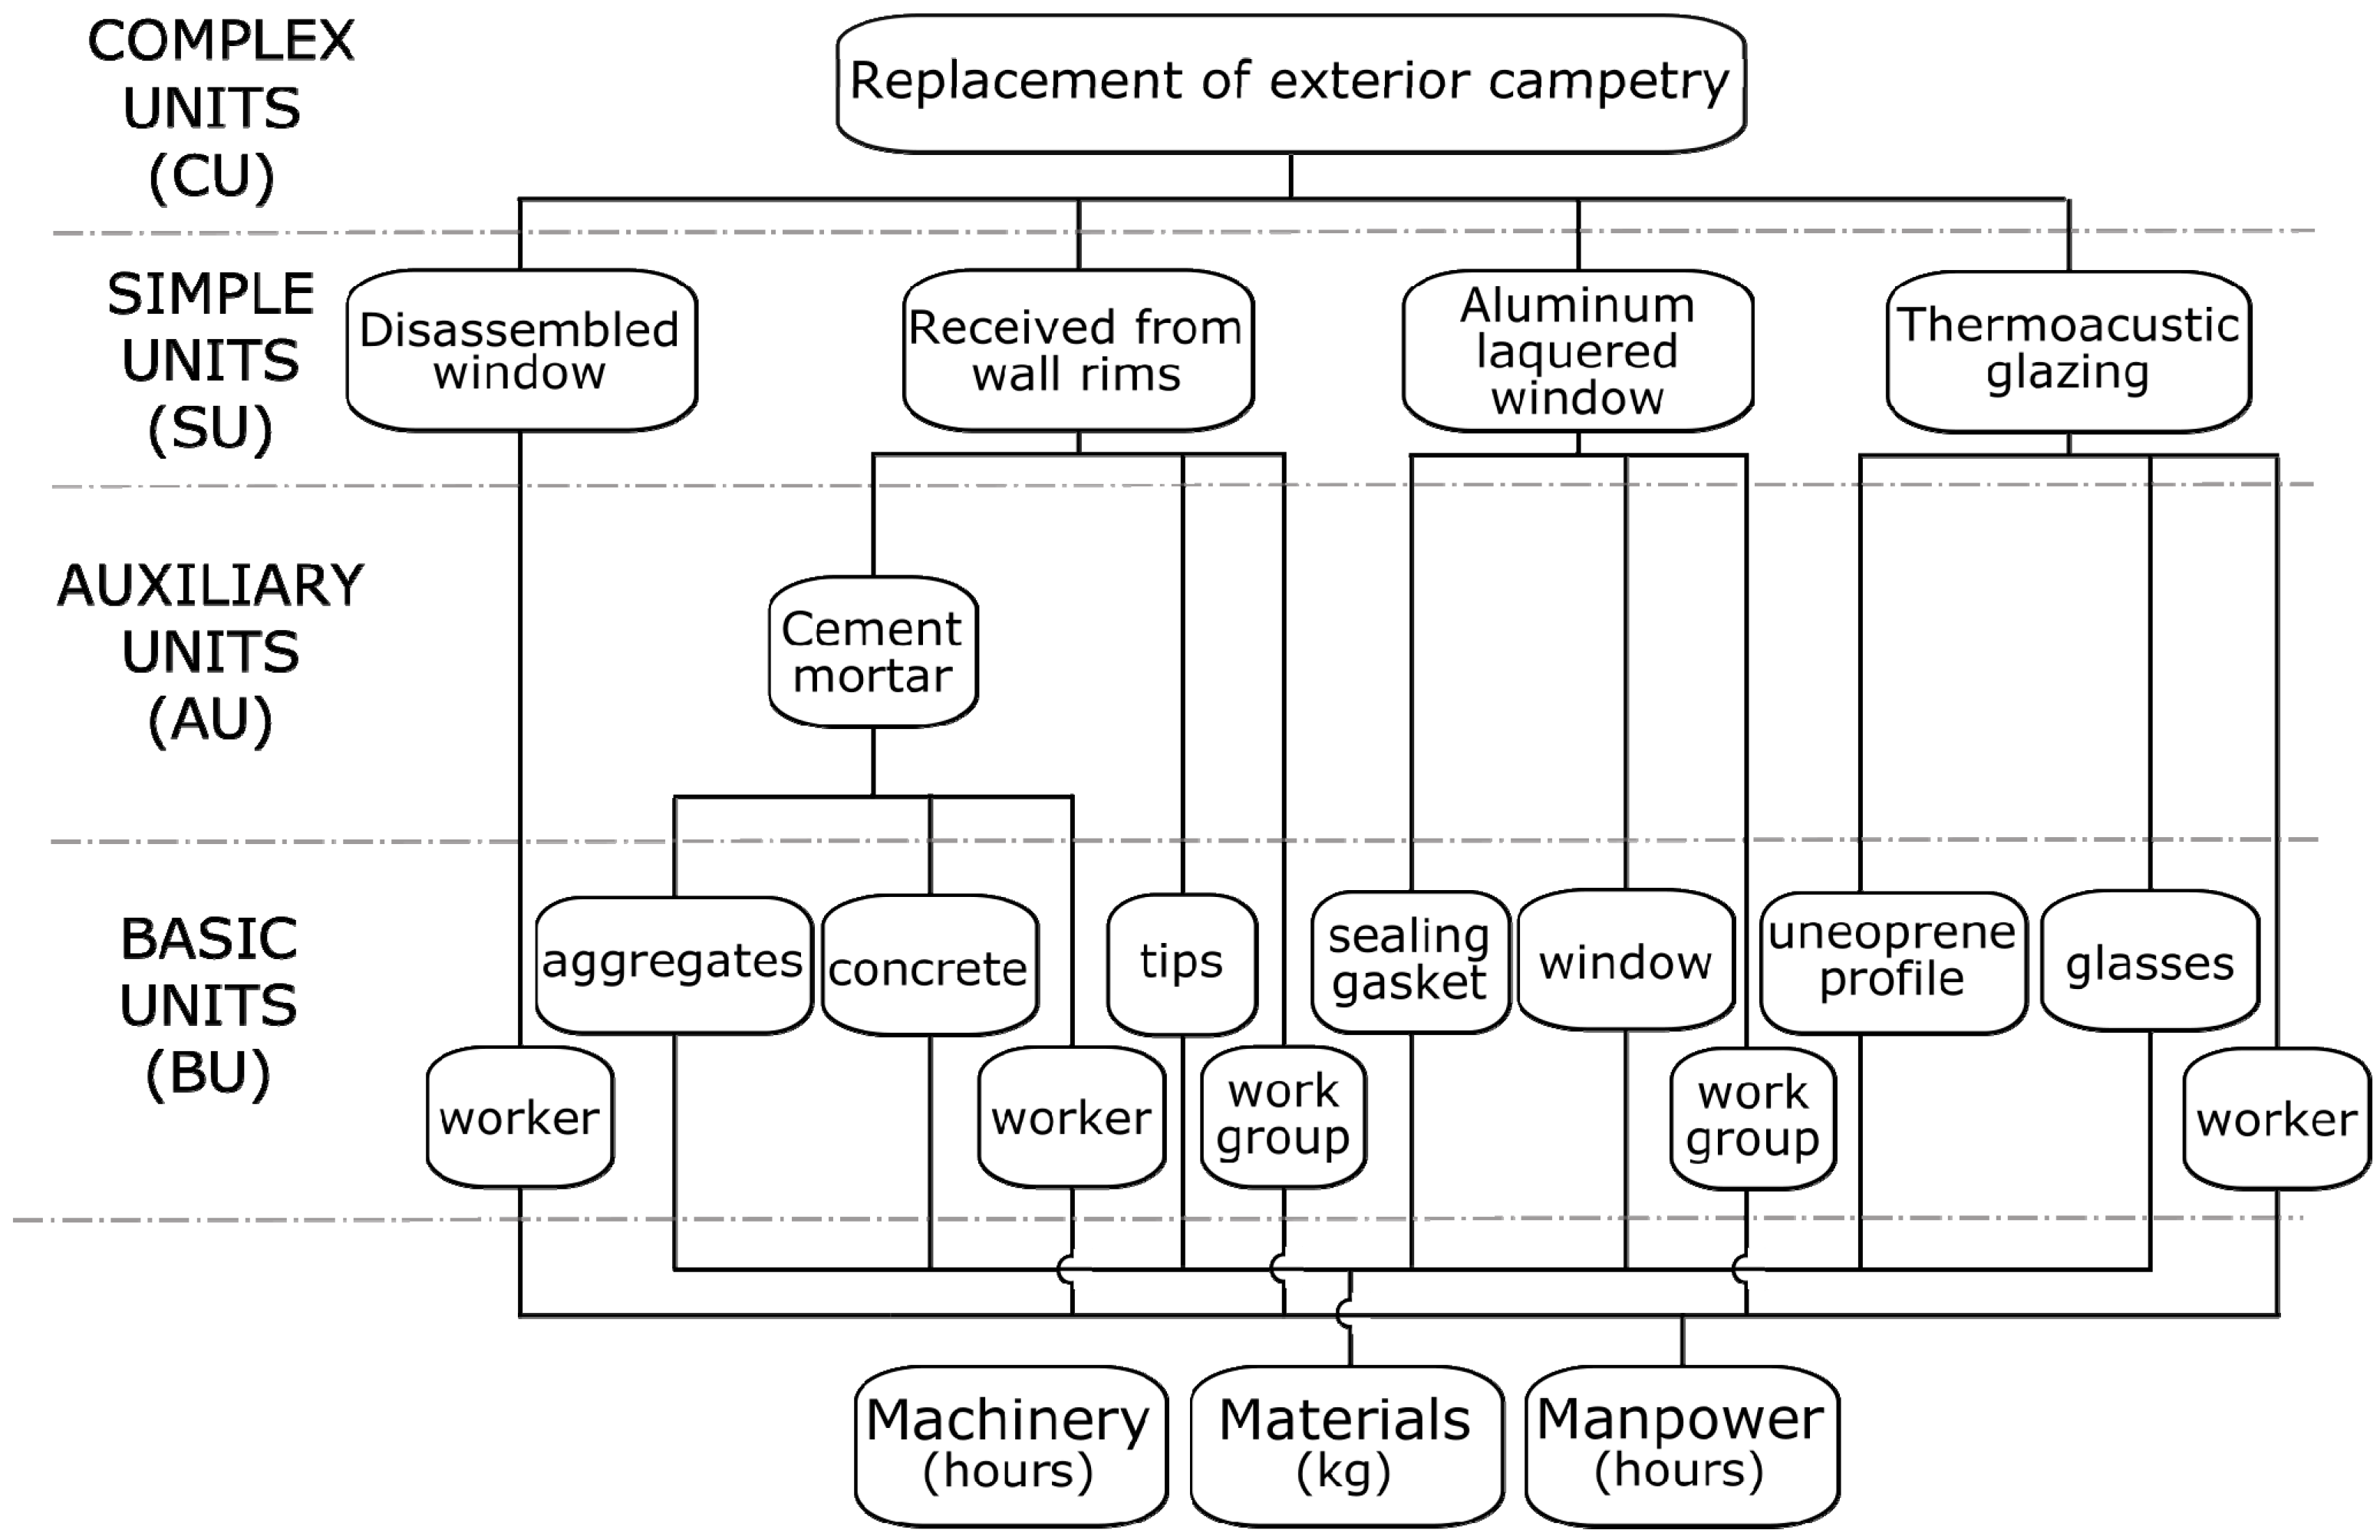
Table 6 shows the quantification of the basic resources (kgs of materials and working hours) contained in the complex units. The materials selected are the most representative in the renovation activities carried out. 
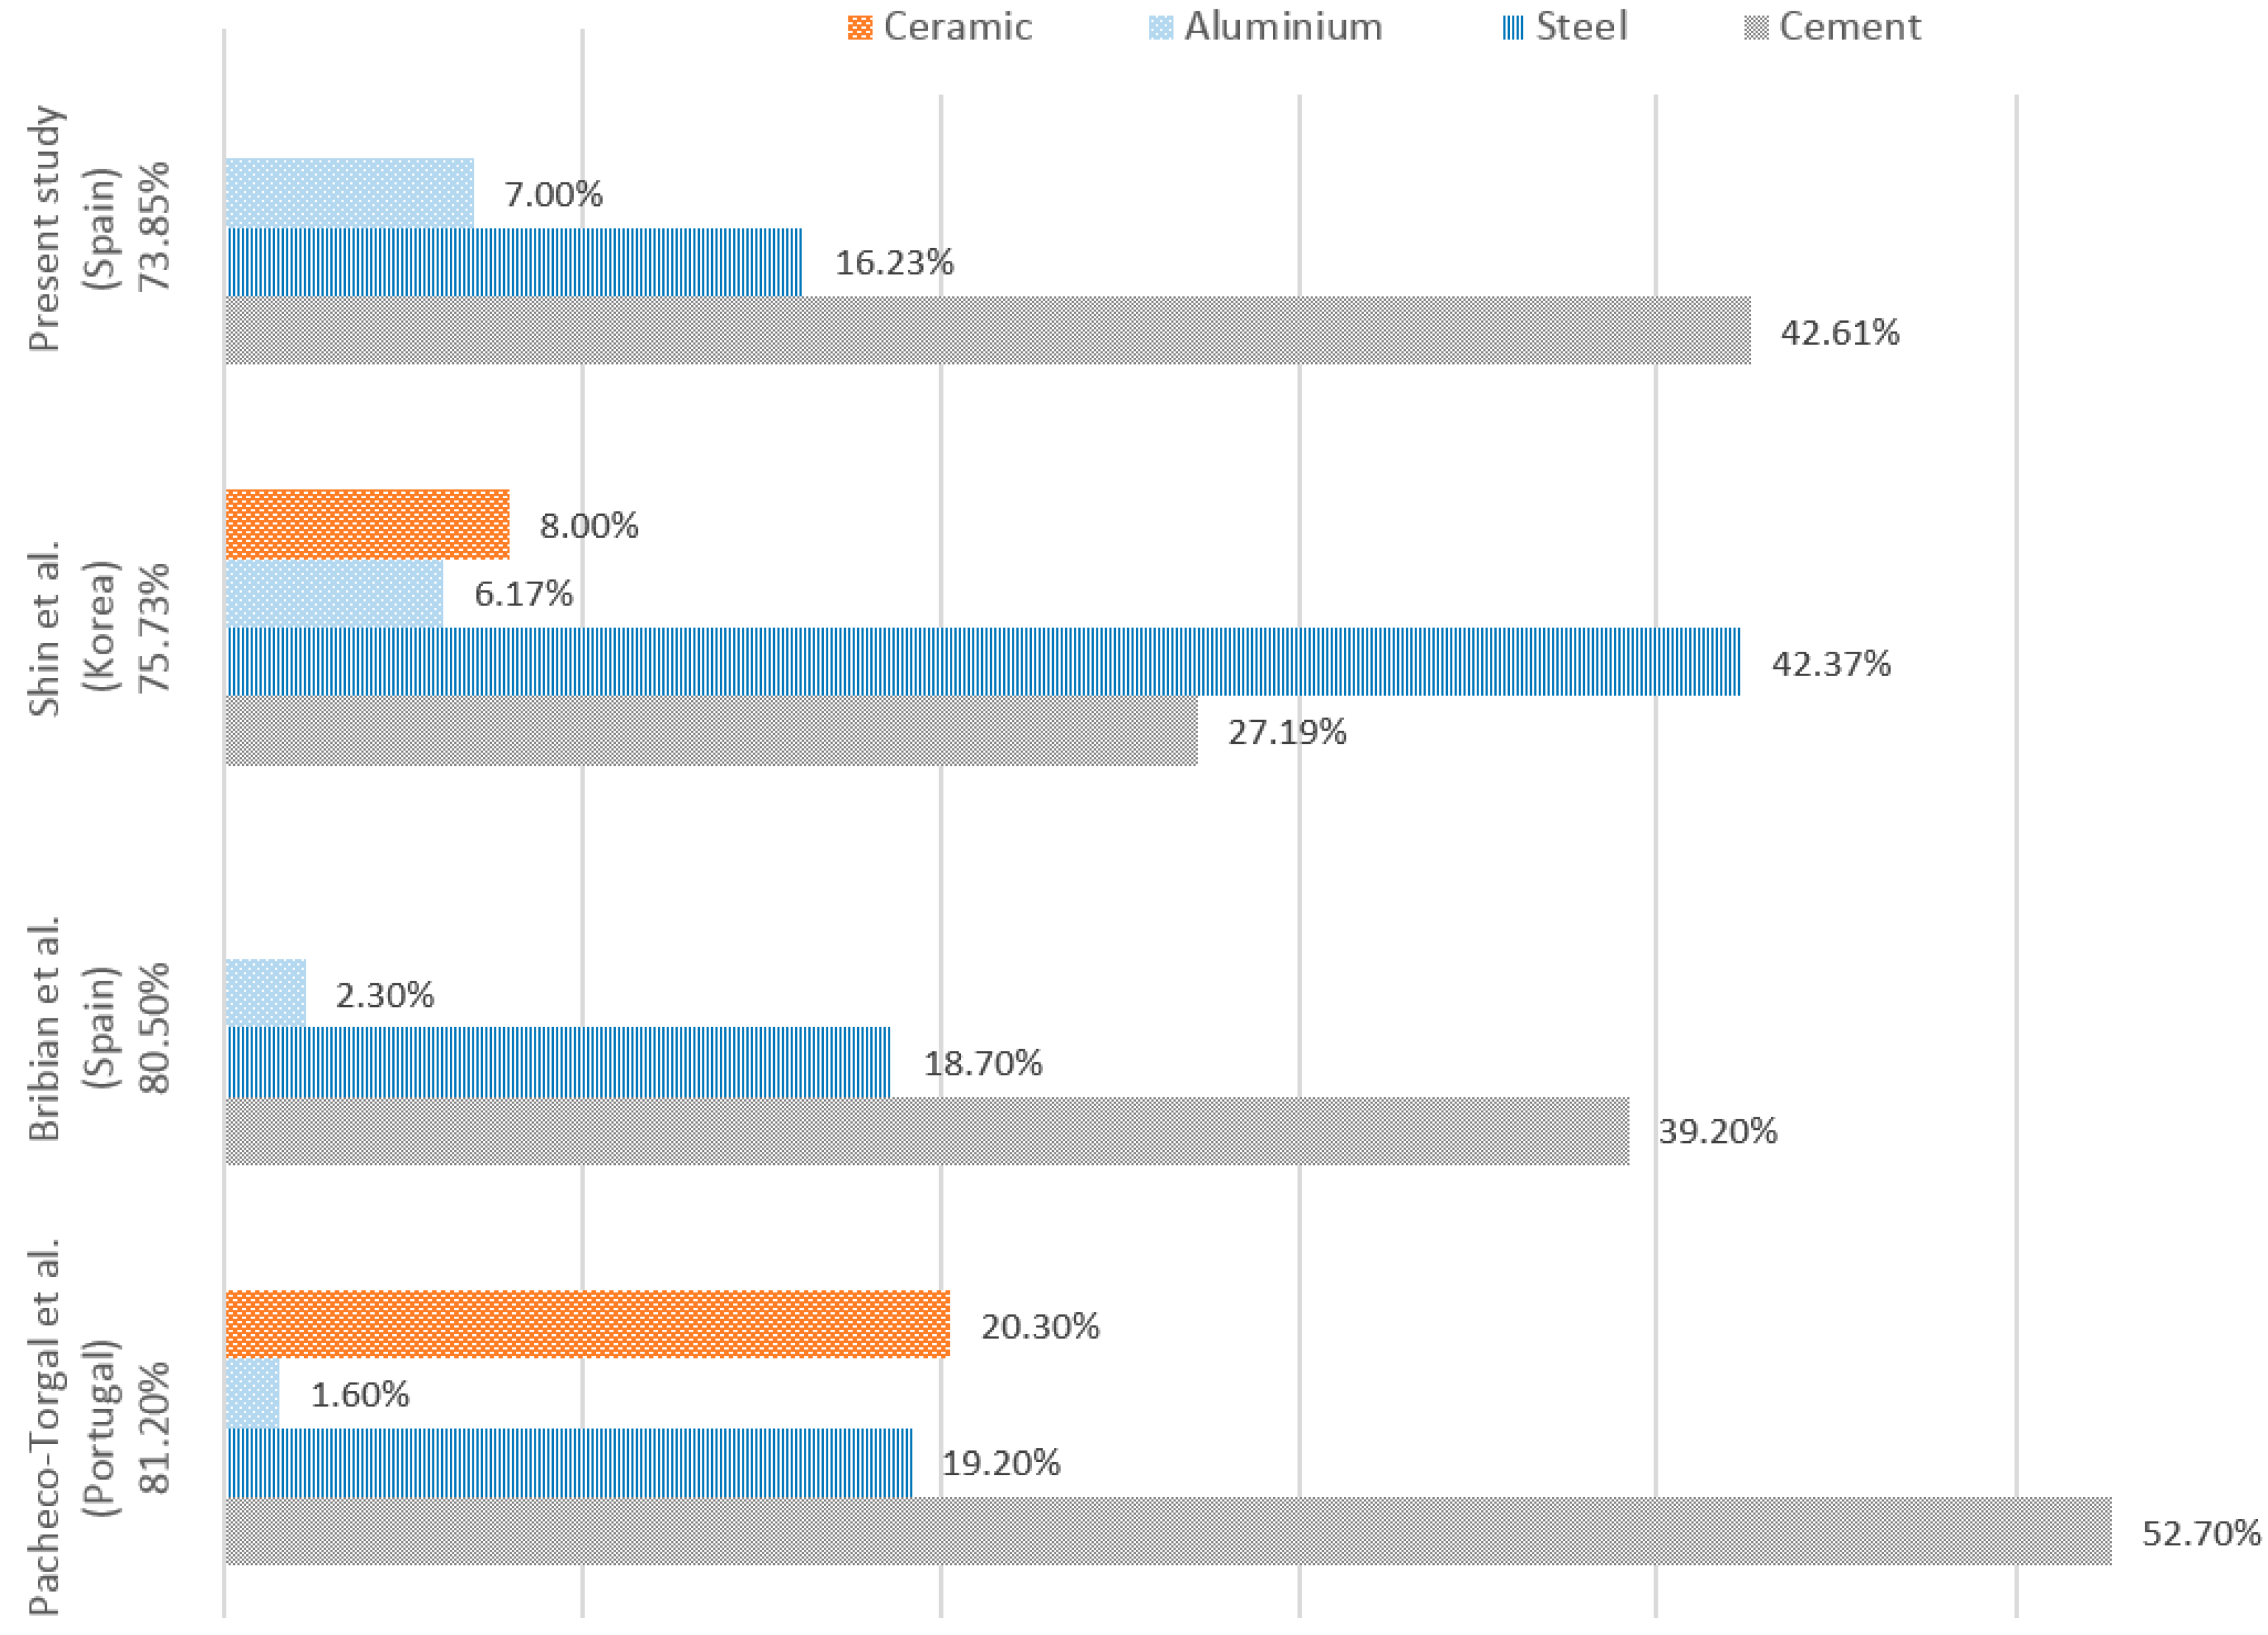
Figure 9 shows the relative contribution of the main building materials to the CO2 emissions per square meter of built area. Constructively, similar buildings, such as those in Spain [35] and Portugal [36], are compared with other constructions in Korea [37]. The high impact of commonly used materials, such as steel, cement, and ceramics, is worth noting. This verifies the coherence of the order of magnitude of the results obtained with the model.
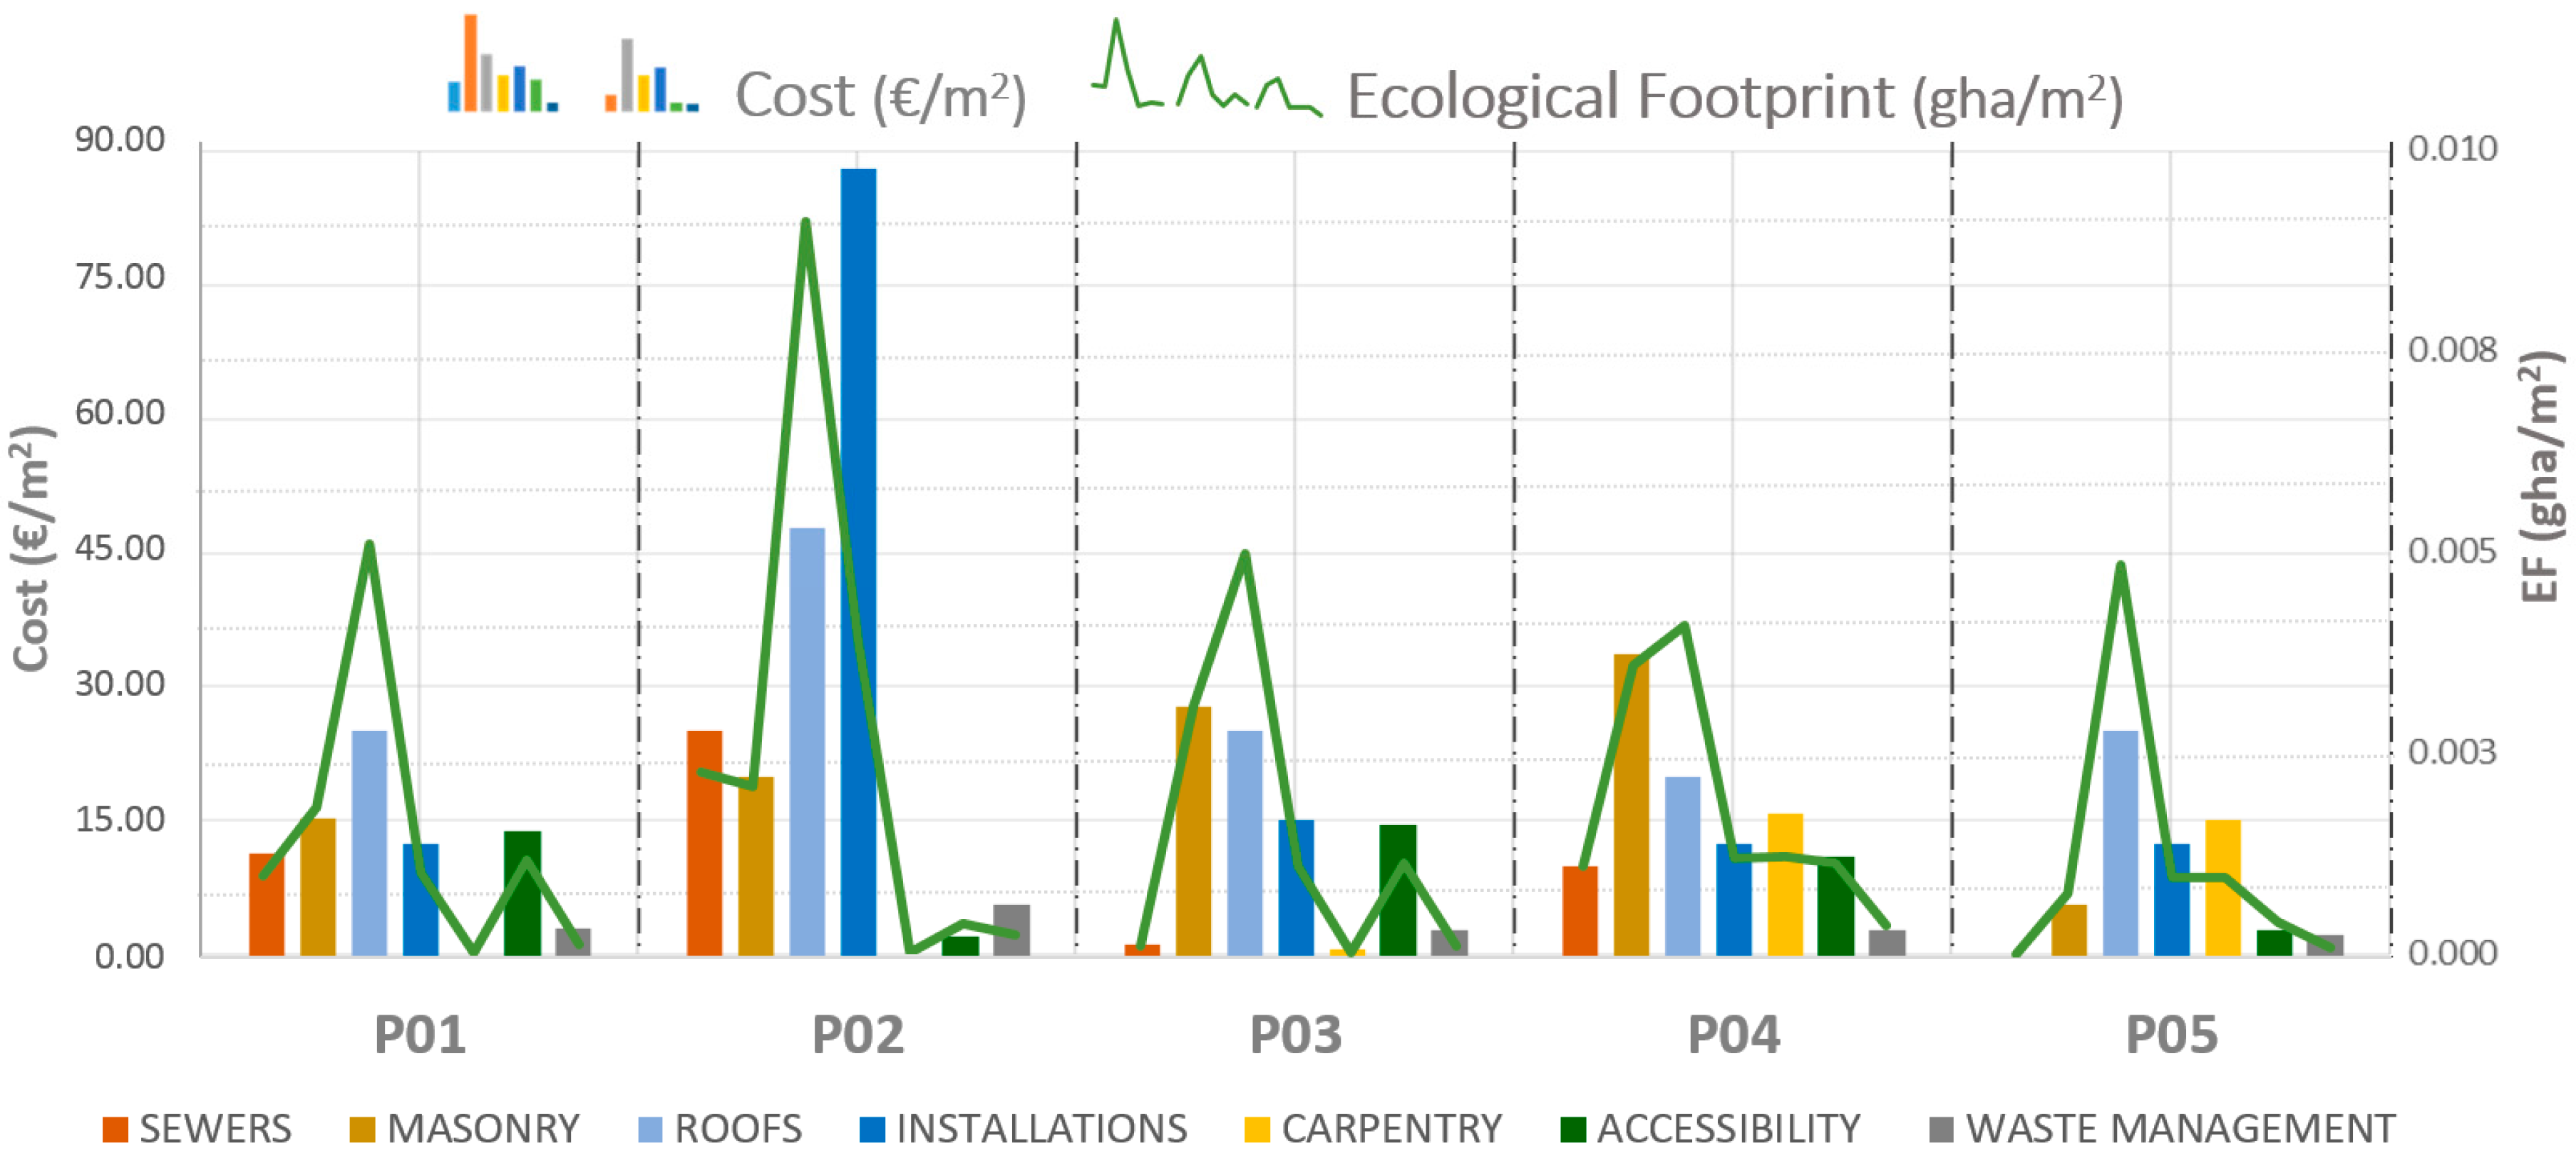
In Figure 10, the results of the five projects are compared economically and environmentally per chapter. In Project 5, the EF of the foundations chapter is highlighted; this is due to the high material consumption (cement slurry injected to improve the poor carrying capacity of the soil) during the underpinning process. However, comparatively, the economic impact is not of major importance in the same chapter.
Project 2 stands out since it presents the greatest economic impact in the installations chapter, also with a high environmental impact in this chapter. This is due to the replacement of obsolete elements. Nevertheless, the roof repair work in this project generates the highest environmental impact (Figure 10).
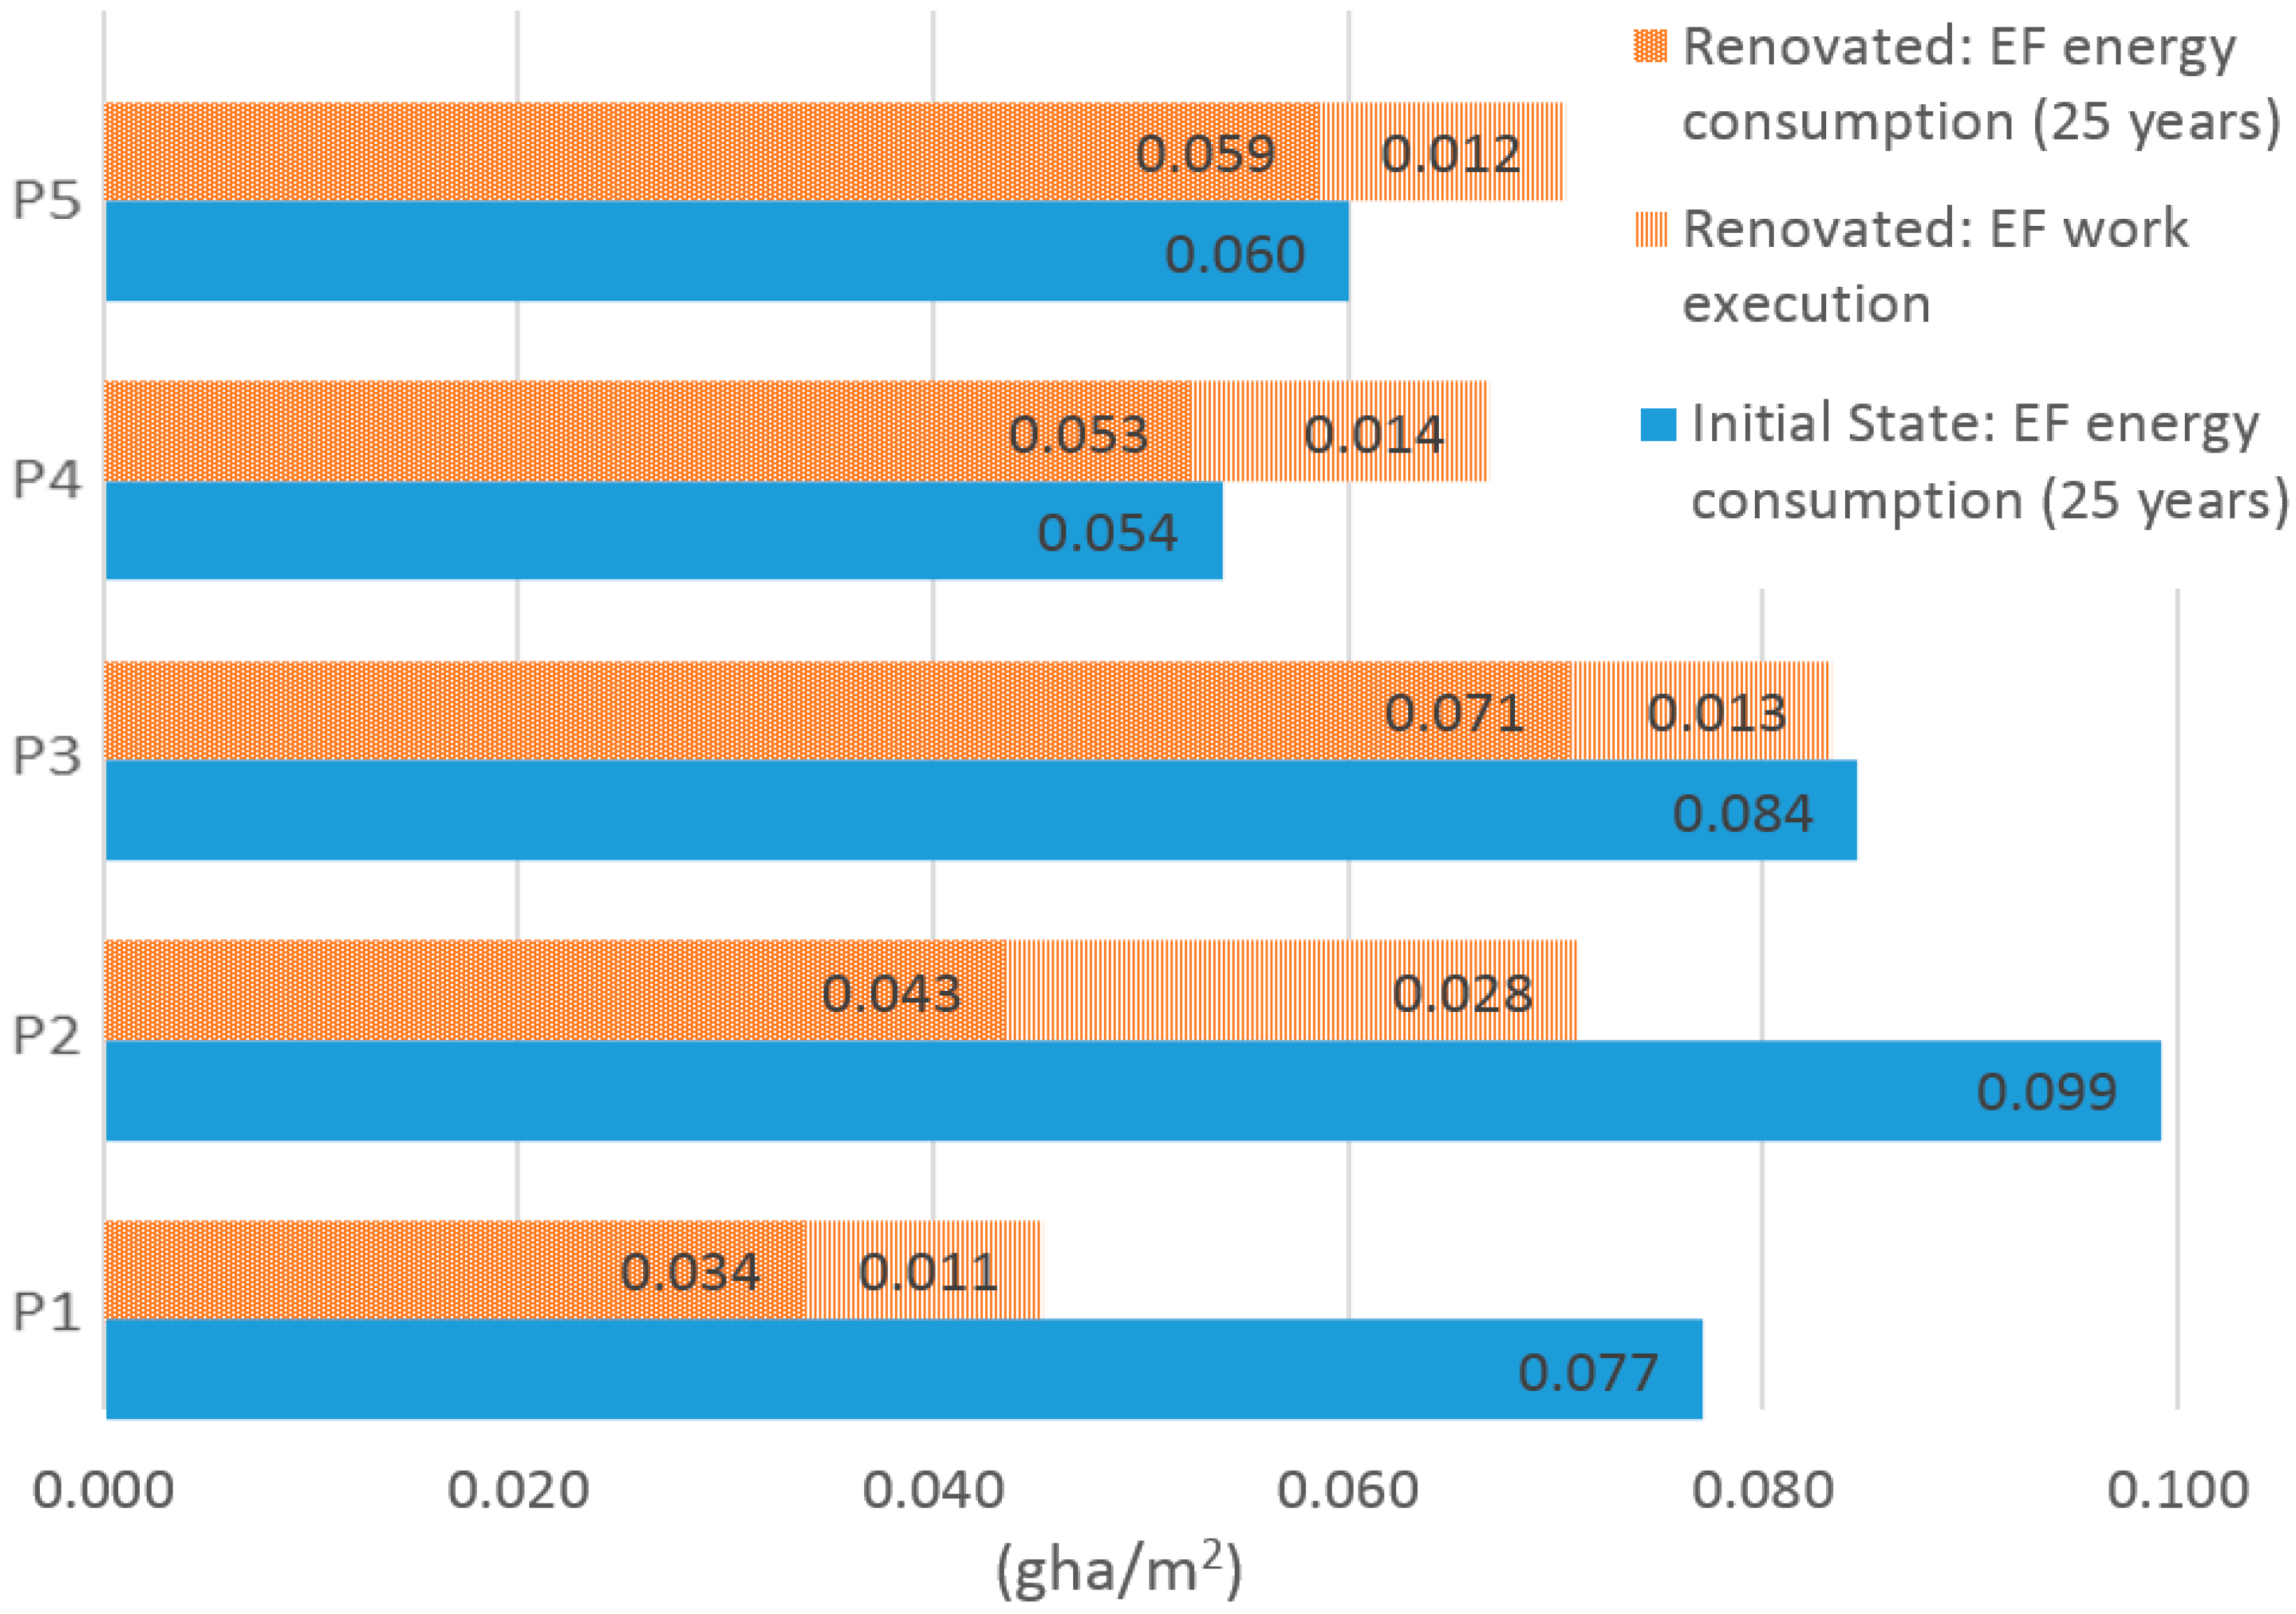
One last comparison, as shown in Figure 11, is given between the EF generated by energy consumption during the use phase of the building (for a period of 25 years) and the EF generated by the renovation work. For the energy simulation, the CE3 software has been employed [61]. CE3 is the free and official calculation software used in Spain for the energy certification of existing buildings. Its levels of accuracy and detail have been contrasted in tests which are publicly accessed. Similar to rest of the software available in Spain, CE3 evaluates the following aspects for dwellings: heating, air-conditioning, and domestic hot water. Other aspects of energy consumption are not assessed.
Upon analyzing the results in Figure 11, it can be observed that projects 1 and 2, where insulation has been incorporated into the roof, the total EF (use + renovation) is much smaller than the EF of energy consumption of the use phase in its initial state; the energy retrofitting appreciably reduces the EF of the use phase. However, in the other three projects, this measure has not been incorporated. In project 3 the balance between initial and renovated state is practically null from the point of view of EF energy. In projects 4 and 5, where the renovation does not suppose an appreciable decrease of the energy consumption, it is more profitable from the environmental point of view to maintain the initial state of the building.
Therefore, it can be concluded that the renovation will be environmentally profitable when a major energy retrofitting is carried out.

4. Conclusions

The HEREVEA model, through geographical information that correlates the economic and environmental variables, analyses the renovation intervention from a holistic perspective (technical, economic, and environmental analysis). The model takes into account the importance that these variables bear in the decision process by normalizing their values for the corresponding population, cost, and EF. The new model, a free and open-access computer tool in GIS, facilitates the assessment of buildings of priority action in the city and integrates, in an intuitive way, the environmental variable, which becomes a key in this decision-making process in terms of reducing environmental impact.
From the disaggregated economic and environmental comparison, it is clear which chapters are the most relevant—in the case of large-scale interventions where the building has load-bearing deficiencies and structural affection, the foundations and masonry chapter stand out due to the need to repair cracks and fissures. The environmental impact is mainly due to the embodied energy of the materials incorporated in the renovation process. In smaller interventions, the masonry and roof sections stand out in a more homogeneous manner, whereby their environmental impact is higher than their economic impact, while in the installations chapter the economic impact is greater than the environmental impact, due to the high cost of the systems and components. From these results it can be concluded that the model is sensitive to changes in construction solutions and the severity of pathologies or level of damage.
In future work, the EF can be combined with other indicators, such as the water footprint in the life cycle of buildings, by taking into account all the aspects that can be assessed in a simplified way from the perspective of the budget and systematic work breakdown classification. The long-term objective involves the creation of a differentiating and open economic and environmental indicator that enables all impacts throughout the life cycle of the building to be predicted during the design stage of buildings.

Author Contributions

M.R.R.-P. and M.M. conceived and designed the experiments. M.R.R.-P., M.M., M.D.A.-R., R.C.-R., and J.S.-G. performed the experiments and analyzed the data. M.R.R.-P., M.D.A.-R., J.S.-G., and M.M. wrote the paper.

Funding

This research was funded by Public Works Agency of the Junta de Andalucía grant number 2434/0604 and The APC was funded by Grants for Research Groups by the Junta de Andalucía.

Acknowledgments

The research is developed as part of the project Ecological footprint of the recovery of buildings: economic and environmental feasibility (HEREVEA), financed by the Public Works Agency of the Junta de Andalucía (Project Type: Contract 68/83, Ref: 2434/0604). The costs for its publication in open access have been funded by Grants for Research Groups by the Junta de Andalucía.

Conflicts of Interest

The authors declare no conflict of interest.

References

  1. Semprini, G.; Gulli, R.; Ferrante, A. Deep regeneration vs shallow renovation to achieve nearly Zero Energy in existing buildings: Energy saving and economic impact of design solutions in the housing stock of Bologna. Energy Build. 2017, 156, 327–342. [Google Scholar] [CrossRef]
  2. Xing, Y.; Hewitt, N.; Griffiths, P. Zero carbon buildings refurbishment—A Hierarchical pathway. Renew. Sustain. Energy Rev. 2011, 15, 3229–3236. [Google Scholar] [CrossRef]
  3. European Commission. Horizon 2020 Work Programme 2014–2015 10. Secure, Clean and Efficient Energy; European Commission: Brussels, Belgium, 2015.
  4. Tejedor, J. Nuevo paradigma normativo sobre la ciudad: Retornando a la ciudad tradicional; A new legal framework for the city: Returning to the traditional city. Inf. Constr. 2015, 67, m022. [Google Scholar] [CrossRef]
  5. Rubio de Val, J.; de Val, J.R. Potencial del nuevo marco normativo para el impulso de la rehabilitación y la regeneración urbana en los ámbitos autonómico y local. Inf. Constr. 2015, 67, m023. [Google Scholar]
  6. Vilches, A.; García-Martínez, A.; Sánchez-Montañes, B. Life cycle assessment (LCA) of building refurbishment: A literature review. Energy Build. 2017, 135, 286–301. [Google Scholar] [CrossRef]
  7. Marrero, M.; Fonseca, A.; Falcon, R.; Ramirez-De-Arellano, A. Schedule and Cost Control in Dwelling Construction using Control Charts. Open Constr. Build. Technol. J. 2014, 8, 1–17. [Google Scholar] [CrossRef]
  8. Almeida, C.P.; Ramos, A.F.; Silva, J.M. Sustainability assessment of building rehabilitation actions in old urban centres. Sustain. Cities Soc. 2018, 36, 378–385. [Google Scholar] [CrossRef]
  9. Erlandsson, M.; Levin, P. Environmental assessment of rebuilding and possible performance improvements effect on a national scale. Build. Environ. 2005, 40, 1459–1471. [Google Scholar] [CrossRef]
  10. Gaspar, P.L.; Santos Lobato, A. Embodied energy on refurbishment vs. demolition: A southern Europe case study. Energy Build. 2015, 87, 386–394. [Google Scholar] [CrossRef]
  11. Thomsen, A.; van der Flier, K. Replacement or renovation of dwellings: The relevance of a more sustainable approach. Build. Res. Inf. 2009, 37, 649–659. [Google Scholar] [CrossRef]
  12. Cetiner, I.; Edis, E. An environmental and economic sustainability assessment method for the retrofitting of residential buildings. Energy Build. 2014, 74, 132–140. [Google Scholar] [CrossRef]
  13. Zavadskas, E.; Raslanas, S.; Kaklauskas, A. The selection of effective retrofit scenarios for panel houses in urban neighborhoods based on expected energy savings and increase in market value: The Vilnius case. Energy Build. 2008, 40, 573–587. [Google Scholar] [CrossRef]
  14. Morelli, M.; Harrestrup, M.; Svendsen, S. Method for a component-based economic optimisation in design of whole building renovation versus demolishing and rebuilding. Energy Policy 2014, 65, 305–314. [Google Scholar] [CrossRef]
  15. Liu, Y.; Liu, T.; Ye, S.; Liu, Y. Cost-benefit analysis for Energy Efficiency Retrofit of existing buildings: A case study in China. J. Clean. Prod. 2018, 177, 493–506. [Google Scholar] [CrossRef]
  16. Toleikyte, A.; Kranzl, L.; Müller, A. Cost curves of energy efficiency investments in buildings—Methodologies and a case study of Lithuania. Energy Policy 2018, 115, 148–157. [Google Scholar] [CrossRef]
  17. Mesthrige, J.W.; Wong, J.K.W.; Yuk, L.N. Conversion or redevelopment? Effects of revitalization of old industrial buildings on property values. Habitat Int. 2018, 73, 53–64. [Google Scholar] [CrossRef]
  18. McCall, M.K. Seeking good governance in participatory-GIS: A review of processes and governance dimensions in applying GIS to participatory spatial planning. Habitat Int. 2003, 27, 549–573. [Google Scholar] [CrossRef]
  19. Gigović, L.; Pamučar, D.; Lukić, D.; Marković, S. GIS-Fuzzy DEMATEL MCDA model for the evaluation of the sites for ecotourism development: A case study of “Dunavski ključ” region, Serbia. Land Use Policy 2016, 58, 348–365. [Google Scholar] [CrossRef]
  20. Jeong, J.S.; García-Moruno, L.; Hernández-Blanco, J.; Sánchez-Ríos, A. Planning of rural housings in reservoir areas under (mass) tourism based on a fuzzy DEMATEL-GIS/MCDA hybrid and participatory method for Alange, Spain. Habitat Int. 2016, 57, 143–153. [Google Scholar] [CrossRef]
  21. Olowu, D. Challenge of multi-level governance in developing countries and possible GIS applications. Habitat Int. 2003, 27, 501–522. [Google Scholar] [CrossRef]
  22. Wackernagel, M.; Rees, W. Our Ecological Footprint: Reducing Human Impact on the Earth; New Society: Gabriola Island, BC, Canada, 1996. [Google Scholar]
  23. Samad, P.P.; Faryadi, S.H. Determination of ecological footprints of dense and high-rise districts, case study of Elahie Neighborhood, Tehran. J. Environ. Stud. 2008, 34, 63–72. [Google Scholar]
  24. Olgyay, V. Greenfoot: A tool for estimating the carbon and ecological footprint of buildings. Renew. Energy Policy 2008, 8, 5058–5062. [Google Scholar]
  25. Li, B.; Cheng, D.-J. Hotel ecological footprint model: Its construction and application. Chin. J. Ecol. 2010, 7, 31. [Google Scholar]
  26. Bin, G.; Parker, P. Measuring buildings for sustainability: Comparing the initial and retrofit ecological footprint of a century home–The REEP House. Appl. Energy 2012, 93, 24–32. [Google Scholar] [CrossRef]
  27. Zhao, X.Y.; Mao, X.W. Comparison environmental impact of the peasant household in han, zang and hui nationality region: Case of Zhangye, Gannan and Linxia in Gansu Province. Acta Ecol. Sin. 2013, 33, 5397–5406. [Google Scholar] [CrossRef]
  28. Solís-Guzmán, J.; Marrero, M.; Ramírez-de-Arellano, A. Methodology for determining the ecological footprint of the construction of residential buildings in Andalusia (Spain). Ecol. Indic. 2013, 25, 239–249. [Google Scholar] [CrossRef]
  29. Marrero, M.; Puerto, M.; Rivero-Camacho, C.; Freire-Guerrero, A.; Solís-Guzmán, J. Assessing the economic impact and ecological footprint of construction and demolition waste during the urbanization of rural land. Resour. Conserv. Recycl. 2017, 117, 160–174. [Google Scholar] [CrossRef]
  30. Martínez-Rocamora, A.; Solís-Guzmán, J.; Marrero, M. Toward the Ecological Footprint of the use and maintenance phase of buildings: Utility consumption and cleaning tasks. Ecol. Indic. 2016, 69, 66–77. [Google Scholar] [CrossRef]
  31. Martínez-Rocamora, A.; Solís-Guzmán, J.; Marrero, M. Ecological footprint of the use and maintenance phase of buildings: Maintenance tasks and final results. Energy Build. 2017, 155, 339–351. [Google Scholar] [CrossRef]
  32. Alba-Rodríguez, M.D.; Martínez-Rocamora, A.; González-Vallejo, P.; Ferreira-Sánchez, A.; Marrero, M. Building rehabilitation versus demolition and new construction: Economic and environmental assessment. Environ. Impact Assess. Rev. 2017, 66, 115–126. [Google Scholar] [CrossRef]
  33. Marrero, M. Huella Ecológica de la Recuperación de Edificios: Viabilidad Económica y Ambiental (Ecological Footprint of the Recovery of Buildings: Economic and Environmental Viability); Final report; University of Seville: Seville, Spain, 2016. [Google Scholar]
  34. Andalusia Government Andalusia Construction Cost Database (ACCD). Available online: https://www.juntadeandalucia.es/organismos/fomentoyvivienda/areas/vivienda-rehabilitacion/planes-instrumentos/paginas/bcca-sept-2017.html (accessed on 11 January 2019).
  35. Bribián, I.; Capilla, A.; Usón, A. Life cycle assessment of building materials: Comparative analysis of energy and environmental impacts and evaluation of the eco-efficiency improvement. Build. Environ. 2011, 43, 1133–1140. [Google Scholar] [CrossRef]
  36. Pacheco-Torgal, F.; Faria, J.; Jalali, S. Embodied energy versus operational energy. Showing the shortcomings of the energy performance building directive (EPBD). Mater. Sci. Forum 2013, 730–732, 537–591. [Google Scholar] [CrossRef]
  37. Shin, S.; Tae, S.; Woo, J.; Roh, S. The development of environmental load evaluation system of a standard Korean apartment house. Sustain. Renew. 2011, 15, 1239–1249. [Google Scholar] [CrossRef]
  38. UNE-EN 15978. Sustainability of Construction Works. Assessment of Environmental Performance of Buildings. Calculation Method; AENOR: Madrid, Spain, 2012. [Google Scholar]
  39. REE. El Sistema Eléctrico Español/The Spanish Electric System; Red Eléctrica de España: Madrid, Spain, 2014. [Google Scholar]
  40. Borucke, M.; Moore, D.; Cranston, G.; Gracey, K.; Iha, K.; Larson, J.; Lazarus, E.; Morales, J.C.; Wackernagel, M.; Galli, A. Accounting for demand and supply of the biosphere’s regenerative capacity: The National Footprint Accounts’ underlying methodology and framework. Ecol. Indic. 2013, 24, 518–533. [Google Scholar] [CrossRef]
  41. GFN. Learning Package of National Footprint Accounts 2014 Edition; Global Footprint Network: Oakland, CA, USA, 2014. [Google Scholar]
  42. EMASESA. Sostenibilidad y Gestión. Así Éramos, Así Somos. 1975–2005/Sustainability and Management. How We Were, How We Are. 1975–2005; EMASESA: Seville, Spain, 2005. [Google Scholar]
  43. EUROSTAT. Municipal Waste Generated by Country in Selected Years (kg Per Capita). Available online: http://ec.europa.eu/eurostat/statistics-explained/index.php/File:Municipal_waste_generated_by_country_in_selected_years_%28kg_per_capita%29_new.png (accessed on 1 January 2016).
  44. Almasi, A.M.; Milios, L. Municipal Waste Management in Spain; Technical Report; European Environment Agency: Copenhagen, Denmark, 2013. [Google Scholar]
  45. Grunewald, N.; Galli, A.; Katsunori, I.; Halle, M.; Gressot, M. The Ecological Footprint of Mediterranean Diets; International Center for Advanced Mediterranean Agronomic Studies: Paris, France, 2015. [Google Scholar]
  46. WWF. International Living Planet Report 2014; Global Footprint Network, ZSL (Zoological Society of London): Gland, Switzerland, 2014. [Google Scholar]
  47. Martínez-Rocamora, A.; Solís-Guzmán, J.; Marrero, M. LCA databases focused on construction materials: A review. Renew. Sustain. Energy Rev. 2016, 58, 565–573. [Google Scholar] [CrossRef]
  48. IPCC. Guidelines for National Greenhouse Gas Inventories. Technical Report. 2006, Volume 4. Available online: https://www.ipcc-nggip.iges.or.jp/public/2006gl/pdf/0_Overview/V0_1_Overview.pdf (accessed on 19 May 2019).
  49. Spain MP. Real Decreto 105/2008, de 1 de Febrero, por el que se Regula la Producción y Gestión de los Residuos de Construcción y Demolición (National Decree 105/2008, February 1, which Regulates the Production and Management of Construction and Demolition Waste); Ministry of Presidency: Madrid, Spain, 2008.
  50. Construction Specifications Institute. Masterformat Manual of Practice (MP2-1); CSI/CSC: Alexandria, VA, USA, 1983. [Google Scholar]
  51. Construction Specifications Institute. UniFormatTM. A Uniform Classification of Construction Systems and Assemblies; Construction Specifications Institute: Alexandria, VA, USA, 1998. [Google Scholar]
  52. Telford, T. Civil Engineering Standard Method of Measurement, 3rd ed.; Institution of Civil Engineers of Great Britain: London, UK, 1991; pp. 4–39. [Google Scholar]
  53. Jones, A.R. CI/SfB Construction Indexing Manual; RIBA: London, UK, 1987. [Google Scholar]
  54. Omniclass. A Strategy for Classifying the Built Environmen—Table 13: Spaces by Function; Construction Specifications Institute: Alexandria, VA, USA, 2012. [Google Scholar]
  55. Ramírez-de-Arellano-Agudo, A. Presupuestación de obras (Work budgeting); Universidad de Sevilla: Seville, Spain, 2010. [Google Scholar]
  56. Alba-Rodríguez, D. Modelo de Evaluación de la Viabilidad Económica y Ambiental de la Recuperación de Edificios: Aplicación en Edificios Residenciales de la Ciudad de Sevilla (Evaluation Model of the Economic and Environmental Feasibility of Buildings Rehabilitation); University of Seville: Seville, Spain, 2016. [Google Scholar]
  57. Alba-Rodríguez, M.D.; Marrero, M.; Solís-Guzmán, J. Economic and environmental viability of building recovery in Seville (Spain). Phase 1: Database in Arcgis. Środowisko Mieszk. 2013, 11, 297–302. [Google Scholar]
  58. González-Vallejo, P.; Solís-Guzmán, J.; Llácer, R.; Marrero, M. La construcción de edificios residenciales en España en el período 2007–2010 y su impacto según el indicador Huella Ecológica. Inf. Constr. 2015, 67, e111. [Google Scholar] [CrossRef]
  59. Salas, N. Historia del Real Patronato de las casas baratas de Sevilla (History of the Royal Board of the Cheap Houses of Seville); AVEC Editorial: Seville, Spain, 2013. [Google Scholar]
  60. Institut Wohnen und Umwelt GmbH TABULA WebTool. Available online: http://webtool.building-typology.eu/#bm (accessed on 1 May 2019).
  61. CE3 Ministerio de Energía, Turismo y Agenda Digital. Certificación Eficiencia Energética de Edificios (Energy Efficiency Certification of Buildings); Ministerio de Energía: Madrid, Spain, 2012.
Figure 1. Ecological Footprint methodology applied to renovation projects.
Sustainability 11 02852 g001
Figure 2. Diagram of a complex unit (CU).
Sustainability 11 02852 g002
Figure 3. HEREVEA model. Example of project characteristics.
Sustainability 11 02852 g003
Figure 4. Representation of dwellings: dark green (more than 100 years old), light green (50–75 years), medium green (75–100 years) [57].
Sustainability 11 02852 g004
Figure 5. The pathologies and level of damage in the 50 cases analyzed.
Sustainability 11 02852 g005
Figure 6. Dwelling pathologies.
Sustainability 11 02852 g006
Figure 7. Summary of the pathologies in the five cases by level of damage. HEREVEA model.
Sustainability 11 02852 g007
Figure 8. Geographical representation of a sample of the dwellings analyzed.
Sustainability 11 02852 g008
Figure 9. Comparison of the contribution of CO2 emissions associated with the manufacture of construction materials.
Sustainability 11 02852 g009
Figure 10. Environmental and economic comparison.
Sustainability 11 02852 g010
Figure 11. Environmental impact comparison between renovated and initial state of the projects.
Sustainability 11 02852 g011
Table 1. Ecological Footprint calculation equations [32].
EquationNo.
Electricity
EFel: Partial Ecological Footprint of electricity consumption (gha/yr)
EFel = Cel × Eel × (1 − Aoc)/Af × EQFca(1)
Cel: Electricity consumption per year (kWh/yr)
Eel: Emission factor of electricity (0.000248 tCO2/kWh) [39]
Aoc: Reduction in emissions due to the CO2 absorption in oceans (0.28) [40,41]
Af: Absorption factor of forests (3.59 tCO2/ha) [41]
EQFca: Equivalence factor of carbon absorption land (1.26 gha/ha) [41]
Water consumption
EFwa: Partial Ecological Footprint of water consumption (gha/yr)
EFwa = Cwa × EIwa × Eel × (1 − Aoc)/Af × EQFca(2)
Cwa: Water consumption per year (m3/yr)
EIwa: Energy intensity of drinking water (0.44 kWh/m3) [42]
Built-up land
EFbl: Partial Ecological Footprint of built-up land (gha/yr)
EFbl = S × EQFbl(3)
S: Total surface occupied by the building or parcel (ha)
EQFbl: Equivalence factor of infrastructure land (2.51 gha/ha) [41]
Manpower
EFfoi: Partial Ecological Footprint of food consumption in EF category i (gha/yr)
EFfoi = (Hw/Hd) × 0.61 × (EFi/365)(4)
Hw: Total number of hours worked per year (h/year)
Hd: Number of hours worked per day (8 h/day)
0.61: Breakfast and lunch as a percentage of the total daily food intake of a Spanish adult (61%)
EFi: Footprint of food consumption in EF category i (gha/person)
365: Days in a year
EFMSW: Partial Ecological Footprint of MSW management (gha/yr)
EFMSW = Hw × Gw × EMSW × (1 − Aoc)/Af × EQFca(5)
Hw: Total number of hours worked per year (h/yr)
Gw: Hourly waste generation (0.000077 t/h) [43]
EMSW: Emission factor of MSW (0.244 tCO2/t) [44]
Construction materials
EFma: Partial Ecological Footprint of consumption of materials (gha/yr)
EFma = ∑(Cmai × Emai) × (1 − Aoc)/Af × EQFca(6)
Cmai: Consumption of material i per year (kg/yr)
Emai: Emission factor of material i (tCO2/kg)
EFwo: Partial Ecological Footprint of wooden materials (gha/yr)
EFwo = ∑(Cwoi/Ywoi) × EQFfo(7)
Cwoi: Consumption of wooden material i per year (t or m3/yr)
Ywoi: Yield of wooden material i (t or m3/ha)
EQFfo: Equivalence factor of forest land (1.26 gha/ha) [41]
EFtr: Partial Ecological Footprint of the transport of materials (gha/yr)
EFtr = ∑(Wmai × Dma / Tcap) × Tcon × Ef × (1 − Aoc)/Af × EQFca(8)
Wmai: Weight of the consumption of material i (t/yr)
Tcap: Truck capacity (t)
Dma: Average distance (km)
Tcon: Truck consumption (L/100 km)
Ef: Emission factor of fuel (tCO2/L)
Machinery
EFmc: Partial Ecological Footprint of machinery (gha/yr)
EFmc = ∑(Hmci × Cfi × Efi) × (1 − Aoc)/Af × EQFca(9)
Hmci: Hours of use of machinery i (h/yr)
Cfi: Consumption factor of machinery i (L/h or kW)
Efi: Emission factor of fuel used by machinery i (tCO2/L or tCO2/kWh)
Table 2. Equivalence factors [46].
Productive Land CategoryEquivalence Factor (gha/ha)
Cropland2.51
Pastures0.46
Forest1.26
Productive sea0.37
Built land2.51
Table 3. Equations on the normalization of variables, Ren stands for renovation and Cons for construction.
EquationNo.
R_costi: cost of the renovation work of project i with respect to a new construction
R_costi = (Ren_costi)/Cons_costi)(10)
Ren_costi: renovation cost per floor area (€/m2)
Cons_costi = new construction cost per floor area (€/m2)
R_EFi: EF of the renovation work of project i with respect to a new construction
R_EFi = (Ren_EFi)/Cons_EFi)(11)
Ren_EFi: EF in global hectares (gha/m2) of the renovation work
Cons_EFi = new construction EF per floor area (gha/m2)
Z_costi: statistical value
Z_costi = (R_costi −Ṝ_costi)/σcost(12)
_costi: mean of R_costi
σcost: standard deviation of R_costi
Z_EFi: statistical value
Z_EFi = (R_EFiṜ_EFi)/σ EF(13)
_EFi: mean of R_EFi
σ EF: standard deviation of R_EFi
N_costi
N_costi = R_costicost(14)
N_EFi
N_EFi = R_EFiEF(15)
Table 4. General characteristics of the 50 projects analyzed.
ProjectPostal CodeDate of ConstructionFloor Area (m2)Number of FloorsNumber of DwellingsType of FoundationType of StructureType of RooftopGround Floor Use
P01410021932290441Piling FoundationReinforced ConcreteFlatCommercial
P0241002194054428Piling FoundationReinforced ConcreteFlatDwelling
P0341002194295346Separate FootingsReinforced ConcreteFlatCommercial
P044100219591860512Separate FootingsReinforced ConcreteFlatCommercial
P054100219591071512Separate FootingsReinforced ConcreteFlatCommercial
P064100219701277412Piling FoundationReinforced ConcreteFlatCommercial
P074100219301943416Piling FoundationReinforced ConcreteFlatCommercial
P08410021920528316Piling FoundationReinforced ConcreteFlatDwelling
P0941002194038841Separate FootingsReinforced ConcreteFlatDwelling
P1041002194041041Separate FootingsReinforced ConcreteFlatDwelling
P1141002195068651Strip FootingsLoad bearing wallSlopingCommercial
P1241002195052541Strip FootingsLoad bearing wallSlopingDwelling
P1341002194049041Strip FootingsLoad bearing wallSlopingCommercial
P14410021940842416Separate FootingsReinforced ConcreteFlatDwelling
P154100219251079416Separate FootingsReinforced ConcreteFlatCommercial
P164100219001088511Separate FootingsReinforced ConcreteFlatCommercial
P1741002192044136Piling FoundationReinforced ConcreteFlatDwelling
P1841002195064041Separate FootingsReinforced ConcreteFlatDwelling
P1941002192048236Separate FootingsReinforced ConcreteFlatDwelling
P2041002196041436Foundation SlabReinforced ConcreteFlatDwelling
P2141002196034936Foundation SlabReinforced ConcreteFlatDwelling
P2241002196039031Piling FoundationReinforced ConcreteFlatDwelling
P2341002195012631Foundation SlabReinforced ConcreteFlatCommercial
P2441002195518621Strip FootingsLoad bearing wallSlopingDwelling
P25410021950871511Separate FootingsReinforced ConcreteFlatDwelling
P2641002194066541Strip FootingsLoad bearing wallSlopingDwelling
P2741002195031231Piling FoundationReinforced ConcreteFlatWarehouse
P28410021930897411Separate FootingsReinforced ConcreteFlatCommercial
P294100219302522316Piling FoundationReinforced ConcreteFlatDwelling
P3041002192727033Separate FootingsReinforced ConcreteFlatDwelling
P3141002195046341Piling FoundationReinforced ConcreteFlatCommercial
P3241002196020531Foundation SlabReinforced ConcreteFlatCommercial
P3341002194032833Separate FootingsReinforced ConcreteFlatCommercial
P3441002194546336Separate FootingsReinforced ConcreteFlatWarehouse - Parking
P3541002195096936Separate FootingsReinforced ConcreteFlatCommercial
P3641002195031931Piling FoundationReinforced ConcreteFlatCommercial
P3741002190046831Separate FootingsReinforced ConcreteFlatCommercial
P3841002190022031Separate FootingsReinforced ConcreteFlatCommercial - Warehouse
P3941003196086636Piling FoundationReinforced ConcreteFlatOffice
P4041003196060546Separate FootingsReinforced ConcreteFlatCommercial
P4141003196057948Separate FootingsReinforced ConcreteFlatDwelling
P4241003194076641Separate FootingsReinforced ConcreteFlatCommercial
P4341003194026744Separate FootingsReinforced ConcreteFlatCommercial
P444100319581461511Separate FootingsReinforced ConcreteFlatCommercial
P45410031937277438Separate FootingsReinforced ConcreteFlatCommercial - Parking
P4641003193031441Separate FootingsReinforced ConcreteFlatDwelling
P4741003190018043Separate FootingsReinforced ConcreteFlatDwelling
P4841003197058048Separate FootingsReinforced ConcreteFlatDwelling
P4941003195040236Piling FoundationReinforced ConcreteFlatDwelling
P5041003190024421Separate FootingsReinforced ConcreteFlatCommercial - Warehouse
Table 5. Statistical analysis of the five case studies, where Ren stands for renovations and Cons for new building construction of similar characteristics.
VariablesProject
P01P02P03P04P05
Economic analysis
Ren (€/m2)81.18187.4687.65105.8663.87
Cons (€/m2)555.92601.81533.32528.07555.92
R0.1460.3110.1640.2000.115
Z−1.037−0.231−0.948−0.772−1.188
N_costi0.7111.5170.8000.9760.559
Environmental analysis
Ren (gha/m2)0.0110.0220.0120.0130.009
Cons (gha/m2)0.2660.2910.2660.2600.266
R0.0430.0750.0450.0500.035
Z−0.5030.115−0.458−0.376−0.662
N_EFi0.8401.4580.8850.9670.680
Table 6. Quantification of construction materials and working hours per project.
MaterialP01P02P03P04P05
WEWEWEWEWE
Cement10.257.5621.1215.0313.129.8011.698.5313.229.65
Steel1.402.772.345.243.415.292.123.991.583.44
Aluminium0.050.490.000.000.151.490.373.700.292.94
Aggregates75.740.15105.80.2094.520.1957.560.1180.970.16
Lime6.004.491.921.448.066.042.571.931.881.41
Ceramic6.003.827.904.736.334.445.172.385.514.22
Concrete10.051.8531.584.6115.271.737.930.9219.792.18
Wood0.04−0.040.36−0.360.12−0.120.06−0.060.30−0.30
Paint0.451.171.143.071.082.790.811.170.300.91
Others2.343.179.3613.184.545.284.644.812.674.11
Total112.325.43181.547.14146.636.9392.9227.49126.528.72
Working hours (h)5979.443001.123070.955034.432714.26
W: weight (kg/m2) E: Emissions (kg CO2/m2).

