Estimating Sustainable Harvest Rates for European Hare (Lepus Europaeus) Populations


1
Institute of Wildlife Biology and Game Management, University of Natural Resources and Life Sciences, Vienna, Gregor-Mendel-Str. 33, 1180 Vienna, Austria
2
Department of Integrative Biology and Evolution, Research Institute of Wildlife Ecology, University of Veterinary Medicine, Savoyenstr. 1, 1160 Vienna, Austria
*
Author to whom correspondence should be addressed.
Sustainability 2019, 11(10), 2837; https://doi.org/10.3390/su11102837
Submission received: 21 March 2019
/
Revised: 7 May 2019
/
Accepted: 12 May 2019
/
Published: 18 May 2019
(This article belongs to the Special Issue Sustainable Natural Resource Management)
Abstract
:Hunting quotas are used to manage populations of game species in order to ensure sustainable exploitation. However, unpredictable climatic events may interact with hunting. We established a population model for European hares (Lepus europaeus) in Lower Austria. We compared the sustainability of voluntary quotas used by hunters—which are derived from hare-specific guidelines—with the actual numbers of hares shot and our recommended quotas for hares, which have been derived from climate and population modeling. We used population modeling based on vital rates and densities to adjust our recommended quotas in order to achieve sustainable harvest. The survival of age classes 1 and 3 had the highest impact on the population growth rate. Population viability analysis showed that a recommended quota with a harvest rate of 10% was sustainable for population densities of 45 hares/km2, and that the threshold for hunting should be raised from 10 hares/km2 so that hare populations with <15 hares/km2 are not hunted. The recommended quota outperformed the voluntary hunting quota, since more hares could be harvested sustainably. Age Class 1 survival was strongly linked with weather: a single year with unfavorable weather conditions (low precipitation) negatively affected population densities. Game species, including the European hare, face increasingly frequent weather extremes due to climate change, so hunting quotas need to be sensitive to frequent population fluctuations.
1. Introduction
Hunting in Europe has a long tradition. Today, hunting is driven by a variety of motivations, including consumption (the use of meat, hides, furs and/or trophies), recreation, and the management of game populations [1]. Hunting regulations are used throughout Europe either to protect game species of conservation concern, or to limit the impacts of conflict species that may have damaging effects on other species, ecosystems, or human land use [1,2]. Adaptive management is an approach to resource conservation in which iterative decisions are made based on ongoing learning about the state of the system [3,4]. Hence, adaptive management is a tool that can be used to cope with the variability and uncertainty encountered in wildlife/human systems. To ensure that management reaches its objectives, sustainable harvest rates have to be established as quotas. However, while game densities and recruitment can be assessed by various monitoring schemes [5], information on sustainable harvest rates is often missing. Where species are exposed to variable environmental conditions (e.g., climate, land use), there is a need for models that simulate the fate of populations in response to the variation [6,7,8].
In models, the population growth rate (λ) indicates whether a population is decreasing (λ < 1), stable (λ = 1) or increasing (λ > 1). The growth rate of a population is influenced by vital rate parameters, such as young-of-the-year survival, adult survival, proportion of females breeding, fecundity, and, in hunted populations, the survival of hunting [9]. There is some discussion over which parameters have the greatest impact on the population density of mammals [10], including the European hare (Lepus europaeus) [11].
The conservation status of the European hare worldwide is Least Concern [12], but the steady decline in hunting bags and population densities in the last century was reason enough for conservation bodies in numerous European countries to list the species as Near Threatened or Threatened [13]. Previous studies have been focused on the causes of decrease in hare populations (cf [14,15,16,17,18,19,20,21,22,23,24]). At present, agricultural intensification appears to be the main threat for European hares [11,25,26,27]. One aspect of agricultural intensification is a reduction in habitat heterogeneity, which results in a loss of both cover and high-quality food, and may increase the hare’s vulnerability to diseases, predation, and unfavorable weather conditions [11].
Variation in climate and weather can significantly influence vital rate parameters and consequently determine changes in population density (e.g., [28,29,30]). For instance, weather effects such as variation in temperature and precipitation influence body condition, survival, and reproduction in various mammals [31,32,33,34]. Hence, understanding the variation in the weather factors that influence the vital rate parameters with the strongest impact on the population growth rate might be helpful in predicting annual and long-term population dynamics in the hare.
In areas with comparatively high densities, the hare remains a popular small game species. For example, more than 94,000 hares were shot in the 2017/18 hunting season in Austria [35]. The main hunting season is from October to December, which is outside the main breeding season [36].
Methods to set quotas for the sustainable harvesting of hares in Lower Austria were published by Klansek and Arnold ([37], Supplementary Materials S1). The methods were based on empirical surveys of the area during the years 1990 and 1998. Twice a year, in spring and autumn, spotlight counts were conducted in seven hunting grounds so that the population growth rate could be estimated. Sustainable harvesting, as proposed by Klansek and Arnold [37], skims a proportion of the population growth without reducing the population’s future spring densities. Moreover, harvesting is maximized. The methods suggested by Klansek and Arnold [37] are voluntary, but are currently widely used by hunters. On each hunting ground in Lower Austria, the hunters conduct spotlight counts in spring and autumn (October, before hunting begins), and use the results to estimate population growth during the summer breeding season and calculate their own voluntary hunting quota for the autumn hunt (see Supplementary Materials, S1). The voluntary quota is not necessarily achieved during hunting—for example, if weather conditions are adverse—or it may be exceeded—for example, if hunting conditions are ideal. Hence, the actual number of hares shot may be higher or lower than the voluntary quota that was set for the hunting ground. Similar methods are used by hunters to plan the harvest of other game species.
It is questionable whether the voluntary hunting quotas or the actual numbers of hares shot are always sustainable, as intended. Voluntary hunting quotas set on the basis of yearly population growth inferred by spotlight counts in spring and autumn may be inaccurate, because spring densities and population growth can vary strongly from year to year [38]. For example, European hare populations have been estimated to change from a spring density of 67 hares/km2 to 91 hares/km2 within two years [39], and to decrease from 13 hares/km2 to 3 hares/km2 within four years [40]. The variation in spring hare density increases the difficulty of defining voluntary hunting quotas for sustainable harvesting. High harvest rates (HR) in a year with high growth might still increase the vulnerability of the population if the following year is characterized by unfavorable conditions.
Empirical data only are generally insufficient to establish sound harvest management recommendations (e.g., [41,42]). In contrast, models including demographic, environmental, and harvesting parameters can be used to calculate more realistic management recommendations (e.g., [43]).
Here, we compare the sustainability of voluntary quotas currently used by hunters and derived from hare-specific hunting guidelines [37], actual numbers of hares shot, and our recommended quotas for hares derived from climate and population modeling, especially in light of the potential for census error. In particular, we ask which vital rate parameters affect the population growth rate (λ) of European hares most strongly. We hypothesize that variation in weather (e.g., in temperature and precipitation) has the largest impact on vital rate parameters with the highest elasticities. We test this hypothesis through using a population model with parameters based on spotlight counts and hunting bag analyses of European hares in Lower Austria. We aim to use cohort population modeling based on vital rates and densities to allow hunting quotas to be adjusted continuously by authorities or hunters, so that more effective recommendations for sustainable HRs of game species, in this case the European hare, can be made.
2. Materials and Methods
2.1. Study Area
We focused on the hare populations of the Marchfeld area in Lower Austria (48°11′ N, 16°42′ E). Lower Austria is in the northeast of Austria, encompasses 19,186 km2, and the land use consists of 42% farmland, 40% woods, and 11% grassland. Our data came from two hunting grounds: Oberweiden (OW) and Zwerndorf (ZD), totaling 36 km2 of arable land [44]. Hare densities in these hunting grounds, as estimated by spotlight counts [45], are atypically high, with spring densities often in the range of 80 to 160 hares/km2. To scrutinize the relationship between density and fecundity, we tested our model with data from two other hunting grounds in Marchfeld, Heide (HE) and Hirschfeld (HI), totaling 18 km2 of arable land [44], with much lower spring hare densities (60 hares/km2).
2.2. Lifecycle of the European Hare
A lifecycle was constructed to describe the life history traits of the European hare (Figure 1). Survival and reproductive parameters were based on the literature [36,40,42,46,47,48,49,50]. Hares of Age Class 1 (A1, Table 1) are born during the breeding season in Year t, and have to survive with their specific survival rate (SA1) to become animals of Age Class 2 (A2) in autumn (t). After surviving hunting (SH), animals of A2 have to survive with their specific survival rate (SA2) until autumn in Year t+1 to enter Age Class 3 (A3). The proportion of A3 animals that survive hunting and the rest of the year (SA3) remain in this age class. A2 and A3 animals contribute to A1 by their reproduction, which is defined as the product of the proportion of females breeding (PFB) and their fecundity (F; number of leverets born per breeding female per year).
2.3. Data Collection
2.3.1. Spotlight Counts
Data from spotlight counts [45] were available for OW for the years 1999 and 2001–2004, and for ZD, HE, and HI for the years 1999–2004, and were used to estimate hare density. Hare counts were conducted in spring (late March/early April) and in autumn (October) before hunting. Spotlight counts were done in the agricultural land on dirt tracks from a car driving at a maximum speed of 15–20 km per hour. Woodland and residential areas were excluded from the spotlight count transects, as European hares are reported to use open fields during their activity period [14]. Spotlight counts for each hare survey were done on at least two nights within one week per season by two of the authors of this study (KH and EK). The effective reach of the spotlight beam was 150 m, and a representative area of each hunting ground was illuminated during each spotlight count (ZD = 215.3 ha, OW = 105.3 ha, HE = 207.0 ha, and HI = 299.7 ha). If the difference between two spotlight counts in a hunting ground within one season was more than 10%, the researchers conducted a third count until two spotlight counts differed by less than 10% [51]. Then, the mean of the two relevant spotlight counts was used to estimate the population density. Since this process of gathering suitable spotlight count numbers was unsuccessful for most of the autumnal counts (i.e., counts were too variable), these counts were excluded from the modeling. Methods and staff were consistent throughout the study period. Hunting was allowed in all four hunting grounds from October to December, and was conducted mainly in November during the years 1999–2004 (the study period). In different parts of an area, the unequal visibility of hares may be caused by structures, e.g., hedges, in the landscape [52], which may result in the non-random distribution of the hares missed during the spotlight counts. Nevertheless, we assume this to be negligible in our study, since structured habitat types such as hedges/thickets (2%), and copses (1%) comprised only 3% of the landscape.
2.3.2. Age and Reproductive Performance
In the years 1999–2004, we sampled females from the hunting bag in all four hunting grounds (total n = 1310, details of the females sampled each year and at each hunting ground can be found in Supplementary Materials Table S1). To gather information on the age of the individuals that were shot, we took one eye from each female whenever possible and kept it in 10% formalin to be dried and weighed afterwards. As some of the eyeballs or lenses were destroyed during sampling, storing, or drying, the sample for analysis was reduced to n = 1088. Two age classes, A2 and A3, and the estimated birth dates of A2 animals were derived from dry eye lens weights [53]. In addition, we collected the uteri of the females whenever possible to examine placental scars. Some uteri were destroyed or had pathological alterations, which reduced the sample size to n = 793. We estimated the reproductive performance based on placental scars [54,55].
2.3.3. Weather Data
Weather data, including precipitation and temperature from the study area (weather station Zwerndorf, 48°12′ N, 16°45′ E) for the years 1999–2004, were provided by the Austrian Central Institute for Meteorology and Geodynamics (for details, see Supplementary Materials Table S2). Furthermore, precipitation data (weather station Wien Hohe Warte, 48°14′ N, 16°21′ E) were available for the years 1841–2016 (for details, see Supplementary Materials Table S3). These long-term data had been statistically homogenized by the Austrian Central Institute for Meteorology and Geodynamics to correct for the effects of variation in measuring systems.
2.4. Modeling Methods
We modified a previous model of hare dynamics [40] to simulate population dynamics within our system. Our principal modifications generalized the model for hare populations typical of Central Europe, and included an even sex ratio [36,46] and no juvenile breeding [26,56,57]. A simple age-structured model from autumn in Year t to autumn in Year t+1 was chosen. Survival rates of Age Class 2 animals were given as a proportion (0.85) of Age Class 3 survival, which was assumed to be 0.5 on average, but could also vary from year to year [47,50,58]. Further assumptions were made in order to model population dynamics in hunting grounds of high hare density in Lower Austria: spotlight counts provide true estimates of population density, as structured habitats are rare in the hunting grounds in spring and autumn [45]; the hunting bag derived from the hunting type “Vorstehtreiben” (drive hunt) represents the true age structure of the population [36]; and no significant migration takes place in that area, as was observed by one decade of capturing and marking animals in the four hunting grounds (SSH and KH, unpublished data).
Five stages from autumn (t) to autumn (t + 1) were included in the model: (1) hunting in Year t; (2) survival over winter; (3) survival until the middle of the breeding season; (4) reproduction; and (5) survival to hunting in Year t + 1. The contribution of Age Class 1 in Year t to the population size of Age Class 1 in Year t + 1 was estimated as:
representing the specific survival rate of Age Class 1 until autumn, survival of hunting, the specific survival rate of Age Class 2 over winter, survival until the middle of the breeding season, and the fecundity of females that breed. The first exponent was set to 1/3, as winter was defined as post-hunting until the following March (four months, December to March inclusive), whereas the second exponent, 3.5/12, was chosen because the median of the estimated birth dates occurred approximately 3.5 months after the spring census. To account for the reproductive contribution of Age Class 2 in Year t + 1, only females of Age Class 1 are relevant; hence, the right side of Equation 1 is divided by two. The contribution of Age Class 1 in Year t to the population size of Age Class 3 in Year t + 1 is:
representing the survival of hunting and the specific Age Class 2 survival until the next autumn, to become an animal of Age Class 3. To represent the contribution of Age Class 3 in Year t to the population of Age Class 2 and Age Class 3 in Year t + 1, the same stages were defined. Hence, the following equations were used:
where PFB and F were estimated directly from the placental scar count results. We calculated the specific survival rates of every age class by using the spring hare numbers (in spring, all hares are Age Class 2 or 3, and half of them are female), the hunting bag (proportion of females and males assessed due to secondary sexual characteristics), and the proportion of Age Class 1 hares in the hunting bag (proportion of Age Class 2 and Age Class 3 determined by eye lens weight, Supplementary Materials S2). We decided to calculate the autumn hare numbers for both Age Class 3 (NA3autumn) and Age Class 2 (NA2autumn) on the basis of the spring hare numbers (Nspring), since the autumn spotlight counts were less reliable then the spring counts:
CA1A1 = SA1 × SH × SA2(1/3) × SA2(3.5/12) × PFB × F/2,
CA1A3 = SH × SA2,
CA3A2 = SA1 × SH × SA3(1/3) × SA3(3.5/12) × PFB × F/2,
CA3A3 = SH × SA3,
NA3autumn = Nspring × SA3(2/3),
To estimate the number of hares in Age Class 2 in autumn, first, the survival of Age Class 3 animals until the middle of the breeding season and their reproduction was calculated. The specific Age Class 1 survival until autumn was also included. Again, the right side of Equation (6) is divided by two, as only females account for the reproductive contribution:
NA2autumn = Nspring × SA3(3.5/12) × PFB × F × SA1/2
The population size for both age classes 2 and 3 after hunting was estimated as the hare numbers of the age class in autumn minus the hare numbers of the age class in the bag, which was calculated as the proportion of Age Class i in the bag (PAiBag):
Ni,post hunting = Ni,autumn − PAiBag
The estimated spring population size (spring) differed in some cases from the actual spring counts (Nspring), because the Age Class 3 survival rate (SA3) was assumed initially to be constant at 0.5. To ensure a match between the model and the observed data, spring was adjusted to Nspring by changing the value for Age Class 3 survival so that it could vary from 0.39 to 0.78.
The number of Age Class 1 hares born in any year could be inferred from the number of breeding Age Class 3 and Age Class 2 females still alive at the middle of the breeding season, and their fecundity. To simulate the dynamics of a generic population, the data from all five years were pooled and the mean parameter values were calculated; then, these mean values were used as constants in the generic population model.
The population growth rates (λ) of the populations from the hunting grounds OW and ZD, and that of the generic population, were calculated as a mean over all the study years using three different approaches. First, λ was simulated including the actual numbers of hares taken in each hunting ground. Second, HRs were set to zero, to simulate the growth rate in the absence of hunting. Third, λ was calculated as the ratio of the spring population sizes, Nt+1/Nt, based on spotlight counts, to evaluate whether the model described the population well.
Elasticities explain the impact of a proportional change in the vital rates on the population growth rate (λ). Consequently, an index of elasticity is often used to show which parameters affect λ most strongly [40,59], although elasticity analysis does have some limitations [60]. Elasticity analyses were carried out on the four matrix elements. Since each element consisted of more than one parameter, a plausible range for each of the parameters was plotted against λ. Parameters with steeper slopes have a stronger impact on λ than parameters with flatter slopes [61]. Hence, the impact strength of each single element on λ could be visualized.
2.5. Estimating Sustainable Harvest Rates
A simple, deterministic model was used to simulate indices of sustainable harvest rates (ISHR, i.e., HRs compatible with λ ≥1) for the generic population. To simulate ISHR under more realistic conditions, environmental and demographic stochasticity were added by drawing vital rates from their underlying distributions. A population viability analysis (PVA) was conducted, with initial population sizes (I) from 500 to 10,000 hares for a hypothetical hunting ground of 50 km2 (densities from 10 to 200 hares km2) and HR from 0 to 40%. As inferred from the field data (see below), density dependence was included by adjusting the fecundity according to the current population density. For each I x HR combination, 1000 Monte Carlo runs were performed to simulate the fate of the initial population over a period of 25 years. A threshold of probability of quasi-extinction (<1 hare/km2) was set to define HRs as being sustainable. The HR was considered to be sustainable if ≤5% of the simulations resulted in quasi-extinctions.
2.6. Effect of Weather on Age Class 1 and Age Class 3 Survival
To describe environmental stochasticity in more detail, we determined the relationships between weather data from the study area and the model parameters with the highest elasticities. Specifically, we tested the effect of different weather data variables on the Age Class 1 and Age Class 3 survival response variables, using linear and quadratic regressions. Therefore, long-term annual precipitation data were analyzed to detect extreme values by calculating the moving variance for a rolling time window with a window width of 10 years for the years 1841–2016 using the package zoo [62], and by estimating the Pearson’s correlation coefficient. We visually checked the normality of the model residuals by means of a normal probability plot. The homogeneity of variances and goodness-of-fit were examined by plotting residuals versus fitted values [63].
2.7. Analysing Voluntary Hare-Hunting Quotas in Lower Austria
Methods to calculate voluntary hare-hunting quotas for the study area were published in Klansek and Arnold [37] and are currently used by hunters in Lower Austria. In order to investigate these methods, the matrix model was used to simulate the hare population’s fate under the voluntary quota (see Supplementary Materials S1). Mean parameter values under environmental and demographic stochasticity were applied, with Age Class 1 survival drawn from the range calculated for the hunting grounds (ZD and OW) during the study years (SA1 = 0.1 to 0.24). Previous studies have described correlations between the proportion of females breeding and density [53,54,56], but with opposite findings. In our case, a linear regression analysis with the response variable fecundity and the covariate spring density based on data from all four hunting grounds showed that fecundity was significantly density-dependent (R2 = 0.28, df = 18, p = 0.017). Therefore, the density dependence of fecundity was incorporated, and the estimates that were derived from the regression analysis (intercept = 14.521, β = −0.0164) were implemented in the model. Excluding this factor from the simulations led to unreasonable results, with spring densities >1000 hares/km2. A possible census error of up to 20% was also included.
Since the number of hares actually taken each year in the hunting grounds differed from the voluntary quotas, the same analysis was conducted with the numbers taken in order to check whether the populations had been hunted in a sustainable way during the study period. All the statistical analyses and modeling were performed in R 3.5.1 [64].
3. Results
3.1. Densities and Vital Rates of the Populations
The spring densities of hares at the two hunting grounds, ZD and OW, showed a similar progression over the whole study period (Figure 2a, Table 2). In 2000 and 2001, the estimated Age Class 1 survival (SA1) and Age Class 3 survival (SA3) in both populations was the highest (SA1ZD2000 = 0.25, SA3ZD2000 = 0.78, SA1OW2001= 0.24, and SA3OW2001 = 0.61; Figure 2b,c), resulting in almost doubled spring densities in the following year (spring density ZD2001 = 150, spring density OW2002 = 161; Figure 2a). The mean Age Class 1 survival rate for both populations and the generic population was calculated as SA1 = 0.14 (Table 2). The estimated proportion of females breeding (PFB) ranged from 0.85 up to 1.00 of females, which contributed to reproduction in both ZD and OW populations (Figure 2d). Values for the estimated fecundity (F) of breeding females ranged from 10.77 to 14.08 leverets born per breeding female and year, and were very similar in OW and ZD populations (FOW = 12.35, ±0.52 SE; FZD = 12.67, ±0.29 SE; Figure 2e).
3.2. The Population Growth Rate
The simulated λOW was 0.84 (λ < 1, indicates a decreasing population) with an observed HR (based on the actual numbers of hares taken) of 12%; the calculated λOW (Nt+1/Nt = ratio of spring population sizes) was 0.89. Simulating the growth rate in the absence of hunting gave a λOW of 0.96. The simulated λZW was 0.97 (Nt+1/Nt = 1.05, slightly increasing population) with an observed HR of 16%; without hunting, λOW was 1.16. The generic population showed a simulated λGP of 0.91 (Nt+1/Nt = 0.97, slightly decreasing population) with an observed HR of 14%; without hunting, λGP was 1.06. As the simulated and the observed growth rate were similar (λGP of 0.91 versus Nt+1/Nt = 0.97), our model fit the data well.
3.3. Elasticity Analysis
Elasticity analyses showed that the survival of age classes 1 and 3, and Age Class 1 survival in particular, had the highest elasticities of all the parameters, as their slopes were the steepest and the λ unit changes were the highest (Table 3). The proportional changes of parameter values in the survival of hunting also had a great impact on the population growth rate. Reproductive parameters (proportion of females breeding and fecundity) affected λ only slightly.
3.4. Sustainable Harvest Rates
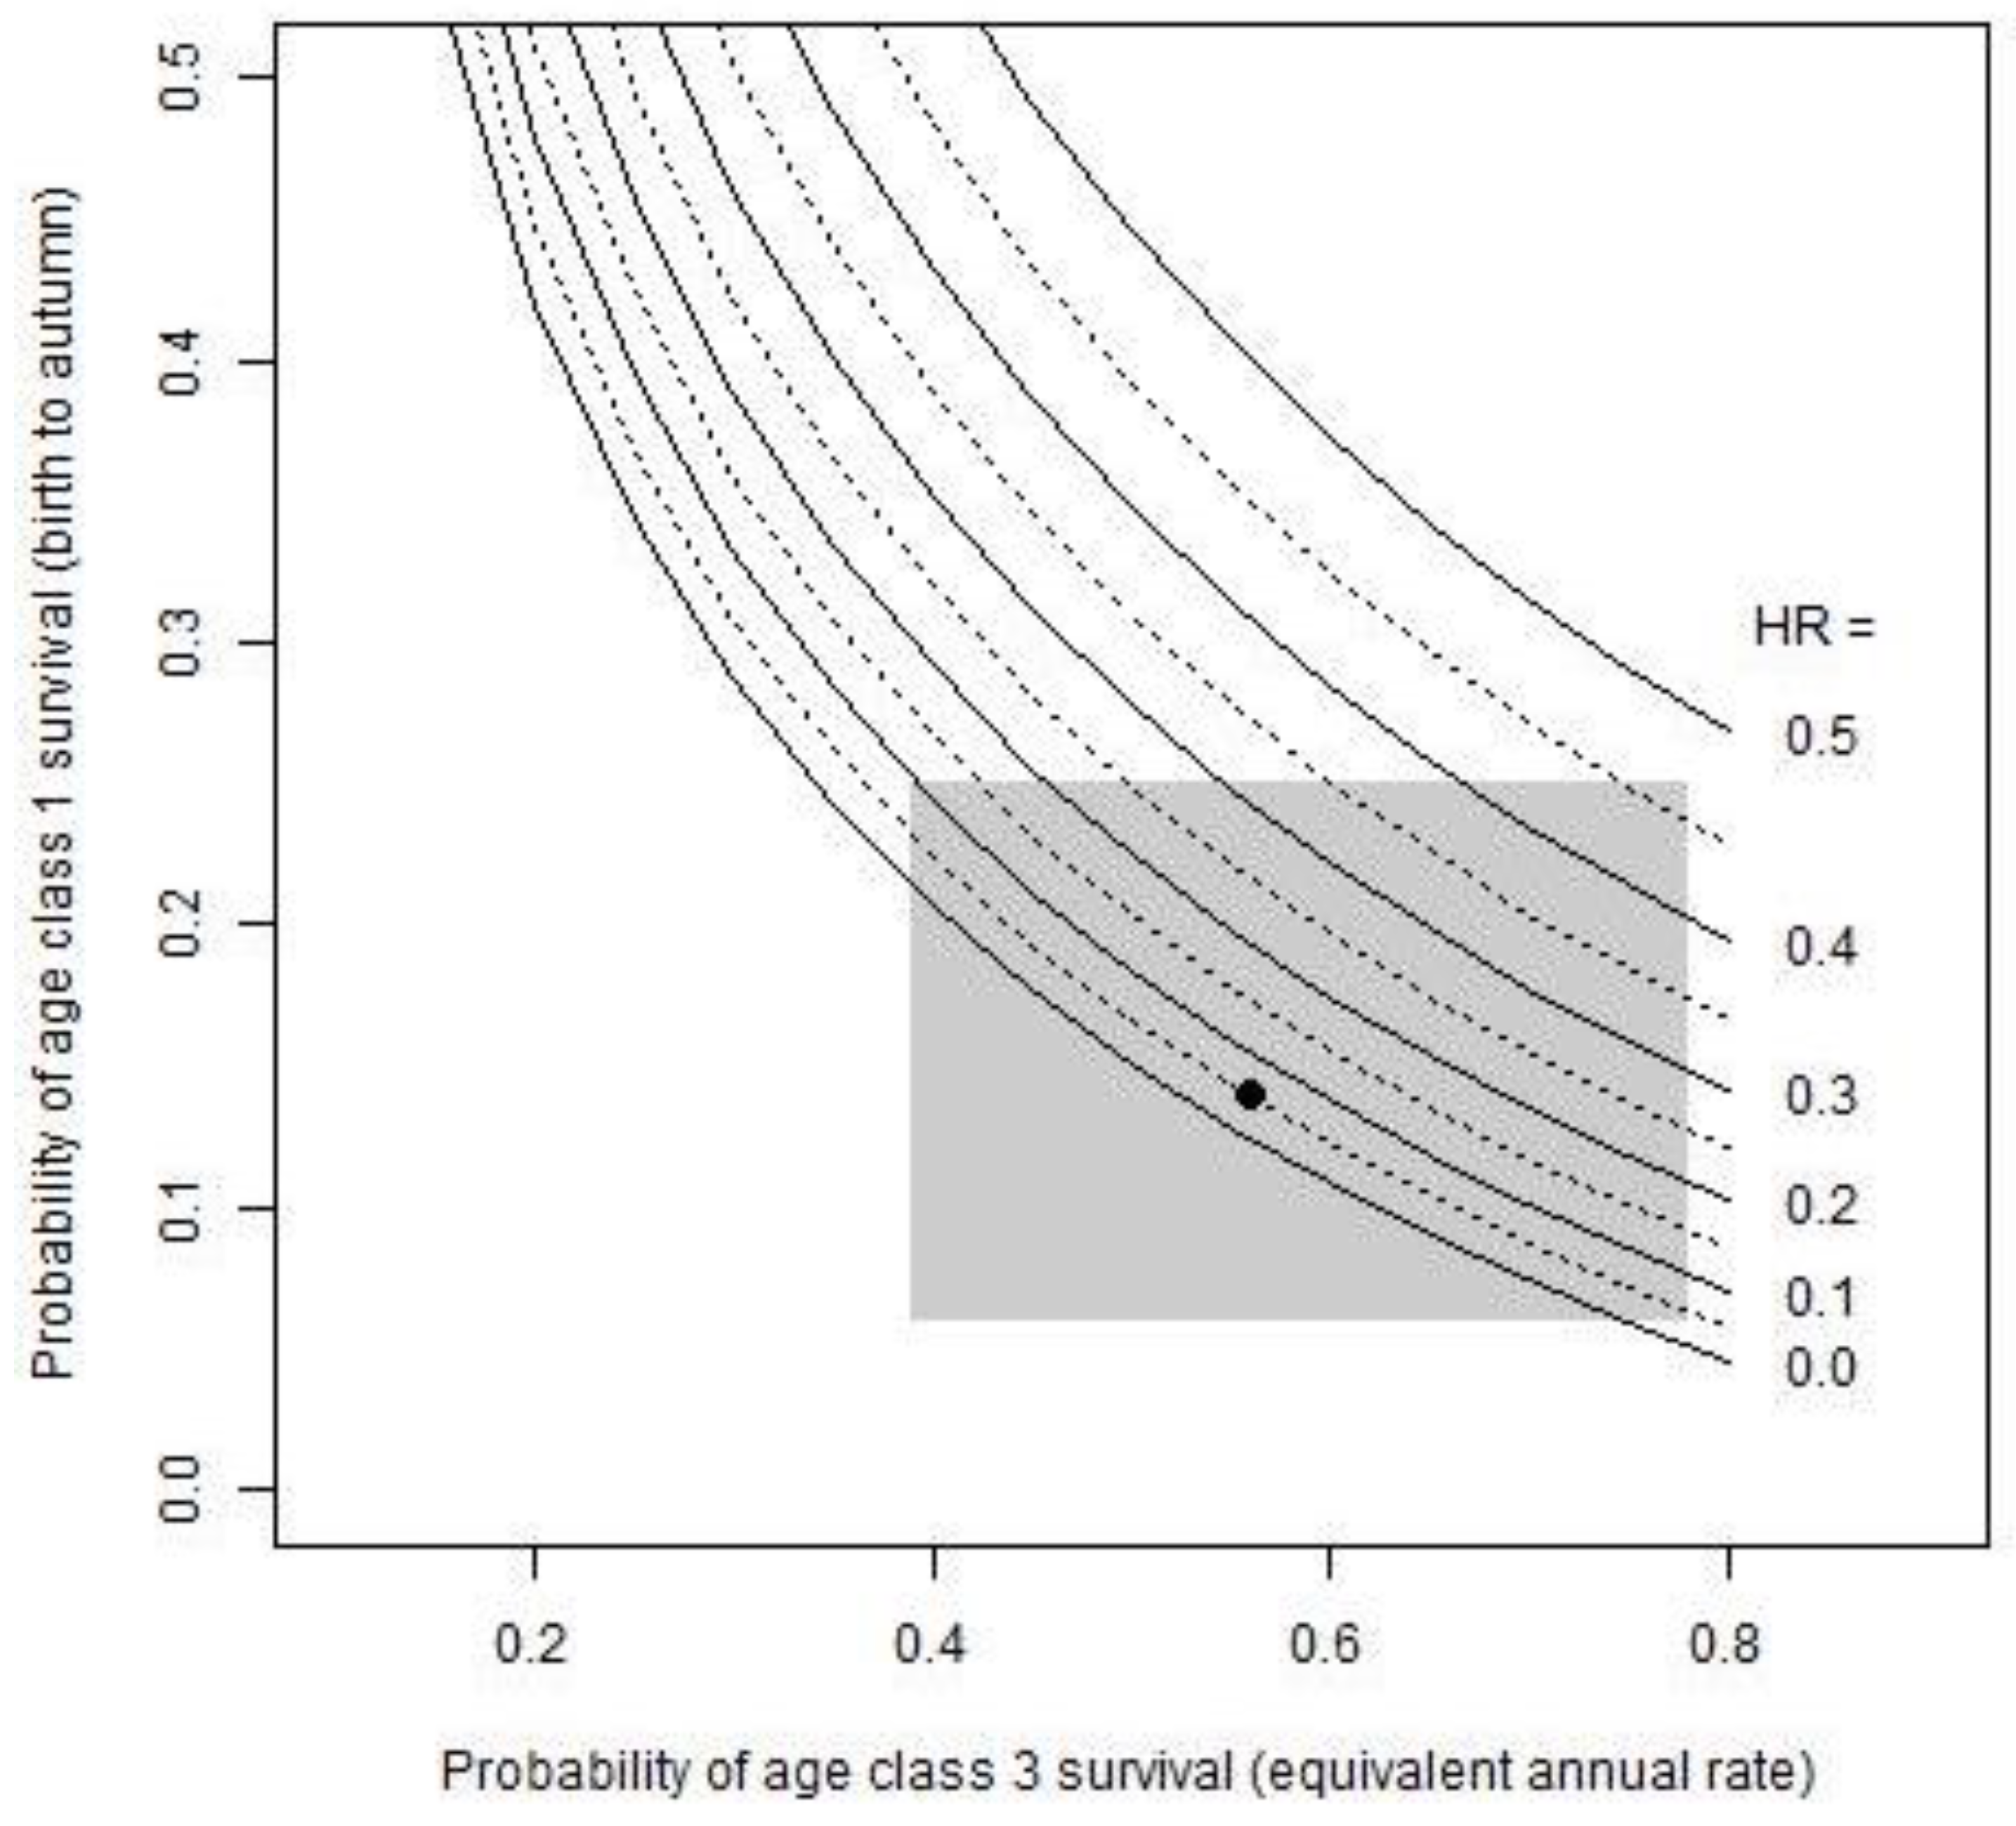
ISHR were described as a function of the two parameters with highest elasticities: Age Class 1 and Age Class 3 survival. Using the simple deterministic model, HRs from 0 to 50% that yielded λ ≥ 1 were simulated over a range of all the possible survival rates of age classes 1 and 3 (Figure 3). The grey rectangle indicates the range of survival rates observed in this study. HRs of 10–45% are sustainable with the highest Age Class 1 survival (SA1 = 0.25), depending on Age Class 3 survival in the same year. However, very low Age Class 1 survival (≤0.1) can sustain only very low HRs (≤15%), and only if Age Class 3 survival is relatively high (>0.6) at the same time. Mean values of both parameters are shown by the black dot (Figure 3), which indicates that the ISHR for the generic population is 5%.
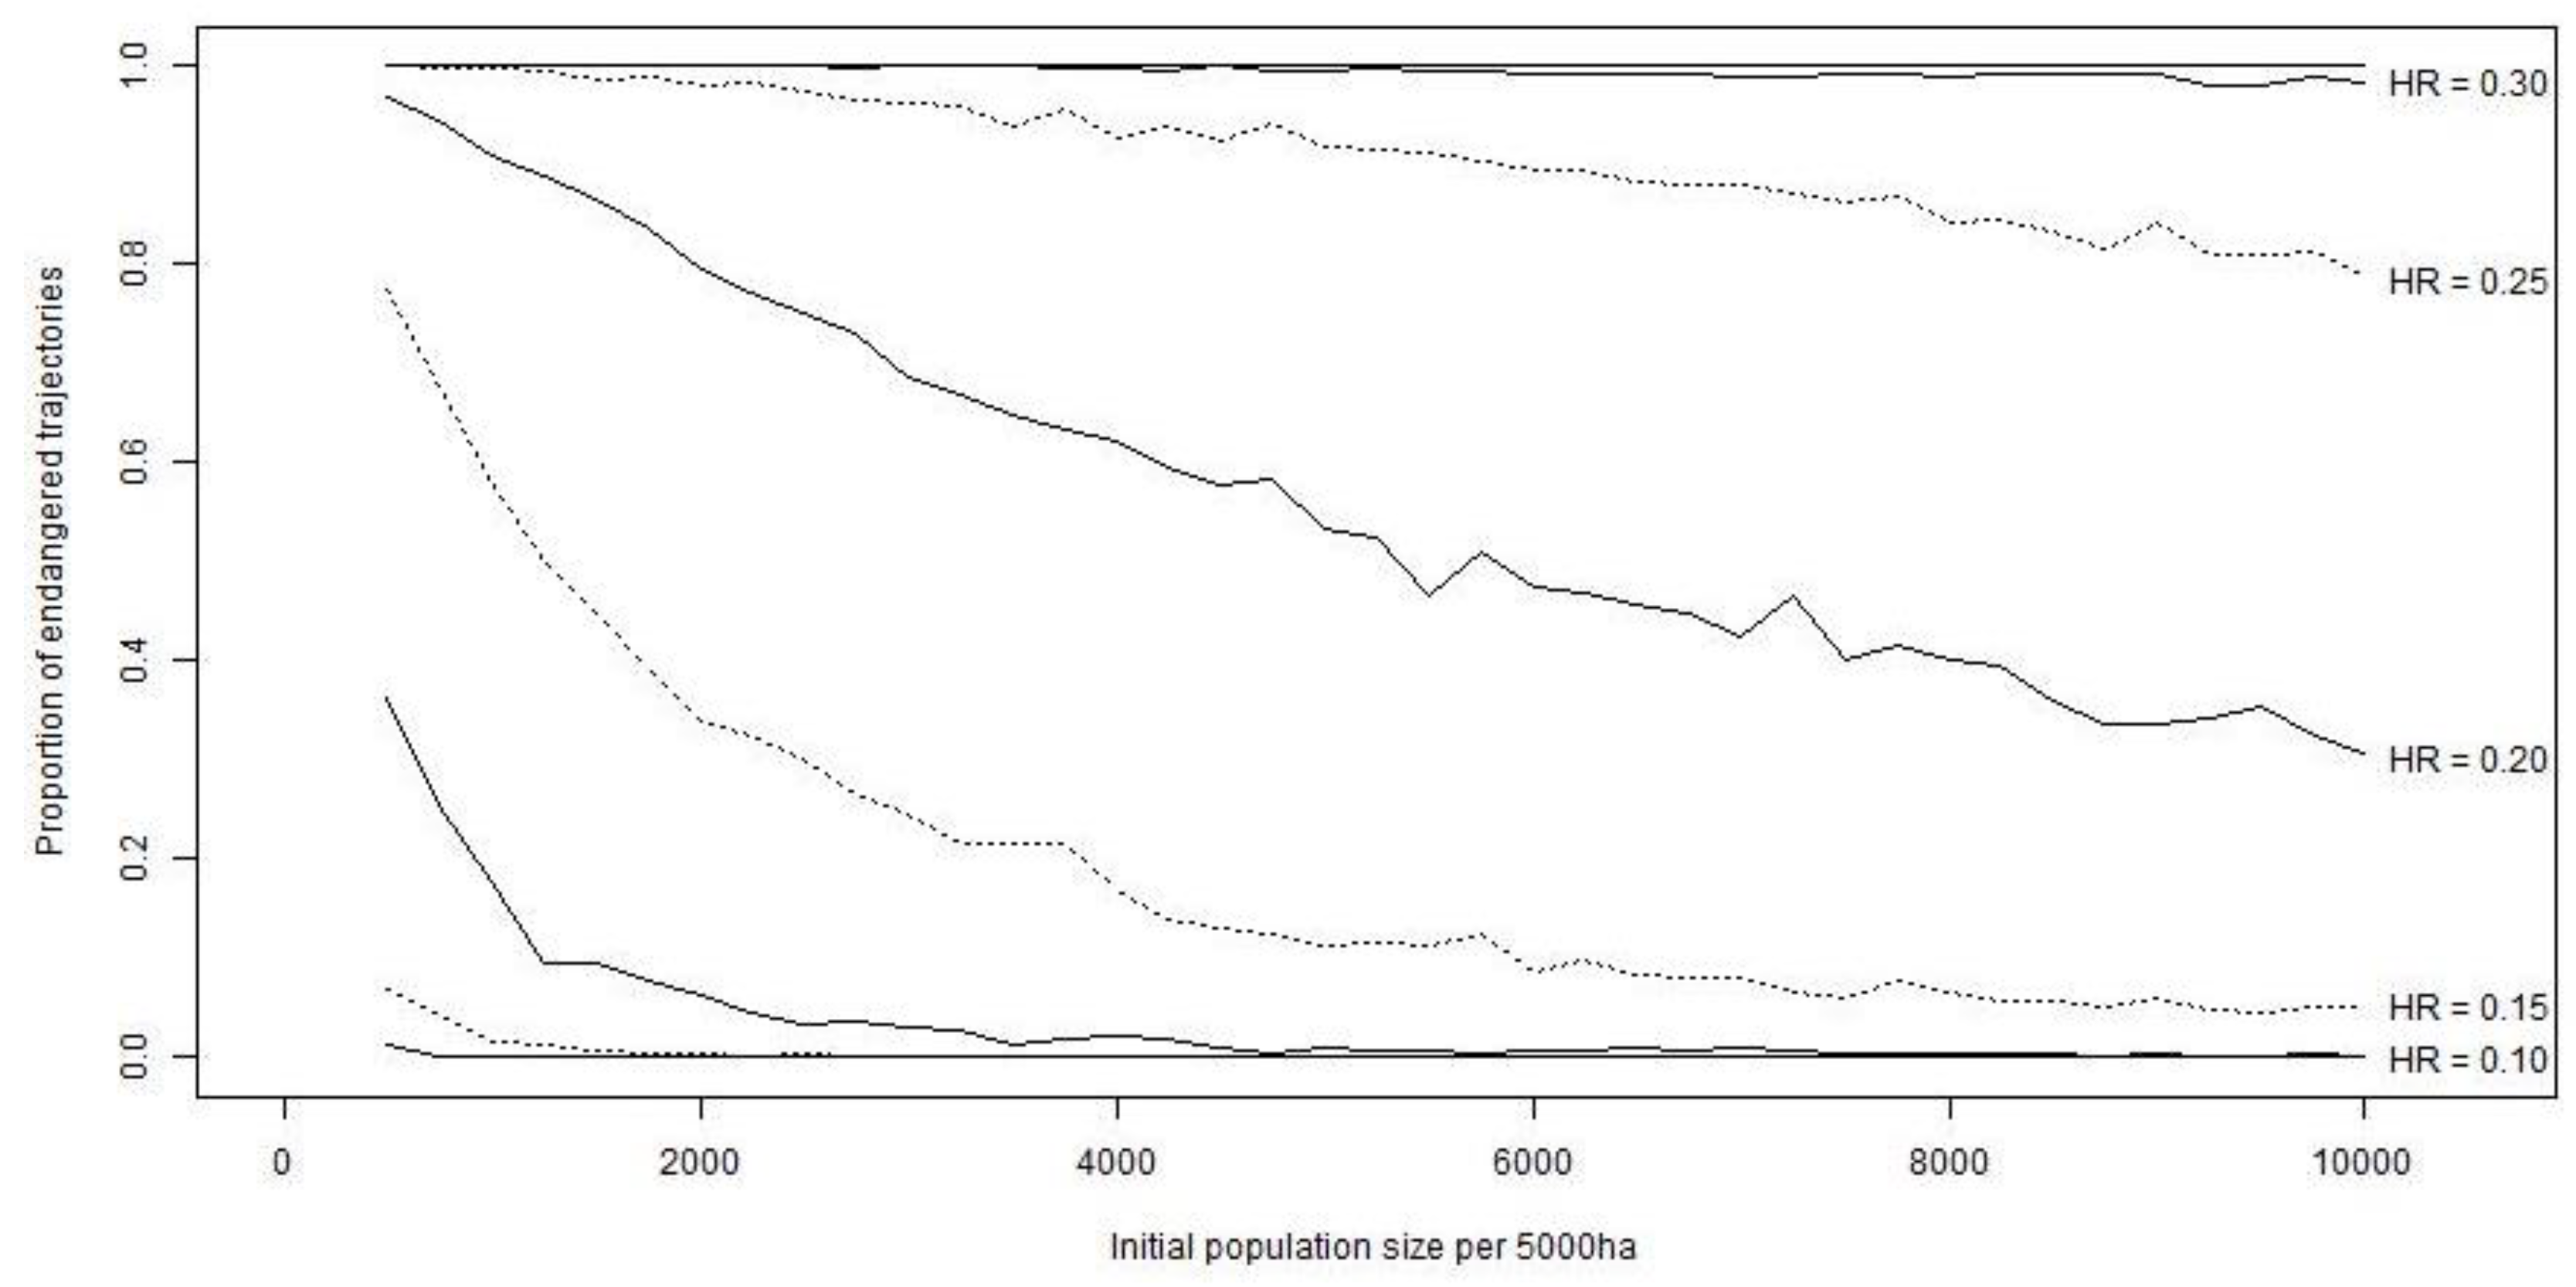
The results of the PVA, including stochasticity, showed different ISHR estimates. HRs of 5% were only sustainable if the population size was at least 750 hares (15 hares/km2), whereas HRs of 10% were sustainable for an initial population of 2250 hares (45 hares/km2; Figure 4). Only if the population reached >9500 hares (190 hares/km2) were HRs of up to 15% sustainable. No population with <10,000 hares (200 hares/km2) could sustain a HR of ≥20%.
3.5. Effect of Weather on Age Class 1 and Age Class 3 Survival
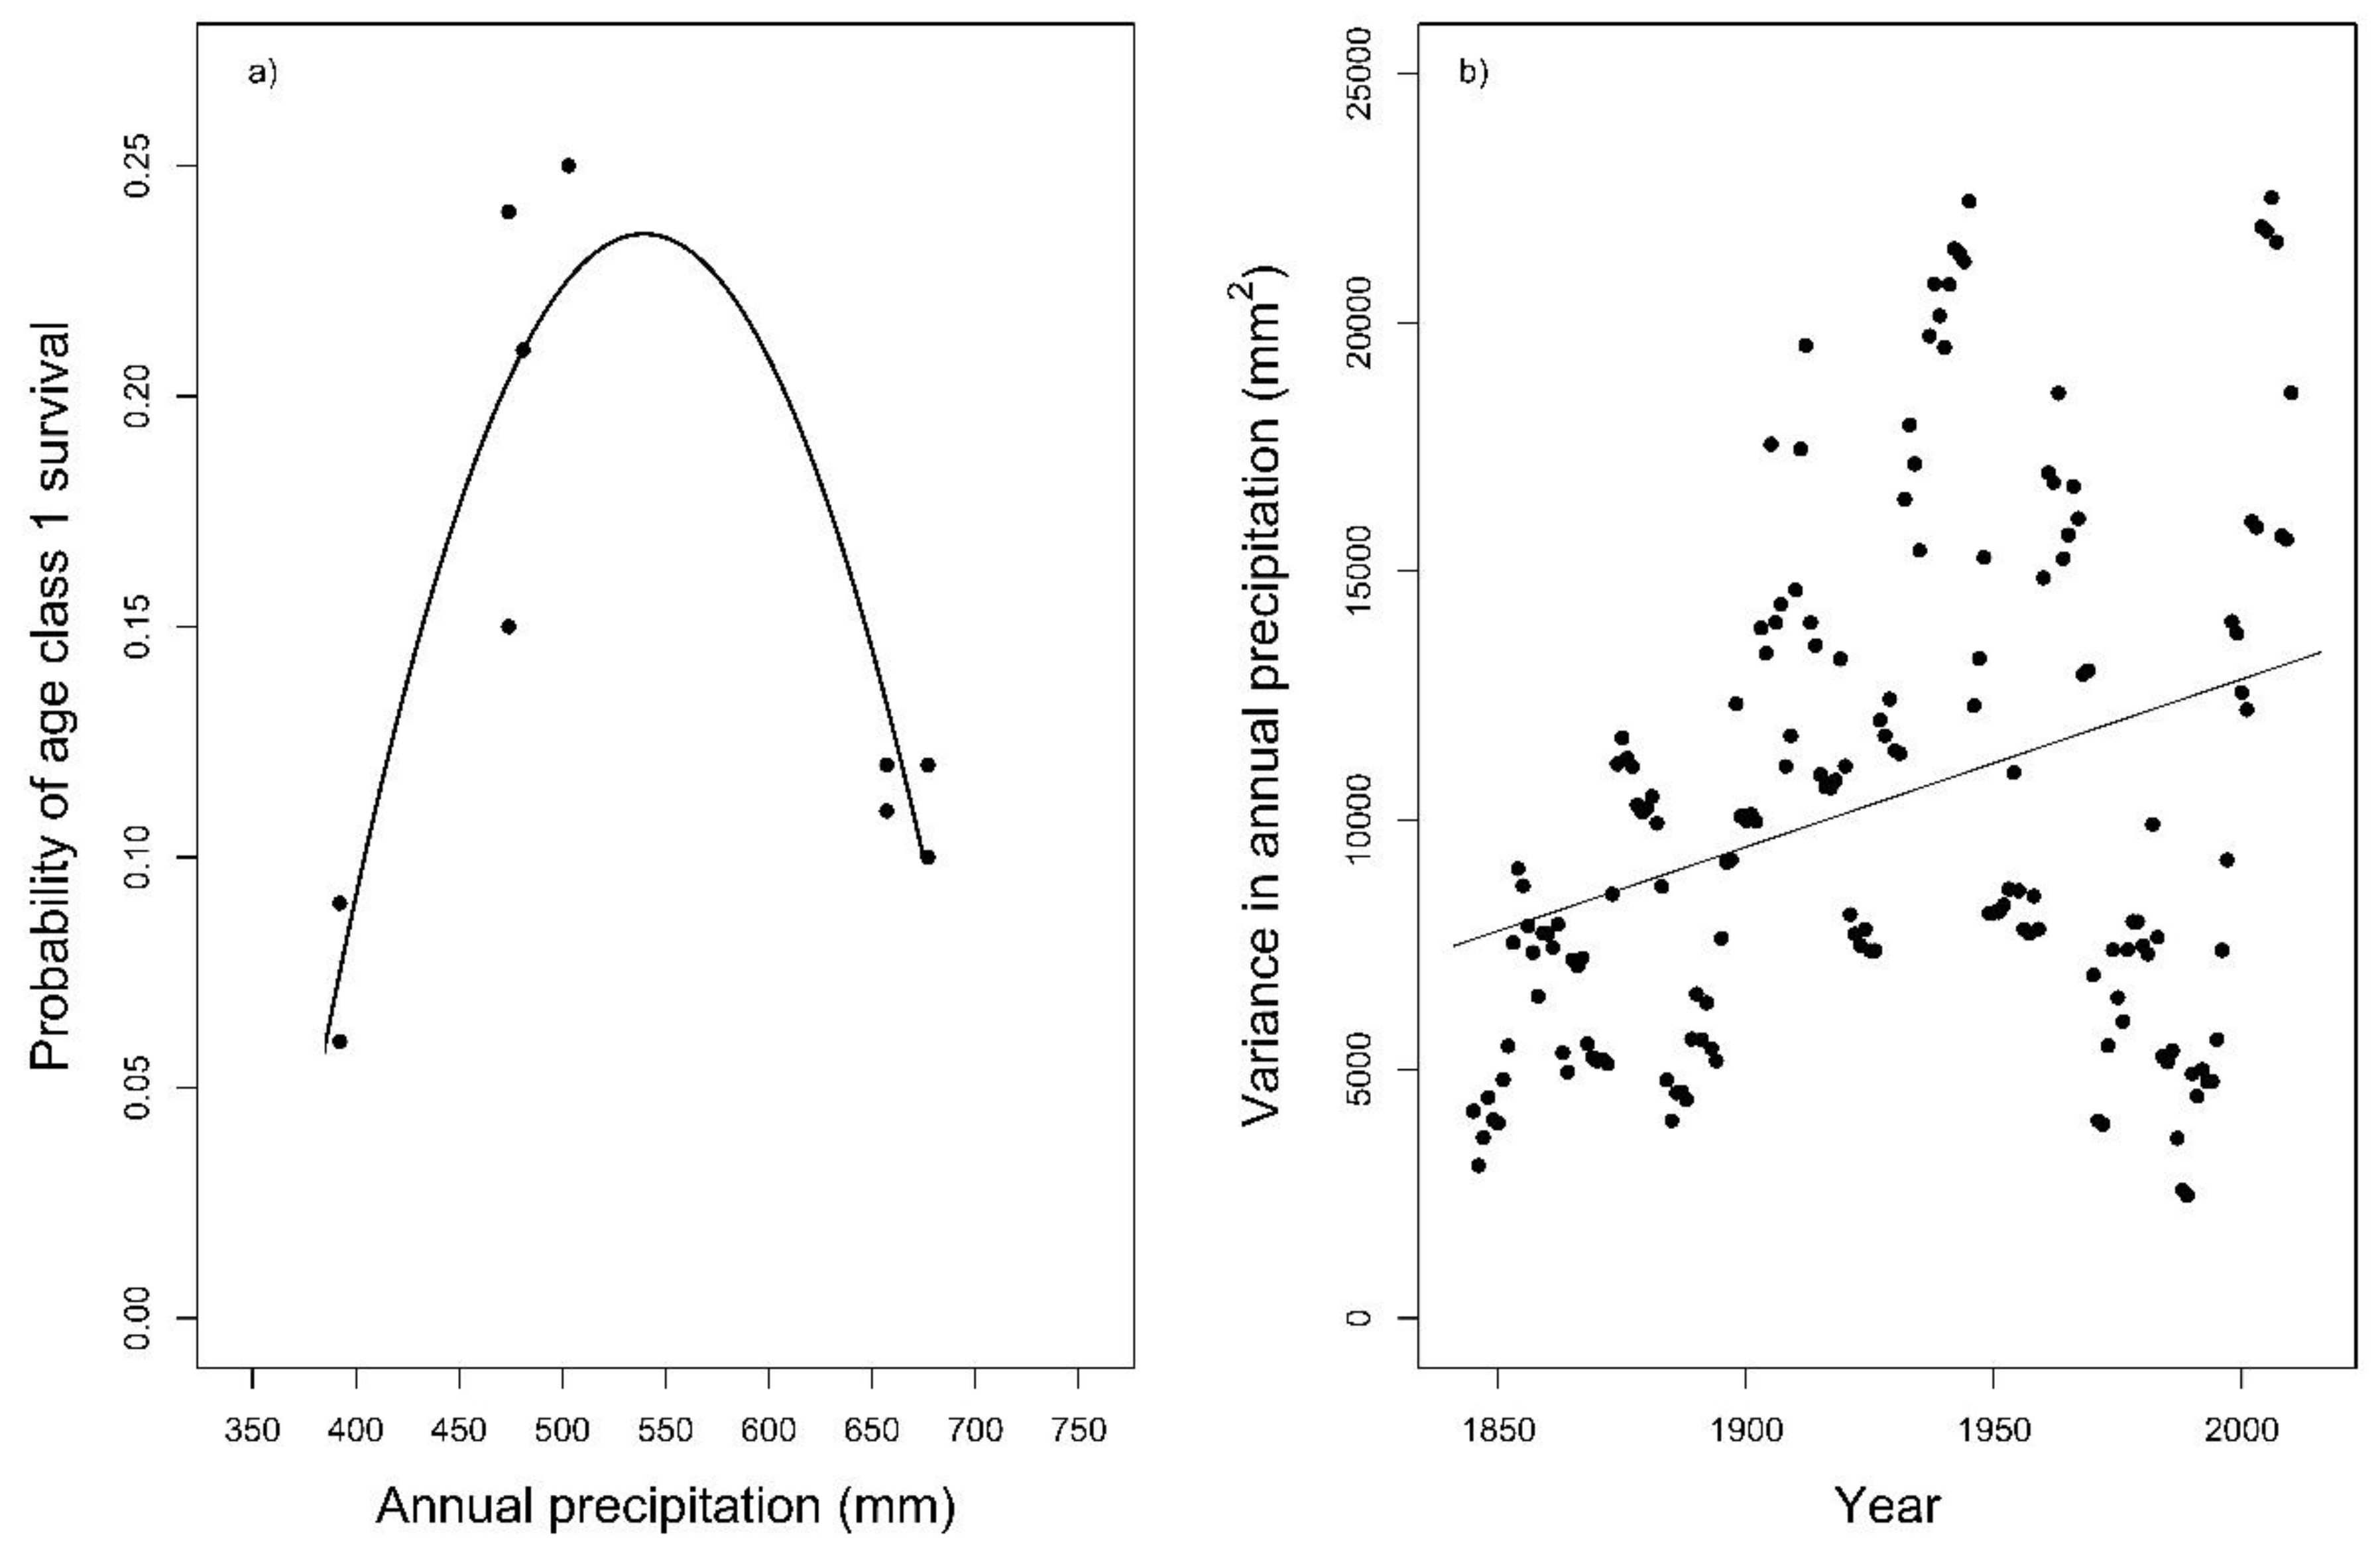
Regression analyses showed an effect of annual precipitation (R2quadratic = 0.83, df = 7, p = 0.002) on Age Class 1 survival (Figure 5a). The temperature variables that we analyzed had no effect on Age Class 1 survival (p > 0.10, Supplementary Materials, Table S4), and Age Class 3 survival was not affected by any weather variable that we evaluated (p > 0.10). Within the years 1841–2016, the mean spring precipitation was 80.0 mm (±37.4), and the mean annual precipitation was 633.0 mm (±109.3, Supporting Information, Figure S1a,b). The year 2003 had an exceptionally low precipitation rate (spring precipitation = 3 mm, annual precipitation = 392 mm). Therefore, we excluded this exceptionally dry year (2003) and replaced it with the parameter values of the generic population. Then, the results of the PVA gave sustainable harvest rates of up to 20% once the population size was >8500 hares (170 hares/km2). The Pearson’s correlation coefficient for the moving variance in annual precipitation showed a significantly positive trend (ρ = 0.31, df = 164, p < 0.001, Figure 5b) for the years 1841–2016, indicating that extremely dry or wet years are increasing in frequency.
3.6. Evaluating Voluntary Hare-Hunting Quotas in Lower Austria
The sustainability of the voluntary quotas currently used by Lower Austrian hunters for hares was analyzed by simulating the generic population with varying Age Class 1 survival rates (0.1 to 0.24) and density-dependent fecundity estimates. When Age Class 1 survival was very low (SA1 = 0.1), there was an extinction risk of 35%, which increased with the increasing census error. The voluntary quota was sustainable, with no risk of extinction, for SA1 values >0.1 and ≤0.24. HRs of ≥15% up to 21% were sustainable if the population had a mean Age Class 1 survival of ≥0.18, even with the highest census error (20%).
Actual numbers of hares shot during the study period were higher when the population growth was low (growth rate 0–40%: mean HRactually = 19%, mean HRvoluntary = 4%) and lower when the population growth was high (growth rate 40–100%: mean HRactually = 12%, mean HRvoluntary = 34%) compared to the voluntary quota. Simulating the population’s fate when the voluntary quota was applied yielded an extinction risk from 30% up to 95% when Age Class 1 survival was 0.1 and the census error was at its highest value. The simulated population showed no probability of extinction within 40 years under the voluntary quota for higher SA1 values.
4. Discussion
Maximizing harvest without imperiling hunted populations has long been a focus of wildlife management. For populations sensitive to climate, and as climatic fluctuations increase in amplitude, determining sustainable levels of harvest in the face of those fluctuations is particularly pressing. Here, we show that higher rates of harvest can be achieved by modifying existing guidelines for harvesting European hares. Moreover, our simulations show that the threshold for hunting should be raised from 10 hares/km2, so that hare populations with fewer than 15 hares/km2 in the spring are not hunted at all. We discuss this finding in the context of the particular population characteristics in our study area, the considerations involved in modeling sustainable HRs, and the importance of climate for hare population dynamics. We further consider the differences between voluntary quotas currently used by hunters and the numbers of hares actually taken, and the consequences for maximum sustainable yields. Finally, we present our recommendations for sustainable management and long-term conservation objectives for European hares.
4.1. Vital Rates and Densities of the Population
The spring densities of the hare populations that we studied are among the highest of any hunted populations in European arable landscapes (OWmean = 117 hares/km2, ZDmean = 119 hares/km2). More usually, spring densities range from 5.6 hares/km2 in some areas in Germany [65] to 116 hares/km2 in Hungary [66]. The high densities seen in our study may be due to a range of factors, including favorable habitat structure, suitable climate, or a lack of predation or disease [11,36,38,54].
The mean Age Class 1 survival rate was 0.14 (range 0.06 to 0.24), which was among the lowest in Europe (cf. [15]: SA1 = 0.25–0.5, [25]: SA1 = 0.2–0.3, [38]: SA1 = 0.25, and [40]: SA1 = 0.14–0.29). Low recruitment was not caused by poor reproduction, since the proportion of females breeding (PFBGP = 0.94) and their fecundity (FGP = 12.4) were among the highest values found in the literature ([54]: PFB = 0.83, F = 10; [57]: PFB = 0.84, F = 11.2; [40]: PFB = 0.93, F = 13.4). Hence, low recruitment was caused by low Age Class 1 survival rates. Examining the causes of mortality in juvenile hares is one of the core tasks in hare research. Assumed causes include losses due to agricultural activities, disease, and predation [38]. Lower Age Class 1 survival rates in our study area were indicated by the substantially lower proportions of hares of Age Class 2 (PA2) in the bag (PA2GP = 0.49) compared to those in other study areas ([46]: PA2 = 0.62; [40]: PA2GP = 0.66).
The elasticity analyses suggested that proportional changes in Age Class 1 survival have the highest impact on the population growth rate, followed by proportional changes in Age Class 3 survival. This result—that survival rates had the highest impact on the population growth rate in European hares—is not in line with the findings of Oli and Dobson [27]. They described survival rates to be overwhelmingly most influential on λ in mammal species with delayed maturity and low reproductive rates, whereas age at maturity and fertility had the largest relative influence on λ in mammal species characterized by early maturity and high reproductive rates, such as those of the European hare. Another study on hares showed that juvenile survival was especially influential for increases in λ, whereas other vital parameters contributed more to annual declines in λ [67]. As our study populations showed increases and decreases in population density during the study period, we cannot say whether or not our results support Oli and Armitage’s [67] conclusions.
4.2. Sustainable Harvest Rates
Without any kind of stochasticity, we found that HRs of 5% were sustainable in the generic population (SA3 = 0.56, SA1 = 0.14, PFB = 0.94, F = 12.4). When Age Class 1 survival was high and Age Class 3 survival was average or high, HRs of up to 45% were sustainable. Using a deterministic model to estimate ISHR is a highly theoretical approach that cannot be applied to real populations, since environmental and demographic stochasticity have unpredictable effects on the vital rates of the population, and thus on sustainable harvesting [68]. However, analyzing a population first by using mean and constant parameter values can indicate strong population trends and average population growth rates [68,69]. For that reason, the validation of deterministic models can be achieved by comparing the simulated mean population growth rate to the calculated λ (Nt+1/Nt), based on spotlight counts [40]. In this study, the simulated and the observed growth rate were similar (λGP of 0.91 vs. Nt+1/Nt = 0.97).
Estimating ISHR using a PVA of the generic population, but incorporating uncertainty by combining different parameter values of the vital rates drawn from the observed distribution, is a more conservative approach. Adding the full range of observed environmental stochasticity to the simulation showed clearly that HRs ≥20% for a population ≤200 hares/km2 would lead to the extinction of the population within the next 25 years, even with high survival rates. In Europe, medium-high hare densities range between 20–30 hares/km2 [38]. Applying our results, this means that hunting quotas should not exceed 5% in areas of medium-high hare densities, in order to ensure sustainability. Hunting quotas of 10% are sustainable only in high-density hunting grounds with hare densities of ≥45 hares/km2. In general, low-density hare populations with fewer than 10 hares/km2 are not hunted in Europe. However, our simulations show that the threshold for hunting should be raised so that hare populations with fewer than 15 hares/km2 in spring are not hunted. Rule 4 in Klansek and Arnold [37] indicates that hares should not be hunted when autumn density is lower than 30 hares/km2. Nevertheless, we recommend based on our analysis that the threshold for hunting should be based on spring densities.
We considered a HR to be sustainable if ≤5% of the simulations resulted in quasi-extinctions. Our chosen threshold is not very conservative: in one of every 20 simulations, the population will go extinct. However, numerical extinction is different from ecological extinction. One in 20 simulations results in a population of less than one hare/km2, but even this population has not quite become extinct yet. Furthermore, our hypothetical hunting ground of 50 km2 is a relatively small area that could probably be demographically rescued by dispersal from neighboring areas. Juvenile hares disperse in the autumn after their birth, particularly when densities are low and hunting takes place [58].
To simulate environmental stochasticity at levels close to reality, long-term data are needed to account for extreme events, such as droughts and strong winters [68,70]. Analyzing the environmental changes in this study indicated that droughts do have a great impact on the results of a PVA. Exchanging the parameter values of the year 2003 (with extremely dry weather) for average parameter values gave sustainable HRs of up to 20% once the population had reached a population size of >8500 hares (170 hares/km2). This resulted in an increase of sustainable HRs of 33%. To predict the impact of abiotic factors such as weather, an analysis of periodic events would be helpful, since current climatic conditions cannot always be extrapolated to simulate future events [68,69].
It is often suggested that PVAs are insufficiently accurate for their results to be taken as an absolute estimate of the likelihood of extinction [68,71,72]. Predicting extinction probabilities with PVAs is only precise if extensive and reliable data exist, and if the distribution of vital rates between individuals and years can be anticipated to be fixed in the future, or if any changes can be precisely foreseen [73]. Nevertheless, unpredictable events or catastrophes, as well as habitat loss, restoration, and changes in biotic factors make it impossible to guarantee correct trajectories [68,74]. Furthermore, the validation of stochastic models is problematic, since data sets are seldom large enough to split the sample and use one half for constructing the model and the other half for validation, as we did in this study. The best way to validate and develop a sound stochastic model would be to improve it by constantly monitoring the population and adjusting the model by incorporating changes in demography or environmental factors [68,74]. Then, population viability analysis can be one useful tool among a variety of decision-making aids for categorizing and managing endangered species [75].
We chose to incorporate density dependence in our model to test the sustainability of the voluntary hunting quotas and the numbers of hares actually taken in the hunting grounds. Preliminary research produced no significant signs of density dependence of any parameter in the two populations we studied, but the ability of species to persist while being hunted can generally be considered to provide evidence of density dependence [76]. It is difficult to quantify density dependence due to sampling errors [77] caused by the counting method used and the dynamics of the population [78].
4.3. Effect of Weather on Age Class 1 Survival
The precipitation rate had a non-linear influence on Age Class 1 survival. This suggests that various mechanisms have a negative effect on Age Class 1 survival under conditions of both lower and higher amounts of precipitation. When precipitation is low, there is an increase in survival with increasing precipitation, supporting the hypothesis that the availability of green fodder has increased. Similar findings have been recorded in other herbivores in dry habitats, such as wild rabbits (Oryctolagus cuniculus) in Australia [79] and the greater kudu (Tragelaphus strepsiceros) [80]. The exceptionally low precipitation rate in 2003 seems to be one of the reasons for high Age Class 1 mortality in that year. In previous studies of European hares, years such as 2003, with very low mean annual precipitation, were also associated with low abundance and low proportions of females breeding [11,16]. Dry years probably also resulted in food scarcity for European hares [39]. A study of the European hare’s diet showed that this species selects its food for high-energy content (crude fat and crude protein), and avoids crude fiber [81]. The quality of food is especially important for lactating does, since it influences the fat content of the milk [82]. Therefore, a reduction in the availability of high-quality food due to dry weather conditions may result in low body condition in Age Class 1 hares, which may lead to higher mortality in this age class.
In contrast, higher amounts of precipitation have been shown to be associated with decreased juvenile survival in various vertebrate species (e.g., [83,84,85,86,87,88,89]). The disease infection risk may be higher under more humid conditions [90,91,92], and energetic costs may increase when animals are exposed to rainy and cold weather [87,93,94]. Negative effects of high precipitation on Age Class 1 survival due to the increased probability of diseases such as coccidiosis and pseudotuberculosis are often described for European hares [11,24,36]. Especially in combination with low temperatures that lead to high energy use, increased precipitation may lead to increased mortality in the first weeks of life [95].
Excluding the year and its exceptionally low precipitation rate from parameter calculations produced a mean Age Class 1 survival of SA1 = 0.16. Recalculating λ on that basis gave a λGP of 1.13 without hunting and λGP = 0.97 with actual numbers of hares taken (14%), higher than the growth rates obtained when the year 2003 was included (λGP = 1.06, λGP = 0.91 with HR = 14%). As the elasticity analyses suggested, proportional changes in Age Class 1 survival had the highest impact on the population growth rate. The results of Age Class 1 survival rates linked with weather conditions indicate that just one year with unfavorable weather conditions can affect λ and population densities.
Climate trend analysis for the study area over the last 175 years showed that extremely dry or wet years are occurring with increasing frequency. With ongoing climate change [96,97], this problematic trend is likely to continue and become even more pronounced. One effect of climate change is the occurrence of frequent and intensive extreme climate events [98]. Droughts in Europe are projected to occur at increased frequency in the near future [99,100,101]. Hence wildlife, including the European hare, will face more frequent weather extremes in the future, with negative effects on annual and long-term population dynamics. For adaptive management, this shows that weather conditions, especially precipitation rates in the current year, must be taken into consideration when ascertaining the yearly quota. In dry or wet years, the Age Class 1 survival rate is likely to be low, and population growth will be impaired. In the long run, the collection of data on vital rates and population densities of European hares in relation to weather conditions will improve population modeling, and allow us to enhance simulations and calculate sustainable hunting quotas.
4.4. Evaluating Voluntary Hare-Hunting Quotas in Lower Austria
Both the voluntary quotas currently used by hunters [37] and the numbers of hares actually taken on hunting grounds proved to be sustainable when the Age Class 1 survival was ≥0.1. Census error was only important for years when SA1 ≤0.11, as the extinction risk increased to 95% with the highest census error (0.2). Under voluntary quotas, ISHR up to 21% were sustainable if the population had a mean Age Class 1 survival of ≥0.18. From an economical point of view, or in terms of maximum sustainable yields [102,103], the voluntary quota performed better than the numbers of hares actually taken, and more hares could have been harvested sustainably. In terms of numbers of hares actually taken, no more than 13% of the population was harvested, even in years when the population increased over the summer by ≥100%. In simulations without census error, population growth rates under the voluntary quota were considerably larger than those with numbers actually taken, despite lower Age Class 1 survival (voluntary quota: growth rates ≥50% with SA1 ≥ 0.2; numbers actually taken: growth rates = 45% with SA1 = 0.24). This might arise because the population is close to carrying capacity, so that higher exploitation may result in higher growth, and thus higher ISHR.
We found a negative correlation between fecundity and density, which was in line with the results of Frylestam [56], but in contrast to the results of Hackländer et al. [54]. Whether the correlation is negative or positive may play a crucial role in the sustainability of HRs and the difference between growth rates under the voluntary quota as currently used by hunters, numbers of hares actually taken, and the quota based on our model. We recommend that the correlation between fecundity and density should be tested as part of every analysis with the goal of estimating sustainable HRs in hunted wildlife populations. Furthermore, it is possible that density dependence also occurs in Age Class 1 survival rate, considering that estimated hare densities at the two hunting grounds were among the highest, and the mean Age Class 1 survival rates were among the lowest in Europe.
4.5. Management Implications
In hunting our two focal European hare populations in Lower Austria, the recommendations of Klansek and Arnold [37] should continue to be applied via a voluntary quota in order to meet the requirements of maximum sustainable yields. Harvesting more when growth is high and reducing the harvest in years with lower growth may lead to a sustainable and simultaneously fruitful exploitation of the hare population. For long-term conservation objectives, our simulations (under a wider range of conditions, including unpredictable events) suggest that lower HRs of 10% and 15% should be applied when the population densities are 45 hares/km2 and 190 hares/km2, respectively. Changes in populations may be sudden, and cannot be predicted from former densities or survival rates alone. Therefore, it is necessary to maintain careful annual monitoring of the population in order to rapidly detect any changes in population dynamics. Furthermore, trends in climatic conditions should be considered when setting hunting quotas, since they can also function as predictors of survival rates and population growth. The results of this study show clearly that harvesting hares in high numbers can only be sustainable in the long term if all the factors affecting the population are taken into consideration, and if hunting quotas are adjusted continuously. This is in line with the concept of adaptive management, which suggests that the effective management of natural resources can be enhanced by reducing the uncertainties and gaining understanding through careful planning, evaluation, and learning [3,4]. Collecting long-term data on European hare vital rates and densities in relation to weather conditions, predation, and disease outbreaks will improve the population model, providing more accurate simulations of sustainable HRs in the future. Today, hunters in central European countries customarily census numerous game species, including the hare, in spring and autumn to estimate the yearly sustainable HRs. Moreover, hunters report their hunting bags to state officials for statistical analysis. We recommend that the governments of European countries implement policies to collect long-term data on the vital rates and densities of various game species, particularly by training hunters to analyze and report census and hunting bag data more accurately. Moreover, we advise governments to assume responsibility for establishing population models in order to process the data that are collected and adjust hunting quotas for populations of various game species routinely, in order to ensure that hunting is sustainable in the long term.
Supplementary Materials
The following are available online at https://www.mdpi.com/2071-1050/11/10/2837/s1, S1: European hare—rules for the calculation of voluntary hunting quotas, by Klansek and Arnold [37], S2: Calculation of the specific survival rates of every age class, Figure S1: (a) The distribution of spring precipitation (mm), and (b) the distribution of annual precipitation (mm) in the study areas for the years 1841–2016, Table S1: Hunting bags and numbers of females, eye lenses, and uteri sampled each year, in each hunting ground, Table S2: Weather data (precipitation and temperature) from the study area for the years 1999–2004, Table S3: Precipitation data from the study region for the years 1841–2016, Table S4: Results of linear and quadratic regressions for the effects of different weather data variables on the response variables Age Class 1 and Age Class 3 survival.
Author Contributions
Conceptualization, K.H.; Formal analysis, C.K. and S.C.S.-B.; Investigation, E.K. and K.H.; Writing—original draft, C.K. and S.C.S.-B.; Writing—review & editing, C.K., S.C.S.-B., E.K. and K.H.; Supervision, K.H.; Funding acquisition, C.K. and K.H.
Funding
This research was funded by Deutsche Wildtier Stiftung and DAAD (KH), Academic-Social Association Austria (CK), the City of Vienna, the State of Lower Austria and Verein Grünes Kreuz (EK).
Acknowledgments
Data collection and placental scar analyses were carried out by Claudia Frisch, Elisabeth Sternbach, and Bea Ludescher. We are grateful to the hunting societies of Oberweiden and Zwerndorf for their logistic support. We thank Phil Stephens for his help with modeling and valuable comments on the manuscript.
Conflicts of Interest
The authors declare no conflict of interest. The funders had no role in the design of the study; in the collection, analyses, or interpretation of data; in the writing of the manuscript; or in the decision to publish the results.
References
- Brainerd, S. European Charter on Hunting and Biodiversity; Convention on the Conservation of European Wildlife and Natural Habitats; Standing Committee of the Bern Convention: Strasbourg, France, 2007. [Google Scholar]
- Trouwborst, A.; Hackländer, K. Wildlife policy and law in Europe. In North American Wildlife Policy and Law; Leopold, B.D., Kessler, W.B., Cummins, J.L., Eds.; Boone and Crocket Club: Missoula, MT, USA, 2018; pp. 425–443. [Google Scholar]
- Williams, B.K. Adaptive management of natural resources—Framework and issues. J. Environ. Manag. 2011, 92, 1346e1353. [Google Scholar] [CrossRef] [PubMed]
- Williams, B.K. Passive and active adaptive management: Approaches and an example. J. Environ. Manag. 2011, 92, 1371–1378. [Google Scholar] [CrossRef] [PubMed]
- Newey, S.; Dahl, F.; Kurki, S. Game Monitoring Systems Supporting the Development of Sustainable Hunting Tourism in Northern Europe: A Review of Current Practices; Report 66; Ruralia Institute, University of Helsinki: Helsinki, Finland, 2010. [Google Scholar]
- Milner-Gulland, E.J.; Akçakaya, H. Sustainability indices for exploited populations. Trends. Ecol. Evolut. 2001, 16, 686–692. [Google Scholar] [CrossRef]
- Saether, B.E. Hunting as sustainable resource utilisation experiences and challenges. Wildl. Biol. 2001, 7, 129–244. [Google Scholar] [CrossRef]
- Stephens, P.A.; Frey-Roos, F.; Arnold, W.; Sutherland, W.J. Sustainable exploitation of social species: A test and comparison of models. J. Appl. Ecol. 2002, 39, 629–642. [Google Scholar] [CrossRef]
- Begon, M.; Mortimer, M.; Thompson, D.J. Population Ecology: A Unified Study of Animals and Plants; Wiley-Blackwell: Oxford, UK, 1996. [Google Scholar]
- Oli, M.K.; Dobson, F.S. The relative importance of life history variables to population growth rate: Cole’s prediction revisited. Am. Nat. 2003, 161, 422–440. [Google Scholar] [CrossRef]
- Smith, R.K.; Harris, S.; Jennings, N.V. A quantitative analysis of the abundance and demography of European hares Lepus europaeus in relation to habitat type, intensity of agriculture and climate. Mamm. Rev. 2005, 35, 1–24. [Google Scholar] [CrossRef]
- Schai-Braun, S.C.; Hackländer, K. Family Leporidae. Hares and rabbits. In Handbook of the Mammals of the World; Lagomorphs and Rodents I; Lacher, T.E., Mittermeier, R.A., Wilson, D.E., Eds.; Lynx Editions: Barcelona, Spain, 2016; Volume 6, pp. 62–148. [Google Scholar]
- Smith, A.T.; Johnston, C.H. Lepus europaeus. The IUCN Red List of Threatened Species. 2008. Available online: www.iucnredlist.org (accessed on 19 February 2019).
- Tapper, S.C.; Barnes, R.F.W. Influence of farming practice on the ecology of the brown hare (Lepus europaeus). J. Appl. Ecol. 1986, 23, 39–52. [Google Scholar] [CrossRef]
- Pépin, D. Variation in survival of brown hare (Lepus europaeus) leverets from different farmland areas in the Paris basin. J. Appl. Ecol. 1989, 26, 13–23. [Google Scholar] [CrossRef]
- Slamečka, J.; Hell, P.; Jurčík, R. Brown hare in the Westslovak lowland. Acta Sci. Nat. Acad. Sci. Bohem. Brno 1997, 31, 1–115. [Google Scholar]
- Vaughan, N.; Lucas, E.-A.; Harris, S.; White, P.C.L. Habitat associations of European hares Lepus europaeus in England and Wales: Implications for farmland management. J. Appl. Ecol. 2003, 40, 163–175. [Google Scholar] [CrossRef]
- Rühe, F.; Hohmann, U. Seasonal locomotion and home-range characteristics of European hares (Lepus europaeus) in an arable region in central Germany. Eur. J. Wildl. Res. 2004, 50, 101–111. [Google Scholar] [CrossRef]
- Schmidt, N.M.; Asferg, T.; Forchhammer, M. C Long-term patterns in European brown hare population dynamics in Denmark: Effects of agriculture, predation and climate. BMC Ecol. 2004, 4, 15. [Google Scholar] [CrossRef] [PubMed]
- Smith, R.K.; Jennings, N.V.; Robinson, A.; Harris, S. Conservation of European hares Lepus europaeus in Britain: Is increasing habitat heterogeneity in farmland the answer? J. Appl. Ecol. 2004, 41, 1092–1102. [Google Scholar] [CrossRef]
- Smith, R.K.; Jennings, N.V.; Tataruch, F.; Hackländer, K.; Harris, S. Vegetation quality and habitat selection by European hares Lepus europaeus in pastural landscape. Acta Theriol. 2005, 50, 391–404. [Google Scholar] [CrossRef]
- Panek, M.; Kamieniarz, R.; Bresiński, W. The effect of experimental removal of red foxes Vulpes vulpes on spring density of brown hares Lepus europaeus in western Poland. Acta Theriol. 2006, 51, 187–193. [Google Scholar] [CrossRef]
- Báldi, A.; Faragó, S. Long-term changes of farmland game populations in a post-socialist country (Hungary). Agric. Ecosyst. Environ. 2007, 118, 307–311. [Google Scholar] [CrossRef]
- Karmiris, I.E.; Nastis, A.S. Intensity of livestock grazing in relation to habitat use by brown hares (Lepus europaeus). J. Zool. 2007, 271, 193–197. [Google Scholar] [CrossRef]
- Hansen, K. Reproduction in European hare in a Danish farmland. Acta Theriol. 1992, 37, 27–40. [Google Scholar] [CrossRef]
- Hackländer, K.; Zeitlhofer, C.; Ceulemans, T.; Suchentrunk, F. Continentality affects body condition and size but not yearly reproductive output in female European hares (Lepus europaeus). Mamm. Biol. 2011, 76, 662–664. [Google Scholar] [CrossRef]
- Jennings, N.V.; Smith, R.K.; Hackländer, K.; Harris, S.; White, P.C.L. Variation in demography, condition and dietary quality of hares Lepus europaeus from high-density and low-density populations. Wildl. Biol. 2006, 12, 179–189. [Google Scholar] [CrossRef]
- Aars, J.; Ims, R.A. Intrinsic and climatic determinants of population demography: The winter dynamics of tundra voles. Ecol. 2002, 83, 3449–3456. [Google Scholar] [CrossRef]
- Saether, B.-E.; Lillegård, M.; Grøtan, V.; Filli, F.; Engen, S. Predicting fluctuations of reintroduced ibex populations: The importance of density dependence, environmental stochasticity and uncertain population estimates. J. Anim. Ecol. 2007, 76, 326–336. [Google Scholar] [CrossRef]
- Rödel, H.G.; Dekker, J.J.A. Influence of weather factors on population dynamics of two lagomorph species based on hunting bag records. Eur. J. Wildl. Res. 2012, 58, 923–932. [Google Scholar] [CrossRef]
- Delgiudice, G.D.; Mech, L.D.; Seal, U.S. Effects of winter undernutrition on body composition and physiological profiles of white-tailed deer. J. Wildl. Manag. 1990, 54, 539–550. [Google Scholar] [CrossRef]
- Van Vuren, D.H.; Armitage, K.B. Duration of snow cover and its influence on life-history variation in yellow -bellied marmot. Can. J. Zool. 1991, 69, 1755–1758. [Google Scholar] [CrossRef]
- Fichet-Calvet, E.; Jomâa, I.; Ben Ismail, R.; Ashford, R.W. Reproduction and abundance of the fat sand rat (Psammomys obesus) in relation to weather conditions in Tunisia. J. Zool. 1999, 248, 15–26. [Google Scholar] [CrossRef]
- Loison, A.; Langvatn, R.; Solberg, E.J. Body mass and winter mortality in red deer calves: Disentangling sex and climate effects. Ecography 1999, 22, 20–30. [Google Scholar] [CrossRef]
- Neumann, F.; Lipp, M. Jagdstatistik 2017/18. STATISTIK AUSTRIA; Bundesanstalt Statistik Österreich: Wien, Austria, 2018. [Google Scholar]
- Zörner, E. Der Feldhase; Spektrum Akademischer Verlag: Heidelberg, Germany, 1996. [Google Scholar]
- Klansek, E.; Arnold, W. Bejagungsplan beim Feldhasen. Österreichisches Weidwerk 1998, 3, 41–42. [Google Scholar]
- Averianov, A.; Niethammer, J.; Pegel, M. Lepus europaeus Pallas, 1778-Feldhase. In Handbuch der Säugetiere Europas; Niethammer, J., Krapp, F., Eds.; AULA-Verlag: Wiesbaden, Germany, 2003; Volume 3/II Hasentiere, pp. 35–104. [Google Scholar]
- Frylestam, B. Structure, size and dynamics of three European hare populations in Southern Sweden. Acta Theriol. 1979, 24, 449–464. [Google Scholar] [CrossRef]
- Marboutin, E.; Bray, Y.; Péroux, R.; Mauvy, B.; Lartiges, A. Population dynamics in European hare: Breeding parameters and sustainable harvest rates. J. Appl. Ecol. 2003, 40, 580–591. [Google Scholar] [CrossRef]
- Kurzejeski, E.W.; Vangilder, L.D.; Lewis, J.B. Survival of wild turkey hens in North Missouri. J. Wildl. Manag. 1987, 51, 188–193. [Google Scholar] [CrossRef]
- Vangilder, L.D.; Kurzejeski, E.W.; Kimmel-Truitt, V.L.; Lewis, J.B. Reproductive parameters of wild turkey hens in North Missouri. J. Wildl. Manag. 1987, 51, 535–540. [Google Scholar] [CrossRef]
- Stevens, B.S.; Bence, J.R.; Porter, W.F.; Parent, C.J. Structural uncertainty limits generality of fall harvest strategies for wild turkeys. J. Wildl. Manag. 2017, 81, 617–628. [Google Scholar] [CrossRef]
- Klansek, E.; Gansterer, A. Niederwild-Musterreviere in Niederösterreich. Österreichs Weidwerk 1988, 88, 16–20. [Google Scholar]
- Langbein, J.; Hutchings, M.R.; Harris, S.; Stoate, C.; Tapper, S.C.; Wray, S. Techniques for assessing the abundance of brown hares Lepus europaeus. Mamm. Rev. 1999, 29, 93–116. [Google Scholar] [CrossRef]
- Rieck, W. Der Feldhase. Deutscher Jagdschutzverband e.V.: Mainz (Niederwildausschuß, Merkblatt Nr. 4). 1977. [Google Scholar]
- Broekhuizen, S.; Maaskamp, F. Age determination in the European hare (Lepus europaeus PALLAS) in the Netherlands. Z. Säugetierkd. 1979, 44, 162–175. [Google Scholar] [CrossRef]
- Pielowski, Z.; Pinkowski, M. A 25-year study of a hare population on the hunting grounds of the research station at Czempin. In Hare; Polish hunting Association: Warszawa, Poland, 1992; pp. 143–156. [Google Scholar]
- Marboutin, E.; Péroux, R. Survival pattern of European hare in a decreasing population. J. Appl. Ecol. 1995, 32, 809–816. [Google Scholar] [CrossRef]
- Marboutin, E.; Hansen, K. Survival rates in a non harvested brown hare population. J. Wildl. Manag. 1998, 62, 772–779. [Google Scholar] [CrossRef]
- Klansek, E.; Vavra, I. Besatzermittlung und Bejagungsplan beim Feldhasen. Österreichisches Weidwerk 1993, 3, 48–49. [Google Scholar]
- Roedenbeck, I.A.; Voser, P. Effects of roads on spatial distribution, abundance and mortality of brown hare (Lepus europaeus) in Switzerland. Eur. J. Wildl. Res. 2008, 54, 425–437. [Google Scholar] [CrossRef]
- Suchentrunk, F.; Willing, R.; Hartl, G.B. On eye lens weights and other age criteria of the Brown hare (Lepus europaeus Pallas, 1778). Z. Säugetierkd. 1991, 56, 365–374. [Google Scholar]
- Hackländer, K.; Frisch, C.; Klansek, E.; Steineck, T.; Ruf, T. Die Fruchtbarkeit weiblicher Feldhasen (Lepus europaeus) aus Revieren mit unterschiedlicher Populationsdichte. Z. Jagdwiss. 2001, 47, 100–110. [Google Scholar] [CrossRef]
- Bray, Y.; Marboutin, E.; Péroux, R.; Ferron, J. Reliability of stained placental-scar counts in European hares. Wildl. Soc. Bull. 2003, 31, 237–246. [Google Scholar] [CrossRef]
- Frylestam, B. Reproduction in the European hare in southern Sweden. Holarct. Ecol. 1980, 3, 74–80. [Google Scholar] [CrossRef]
- Bensinger, S. Untersuchungen zur Reproduktionsleistung von Feldhäsinnen (Lepus europaeus PALLAS, 1778), Gleichzeitig ein Beitrag zur Ursachenfindung des Populationsrückganges dieser Wildtierart. Ph.D. Thesis, Universität Leipzig, Leipzig, Germany, 2002. [Google Scholar]
- Bray, Y.; Devillard, S.; Marboutin, E.; Mauvy, B.; Péroux, R. Natal dispersal of European hare in France. J. Zool. 2007, 273, 426–434. [Google Scholar] [CrossRef]
- Caswell, H. Matrix Population Models: Construction, Analysis and Interpretation; Sinauer Inc.: Sunderland, MA, USA, 2001. [Google Scholar]
- Coulson, T.; Gaillard, J.-M.; Festa-Bianchet, M. Decomposing the variation in population growth into contributions from multiple demographic rates. J. Anim. Ecol. 2005, 74, 789–801. [Google Scholar] [CrossRef] [Green Version]
- Citta, J.J.; Mills, L.S. What do demographic sensitivity analyses tell us about controlling brown-headed cowbirds? Stud. Avian Biol. 1999, 18, 121–134. [Google Scholar]
- Zeileis, A.; Grothendieck, G. zoo: S3 Infrastructure for regular and irregular time series. J. Stat. Softw. 2005, 14, 1–27. [Google Scholar] [CrossRef]
- Faraway, J.J. Extending the Linear Model with R. Texts in Statistical Science; Chapman and Hall/CRC: London, UK, 2006. [Google Scholar]
- R Development Core Team. R: A Language and Environment for Statistical Computing; R Foundation for Statistical Computing: Vienna, Austria, 2018; Available online: www.R-project.org (accessed on 10 October 2018).
- Ahrens, M. Zur Situation des Feldhasen (Lepus europaeus Pallas, 1778) im Land Brandenburg sowie einige Möglichkeiten zur Stabilisierung und Hebung der Besätze. Beiträge zur Jagd- und Wildforschung 2000, 25, 215–225. [Google Scholar]
- Bertóti, I. The effect of modern corn production system on hare production. A Vadgazdalkodas Fejlesztese 1975, 15, 33–41. [Google Scholar]
- Oli, M.K.; Armitage, K.B. Yellow-bellied marmot population dynamics: Demographic mechanisms of growth and decline. Ecology 2004, 85, 2446–2455. [Google Scholar] [CrossRef]
- Beissinger, S.R.; Westphal, M.I. On the use of demographic models of population viability in endangered species management. J. Wildl. Manag. 1998, 62, 821–841. [Google Scholar] [CrossRef]
- Beissinger, S.R. Demography, environmental uncertainty and the evolution of mate desertion in white snail kite. Ecology 1986, 67, 1445–1459. [Google Scholar] [CrossRef]
- Arino, A.; Pimm, S.L. On the nature of population extremes. Evol. Ecol. 1995, 9, 429–443. [Google Scholar] [CrossRef]
- Possingham, A.; Lindenmayr, D.; Norton, T. A framework for the improvement of threatened species based on population viability analyses (PVA). Pac. Conserv. Biol. 1993, 1, 38–45. [Google Scholar]
- Ralls, K.; Taylor, B.L. How viable is population viability analysis. In The Ecological Basis of Conservation: Heterogeneity, Ecosystems, and Biodiversity; Pickett, S.B.A., Ostfeld, R.S., Shachak, M., Likens, G.E., Eds.; Chapman & Hall: New York, NY, USA, 1997; pp. 228–235. [Google Scholar]
- Coulson, T.; Mace, G.M.; Hudson, E.; Possingham, H. The use and abuse of population viability analysis. Trends. Ecol. Evolut. 2001, 16, 219–221. [Google Scholar] [CrossRef] [Green Version]
- Brook, W.; O’Grady, J.; Chapman, A.; Burgman, B.; Akcakaya, H.; Frankham, R. Predictive accuracy of population viability analysis in conservation biology. Nature 2000, 404, 385–387. [Google Scholar] [CrossRef] [PubMed]
- Ellner, S.P.; Fieberg, J.; Ludwig, D.; Wilcox, C. Precision of population viability analysis. Conserv. Biol. 2002, 16, 258–261. [Google Scholar] [CrossRef]
- Sutherland, W. Sustainable exploitation: A review of principles and methods. Wildl. Biol. 2001, 7, 131–140. [Google Scholar] [CrossRef]
- Shenk, T.; White, G.; Burnham, K. Sampling-variances effects on detecting density dependence from temporal trends in natural populations. Ecol. Monogr. 1998, 68, 445–463. [Google Scholar] [CrossRef]
- Freckleton, R.P.; Watkinson, A.R.; Green, R.E.; Sutherland, W.J. Census error and the detection of density dependence. J. Anim. Ecol. 2006, 75, 837–851. [Google Scholar] [CrossRef] [Green Version]
- Dudzinski, M.L.; Mykytowycz, R. Analysis of weights and growth rates of an experimental colony of wild rabbits, Oryctolagus cuniculus (L.). CSIRO Wildl. Res. 1960, 5, 102–115. [Google Scholar] [CrossRef]
- Owen-Smith, N. Demography of a large herbivore, the greater kudu Tragelaphus strepsiceros, in relation to rainfall. J. Anim. Ecol. 1990, 59, 893–913. [Google Scholar] [CrossRef]
- Schai-Braun, S.C.; Reichlin, T.S.; Ruf, T.; Klansek, E.; Tataruch, F.; Arnold, W.; Hackländer, K. The European hare (Lepus europaeus): A picky herbivore searching for plant parts rich in fat. PLoS ONE 2015, 10, e0134278. [Google Scholar] [CrossRef]
- Hackländer, K.; Tataruch, F.; Ruf, T. The effect of dietary fat content on lactation energetics in the European hare (Lepus europaeus). Physiol. Biochem. Zool. 2002, 75, 19–28. [Google Scholar] [CrossRef] [PubMed]
- Palomares, F. The negative impact of heavy rains on the abundance of Mediterranean population of European rabbits. Mamm. Biol. 2003, 68, 224–234. [Google Scholar] [CrossRef]
- Rödel, H.G.; Bora, A.; Kaetzke, P.; Khaschei, M.; Hutzelmeyer, H.; von Holst, D. Over-winter survival in subadult European rabbits: Weather effects, density dependence, and the impact of individual characteristics. Oecol. 2004, 140, 566–576. [Google Scholar] [CrossRef] [PubMed]
- Reed, A.W.; Kaufman, G.A.; Sandercock, B.K. Demographic response of a grassland rodent to environmental variability. J. Mammal. 2007, 88, 982–988. [Google Scholar] [CrossRef]
- Foley, C.; Pettorelli, N.; Foley, L. Severe drought and calf survival in elephants. Biol. Lett. 2008, 4, 541–544. [Google Scholar] [CrossRef] [PubMed] [Green Version]
- Rödel, H.G.; Starkloff, A.; Seltmann, M.W.; Prager, G.; von Holst, D. Causes and predictors of nest mortality in a European rabbit population. Mamm. Biol. 2009, 74, 198–209. [Google Scholar] [CrossRef]
- Fisher, R.J.; Wellicome, T.I.; Bayne, E.M.; Poulin, R.G.; Todd, L.D.; Ford, A.T. Extreme precipitation reduces reproductive output of an endangered raptor. J. Appl. Ecol. 2015, 52, 1500–1508. [Google Scholar] [CrossRef]
- Qu, J.; Russell, J.C.; Ji, W.; Yang, M.; Chen, Q.; Li, W.; Zhang, Y. Five-year population dynamics of plateau pikas (Ochotona curzoniae) on the east of Tibetan Plateau. Eur. J. Wildl. Res. 2017, 63, 51. [Google Scholar] [CrossRef]
- Rödel, H.G.; Starkloff, A. Social environment and weather during early life influence gastro-intestinal parasite loads in a group-living mammal. Oecologia 2014, 176, 389–398. [Google Scholar] [CrossRef]
- Stromberg, B.E. Environmental factors influencing transmission. Vet. Parasitol. 1997, 72, 247–264. [Google Scholar] [CrossRef]
- O’Connor, L.J.; Walkden-Brown, S.W.; Kahn, L.P. Ecology of the free-living stages of major trichostrongylid parasites of sheep. Vet. Parasitol. 2006, 142, 1–15. [Google Scholar] [CrossRef]
- Myers, K.; Bults, H.G.; Gilbert, N. Stress in the rabbit. In Proceedings of the World Lagomorph Conference, Guleph, ON, Canada, 12–16 August 1979; pp. 90–97. [Google Scholar]
- Seltmann, M.W.; Ruf, T.; Rödel, H.G. Effects of body mass and huddling on resting metabolic rates of post-weaned European rabbits under different simulated weather conditions. Funct. Ecol. 2009, 23, 1070–1080. [Google Scholar] [CrossRef]
- Hackländer, K.; Arnold, W.; Ruf, T. Postnatal development and thermoregulation in the precocial European hare (Lepus europaeus). J. Comp. Physiol. B. 2002, 172, 183–190. [Google Scholar] [CrossRef] [PubMed]
- Fischlin, A.; Midgley, G.F.; Price, J.T.; Leemans, R.; Gopal, B.; Turley, C.; Rounsevell, M.D.A.; Dube, O.P.; Tarazona, J.; Velichko, A.A. Ecosystems, their properties, goods, and services. In Climate Change 2007: Impacts, Adaptation and Vulnerability; Contribution of Working Group II to the Fourth Assessment Report of the Intergovernmental Panel on Climate Change; Parry, M.L., Canziani, O.F., Palutikof, J.P., van der Linden, P.J., Hanson, C.E., Eds.; Cambridge University Press: Cambridge, UK, 2007. [Google Scholar]
- IPCC. Climate Change 2007: Impacts, Adaptation and Vulnerability; Contribution of Working Group II to the Fourth Assessment Report of the Intergovernmental Panel on Climate Change; Parry, M.L., Canziani, O.F., Palutikof, J.P., van der Linden, P.J., Hanson, C.E., Eds.; Cambridge University Press: Cambridge, UK, 2007. [Google Scholar]
- IPCC. Managing the Risks of Extreme Events and Disasters to Advance Climate Change Adaptation; A Special Report of Working Groups I and II of the Intergovernmental Panel on Climate Change; Field, C.B., Barros, V., Stocker, T.F., Qin, D., Dokken, D.J., Ebi, K.L., Mastrandrea, M.D., Mach, K.J., Plattner, G., Allen, S.K., et al., Eds.; Cambridge University Press: Cambridge, UK; New York, NY, USA, 2012. [Google Scholar]
- Nakićenović, N.; Davidson, O.; Davis, G.; Grübler, A.; Kram, T.; La Lebre Rovere, E.; Metz, B.; Morita, T.; Pepper, W.; Pitcher, H.; et al. Emissions Scenarios; A Special Report of the Intergovernmental Panel on Climate Change; Cambridge University Press: Cambridge, UK, 2000. [Google Scholar]
- Spinoni, J.; Naumann, G.; Vogt, J. Spatial patterns of European droughts under a moderate emission scenario. Adv. Sci. Res. 2015, 12, 179–186. [Google Scholar] [CrossRef] [Green Version]
- Stagge, J.H.; Rizzi, J.; Tallaksen, L.M.; Stahl, K. Future Meteorological Drought: Projections of Regional Climate Models for Europe; Drought R&SPI Technical Report No. 25. Oslo, Norway, 2015. Available online: http://www.eu-drought.org/media/default.aspx/emma/org/10859960/DROUGHT+RSPI+Technical+Report+No.+25+-+Future+Meteorological+Drought+Projections+of+Regional+Climate.pdf (accessed on 10 October 2018).
- McCullough, D. The George Reserve Deer Herd: Population Ecology of a K-Selected Species; University of Michigan Press: Ann Arbor, MI, USA, 1979. [Google Scholar]
- McCullough, D. Population manipulations of North American deer Odocoileuas app.: Balancing high yield with sustainability. Wildl. Biol. 2001, 7, 160–169. [Google Scholar] [CrossRef]
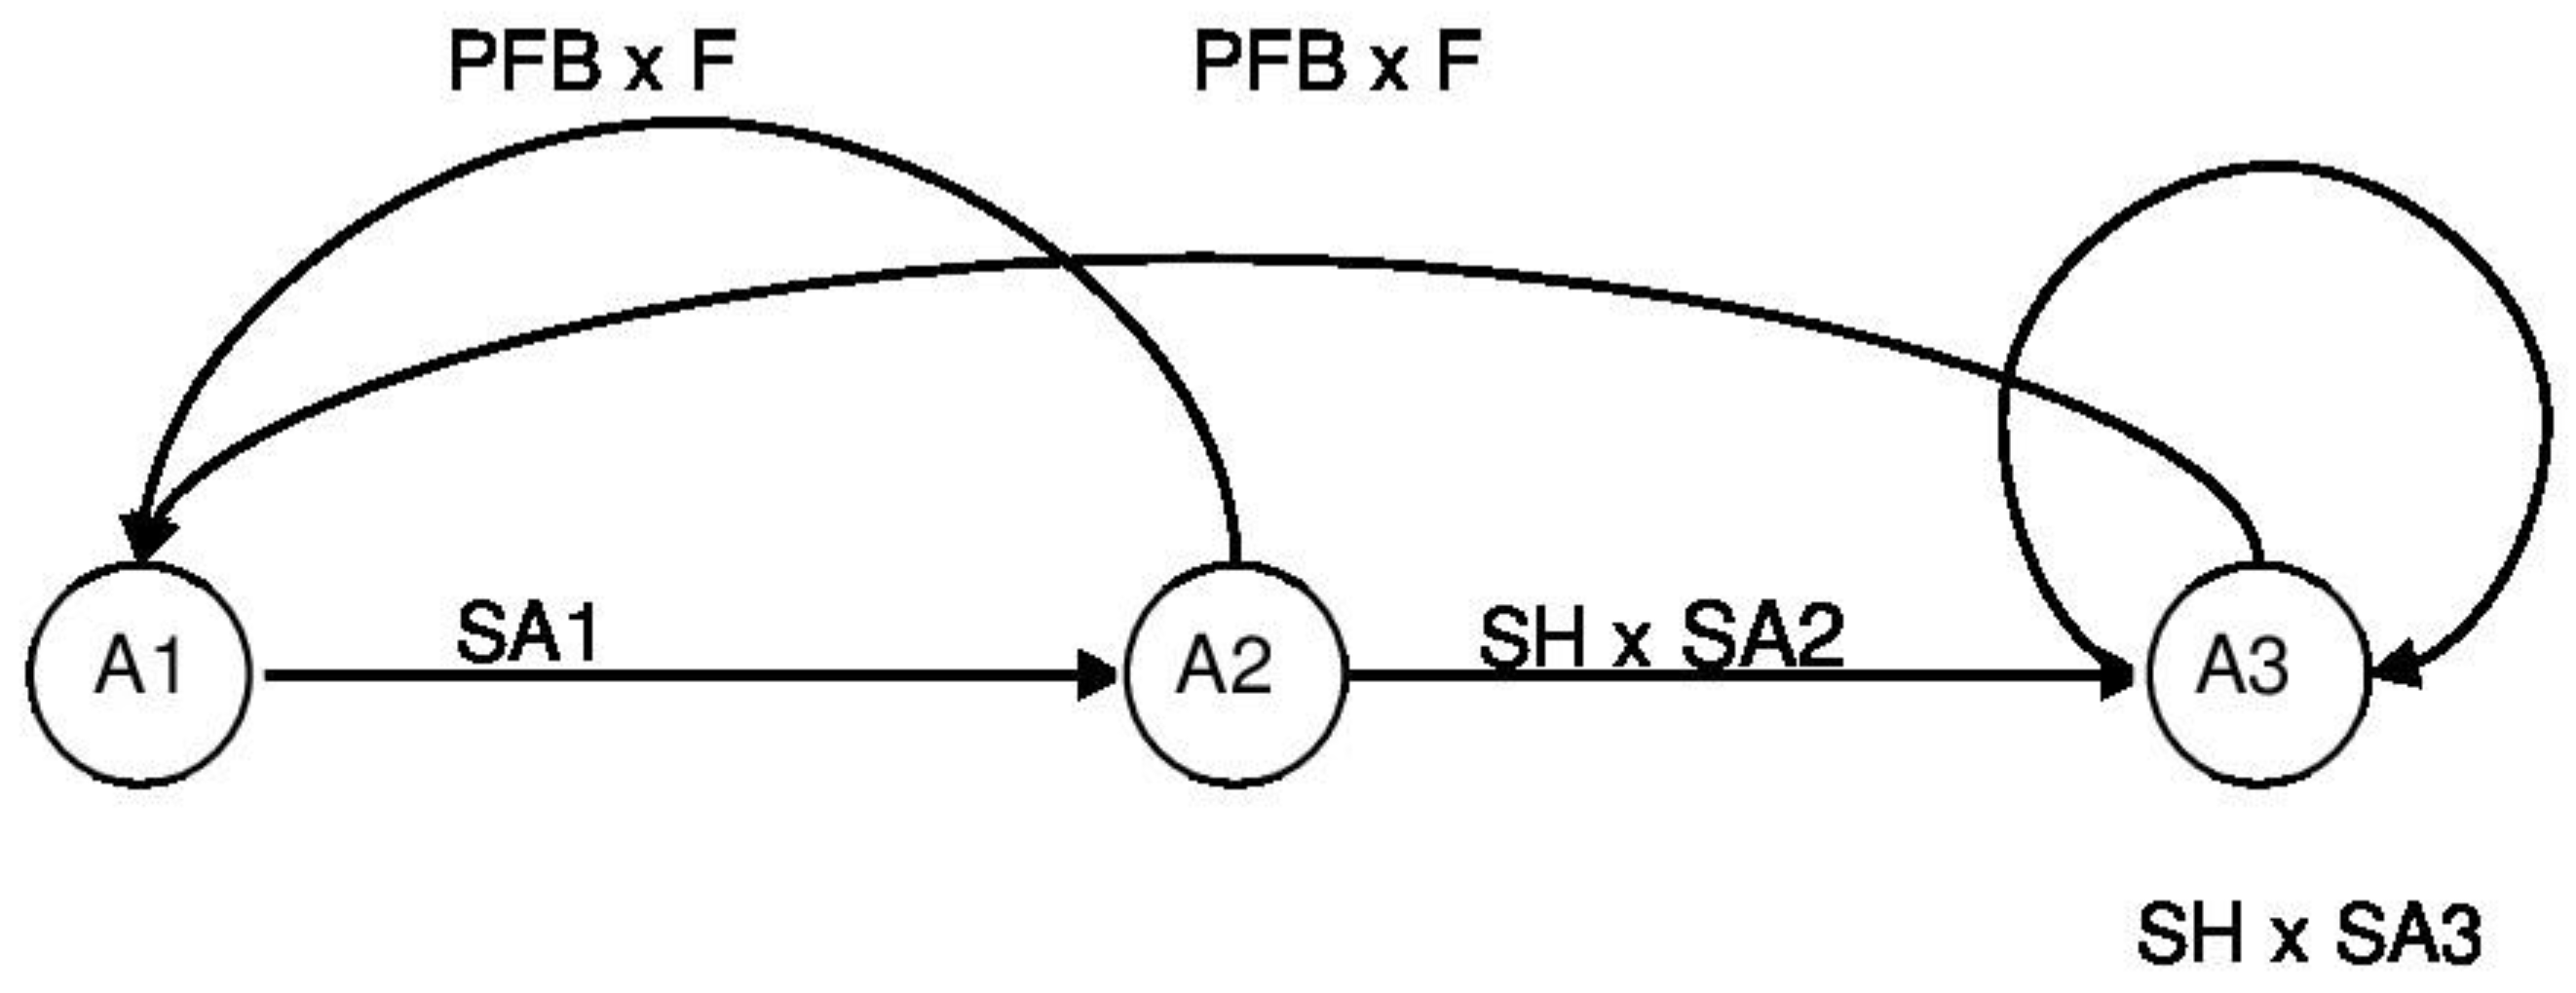
Figure 1.
Lifecycle of European hare: hares of Age Class 1 (A1) survive with their specific survival rate (SA1) and become Age Class 2 animals (A2). After surviving hunting (SH) and the rest of the year (SA2), Age Class 2 animals become Age Class 3 animals (A3); they remain in that age class if they also survive hunting and the rest of the year (SA3). Age Class 2 and Age Class 3 contribute to Age Class 1 by their reproduction, which is defined as the product of the proportion of females breeding (PFB) and their fecundity (F; number of leverets born per breeding female per year).

Figure 2.
Densities and vital rates of the European hare populations in the two hunting grounds Zwerndorf (ZD, triangles) and Oberweiden (OW, dots), in Lower Austria during the years 1999–2004. Hare densities (a) were measured by spotlight counts in spring, whereas Age Class 1 survival (b), Age Class 3 survival (c), proportion of females breeding (d), and fecundity (e) were calculated by analyzing hunting bags and spring hare numbers. Dashed lines represent unknown progressions due to missing spotlight counts in OW in the year 2000.

Figure 3.
Indices of sustainable harvest rates (ISHR) as a function of the parameters with the highest elasticities. Harvest rates (HR) from 0 to 50% were plotted against a possible range of Age Class 1 and Age Class 3 survival rates. The grey rectangle indicates the range of survival rates observed in this study. HRs of 5% were estimated to be sustainable for the generic population (with mean values for survival, indicated by the black dot).

Figure 4.
Results of a population viability analysis with initial population sizes (I) of 500 to 10,000 hares on a hypothetical hunting ground of 50 km2 and simulated harvest rates (HR) from 0 to 40%. Density dependence was accommodated in the model by adjusting the fecundity according to current population density. A total of 1000 Monte Carlo runs were performed for every I × HR combination over a time period of 25 years. The sustainability threshold was set at ≤5% of simulations ending in quasi-extinction (<1 hare/km2). HRs of 15% were only sustainable if the population size was >9500 hares.

Figure 5.
Curve-fitting regression analysis of (a) annual precipitation (R2quadratic = 0.83, p = 0.002) on Age Class 1 survival in areas Oberweiden (OW) and Zwerndorf (ZD) between 1999–2004. The regression line is statistically significant. For the years 1841–2016, (b) shows the moving variance in annual precipitation for a rolling time window with a window width of 10 years. The correlation is statistically significant.


Table 1.
Overview of all the notations used for the parameters in the matrix model.
| Parameter | Notation |
|---|---|
| Age Class 1 | A1 |
| Age Class 2 | A2 |
| Age Class 3 | A3 |
| Age Class 1 survival rate | SA1 |
| Age Class 2 survival rate | SA2 |
| Age Class 3 survival rate | SA3 |
| Hunting survival rate | SH |
| Year | t |
| Proportion of females breeding | PFB |
| Fecundity (leverets/breeding female/year) | F |
| Contribution of Age Class 1 | CA1 |
| Contribution of Age Class 3 | CA3 |
| Hare numbers | N |
| Hare numbers in Age Class 2 | NA2 |
| Hare numbers in Age Class 3 | NA3 |
| Proportion of Age Class 2 | PA2 |
| Proportion of Age Class 3 | PA3 |
| Proportion of Age Class i | PAi |
Table 2.
Spring densities, survival rates, and reproductive parameters of European hares from the hunting grounds Oberweiden (OW, 1999 and 2001–2004) and Zwerndorf (ZD, 1999–2003), and the generic population (GP, 1999–2004). Values are means (± standard deviations).
Table 2.
Spring densities, survival rates, and reproductive parameters of European hares from the hunting grounds Oberweiden (OW, 1999 and 2001–2004) and Zwerndorf (ZD, 1999–2003), and the generic population (GP, 1999–2004). Values are means (± standard deviations).
| Hunting Ground | Spring Densities | Age Class 3 Survival | Age Class 1 Survival | Proportion of Females Breeding | Fecundity (Leverets/Breeding Female/Year) |
|---|---|---|---|---|---|
| OW | 117 (±31.4) | 0.51 (±0.08) | 0.14 (±0.08) | 0.92 (±0.08) | 12.14 (±1.3) |
| ZD | 121 (±26.4) | 0.61 (±0.1) | 0.14 (±0.06) | 0.96 (±0.02) | 12.67 (±0.64) |
| GP | 119 (±27.43) | 0.56 (±0.1) | 0.14 (±0.07) | 0.94 (±0.06) | 12.40 (±1.0) |
Table 3.
Slopes and λ (population growth rate) unit change of each vital rate of the generic population. Parameters were plotted against λ to visualize the impact strength of each single element on λ. Parameters with steeper slopes had a stronger impact on λ than parameters with flatter slopes. Consequently, proportional changes in parameter values in Age Class 1 and Age Class 3 survival had the greatest impact on λ, followed by the survival of hunting. Reproduction parameters showed only low elasticities.
| Parameter | Slope | λ Unit Change |
|---|---|---|
| Age Class 1 survival | 3.60 | 0.72 |
| Age Class 3 survival | 1.54 | 0.62 |
| Survival of hunting | 1.06 | 0.52 |
| Proportion of females breeding | 0.54 | 0.08 |
| Fecundity | 0.04 | 0.20 |
© 2019 by the authors. Licensee MDPI, Basel, Switzerland. This article is an open access article distributed under the terms and conditions of the Creative Commons Attribution (CC BY) license (http://creativecommons.org/licenses/by/4.0/).
Share and Cite
MDPI and ACS Style
Schai-Braun, S.C.; Kowalczyk, C.; Klansek, E.; Hackländer, K. Estimating Sustainable Harvest Rates for European Hare (Lepus Europaeus) Populations. Sustainability 2019, 11, 2837. https://doi.org/10.3390/su11102837
AMA Style
Schai-Braun SC, Kowalczyk C, Klansek E, Hackländer K. Estimating Sustainable Harvest Rates for European Hare (Lepus Europaeus) Populations. Sustainability. 2019; 11(10):2837. https://doi.org/10.3390/su11102837
Chicago/Turabian StyleSchai-Braun, Stéphanie C., Christine Kowalczyk, Erich Klansek, and Klaus Hackländer. 2019. "Estimating Sustainable Harvest Rates for European Hare (Lepus Europaeus) Populations" Sustainability 11, no. 10: 2837. https://doi.org/10.3390/su11102837
Note that from the first issue of 2016, this journal uses article numbers instead of page numbers. See further details here.