Does Fallowing Cultivated Land Threaten Food Security? Empirical Evidence from Chinese Pilot Provinces


1
School of Geographical Sciences, Southwest University, Chongqing 400715, China
2
Division of Geography and Tourism, Department of Earth and Environmental Sciences, KU Leuven, 3001 Leuven, Belgium
*
Author to whom correspondence should be addressed.
Sustainability 2019, 11(10), 2836; https://doi.org/10.3390/su11102836
Submission received: 11 April 2019
/
Revised: 13 May 2019
/
Accepted: 15 May 2019
/
Published: 18 May 2019
(This article belongs to the Section Sustainability in Geographic Science)
Abstract
:Facing worsening problems, including the decreasing amount, quality, and deterioration of land ecosystems, cultivated land needs protective measures. China has been conducting an experimental fallow policy to deter these problems in five pilot provinces since 2016. However, inadequate and inconclusive studies of the impacts of fallow policy on food security have motivated the authors to fill this knowledge gap and to provide evidence for policy-making. Using the modified cultivated land pressure model, this study explores the cultivated land pressure at three scales (nation, province, and prefecture) to determine the capacity of feeding people using cultivated land, and examines the impact of fallowing cultivated land. There are three main findings. First, the cultivated land pressure in China continually decreased during the period of 2000–2016, and would remain in a decreasing trend during 2017–2020 even if the measures implemented doubled the fallowing scale every year. Second, the spatial patterns of the cultivated land pressure between the provincial and prefectural scale show a similar overview, with some nuanced disparities. Finally, the five pilot provinces show various amplitudes of variation in cultivated land pressure, ranging from 0.017% to 9.027% under three fallow scale scenarios. Thus, the results of this research support the argument that fallow policy will not threaten food security at a national and provincial scale, based on the current fallow scale and enlargement pace. The deeper understanding of the impact of fallow policy provides a scientific reference for policymaking and calls for further studies focusing on a more comprehensive measurement of cultivated land pressure and optimization fallow scale.
1. Introduction
Cultivated land is one of the most important resources for both the agricultural sector and the national economy [1,2]. However, cultivated land has been facing a host of qualitative and quantitative problems, as well as ecological issues. In terms of the amount of cultivated land, because of a significant spatial shift of cultivated land to built-up areas during the past several decades [3,4], highly productive cultivated land has tended to decrease. To counter the dwindling tendency, land exploitation and land consolidation are applied to offset the cultivated land occupied by urbanization and industrialization [5,6]. While land exploitation could provide newly cultivated land, grain productivity has been undergoing a decreasing trend. That is because states depend heavily on land exploitation rather than land consolidation [7], which can provide higher amounts of arable land with a high productivity. Ecological problems resulting from urban sprawl and polluting industrialization are another issue. Considerable heavy metal contaminant [8], water and soil loss [9], desertification [10], and so on have occurred. Thus, cultivated land in China is unsustainable and needs protective measures.
The implementation of land fallowing is one of the solutions to alleviate the problems of cultivated land [11]. Previous works have shown that fallowing is a sound means to maintain soil fertility and provide an opportunity to produce a good medium for crop planting [12]. For example, the United States (U.S.) and the European Union (E.U.) have applied a land fallowing system and achieved significant success in both cultivated land protection and grain demand–consumption regulation [13,14,15]. Specifically, a fallow policy has been carried out in the U.S. for several decades, and has shown numerous benefits to the ecosystem [16] and grain supply–demand system [17]. The E.U. has used a fallow policy to address fluctuating grain output and consumption [14]. Other countries that have applied a fallow policy to solve cultivated land problems include Japan, Nigeria, Uganda, and Belize [18,19,20,21].
Considerable literature regarding fallow policies has been produced, focusing on the necessity and feasibility of fallowing. For example, Thomsen et al. found that it is crucial to fallow in order to control perennial weeds for a better long-run tillage condition [22]. Schillinger et al. compared three fallow management systems to argue that fallow could mediate local environmental concerns to some extent [23]. Regarding fallow practice, in a small scale, fallow programs design for strawberry land have been explored [24]; in a larger scale, the distribution of fallow areas in China has been mapped showing various spatial patterns. [25] Discussions on the benefit of fallow farmers have been conducted in various nations and at different levels, which show that land fallowing has great positive impacts on ecosystem and economy aspects [26,27,28]. Plus, Xie et al. examined the willingness and behavior of fallow policy, and found that most farmers in Hebei, China, favor this policy [29]. However, the literature on fallowing in China is relatively insufficient. Yang et al. recently summarized a land fallowing and crop rotation system, as well as their variations from the slavery period to the current policy experimentations in China [30]. Chen and Yang developed a theoretical framework to construct a fallow system considering the reality of contemporary China [31]. The impacts of fallowing on the economy [32] and natural resources [33,34] of China have been discussed, but the societal effects have not yet been explored. A mismatching fallow policy could result in a problem in grain volume security, which is serious in China, where there are approximately 1.4 billion people, but only 0.10 km2 of cultivated land per capita [35]. Thus, it is of fundamental importance to determine whether a fallow policy would pose a threat to food security.
There is scholarly consensus that food security is a top priority for many governments worldwide [36], and a voluminous body of work has focused on it. First, indicators such as experience-based coping strategies and dietary diversity are used to measure food security [37]. Second, focusing on food security governance, some argue food security should be regarded as a “wicked problem” rather than an optimistic problem-solving exercise, and subnational level governance could provide more valuable insight [38]. Third, some new frontiers in food security are burgeoning. Rather than only establishing a quantified target and standards, the food security problem gradually becomes a process consisting of uncertainties, trials, and errors, as well as interwoven administrative powers [39]. Nevertheless, similar to the explanation of the Food and Agriculture Organization (FAO) of the U.S., most important are the four pillars of food security, namely: availability, access, utilization, and stability [40]. In this study, the availability of food is the most emphasized for food security; that is, it is defined with an emphasis on stable local food supply.
To fill the knowledge gap, where seldom research has discussed the impact on food security of fallow policy, we need to measure the degree of food security under the land fallowing policy. In this sense, the main purpose of this paper is to explore to what extent the fallow policy would influence food provisions from the cultivated land in China. The findings should make an important contribution to policy-making about land fallowing of the central state, especially at a policy experimentation stage, in China. It is also a bridge between research and policy practice [31], which can improve the precision of policy conduction at a lower scale.
2. Method
2.1. Research Area and Data Sources
As shown in the website of the World Bank, China is the fourth largest country in the world, covering 9,562,910 km2 [41]. At the same time, approximately 1.4 billion people live in China. Thus, food security is among some of the extremely important issues China faces. If the cultivated land under an inappropriate land fallowing scale fails to provide sufficient food to feed the population, disastrous consequences would ensue. Assessing the influence of fallow policy on this country could be an essential issue. In addition, the Chinese government plans to regularly carry out a nationwide land fallowing policy, following the experimental implementation in five provinces. Understanding the change resulting from this policy will help in facilitating the effective implementation of the fallow policy.
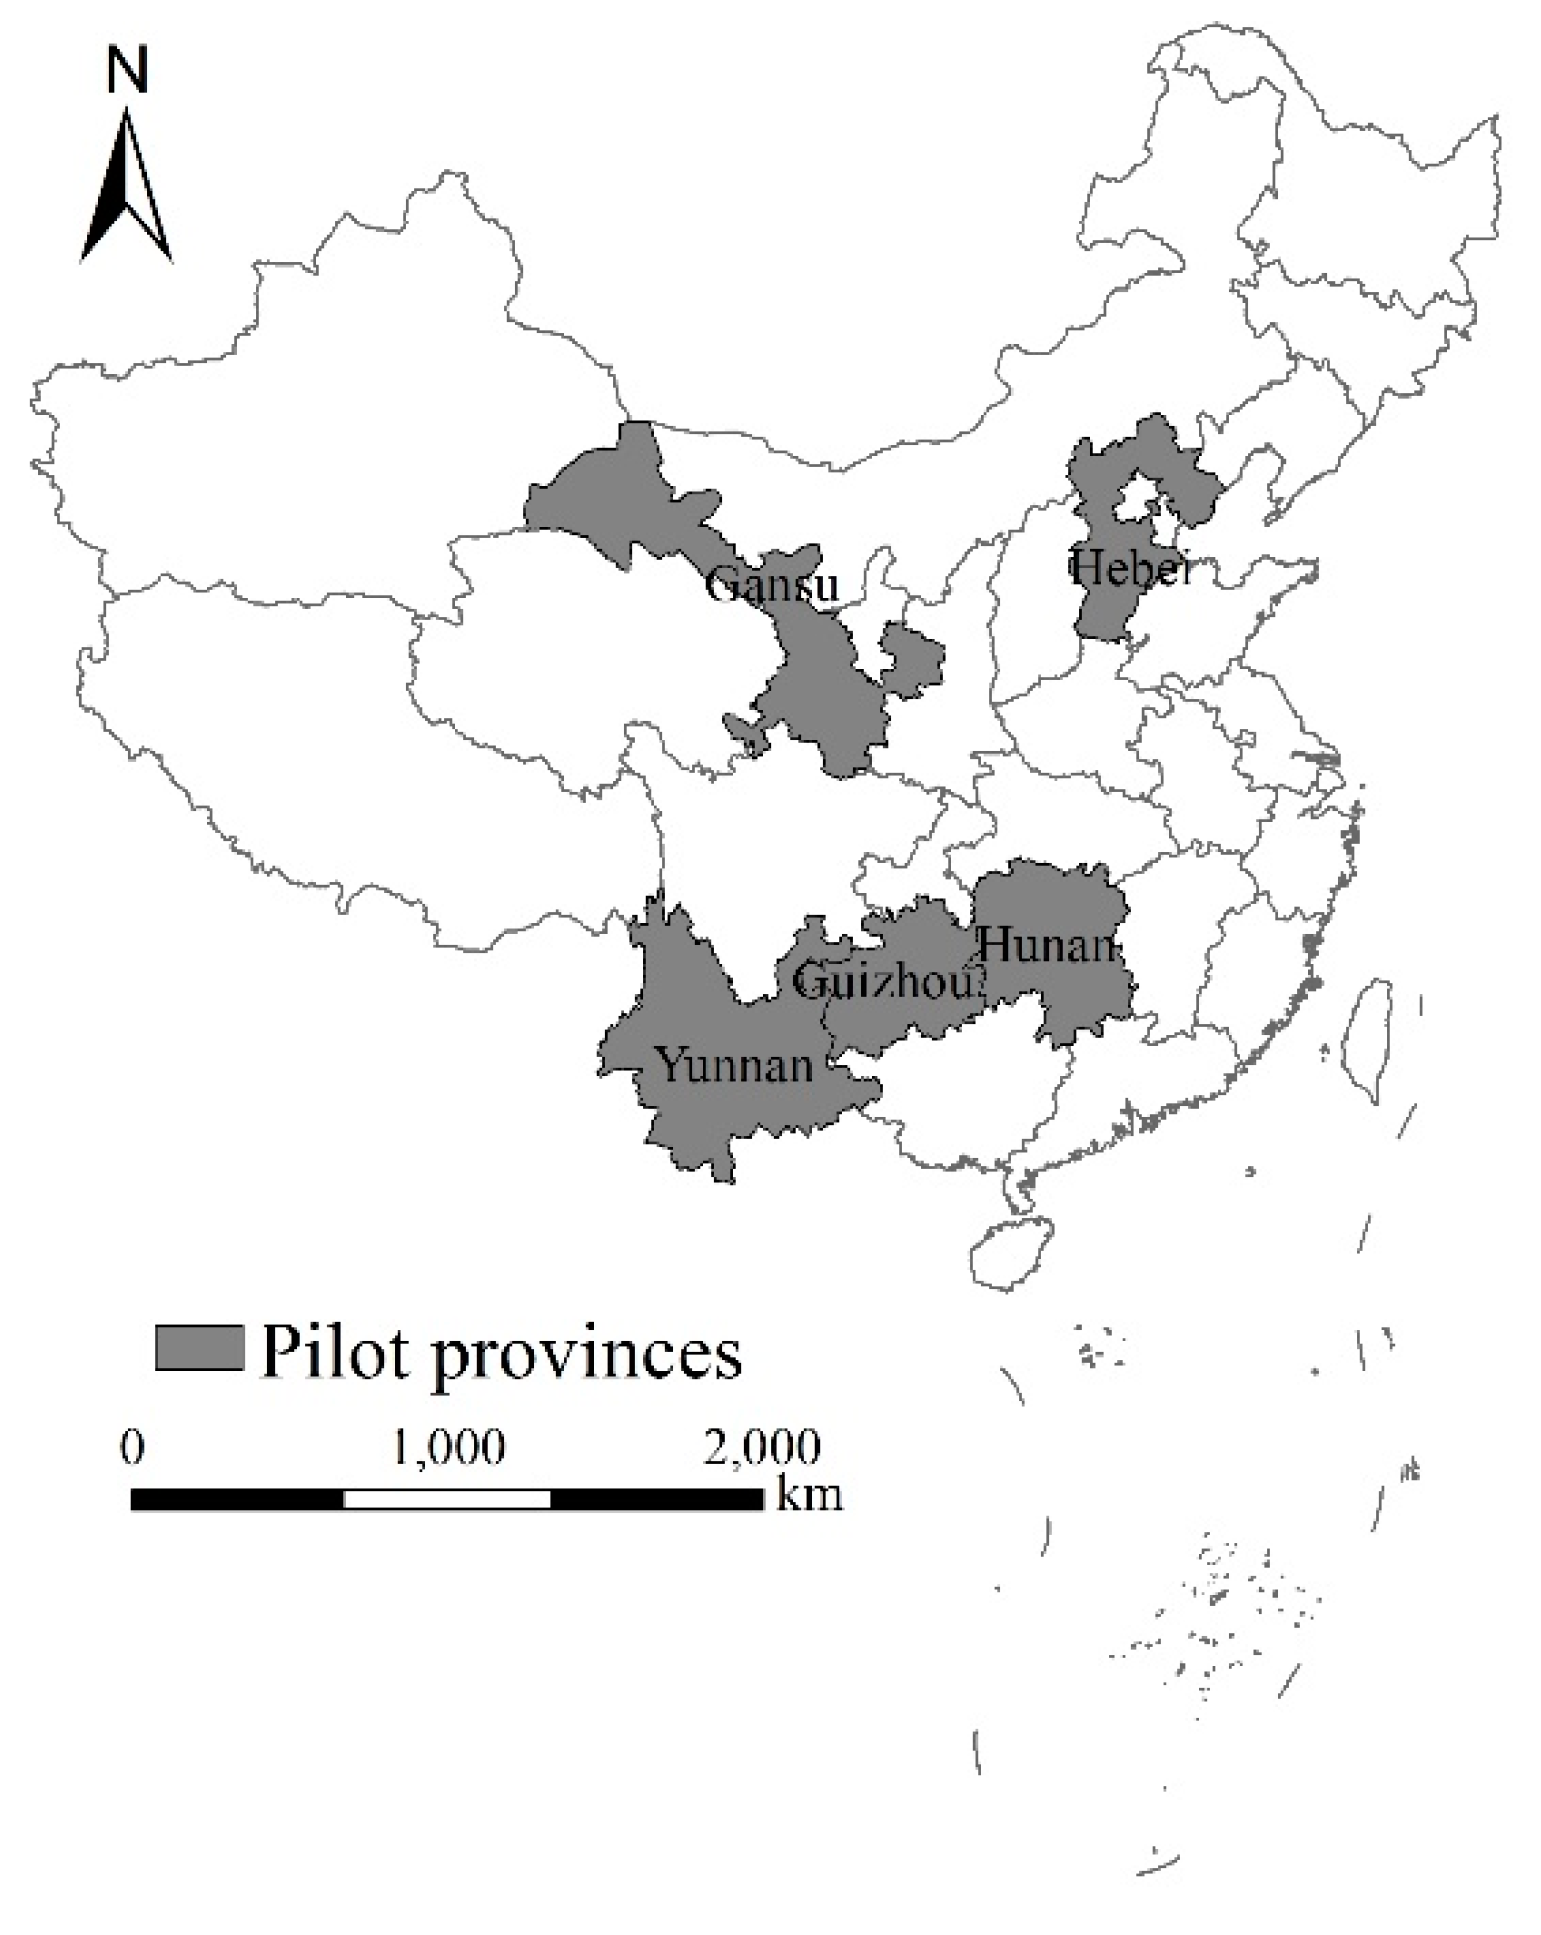
China is the largest country in East Asia, with numerous landforms such as plains, hills, mountains, plateaus, and basins. The natural environment and socioeconomic status should be considered during the implementation of the fallow system, according to the “Pilot program of exploration and implementation of arable land fallowing crop rotation system”, Hebei, Gansu, Hunan, Yunnan, and Guizhou Provinces were selected as the policy experimental regions (Figure 1). They vary in terms of landscapes and socioeconomic conditions. Hebei is among the main grain-producing areas, owing to a great amount of fertile soil. Hebei (36°01′–42°37’ N, 113°04′–119°53′ E) is located in north-east China, and is one of the major grain-producing areas of China, with 33,638,000 t of grain output in 2015 [42]. The main reason for fallowing is to mitigate the ground tunneling problems caused by the irrigation of winter-wheat [43]. Gansu (32°11′–42°57′ N, 92°13′–108°46′ E) is a province located in northwest part of China. It is one of most typical arid and semi-arid regions without too much water in China, and has been subject to severe ecological degradation, such as soil desertification, calling for a decrease in cultivated land use intensity [44]. Hunan (24°38′–30°8′ N, 108° 47′–114°15′ E) is situated in central China. The main concern of Hunan is heavy metal contamination, which has caused serious poisoning of grain production and resulted in an urge for cultivated land rehabilitation [45]. Yunnan (21°13′–29°25′ N, 97°31′–106°11′ E) and Guizhou (24°37′–29°13′ N, 103°36′–109°35′ E) are situated in southwestern China, and are in an inferior position in terms of economic development, out of the five provinces. The prominent problem in these provinces is Karst topography, resulting in rocky desertification of arable land [25].
The data of the cultivated land area, population, grain output, sown area of grain, sown area of farm crops, and gross domestic product (GDP) per capita were derived from the “China Statistical Yearbook (2000–2016)”, with supplementation from the statistical yearbooks from each province of China (2000–2016).
2.2. Model Used to Calculate the Cultivated Land Pressure
As a concept, cultivated land pressure was developed by Cai in 2000 [46] to evaluate the food security degree that cultivated land, in practice, could provide local people, at a certain grain-consumption level and grain-producing level.
The cultivated land pressure index model is an approach to measure the ability that cultivated land grain output has in satisfying regional grain consumption by local people in a specific area. To calculate it, we must know the minimal demand of cultivated land per capita, Smin (guaranteeing the amount of cultivated land for food security in a specific area), which is calculated as follows [46]:
Then, we can measure the cultivated land pressure index, Ko, using Smin and the actual cultivated land area per capita, Sa, as follows [46]:
where Ko is the cultivated land pressure, β is the food self-sufficiency rate, Gr is the annual grain demand per capita, p is the grain yield per year, q is the grain sown area as a percentage of the total sown area, k is the multiple cropping index, and Sa is the actual cultivated land area per capita.
If Ko <1, there is no serious pressure and there is a positive condition for food security; if Ko = 1, it is near the red line of food security (critical state); if Ko >1, there is obvious pressure, and a food supply crisis could occur unless appropriate measures are taken.
It is an easy means to measure the ratio of human need and cultivated land production, which has been used in some previous studies. For instance, researchers measured cultivated land pressure in China in a long run. By depicting the relationship of the supply–demand of cultivated land via calculating the cultivated land pressure index of China, they draw an overview transformation of cultivated land pressure in China [46,47,48]. Apart from focusing on the single- and large-scale cultivated land pressure, Zhang et al. explored the temporal–spatial difference of cultivated land pressure at multiple scales in China, and found the spatial variation characteristics on it [49]. Luo et al. re-raised a question of “who will feed China”, by measuring cultivated land pressure in China at a prefectural scale, and argued that current urbanization is compatible with food security in China [50]. Some external tools such as the system dynamics model were also used to measure cultivated land pressure based on the cultivated land pressure index model [51].
The aforementioned model is an effective means to calculate cultivated land pressure. However, when we compare the cultivated land pressure between regions, there are several shortcomings in the original model, as follows: (i) there is no longer a state monopoly for the purchase and marketing of grain, because the market becomes the main regulator of grain supply–demand with the necessary aid of state regulation, but this is not taken into account in the model; (ii) it is nearly impossible to obtain accurate data for the grain self-sufficiency rate; and (iii) the regional disparities in cultivated land quality are not revolved in the model.
To explicitly highlight the regional disparities in economic development and natural resources, and dismiss uncertain data, we modified the original model by (i) using the capacity for obtaining food via the ratio of GDP per capita of a subregion and the GDP per capita of the region, instead of the grain self-sufficiency rate, and (ii) adding the regional disparities in cultivated land quality via multiple cropping index and grain yield per year [52], as follows:
where is the capacity for obtaining food, Xi is the GDP per capita of i subregion, and Xn is the average GDP per capita of region [50], and
where is the regional disparity of cultivated land quality; pi and ki are the grain yield per year and multiple cropping index of i subregion, respectively; and kn and pn are the average grain yield and multiple cropping index of the region, respectively.
The modified model is as follows:
There are several reasons for choosing a cultivated land pressure model to measure food security. Firstly, the variables in this model are directly related to the supply–demand relation of food [46,47,51], which means it evaluates the food security degree more precisely. Second, to map the overview of food security in China at a perpetual scale, accessible data are essential. The employed data in the cultivated land pressure model can be found in the China Statistical Yearbook, and in statistical yearbooks from each province of China. Finally, after a modification of the model by adding two indices, this model shows a better ability for explaining the relation between production and consumption of food. Thus, we used the original model when calculating the cultivated land pressure nationwide, and at the sub-nation scale, we used the modified model to compare the food security level.
2.3. Settings for Grain Consumption and Cropping Index
Different grain consumption situations directly affect the value of K. In accordance with the lowest standard for food consumption from the FAO, 400 kg per year could meet the minimum current demand of people. Xin et al. developed a framework to calculate grain consumption per capita, and argued that grain consumption per capita in China is 424 kg per year, by combining several grain purposes, including for food, brews, fodder, seed, and so on [53]; furthermore, the State Food and Nutrition Consultant Committee of China suggests that 437 kg per year would be a suitable grain consumption for Chinese individuals by 2020. Thus, we developed 400 kg, 424 kg, and 437 kg per year as the three grain consumption per capita scenarios, to show various results for cultivated land pressure.
Regarding the cropping index, we developed the results of Ding’s study on the cropping index of cultivated land of China. He argued the cropping index was 134.26% in China in 2012, and the average annual growth rate was 1.29% [54]. Based on this, this study calculated the cropping indices for the following years.
3. Results
3.1. Changes in Cultivated Land Pressure During the Period of 2000–2016
3.1.1. Temporal Change
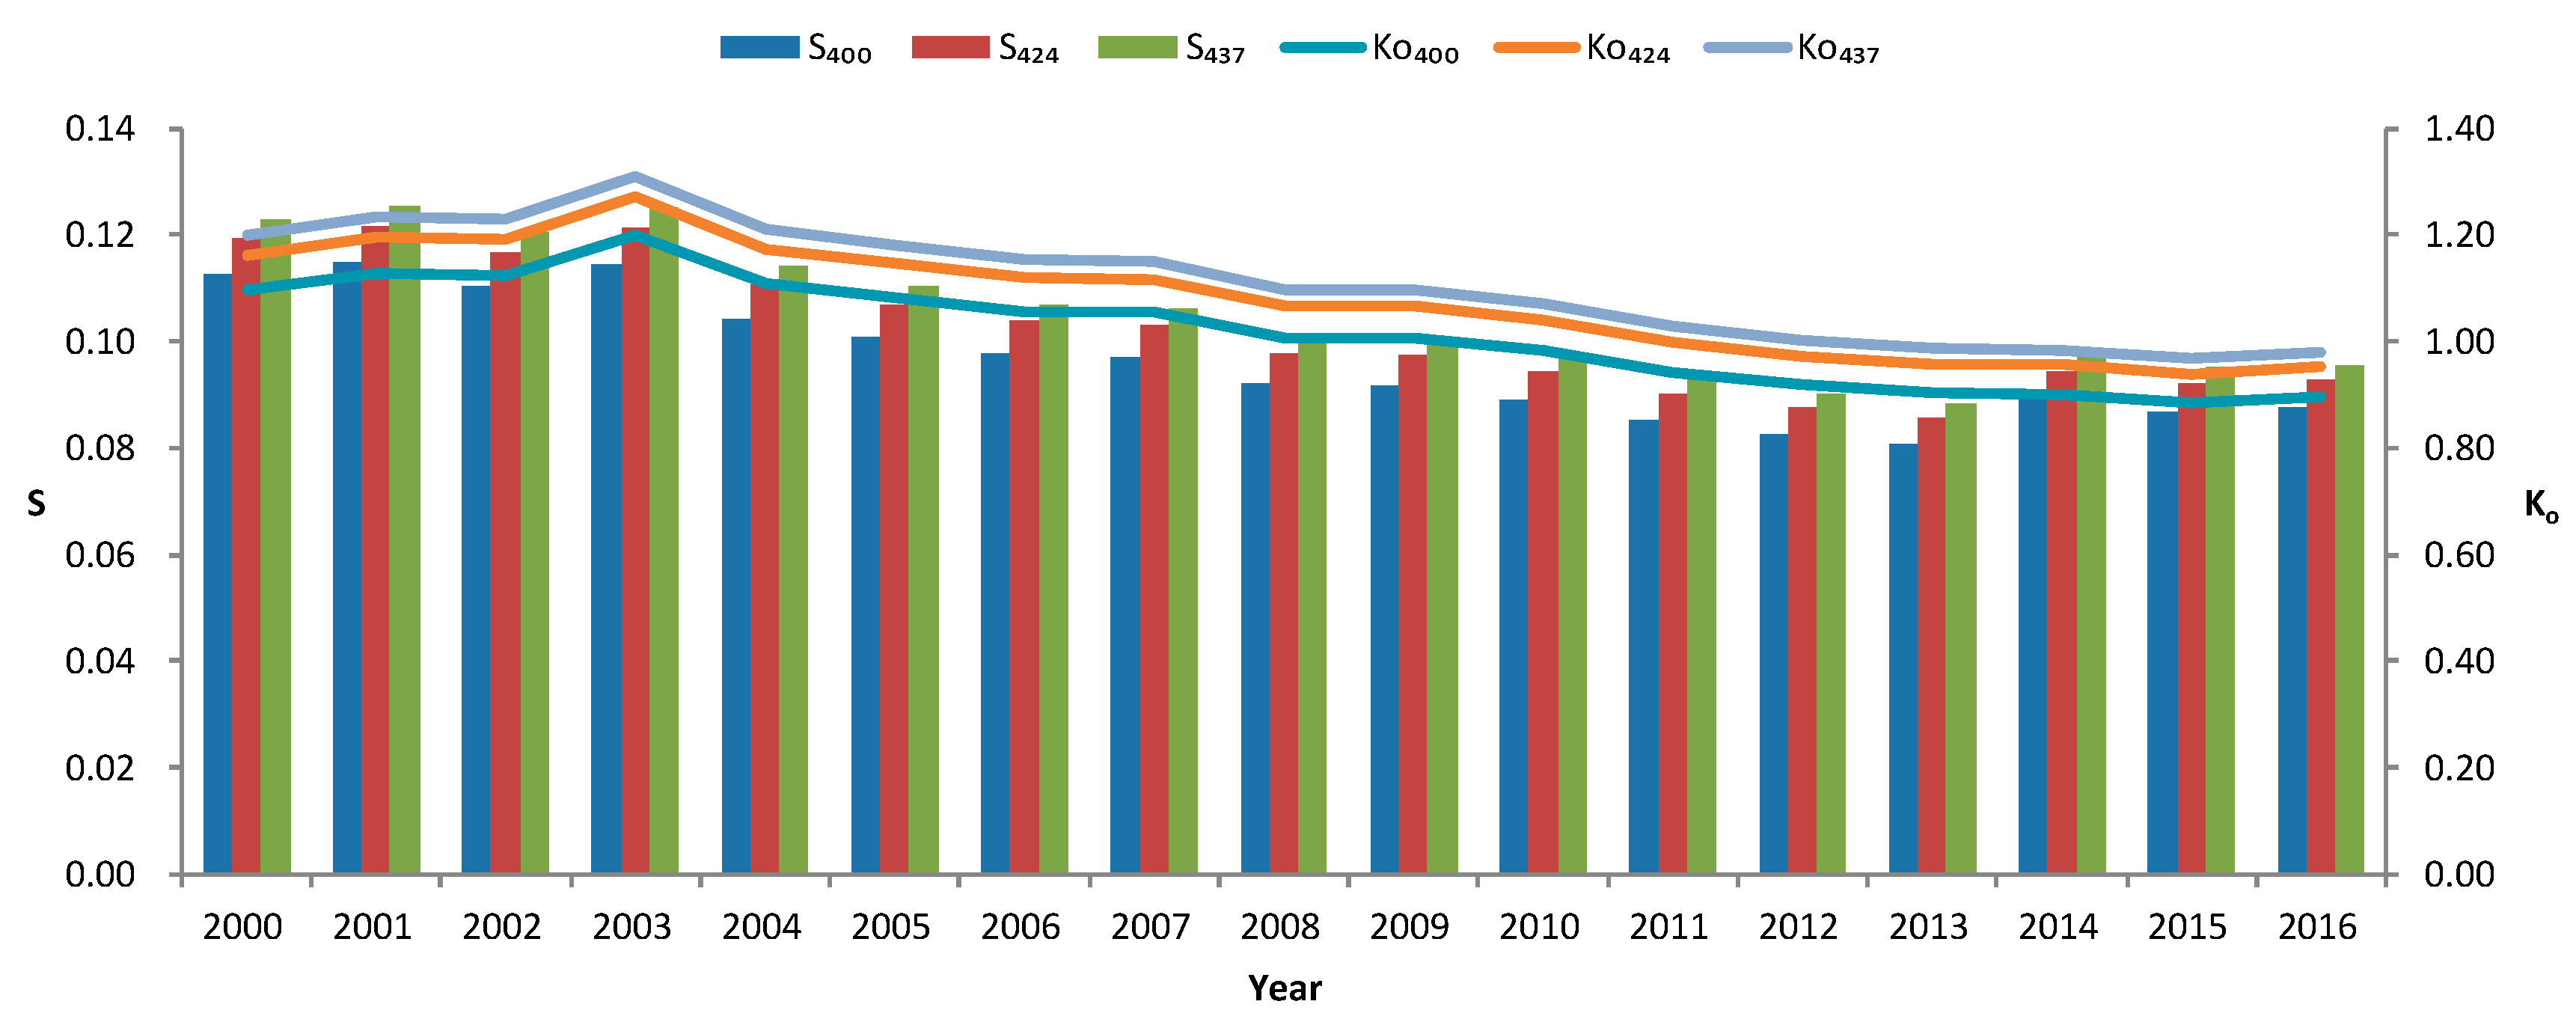
As shown in Figure 2, under the three scenarios of annual grain consumption per capita, the S400, S424, and S437 values continually decreased with fluctuations. The S400, S424, and S437 values decreased to 0.09 from 0.11, 0.12, and 0.13, respectively.
The Ko400, Ko424, and Ko437 values decreased as well during the period of 2000–2016, and were less than 1.00 after 2006, 2008, and 2011, respectively. This means that China entered a period of stable food security in 2011 (Ko <1).
3.1.2. Spatial Change at the Province Scale
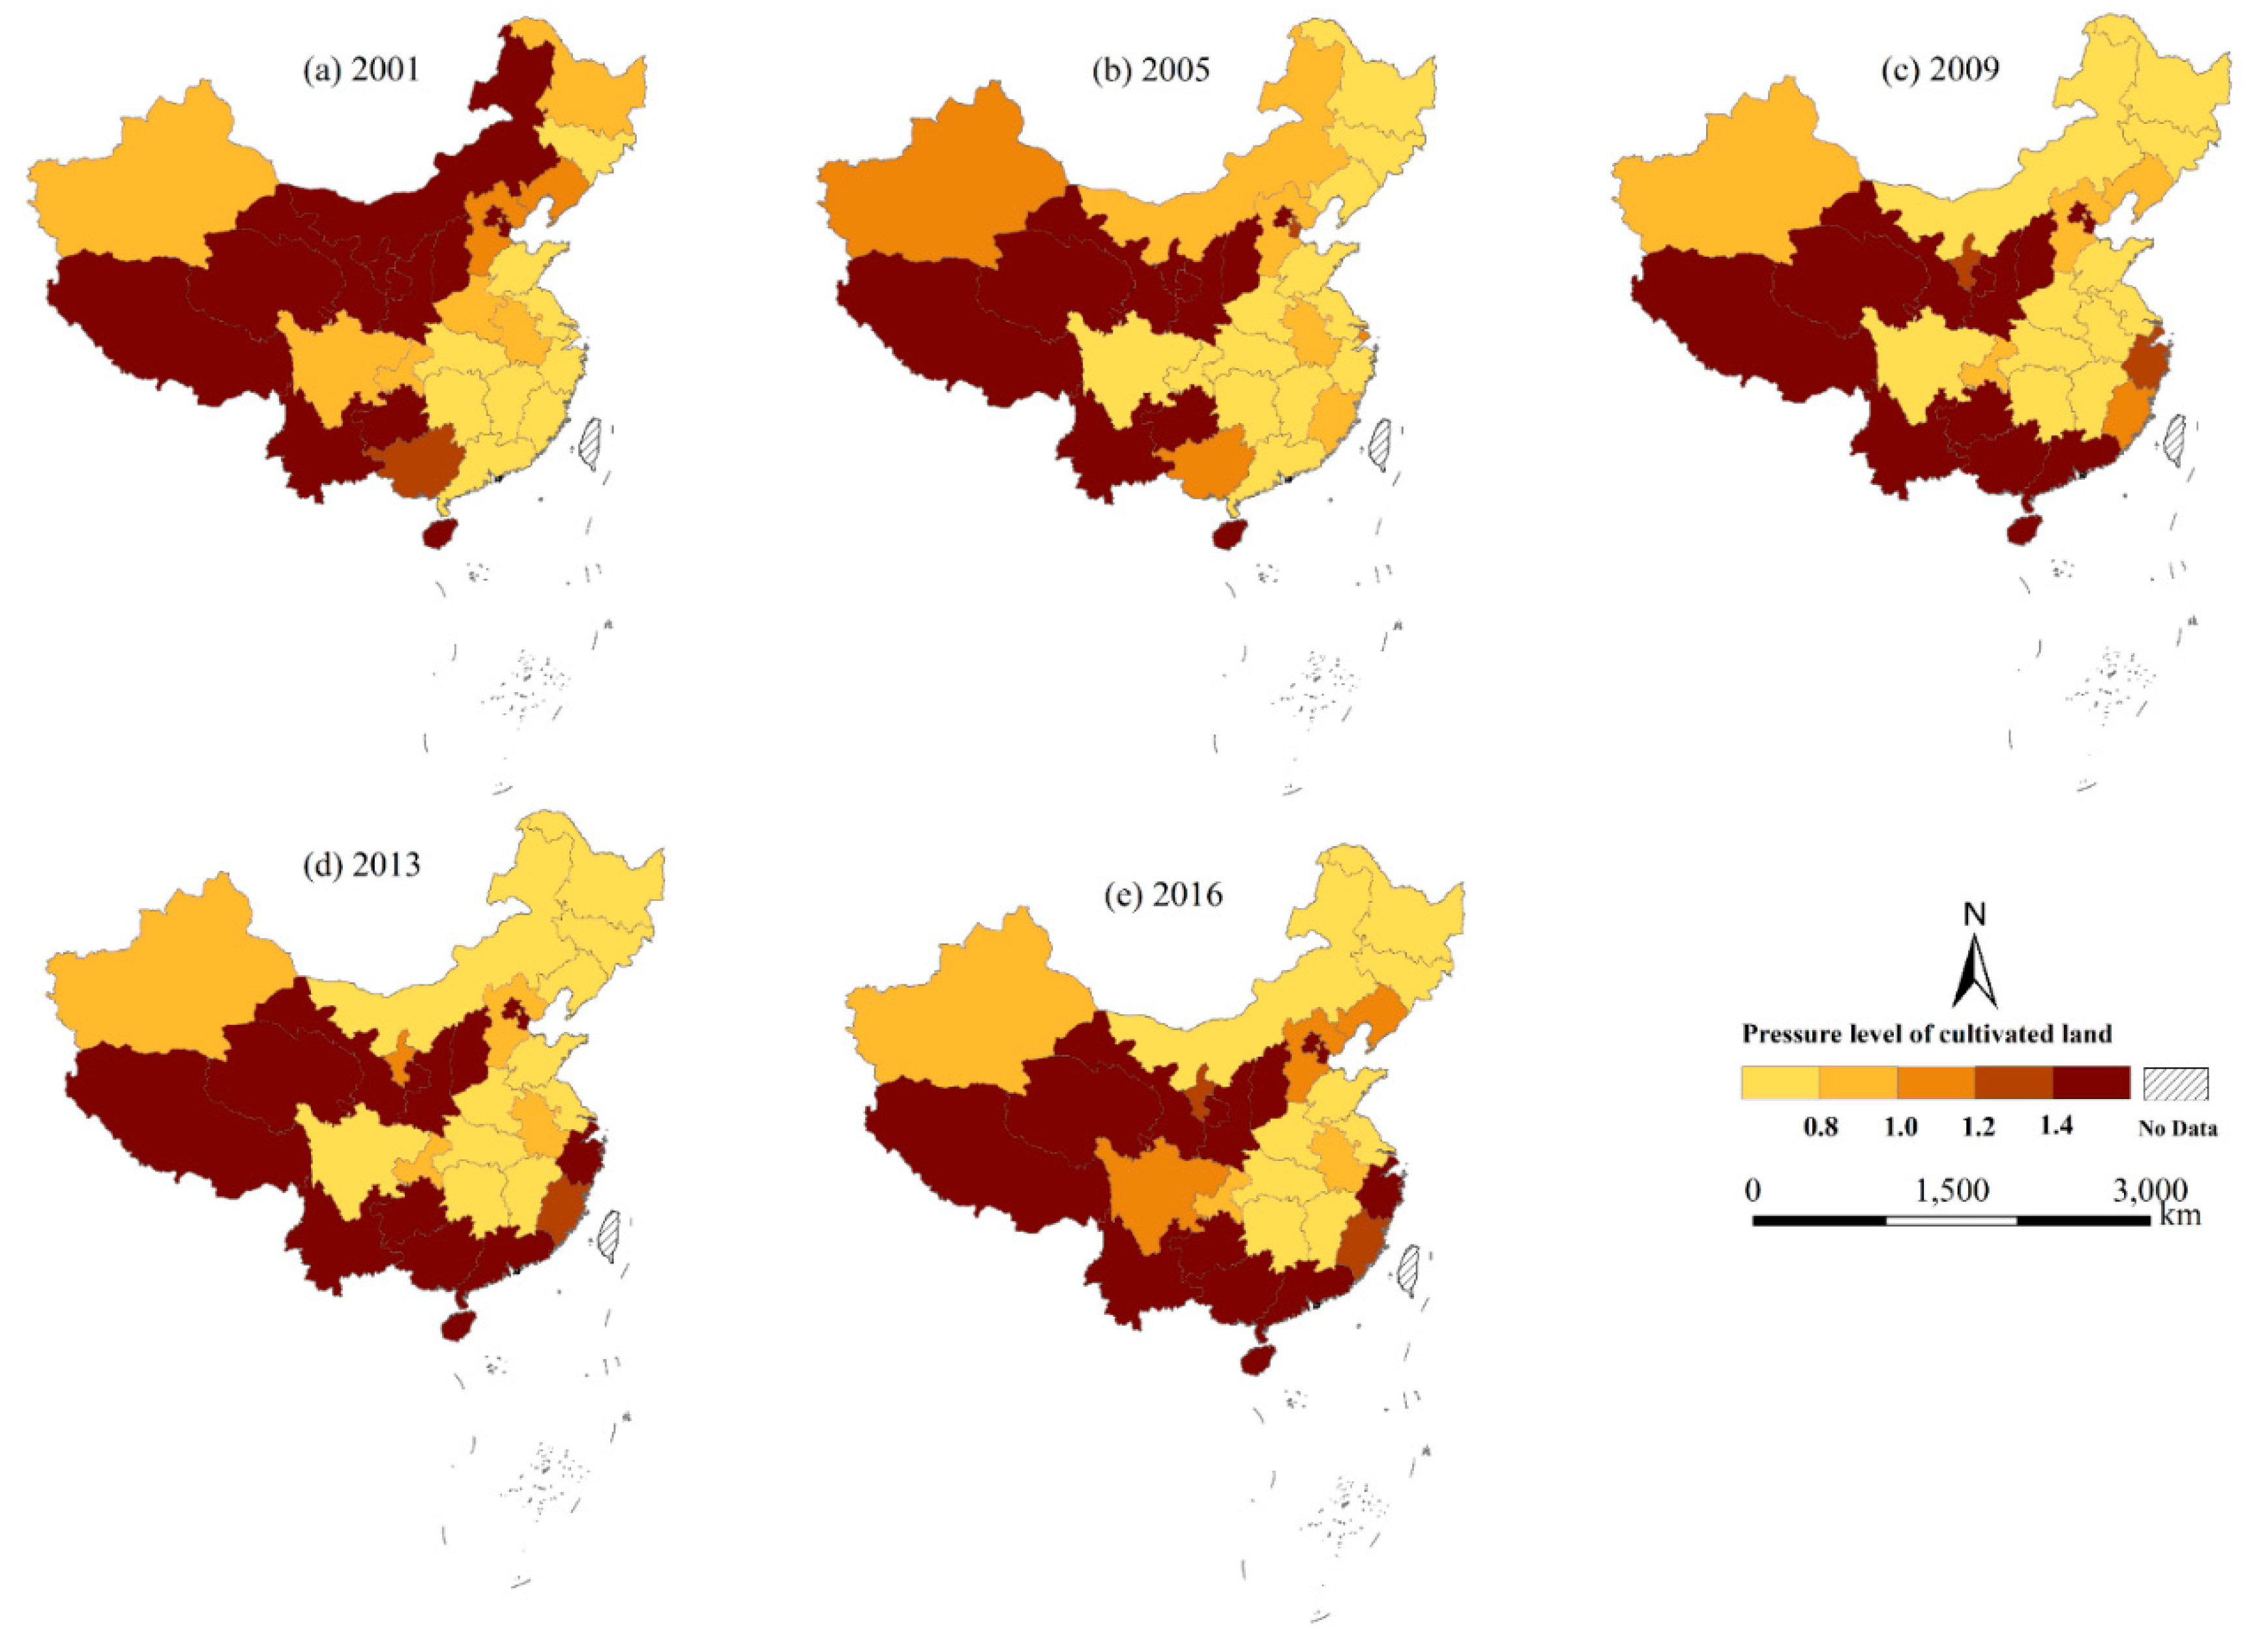
Regarding the spatial changes, an annual grain consumption of 424 kg was used in the calculations. During the period of 2000–2016, the overall cultivated land pressure in China showed a downward trend. However, for different regions, the changes in K were significantly different. The panel data for 2001, 2005, 2009, 2013, and 2016 were chosen to explore the spatial change (Figure 3).
The Ks in 16 provincial regions increased, while in 15 others, it showed a downward trend. The increasing areas were mainly distributed in the provinces and municipalities of eastern China and China’s south-east coastal areas; the southwestern regions also showed an increasing trend. The Ks in Beijing, Shanghai, and Tibet significantly increased. The cultivated land pressure in northwestern, northern, and central China showed a significant decreasing trend. The Ks in Inner Mongolia, Shanxi, and Hebei Shaanxi significantly decreased.
As shown in Table 1, during 2001, Ks in the 16 provincial regions were greater than 1.00. During 2005, with a different distribution pattern, 16 provincial regions still had a K less than 1.00. During 2009, in contrast to 2005, the most obvious change was that the K in Xinjiang was less than 1.00. During 2013, there were still 15 provincial regions with a K less than 1.00. Compared to the overall pattern during 2009, the change was not obvious. In 2016, there were 12 provincial regions with a K less than 1.00 during 2016. Compared to the overall pattern during 2013, the pressure on the cultivated land in Hebei and Liaoning increased to a value greater than 1.00.
In short, there are two significant features of the cultivated land pressure at the province scale. First, for the five panel data years, the pressure pattern of the cultivated land is generally stable with sporadic changes, reflecting the increases and decreases in the utilization of cultivated land resources, and the relationship between humans and the land in these areas. Second, in terms of spatial distribution, several areas show a high cultivated land pressure, including economically developed areas such as the Circum-Bohai Sea region, the Yangtze River Delta region, and the Pearl River Delta region, and in the southeastern coastal, southwestern, and semi-arid areas (Qinghai, Gansu, Shaanxi, and Shanxi). However, the cultivated land pressure on the north-east and south-east plains was generally low.
3.1.3. Spatial Change at the Prefecture Scale
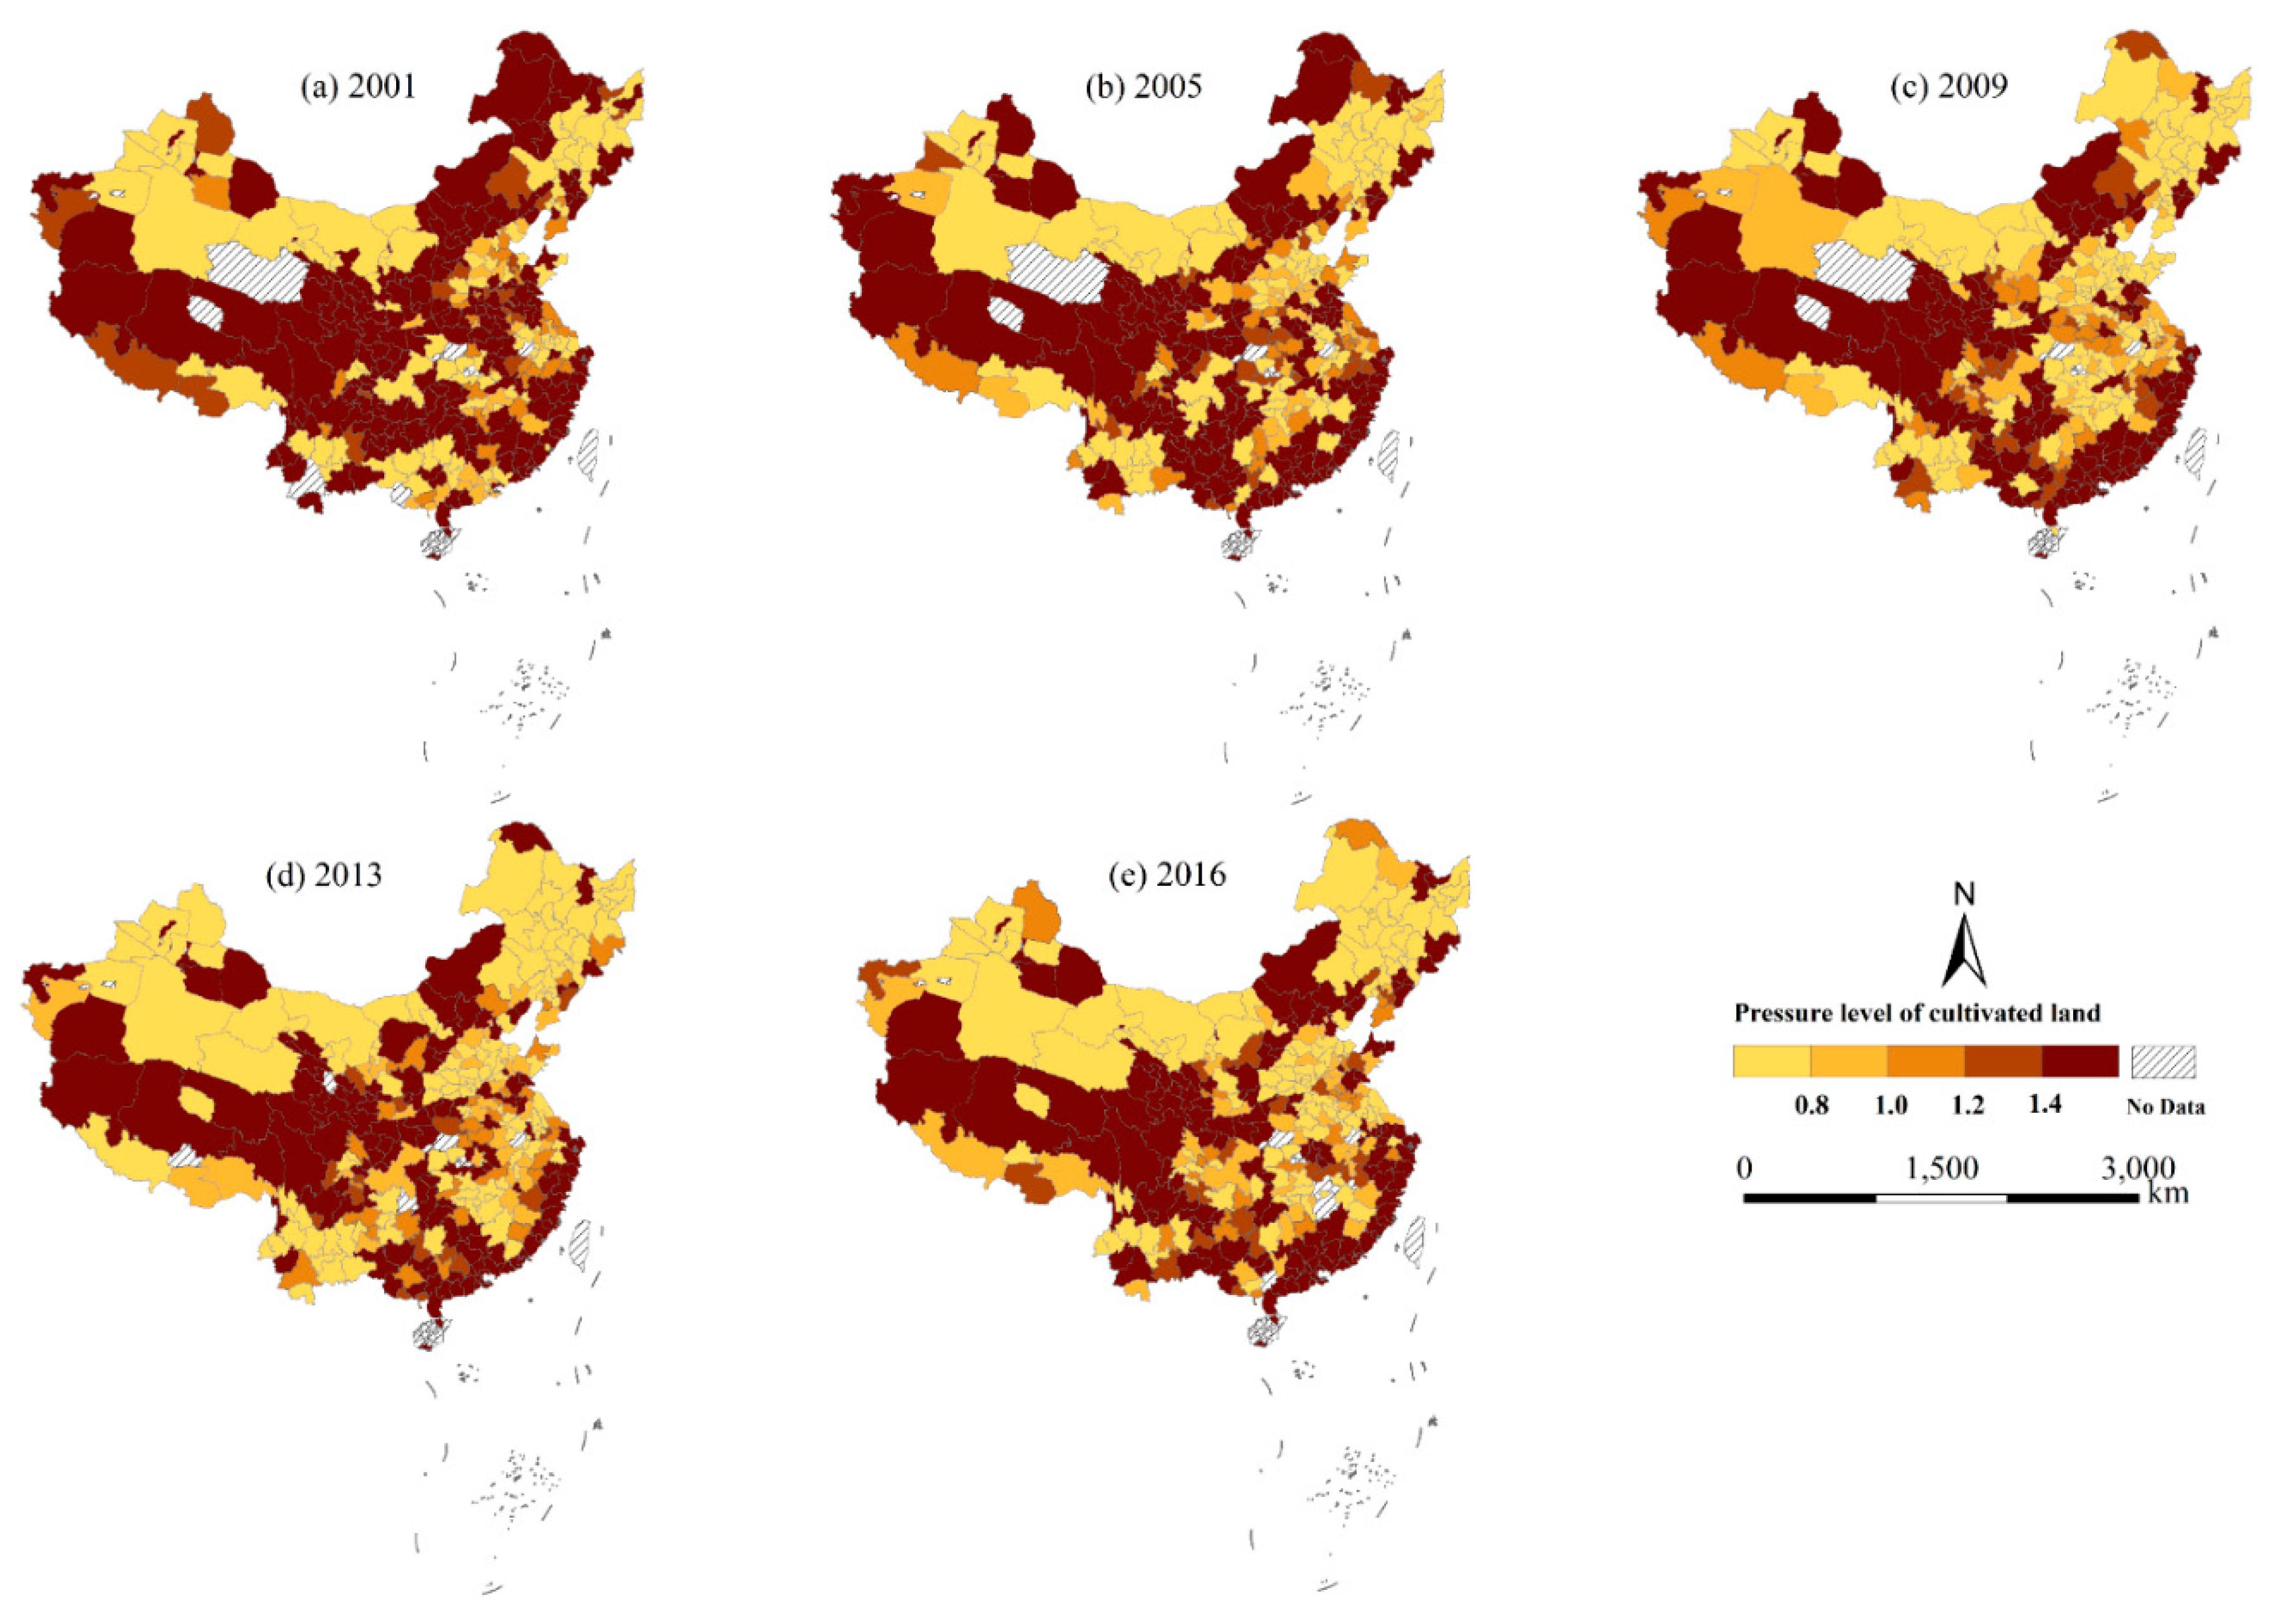
The spatial distribution of K at a province scale shows the main characteristics of the relationship between cultivated land and humans. In contrast, the prefecture-scale can reflect the more subtle features of cultivated land pressure. This study also calculated the cultivated land pressure at a prefecture-scale city scale using the panel data for every prefecture-scale region of China (except for no data). The results show that the pattern of cultivated land pressure for the five panel data years is still overall stable, but with more sporadic changes (Figure 4).
The overall stability is that the primary areas of a high- or low-pressure did not change. At one end of the spectrum, the areas with high cultivated land pressure are concentrated along the southeastern coast and in western China (particularly on the Qinghai–Tibet and Yunnan–Guizhou Plateaus in the southwestern region). The former is because the non-agricultural use of cultivated land is common, as a result of the rapid economic development, such that the contradiction between the people and the land is pronounced. The latter is mainly as a result of ecological fragility, poor weather and production conditions. At the other end of the spectrum, western Inner Mongolia and northern Xinjiang have maintained relatively low cultivated land pressure. The former is China’s main grain production base, where both the grain quantity and quality are high. The latter is mainly a population outflow area of China, and the contradiction between the people and the land is not acute. Sporadic areas with a low K were scattered on the vast plains of central China and in eastern China, and showed no universal rules.
Three characteristics could be drawn regarding the sporadic changes. First, the cultivated land pressure in western Inner Mongolia–northern Shaanxi–Shanxi decreased, becoming a low-pressure zone versus a high-pressure zone during 2001. This is because of the substantial increase in grain production in this region. Second, the cultivated land pressure in some cities in northeastern and eastern China has significantly decreased. Third, the cultivated land pressure in northern Xinjiang and the Huang-Huai-Hai region has also decreased, and the food security situation has improved significantly. Fourth, since 2001, the north–south differentiation of China’s cultivated land pressure was very obvious—in the northeastern region where the K is relatively low, the cultivated land pressure was smaller and the food security situation was better; by 2009, a large low-pressure agglomeration had formed. However, a large, stable high-pressure area along the southeastern coastal areas formed after 2009, resulting in a high food provision risk. This also confirms the trend of China’s cultivated land moving northward over the past 15 years.
In addition, the number of cities with a K less than 1.00 has gradually increased (108 during 2001, 130 during 2005, 157 during 2009, 161 during 2013, and 153 during 2016), indicating that nearly one-half of the cities were within a safer range for nearly a decade; thus the possibility of a food supply crisis at the prefecture scale across China has gradually decreased.
3.2. Prediction of Cultivated Land Pressure and Scenario Simulation
3.2.1. Scenario Settings
What might occur over the next four years following the research period? Using a gray prediction model, this study predicted the factors that form the cultivated land pressure index, and examined what would happen under various scenarios of a land fallowing scale. A grey forecast model, GM (1, 1) model, was used to predict the factors affecting cultivated land pressure, and then to calculate the cultivated land pressure, K. Using the data of the population, cultivated land area, grain output, grain planting area, total planting area, cropping index, and GPD per capita from 2000 to 2016, we predicted the data for 2017–2020. To calculate the cultivated land pressure index, we cut the fallow area from the total cultivated land area. Notably, the fallow scale in Hebei is one-half that in practice, because of “a season for farming non-wheat, a season for fallow” policy (Hebei Province is among the most important bases of grain production in China, the main reason for fallowing in Hebei is to reduce the amount of irrigation water for wheat planting) [55].
To compare the different Ks under various fallow scales, several scenarios were set (Table 2). First, there was a stable land fallowing scale since 2018 (according to the latest fallow policy of the state, the scale during 2018 is double that of 2017). Second, we assumed that the land fallowing scale would double every year (Scalet+1 = 2 ×Scalet), which could see an outcome under a relatively radical fallow increase rate. Finally, under the third scenario, we assumed that the land fallowing scale would double every two years. The change in the doubling scale originated from the decision for the land fallowing system during 2017 and 2018.
3.2.2. National Change
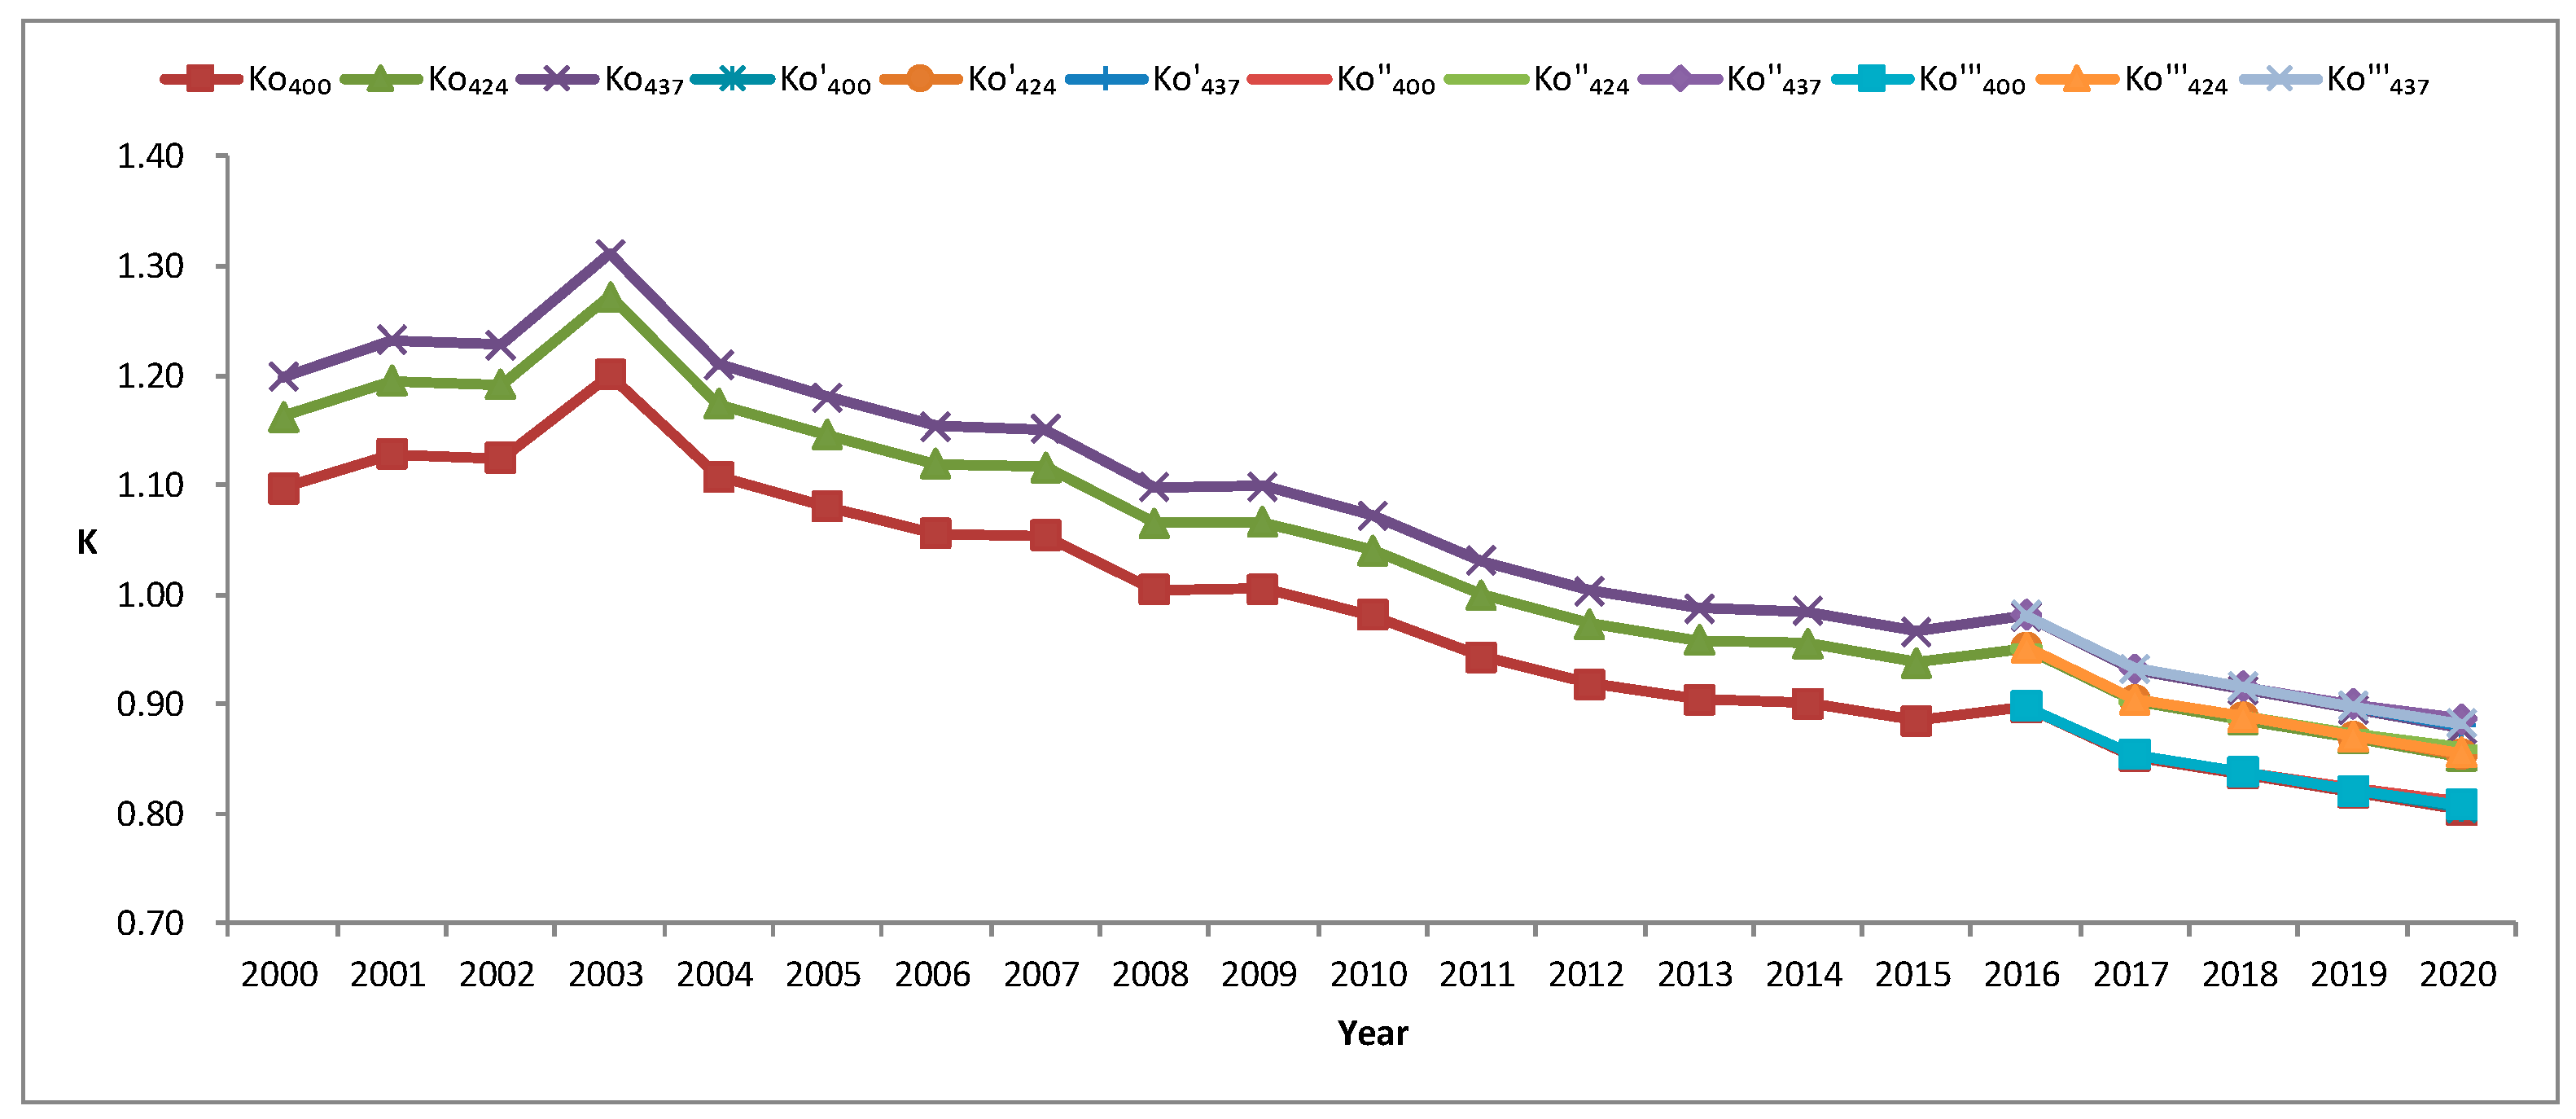
Under the three annual grain demand situations per capita, the cultivated land pressure showed subtle changes (Figure 5). First, in the temporal aspect, the three lines of cultivated land pressure would continue to slightly decrease and would always be less than 1.00 if there were to be no fallow program from 2000 to 2020. Additionally, under the first fallow scenario, no significant changes in the K between fallowing and not fallowing would occur, except for K437, which during 2019 differs by 0.01 from that of 2018.
3.2.3. Changes in the Pilot Provinces
Similar to the national analysis, the cultivated land pressure index in the five pilot provinces under fallow and non-fallow scenarios was calculated. As shown in Table 3, the Ks increase by various degrees under the three fallow scale scenarios, and there are two main features, namely: first, every province would maintain the same basic trend of cultivated land pressure, that is, the Ks in Hebei, Gansu, and Hunan would be less than 1.00, while the Ks in Yunnan and Guizhou would be greater than 1.00. Second, there would not be significant changes during the fallow process, but the Ks in Hebei, Yunnan, Guizhou, and Hunan would be slightly higher beginning in 2015. However, the K in Gansu would decrease during the period of 2017–2020 after a slight increase, and would become the lowest-pressure region of the pilot areas.
As shown in Table 4, under Scenario I, the amplitude of variation in K (ΔK) in the five pilot provinces, i, was positive, ranging from 0.017%–2.114% (to facilitate a more detailed comparison, the cultivated land pressure value K and the cultivated land pressure variability (ΔK) decimal numbers were set to three digits.). According to the average range of change from large to small, they are as follows: Gansu, Yunnan, Hunan, Guizhou, and Hebei. Thus, there would be no grain supply problems in the five pilot provinces, because of the slight changes in K under the stable fallow scale, which also implicitly demonstrates that the current fallow amount would not greatly influence the food provisions of the whole nation.
Then, the Ks under Scenario II were calculated. Because the fallow scale during 2016 and 2017 was set, we only determined the scale during 2018, 2019, and 2020. According to the setting of the second scenario, the scale during 2018 was twice that of 2017, the scale during 2019 was twice that of 2018, and the scale during 2020 was twice that of 2019. As shown in Table 4, the amplitudes of variation are 0.017%–9.027%, and the Ks in Guizhou are the highest; however, the changing amplitude in Hebei is the largest, even though it has lowest cultivated land pressure.
Finally, under Scenario III, the fallow scale doubled every two years; that is, the scale during 2018 was twice that of 2017, the scale during 2019 was the same as that of 2018, and the scale during 2020 was twice that of 2019. The K under fallowing is still higher than the K under non-fallow implementation, but the amplitudes are smaller than those under the second scenario, which are 0.017%–4.319%.
Obviously, the impacts on the cultivated land pressure from the cultivated land fallowing policy differ by location. Under the three scenarios of fallow scale, the Ks have various increasing amplitudes. Thus, we can reasonably predict the changing scope would not exceed 5% if we maintain the same grain demand as the aforementioned assumption during recent years.
4. Discussion
4.1. Cultivated Land Pressure Index Provides a Reliable Approach to Measure Food Security and Shows a Decreasing Trend Nationwide During the Period of 2000–2020
In this research, the traditional cultivated land pressure index model and its modified version served as important tools for measuring food security. Compared to some intricate means to measure food grain demand and consumption, the cultivated land pressure index can provide a clear and direct result using an easier approach. Moreover, unlike previous studies that calculated the cultivated land pressure only using land and population data [47,51], the modified model combines the amount of cultivated land, people’s demand for grain, and disparities in economic development and productive capacity. The results show that the cultivated land pressure in China decreased during the period of 2000–2016, and would remain in a decreasing trend during the next four years, even with some fallowing of the cultivated land.
The findings reported in this study are consistent with those of previous studies. For example, Chen and Yang argued that a higher fallow scale could be implemented, given sufficient grain production [31]. Similarly, the empirical finding in this paper also indicates that the current fallow policy has a limited influence on food provisions nationwide. Also, the declining trend of cultivated land pressure could be confirmed in the relevant research. Zhang et al. found that the cultivated land pressure in China experienced a rapid increase in the first several years of the 21th century, and then decreased quickly to date [49].
4.2. Spatial Patterns of Cultivated Land Pressure between a Provincial and Prefectural Scale Show a Similar Overview, with Some Nuanced Disparities
This paper investigates the spatial patterns of cultivated land pressure at a province and prefecture scale, and they share a similar holistic picture. First, at both scales, the west and south part of China are found to be the areas with the highest cultivated land pressure. Second, the relatively dense distribution of high cultivated land pressure was found in economically developed and arid and semi-arid areas. The spatial pattern of the cultivated land pressure is consistent with Zhang’s study [49], which argued that the cultivated land pressure in the eastern part of China increases gradually, and in the west of China it is relatively high, while in the central and northeastern parts of China it is a low level.
Disparities are found in the number of regions with K less than 1.00. At the prefecture scale, temporally, it is found that the number of cities with a K less than 1.00 increased generally (108 during 2001, 130 during 2005, 157 during 2009, 161 during 2013, and 153 during 2016), showing a negative relationship between humans and the cultivated land resource. By contrast, the number of provinces with a K less than 1.00 decreased from 16 in 2001 to 12 in 2016. The slight decreasing trend should also be noted, in that humans should slow their developmental rate to wait for the recovery of nature. This implication is also consistent with that of Li’s study [3]. This study observed a decreasing trend in the total quality of cultivated land in China, although land expropriation and consolidation could compensate for the decline in the cultivated land amount. Food security and cropland quality should be prioritized. Moreover, a recent study on the spatial differentiation of cultivated land pressure showed a transition in China, which demonstrated that most of areas have lesser cultivated land pressure and that a denser high-level aggregation is forming [56]. This research also supports the finding about the transformation of the spatial distribution of cultivated land pressure in China.
4.3. Amplitudes of Variation in Cultivated Land Pressure Under the Fallow Policy Vary for Different Pilot Provinces
Different amplitudes of variations in cultivated land pressure were found under the three fallow scale situations, namely: (i) if the fallow scale of 2017 was maintained, the changes in cultivate land pressure (ΔK) are within 0.017%–2.114%; (ii) if the amount of fallowed land was twice that of 2017, ΔK would increase up to 9.027%; and (iii) if the fallow scale changed every two years, ΔK would change within 0.017%–4.319%. In addition, there was only one case where ΔK was greater than 5%, while the other cases were all less than 5%. A different fallow scale would result in various impacts on food security. According to Chen and Yang, using flexible fallow scale regulations could meet the changing international grain market. More attention should be paid to the amplitudes of change in the cultivated land pressure in future research, in order to explore the flexibility of scale management [31].
Previous research has examined the relationship between population and food production, from similar perspectives. Cheng and Shi, for instance, paid special attention to cultivated land pressure after the Grain for Green Project (a policy converting cultivated land to forest land). They found that cultivated land pressure did not increase obviously, and the food security in the case area was controllable because of labor migration from rural areas to urban areas, and the pressure levels varied in different stages and areas [57]. It supports the finding on the variation of cultivated land pressure under the pilot fallow policy, and also shows a robust deciphering ability of the cultivated land pressure model in food security research [47,49,50,51].
4.4. Decreasing Cultivated Land for Tilling Under Current Land Fallowing Policy Does not Pose a Threat to Food Security
A fallowing scale changing to double the size every year during 2017–2020 would not change the cultivated land pressure significantly, which means that the current fallowing policy would not threaten food security in China. At a national scale, cultivated land pressure shows little change under fallowing policy compared to the non-fallowing setting (Figure 5). At a provincial scale, the scenario stimulations of the five pilot provinces also show slight changes of cultivated land pressure, even though there is a change of double the size every year from 2017 to 2020. Thus, despite the fact that there would a small amount of cultivated land fallowing for rehabilitating, the remaining cultivated land could provide enough food nationwide and in the five pilot provinces.
Existing studies share the same insight of this paper. In a short term, land fallowing with a suitable size and spatial distribution is not a threat factor on food security. It is supported by argument of Van Noordwijk who found the scale (size) play an important role in the food production and build-up and the decline of soil fertility [58]. Moreover, land fallowing contributes food security in a long run. Partey et al and Cotta argued improved fallow system has real potential to secure enough food production using the cases in Sub-Saharan Africa and Peruvian Amazon [59,60]. Similarly, some studies from biology perspective also provide evidence with the statement that fallowing is an effective approach to improve fertility and hence increase food provision [61,62].
5. Conclusions
This research used the cultivated land area and population data to measure the cultivated land pressure in order to determine the food security degree and to examine the influential degree of the fallow policy. The current cultivated land fallowing policy will not significantly influence cultivated land pressure. By calculating the pressure index, we argue that the amplitude of variation in cultivated land pressure would not exceed 10%, which means that food security would be controllable if the fallow scale maintains its recent extent. Thus, the grain provision capacity should not be a negative component of the current fallow policy. Cultivated land pressure in the pilot provinces showed various outcomes under the fallow policy, while all of the Ks showed an increasing trend to different degrees. Thus, maintaining a reasonable fallow scale to guarantee food security and relieve cultivated land problems at the same time seems more appropriate. Amplitudes of variation in cultivated land pressure vary at different fallow scales within 0.017%–9.027%.
For policymakers, these findings have some implications. First, it is better to understand to what extent the fluctuation in grain provision would not threaten food security, considering cultivated land pressure during the implementation of the fallow policy. Policymakers should adopt an appropriate and detailed fallow policy to guarantee the demand of the nation’s population, without a significant fluctuation in grain price. Second, regarding regulating the amount of future fallowed area, the cultivated land pressure can not only provide guidance for the selection of future fallowed areas, but also provide a comprehensive basis for fallowing work. Cultivated land pressure should be used to reflect the carrying capacity of the arable land in the region to manage fallowing programs. Third, because of various situations of resource endowment and cultivated land pressure, target-orientated guidance for fallowing should be provided. For example, regions such as Hebei could provide more areas to implement more fallow programs, because of its low-pressure index and “half-fallow” policy for water-saving targets, while regions such as Yunnan and Guizhou should implement more prudent strategies because of their inferior local grain production and the status quo of higher pressure.
This research has a few limitations that can be further remediated in the future. First, the current cultivated land pressure is discussed in a relatively closed system of food supply–consumption, even though we put effort in to add indices like the ability of economically obtaining grain and the regional disparity of cultivated land quality. Second, in terms of limited data, only discussions at a perpetual scale could be possibly be used to map an overview of the cultivated land pressure in China. While county scale could be more refined, it seems impossible to collect all of the data. Third, the design scenario of the fallow scale is based on the recent regulation of the central state, and not much evidence or clues could be used. That is also the reason this paper argues that land fallowing would not threaten food security in China within an upper limit (doubling in size from 2017 for every year during 2017–2020).
Several implications of future study, therefore, could be drawn up. In the first place, not only should cultivated land status and grain consumption be considered, but some external factors such as technological development and natural hazards could be added into the cultivated land pressure model, in order to show a more comprehensive change of food security and relationship between humans and cultivated land. Second, more cases could be employed to examine food security using cultivated land pressure when there is an increasing number of pilot areas that could carry out the fallow policy under a state guidance on the expansion of policy experimentation. It would be a good compensation for insufficient data at a county scale. Finally, how much is the most suitable fallow scale in the Chinese context? How should policy-makers schedule a fallow scale in advance? These are intricate questions that should be considered, not only the supply–consumption of food in the short term, but also cultivated land resilience in the long-run. Land fallowing policy could engender the most ecological benefits when cultivated land fallowing is under an efficient and effective arrangement, including the fallow area, fallow scale, and fallow order. Thus, more studies on the optimization of fallow scales and regulation systems are needed in the future.
Author Contributions
Conceptualization, Q.Y. and R.Y.; formal analysis, Q.Y., K.S., and R.Y.; funding acquisition, Q.Y.; data curation, R.Y., K.S., and Y.W.; methodology, R.Y. and Q.Y.; writing (review and editing), Q.Y., R.Y., Y.W., and K.S.
Funding
This research is supported by the Key Project of the National Social Science Foundation of China, under grant 15ZDC032.
Conflicts of Interest
The authors declare no conflict of interest.
References
- Chen, J. Rapid urbanization in China: A real challenge to soil protection and food security. Catena 2007, 69, 1–15. [Google Scholar] [CrossRef]
- Yang, H.; Li, X.B. Cultivated land and food supply in China. Land Use Policy 2000, 17, 73–88. [Google Scholar] [CrossRef]
- Li, Y.Y.; Li, X.B.; Tan, M.H.; Wang, X.; Xin, L.J. The impact of cultivated land spatial shift on food crop production in China, 1990–2010. Land Degrad. Dev. 2018, 29, 1652–1659. [Google Scholar] [CrossRef]
- Zhang, Z.X.; Wen, Q.K.; Liu, F.; Zhao, X.L.; Liu, B.; Xu, J.Y.; Yi, L.; Hu, S.G.; Wang, X.; Zuo, L.J.; et al. Urban expansion in China and its effect on cultivated land before and after initiating “Reform and Open Policy”. Sci. China-Earth Sci. 2016, 59, 1930–1945. [Google Scholar] [CrossRef]
- Liu, L.; Liu, Z.J.; Gong, J.Z.; Wang, L.; Hu, Y.M. Quantifying the amount, heterogeneity, and pattern of farmland: Implications for China’s requisition-compensation balance of farmland policy. Land Use Policy 2019, 81, 256–266. [Google Scholar] [CrossRef]
- Jin, X.B.; Zhang, Z.H.; Wu, X.W.; Xiang, X.M.; Sun, W.; Bai, Q.; Zhou, Y.K. Co-ordination of land exploitation, exploitable farmland reserves and national planning in China. Land Use Policy 2016, 57, 682–693. [Google Scholar] [CrossRef]
- Song, W.; Pijanowski, B.C. The effects of China’s cultivated land balance program on potential land productivity at a national scale. Appl. Geogr. 2014, 46, 158–170. [Google Scholar] [CrossRef]
- Li, W.B.; Wang, D.Y.; Wang, Q.; Liu, S.H.; Zhu, Y.L.; Wu, W.J. Impacts from Land Use Pattern on Spatial Distribution of Cultivated Soil Heavy Metal Pollution in Typical Rural-Urban Fringe of Northeast China. Int. J. Environ. Res. Public Health 2017, 14, 336. [Google Scholar] [CrossRef]
- Khaledian, Y.; Kiani, F.; Ebrahimi, S.; Brevik, E.C.; Aitkenhead-Peterson, J. Assessment and Monitoring of Soil Degradation during Land Use Change Using Multivariate Analysis. Land Degrad. Dev. 2017, 28, 128–141. [Google Scholar] [CrossRef]
- Li, N.; Yan, C.Z.; Xie, J.L.; Ma, J.X. Cultivated-land change in Mu Us Sandy Land of China before and after the first-stage grain-for-green policy. Sci. Cold Arid Reg. 2018, 10, 347–353. [Google Scholar] [CrossRef]
- Lu, H.; Xie, H.L.; Lv, T.G.; Yao, G.R. Determinants of cultivated land recuperation in ecologically damaged areas in China. Land Use Policy 2019, 81, 160–166. [Google Scholar] [CrossRef]
- Yang, Q.Y.; Xin, G.X.; Jiang, J.L.; CHEN, Z.T. The comparison and implications of crop rotation and fallow in the western countries and east asian. China Land Sci. 2017, 31, 71–79. (In Chinese) [Google Scholar]
- Baumhardt, R.L.; Schwartz, R.C.; MacDonald, J.C.; Tolk, J.A. Tillage and Cattle Grazing Effects on Soil Properties and Grain Yields in a Dryland Wheat-Sorghum-Fallow Rotation. Agron. J. 2011, 103, 914–922. [Google Scholar] [CrossRef]
- Kovacs-Hostyanszki, A.; Baldi, A. Set-aside fields in agri-environment schemes can replace the market-driven abolishment of fallows. Biol. Conserv. 2012, 152, 196–203. [Google Scholar] [CrossRef]
- Nielsen, D.C.; Lyon, D.J.; Miceli-Garcia, J.J. Replacing fallow with forage triticale in a dryland wheat-corn-fallow rotation may increase profitability. Field Crop. Res. 2017, 203, 227–237. [Google Scholar] [CrossRef]
- Wittman, H.K.; Johnson, M.S. Fallow management practices in Guatemala’s Western Highlands: Social drivers and biophysical impacts. Land Degrad. Dev. 2008, 19, 178–189. [Google Scholar] [CrossRef]
- Baumhardt, R.L.; Schwartz, R.C.; Greene, L.W.; MacDonald, J.C. Cattle Gain and Crop Yield for a Dryland Wheat-Sorghum-Fallow Rotation. Agron. J. 2009, 101, 150–158. [Google Scholar] [CrossRef]
- Chen, C.W.; Hsu, N.S.; Wu, C.S. Optimal fallow area and location for multifunctional benefits of a paddy field during drought periods. Paddy Water Environ. 2014, 12, 319–333. [Google Scholar] [CrossRef]
- Steinberg, M.K. Political ecology and cultural change: Impacts on swidden-fallow agroforestry practices among the Mopan Maya in southern Belize. Prof. Geogr. 1998, 50, 407–417. [Google Scholar] [CrossRef]
- Harris, F. Nutrient management strategies of small-holder farmers in a short-fallow farming system in north-east Nigeria. Geogr. J. 1999, 165, 275–285. [Google Scholar] [CrossRef]
- Carswell, G. Farmers and fallowing: Agricultural change in Kigezi District, Uganda. Geogr. J. 2002, 168, 130–140. [Google Scholar] [CrossRef]
- Thomsen, M.G.; Mangerud, K.; Riley, H.; Brandsaeter, L.O. Method, timing and duration of bare fallow for the control of Cirsium arvense and other creeping perennials. Crop Prot. 2015, 77, 31–37. [Google Scholar] [CrossRef]
- Schillinger, W.F.; Young, D.L. Best Management Practices for Summer Fallow in the World’s Driest Rainfed Wheat Region. Soil Sci. Soc. Am. J. 2014, 78, 1707–1715. [Google Scholar] [CrossRef]
- Yu, J.L.; Boyd, N.S.; Guan, Z.F. Relay-cropping and Fallow Programs for Strawberry-based Production System: Effects on Crop Productivity and Weed Control. Hortscience 2018, 53, 445–450. [Google Scholar] [CrossRef]
- Shi, K.F.; Yang, Q.Y.; Li, Y.Q.; Sun, X.F. Mapping and evaluating cultivated land fallow in Southwest China using multisource data. Sci. Total Environ. 2019, 654, 987–999. [Google Scholar] [CrossRef] [PubMed]
- Williams, J.R.; Llewelyn, R.V.; Pendell, D.L.; Schlegel, A.; Dumler, T. A Risk Analysis of Converting Conservation Reserve Program Acres to a Wheat-Sorghum-Fallow Rotation. Agron. J. 2010, 102, 612–622. [Google Scholar] [CrossRef]
- Gilley, J.E.; Doran, J.W.; Eghball, B. Tillage and fallow effects on selected soil quality characteristics of former conservation reserve program sites. J. Soil Water Conserv. 2001, 56, 126–132. [Google Scholar]
- Etheredge, L.M.; Griffin, J.L.; Salassi, M.E. Efficacy and Economics of Summer Fallow Conventional and Reduced-Tillage Programs for Sugarcane. Weed Technol. 2009, 23, 274–279. [Google Scholar] [CrossRef]
- Xie, H.L.; Cheng, L.J.; Lv, T.G. Factors Influencing Farmer Willingness to Fallow Winter Wheat and Ecological Compensation Standards in a Groundwater Funnel Area in Hengshui, Hebei Province, China. Sustainability 2017, 9, 839. [Google Scholar] [CrossRef]
- Yang, Q.Y.; Chen, Z.T.; Xin, G.X.; Zeng, L. the historical evolution of chinese cultivation system and some thoughts on the current land fallow and crop rotation policy. West Forum 2018, 28, 1–8. (In Chinese) [Google Scholar]
- Chen, Z.T.; Yang, Q.Y. Fundamental framework of China’s fallow system. China Popul. Resour. Environ. 2017, 27, 126–136. (In Chinese) [Google Scholar]
- Wang, C.; Siriwardana, M.; Meng, S. Effects of the Chinese arable land fallow system and land-use change on agricultural production and on the economy. Econ. Model. 2019, 79, 186–197. [Google Scholar] [CrossRef]
- Zhang, S.L.; Yang, X.Y.; Lovdahl, L. Soil Management Practice Effect on Water Balance of a Dryland Soil during Fallow Period on the Loess Plateau of China. Soil Water Res. 2016, 11, 64–73. [Google Scholar] [CrossRef]
- Zhao, W.F.; Gao, Z.Q.; Sun, M.; Deng, L.F. Effects of tillage during fallow period on soil water and wheat yield of dryland. J. Food Agric. Environ. 2013, 11, 609–613. [Google Scholar]
- National Bureau of statistics of the People’s Republic of China. 2017 China Statistical Yearbook; China Statistical Press: Beijing, China, 2017.
- Wang, Y.S. The Challenges and Strategies of Food Security under Rapid Urbanization in China. Sustainability 2019, 11, 542. [Google Scholar] [CrossRef]
- Leroy, J.L.; Ruel, M.; Frongillo, E.A.; Harris, J.; Ballard, T.J. Measuring the Food Access Dimension of Food Security: A Critical Review and Mapping of Indicators. Food Nutr. Bull. 2015, 36, 167–195. [Google Scholar] [CrossRef]
- Candel, J.J.L. Food security governance: A systematic literature review. Food Secur. 2014, 6, 585–601. [Google Scholar] [CrossRef]
- Janin, P.; Dury, S. The new frontiers of food security. A prospective review. Cah. Agric. 2012, 21, 285–292. [Google Scholar] [CrossRef]
- Food and Agriculture Organization of the United Nations. Food Security. Available online: http://www.fao.org/forestry/13128-0e6f36f27e0091055bec28ebe830f46b3.pdf (accessed on 27 February 2019).
- World Bank. Surface Arzea. Available online: https://data.worldbank.org/indicator/AG.SRF.TOTL.K2?year_high_desc=true (accessed on 29 April 2019).
- Yang, R.H.; Yang, Q.Y.; Chen, Y.D.; Zeng, L. Cultivated area-food-population system in land fallow area and analysis of spatio-temporal evolution and prediction of cultivated land index. Agric. Res. Arid Areas 2018, 36, 270–278. (In Chinese) [Google Scholar]
- Qiu, G.Y.; Zhang, X.N.; Yu, X.H.; Zou, Z.D. The increasing effects in energy and GHG emission caused by groundwater level declines in North China’s main food production plain. Agric. Water Manag. 2018, 203, 138–150. [Google Scholar] [CrossRef]
- Wu, X.Y.; Zhang, X.F.; Dong, S.K.; Cai, H.; Zhao, T.R.; Yang, W.J.; Jiang, R.; Shi, Y.D.; Shao, J.L. Local perceptions of rangeland degradation and climate change in the pastoral society of Qinghai-Tibetan Plateau. Rangel. J. 2015, 37, 11–19. [Google Scholar] [CrossRef]
- Xie, H.L.; Wang, W.; Zhang, X.M. Evolutionary game and simulation of management strategies of fallow cultivated land: A case study in Hunan province, China. Land Use Policy 2018, 71, 86–97. [Google Scholar] [CrossRef]
- Cai, Y.L.; Fu, Z.Q.; Dai, E.F. The minimum area per capita of cultivated land and its implication for the optimization of land resource allocation. Acta Geogr. Sin. 2002, 2, 127–134. (In Chinese) [Google Scholar]
- Zhu, H.B.; Zhang, A.L. Analyzing Temporal and Spatial Distribution Characteristics of Pressure Index of Cultivated Land in China. Resour. Sci. 2007, 2, 104–108. (In Chinese) [Google Scholar]
- Cai, Y.L.; Wang, Y.; Li, Y.P. Study on changing relationship of demand and supply of cultivated land in China. China Land Sci. 2009, 23, 11–18. (In Chinese) [Google Scholar]
- Zhang, Y.J.; Yan, X.S.; Zhang, F.; Xiao, Z.C. Analysis on temporal-spatial difference of cultivated land pressure at multiple scales in China from 1978 to 2015. Trans. Chin. Soc. Agric. Eng. 2018, 34, 1–7. (In Chinese) [Google Scholar]
- Luo, X.; Zeng, J.X.; Zhu, Y.Y.; Zhang, L. Who will feed China: The role and explanation of China’s farmland pressure in food security. Geogr. Res. 2016, 35, 2216–2226. (In Chinese) [Google Scholar]
- Tan, S.K.; Zhang, L.; Qi, R. Research on regional pressure index of cultivated land based on system dynamics—A case study of Hubei province. J. Nat. Resour. 2012, 5, 757–764. (In Chinese) [Google Scholar]
- Zhu, H.B.; Sun, H.N. Cultivated land pressure index model based on grain economy acquisition ability. Guangdong Land Sci. 2015, 5, 15–18. (In Chinese) [Google Scholar]
- Xin, L.J.; Wang, J.Y.; Wang, L.X. Prospect of per capita grain demand driven by dietary structure change in China. Resour. Sci. 2015, 37, 1347–1356. (In Chinese) [Google Scholar]
- Ding, M.J.; Chen, Q.; Xin, L.J.; Li, L.H.; Li, X.B. Spatial and temporal variations of multiple cropping index in China based on SPOT-NDVI during 1999–2013. Acta Geogr. Sin 2015, 70, 1080–1090. (In Chinese) [Google Scholar] [CrossRef]
- Department of Plantation Management, Ministry of Agriculture, China. Notice on Printing Exploration the Pilot Program for Implementing the Crop-Rotation and Fallow System. Available online: http://jiuban.moa.gov.cn/zwllm/tzgg/tz/201606/t20160629_5190955.htm (accessed on 27 February 2019).
- Zhang, H.; Wang, Y. Spatial differentiation of cropland pressure and its socio-economic factors in China based on panel data of 342 prefectural-level units. Geogr. Res. 2017, 36, 731–742. (In Chinese) [Google Scholar]
- Cheng, l.S.; Shi, W.Y. Effects of land conversion projects on the land pressure—Taking wulong county as a case. Chin. J. Agric. Resour. Reg. Plan. 2018, 39, 201–206. (In Chinese) [Google Scholar]
- van Noordwijk, M. Scale effects in crop-fallow rotations. Agrofor. Syst. 1999, 47, 239–251. [Google Scholar] [CrossRef]
- Cotta, J.N. Revisiting Bora fallow agroforestry in the Peruvian Amazon: Enriching ethnobotanical appraisals of non-timber products through household income quantification. Agrofor. Syst. 2017, 91, 17–36. [Google Scholar] [CrossRef]
- Partey, S.T.; Zougmore, R.B.; Ouedraogo, M.; Thevathasan, N.V. Why Promote Improved Fallows as a Climate-Smart Agroforestry Technology in Sub-Saharan Africa? Sustainability 2017, 9, 1887. [Google Scholar] [CrossRef]
- Hauser, S.; Bengono, B.; Bitomo, O.E. Short- and long-term maize yield response to Mucuna pruriens and Pueraria phaseoloides relay fallow and biomass burning versus mulching in the forest zone of southern Cameroon. Biol. Agric. Hortic. 2008, 26, 1–17. [Google Scholar] [CrossRef]
- Krupnik, T.J.; Ahmed, Z.U.; Timsina, J.; Shahjahan, M.; Kurishi, A.; Miah, A.A.; Rahman, B.M.S.; Gathala, M.K.; McDonald, A.J. Forgoing the fallow in Bangladesh’s stress-prone coastal deltaic environments: Effect of sowing date, nitrogen, and genotype on wheat yield in farmers’ fields. Field Crop. Res. 2015, 170, 7–20. [Google Scholar] [CrossRef]
Figure 1.
Location of the five pilot provinces.

Figure 2.
Change in the minimal demand of the cultivated land per capita and cultivated land pressure index (K) in China during the period of 2000–2016.
Figure 2.
Change in the minimal demand of the cultivated land per capita and cultivated land pressure index (K) in China during the period of 2000–2016.

Figure 3.
Spatiotemporal change in cultivated land pressure in China at a province scale during the period of 2000–2016.
Figure 3.
Spatiotemporal change in cultivated land pressure in China at a province scale during the period of 2000–2016.

Figure 4.
Spatiotemporal change in cultivated land pressure in China at the prefecture-scale city scale during the period of 2000–2016.
Figure 4.
Spatiotemporal change in cultivated land pressure in China at the prefecture-scale city scale during the period of 2000–2016.

Figure 5.
Comparison of K under a fallow or non-fallow scenario in China at the prefecture scale during the period of 2000–2020. Note: Ko400, Ko424, and Ko437 represent the cultivated land pressure under the three situations of annual grain demand per capita when there is no fallow policy (Gr = 400, 424, and 437, respectively); Ko’400, Ko’424, Ko’437, Ko″424, Ko″437, Ko’’’420, Ko’’’424, and Ko’’’437 represent the cultivated land pressure under the three situations of annual grain demand per capita (Gr = 400, 424, and 437) under the first, second, and third scenarios of annual grain demand per capita.


Table 1.
The number and name of provincial regions (K < 1.00).
| Year | Number of Provincial Regions (K < 1.00) | Name of Provincial Regions (K < 1.00) |
|---|---|---|
| 2001 | 16 | Jilin, Heilongjiang, Shanghai, Jiangsu, Zhejiang, Anhui, Fujian, Jiangxi, Shandong, Henan, Hubei, Hunan, Guangdong, Chongqing, Sichuan, and Xinjiang |
| 2005 | 16 | Inner Mongolia, Liaoning, Jilin, Heilongjiang, Jiangsu, Zhejiang, Anhui, Fujian, Jiangxi, Shandong, Henan, Hubei, Hunan, Guangdong, Chongqing, and Sichuan |
| 2009 | 15 | Jiangsu, Shandong, Jilin, Hubei, Inner Mongolia, Henan, Hunan, Heilongjiang, Anhui, Jiangxi, Sichuan, Xinjiang, Chongqing, Hebei, and Liaoning |
| 2013 | 15 | Hebei, Inner Mongolia, Liaoning, Jilin, Heilongjiang, Jiangsu, Anhui, Jiangxi, Shandong, Henan, Hubei, Hunan, Chongqing, Sichuan, and Xinjiang |
| 2016 | 12 | Inner Mongolia, Jilin, Heilongjiang, Jiangsu, Anhui, Jiangxi, Shandong, Henan, Hubei, Hunan, Chongqing, and Xinjiang |
Table 2.
Three scenarios and their meanings.
| Type | Meaning |
|---|---|
| Scenario I | Scalet+1 = Scalet, Scalet+2 = Scalet+1 … Scalet+n = Scalet+n−1 |
| Scenario II | Scalet+1 = 2 × Scalet, Scalet+2 = 2 × Scalet+1 … Scalet+n = 2 × Scalet+n−1 |
| Scenario III | Scalet+1 = Scalet, Scalet+2 = 2 × Scalet+1 … Scalet+n−1 = Scalet+n−2, Scalet+n = 2 × Scalet+n−1 |
Table 3.
Comparison of Ks among the five pilot provinces.
| Year | Hebei | Yunnan | Guizhou | Gansu | Hunan | |||||
|---|---|---|---|---|---|---|---|---|---|---|
| K | K’ | K | K’ | K | K’ | K | K’ | K | K’ | |
| 2000 | 1.030 | 1.030 | 1.156 | 1.156 | 1.294 | 1.294 | 1.433 | 1.433 | 0.954 | 0.954 |
| 2001 | 1.075 | 1.075 | 1.154 | 1.154 | 1.281 | 1.281 | 1.361 | 1.361 | 1.060 | 1.060 |
| 2002 | 1.106 | 1.106 | 1.217 | 1.217 | 1.484 | 1.484 | 1.294 | 1.294 | 1.091 | 1.091 |
| 2003 | 1.134 | 1.134 | 1.190 | 1.190 | 1.402 | 1.402 | 1.286 | 1.286 | 0.953 | 0.953 |
| 2004 | 1.098 | 1.098 | 1.170 | 1.170 | 1.358 | 1.358 | 1.261 | 1.261 | 0.886 | 0.886 |
| 2005 | 1.054 | 1.054 | 1.175 | 1.175 | 1.295 | 1.295 | 1.216 | 1.216 | 0.956 | 0.956 |
| 2006 | 0.992 | 0.992 | 1.230 | 1.230 | 1.422 | 1.422 | 1.261 | 1.261 | 0.874 | 0.874 |
| 2007 | 0.977 | 0.977 | 1.236 | 1.236 | 1.320 | 1.320 | 1.236 | 1.236 | 0.910 | 0.910 |
| 2008 | 0.962 | 0.962 | 1.197 | 1.197 | 1.242 | 1.242 | 1.148 | 1.148 | 0.883 | 0.883 |
| 2009 | 0.967 | 0.967 | 1.159 | 1.159 | 1.211 | 1.211 | 1.128 | 1.128 | 0.923 | 0.923 |
| 2010 | 0.967 | 0.967 | 1.116 | 1.116 | 1.251 | 1.251 | 1.069 | 1.069 | 0.898 | 0.898 |
| 2011 | 0.913 | 0.913 | 1.055 | 1.055 | 1.582 | 1.582 | 1.011 | 1.011 | 0.883 | 0.883 |
| 2012 | 0.898 | 0.898 | 1.020 | 1.020 | 1.291 | 1.291 | 0.929 | 0.929 | 0.915 | 0.915 |
| 2013 | 0.872 | 0.872 | 1.028 | 1.028 | 1.360 | 1.360 | 0.907 | 0.907 | 0.898 | 0.898 |
| 2014 | 0.879 | 0.879 | 1.013 | 1.013 | 1.232 | 1.232 | 0.894 | 0.894 | 0.904 | 0.904 |
| 2015 | 0.883 | 0.883 | 1.011 | 1.011 | 1.197 | 1.197 | 0.888 | 0.888 | 0.924 | 0.924 |
| Scenario I | ||||||||||
| 2016 | 0.893 | 0.902 | 1.029 | 1.029 | 1.193 | 1.193 | 0.915 | 0.916 | 0.902 | 0.904 |
| 2017 | 0.886 | 0.895 | 1.017 | 1.019 | 1.167 | 1.169 | 0.922 | 0.924 | 0.871 | 0.872 |
| 2018 | 0.878 | 0.897 | 1.006 | 1.009 | 1.205 | 1.210 | 0.834 | 0.836 | 0.865 | 0.867 |
| 2019 | 0.871 | 0.890 | 0.994 | 0.997 | 1.194 | 1.199 | 0.810 | 0.812 | 0.858 | 0.861 |
| 2020 | 0.864 | 0.882 | 0.983 | 0.986 | 1.184 | 1.188 | 0.786 | 0.788 | 0.852 | 0.855 |
| Scenario II | ||||||||||
| 2016 | 0.893 | 0.902 | 1.029 | 1.029 | 1.193 | 1.193 | 0.915 | 0.916 | 0.902 | 0.904 |
| 2017 | 0.886 | 0.895 | 1.017 | 1.019 | 1.167 | 1.169 | 0.922 | 0.924 | 0.871 | 0.872 |
| 2018 | 0.878 | 0.897 | 1.006 | 1.009 | 1.205 | 1.210 | 0.834 | 0.836 | 0.865 | 0.867 |
| 2019 | 0.871 | 0.909 | 0.994 | 1.001 | 1.194 | 1.204 | 0.810 | 0.812 | 0.858 | 0.864 |
| 2020 | 0.864 | 0.942 | 0.983 | 0.995 | 1.184 | 1.202 | 0.786 | 0.788 | 0.852 | 0.863 |
| Scenario III | ||||||||||
| 2016 | 0.893 | 0.902 | 1.029 | 1.029 | 1.193 | 1.193 | 0.915 | 0.916 | 0.902 | 0.904 |
| 2017 | 0.886 | 0.895 | 1.017 | 1.019 | 1.167 | 1.169 | 0.922 | 0.924 | 0.871 | 0.872 |
| 2018 | 0.878 | 0.897 | 1.006 | 1.009 | 1.205 | 1.210 | 0.834 | 0.836 | 0.865 | 0.867 |
| 2019 | 0.871 | 0.890 | 0.994 | 0.997 | 1.194 | 1.199 | 0.810 | 0.812 | 0.858 | 0.861 |
| 2020 | 0.864 | 0.901 | 0.983 | 0.989 | 1.184 | 1.193 | 0.786 | 0.788 | 0.852 | 0.857 |
Table 4.
Changes in K under fallow and non-fallow scenarios in the pilot provinces.
| Year | Hebei | Yunnan | Guizhou | Gansu | Hunan | ||||||||||
|---|---|---|---|---|---|---|---|---|---|---|---|---|---|---|---|
| K | K’ | ΔK | K | K’ | ΔK | K | K’ | ΔK | K | K’ | ΔK | K | K’ | ΔK | |
| Scenario I | |||||||||||||||
| 2016 | 0.893 | 0.902 | 0.943% | 1.029 | 1.029 | 0.017% | 1.193 | 1.193 | 0.027% | 0.915 | 0.916 | 0.026% | 0.902 | 0.904 | 0.156% |
| 2017 | 0.886 | 0.895 | 1.044% | 1.017 | 1.019 | 0.169% | 1.167 | 1.169 | 0.245% | 0.922 | 0.924 | 0.252% | 0.871 | 0.872 | 0.155% |
| 2018 | 0.878 | 0.897 | 2.111% | 1.006 | 1.009 | 0.329% | 1.205 | 1.210 | 0.449% | 0.834 | 0.836 | 0.243% | 0.865 | 0.867 | 0.308% |
| 2019 | 0.871 | 0.890 | 2.112% | 0.994 | 0.997 | 0.320% | 1.194 | 1.199 | 0.411% | 0.810 | 0.812 | 0.234% | 0.858 | 0.861 | 0.305% |
| 2020 | 0.864 | 0.882 | 2.114% | 0.983 | 0.986 | 0.312% | 1.184 | 1.188 | 0.376% | 0.786 | 0.788 | 0.226% | 0.852 | 0.855 | 0.302% |
| Scenario II | |||||||||||||||
| 2016 | 0.893 | 0.902 | 0.943% | 1.029 | 1.029 | 0.017% | 1.193 | 1.193 | 0.027% | 0.915 | 0.916 | 0.026% | 0.902 | 0.904 | 0.156% |
| 2017 | 0.886 | 0.895 | 1.044% | 1.017 | 1.019 | 0.169% | 1.167 | 1.169 | 0.245% | 0.922 | 0.924 | 0.252% | 0.871 | 0.872 | 0.155% |
| 2018 | 0.878 | 0.897 | 2.111% | 1.006 | 1.009 | 0.329% | 1.205 | 1.210 | 0.449% | 0.834 | 0.836 | 0.243% | 0.865 | 0.867 | 0.308% |
| 2019 | 0.871 | 0.909 | 4.316% | 0.994 | 1.001 | 0.643% | 1.194 | 1.204 | 0.825% | 0.810 | 0.812 | 0.234% | 0.858 | 0.864 | 0.612% |
| 2020 | 0.864 | 0.942 | 9.027% | 0.983 | 0.995 | 1.258% | 1.184 | 1.202 | 1.520% | 0.786 | 0.788 | 0.226% | 0.852 | 0.863 | 1.221% |
| Scenario III | |||||||||||||||
| 2016 | 0.893 | 0.902 | 0.943% | 1.029 | 1.029 | 0.017% | 1.193 | 1.193 | 0.027% | 0.915 | 0.916 | 0.026% | 0.902 | 0.904 | 0.156% |
| 2017 | 0.886 | 0.895 | 1.044% | 1.017 | 1.019 | 0.169% | 1.167 | 1.169 | 0.245% | 0.922 | 0.924 | 0.252% | 0.871 | 0.872 | 0.155% |
| 2018 | 0.878 | 0.897 | 2.111% | 1.006 | 1.009 | 0.329% | 1.205 | 1.210 | 0.449% | 0.834 | 0.836 | 0.243% | 0.865 | 0.867 | 0.308% |
| 2019 | 0.871 | 0.890 | 2.112% | 0.994 | 0.997 | 0.320% | 1.194 | 1.199 | 0.411% | 0.810 | 0.812 | 0.234% | 0.858 | 0.861 | 0.305% |
| 2020 | 0.864 | 0.901 | 4.319% | 0.983 | 0.989 | 0.625% | 1.184 | 1.193 | 0.754% | 0.786 | 0.788 | 0.226% | 0.852 | 0.857 | 0.607% |
© 2019 by the authors. Licensee MDPI, Basel, Switzerland. This article is an open access article distributed under the terms and conditions of the Creative Commons Attribution (CC BY) license (http://creativecommons.org/licenses/by/4.0/).
Share and Cite
MDPI and ACS Style
Yang, Q.; Yang, R.; Wang, Y.; Shi, K. Does Fallowing Cultivated Land Threaten Food Security? Empirical Evidence from Chinese Pilot Provinces. Sustainability 2019, 11, 2836. https://doi.org/10.3390/su11102836
AMA Style
Yang Q, Yang R, Wang Y, Shi K. Does Fallowing Cultivated Land Threaten Food Security? Empirical Evidence from Chinese Pilot Provinces. Sustainability. 2019; 11(10):2836. https://doi.org/10.3390/su11102836
Chicago/Turabian StyleYang, Qingyuan, Renhao Yang, Yahui Wang, and Kaifang Shi. 2019. "Does Fallowing Cultivated Land Threaten Food Security? Empirical Evidence from Chinese Pilot Provinces" Sustainability 11, no. 10: 2836. https://doi.org/10.3390/su11102836
Note that from the first issue of 2016, this journal uses article numbers instead of page numbers. See further details here.