Article

A Model for Predicting Energy Usage Pattern Types with Energy Consumption Information According to the Behaviors of Single-Person Households in South Korea

1
Department of Architecture, Sejong University, Seoul 05006, Korea
2
School of Architecture, Yeungnam University, Gyeongsan 38541, Korea
*
Author to whom correspondence should be addressed.
Sustainability 2019, 11(1), 245; https://doi.org/10.3390/su11010245
Submission received: 13 December 2018 / Revised: 26 December 2018 / Accepted: 27 December 2018 / Published: 7 January 2019
(This article belongs to the Special Issue Smart Energy Management for Smart Grids)

Abstract

:
Residential energy consumption accounts for the majority of building energy consumption. Physical factors and technological developments to address this problem have been researched continuously. However, physical improvements have limitations, and there is a paradigm shift towards energy research based on occupant behavior. Furthermore, the rapid increase in the number of single-person households around the world is decreasing residential energy efficiency, which is an urgent problem that needs to be solved. This study prepared a large dataset for analysis based on the Korean Time Use Survey (KTUS), which provides behavioral data for actual occupants of single-person households, and energy usage pattern (EUP) types that were derived through K-modes clustering. The characteristics and energy consumption of each type of household were analyzed, and their relationships were examined. Finally, an EUP-type predictive model, with a prediction rate of 95.0%, was implemented by training a support vector machine, and an energy consumption information model based on a Gaussian process regression was provided. The results of this study provide useful basic data for future research on energy consumption based on the behaviors of occupants, and the method proposed in this study will also be applicable to other regions.

1. Introduction

Approximately 40% of global energy is consumed in buildings, and residences account for approximately 3/4 of the total energy consumption in buildings [1]. Energy consumption in residences is expected to continuously increase until 2040 [2]; consequently, active research is being conducted on energy savings in residences [3,4,5]. Since energy consumption in the residential sector accounts for a large part of total energy consumption, energy saved in this sector through continuous research and technological development will have a positive impact on the reduction of total energy consumption and greenhouse gases.
To examine the research trends related to residential energy, the paradigm is shifting toward an emphasis on the behaviors of occupants, as well as the physical and environmental factors that affect energy consumption [6,7,8,9]. The behaviors of occupants are considered an important factor that affects residential energy consumption since, given identical physical and environmental situations, energy consumption may still differ depending on the behaviors of occupants. Previous studies have indicated that occupants behaviors are a major factor in energy consumption, and have therefore predicted energy consumption based on these behaviors. However, researchers are facing difficulties in data collection due to privacy issues [10].
The recent increase in single-person households due to demographic changes is becoming an issue in various fields of research, and residential energy researchers are also paying attention to this. Yu et al. [11] investigated future scenarios of energy consumption through demographic changes, and anticipated that the increase in single-person households would increase energy consumption and carbon emissions, arguing that energy consumption measures must consider these factors. In South Korea, which is the target region of this study, single-person families have steadily increased since 1975. According to the Population and Housing Census [12], which was conducted in 2015, single-person households account for 27.2% of all households, emerging as the main household type in South Korea.
According to a study on single-person households and residential energy, the increase in single-person households has decreased the total energy consumption per household but doubled the power consumption of residential energy. This is due to the fact that even with only one occupant, energy consumption efficiency decreases with the use of basic household appliances [13]. Thus, energy experts are pointing out the problems with the increasing number of single-person households, and the need for countermeasures. Previous studies found that energy research, based on the behaviors of occupants, was necessary to effectively reduce energy consumption in residences. In particular, they observed demographic changes from the global trend of increasing single-person households and recognized the importance of, and the need for, research into energy consumption in single-person households.
Therefore, this study derives types of “energy usage patterns” (EUPs) using K-modes clustering for single-person households in South Korea. In addition, energy consumption data were extracted from EnergyPlus based on the behaviors of occupants, and three types of energy consumption data (total energy, cooling, and heating) were provided for each EUP type using a Gaussian process regression, in order to improve the use of this studies results. Finally, based on the results of a support vector machine (SVM), a model for predicting EUP types was implemented via household characteristics and living patterns.

2. Materials and Methods

In Section 2, we describe the overall research process, the data, and methods used for the purposes of the research.

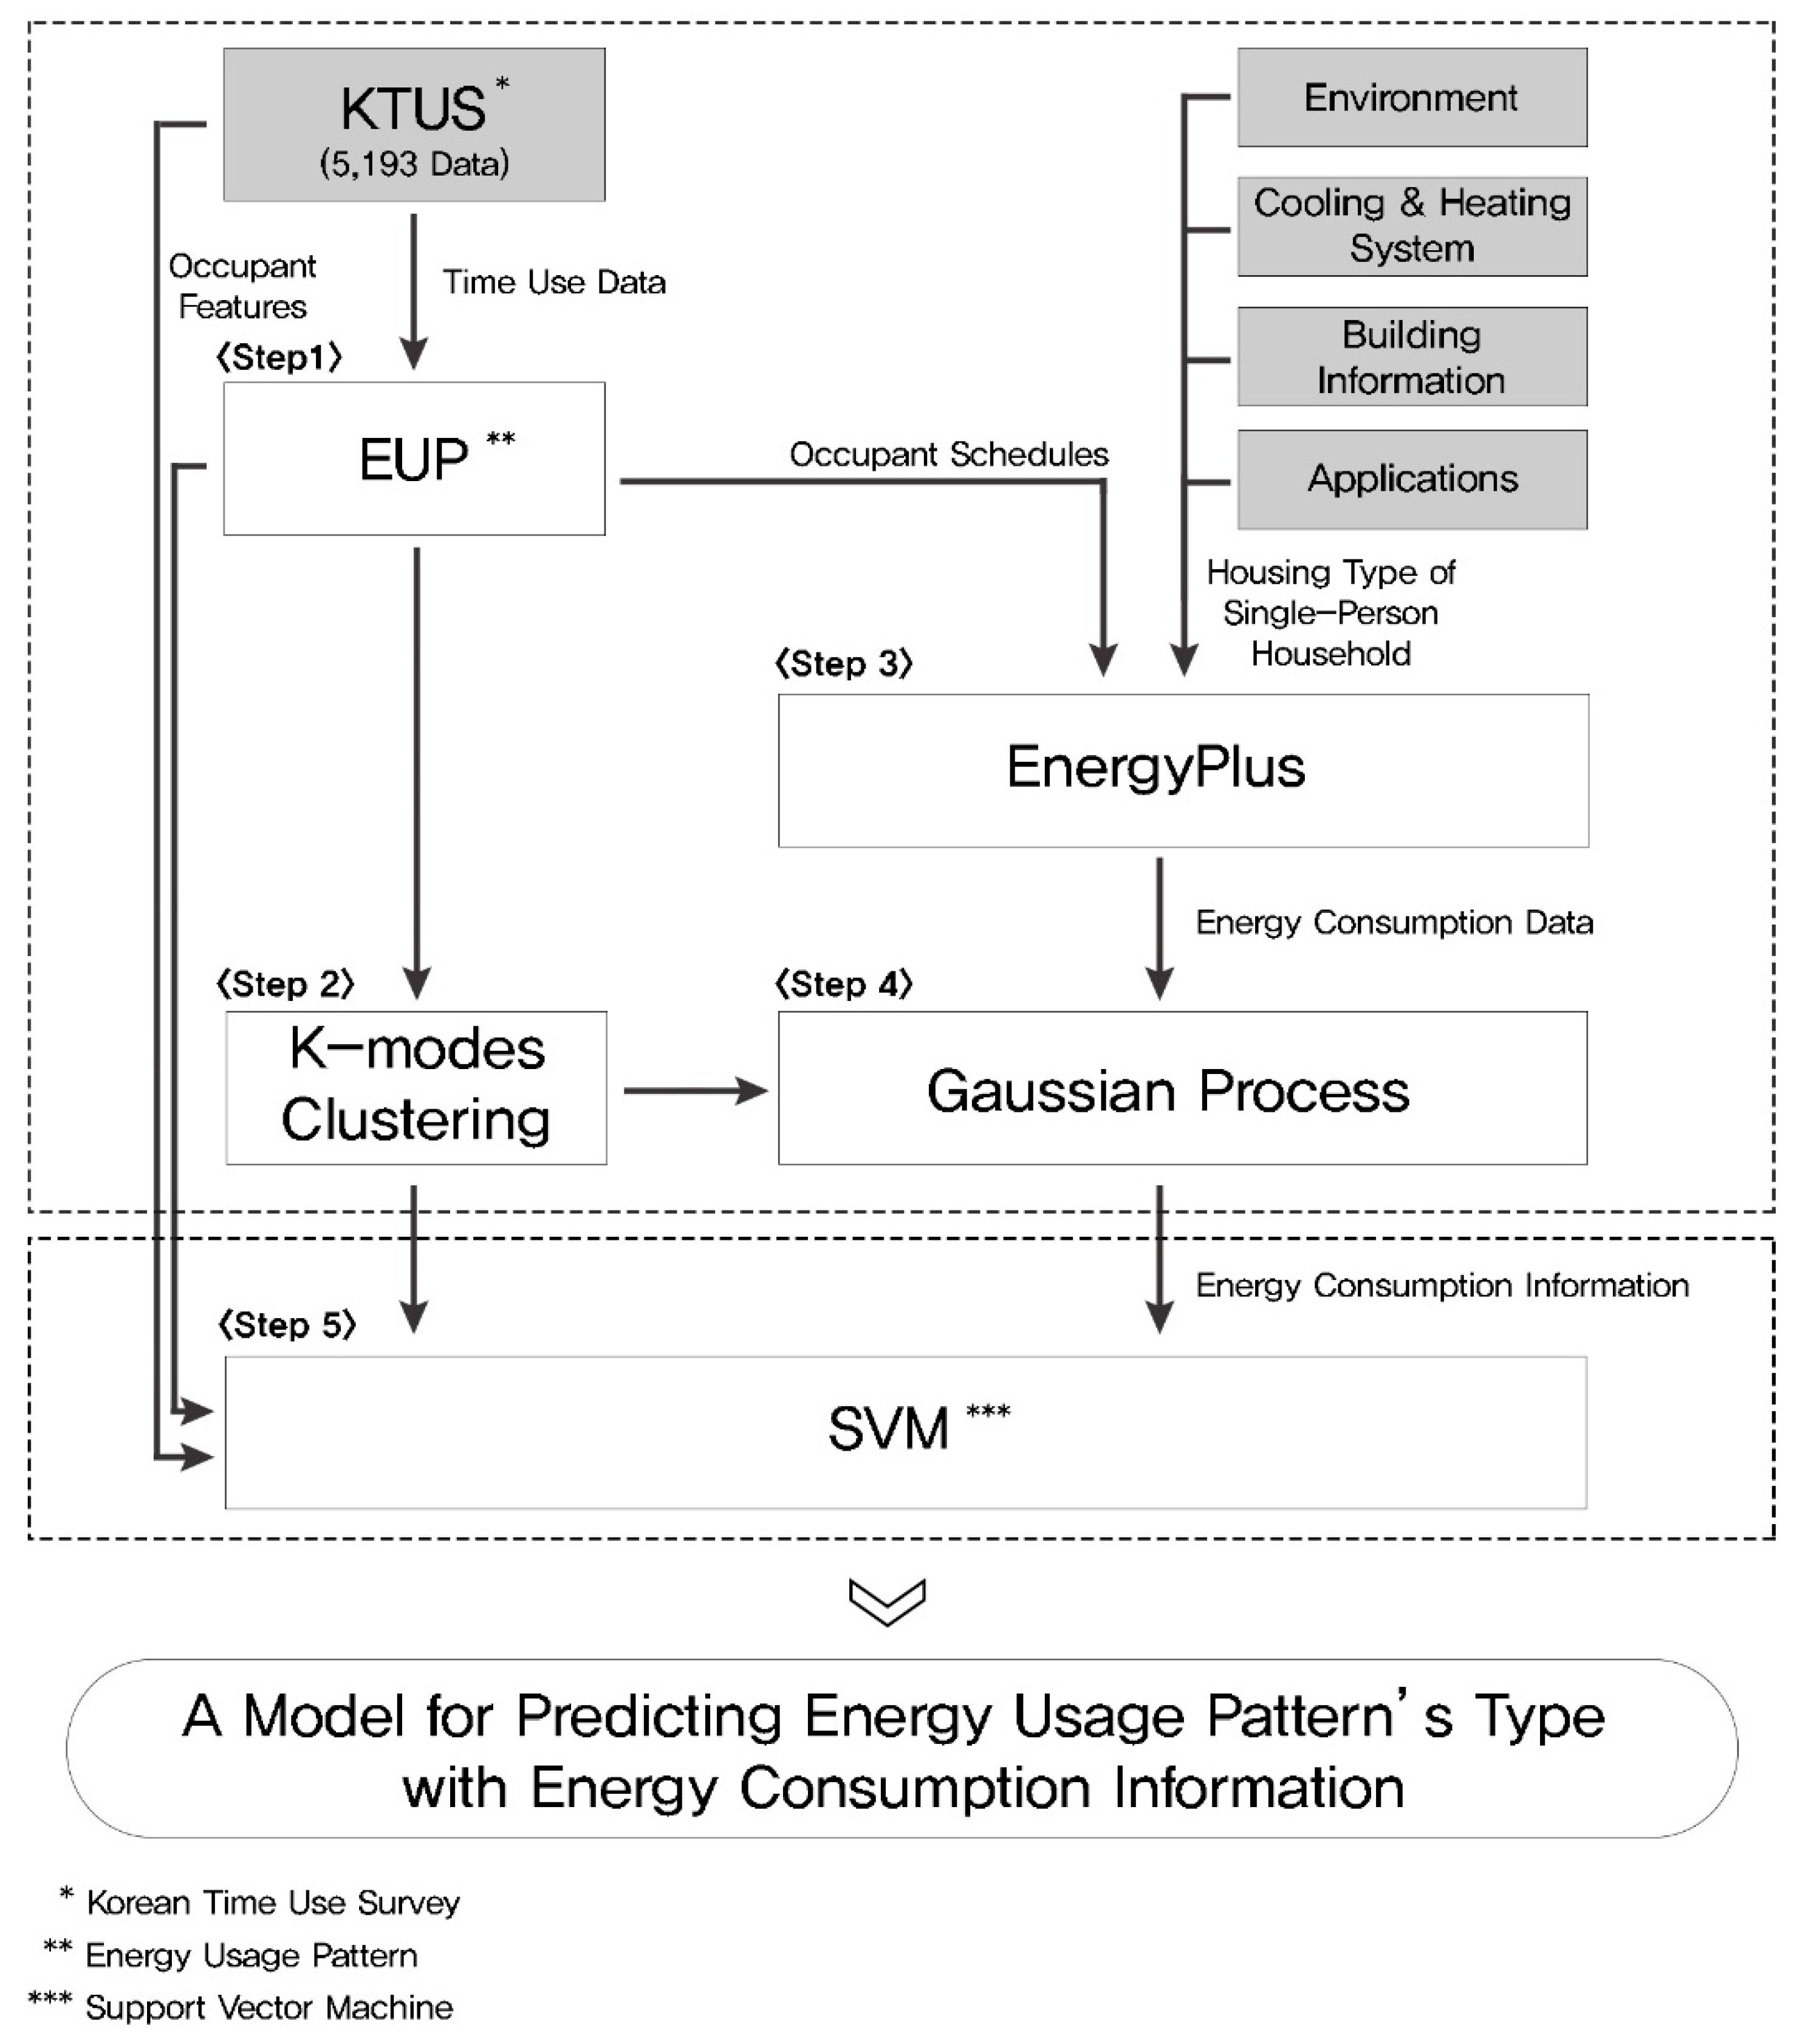
2.1. Research Process

Figure 1 shows the research process for creating a model to predict EUP types with energy consumption information, according to the behaviors of single-person households in South Korea.
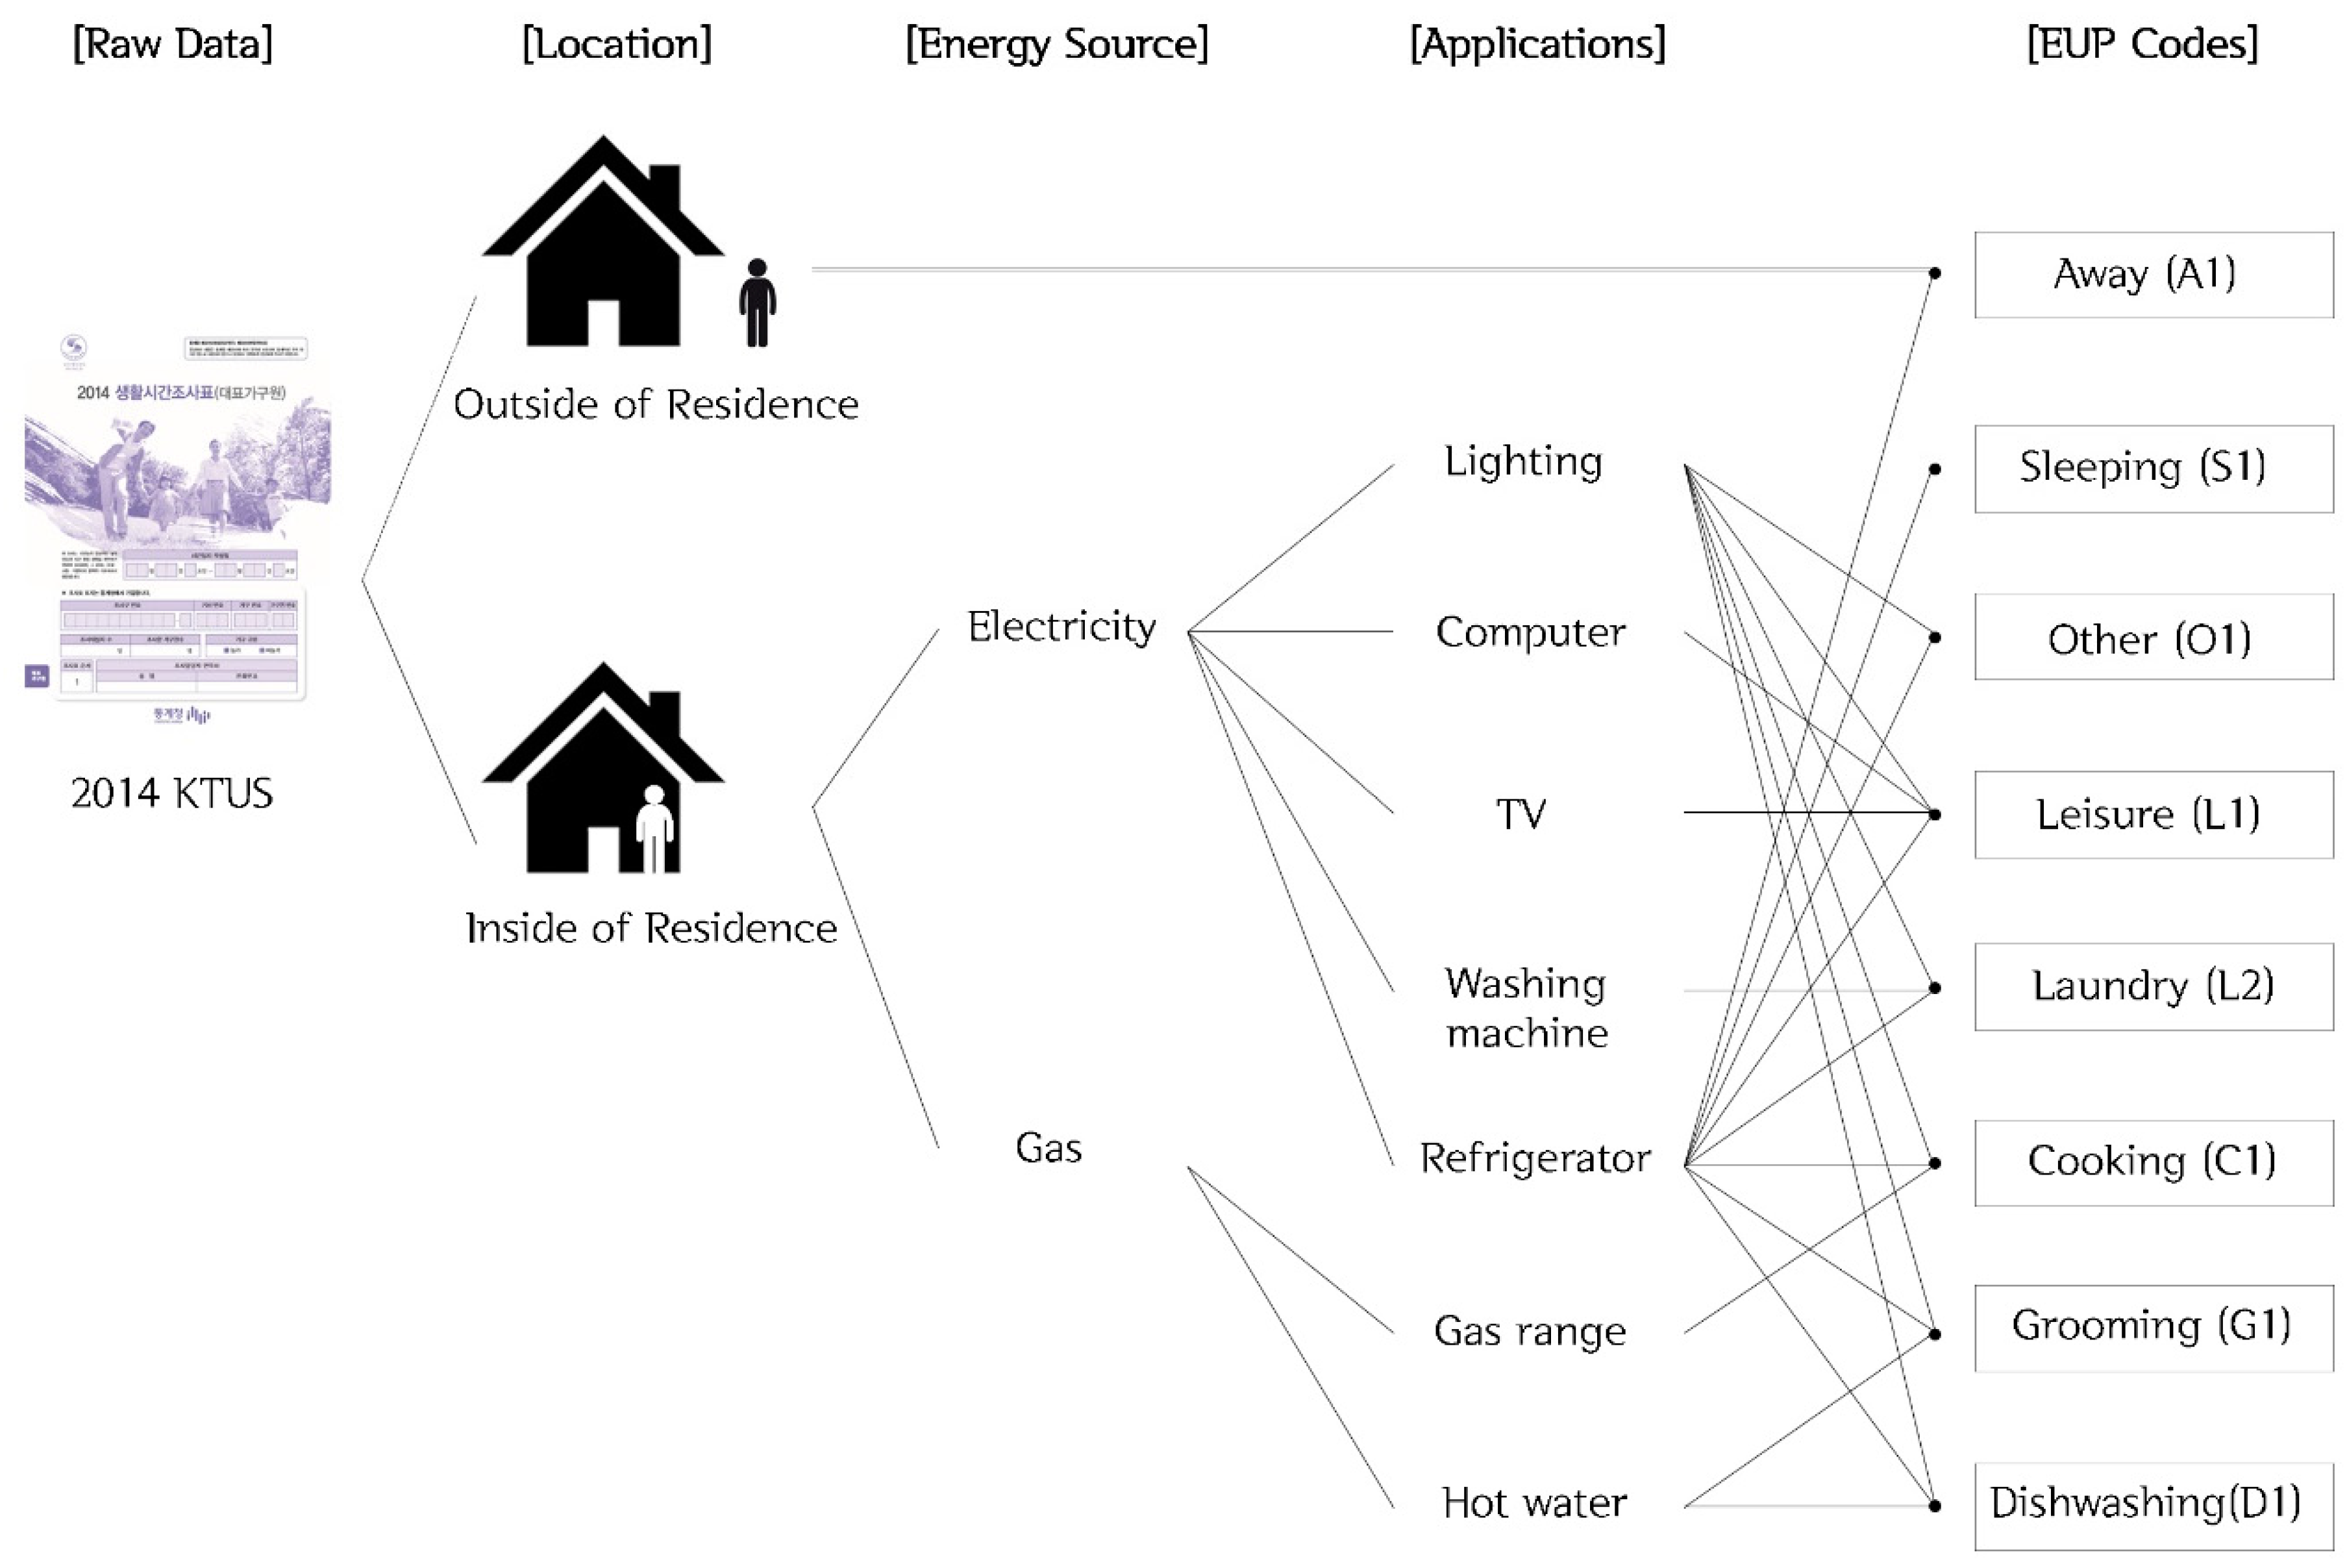
  • Step 1: Build 5193 EUP datasets by redefining 5193 “Korean Time Use Survey (KTUS)” data points [14] through codes related to energy consumption.
  • Step 2: Derive EUP types by performing K-modes clustering analysis with the EUP dataset built in Step 1.
  • Step 3: Create 5193 “occupant schedules” to become inputs into EnergyPlus using the EUP dataset built in Step 1. Implement representative residential environments of Korean single-person households, and extract 5193 points of “energy consumption data” based on occupant behaviors through energy simulation.
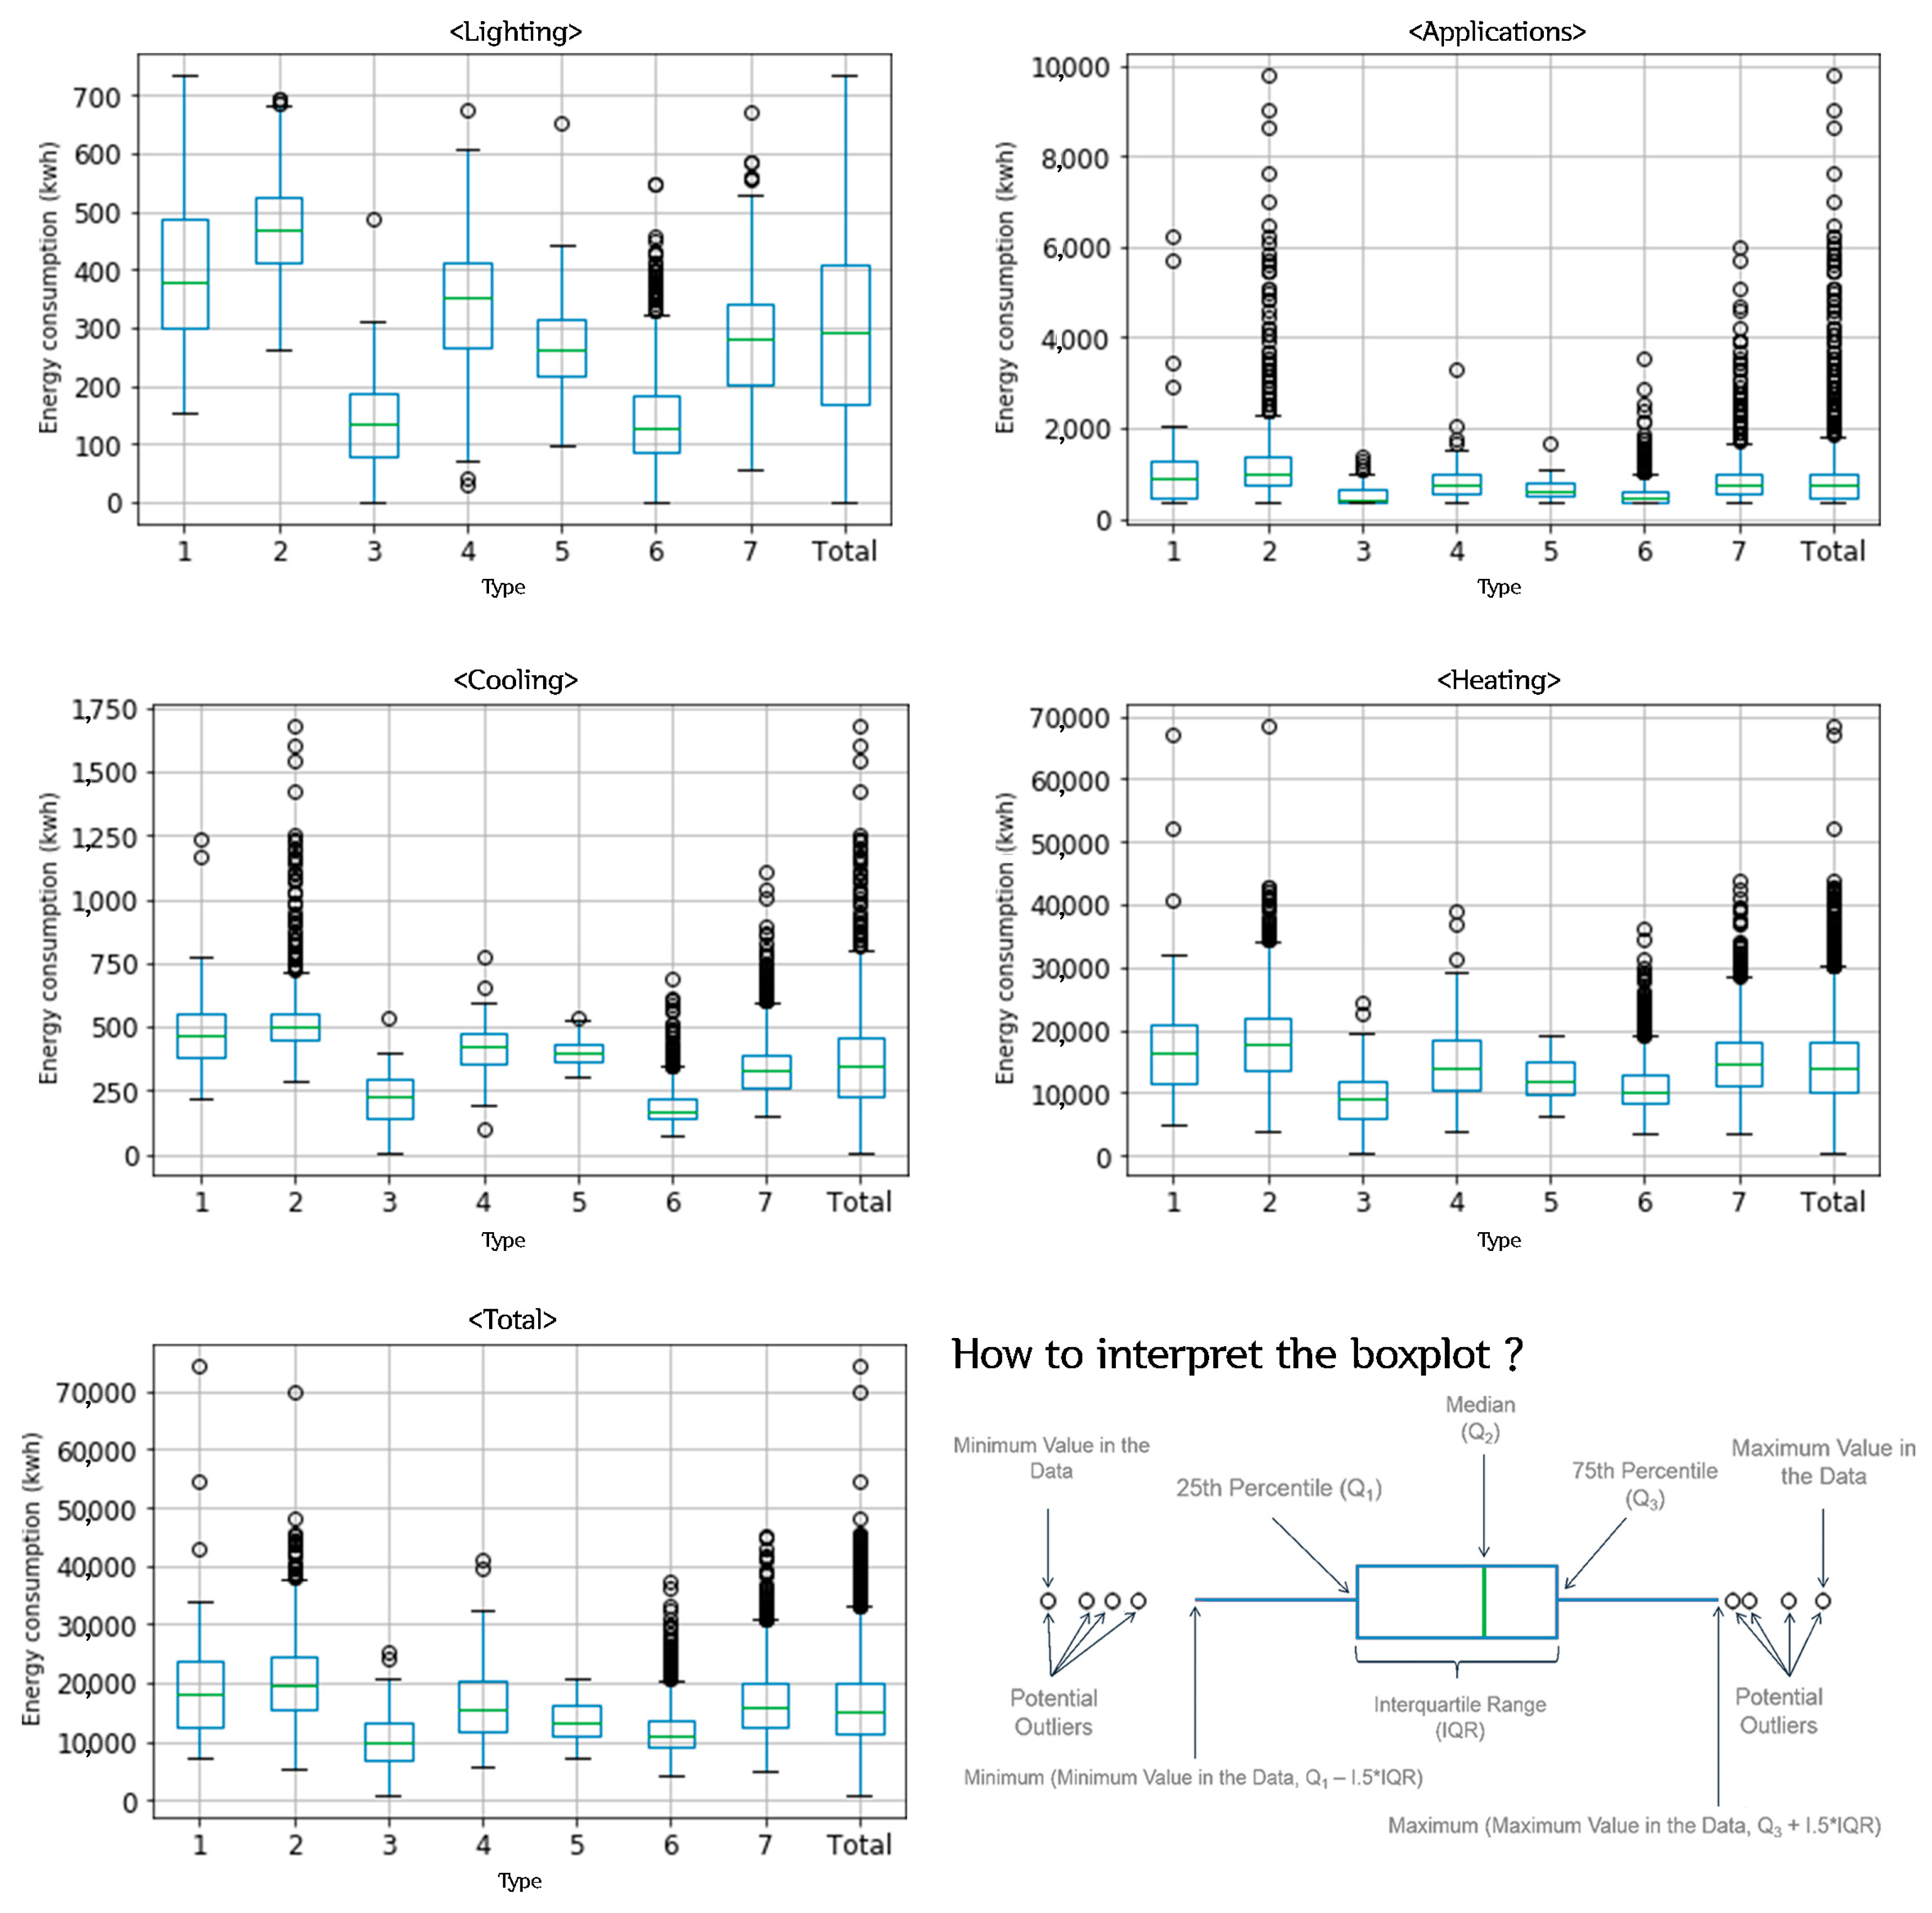
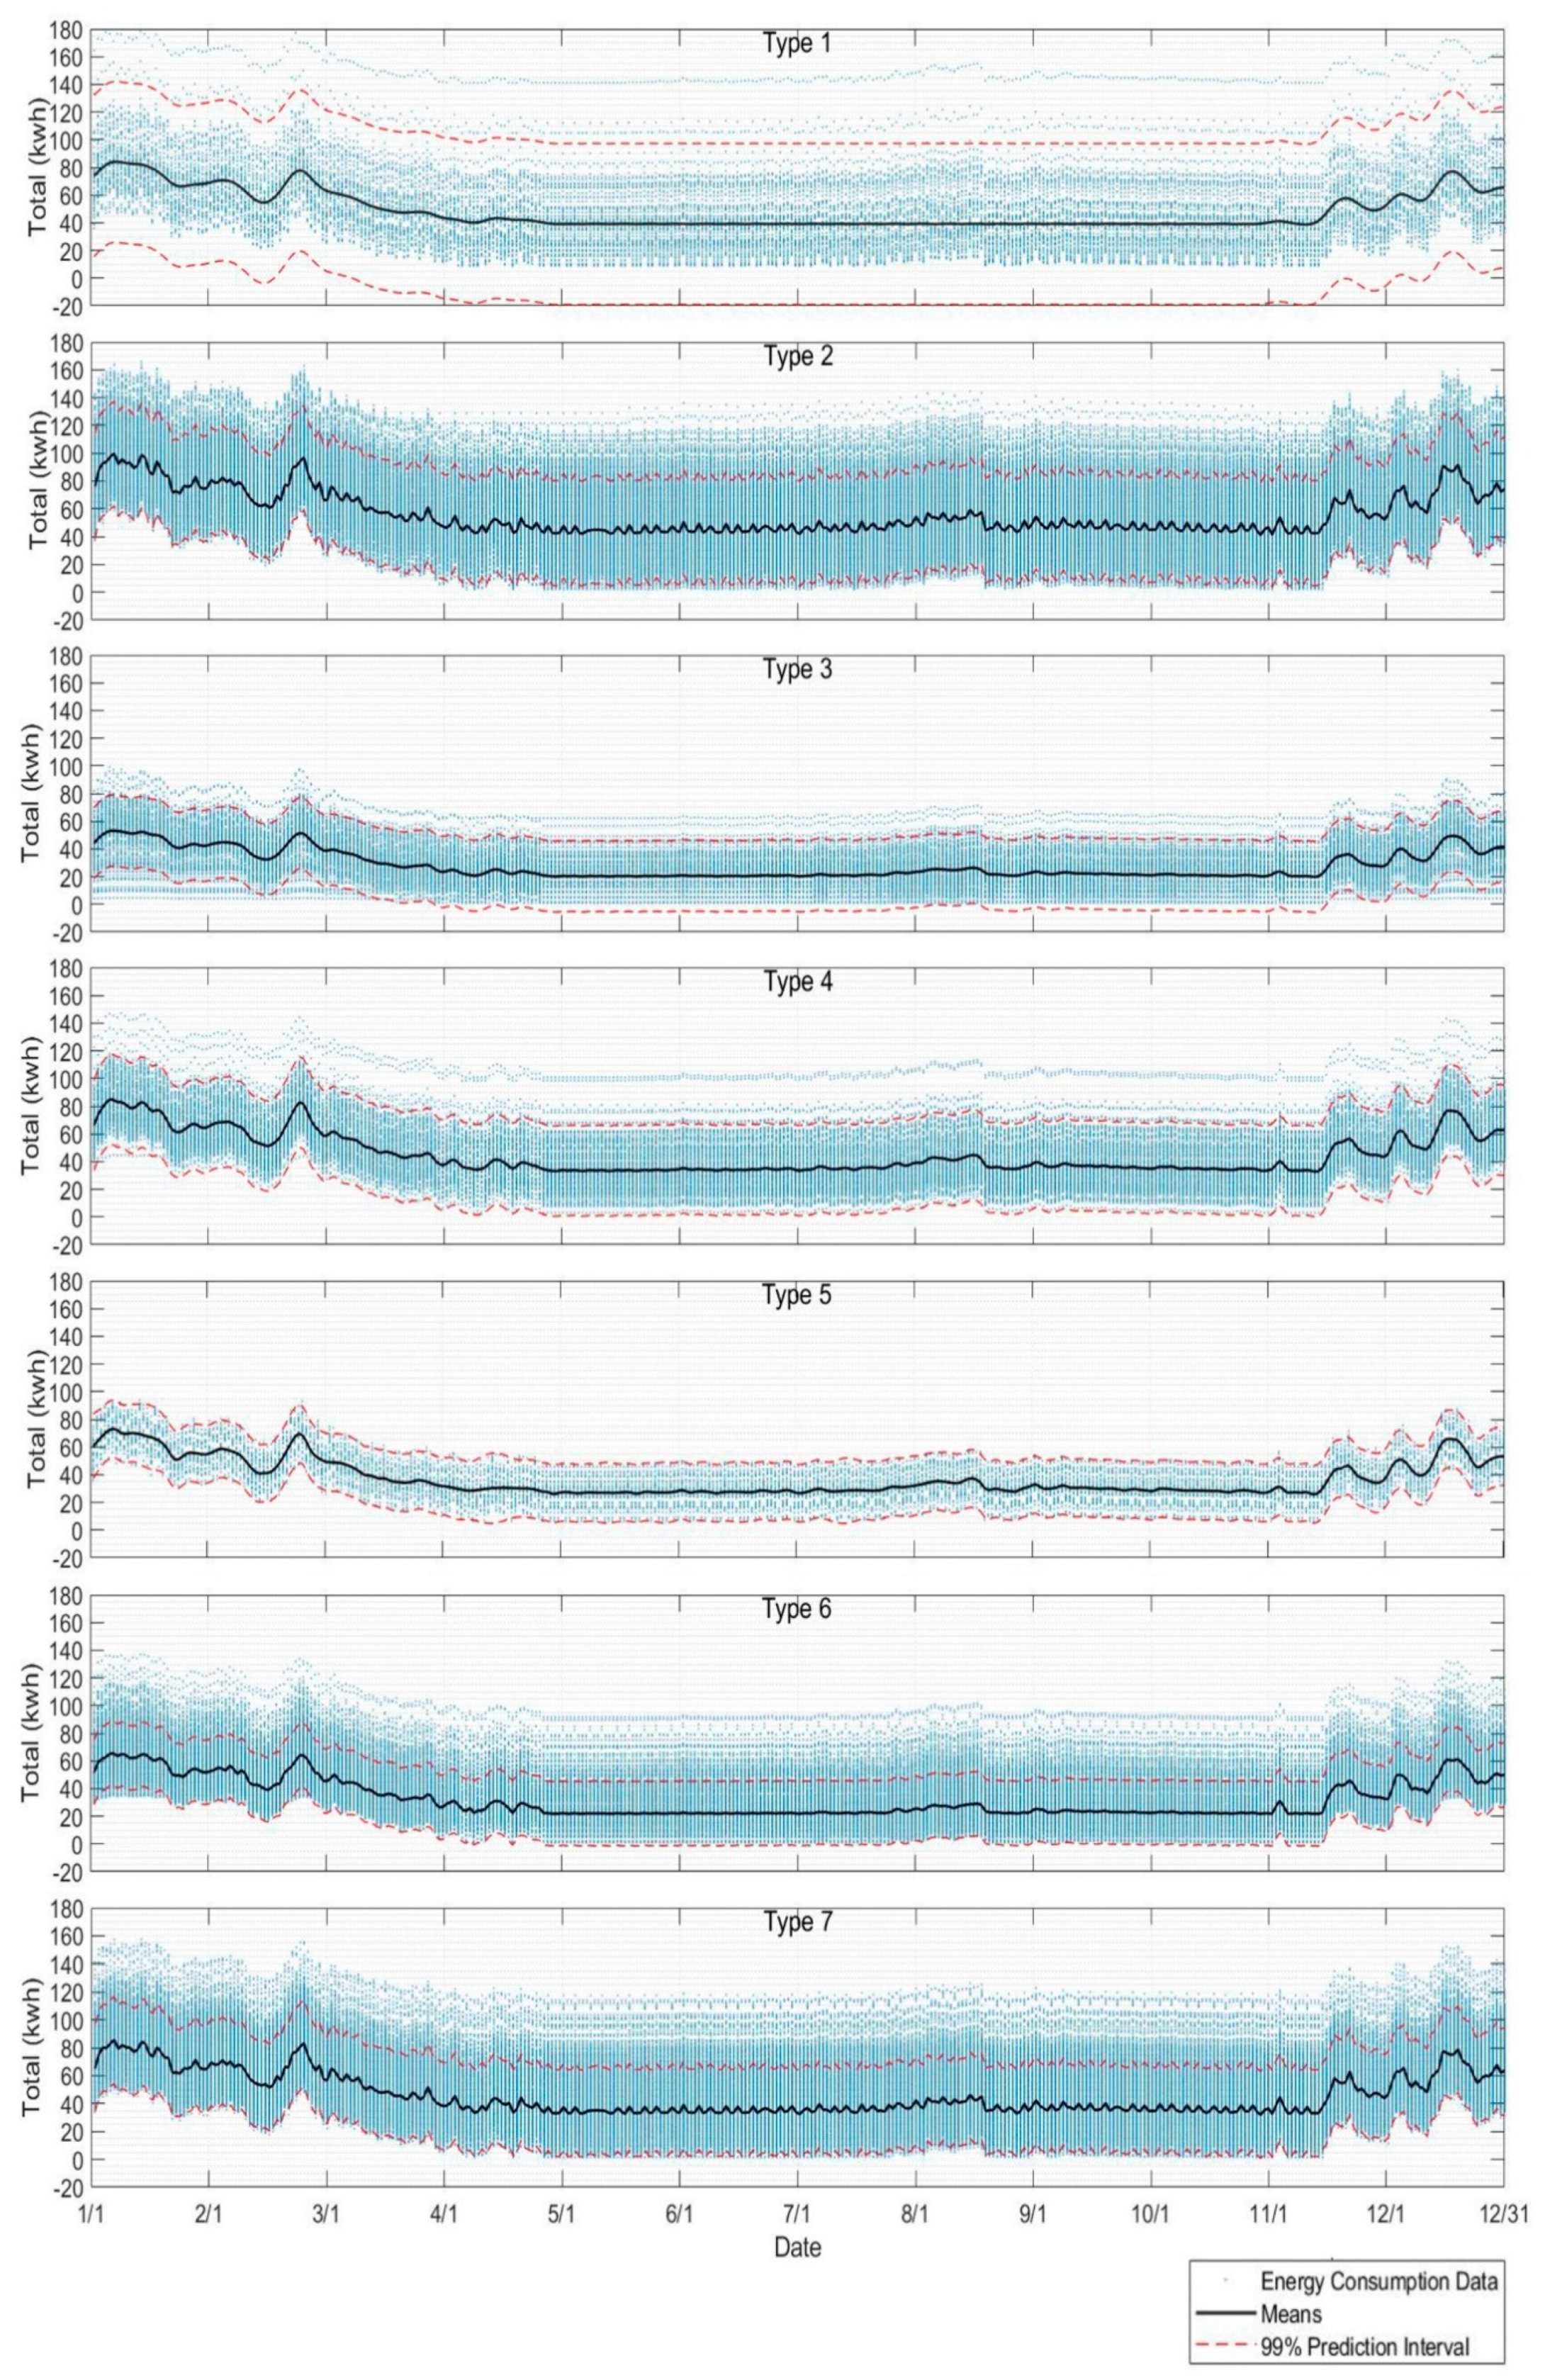
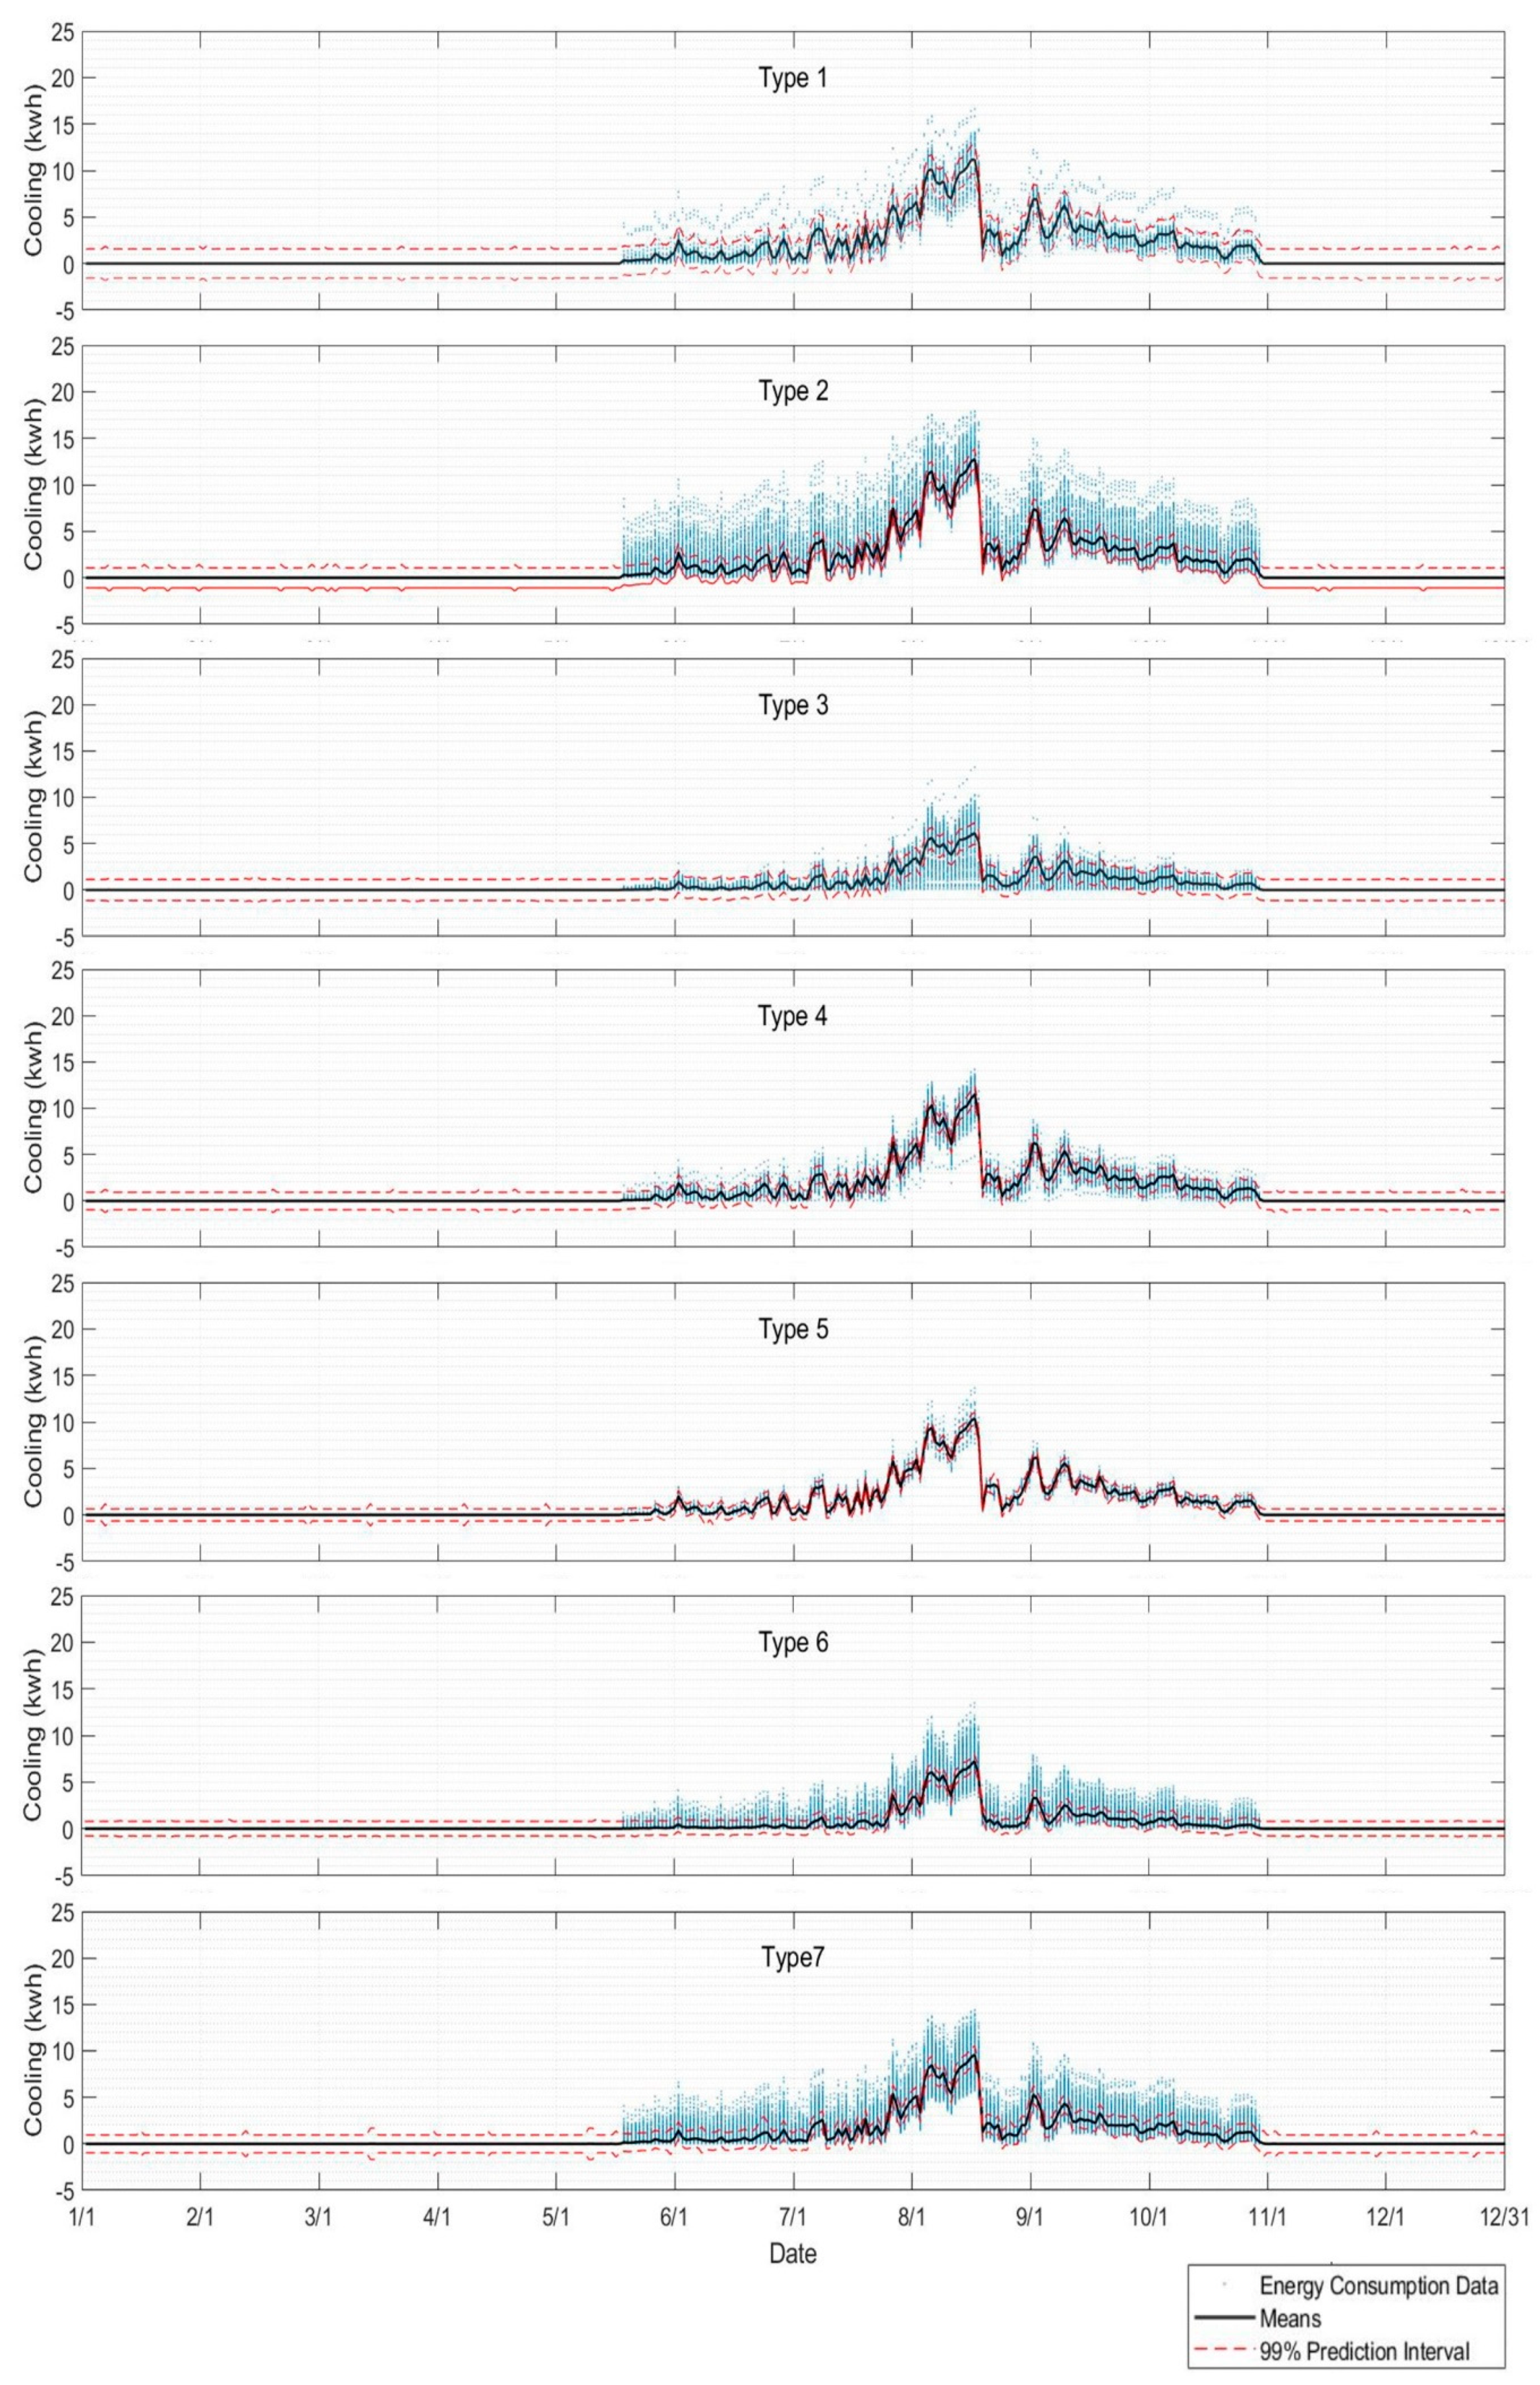
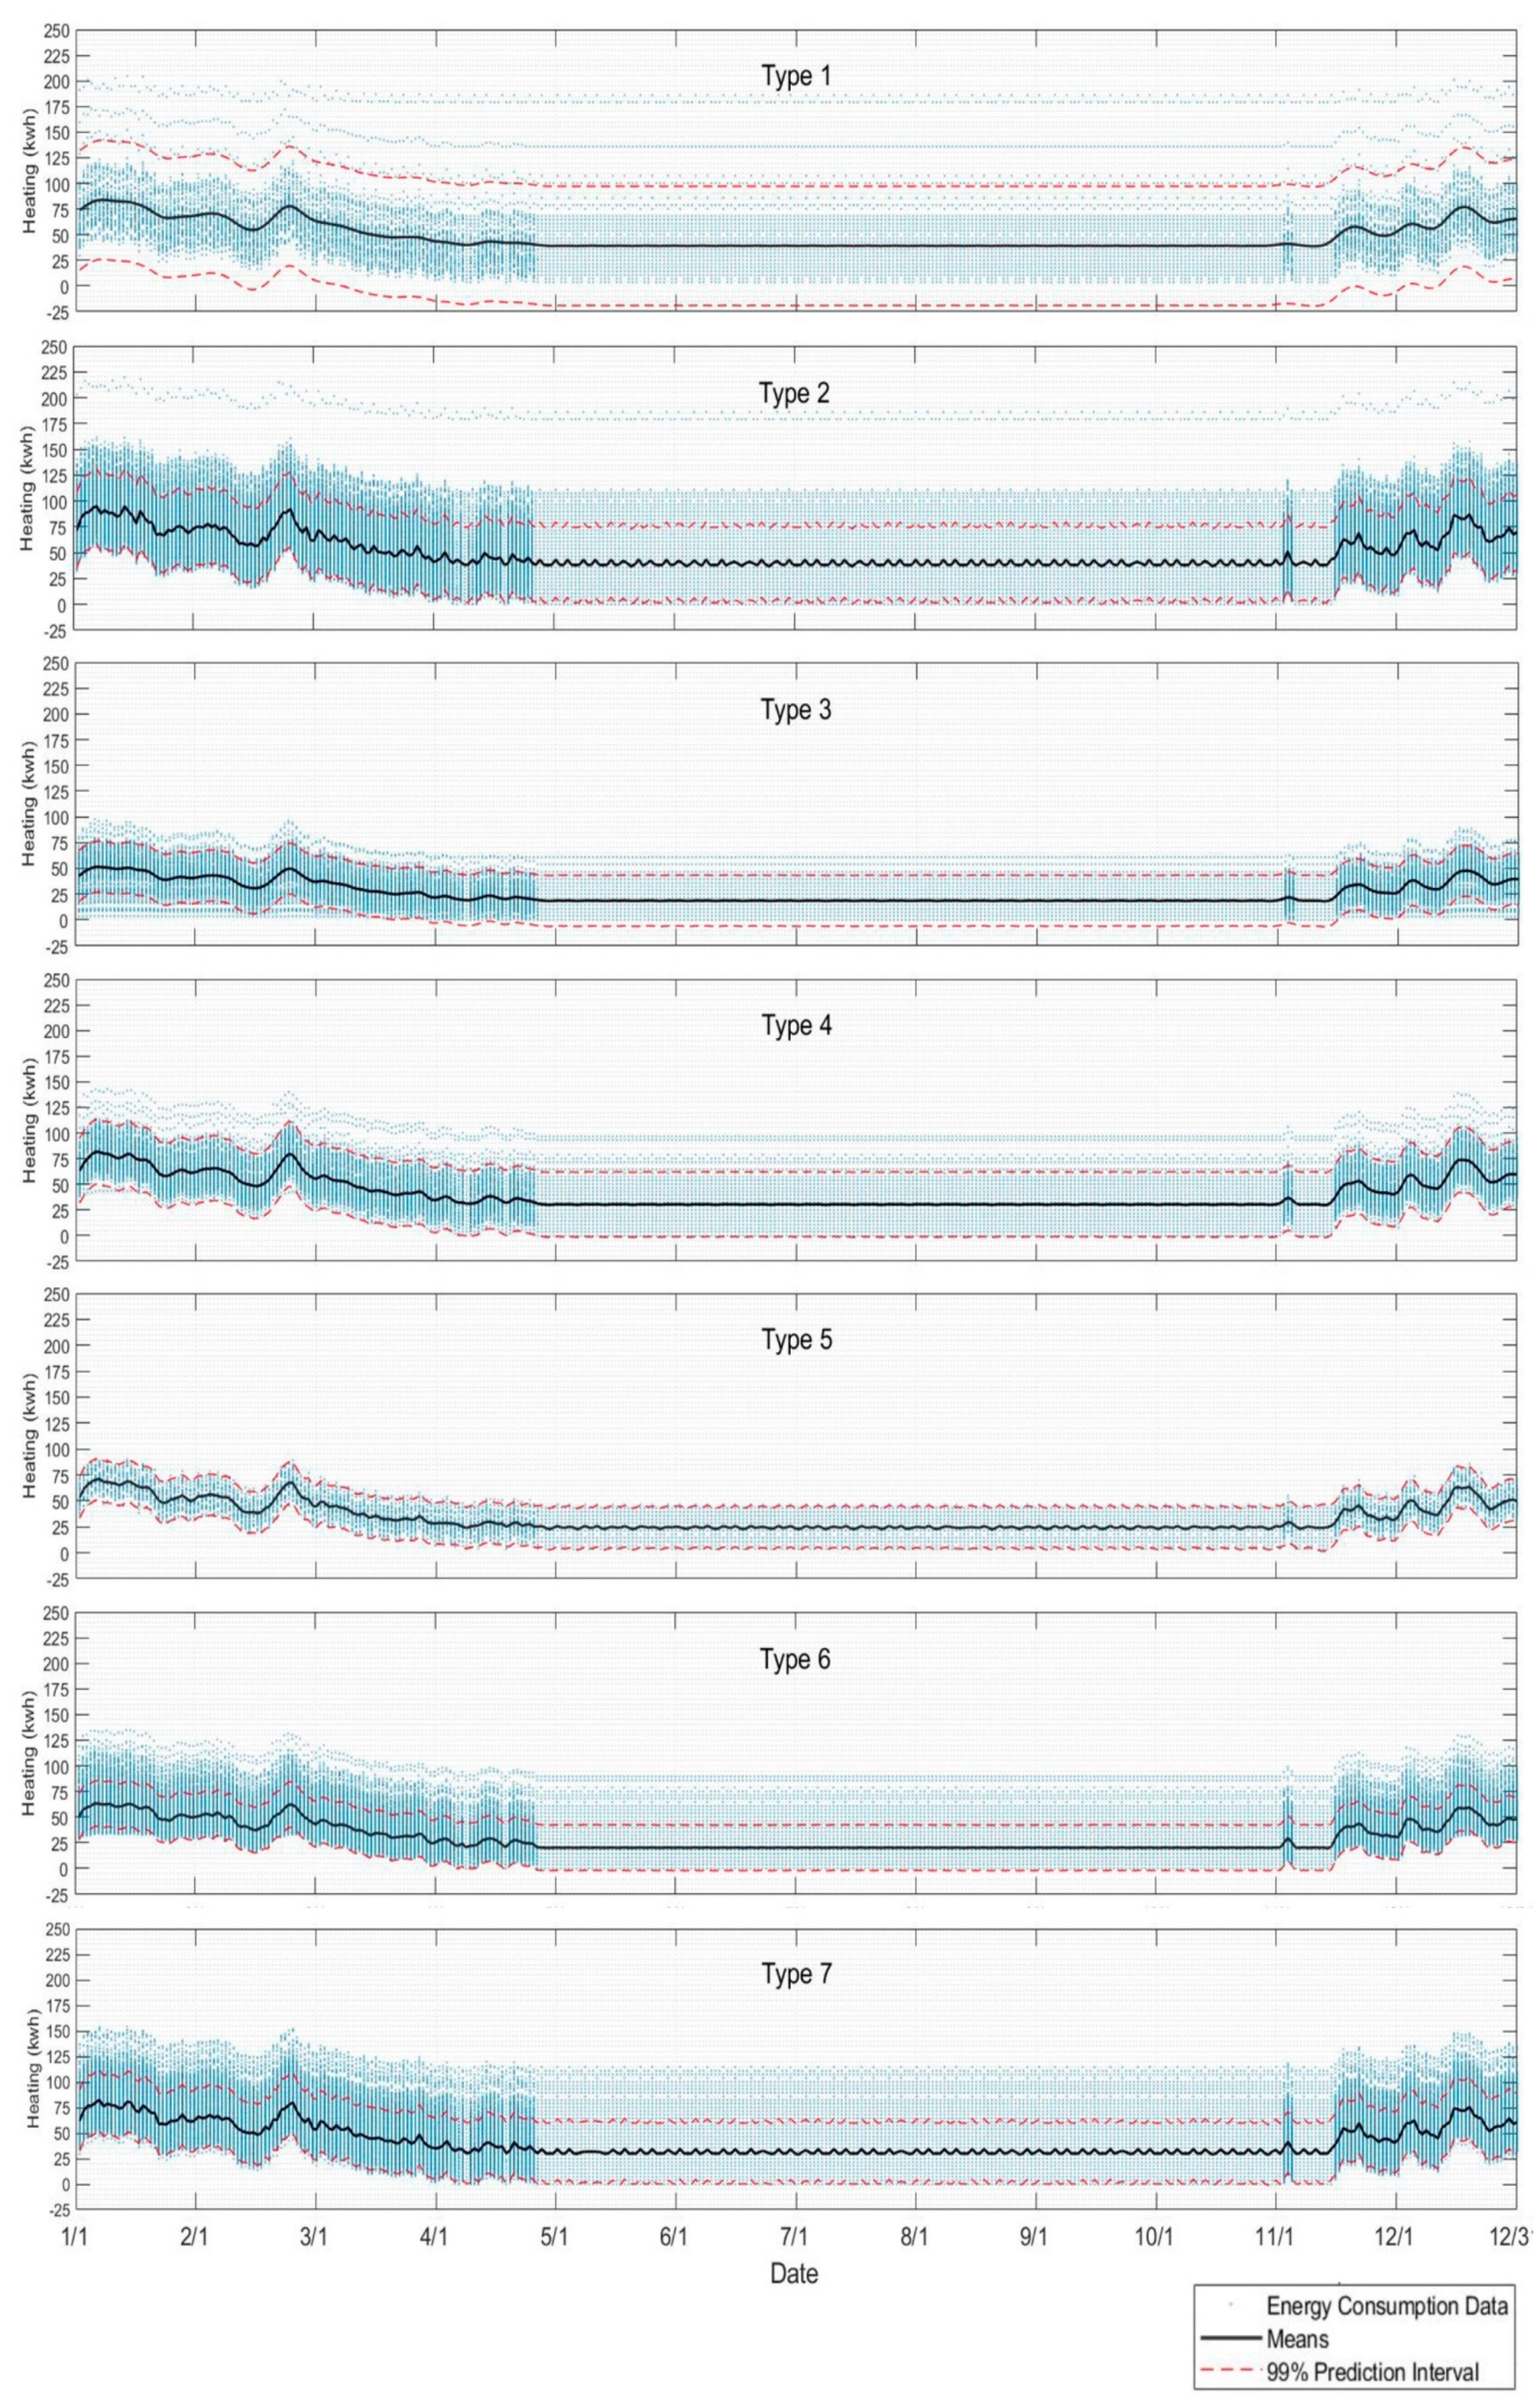
  • Step 4: Provide an “Energy Consumption Information” model for three items (total, cooling, and heating) for each type through a Gaussian process with the EUP types and energy consumption data, which are the results of Steps 2 and 3, as input.
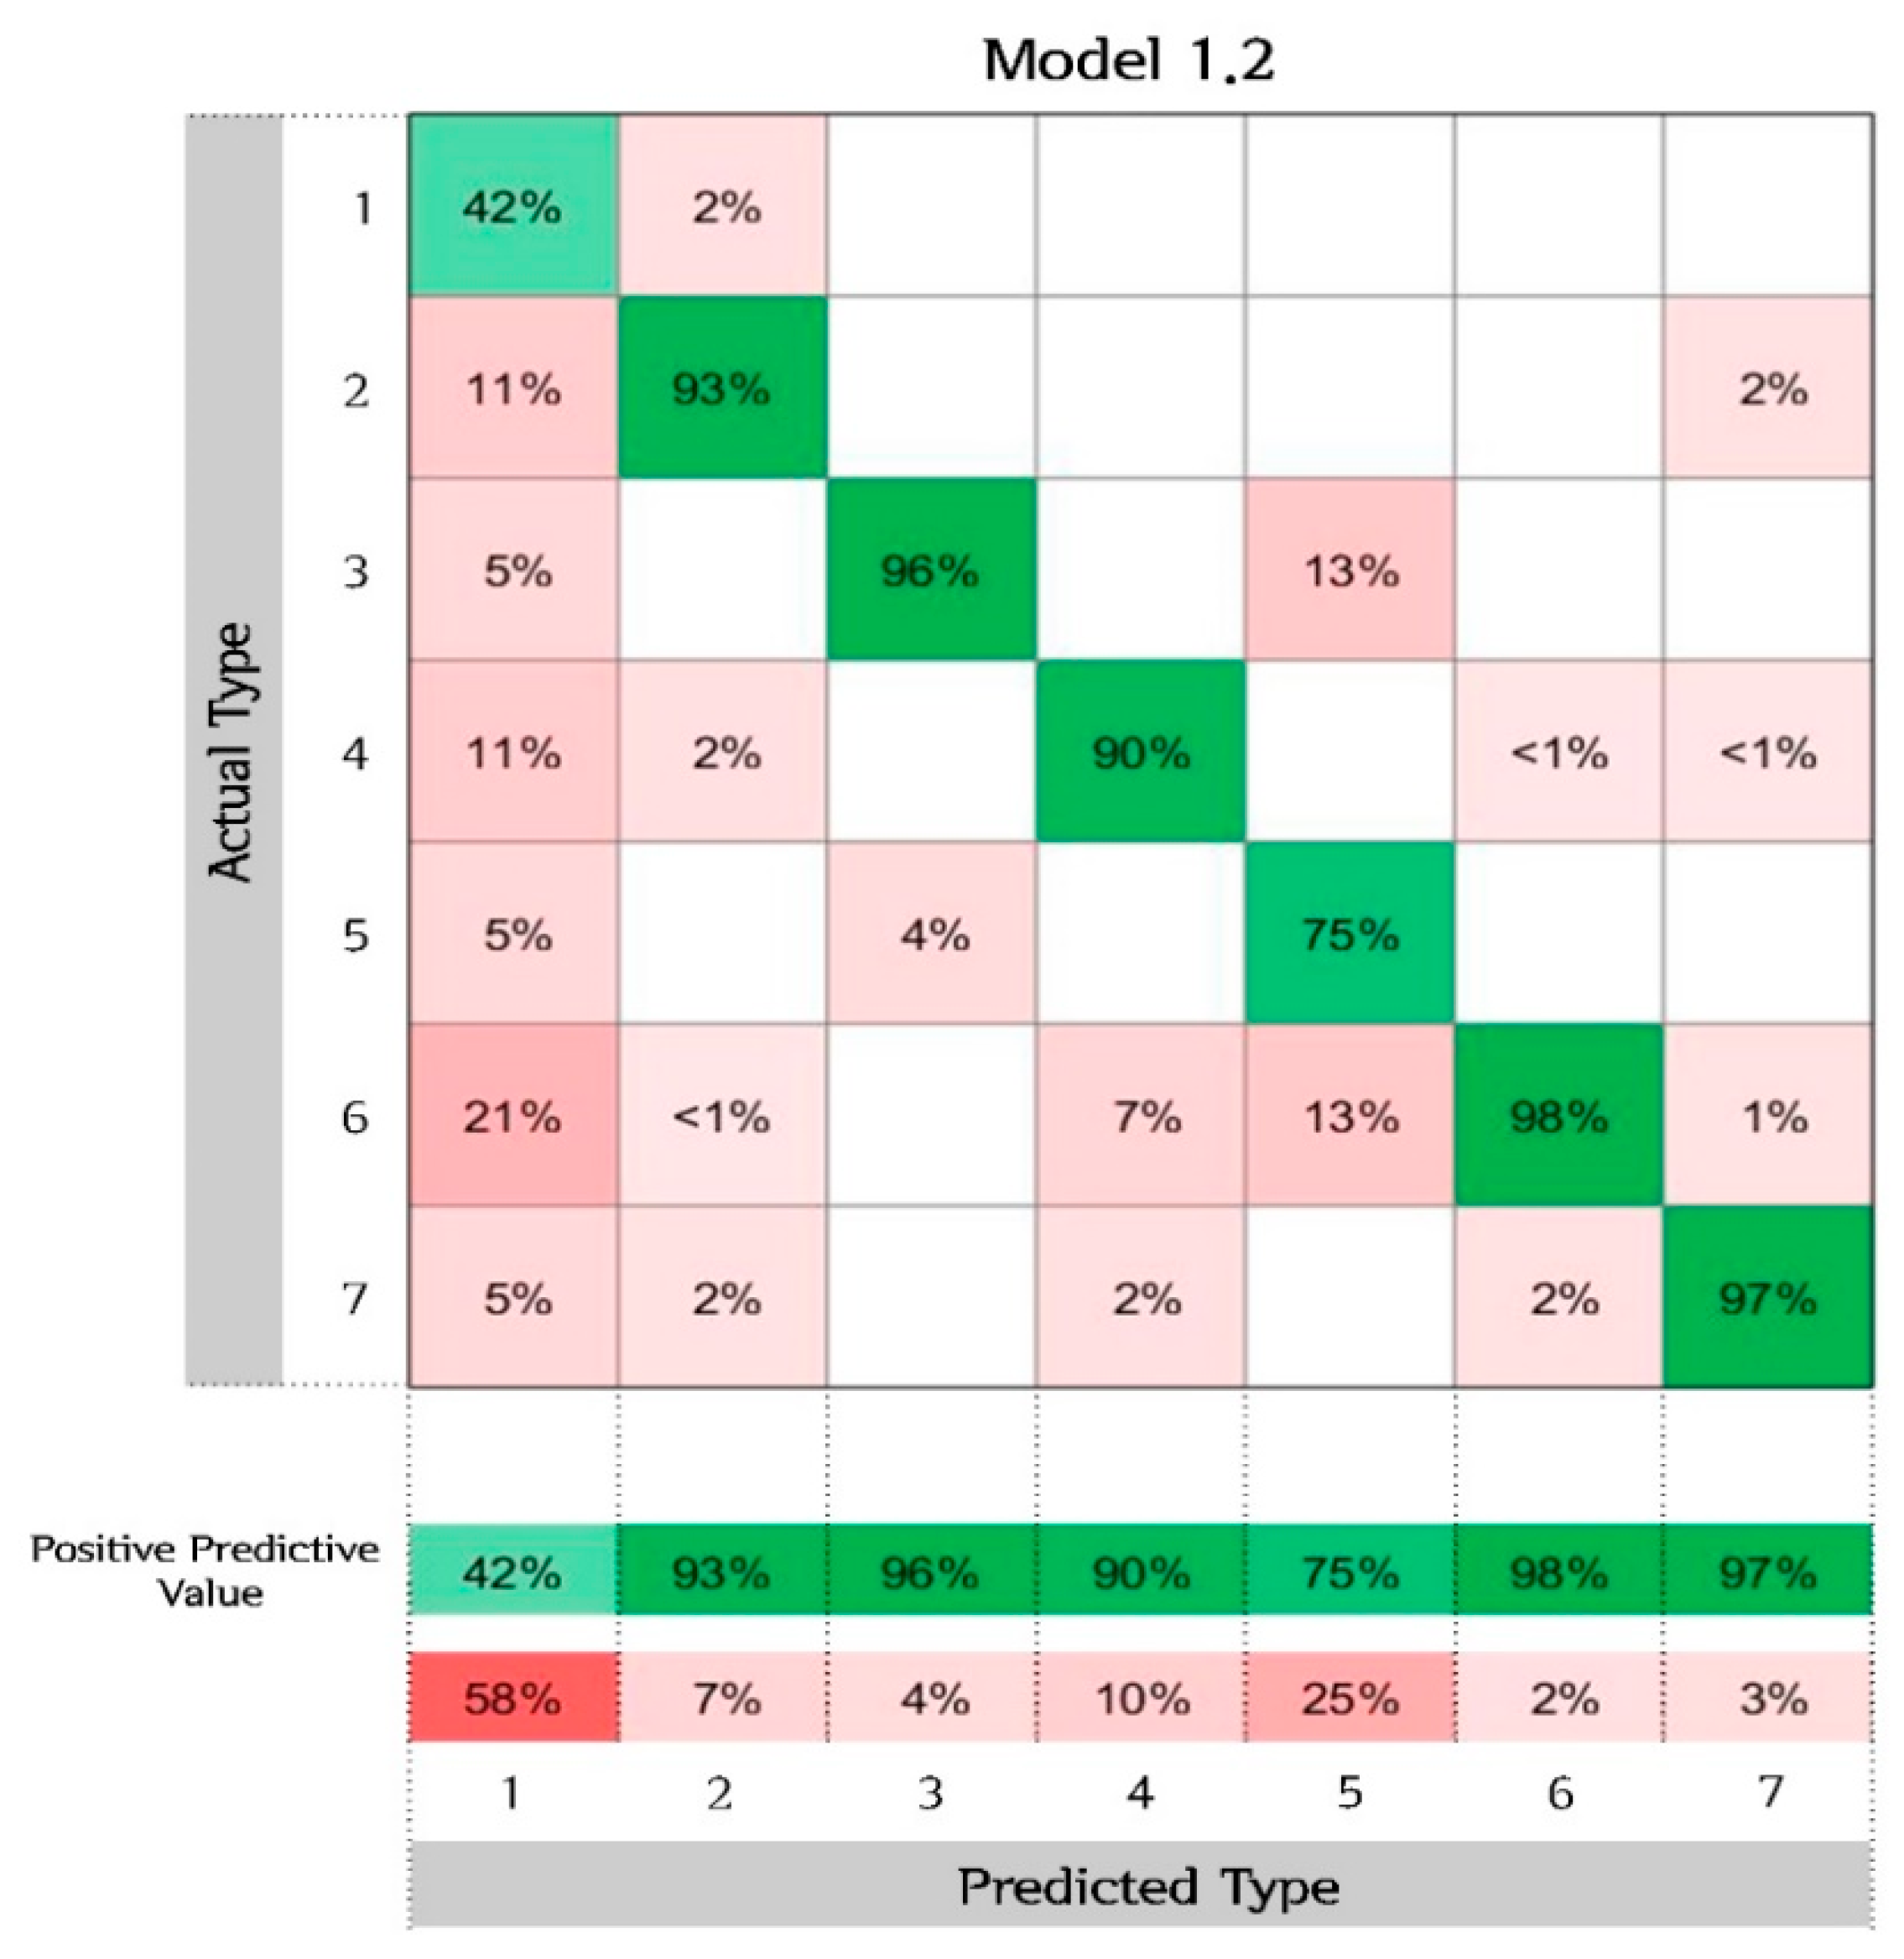
  • Step 5: Train the SVM model to predict EUP types through 5193 occupant features and EUPs, and verify the suitability of the model through the test process of the trained predictive model.

2.2. Generating EUP Datasets from the Korean Time Use Survey

The purpose of the KTUS is to determine the lifestyles of Koreans for 24 h and provide basic data for policy formulation and academic research in the sectors of labor, welfare, culture, transportation, etc. [15]. The KTUS is performed every five years in 800 regions in South Korea. The survey data largely consist of three parts: Residences, residents, and time logs. This allows us to understand basic information and living patterns of the residents. The time logs are created for 144 times slots that divide 24 h into 10-min units based on the actual living pattern of residents. The behaviors and places of the residents in each time slot are recorded as codes. The behavior classification codes consist of nine major categories, 42 middle categories, and 138 subcategories. These data allowed us to find out the detailed behaviors of residents. Furthermore, it includes the residents’ location information, which allowed us to find out what the residents did at specific locations in their residences. We obtained the KTUS data through the Microdata Integrated Service (MDIS) [14].
In the KTUS data for 2014, which was obtained through the MDIS in this study, 5240 pieces of data were collected that satisfied the conditions of urban residents, with household members 10 years or older in single-person households. Among them, 5193 KTUS data points were used for this study, excluding 47 data points in which the residents were not in their residences for 24 h.
First, to perform the K-modes clustering and EnergyPlus analysis based on the KTUS data, the 138 pieces of behavior classification data were redefined as codes related to energy consumption, as shown in Figure 2.
Applications related to energy consumption in the residences were assumed to be related to lighting, computer, TV, washing machine, refrigerator, gas range, and hot water usage. Occupant behaviors were classified into eight energy consumption behaviors by identifying which application was used [16].
The location of the occupants was divided into inside and outside the residence through the “behavior location” information of the KTUS; when the occupant was outside the residence, it was set as Away (A1). Refrigerators are assumed to operate continuously regardless of the presence or behavior of occupants. By identifying which application was used according to the occupants’ behavior, the behaviors were classified into the behavior codes of: Leisure (L1), Laundry (L2), Cooking (C1), Grooming (G1), and Dishwashing (D1). In addition, when the occupant slept, it was assumed that the lights were out, and the behavior was classified as Sleeping (S1). Behaviors that were not directly related to energy consumption were defined as Other (O1). Table 1 lists the energy application and energy consumption behavior codes defined through this process.

2.3. Deriving EUP Types and an Energy Consumption Information Model for Each Type

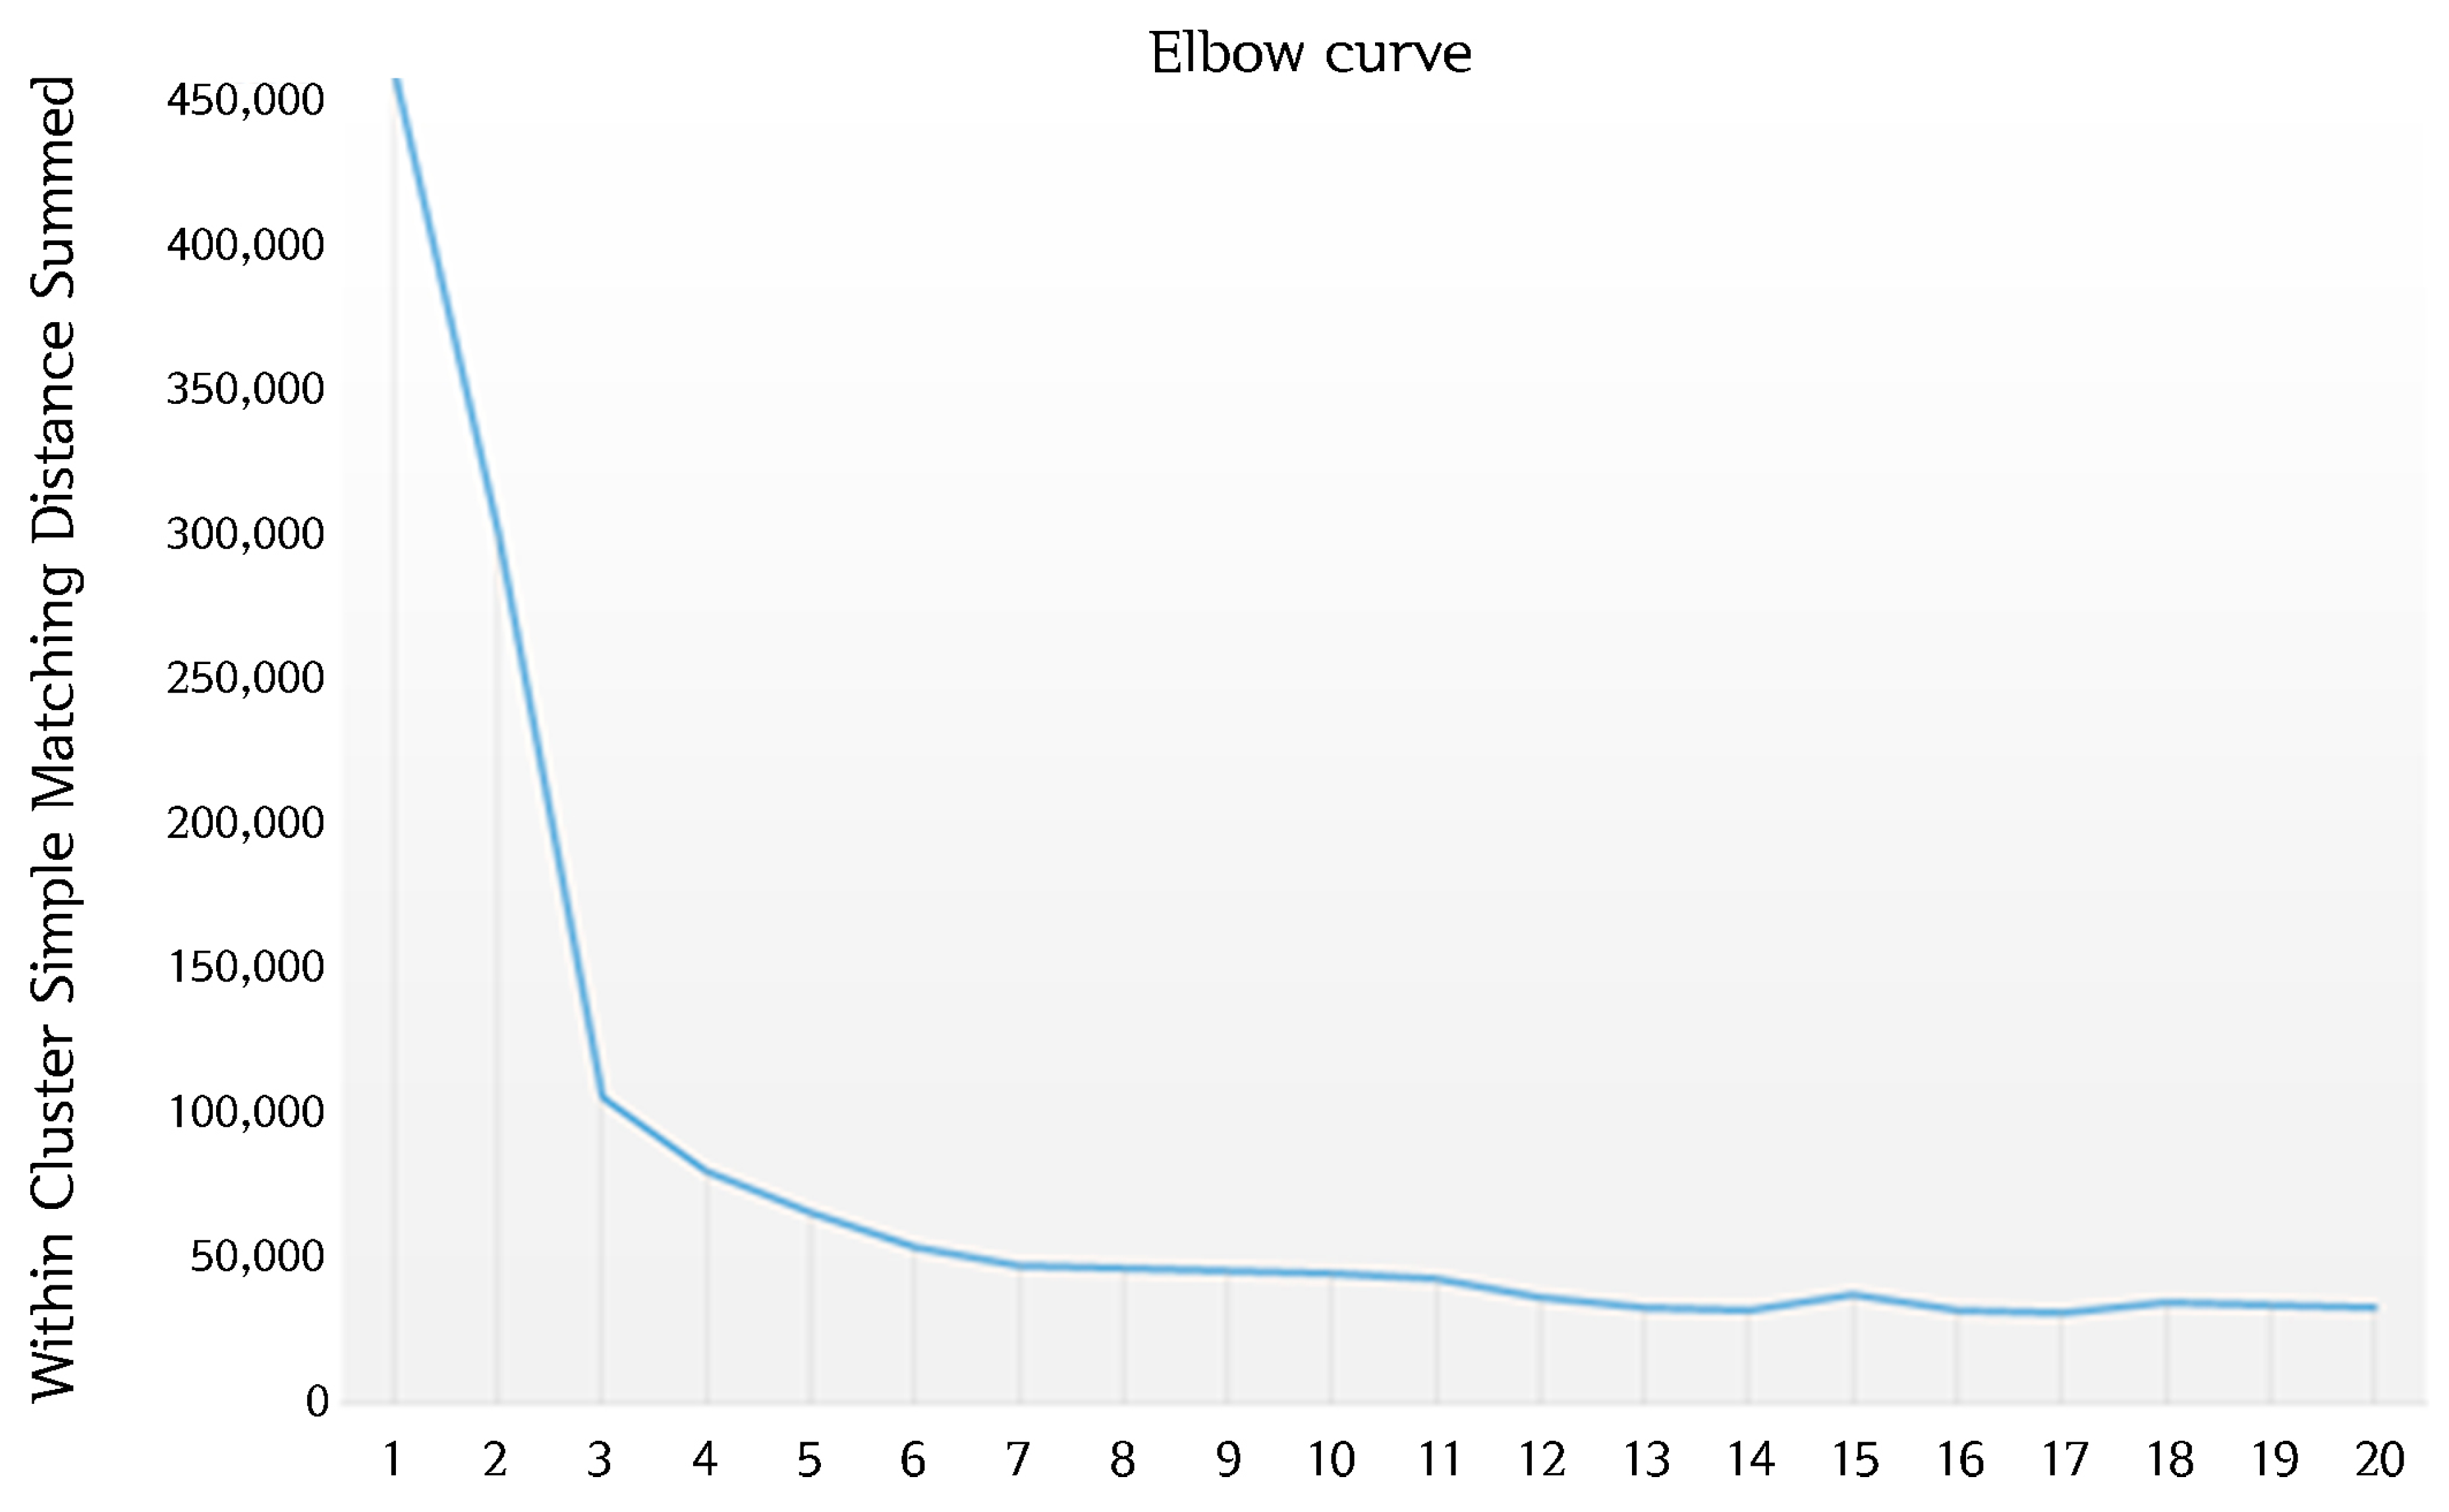
2.3.1. K-Modes Clustering

Clustering is a machine learning analysis method used for various purposes, such as pattern analysis, grouping, and classification. Among the clustering methods, K-means clustering, which was first proposed by MacQueen [17], finds appropriate center values by clustering data that have the most similar shapes from the centers of k items that have been randomly selected, and combines them into a group of items that have similar characteristics. This is the most popular clustering method, it is however limited in that it can only be applied to data consisting of numerical variables [18]. K-means clustering is not appropriate for this study because clustering must be performed with categorical variables consisting of behavior classification codes rather than numerical variables.
To complement the limitations of the existing K-means clustering, Huang [19] proposed K-modes clustering. K-modes clustering is applicable to data formats consisting of categorical variables rather than numerical variables. Categorical variables refer to data that cannot be expressed by numbers, such as men and women. These data only provide information but cannot express quantities such as numbers.
K-modes clustering is composed of a distance function for measuring the distance between objects, and a cost function for optimized analysis. These functions are explained in detail below.
D is a set of objects X, which consist of nominal variables. The number of X’s is n, and D = [ X 1 ,   X 2 , , X n ] ( 1 i n ) . If object X i has m nominal variables, X i = [ x i , 1 ,   x i , 2 , , x i , m ] ( 1 j m ) .
Z is a set of k cluster centers, and Z = [ Z 1 , Z 2 , , Z k ] ( 1 l k ) . If Z l , which is the center of cluster C l , has m nominal variables, Z l = [ z l , 1 , z l , 2 , , z l , m ]   ( 1 j m ) .
The equation for obtaining the distance between the center of cluster C l , Z l = [ z l , 1 , z l , 2 , , z l , m ] , and the object X i = [ x i , 1 ,   x i , 2 , , x i , m ] through the distance function is as follows:
Distance   function :   d ( x i , j , z l , j ) = { 0 ,       x i , j = z l , j 1 ,       x i , j z l , j ,
where d ( x i , j , z l , j ) is a function for measuring the distance between Z l and X i , and calculates the distance between two objects by comparing the jth variables. The distance between each object X and the cluster center Z is calculated through Equation (1), and the model is optimized in such a way that the result value of Equation (2) is minimized:
Cos t   function :   P ( U , Z ) = l = 1 k i = 1 n j = 1 m u i , l d ( x i , j , z l , j )
U = [ u i , l ] is an n × k matrix consisting of 0 and 1. u i , l = 1 indicates that object X i is assigned to the closest cluster C l . To optimize the model, the cluster center is reset, and this is repeated until the minimum value of the cost function P ( U , Z ) is obtained. Then, the analysis is stopped, and the result of the cluster analysis is derived.
This study aims to derive EUP types using K-modes clustering, which consists of the following process. First, a dataset for 144 time slots for 5193 objects was prepared through the EUP codes defined in Section 2.2 (Table 2). The analysis environment was built through the K-modes clustering algorithm suggested by Huang [19] using Python 3.6.
Next, the analysis for each k was performed 1000 times to derive the minimum of the cost function, and find the optimized k. The K-modes clustering analysis and the method of finding the optimized k is as follows:
  • Select k random cluster centers.
  • Calculate the distance between each object and cluster center, and allocate each object to the closest cluster center. Allocate every object to clusters, and move the cluster center in the direction for which the distance between each object and cluster center becomes minimized.
  • Compare the center of the moved cluster with the previous center. If the result is different, return to Step 2 and repeat. The analysis is stopped if the same result value, when compared with the previous center, is generated.
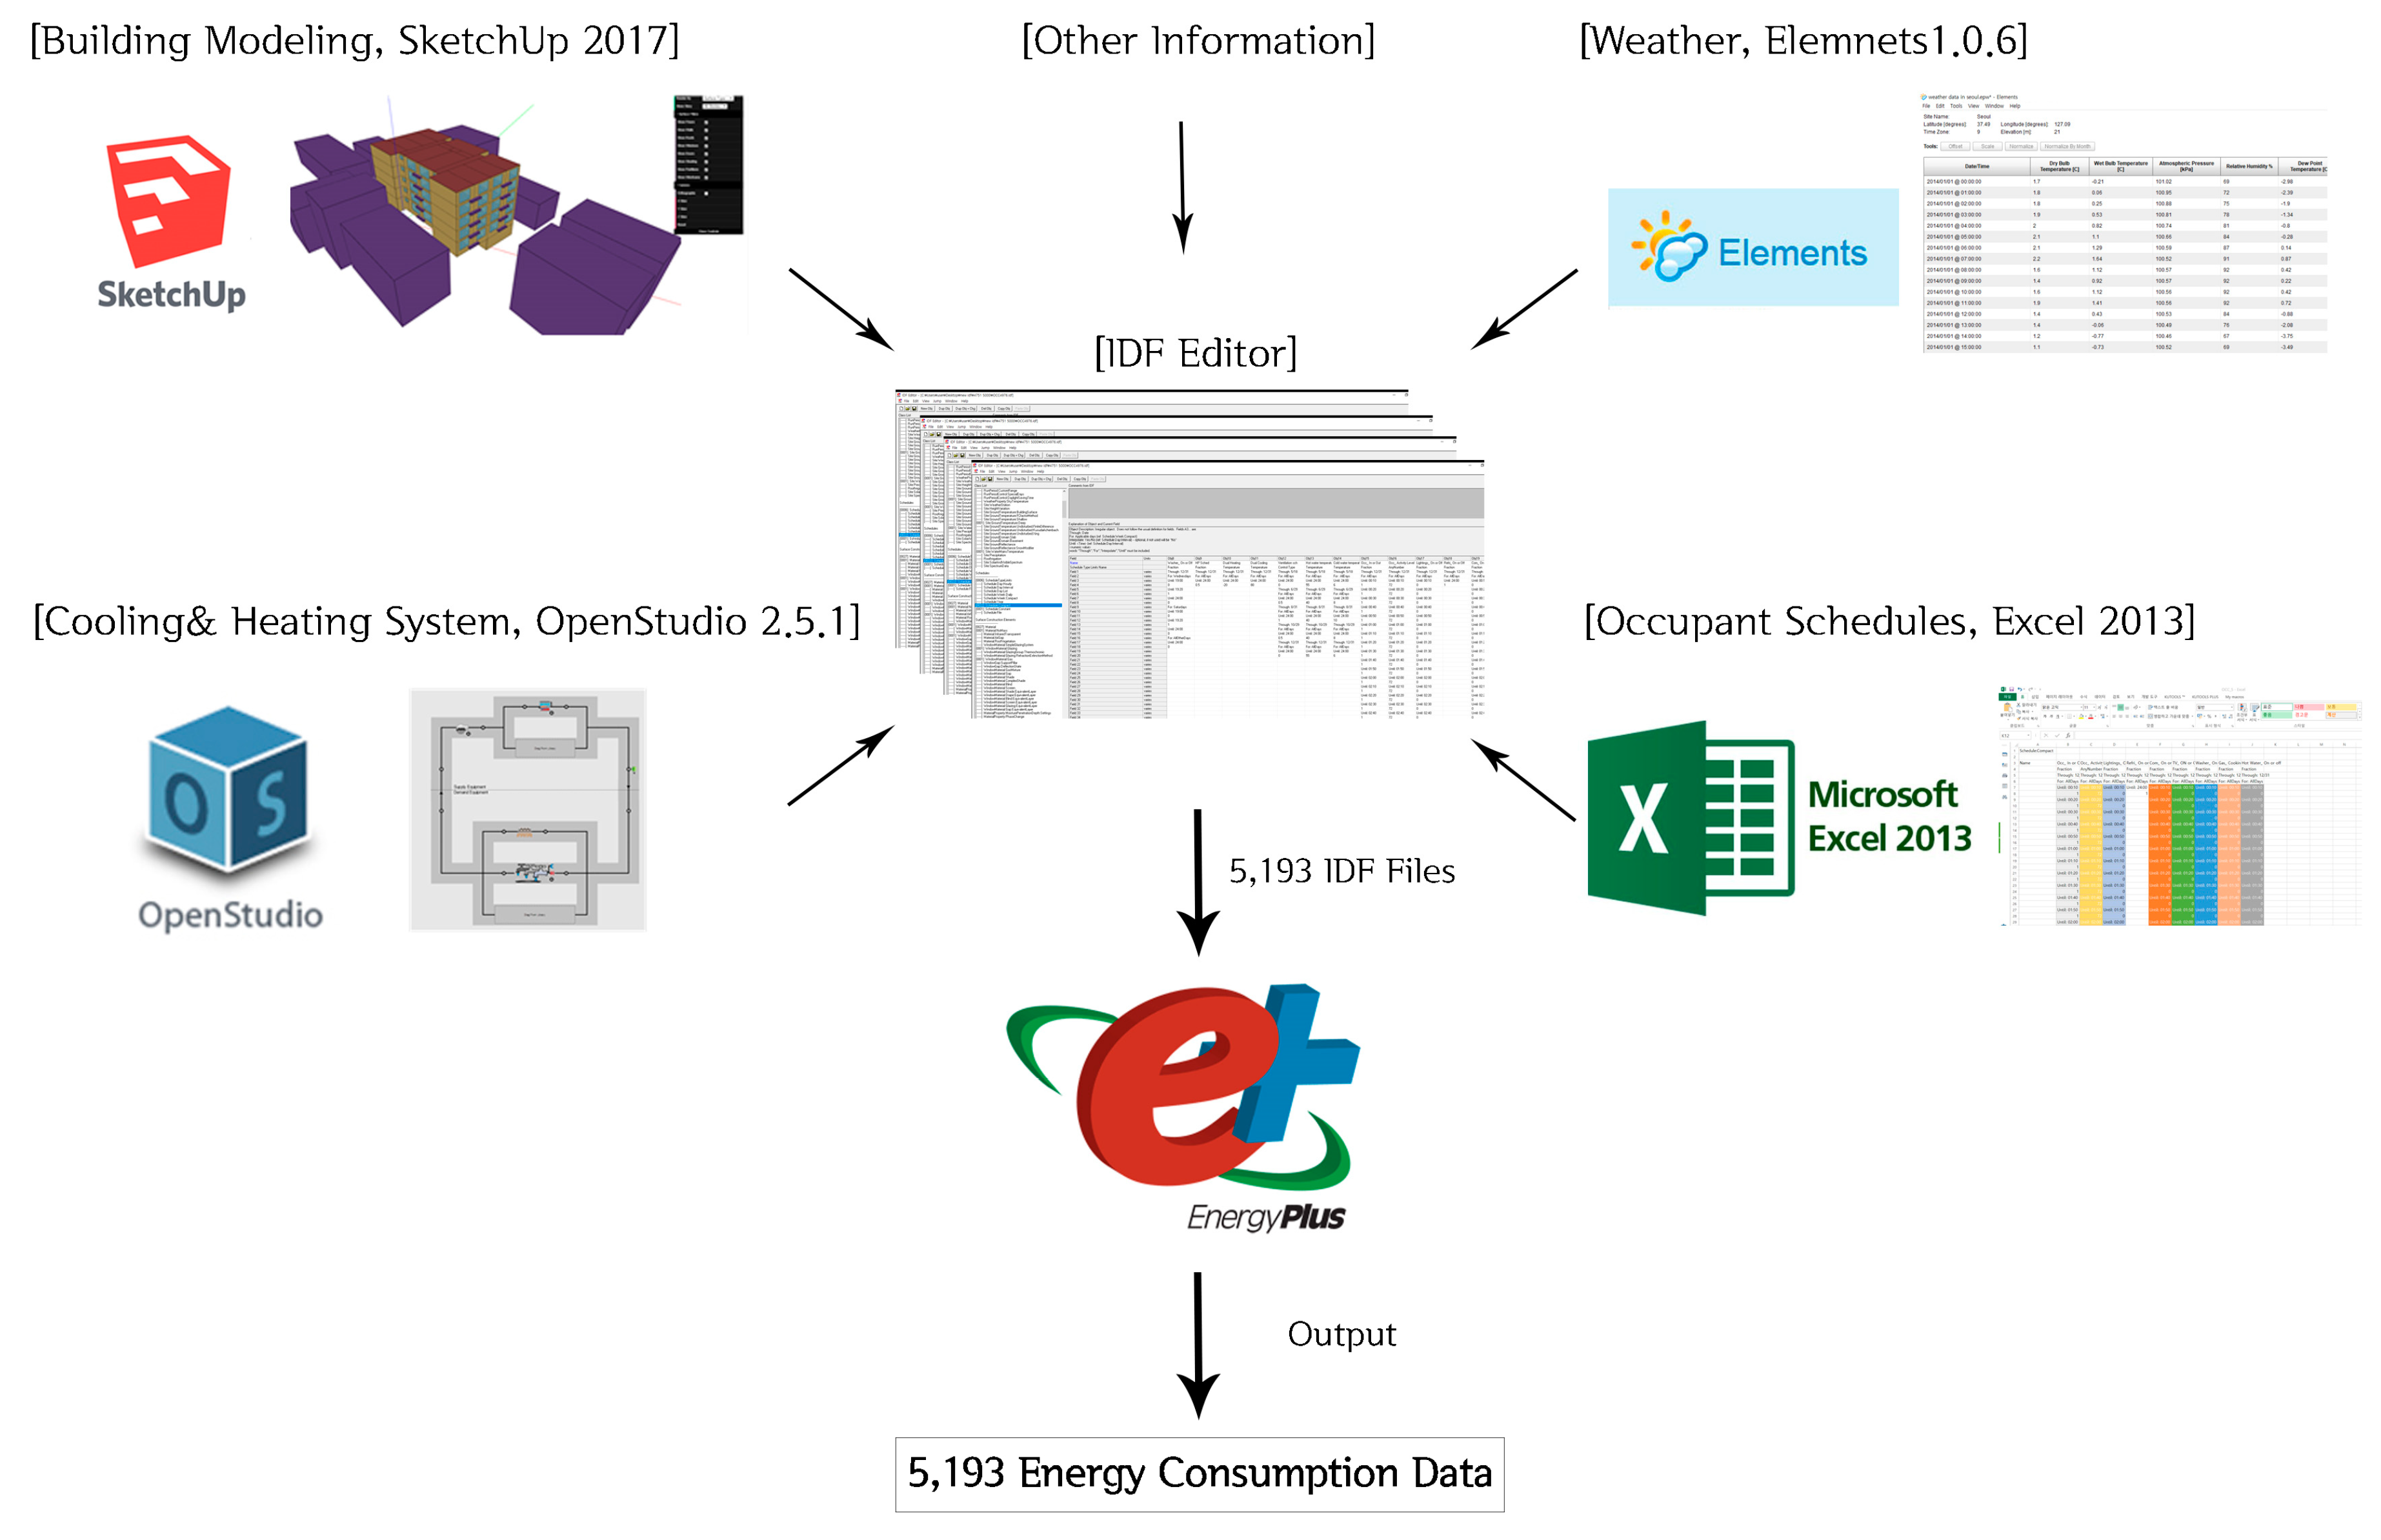
Finally, to select the optimized k, k is found by drawing an elbow curve using the errors of the model for each k (Figure 3). In this study, k = 7 was found to be the most optimized model through visualization of the analysis results 6, 7, and 8, which had small variations in the error reduction in the elbow curve.

2.3.2. EnergyPlus

EnergyPlus is a dynamic energy simulation based on the strengths of Building Loads Analysis and System Thermodynamics (BLAST) and DOE-2 in the U.S. in 1996 [20]. EnergyPlus can implement more concrete building materials and facility systems, and makes it easier to control facility systems than do other energy simulations [21]. Furthermore, EnergyPlus can consider the behaviors of occupants in the simulation. It is widely used in energy research that considers the behaviors of occupants. The use of applications, cooling and heating, and natural ventilation can be controlled in 1-min units according to the behavior of occupants, resulting in a simulation environment that is more similar to real-world situations. Therefore, in this study, 5193 energy consumption amounts were derived based on the occupant behavior through EnergyPlus.
The target building of this study is located in a residential area, and the inside of the building has a floor plan that is typical in South Korea. Hence, it can be regarded as a representative residence type for single-person households in South Korea (Figure 4). Happy houses are for households consisting of one or two persons, such as college students, newlyweds, and career starters. The construction of happy houses started in 2014, and the goal was to build 150,000 happy houses by 2017 [22]. For this study, we obtained the design drawings and energy savings plan for the “S Happy House” from the Korea Land and Housing Corporation (LH), which we used as the basic data for accurate energy simulation. S Happy House was a 41 m2 unit on the fourth floor of a building in Seoul and was certified as Class 3 in the energy efficiency rating system, and can be used as a reference for energy consumption in future research. The fourth floor, which is the middle floor of the residential floors, was selected because the top and bottom floors are heavily influenced by the external environment [23].
The main inputs and settings for the EnergyPlus simulation are listed in Table 3. The five main input items of EnergyPlus are the environment, building information, cooling and heating systems, applications, and occupant schedules.
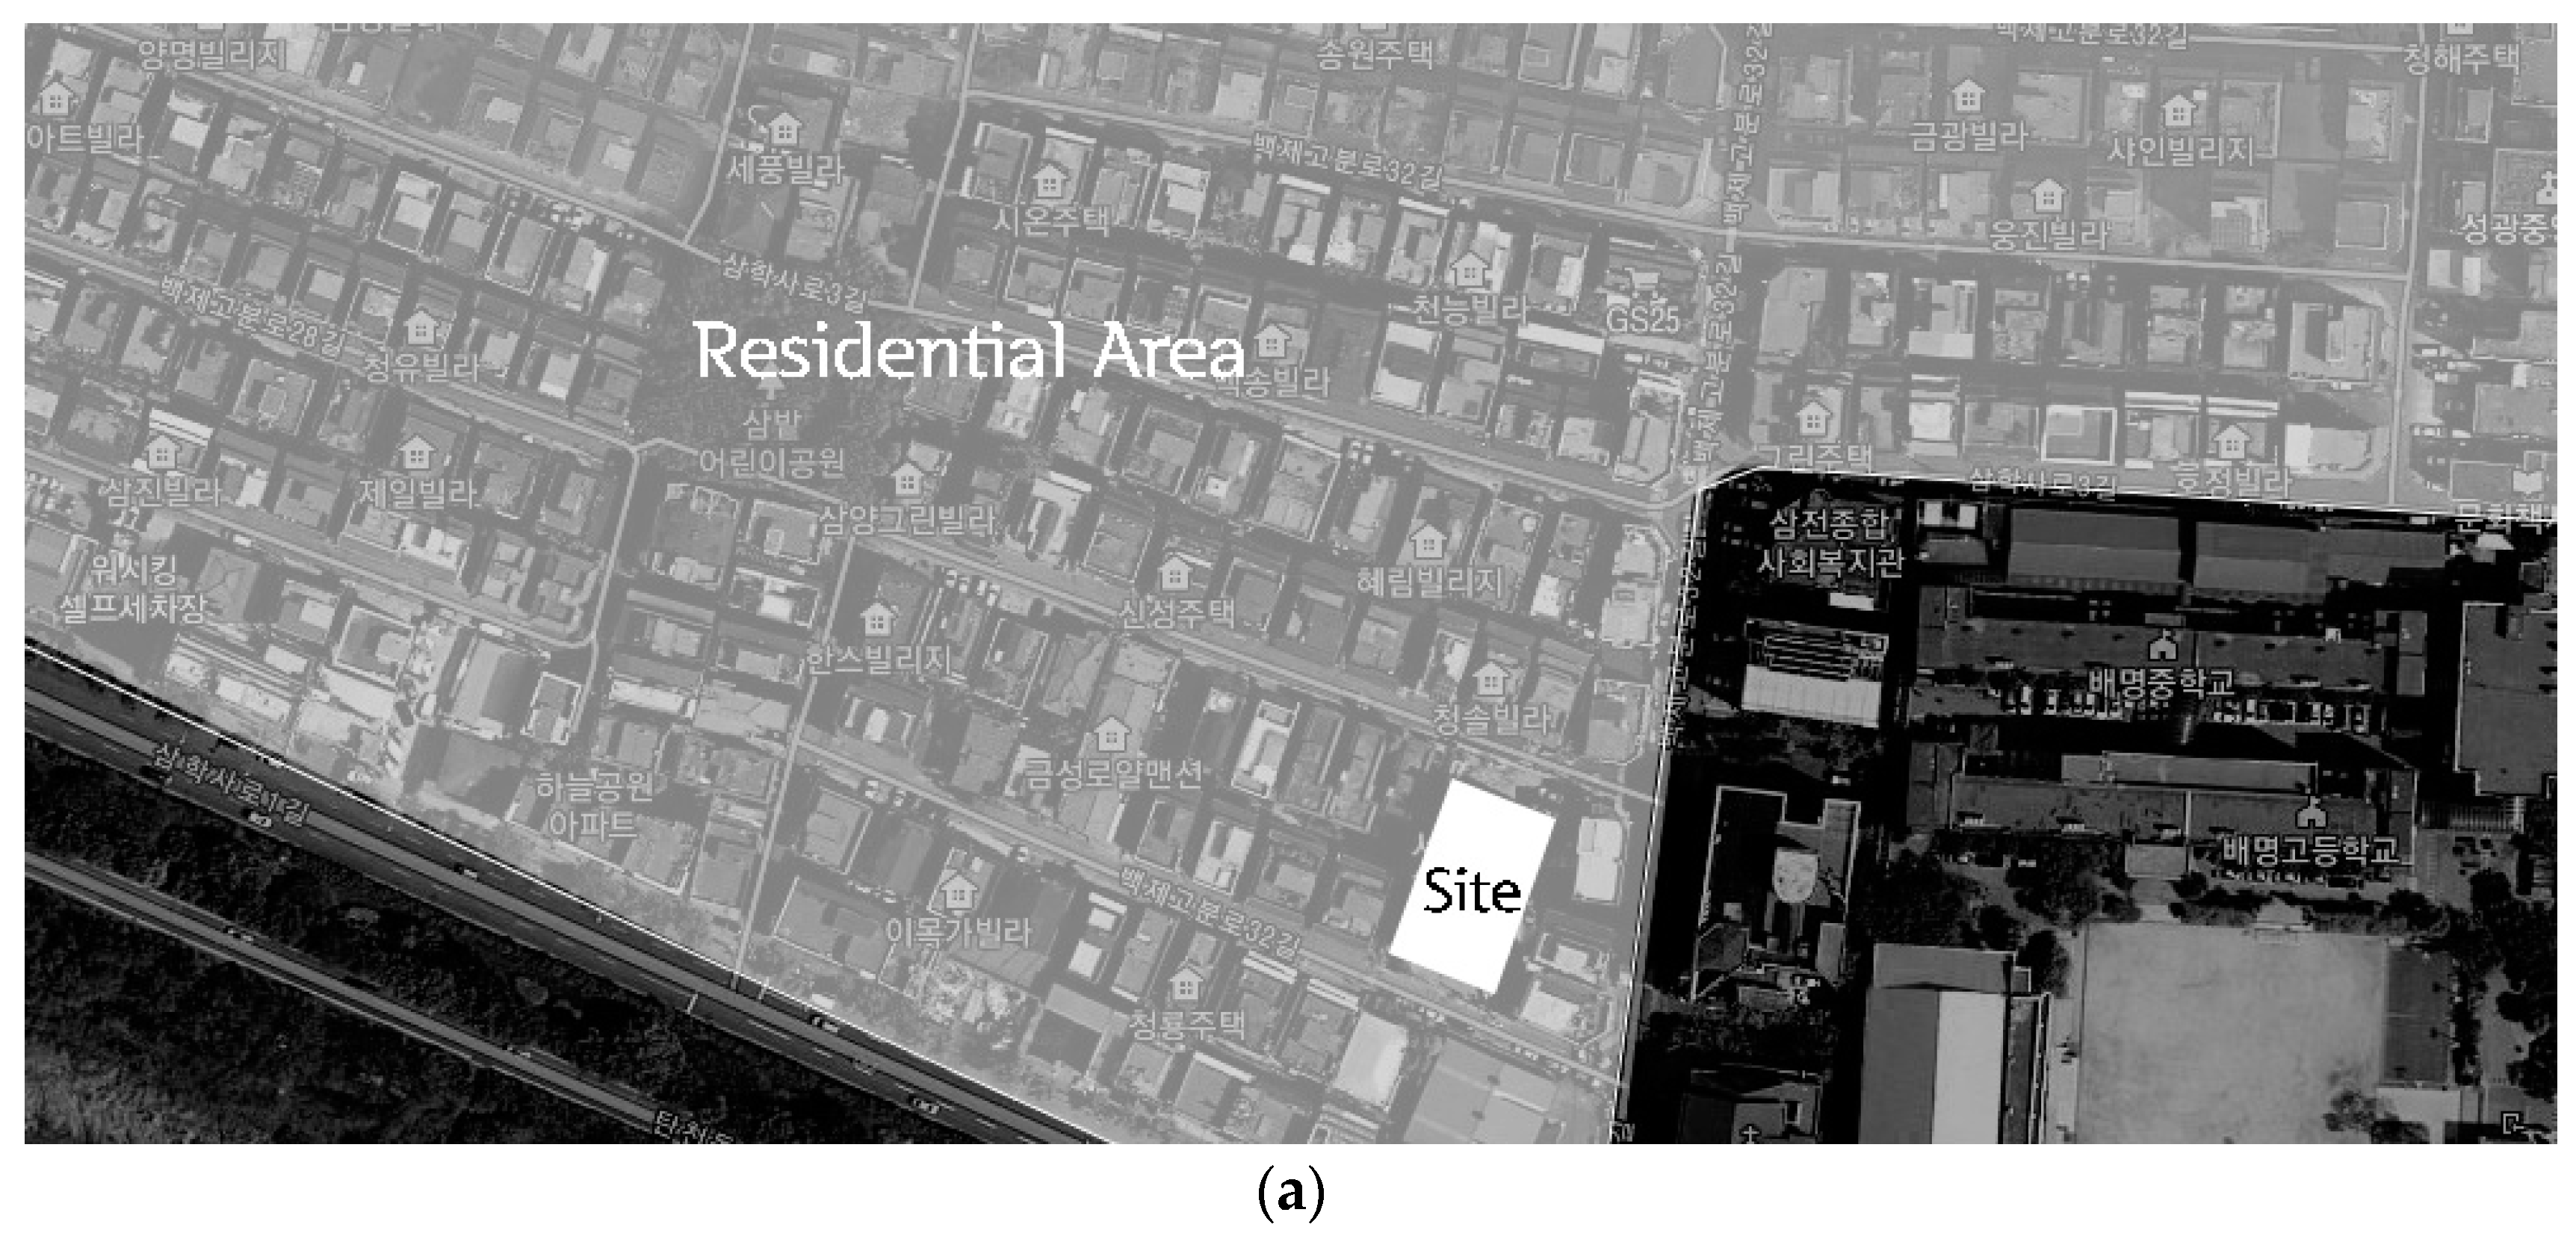
  • The input data for “Environment” included the location, which was based on the latitude and longitude of the target site, Greenwich Mean Time, surrounding city environment, and weather data. This was the external environment information that affected the building energy. For weather data, which was not provided by EnergyPlus, the “Korea standard weather data” from Seoul were used [24].
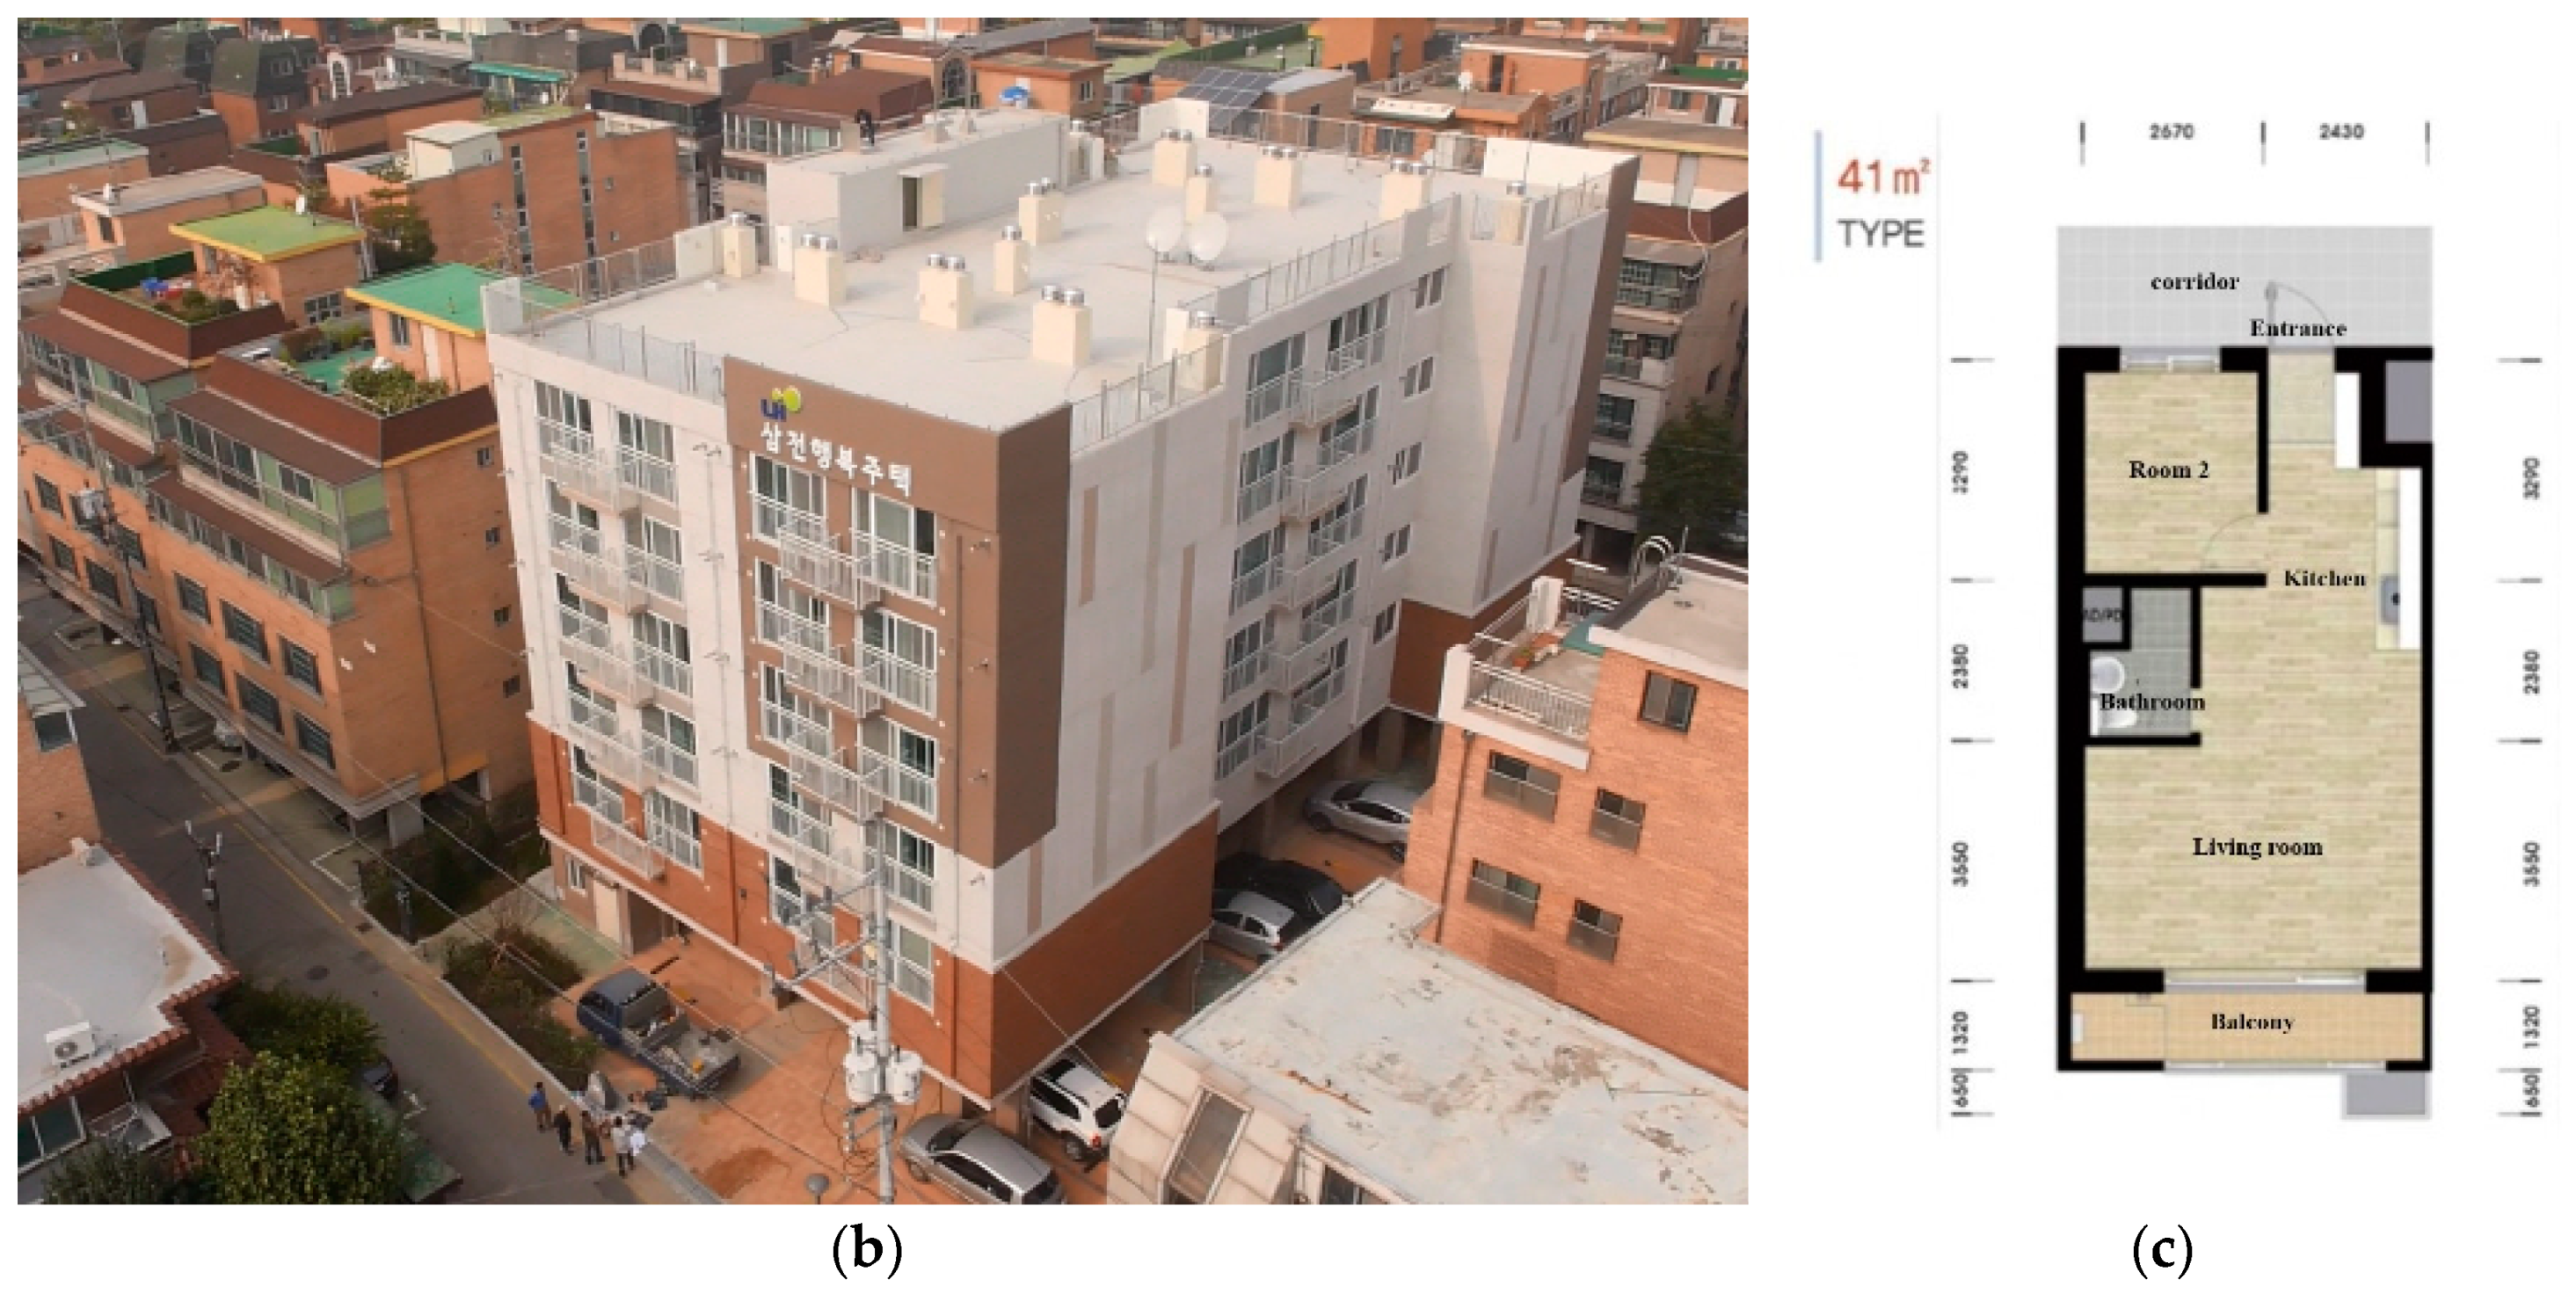
  • “Building Information” included a 3D model, material, and the composition of the simulation object. To build a simulation environment that was similar to the actual environment, we received the energy savings plan and drawings of the S Happy House from LH.
  • For the “Cooling and Heating System”, a wall-mounted air conditioner and floor heating system were applied [25]. The cooling and heating temperatures for a comfortable indoor environment were set as 20 °C and 26 °C, respectively, by referring to the Certification Standard for Building Energy Efficiency Rating and Zero Energy Building [26]. Water was delivered from an external source, but hot water was heated through an individual boiler.
  • “Applications” include electric lights, refrigerator, TV, computer, washing machine, and gas range. For the power standards of these applications, the “Survey Of Household Appliance Penetration And Household Power Consumption” was referenced [16].
  • “Occupant Schedules” corresponds to every schedule used for simulations based on the occupant’s behaviors. In this study, 5193 data points obtained through the KTUS were used.
The physical elements such as the S Happy House and surrounding environment were constructed using SketchUp 2017, through the drawings received from LH. Furthermore, the framework of the cooling and heating systems structure was constructed by converting the three dimensional (3D) model with OpenStudio2.5.1. The Korean standard weather data for Seoul were converted to an epw file for weather data to input into EnergyPlus. Based on the EUPs derived in Section 2.2, 5193 occupant schedules were created.
As shown in Figure 5, 5193 IDF files is the extension name for the EnergyPlus were created through the collected information, from which 5193 energy consumption data points were finally obtained through the EnergyPlus simulation.

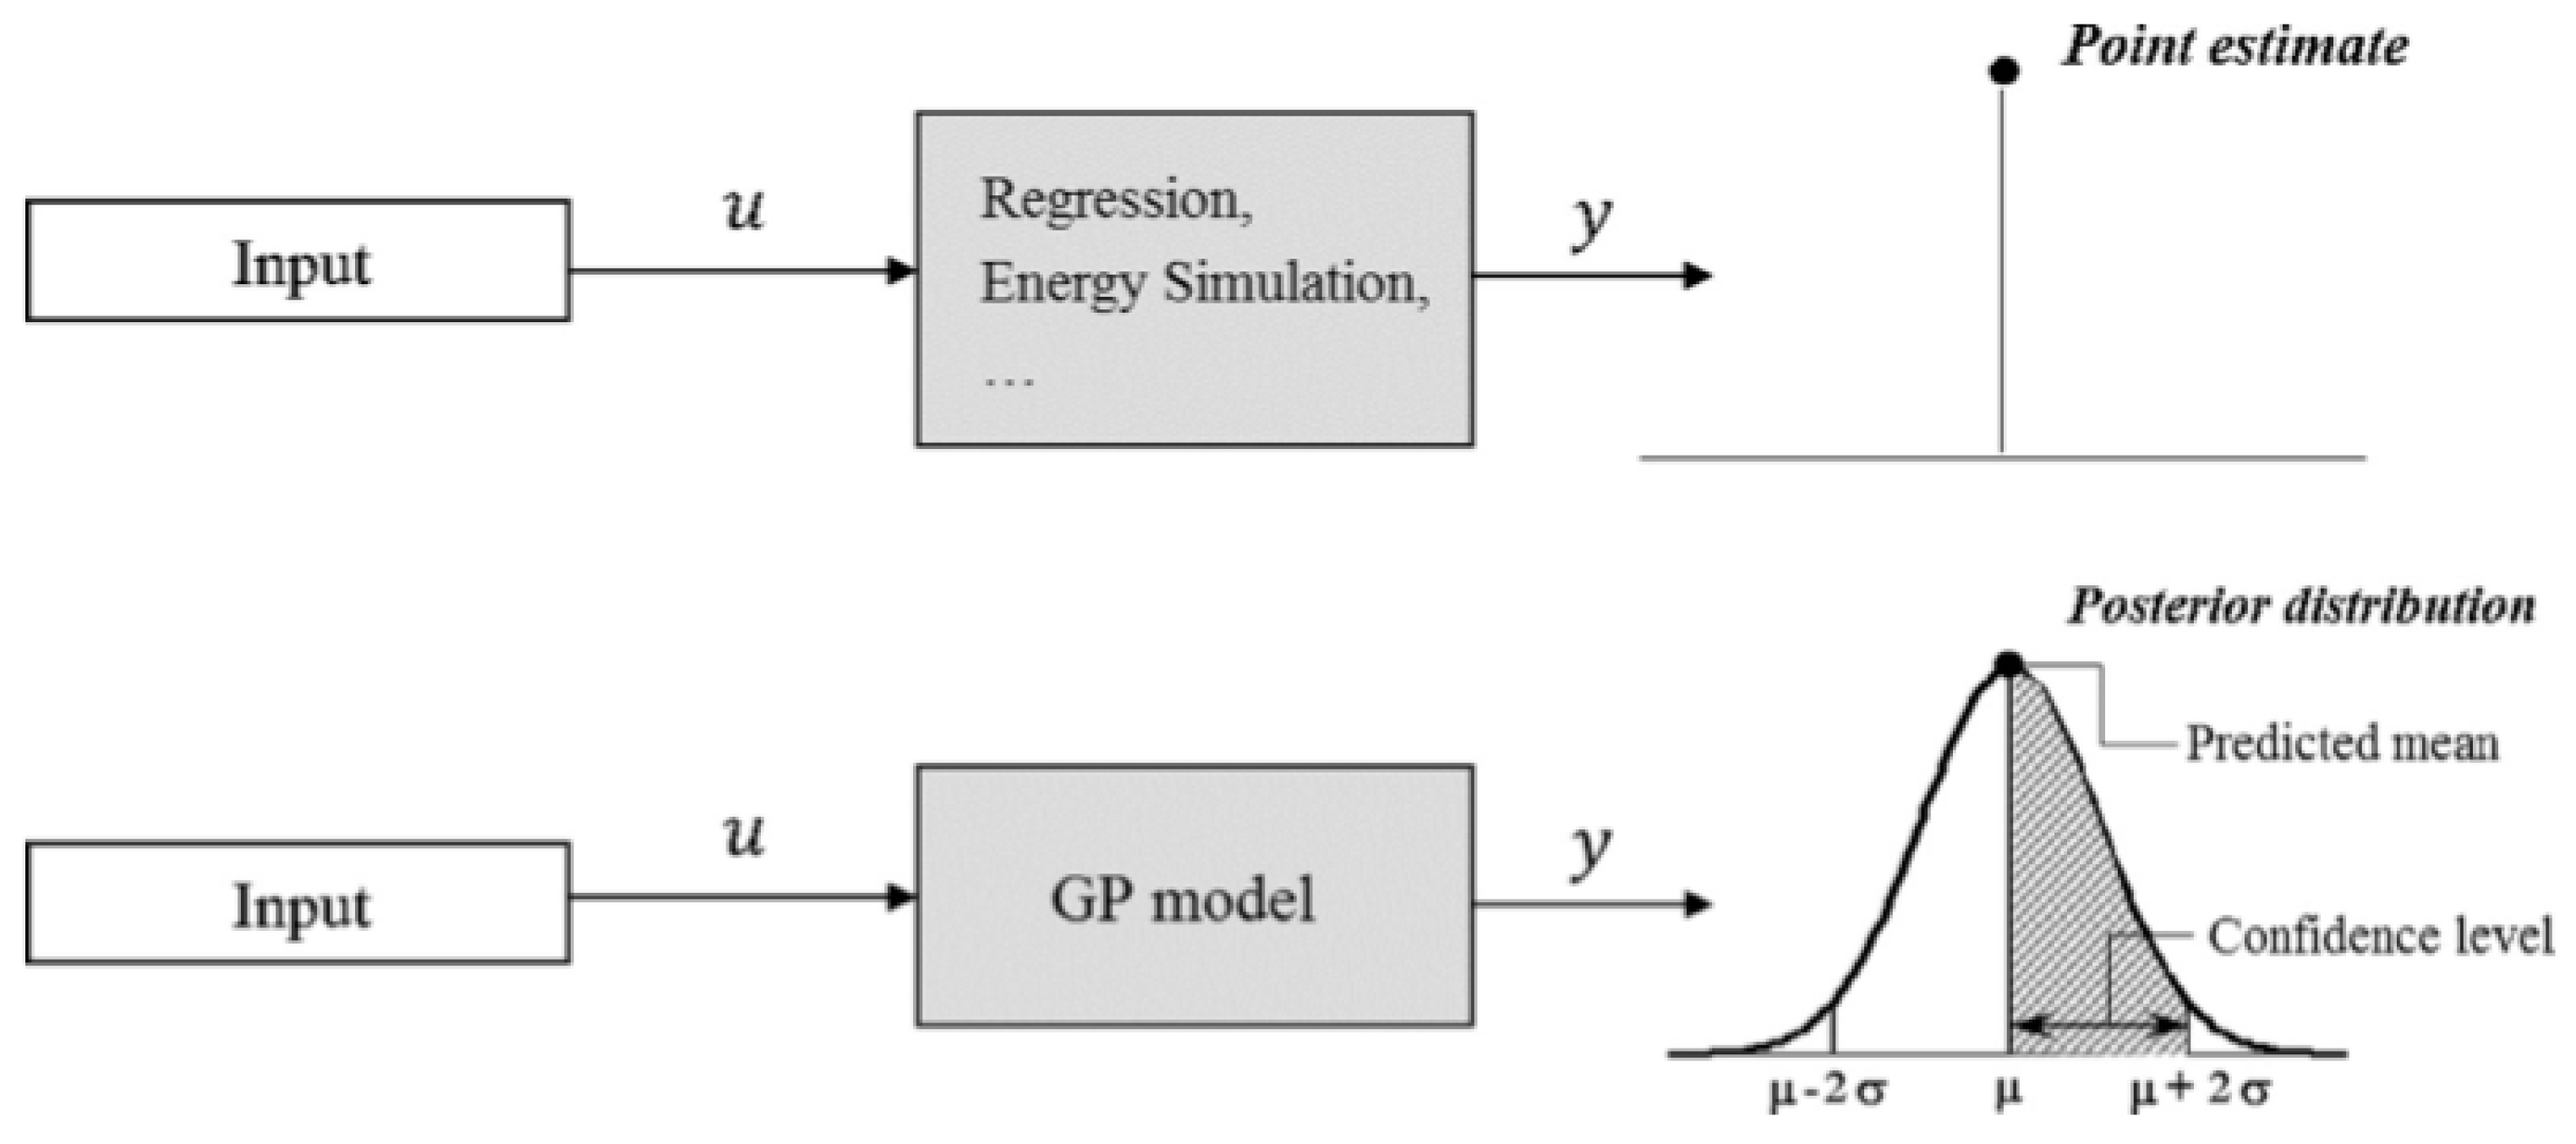
2.3.3. Gaussian Process Regression

Gaussian process regression (GPR) [27] is a black box model that can flexibly cope with nonlinear data using a Bayesian approach. It is appropriate for highly uncertain energy research because it can perform probabilistic prediction (Figure 6) [28]. Research is being conducted to build energy-related models using GPR [29,30,31,32]. In this study, an energy consumption information model was provided through GPR using the daily energy consumption data for 365 days according to each EUP type.
GPR is a linear regression model estimated from n training data { ( x i , y i ) ; i = 1 , 2 , n } , as shown in Equation (3). When the mean is zero and the variance is σ 2 , ε is Gaussian noise, as shown in Equation (4). β is a coefficient estimated from the data, and x T is expressed as an input vector:
y = x T β + ε ,
ε ~ N ( 0 , σ 2 ) .
When a training dataset is given, the post distribution of β can be estimated through the Bayesian approach, which consists of a pre-distribution and a likelihood functions. The equation of the GPR model is composed of a mean function shown in Equation (5), and a covariance function shown in Equation (6). Because the mean function has a value of zero, it can be expressed as Equation (7):
E ( f ( x ) ) = m ( x ) ,
k ( x , x ) = E [ { f ( x ) m ( x ) } { ( f ( x ) m ( x ) } ] ,
f ( x ) ~ G P ( 0 , k ( x , x ) ) .
Therefore, f ( x ) has a zero mean and follows the covariance function k ( x , x ) . The covariance function can be defined as various kernel functions, such as squared exponential, exponential, matern, rational quadratic, and automatic relevance determination. The most universal function is the squared exponential kernel (SE) function [33], which is widely used in building energy prediction research [28,34,35,36,37]. In this study, the SE method was adopted, and the kernel function is expressed as Equation (8). k ( x , x ) is parameterized by the kernel parameter or hyper parameter θ , and k ( x , x ) is dependent on the θ value. Therefore, it can be expressed as k ( x , x | θ ) . Here, σ f denotes the signal standard deviation, and σ l denotes the characteristic length scale:
k ( x i , x j | θ ) = σ f 2   exp [ 1 2 ( x i x j ) T ( x i x j ) σ l 2 ] .
For the GPR tool, the statistics and machine learning toolbox of MATLAB R2018b were used. For the algorithm, Williams et al. [33] was referenced. For a detailed explanation of the equation, the MATLAB User’s Guide [38] can be referenced. To predict the energy consumption by EUP type for 365 days in this study, three energy consumption information models were created for total energy, cooling, and heating for each type, with x as the date and y as the daily energy consumption data.

2.4. Methodology for Predicting EUP Types Used by the SVM

SVM is a model that can solve the classification and regression problems through supervised learning. The SVM model can effectively respond to various problems because it can be applied to linear and nonlinear problems [39]. The idea behind SVM is to create lines or hyperplanes that classify data into classes [40]. Therefore, it creates lines or hyperplanes that can distinguish different outputs (i.e., classes) by entering input x and output y data. SVM models include linear, quadratic, cubic, fine Gaussian, medium Gaussian, and coarse Gaussian SVMs, depending on the kernel function for implementing the lines or hyperplanes that distinguish classes (Table 4). In this study, six SVM models were trained through the Classification Learner App of MATLAB R2018b, and the most appropriate SVM model was selected [38].
To train the SVM model, input data x and output data y are required. The x data provide information for predicting y, and consist of the factors affecting y. The y data are the results obtained from x, and y is the answer that we want to eventually obtain through the predictive model. In this study, x consisted of five occupant features and 144 EUP data points. Furthermore, the EUP types defined by K-modes clustering in Section 2.3.1 correspond to y.
Occupant behavior varies by occupant features such as age, gender, income, working status, and care needs, which can lead to differences in EUP. Many studies have been conducted on occupant behavior and energy consumption according to occupant features [41,42,43]. In this study, a predictive model for the SVM EUP type was constructed using occupant features and EUP, and the dataset for this is shown in Table 5.

3. Results and Discussion

As a result of the research, Section 3 has the following contents. Seven EUP types of single-person households have been derived in South Korea. In addition, we analyzed the differences in household characteristics and energy consumption of each type and constructed an energy information model through Gaussian process regression. Finally, we developed an EUP type predictive model with 95% accuracy through SVM.

Deriving the EUP Types and Analysis of Occupant Features through K-Modes Clustering

As a result of K-modes clustering with 5193 EUP data points using the method outlined in Section 2.3.1, seven EUP types of single-person household occupants were derived. The household characteristics of seven EUP types based on the analysis results can be seen in Figure 7, which visualizes the energy consumption behavior probability of occupants by time slot for the seven EUP types, and in Table 6, which outlines the five household characteristics used in the SVM.
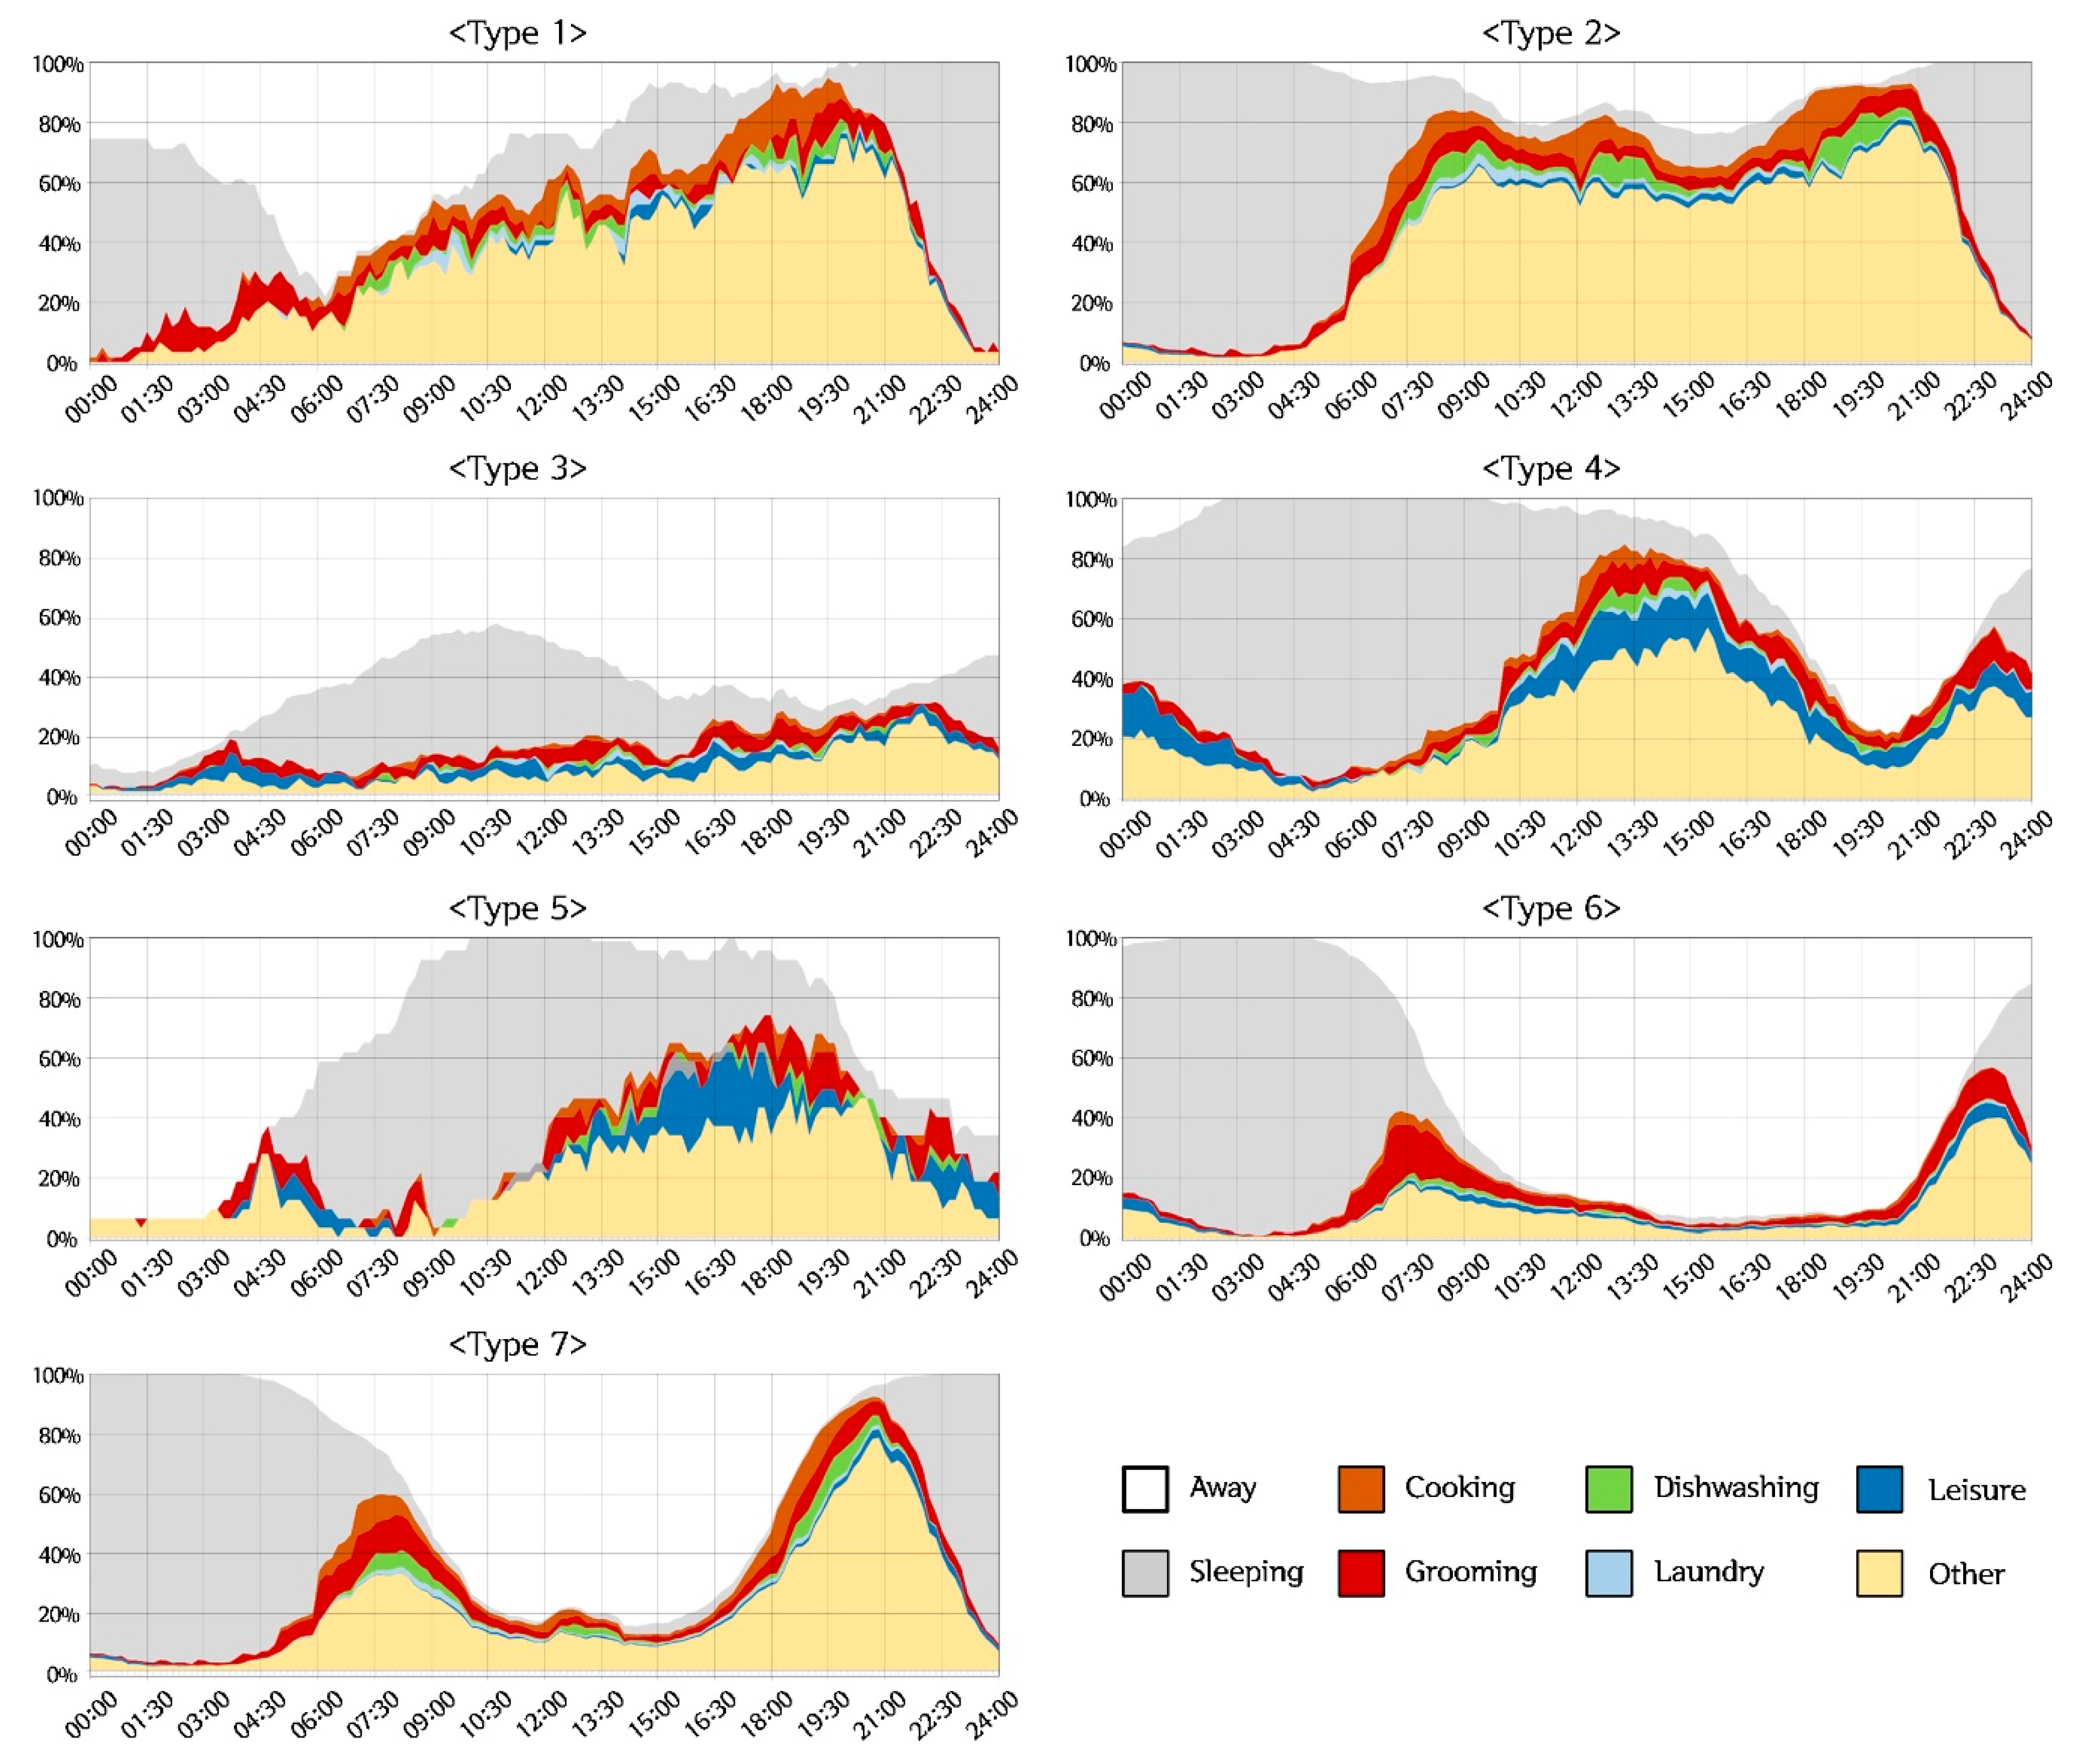
  • Type 1 was a cluster that mainly consists of people aged 65 or older (51.7%) with low incomes. They were mainly involved in outside activities between 04:30 and 09:00, and in indoor activities in the residence at other times.
  • Type 2 had the highest ratios of household members who are 65 or older (66.0%), female (68.8%), had monthly incomes less than 1 million won (75.8%), and had care needs (65.78%). They had almost no outside activities or hobbies. Their main space of activity was their residence.
  • Type 3 had the highest ratio of economic activities (81.4%), and their daily work started in the afternoon, after 13:00. After their economic activities were finished in the late evening, they mainly slept in their residence between 04:00 and 13:00. Besides sleeping, their activities related to energy consumption were few, and their living patterns were irregular.
  • Type 4 spent a similar amount of time in the residence as Type 1. Their genders, monthly incomes, and jobs were similar, but their age was different. The time slot for the main outside activities of Type 4 was 18:00 to 22:30. They spent a high percentage of time in hobby activities in their residence.
  • Type 5 had a sleeping time period similar to that of Type 3, but after sleeping they mainly spent time in their residence enjoying hobbies. They went out in the evening between 22:00 and 08:00.
  • Type 6 had a high percentage of youth who were active in economic and outside activities, with the lowest ratio of people aged 65 or older (9.0%). Furthermore, they spent the shortest amount of time in their residences. The main activity in the residence was personal hygiene, and they had the least amount of time spent on other activities.
  • Type 7 comprised 2074 out of the 5193 data points. This seemed to be the living pattern type of general office workers. However, based on the percentage of those 65 years or older (45.4%) and without work (51.2%), this type also included people who spent their personal time mainly outside their residence, besides office workers.
a. Comparison of Energy Consumption by EUP Type According to the Energy Simulation Results
A total of 5193 energy simulations were performed based on occupants through EnergyPlus. To compare the energy consumption among the seven EUP types, the data were expressed as boxplots, as shown in Figure 8. The analysis was performed for five categories: Electric light, applications, cooling, heating, and total energy consumption for one year. Furthermore, to facilitate the comparison of energy consumption, a ranking list was prepared for each item, as shown in Table 7.
As shown in Table 7, the annual total energy consumption was the highest for Type 2, followed by Type 1, Type 7, Type 4, Type 5, Type 6, and Type 3, respectively. Type 1 and Type 2 ranked highest for all five items. They seem to be largely affected by the occupancy time, need for a comfortable indoor environment, and personal life. For Type 2, the percentage of households that had care needs was 65.78%, and, since they had a high percentage of people staying at home, they had the highest energy consumption. Furthermore, Type 2 had the highest energy consumption, which was twice as high as that of Type 3, which had the lowest energy consumption in the same conditions (except for daily living pattern).
Type 4, which had a similar occupancy time as Type 1, showed lower energy consumption in every item. The largest differences in household characteristics between the two types were age and occupancy time slot. Type 4, which had a high percentage of youth, mainly saw occupants spending time for sleeping, leisure, and personal management. Type 1, which had a high percentage of elders, had large energy consumption amounts for residential environment maintenance, such as food preparation and dishwashing. Even though their occupancy times were similar, the energy consumption patterns of the two types were different due to the differences in household characteristics and living patterns.
Furthermore, there were some cases in which the occupancy time was long, but the energy consumption was low. Type 4 had a longer occupancy time than did Type 7, but Type 7 had greater energy consumption in applications and heating. Type 7, which had similar household characteristics as Type 1, had high energy consumption for applications because their living pattern focused on maintaining their residential environment. In the case of heating energy, unlike Type 7, Type 4 household members stayed at home during the day when the outside temperature was higher in the winter, and because their time outside was short, they consumed less energy in returning the indoor temperature to a proper, comfortable temperature. However, in the summer, Type 4 members consumed higher cooling energy than did Type 7 due to the high outdoor temperatures during the day. It appears that Type 7 reduced energy consumption due to cooling energy by maintaining the indoor temperature at 26 °C or lower through natural ventilation during the evening. This was clearly seen through a comparison of Type 5 and Type 6, which had opposite time slots for staying at home, although their occupancy times were similar.
According to Fong et al. [44], age and sex influence energy consumption, and the higher the percentages of elders and women, the higher the energy consumption was. The results of this study also suggest that age and sex have a large effect on energy consumption. Out of the seven types, Type 1, Type 2, and Type 7 had the highest percentages of people 65 years or older, and they correspond to 1st, 2nd, and 3rd for their annual total energy consumption, and all three types had the highest percentages of women. Next, Type 4 and Type 5, which ranked 4th and 5th, respectively, also had a higher percentage of women than men. Type 6 and Type 3, which ranked 6th and 7th, respectively, had a higher percentage of men. Therefore, these results suggest that age and sex can cause differences in lifestyles and energy consumption.
Income and work had an effect on occupancy time, and caused differences in energy consumption. Type 3, Type 5, and Type 6 had jobs, and the higher the income, the lower the energy consumption was. For Type 3 and Type 5, the percentage of people with jobs was 81.4% and 93.9%, respectively. According to a previous study on energy consumption based on income for Koreans, the higher the economic level, the lower the constraints for energy consumption and the higher the energy consumption to maintain the environment of residence [45,46]. However, in this study, the higher the income, the lower the energy consumption was. This result seems to be because of the nature of single-person households; the more actively they are involved in economic activities, the higher their income, and the lower their occupancy time in the residence are.
b. Energy Consumption Information Model for Total Energy, Cooling, and Heating for Each Type Through Gaussian Process Regression
To provide energy consumption data for each EUP type, GPR was performed, as described in Section 2.3.3, and the information model for total energy, cooling, and heating was created. The information model is composed of three elements. The total model (Figure S1) can identify the overall energy consumption pattern. The cooling (Figure S2) and heating (Figure S3) models are most heavily influenced by the climate. To examine the energy consumption by period, the three information models are presented in the Appendix A [47].
In the figures in the Appendix A, the blue dots indicate the actual data, and the red dots comprise the boundary representing a 99% confidence interval. A larger space between the top and bottom lines means greater diversity in energy consumption. The black solid line is the mean value where the largest amount of data is located. The top and bottom 99% prediction interval lines are drawn above and below this line.
c. Predictive Model of EUP Types Through Occupant Features and EUPs
The predictive model was evaluated through six SVMs, according to the kernel function types and options presented in Section 2.4. Each model was trained using 80% of the total data as the training data, and the model was evaluated with 20% data. As a result, the prediction rate of each model was as shown in Table 8. Thus, Model 1.2 was most appropriate for predicting the EUP type.
To examine the prediction performance of Model 1.2 in detail, a confusion matrix was drawn, as shown in Figure 9. The probabilities that the EUP-type prediction model would accurately predict the type were generally high: 42%, 93%, 96%, 90%, 75%, 98%, and 97%, respectively, according to type. However, when we examined Type 1 and Type 5, which showed relatively low prediction rates, it seemed that they were not sufficiently trained because they had a smaller number of data points compared to other types. This issue could be improved if we were to acquire more data in the future. Therefore, the EUP-type prediction model with a prediction rate of 95.0% was implemented through SVM. The results of this study showed applicability of EUP prediction in other countries and regions.

4. Conclusions

The residential sector accounts for 3/4 of the total building energy consumption. Research and development of technologies to reduce energy consumption in residences is being actively conducted. However, the improvement of physical elements in buildings has limitations for energy reduction purposes. The paradigm is shifting towards considering the behaviors of occupants, as a means of overcoming these limitations and to create sustainable energy savings in the residential sector. Although studies considering the behaviors of occupants have been conducted, there have been difficulties due to limitations in data collection and privacy issues. Furthermore, it is difficult to analyze the behaviors of occupants because of their inherent complexity. This study attempted to overcome this limitation through data mining.
This study prepared large datasets for analysis based on the KTUS, which provides behavior data of actual residential occupants. Furthermore, EUP types were derived through K-modes clustering, and the household characteristics and energy consumption of each type were analyzed. As a result of K-modes clustering, seven EUP types were derived. Comparisons of the five household characteristics and energy consumption among the types revealed that people aged 65 or older and females had higher amounts of energy consumption than other groups. Unlike the results of previous studies, we found that the higher the economic level of a resident, the lower the energy consumption was, because of their occupancy time and occupancy time slots. This can be considered a characteristic of single-person households. The energy consumption showed a two-fold difference depending on the EUP type. Finally, an EUP-type prediction model with a prediction rate of 95.0% was implemented by training an SVM, and an energy consumption information model provided through GPR.
The processes of deriving the EUP types based on actual behavior data, energy simulation, and implementation of the EUP-type prediction model and the energy consumption information model, can be used as basic research data in future studies based on the behaviors of occupants, and they can be applied to other regions. In addition, EnergyPlus, Openstudio, and Python used in this study are open-source software and can increase the usefulness of this study in the future.
The limitation of this study is that the energy consumption data were created through energy simulations. If this limitation can be overcome, the outputs of the obtained research, through the process used in this study, can help prepare the framework for a building occupant energy management system in the coming era of smart buildings, which will lead to energy savings in the residential sector. There is also a limitation that the subject of this study is limited to single-person households. Recently, however, technology development and research on smart cities and buildings, enabling data collection, is in progress and a smart monitoring system for occupants will be available. Once the monitoring system is established, energy management will be possible considering the energy consumption patterns of occupants. The limitations could be overcome if later studies were conducted from data collection of Internet of Things (IoT) devices in multi-person households.

Supplementary Materials

The following are available online at https://www.mdpi.com/2071-1050/11/1/245/s1, Figure S1. Energy Consumption Information Model for total energy consumption over 365 days. Figure S2. Energy Consumption Information Model for cooling for 365 days. Figure S3. Energy Consumption Information Model for heating for 365 days.

Author Contributions

Conceptualization, S.K., and S.J.; data curation, S.K. and S.-M.B.; formal analysis, S.K.; methodology, S.K. and S.J.; project administration, S.K.; software, S.K.; supervision, S.J. and S.-M.B.; visualization, S.K.; writing—original draft, S.K.; writing—review and editing, S.K., S.J., and S.-M.B.

Funding

This work was supported by the National Research Foundation of Korea (NRF) grant funded by the Korean government (MSIT) (No. NRF-2018R1A2B2005528).

Acknowledgments

In this section you can acknowledge any support given which is not covered by the author contribution or funding sections. This may include administrative and technical support, or donations in kind (e.g., materials used for experiments).

Conflicts of Interest

The authors declare no conflict of interest.

Appendix A

Figure A1. Energy Consumption Information Model for total energy consumption over 365 days.
Sustainability 11 00245 g0a1
Figure A2. Energy Consumption Information Model for cooling for 365 days.
Sustainability 11 00245 g0a2
Figure A3. Energy Consumption Information Model for heating for 365 days.
Sustainability 11 00245 g0a3

References

  1. Nejat, P.; Jomehzadeh, F.; Taheri, M.M.; Gohari, M.; Majid, M.Z.A.J.R. A global review of energy consumption, CO2 emissions and policy in the residential sector (with an overview of the top ten CO2 emitting countries). Renew. Sustain. Energy Rev. 2015, 43, 843–862. [Google Scholar] [CrossRef]
  2. Conti, J.; Holtberg, P.; Diefenderfer, J.; LaRose, A.; Turnure, J.T.; Westfall, L. International Energy Outlook 2016 with Projections to 2040; USDOE Energy Information Administration (EIA), Office of Energy Analysis: Washington, DC, USA, 2016.
  3. Guo, F.; Akenji, L.; Schroeder, P.; Bengtsson, M.J.E. Static analysis of technical and economic energy-saving potential in the residential sector of Xiamen city. Energy 2018, 142, 373–383. [Google Scholar] [CrossRef]
  4. Hoicka, C.E.; Parker, P.J.E.E. Assessing the adoption of the house as a system approach to residential energy efficiency programs. Energy Effic. 2018, 11, 295–313. [Google Scholar] [CrossRef]
  5. Gonzalez, J.M.; Pouresmaeil, E.; Canizares, C.A.; Bhattacharya, K.; Mosaddegh, A.; Solanki, B.V. Smart Residential Load Simulator for Energy Management in Smart Grids. IEEE Trans. Ind. Electron. 2018, 66, 1443–1452. [Google Scholar]
  6. Menezes, A.C.; Cripps, A.; Bouchlaghem, D.; Buswell, R.J.A.E. Predicted vs. actual energy performance of non-domestic buildings: Using post-occupancy evaluation data to reduce the performance gap. Appl. Energy 2012, 97, 355–364. [Google Scholar] [CrossRef] [Green Version]
  7. Ouyang, J.; Hokao, K.J.E. Energy-saving potential by improving occupants’ behavior in urban residential sector in Hangzhou City, China. Energy Build. 2009, 41, 711–720. [Google Scholar] [CrossRef]
  8. Guerra-Santin, O.; Bosch, H.; Budde, P.; Konstantinou, T.; Boess, S.; Klein, T.; Silvester, S.J.E.E. Considering user profiles and occupants’ behaviour on a zero energy renovation strategy for multi-family housing in the Netherlands. Energy Effic. 2018, 1–24. [Google Scholar] [CrossRef]
  9. Brounen, D.; Kok, N.; Quigley, J.M.J.E.E.R. Residential energy use and conservation: Economics and demographics. Eur. Econ. Rev. 2012, 56, 931–945. [Google Scholar] [CrossRef] [Green Version]
  10. Amasyali, K.; El-Gohary, N.M.J.R.; Reviews, S.E. A review of data-driven building energy consumption prediction studies. Renew. Sustain. Energy Rev. 2018, 81, 1192–1205. [Google Scholar] [CrossRef]
  11. Yu, B.; Wei, Y.-M.; Kei, G.; Matsuoka, Y.J.N.E. Future scenarios for energy consumption and carbon emissions due to demographic transitions in Chinese households. Nat. Energy 2018, 3, 109–118. [Google Scholar] [CrossRef]
  12. Statistics Korea. Population and Housing Census; Statistics Korea, Ed.; Statistics Korea: Seoul, Korea, 2015.
  13. Lee, S.G.; Lee, S.I.; Na, I.G. A Study on Improvement Mesures for the National Energy Saving and Efficiency Improvement System; Korea Energy Economics Institute; KEEI: Ulsan, Korea, 31 December 2008. [Google Scholar]
  14. Statistics Korea. 2014 Korea Time Use Survey; Statistics Korea, Ed.; Micro Intergreted Service: Seoul, Korea, 2015.
  15. Statistics Korea. Guidelines for Users of 2014 Korean Time Use Survey; Statistics Korea, Ed.; Statistics Korea: Seoul, Korea, 2016.
  16. Exchange, K.P. A Survey of Hosehold Appliance Penetration and Household Power Consumption Patterns; Statistics Korea, Ed.; Statistics Korea: Seoul, Korea, 2013.
  17. MacQueen, J. Some methods for classification and analysis of multivariate observations. In Proceedings of the Fifth Berkeley Symposium on Mathematical Statistics and Probability, Berkeley, CA, USA, 21 June–18 July 1965; pp. 281–297. [Google Scholar]
  18. Huang, Z.; Ng, M.K. A note on k-modes clustering. J. Classif. 2003, 20, 257–261. [Google Scholar] [CrossRef]
  19. Huang, Z. Extensions to the k-means algorithm for clustering large data sets with categorical values. Data Min. Knowl. Discov. 1998, 2, 283–304. [Google Scholar] [CrossRef]
  20. Crawley, D.B.; Lawrie, L.K.; Winkelmann, F.C.; Buhl, W.F.; Huang, Y.J.; Pedersen, C.O.; Strand, R.K.; Liesen, R.J.; Fisher, D.E.; Witte, M.J.J.E.; et al. EnergyPlus: Creating a new-generation building energy simulation program. Energy Build. 2001, 33, 319–331. [Google Scholar] [CrossRef]
  21. Zhou, X.; Hong, T.; Yan, D. Comparison of HVAC system modeling in EnergyPlus, DeST and DOE-2.1 E. In Building Simulation; Springer: Berlin/Heidelberg, Germany, 2014; pp. 21–33. [Google Scholar]
  22. Ministry of Land, Infrastructure and Transport. Introduction of Happy House. Available online: www.molit.go.kr/happyhouse/info.jsp (accessed on 30 January 2018).
  23. Jang, H.; Kang, J.J.E. An energy model of high-rise apartment buildings integrating variation in energy consumption between individual units. Energy Build. 2018, 158, 656–667. [Google Scholar] [CrossRef]
  24. The Korean Solar Energy Society; KIAEBS. Korean Standard Weather Data; The Korean Solar Energy Society, KIAEBS, Eds.; The Korean Solar Energy Society; KIAEBS: Seoul, Korea, 2015. [Google Scholar]
  25. US DOE. Getting Started with Energy Plus; US Department of Energy: Washington, DC, USA, 2009.
  26. Ministry of Land, Infrastructure and Transport. Standards for Building Energy Efficiency Rating and Zero Energy Building Certification; Ministry of Land, Infrastructure and Transport, Ed.; Ministry of Land, Infrastructure and Transport: Sejong, Korea, 2017.
  27. Williams, C.K.; Rasmussen, C.E. Gaussian processes for regression. In Advances in Neural Information Processing Systems; NIPS: Montreal, QC, Canada, 1996; pp. 514–520. [Google Scholar]
  28. Yoon, Y.R.; Moon, H.J.J.E. Energy consumption model with energy use factors of tenants in commercial buildings using Gaussian process regression. Energy Build. 2018, 168, 215–224. [Google Scholar] [CrossRef]
  29. Heo, Y.; Choudhary, R.; Augenbroe, G.J.E. Calibration of building energy models for retrofit analysis under uncertainty. Energy Build. 2012, 47, 550–560. [Google Scholar] [CrossRef]
  30. Kim, Y.-J.; Park, C.-S. Gaussian process model for real-time optimal control of chiller system. J. Archit. Inst. Korea Plan. Des. 2014, 30, 211–220. [Google Scholar] [CrossRef]
  31. Nghiem, T.X.; Jones, C.N. Data-driven demand response modeling and control of buildings with gaussian processes. In Proceedings of the 2017 American Control Conference (ACC), Seattle, WA, USA, 24–26 May 2017; pp. 2919–2924. [Google Scholar]
  32. Sheng, H.; Xiao, J.; Cheng, Y.; Ni, Q.; Wang, S. Short-term solar power forecasting based on weighted Gaussian process regression. IEEE Trans. Ind. Electron. 2018, 65, 300–308. [Google Scholar] [CrossRef]
  33. Rasmussen, C.E. Gaussian processes in machine learning. In Advanced Lectures on Machine Learning; Springer: Berlin, Germany, 2004; pp. 63–71. [Google Scholar]
  34. Heo, Y.; Zavala, V.M.J.E. Gaussian process modeling for measurement and verification of building energy savings. Energy Build. 2012, 53, 7–18. [Google Scholar] [CrossRef]
  35. Bhinge, R.; Biswas, N.; Dornfeld, D.; Park, J.; Law, K.H.; Helu, M.; Rachuri, S. An intelligent machine monitoring system for energy prediction using a Gaussian Process regression. In Proceedings of the 2014 IEEE International Conference on Big Data (Big Data), Washington, DC, USA, 27–30 October 2014; pp. 978–986. [Google Scholar]
  36. Blum, M.; Riedmiller, M.J.P. Electricity demand forecasting using Gaussian processes. Power 2013, 10, 104. [Google Scholar]
  37. Manfren, M.; Aste, N.; Moshksar, R. Calibration and uncertainty analysis for computer models—A meta-model based approach for integrated building energy simulation. Appl. Energy 2013, 103, 627–641. [Google Scholar] [CrossRef]
  38. The MathWorks, Inc. Statistics and Machine Learning Toolbox™ User’s Guide; Matlab: Natick, MA, USA, 2018. [Google Scholar]
  39. Huang, J.; Lu, J.; Ling, C.X. Comparing naive Bayes, decision trees, and SVM with AUC and accuracy. In Proceedings of the Third IEEE International Conference on Data Mining, Melbourne, FL, USA, 22 November 2003; p. 553. [Google Scholar]
  40. Noble, W.S. What is a support vector machine? Nat. Biotechnol. 2006, 24, 1565–1567. [Google Scholar] [CrossRef] [PubMed]
  41. Al-Mumin, A.; Khattab, O.; Sridhar, G.J.E. Occupants’ behavior and activity patterns influencing the energy consumption in the Kuwaiti residences. Energy Build. 2003, 35, 549–559. [Google Scholar] [CrossRef]
  42. Huebner, G.; Shipworth, D.; Hamilton, I.; Chalabi, Z.; Oreszczyn, T. Understanding electricity consumption: A comparative contribution of building factors, socio-demographics, appliances, behaviours and attitudes. Appl. Energy 2016, 177, 692–702. [Google Scholar] [CrossRef] [Green Version]
  43. Kavousian, A.; Rajagopal, R.; Fischer, M.J.E. Determinants of residential electricity consumption: Using smart meter data to examine the effect of climate, building characteristics, appliance stock, and occupants’ behavior. Energy 2013, 55, 184–194. [Google Scholar] [CrossRef]
  44. Fong, W.-K.; Matsumoto, H.; Lun, Y.-F.; Kimura, R. Influences of indirect lifestyle aspects and climate on household energy consumption. J. Asian Archit. Build. Eng. 2007, 6, 395–402. [Google Scholar] [CrossRef]
  45. Jung, J.; Yi, C.; Lee, S. An Integrative Analysis of the Factors Affecting the Household Energy Consumption in Seoul. J. Korea Plan. Assoc. 2015, 50, 75–94. [Google Scholar] [CrossRef]
  46. Noh, S.C.; Lee, H.Y. An Analysis of the Factor Affecting the Energy Consumption of the Household in Korea. J. Korea Plan. Assoc. 2013, 48, 295–312. [Google Scholar]
  47. Gi, K.; Sano, F.; Hayashi, A.; Tomoda, T.; Akimoto, K. A global analysis of residential heating and cooling service demand and cost-effective energy consumption under different climate change scenarios up to 2050. Mitig. Adapt. Strateg. Glob. Chang. 2018, 23, 51–79. [Google Scholar] [CrossRef]
Figure 1. Research process for predicting energy usage pattern types with energy consumption information.
Sustainability 11 00245 g001
Figure 2. EUP data code definitions according to 5193 resident behaviors in the KTUS.
Sustainability 11 00245 g002
Figure 3. Elbow curve for error values of the model for each k.
Sustainability 11 00245 g003
Figure 4. The “S Happy House” located in Seoul, which is the energy simulation target area: (a) The target site located in a residential area; (b) a bird’s-eye view of the S Happy House; (c) a floor plan for the 41 m 2 module.
Sustainability 11 00245 g004aSustainability 11 00245 g004b
Figure 5. Process of deriving the 5193 energy consumption data points based on occupants’ behaviors using EnergyPlus.
Sustainability 11 00245 g005
Figure 6. Two different Gaussian process models: A general predictive model and probabilistic predictive model. Source Reference [28].
Sustainability 11 00245 g006
Figure 7. Energy consumption behavior probability by time slot for the seven EUP types derived through K-modes clustering.
Sustainability 11 00245 g007
Figure 8. Comparison of the total annual energy consumption for lighting, applications, cooling, heating, and the overall total for each EUP type.
Sustainability 11 00245 g008
Figure 9. Confusion matrix for verifying the performance of the EUP-type prediction model.
Sustainability 11 00245 g009
Table 1. EUP codes related to energy-using applications.
ElectricityGasEnergy Consumption Behavior
LightingComputerTVWashing MachineRefrigeratorGas RangeHot WaterEUP Codes
A1, S1
O1
L1
L1
L2
C1
G1, D1
Table 2. EUP dataset format for K-modes clustering.
Household No.Time Step 1
(00:00–00:10)
Time Step 2
(00:10–00:20)
Time Step 3
(00:20–00:30)
···Time Step 143
(23:40–23:50)
Time Step 144
(23:50–24:00)
1S1S1O1···G1A1
2G1G1S1···L1L1
3A1A1A1···S1S1
·····················
5192A1O1O1···S1S1
5193C1C1L2···A1A1
Table 3. Energy simulation settings through EnergyPlus.
EnergyPlus Input ItemsDetailsUsed Tools
EnvironmentLocationSeoul
Latitude: 37.49
Longitude: 127.09
Time zone: GMT + 9
Elements1.0.6
WeatherStandard weather data in Seoul
Building Information3D ModelingS Happy HouseSketchUp2017
OpenStudio2.5.1
IDF Editor
MaterialGlass, Concrete, EPS, etc.
ConstructionExternal · Internal wall
External · Internal window
Floor, Roof, Door etc.
Cooling and Heating SystemsDuctless air-conditioningSet point: 26 °COpenStudio2.5.1
IDF Editor
Low temperature radiant systemSet point: 20 °C
ApplicationsLighting25 W * 4 eaIDF Editor
Refrigerator40.6 W * 1 ea
TV130.6 W * 1 ea
Computer255.9 W * 1 ea
Washing machine242.8 W * 1 ea
Gas range2100 W * 1 ea
Hot water3 ea
Occupant ScheduleActivity level5193 schedules based on EUP data (time step: 10 min)Excel 2013
IDF Editor
Applications Operation
Table 4. Six SVM models put through the Classification Learner App of MATLAB R2018b.
SVM TypeModel No.Kernel FunctionKernel Scale ModeMulticlass Method
Linear SVM1.1Linear kernelAuto *One-vs-One **
Quadratic SVM1.2Quadratic kernelAuto *
Cubic SVM1.3Cubic kernelAuto *
Fine Gaussian SVM1.4Gaussian kernel3.1
Medium Gaussian SVM1.5Gaussian kernel12
Coarse Gaussian SVM1.6Gaussian kernel49
* When you set the Kernel scale mode to Auto, the software uses a heuristic procedure to select the scale value; ** only for data with three or more classes. This method reduces the multiclass classification problem to a set of binary classification subproblems, with one SVM learner for each subproblem. One-vs-One trains one learner for each pair of classes.
Table 5. Dataset format for building a predictive model for EUP types through SVM.
Household No.Occupant FeaturesEUP DataType
AgeGenderIncomeWorkingCare NeedsTime1···Time144
x 1 x 2 x 3 x 4 x 5 x 6 ··· x 149 y
142woman3yesnoS1···A16
267woman1nonoG1···L17
370man1noyesA1···S12
······························
519234man2yesnoA1···S13
519325man1yesnoC1···A14
Table 6. Percentages of five household characteristics by EUP type.
TypeAgeGenderIncome
(Unit: 10,000 w)
WorkingCare Needs
Type 1
(60 persons)
~30
31~50
51~64
65~
7 (11.7)
10 (16.7)
12 (20.7)
31 (51.7)
M

W
28 (46.7)

32 (53.3)
~100
100~200
200~300
300~400
400~500
500~
31 (51.7)
14 (23.3)
9 (15.0)
3 (5.0)
3 (5.0)
0 (0.0)
Y

N
36 (60.0)

24 (40.0)
2 (1.07)
Type 2
(1422 persons)
~30
31~50
51~64
65~
71 (5.0)
143 (10.1)
270 (19.0)
938 (66.0)
M

W
444 (31.2)

978 (68.8)
~100
100~200
200~300
300~400
400~500
500~
1078 (75.8)
219 (15.4)
60 (4.2)
32 (2.3)
13 (0.9)
20 (1.4)
Y

N
283 (19.9)

1139 (80.1)
123 (65.78)
Type 3
(161 persons)
~30
31~50
51~64
65~
43 (26.7)
66 (41.0)
37 (23.0)
15 (9.3)
M

W
94 (58.4)

67 (41.6)
~100
100~200
200~300
300~400
400~500
500~
42 (26.1)
53 (32.9)
50 (31.1)
8 (5.0)
5 (3.1)
3 (1.9)
Y

N
131 (81.4)

30 (18.6)
4 (2.14)
Type 4
(176 persons)
~30
31~50
51~64
65~
79 (44.9)
62 (35.2)
14 (8.0)
21 (11.9)
M

W
87 (49.4)

89 (50.6)
~100
100~200
200~300
300~400
400~500
500~
85(48.3)
47 (26.7)
33 (18.8)
7 (4.0)
2 (1.1)
2 (1.1)
Y

N
101 (57.4)

75 (42.6)
2 (1.07)
Type 5
(33 persons)
~30
31~50
51~64
65~
15 (45.5)
12 (36.4)
2 (6.1)
4 (12.1)
M

W
14 (42.4)

19 (57.6)
~100
100~200
200~300
300~400
400~500
500~
7 (21.2)
6 (18.2)
12 (36.4)
2 (6.1)
2 (6.1)
4 (12.1)
Y

N
31 (93.9)

2 (6.1)
2 (1.07)
Type 6
(1267 persons)
~30
31~50
51~64
65~
384 (30.3)
500 (39.5)
269 (21.2)
114 (9.0)
M

W
673 (53.1)

594 (46.9)
~100
100~200
200~300
300~400
400~500
500~
325 (25.7)
425 (33.5)
309 (24.4)
104 (8.2)
50 (3.9)
54 (4.3)
Y

N
1004 (79.2)

263 (20.8)
7 (3.74)
Type 7
(2074 persons)
~30
31~50
51~64
65~
206 (9.9)
384 (18.5)
543 (26.2)
941 (45.4)
M

W
731 (35.2)

1343 (64.8)
~100
100~200
200~300
300~400
400~500
500~
1180 (56.9)
476 (23.0)
237 (11.4)
71 (3.4)
47 (2.3)
63 (3.0)
Y

N
1012 (48.8)

1062 (51.2)
47 (25.13)
Table 7. Energy consumption ranking by type.
Type 1Type 2Type 3Type 4Type 5Type 6Type 7
Lighting2163574
Equipment2174563
Cooling2163475
Heating2174563
Total2174563
Table 8. Comparison of the prediction rates of six SVM models.
SVM TypeModel No.Prediction Speed
(No. of Observations Per s)
Training Time
(s)
Accuracy
(%)
Linear SVM1.1~19007.645794.0%
Quadratic SVM1.2~13008.130795.0%
Cubic SVM1.3~14008.494694.5%
Fine Gaussian SVM1.4~17057.53351.6%
Medium Gaussian SVM1.5~13009.38393.8%
Coarse Gaussian SVM1.6~100012.07891.0%

