1. Introduction
In the last decades, agronomic management developed from scientific research has focused on increasing crop productivity through intensive use of fertilizers and chemicals [
1]. In order to provide sufficient food for humans in a context of fast population growth and new concepts of sustainability, agriculture is now called upon to reduce the use of non-renewable resources and address the negative impact of conventional agricultural practices on climate and of environmental pollution, particularly in cereal cultivation [
2,
3].
Wheat is one of the world’s most widely-grown crops, providing staple food for one third of the human population. It is cultivated under different climatic conditions and agricultural systems, and consequently with variable yield responses [
4]. The current average global grain yield is 3.3 t ha
−1, a value that should be almost doubled to meet future food demands [
5]. In many countries, this target has already been reached, and even exceeded, as a result of the intensive use of agro-chemicals, as wheat yield responds well to input level. Large applications of chemical fertilizers, particularly nitrogen, are required to maintain high wheat yields, although this can have negative consequences for the environment and human health [
6].
In order to address these critical issues and deal more effectively with environmental stresses, research is now focusing on exploring plant root-microbial associations [
7]. Plant-aiding microorganisms are currently becoming available as commercial biofertilizers, and are claimed to have beneficial effects on cereal growth and productivity as a result of interaction with several rhizosphere processes [
8,
9]. Plant growth-promoting rhizobacteria (PGPR) are known to stimulate plant growth by fixing N, producing auxins and other phytohormones that enhance root growth, and by synthesizing siderophores, that enhance low-available nutrient uptake from the soil, and other substances that help plants withstand adverse conditions [
10,
11].
Vesicular-arbuscular mycorrhizal (VAM) fungi are non-pathogenic microorganisms that establish symbioses with many spontaneous and cultivated species, and have the ability to boost water and nutrient uptake, especially in poor, arid soils, and to protect the plant against root pathogens [
12]. Application of PGPR and mycorrhizal fungi consortia has also been shown to improve plant growth as a result of synergistic interactions between microorganisms [
13,
14,
15,
16,
17].
The literature documents a positive influence on the shoot growth, nutrient uptake, and grain yield of wheat after inoculation with arbuscular mycorrhizal fungi [
18,
19], PGPR [
20], but also VAM-PGPR consortia [
15]. However, very few studies, mostly in laboratory and only seldom in field conditions, have investigated the effects of microbial inoculation on root growth, and they have not taken into account the type of agricultural management applied and the constrains imposed by abiotic and biotic factors [
21,
22,
23,
24].
A vigorous root system is fundamental for the development of healthy crops, and, consequently, for obtaining high yields [
25]. Root colonization by VAM and bacteria can increase root length and surface area, allowing a large soil volume to be explored, and thereby enhancing water and nutrient uptake, particularly under drought conditions [
26,
27].
In this context, the aim of the present study was to investigate the response of common wheat (Triticum aestivum L.) to inoculation with a commercial biofertilizer containing the VAM Rhizophagus irregularis and the diazotrophic bacterium Azotobacter vinelandii. Novel aspects of this research were the study of the combined effects of both aiding fungi and bacteria, and their effects on root patterns in open field conditions under various nitrogen fertilization doses. It was preliminarily ascertained the viability of microorganisms, the effectiveness of mycorrhizal colonization and their effects on wheat roots in controlled conditions (rhizoboxes) by application as a seed inoculum or by foliar spraying young seedlings. Then, the effects of the inoculum were tested in open fields over a two-year trial after foliar-spraying at the end of tillering in combination with different N fertilization doses. Root growth patterns down to a depth of 1 m, nutrients uptake, and yield performances were assessed and related through Principal Component Analysis.
2. Materials and Methods
2.1. Preliminarily Root Observations in Rhizoboxes
A rhizobox trial was set up in order to study the effects on the early root growth of wheat after inoculation with the commercial biofertilizer Rhizosum N® (Biosum Technology, Madrid, Spain), which contains the VAM Rhizophagus irregularis (2% w/w) and the diazotrophic bacterium Azotobacter vinelandii (1 × 10¹⁰ CFU g−1). Transparent, plexiglass-sided rhizoboxes, measuring 30 × 2.5 cm and 45 cm high, were randomly positioned inside a greenhouse at the University of Padua’s experimental farm, with day-night growing conditions of 25–3 °C temperature and 22–78% relative air humidity. The rhizoboxes were filled with a mixture of sand and silty-loam soil (1:1 w/w), previously sterilized at 105 °C for 72 h in an oven to avoid any interference of soil microbioma with the inoculum, and angled at 45° to allow root observation through the transparent underside during growth. About 30 kg of N ha−1 and 90 kg ha−1 of P2O5 and K2O were incorporated into the soil before rhizobox filling to mimic basic pre-sowing field fertilization. Three seeds of wheat var. Bologna (SIS, Bologna, Italy) were sown at a depth of 3 cm in each rhizobox, and plants were grown for 50 days from February to March 2014.
Inoculum was applied by two ways, as seed-coating treatment and by foliar spraying at 23 DAS (days after sowing), and results were compared with not inoculated controls. In the former case, just before sowing, 0.1 g of freeze-dried formulation was diluted in a small volume (2 mL) of ultrapure water in order to optimize the adherence to 1000 seeds (i.e., ~38 g); the final inocula contained 0.19 µg of
R. irregularis and 10
6 CFU of
A. vinelandii per seed, consistent with the recommended application rate of 50 g ha
−1 of commercial formulation. All seeds had been previously sterilized in 15%
v/
v sodium hypochlorite solution for 15 min, then rinsed for 5 min in ultrapure water three times. In the second case, the same amount of biofertilizer per plant was applied post-emergence by spraying 10 mL inoculum solution (0.01 g Rhizosum N in 1 L of water) on the leaves and the ground surface at 23 DAS and 2-leaf stage (Z12) [
28]. Three rhizoboxes (replicates) per treatment were examined (nine in total), with three plants each.
At the end of the experiment (50 DAS), determined as when the roots had more or less reached the bottom of the rhizobox at the 4-leaf stage (Z14), the plants were harvested and the root system was gently washed so it could be collected in its entirety. Roots were stored in ethanol solution (15% v/v) at 4 °C until processing. The main parameters (i.e., length, surface area, diameter, and number of tips and forks) were measured from 1-bit 400-DPI TIFF-format images of the roots acquired with a flatbed scanner (Expression 11000 XL, Epson, Suwa, Japan). Image analysis was carried out with the WinRhizo® software (Regent Instruments Inc., Ville de Québec, QC, Canada).
2.2. Preliminarily Mycorrhizae Detection in Pots
In order to assess the viability of the commercial inoculum and the extent of possible root mycorrhization in wheat, simultaneously as the rhizobox experiment, it was carried out a similar trial with seed-inoculated plants grown in 3.1-L pots (9 cm diameter, 50 cm height) following the same inoculation procedure as for the rhizoboxes (i.e., substrate and seed sterilization, dose of inoculum, number of replicates). Roots of 40-day-old wheat plants of inoculated and non-inoculated control from the pots were collected and washed briefly in sterile water before optical microscope and ESEM (Environmental Scanning Electron Microscopy) imaging.
For the microscopic analysis, 5-mm long root fragments were excised and colored following the procedure of [
29]. Then, root samples were mounted on a microscope slide, gently pressed with a cover slide, and examined with a microscope (Nikon eclipse E600) mounted with a DS-FIZ camera to detect mycorrhization. Forty-five root pieces, coming from the three pots (15 each), were visually analyzed and each of them assigned to a specific class of mycorrhization as follows: absence of colonization (class 0); traces of colonization (class 1); less than 10% colonization (as root length) (class 2); from 11 to 50% of colonization (class 3); from 51 to 90% of colonization (class 4); more than 90% of colonization (class 5). An index of mycorrhizal colonization (M) was calculated as follows:
where n1, n2, n3, n4, and n5 are the number of root pieces belonging to classes 1, 2, 3, 4, and 5, respectively, and N is the total number of root pieces examined.
ESEM analyses was used as a further tool to ascertain root mycorrhization. One-mm long root fragments were excised with a sterile lancet and fixed overnight in 3% v/v glutaraldehyde solution in 0.1 M phosphate buffer at pH 7.0 and 4 °C. The samples were then extensively rinsed in 0.1 M phosphate buffer pH 7.0, and dehydrated in acetone solution (25%, 50%, 75% and 100% v/v in deionised H2O). Lastly, the samples were dried with a Critical Point Dryer (CPD 020, Balzers Union Limited, Balzers, Liechtenstein) in a CO2 atmosphere, and attached to aluminum stubs with double-sided adhesive conductive carbon tape. Root mycorrhization was observed with an ESEM Quanta™ 250 FEG (FEI, Hillsboro, OR, USA), operating in low vacuum mode (pressure chamber set at 100 Pa), and with a beam accelerating voltage of 3 or 5 kV.
2.3. Two-Year Field Trial
A field trial was conducted during the 2013–2014 and 2014–2015 growing seasons at the University of Padua’s experimental farm at Legnaro (45°21′ N, 11°58′ E, 12 m a.s.l) on the Po plain (NE Italy). Wheat was cultivated in a fulvi-calcaric-cambisol (USDA classification), which was characterized at the beginning of the experiment (
Table 1).
Annual precipitation at this site is ~830 mm (30-year historical mean). The climatic data were provided by a station placed within the experimental farm and managed by the regional weather service center ARPAV (Teolo, Padua, Italy). It was used a completely randomized block experimental design with three replicates; each plot measured 10 × 3 m (30 m2) and comprised 24 crop rows 12 cm apart. In both years, the previous crop had been sugar beet. The soil was ploughed to a depth of 0.3 m and harrowed at 0.15 m, and prior to sowing the fertilizers N, P2O5, and K2O were incorporated (as ternary fertilizer) in doses of 32, 96 and 96 kg ha−1, respectively.
The trial included the wheat varieties cultivated in the experimental farm on large scale; i.e., the high-yielding Africa (APSOV, Voghera, Italy) in the first year, and the high-quality Bologna (SIS, Bologna, Italy) in the second, which are two of the main varieties cultivated in the region for the bakery industry. First year sowing took place on 29 October 2013, harvesting on 12 June 2014; second year sowing was on 12 November 2014, with harvesting occurring 22 June 2015. Crops were protected against weeds chemically (a.i., Thifensulfuron-methyl and Tribenuron-methyl) about at the end of March, one month later from microbial application. To offset possible interactions between fungicides and mycorrhizal fungi, plants were protected from fungal pathogens at the heading stage using active ingredients (i.e., Cyproconazole, Azoxystrobin and Prochloraz) recognized as non-harmful to mycorrhizal fungi’s survival [
30].
Inoculated plots and non-inoculated controls were factorially combined with three decreasing rates of N fertilization, using ammonium nitrate (34% N), as specified in
Table 2.
The microbial inoculum (Rhizosum N) was applied at a label dose of 50 g of freeze-dried product ha−1, following the manufacturer’s instructions, at tillering (7 March 2014 in the first year, 19 February 2015 in the second), before stem elongation in order to adequately reach the soil. The commercial formulation was rehydrated for one hour in 200 mL pure water, mixed with 600 L ha−1 of non-chlorinated water, and sprayed mechanically onto the wheat using farm-scale technologies. The treatment was performed during the late afternoon in order to minimize the interaction of UV light with bacterial survival. The application volume ensured good soil and canopy wetness, with expected inoculation rates of about 0.1 mg VAM m−2, and 5 × 10⁷ CFU A. vinelandii m−2.
During the growing cycle, from the beginning of stem elongation to the booting stage, the relative chlorophyll content in leaves was monitored with a SPAD 502 chlorophyll meter (Konica-Minolta, Hong Kong) on the last fully-developed leaf (10 leaves per plot randomly chosen) at 10-day intervals. Culm height was also measured on the same plants.
At the same time as the SPAD measurements were taken, the Normalized Difference Vegetation Index (NDVI) of the canopy of each plot was measured with an active handheld Greenseeker spectrometer (Ntech Industries, Ukiah, CA, USA). The sensor measures canopy reflectance at wavelengths of 590 nm (ref
RED) and 880 nm (ref
NIR), and provides a ratio value as follows:
At maturity, yield was measured in the central area of each plot (about 22 m
2) by collecting the grains with a mini combine harvester. The harvest index was measured in a checking area of 1 m
2 of each plot; these sample materials were also used to measure N concentration according to the Kjeldahl method, while Ca, K, P, Fe, Mg, and Zn concentrations were measured by Inductively Coupled Plasma Optical Emission Spectroscopy (ICP-OES) (SPECTRO CirOS Vision EOP, SPECTRO Analytical Instruments GmbH & Co. KG, Kleve, Germany). Oven-dried samples of grains and straw of about 0.4 g were mixed with 7 mL HNO
3 (65%
v/
v) and 1 mL H
2O
2 (30%
v/
v), then microwave acid-digested (Mileston ETHOS 900, Bergamo, Italy) following EPA method 3052 [
31]. The samples were then diluted to 25 mL with distilled water, filtered (0.45-μm CA), and analyzed by ICP-OES. Measurement accuracy was assured with certified reference materials (ERM-CD281 and BRC-402, JRC-IRMM, Geel, Belgium).
At full flowering (16 May 2014 in year 1, 5 May 2015 in year 2), the root system was investigated down to a depth of 1 m using the coring method, and with three replicates per treatment (one core per plot). 70-mm diameter soil cores were collected in a central row at least 1 m from the plot border. Each core was split into 0.1-m sub-samples, which were frozen at −18 °C until washing. Roots were cleaned of soil particles using a hydraulic sieving-centrifugation device on a 500-μm mesh sieve, and stored in a 15%
v/
v ethanol solution at 4 °C until digitalization. Root images were processed in the KS 300 Rel. 3.0 software (Karl Zeiss, Munich, Germany), with a minimum area of 40 pixels for thresholding background noise. Root length was determined by the FbL (fiberlength) algorithm, and the mean root diameter was calculated as the area-to-length ratio of root objects in a sample [
32]. Root length density (RLD) and root surface density (RSD) were expressed as cm of roots per cm
3 of soil and cm
2 of roots per cm
3 of soil, respectively.
At the same time as the root examination, 100 1-cm long root tips per treatment were observed through a stereomicroscope (×10–50 magnification) to assess the extent of root mycorrhizal colonization. Roots were collected from 0–0.3 m depth soil monoliths after gently washing in the first year only, due to the laboriousness and time-consuming procedure. Fungal structures like arbuscules and vesicles in the root tips were blue-colored after staining with ink [
29].
2.4. Statistical Analysis
The data from all examined parameters were subjected to an ANOVA performed in the Statgraphics Centurion XI software (Adalta, Arezzo, Italy). Separation of means was set at p ≤ 0.05 with the Newman–Keuls test.
In addition to ANOVA, to facilitate interpretation of the large dataset from the two-year field trial, factorial discriminant analysis (MDA, Multigroup Discriminant Analysis with Wilks’ lambda and Pillai’s trace tests), and principal component analysis (PCA) were also carried out to describe above- and below-ground plant behavior in response to the microbiological inoculum and N fertilization. Multivariate data normality was first verified by the Shapiro test. Before analysis, data were standardized by subtracting the mean and dividing the result by the standard deviation within each variable. All analyses were performed in MS Excel XLSTAT (Addinsoft, Paris, France).
3. Results
3.1. Climatic Conditions in Field Trials
The climatic conditions differed greatly between the two growing seasons (2013–2014 and 2014–2015). Seasonal rainfall was higher in the first than in the second year (October–June: 890 vs. 610 mm), as were winter/spring temperatures (
Figure S1).
Climatic conditions at the time of biofertilizer application also differed over the two years. In the first year, inoculum was applied at the beginning of stem elongation, a slightly more advanced growth stage compared with the second year (end of tillering), because of the extremely rainy winter, which had delayed mechanical spraying.
In the 10 days before inoculation, 58 mm of precipitation was recorded in the first year, but none in the second, whereas after treatment there was no precipitation for two weeks in the first year (18 mm after 16 days) compared with 22 mm after 2 days in the second.
Temperatures at the time of microbial treatment also differed in the two years: maximum and minimum daily temperatures on the inoculation day were 17.3 °C and 4.4 °C in the first year, 11.2 °C and −2.6 °C in the second. In the first year, the average temperature over the 3 days following inoculation was 10.6 °C, much higher than the 4.3 °C recorded in the second year.
3.2. Effects of Inoculum on Root Growth
In controlled conditions (rhizoboxes), plants developed from inoculated seeds showed a more complex root system than untreated controls, as revealed by the higher (
p ≤ 0.05) root tip and fork densities (about +30%). Due to slight increases in root length (+3%) and diameter (+11%), treated plants also exhibited a positive trend in root surface area (+20% vs. controls), although this was not statistically significant (
Table 3). At the end of the experiment, maximum root depth was similar to untreated controls (
p > 0.05).
Plants inoculated by foliar + soil spraying had significantly lower maximum root depth, branching and tip density compared with untreated controls (both –28%,
p ≤ 0.05), but similar root length and surface area (
Table 1).
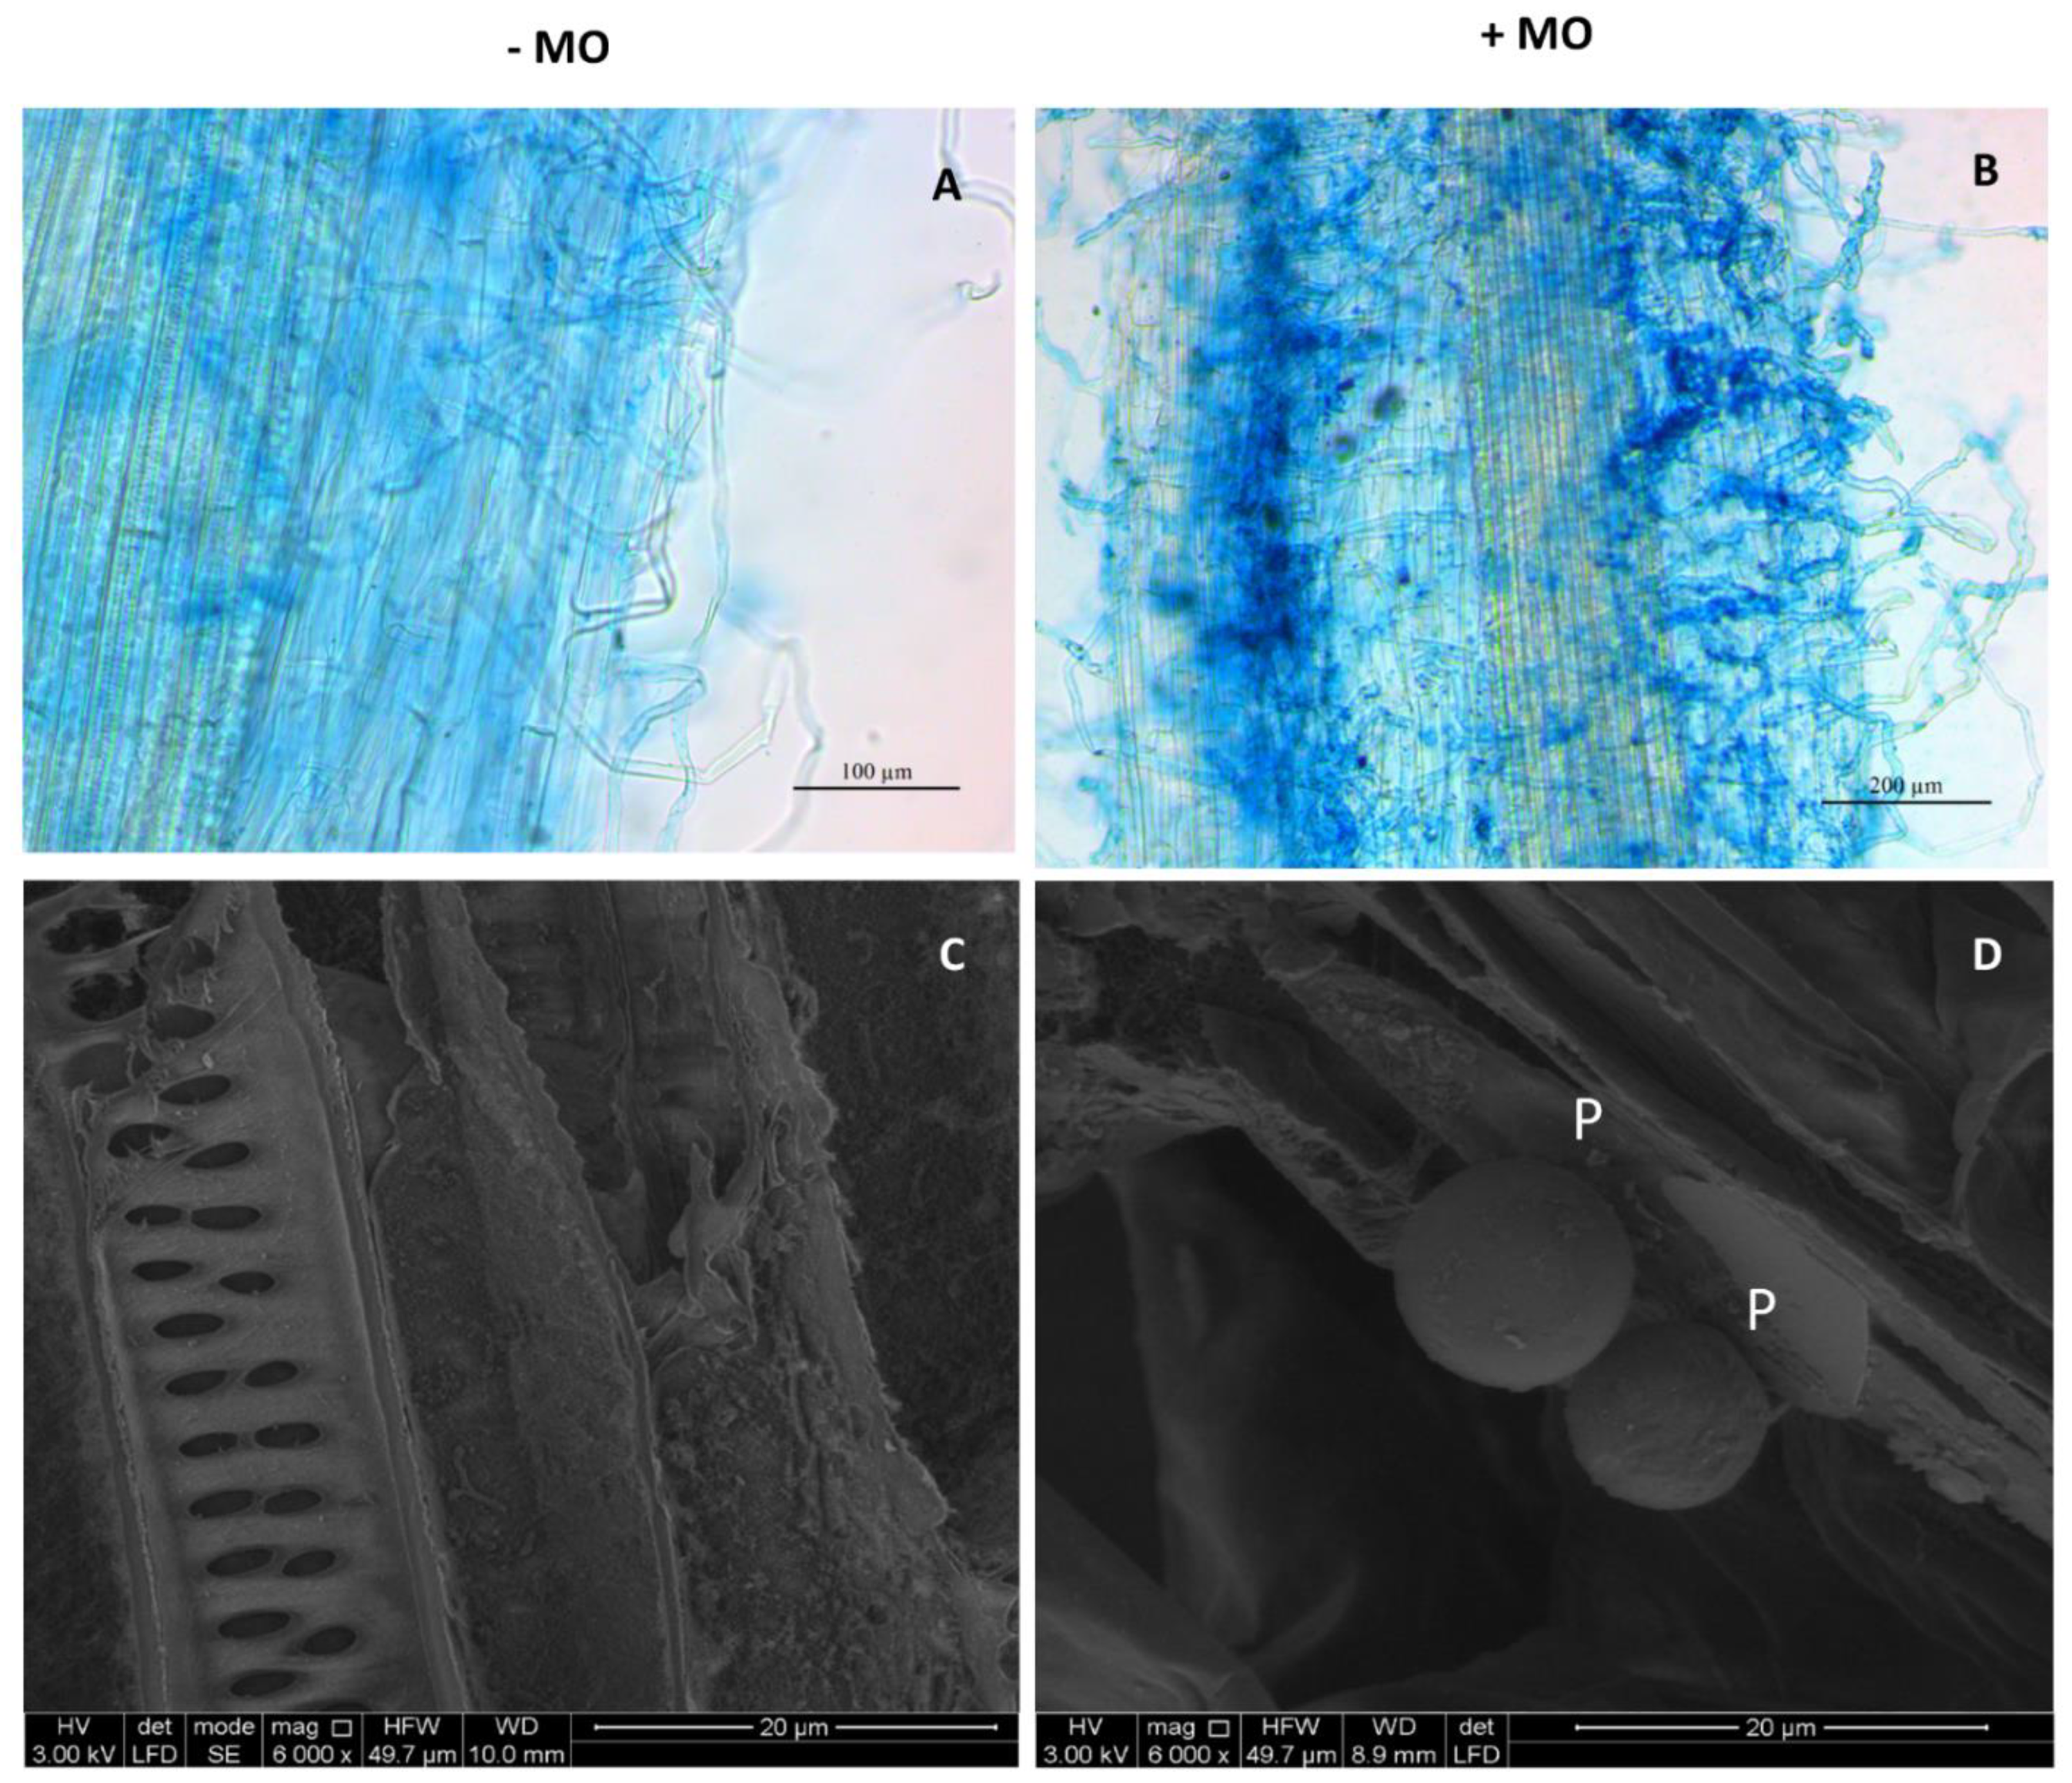
In sterilized pot soil, microscopic observations revealed an abundance of fungal structures in excided root fragments of 40-day old seedlings grown from inoculated seeds, while no coloration was found in root tissues of non-inoculated controls, as expected (
Figure 1A,B). The mycorrhization index calculated on 45 root pieces was 47%, revealing a sufficient viability of the commercial inoculum and effectiveness in root colonization. These findings were confirmed by ESEM imaging of micro-dissected mycorrhized roots previously disinfected and processed under sterile conditions, which showed the presence of intraradical VAM propagules (
Figure 1D), whereas none were detected in non-inoculated control plants in the sterilized soil (
Figure 1C).
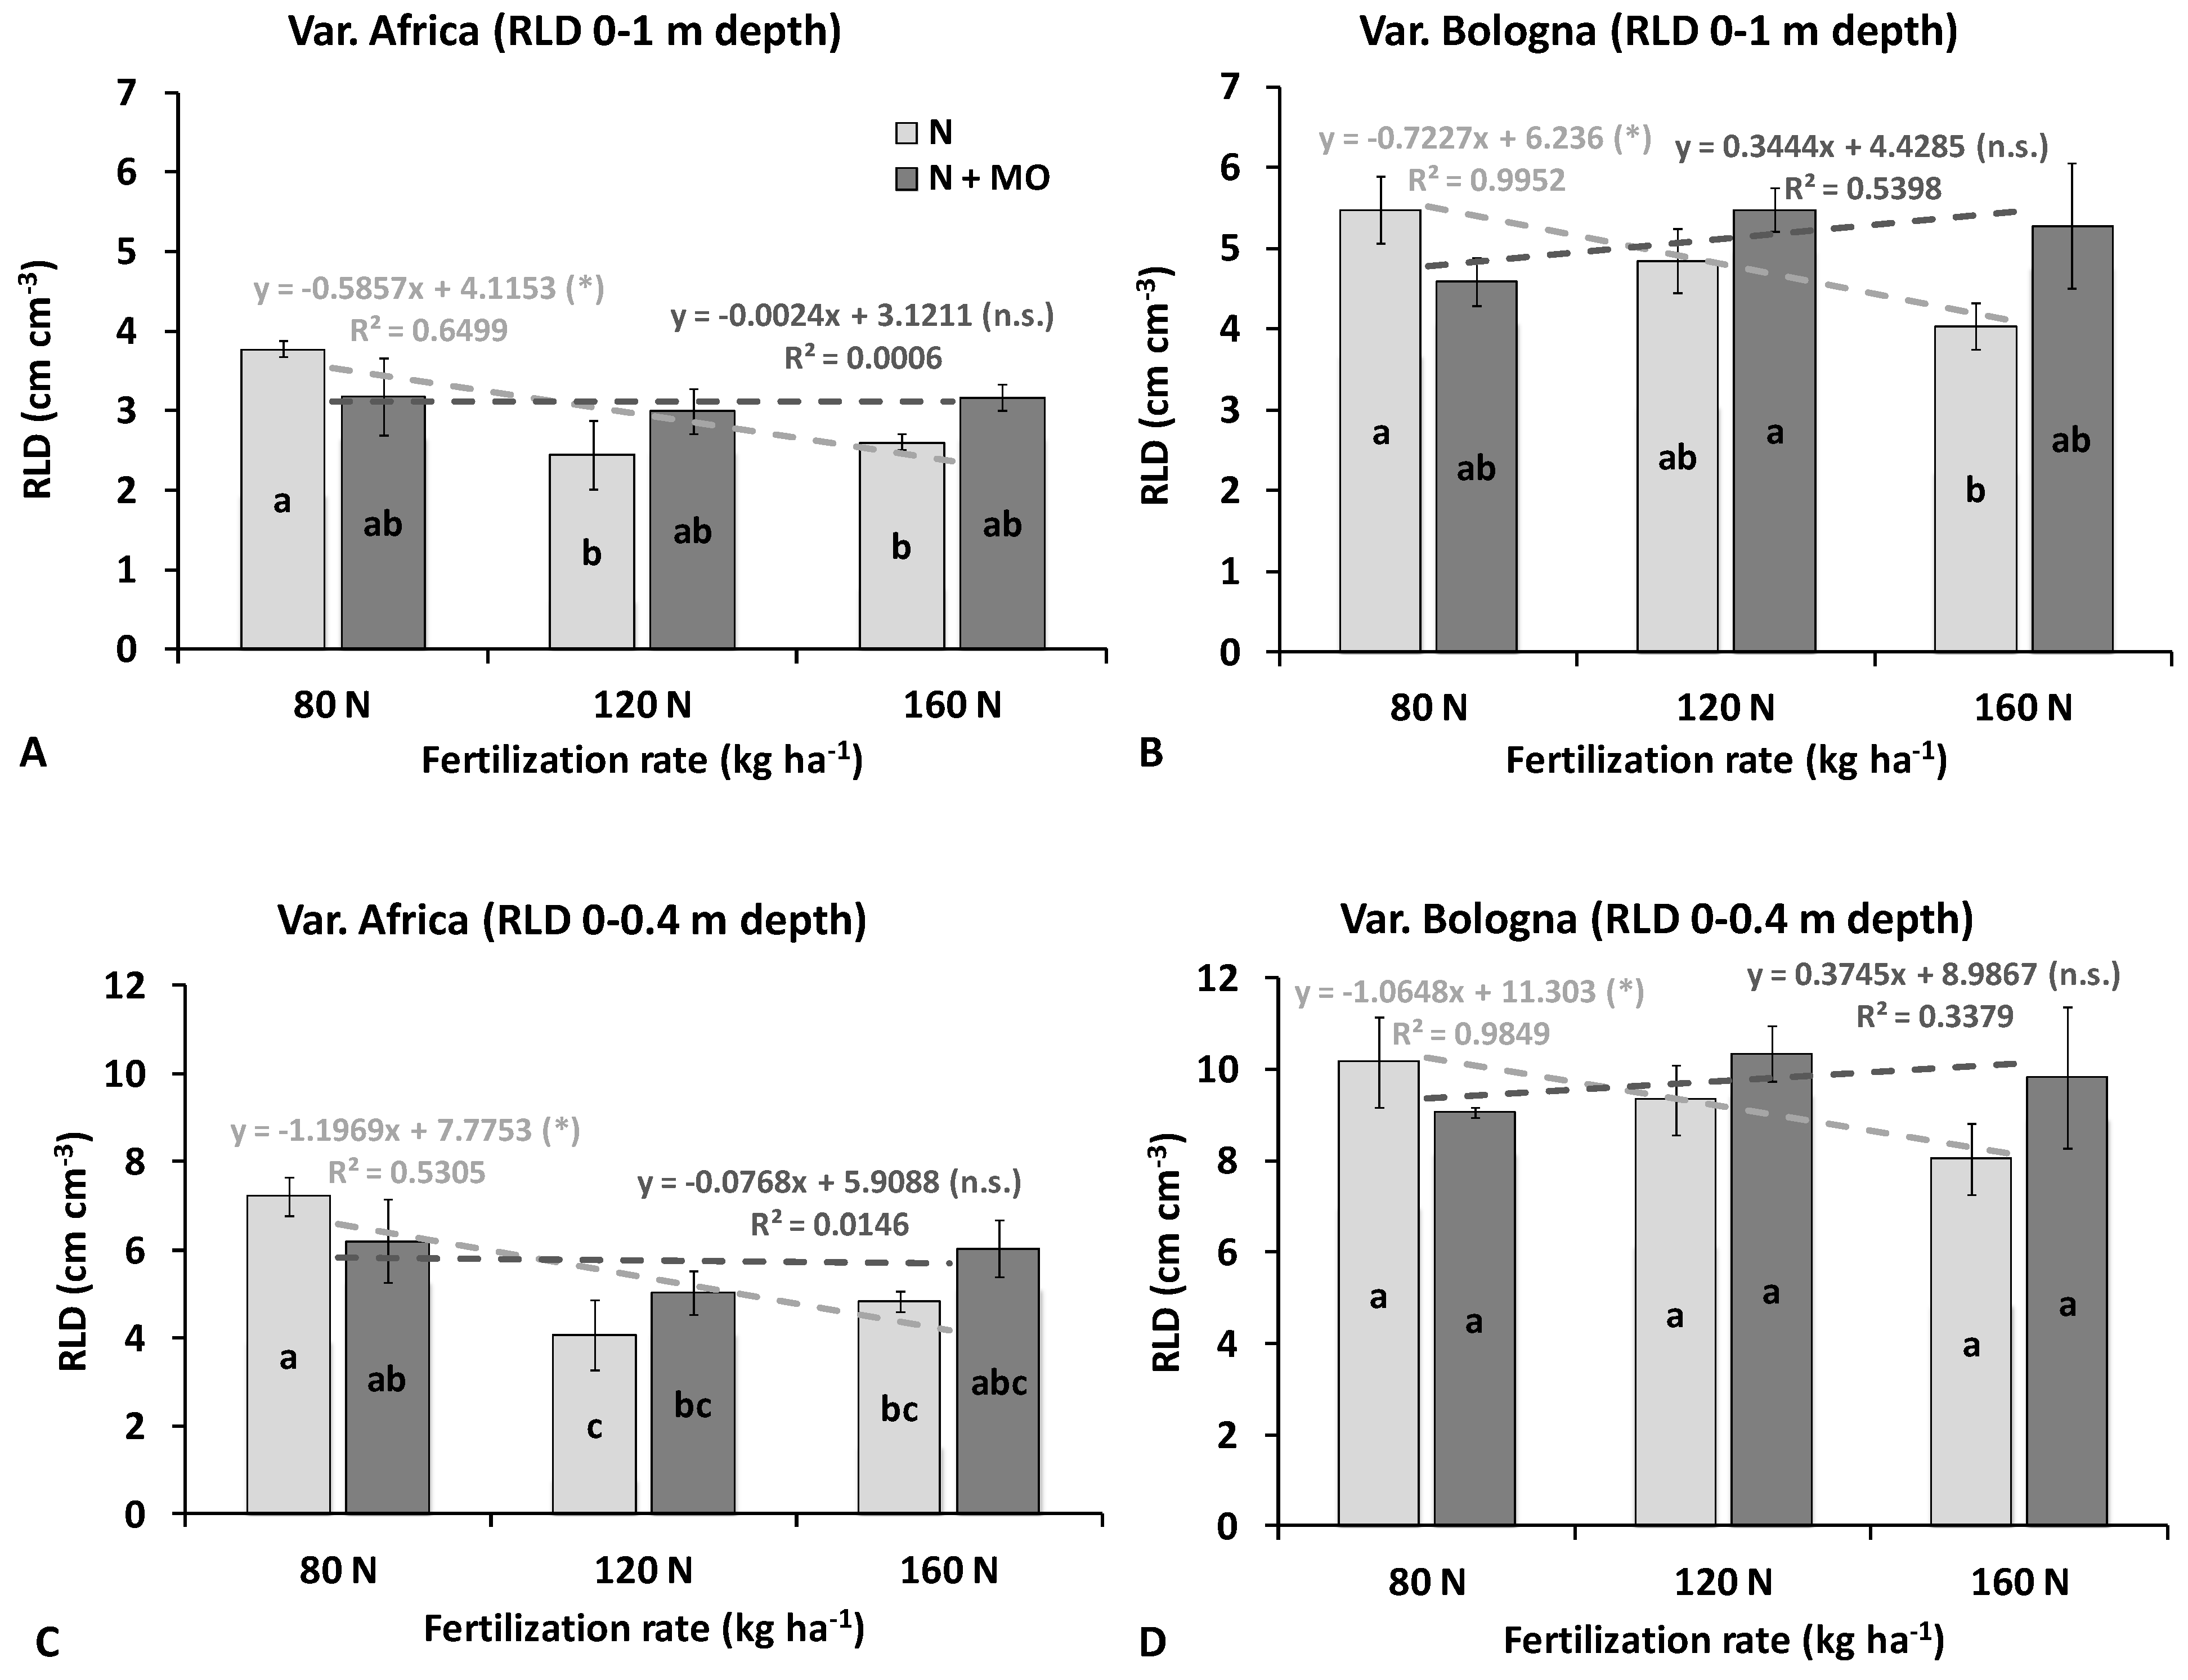
In the more complex field situation, analysis referred to the root system collected at the flowering stage from the 0–1 m depth profile. Root length density (RLD) of var. Bologna (second-year trial) was higher than that of var. Africa (first year), but the effects of nitrogen fertilization and inoculation were stable across years. Without inoculation, plants fertilized with the lowest nitrogen dose (80 kg ha
−1) had the greatest RLD values in the entire 0–1 m soil profile (averages of 3.78 and 5.48 cm cm
−3, in 1st and 2nd years, respectively), and in the top 0–0.4 m soil layer (7.23 and 10.16 cm cm
−3, respectively) (
Figure 2,
Table S1). The average RLD was negatively correlated with N fertilization dose, particularly in the second year (whole profile: R
2 = 0.64 1st year, 0.99 2nd year): the higher the N dose the lower the root length density (
Figure 2). In the 1st year, the RLD of var. Africa was 35% lower at 120 kg N ha
−1 and 31% lower at 160 kg N ha
−1 than the lowest N dose (80 kg ha
−1) in the whole soil profile, and the reductions were even greater in the arable layer (−44% and −33%, respectively). In the 2nd year, there were smaller reductions in the RLD of var. Bologna: on average −12% and −26% in the 0–1 m profile, and −8% and −21% in the top 0.4 m depth layer at 120 and 160 kg N ha
−1, respectively, compared with the 80 Kg N ha
−1 dose.
Root length reductions due to increases of N fertilization were not observed in both varieties with inoculation with the biofertilizer Rhizosum N, so that plants fertilized with 120 or 160 kg N ha
−1 attained the same or even greater RLD as those fertilized at 80 kg N ha
−1 without inoculation (
Figure 2). As a result, the root length density of inoculated plants was poorly correlated with nitrogen dose (low regression coefficients), revealing a reduction in variability across fertilization levels.
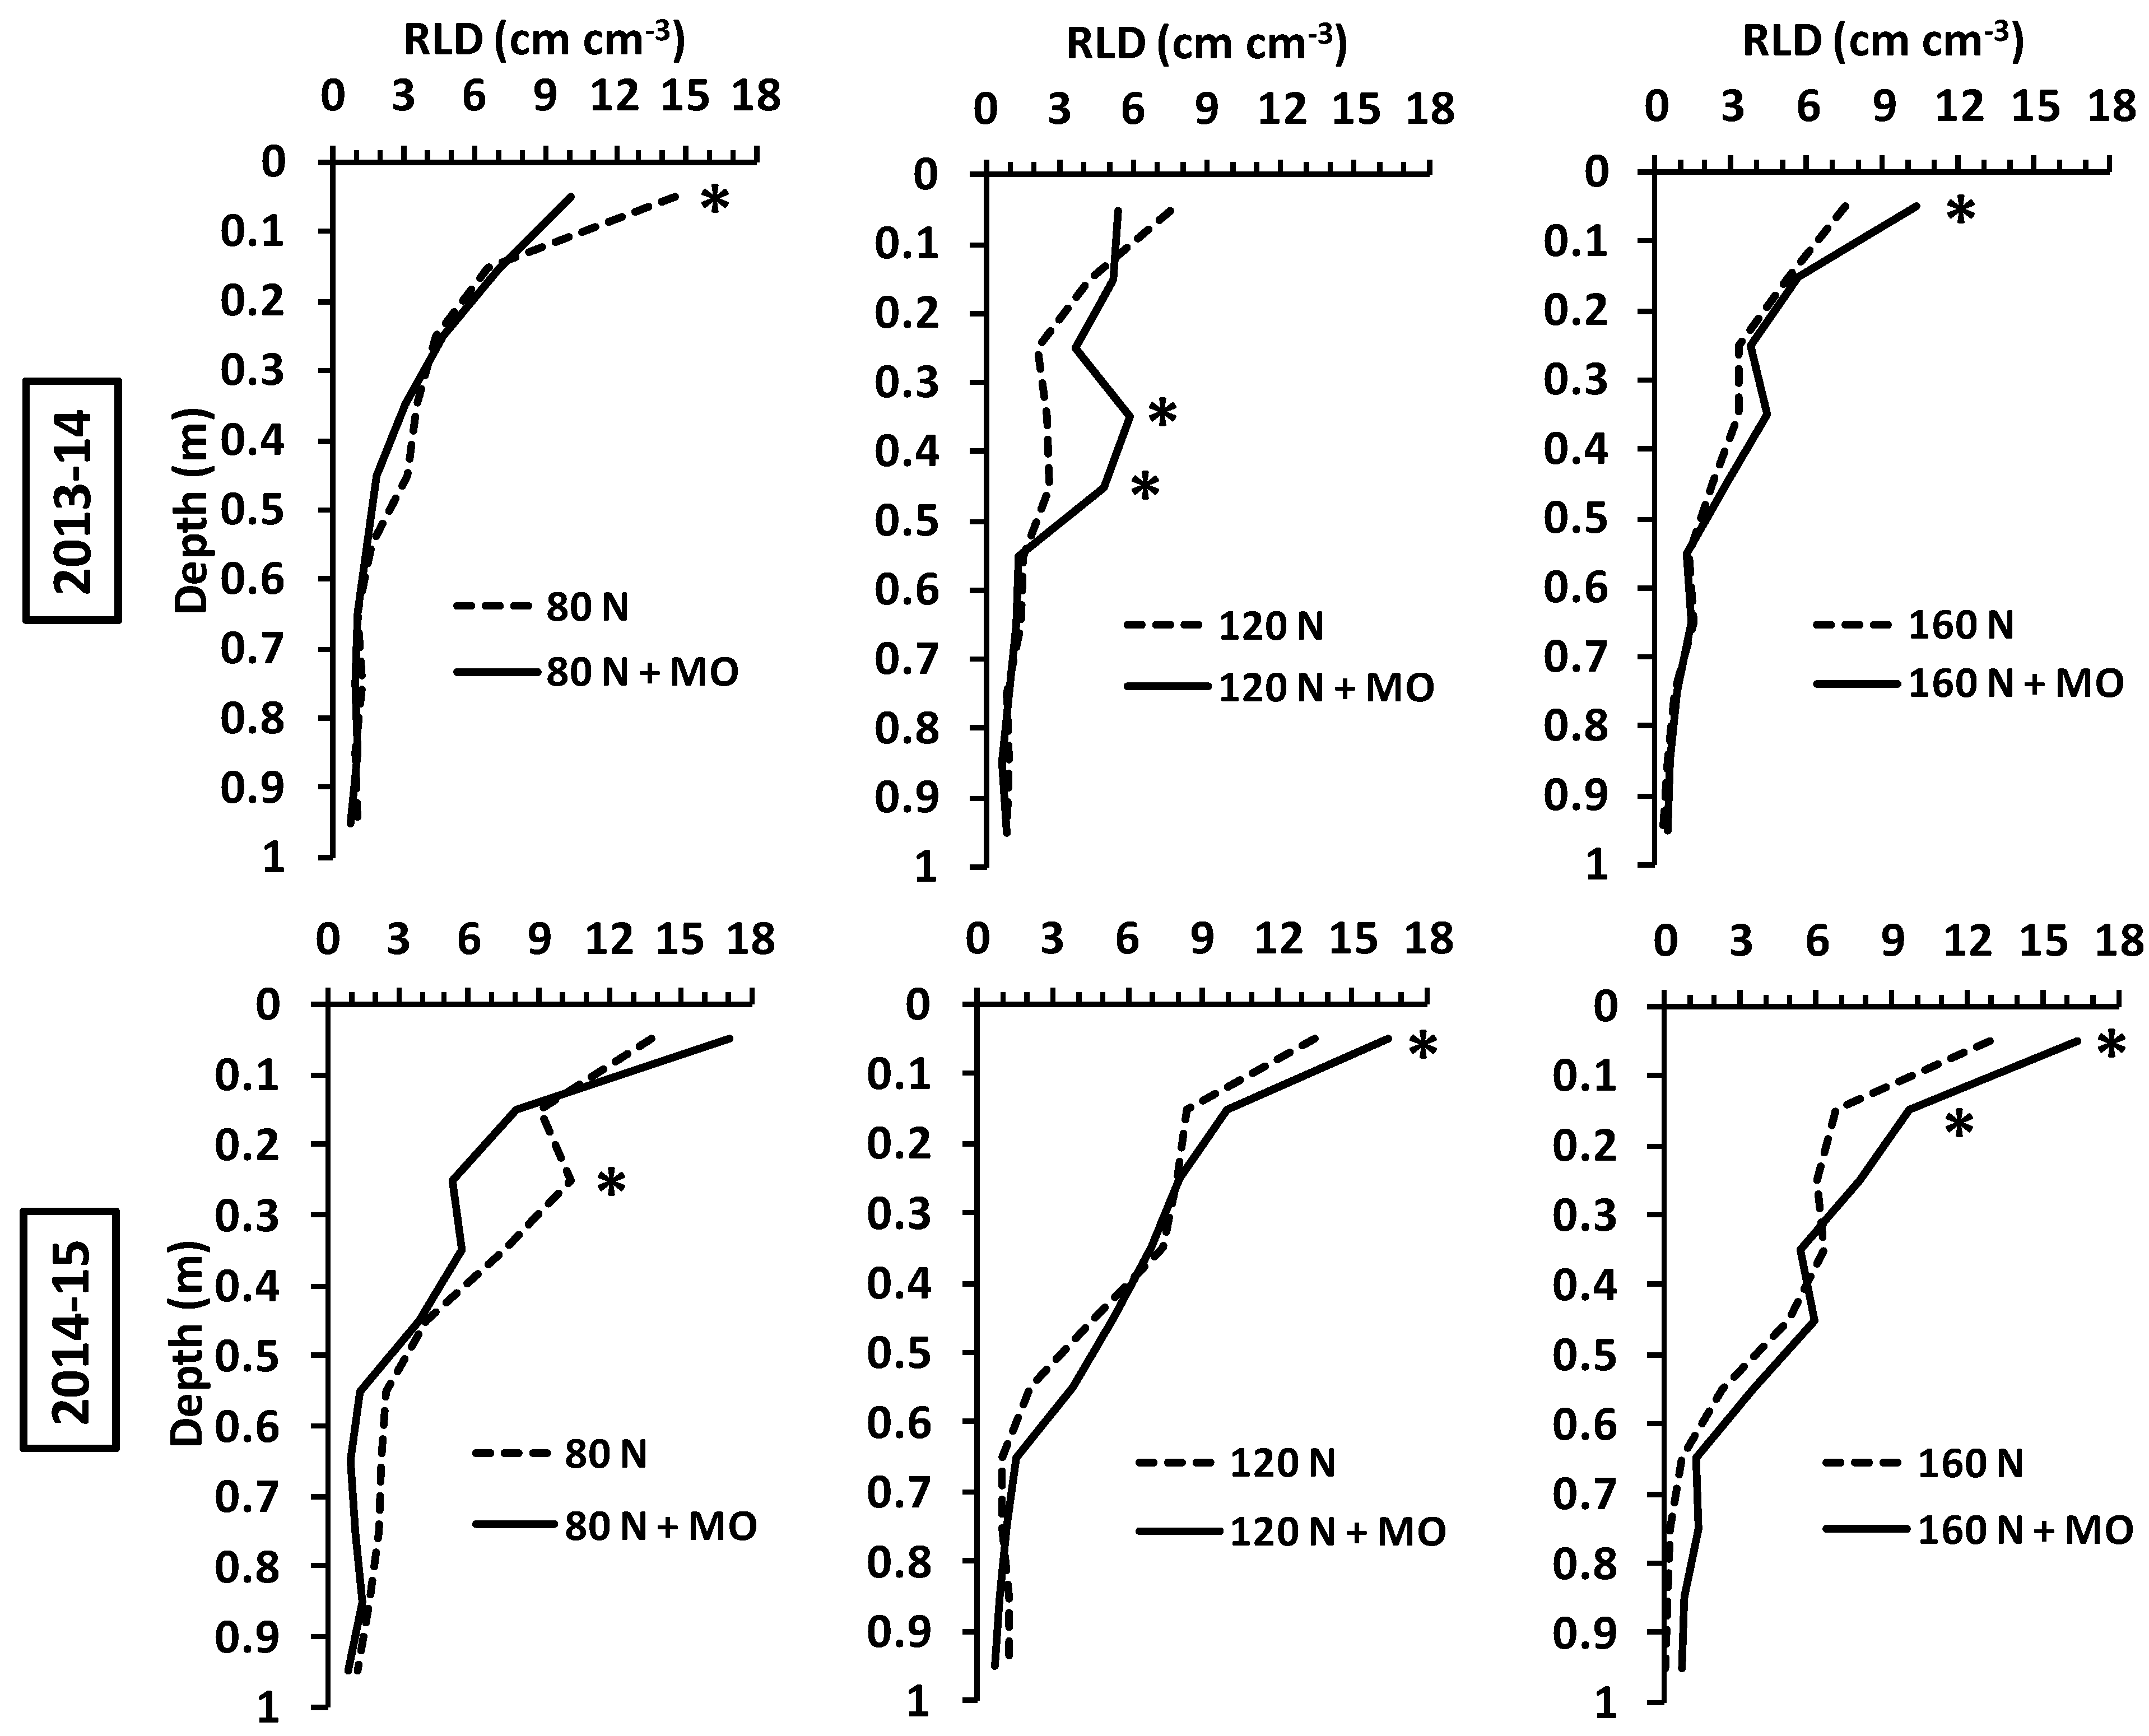
A comparison between inoculated and non-inoculated plants at the same N fertilization dose revealed that biofertilization increased root growth at medium and high N supply (120 and 160 kg ha
−1), while the opposite generally occurred at the lowest dose (80 kg N ha
−1). Although inoculated and control plants did not differ significantly in overall mean RLD at 0–1 m, application of
Rizophagus irregularis and
Azotobacter vinelandii led to evident root enhancements in specific soil layers, mainly in the arable profile (
p ≤ 0.05) (
Figure 3).
As regards the root surface density, despite a trend towards greater values in inoculated plants than in controls at 120 and 160 kg N ha
−1 fertilization doses in the top 0–0.4 m soil and in the whole profile (0–1 m average), it was not possible to detect any significant difference between inoculation and controls (
Table S1).
Contrasting responses were found in the two years with regard to root diameter: in the 1st year (var. Africa) there was a general small increase in root diameter following inoculation, but a slight decrease (p > 0.05) in the 2nd year (var. Bologna) (data not shown). The average root diameter in 1st and 2nd year trials was 260 and 310 µm, respectively.
The “N fertilization × inoculation” interaction was not statistically significant for any of the investigated root parameters.
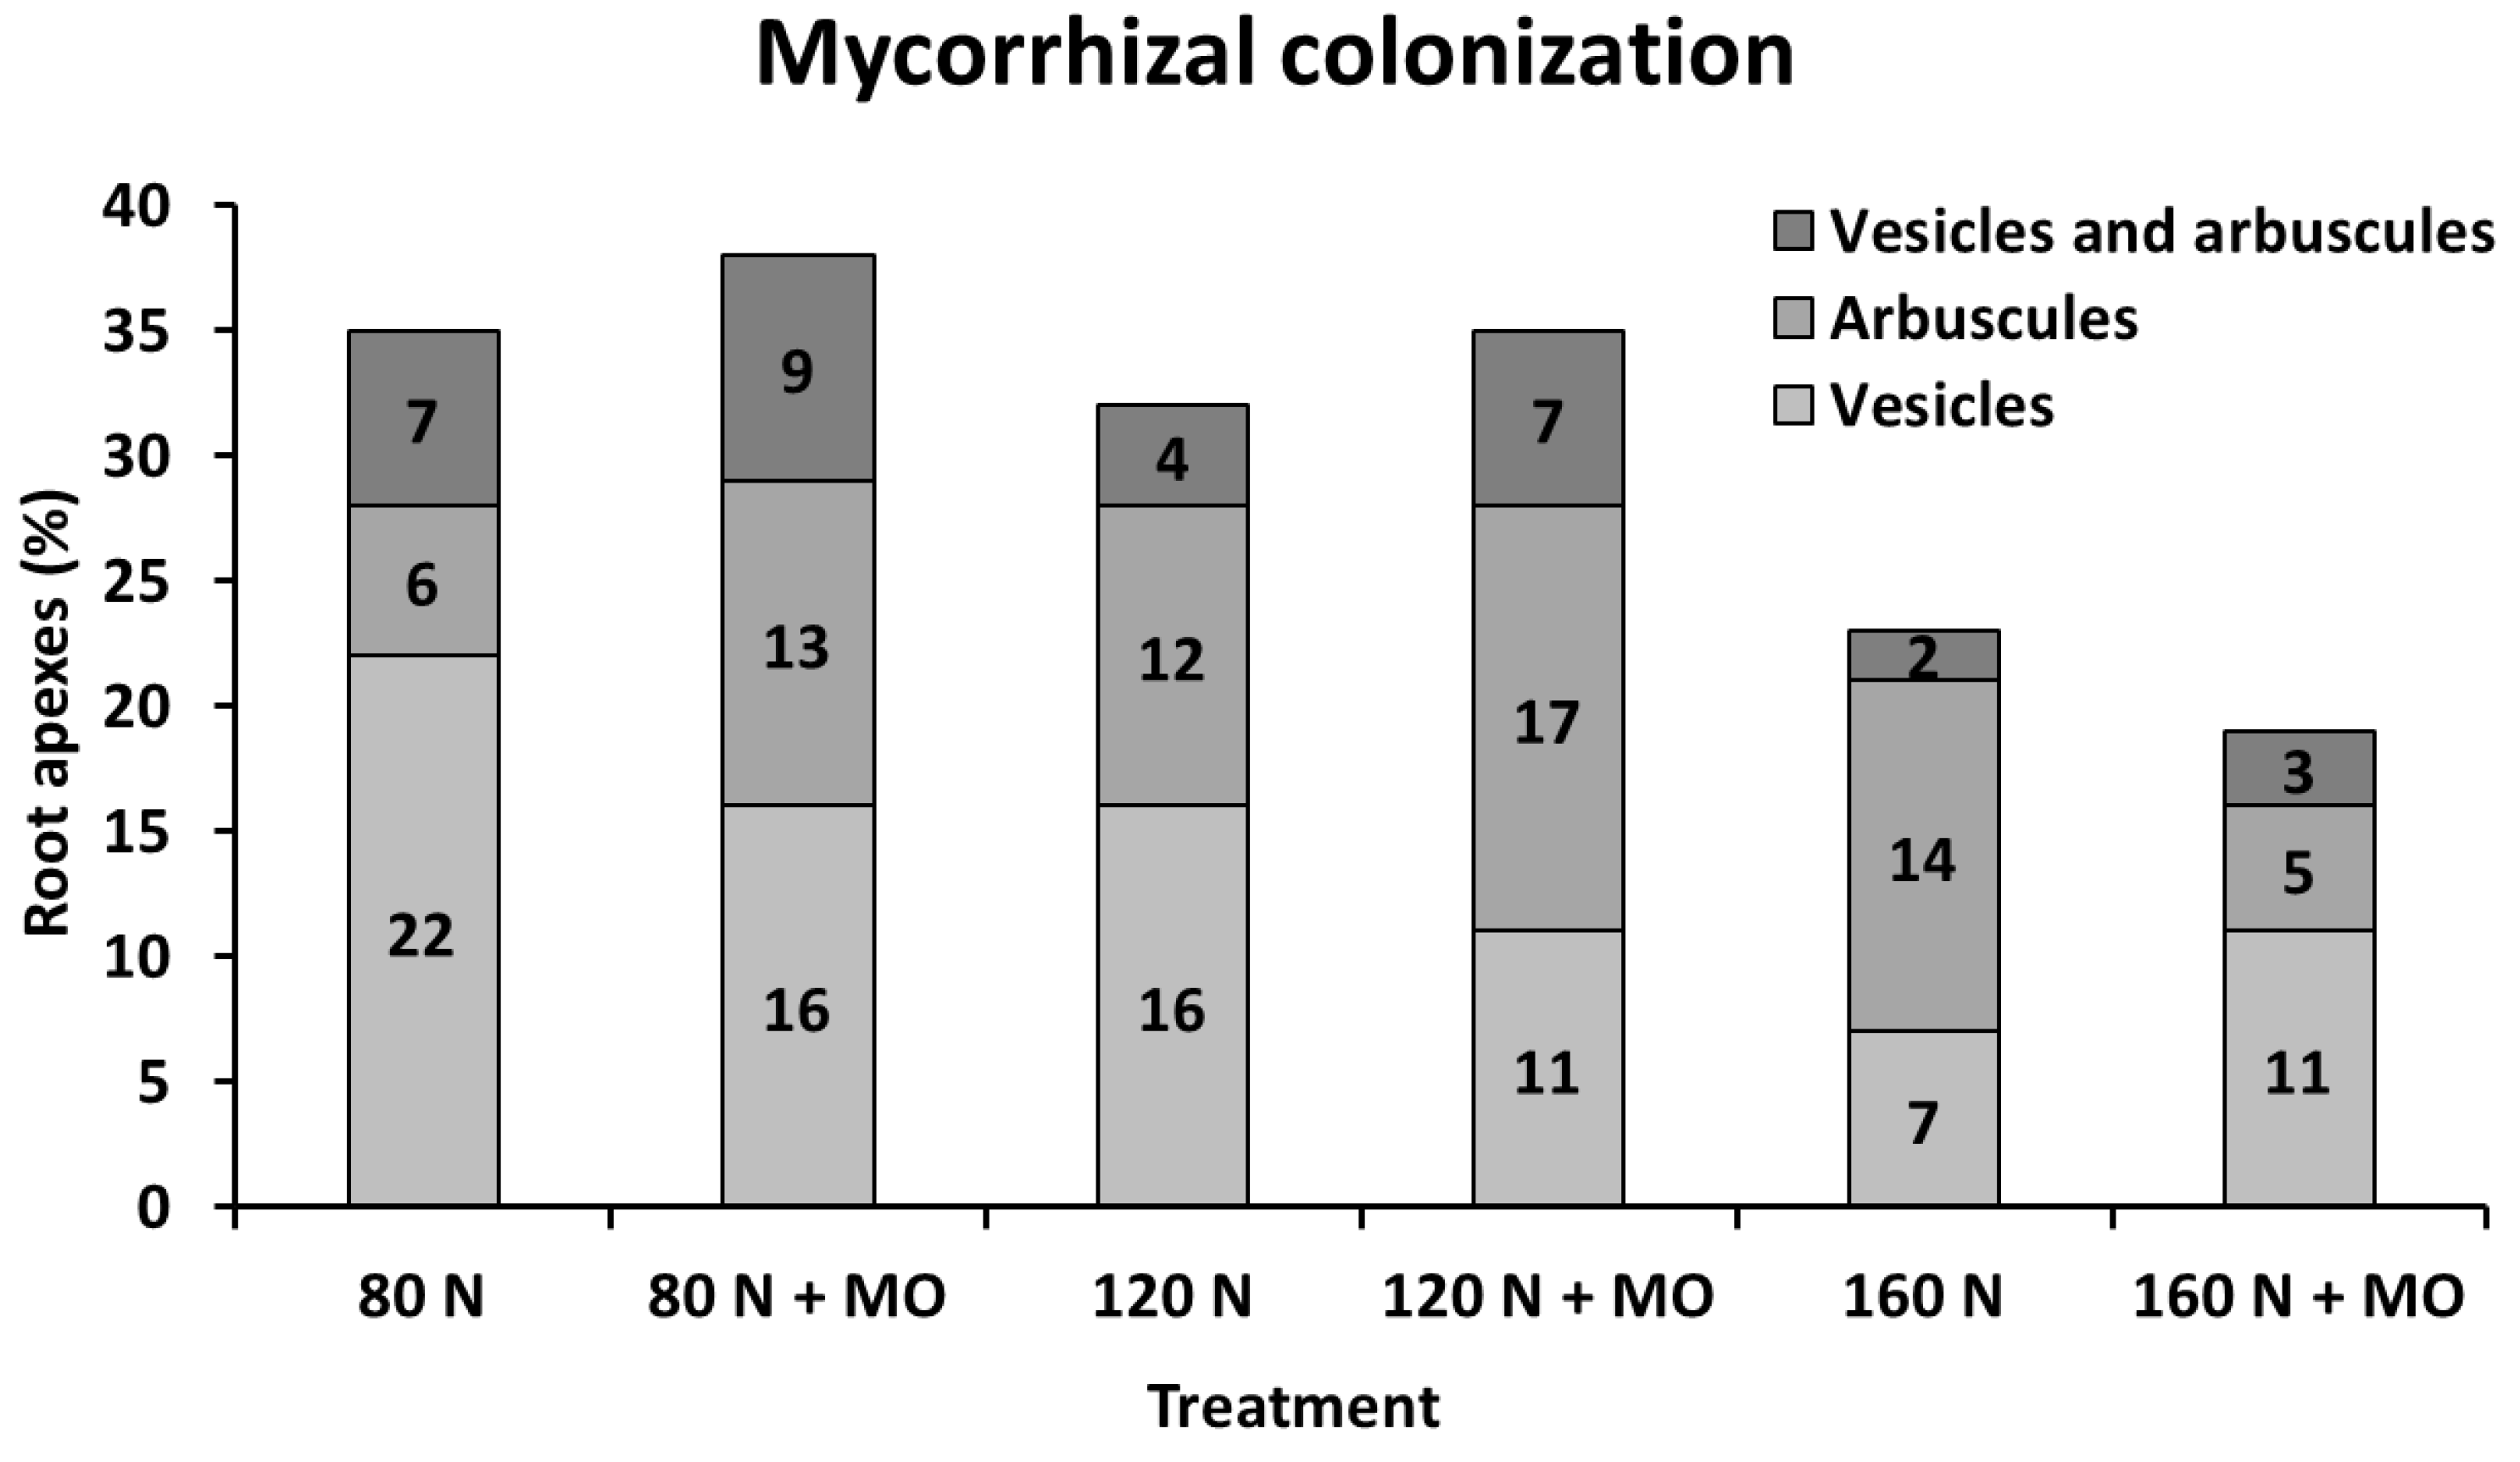
Microscopic assessments carried out in the 1st year on 100 root apexes per treatment of var. Africa in the arable layer showed that mycorrhizal root colonization, based on arbuscule and vesicle abundance, increased in inoculated plants at low and medium N fertilization doses (+3%, as absolute variation), but decreased at high N supply (−4%, as absolute variation), compared with non-inoculated controls. Natural occurrence of mycorrhization (no inoculation) was relatively high under medium–low N supply (32–35%), but markedly decreased at 160 kg N ha
−1 (−23%, as absolute value). However, it seems that inoculation increases the number of root apexes containing fungal arbuscules, and reduces the number containing vesicles, particularly at 80 kg N ha
−1 (
Figure 4).
3.3. Vegetation Indices, Shoot Growth and Grain Yield
Vegetation indices, such as SPAD and NDVI, were affected mainly by fertilization, as increased N supply led to significant improvements in chlorophyll contents and canopy greenness (
p ≤ 0.05), except for NDVI in the first year, which was very similar among treatments (
Table 4). The effect of inoculation with
R. irregularis +
A. vinelandii (not shown) was not significant, as well as the “inoculation × fertilization” interaction. Plant height was very stable across treatments, on average ~74 cm in var. Africa (1st year), and ~55 cm in var. Bologna (2nd year) (data not shown). Microbial inoculation did not have any significant effect also on grain yield, while nitrogen fertilization significantly improved it in the second year with the high-quality var. Bologna (
Table 4). Var. Bologna reached the maximum yield potential of ~6 t ha
−1 already at 120 kg N ha
−1, while Africa had a better yield with stable values across fertilizations (average: 6.38 t ha
−1).
3.4 Nutrient Uptake
Nitrogen concentrations in straw and grains, N removal and yield were often significantly affected by N fertilization (main effect, p ≤ 0.05), the higher the dose the greater the effects, while inoculation and the interaction between the two factors resulted always not significant. The average N concentration in straw differed between years, being 7.6 g kg−1 DW in the 1st year, and 4.9 g kg−1 DW in the 2nd, likely due to varietal differences and climatic conditions.
On the other side, biofertilizer application only seldom increased N concentration in the harvested grains, mainly in the 2nd year with var. Bologna, with the better response observed at the medium N fertilization rate (+10%;
p ≤ 0.05), although the major driver of N accumulation (i.e., proteins) was fertilization (
Table 5).
As a result of the combination of biomass production and nutrient concentration in plant tissues, inoculation generally slightly (
p > 0.05) enhanced N removal (straw + grains) with maximum improvements detected at 160 kg N ha
−1 fertilization: +32 kg ha
−1 (+12%) in the first year, and +23 kg ha
−1 (+13%) in the second year vs. respective controls (
Table 5).
The biofertilizer also seldom improved the concentrations in straw tissue and grains of other nutrients, like K, P, and Zn (
Table 6). In particular, straw had significantly higher concentrations of Zn at 80 kg N ha
−1 in the 1st year (+44%) and at 160 kg N ha
−1 in the 2nd year (+25%), and of K at 160 kg N ha
−1 in the 2nd year (+21%) (
p ≤ 0.05). Also, straw P concentration was increased by inoculation at 120 kg N ha
−1 in the 1st year. The major positive effects of inoculation on plant nutrition were found at high N dose in straw. In the grains, these nutrients were generally increased only as a trend (
p > 0.05). The response of var. Bologna (second year) at 80 kg N ha
−1 with inoculation was interesting, there being a general reduction in the concentrations of all nutrients in the straw, and an increase in the grains, suggesting that at low N supply there is an increasing trend of nutrient harvest indices (i.e., the ratio between nutrient accumulation in grains and total above-ground nutrient accumulation).
3.5. Principal Component Analysis (PCA) and Discriminant Analysis (DA)
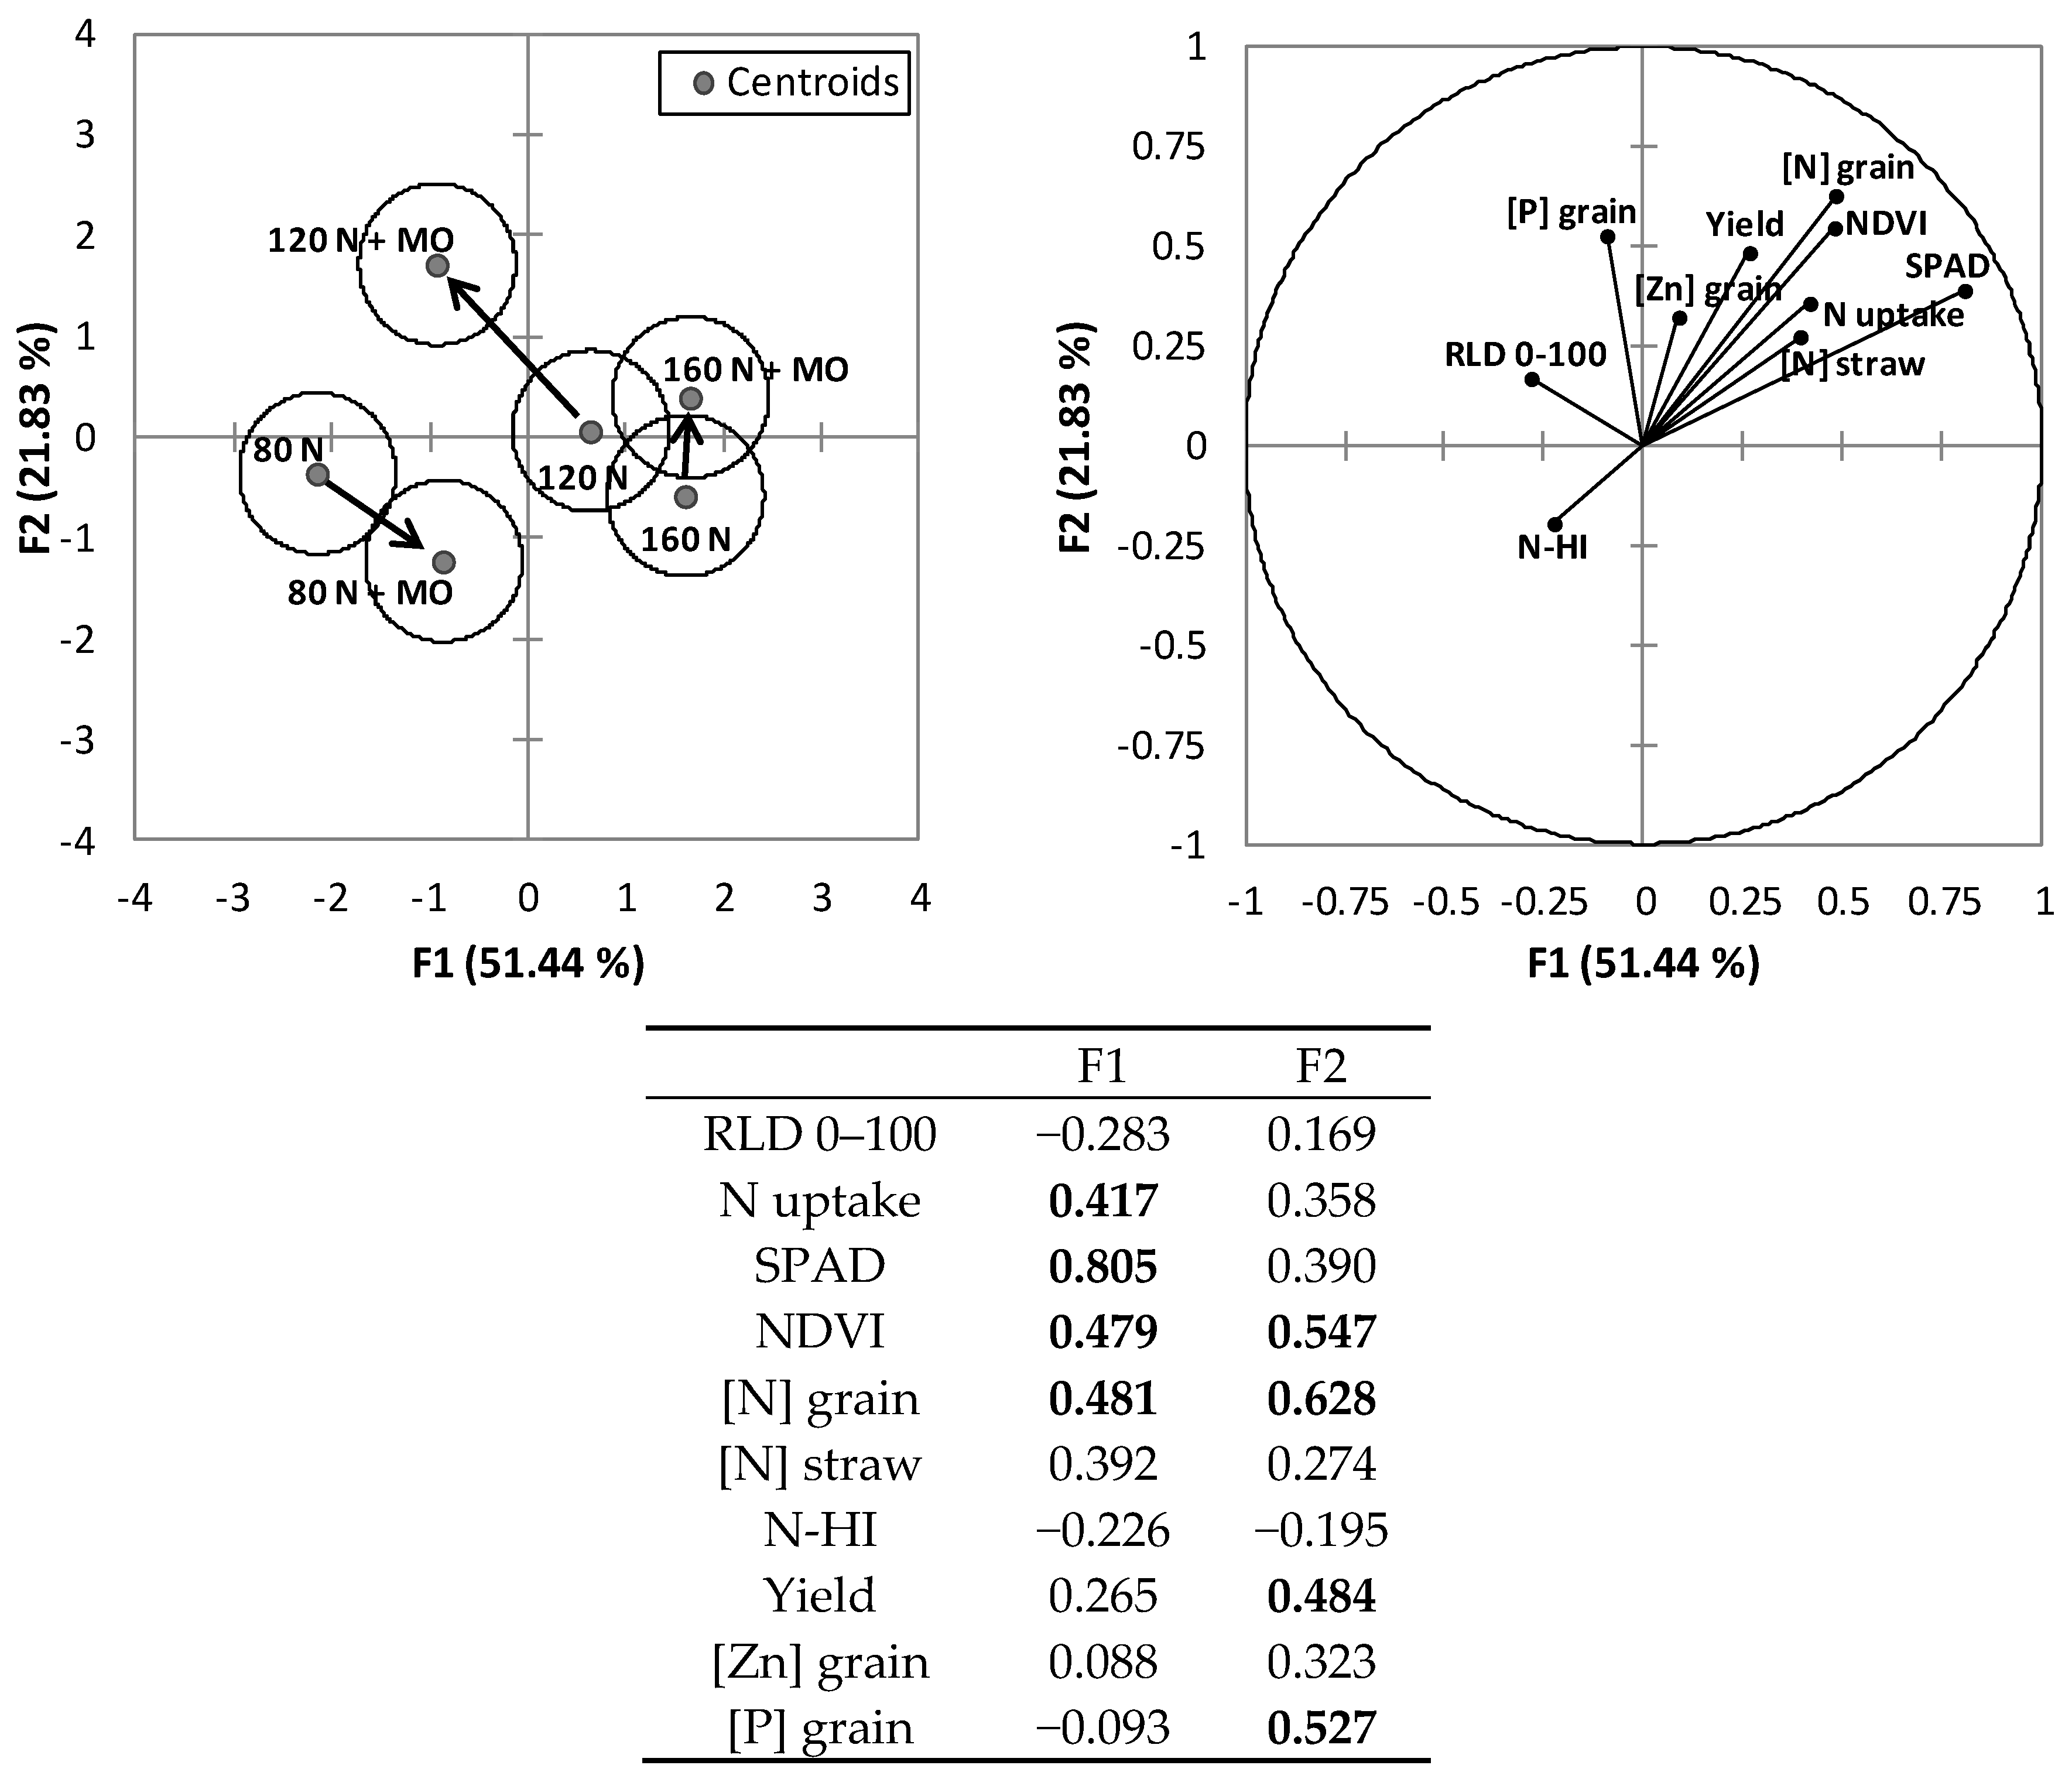
PCA conducted on the whole dataset of the two-year trial identified two synthetic variables, which explain an overall variability of 73.3%, attributed mostly to the first variable (F1 = 51.5%; F2 = 21.8%) (
Figure 5). Relevant (loadings > |0.4|) nitrogen-related variables were assigned to F1 (shoot N uptake, SPAD, NDVI, and grain N concentration), while yield and grain P concentration were assigned to F2. Following the vector direction of each variable, generally good correlations are established among the variables plotted very closely together, in this study NDVI, SPAD, yield, and grain and straw N concentrations—and these were negatively correlated with the nitrogen harvest index (N-HI, i.e., the ratio between N accumulation in grains and total above-ground N accumulation). P and Zn concentrations in grain were correlated with root length density.
The centroid position and cluster separation in the discriminant analysis (
Figure 5) summarizes wheat response to inoculation and fertilization, and shows that the microbial inoculation, at medium and high fertilization, promotes cluster shift according to vectors/variables related to root growth and nutrient allocation in the grains and limits root growth at low fertilization levels.
4. Discussion
Rhizophagus irregularis is a widespread VAM species in biofertilizer formulation for many crops. In the present study, microscopic observation and ESEM imaging revealed appreciable root colonization by this mycorrhizal fungus of wheat grown in sterilized pot soil, suggesting its potential use with this crop in the open field. By excluding the activity of natural microflora, it was ascertained that
R. irregularis can promote root growth after seed application, while increased N availability for plants might at least be expected from the free-living diazotroph
Azotobacter vinelandii through N-fixation [
33] and transportation from soil to roots [
34]. Although applicable individually, it has been suggested that mycorrhizal fungi and bacteria consortia can provide additional benefits for plants due to synergistic effects [
35].
In early growth stages of the rhizobox trial, marked root morphological changes were documented due to seed inoculation, which mainly concerned the promotion of root initiation and branching, but there was also a trend for greater length and surface area that may enable the plants to access more soil resources with expected benefits particularly under low nutrient availability. Similar effects with
R. irregularis were found in other crops, like rice by [
36], who detected increased root length and branching of the main roots, and a greater number of first- and second-order lateral roots, and also in tomato by [
37], although with substantial variations in root colonization among varieties. A more branched root system induced by VAM germinating spores was also found in
Medicago truncatula [
38], but this effect is common in many other species, probably as a means to increase the root sites available for mycorrhizal colonization [
39].
The inoculated PGP rhizobacteria may also have contributed to improve root growth, as many authors refer to their ability to produce plant growth regulators and phytohormones [
40,
41,
42], like indole-3-acetic acid, which is involved in root initiation and cell division [
43,
44]. However, an increase in the number of root tips and branches in wheat under foliar + soil inoculation in its early growth stages, probably because of the later inoculation compared to seed treatment and an expected delayed effect, was not recorded. In this regard, it can also be hypothesized that for a short period after inoculation an excess of phytohormones had reduced plant growth [
45].
For practical applications, attention should be drawn to the finding that this biofertilizer stably enhanced root growth across years and varieties under medium-high nitrogen fertilization doses in the field (120 and 160 kg ha
−1). The reduction in root growth under inoculation at the low N rate (80 kg ha
−1), despite improved mycorrhization, was undoubtedly unexpected, but there is evidence that soil nutrient availability, whether excessive or severely deficient, significantly affects root growth [
25,
46]. Nitrogen availability is a strong conditioning factor of root morphology and growth [
47], and high, homogeneous soil nitrate concentration can inhibit lateral and primary root growth [
48]. In this trial, in the absence of inoculation, the reduction in root length density with increased amounts of chemical fertilizer is in agreement with many reports in the literature [
49,
50,
51], suggesting that root growth impairment can occur at extremely high and extremely low N supply [
52]. Despite species-specific regulation, an excess of nitrogen can reduce lateral root formation through hormone-mediated mechanisms related to reduced shoot-to-root auxin transport [
53], and ethylene accumulation at the root level [
54].
Azotobacter is capable of synthetizing biologically active substances, particularly auxins, that directly affect root growth and morphology [
41], and many PGPRs lower root ethylene levels through production of the ACC-deaminase enzyme [
55,
56] and toxins, like rhizobitoxine, capable of inhibiting ethylene synthesis [
35]. Mycorrhizal colonization can modify plant hormone levels as well, thereby affecting root growth responses [
22].
Here it is demonstrated that inoculation clearly helped to minimize the negative impact of chemical fertilization on root growth, although there was no clear relationship with the mycorrhization level, which tended to decrease with increasing fertilizer doses. Good root mycorrhization generally occurs under low fertility conditions [
57], as these symbioses are negatively affected by chemical fertilizers [
58,
59], but there are many other factors affecting AM structure density in roots, like soil management and other cropping practices [
15]. However, it should be highlighted that a high density of VAM structures in plant roots is not always correlated to the functional efficiency of the mycorrhizal symbiosis [
60]. The effects of N fertilization on PGPR establishment and survival is not yet well understood [
61], and some studies show that high levels of N fertilizers reduce the number of PGPR species associated with crop roots [
62] or minimize their effects on grain yield and N uptake [
63].
In this study, the effects of inoculation were exerted mainly at root level in the arable layer, although in many cases there were appreciable root improvements at greater depths (
Figure 3), which may play a role in water and nutrient uptake under drought conditions when RLD is maintained above the critical threshold of 1 cm cm
−3 for water uptake [
64], with possible yield improvements. In this view, agronomic benefits deriving from field inoculation of wheat consist in partial savings on fertilizers or reducing the environmental impact (nutrient leaching) of intensive agriculture. Yield improvements seem currently not achievable in the fertile agro-ecosystem of northern Italy, and greater root systems may compete with grain filling for plant resource allocation under optimal growing conditions [
65]. In the present study, there was no stable positive correlation between root expansion and canopy greenness, grain yield and quality. In some cases (N levels), inoculation resulted in improved accumulation of low-mobile nutrients, like K, Zn, and P, particularly in the straw, and of N, although to a lesser extent as it is less dependent on root expansion, in agreement with existing literature [
8,
22]. Undoubtedly, the success of these microorganisms in sustainable agriculture depends on climatic conditions [
66], the plant genome [
67,
68] and competition with resident microbioma [
69], but larger root systems have also a key environmental advantage in reducing N losses from agricultural ecosystems, which is of huge importance in temperate rainy climates and in winter-spring crops. Although improvements of the canopy greenness and grain yield were not observed at our experimental site, direct agronomic benefits cannot be excluded particularly under extreme/stress conditions.
5. Conclusions
It is concluded that the association between the VAM Rhizophagus irregularis and the free-living diazotroph Azotobacter vinelandii can benefit wheat cultivation especially by improving root exploration in field conditions. There is no evidence of a negative interaction between inoculation response and N fertilization at the medium-high doses studied here (120–160 kg ha−1), which seems necessary to maintain the high protein content required by the bakery industry (>120 g kg−1, i.e., >21 g N kg−1). In fertile soils, like those that hosted the present study, moderate improvements in the uptake of some nutrients may be expected as a result of inoculation with possible environmental benefits.
Intensive agriculture, with the use of high levels of chemical fertilizers and soil tillage, is causing an alarming loss of soil fertility and widespread environmental pollution, particularly by nitrates. In this regard, more extended root systems derived from the application of microbiological tools may boost nutrient uptake, particularly under critical conditions due to excessive precipitation or low soil availability. Climate change and reduced fertilizer availability (mainly P and K), progressively accelerate the shift to more sustainable cultivation methods, which must be fully characterized. The biofertilizer experimented here is one among others available on the market, and the results from this study suggest that efficient consortia should include multi-target species; i.e., plant growth stimulating together with N-fixing and nutrient-mobilizing microorganisms.
Further investigations on the use of this inoculum are needed to verify whether yield improvements, nitrogen savings, and reduced nitrate leaching can be achieved in marginal soils, in organic agriculture and with elevated rainfall. As for future perspectives, the possibility to replace post-emergence inoculation with seed application of microorganisms should also be studied to improve the economic sustainability of these new practices.

 ,
, 


