Harmony in Diversity: Can the One Belt One Road Initiative Promote China’s Outward Foreign Direct Investment?


1
School of Business Administration, Shanghai Lixin University of Accounting and Finance, Shanghai 201209, China
2
Department of Economics, Shanghai Lixin University of Accounting and Finance, Shanghai 201209, China
3
Economic Studies, University of Dundee School of Business, Dundee, DD1 4HN, UK
*
Author to whom correspondence should be addressed.
Sustainability 2018, 10(9), 3264; https://doi.org/10.3390/su10093264
Submission received: 12 July 2018
/
Revised: 30 August 2018
/
Accepted: 6 September 2018
/
Published: 12 September 2018
(This article belongs to the Special Issue Services Sector Trade and Investment)
Abstract
:This paper investigates the effect of the One Belt One Road (OBOR) initiative on China’s outward foreign direct investment (OFDI) using a dataset of all host countries for the period of 2010–2015. The employed econometric technique combines a difference-in-differences estimator with matching techniques. The results show that China’s OFDI in OBOR countries is about 40% higher than in non-OBOR countries. After the initiative, the OFDI from China increases by 46.2% in OBOR countries. However, after controlling for the heterogeneity across OBOR and non-OBOR countries using the matching approach, the significance of the increasing effect caused by the OBOR initiative disappears. We also find the OBOR initiative diminishes the resource-seeking motivation and improves the market-seeking motivation of China’s OFDI. Our results cast doubts on the infrastructure-led and institution-based strategy of the OBOR initiative, but support the boosting effect of the OBOR initiative on institutional cooperation and cultural convergence. Thus, the OBOR initiative is a sustainable continuation and development of the long tradition of economic, institutional, and cultural convergence with the OBOR countries, rather than a temporary policy shock.
1. Introduction
The One Belt One Road (OBOR) policy involves two factors: ‘One Belt’ denotes the Silk Road Economic Belt and ‘One Road’ denotes the 21st Century Maritime Silk Road. The OBOR aims to promote China’s integration into a more open global economy. The One Belt (OB) initiative includes countries in Central Asia, West Asia, South Asia, and Southeast Asia (green areas in Figure A1 in Appendix A), which was unveiled by Chinese President Xi Jinping in Kazakhstan on 7 September 2013. Less than a month later, President Xi Jinping announced the One Road (OR) initiative in Indonesia on 3 October 2013, which includes countries throughout the South China Sea, Indian Ocean, and the South Pacific to Europe and East Africa (dark green areas in Figure A1 in Appendix A). Since its inception in late 2013, the OBOR initiative has become a Chinese national strategy to integrate China’s economy with those of countries and regions in Asia, Europe, and Africa [1], and sustained its economic growth by developing closer cooperation with these partners [2]. As a means of enhancing China’s global influence, a range of new government policies following the OBOR initiative have been strongly supporting China’s outward foreign direct investment (OFDI).
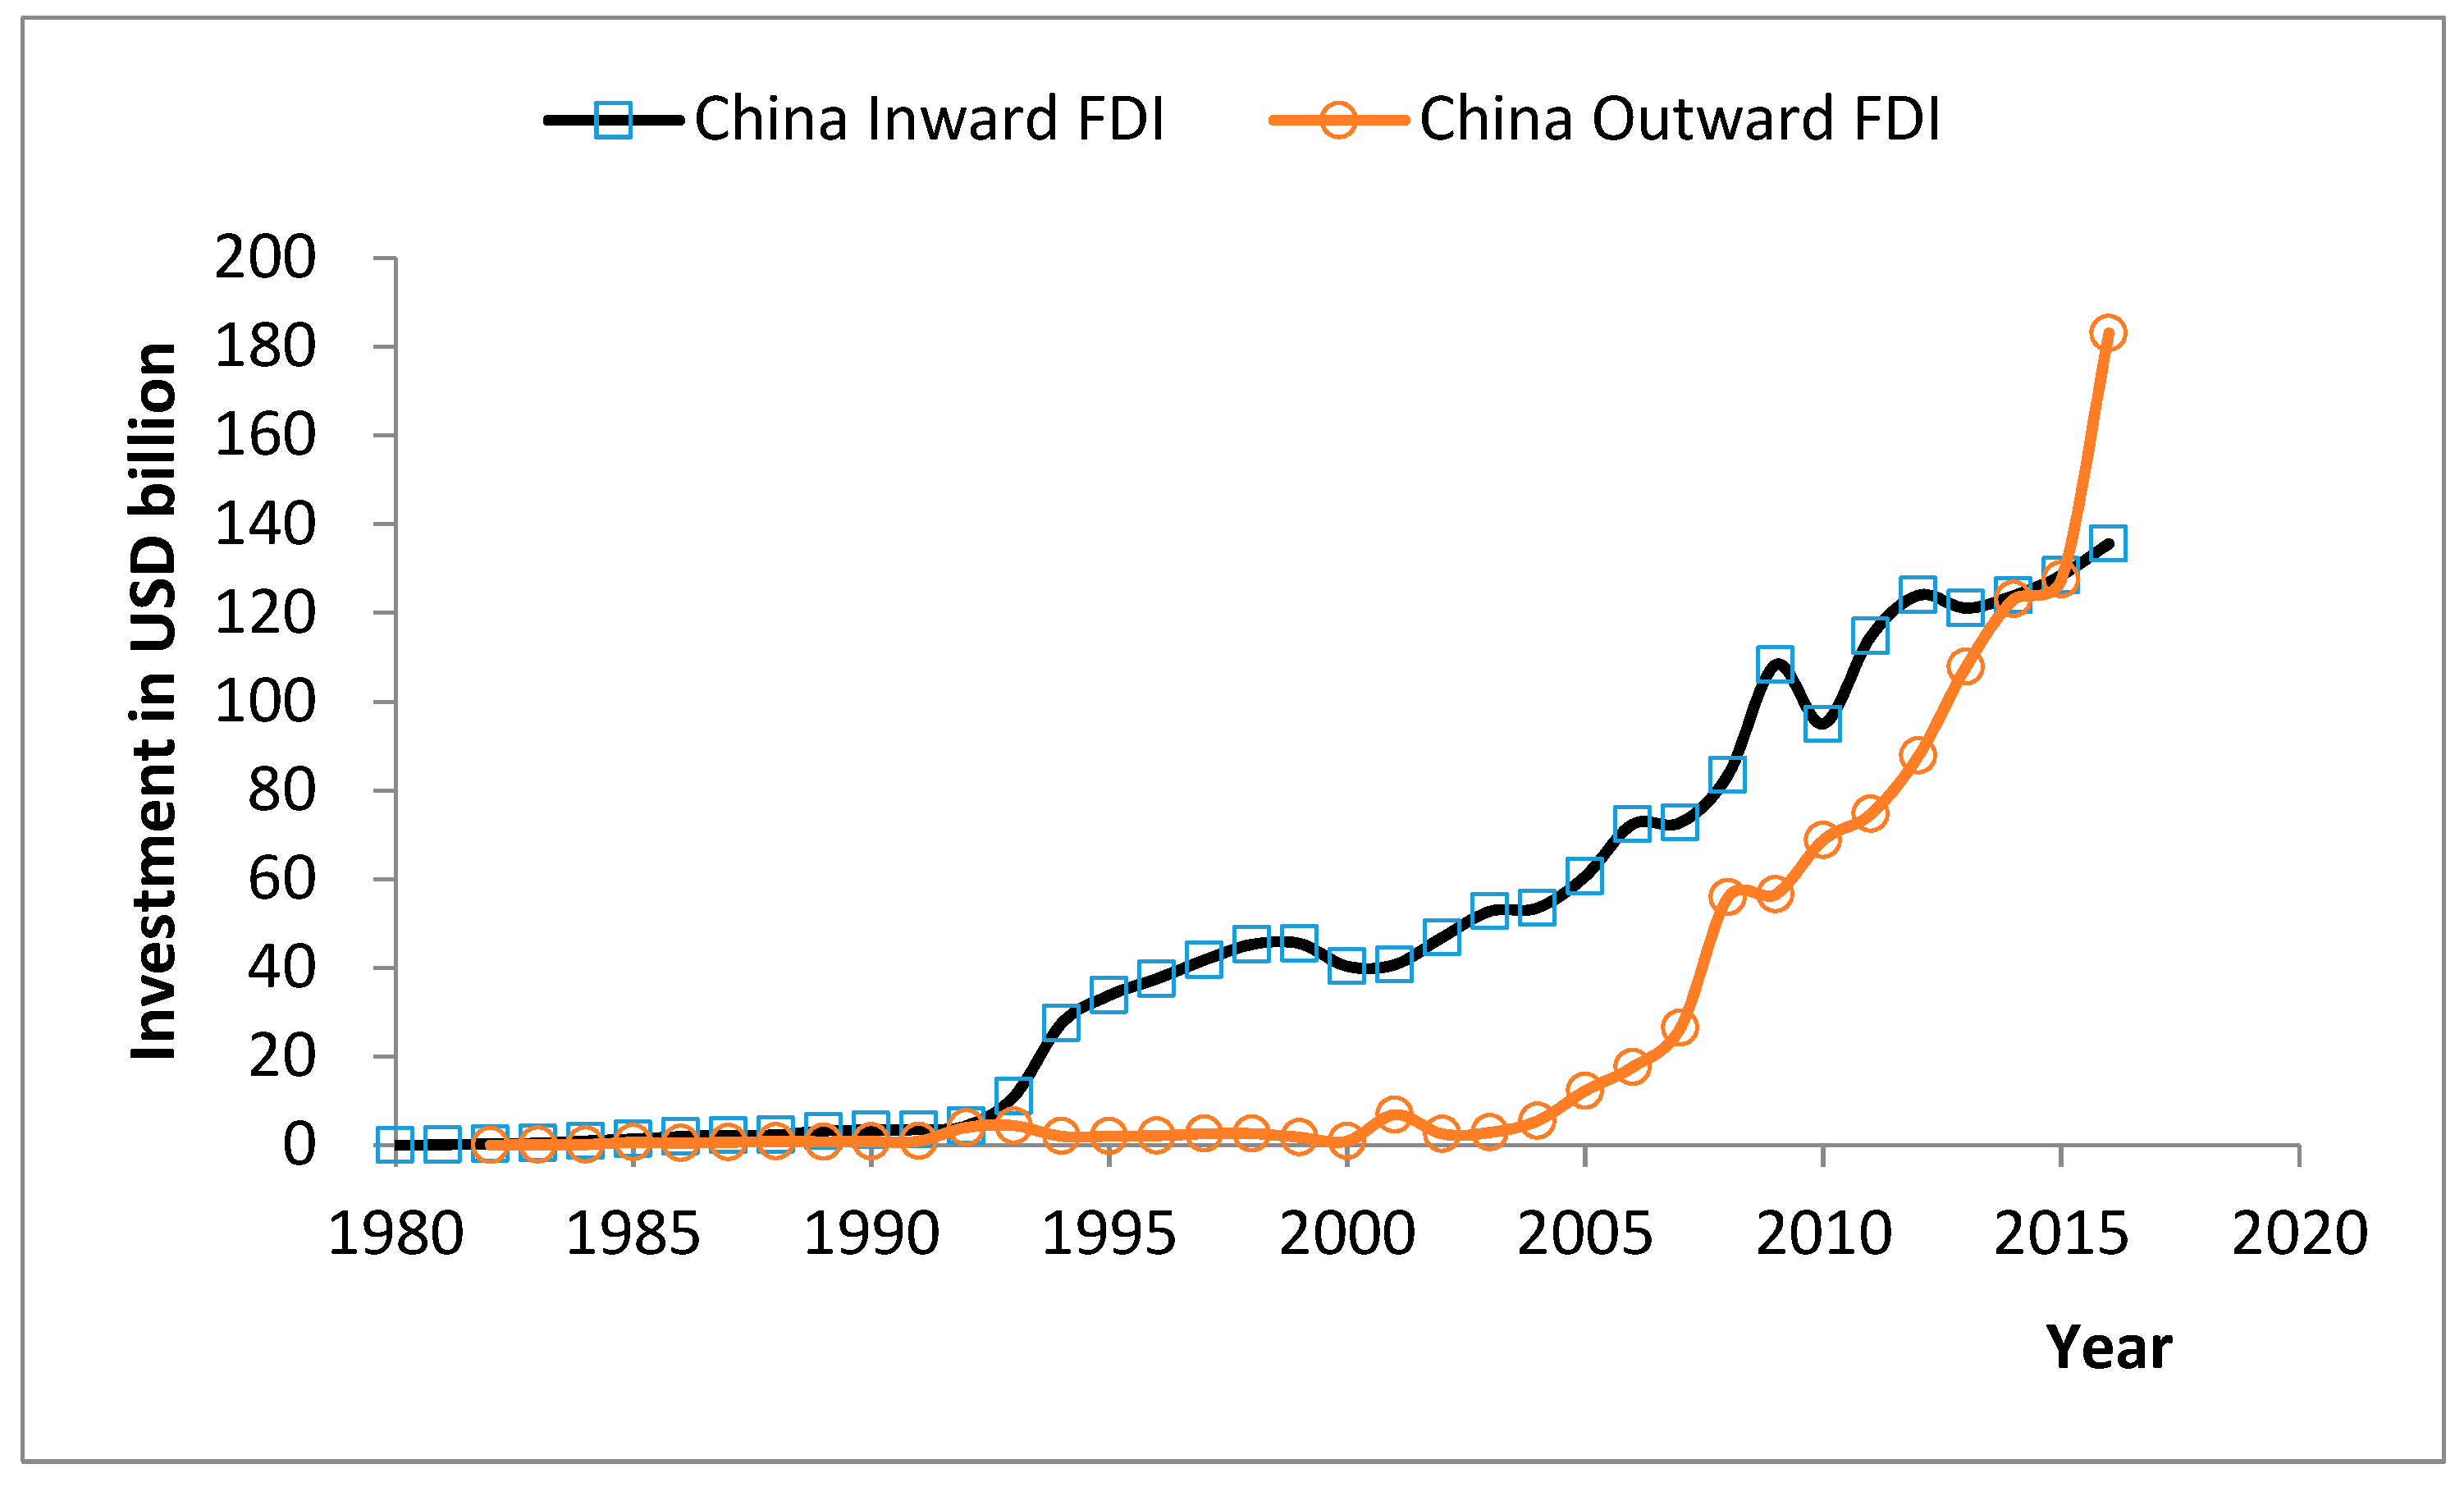
China’s government has encouraged Chinese enterprises to search abroad and participate in cross-border investment (‘Going Out Strategy’), which has been an important aspect of the agenda since the beginning of the new millennium [3,4]. The OBOR initiative is thought to be an upgrade policy with the aim to connect China more closely to Central Asia, Southeast Asia, South Asia, East Africa, and East-Central Europe. The OBOR countries include more than 65 economies that account for over 4 billion people in terms of population. The economic aggregate of the OBOR countries is about $21 trillion, nearly 65% land-based global production values and 30% maritime-based values [5]. By creating the Asian Infrastructure Investment Bank (AIIB), the Silk Road Fund (SRF), the New Development Bank (NDB), amongst other government-led programs, China has made a convincing commitment to the OBOR initiative for a more open world economy, which aims to become an important and maybe a central part of the globalization in the new era. Since the OBOR initiative mostly covers low-income economies with 64% of the world population but only 30% of the world gross domestic product (GDP), this vast underdeveloped region has the potential to become a new growth engine of the global economy and create new markets for China’s exports and OFDI [2]. In 2010, China’s outward and inward foreign direct investment (FDI) were only $68.8 and $114.7 billion, respectively. However, the OFDI from China almost tripled to $183.1 billion over the period of 2010–2016, while inward FDI only increased by about 15% to $133.7 billion (Figure 1) [6], indicating that China has transformed from a global manufacturer to a global investor with a substantial increase of the OFDI [1]. Nowadays, China has become the second largest source and recipient of OFDI, following the U.S. Consequently, the question arises as to whether or how China’s OBOR initiative might have influenced its OFDI, especially in the OBOR countries, which is the main focus of this paper.
Without a central coordination mechanism, however, the clash caused by different motivations, institutions, and cultures between China and the host countries is still creating entry barriers for China’s OFDI. Although many OBOR countries appreciate the Chinese effort to promote regional economic cooperation and development, there is a widespread concern that China exporting its massive excess capacity to their domestic economies through the OFDI will displace competitors in the local market, because China’s OFDI used to be regarded as resource-seeking and even rent-seeking might deepen the resource dependence of the host countries and lead to corruption. Moreover, underdeveloped OBOR countries with weak governance may not fully benefit from China’s investment, as the OBOR initiative follows the “non-interference” criteria and does not tie investment to political reform [7]. Thus, the international community still hesitates to regard the so-called “China model” as a replacement of the American-led international economic architecture [2].
China has achieved impressive economic growth since the 1970s by attracting enormous FDI from developed economies. However, as China’s economy has been the new normal with moderate growth since 2012, the sustainability of the China model as a global manufacturer is facing unprecedented challenges. Here, our main argument is that China’s OBOR initiative, as a new regional cooperation model used to accelerate China’s transformation from an FDI receiver to an FDI provider for the next stage of sustainable development, is an important strategy to sustain its economic growth by continuing its long tradition of economic, institutional, and cultural convergence with the OBOR countries. Whether or how the OBOR initiative can stimulate and guide the motivation of Chinese foreign investment and promote the OFDI from China in the OBOR countries was studied.
Despite being an important and intriguing matter to policymakers, industry experts, and academics, existing literature on this topic is surprisingly limited. Previous studies are focused on China’s FDI flows to the developed or emerging economies, such as Africa and Poland [8,9]. However, these studies are not concerned with the systematic effect of the OBOR initiative on China’s OFDI, and only a few papers discuss the OBOR initiative. Liu et al. [3] identified the main determinants of China’s OFDI in the OBOR countries, such as infrastructure facilities, market potential, exchange rate levels, and openness of host countries. However, the dataset used in that study includes only 93 countries and regions (49 OBOR and 44 non-OBOR countries). The comparatively small sample size and ambiguous categorization cannot fully consider the difference between the OBOR (more than 65 countries) and non-OBOR countries (more than 140 countries), preventing accurate analysis of the difference between the continental One Belt (OB) and maritime One Road (OR) countries. For example, in the work by Liu et al. [3], Hong Kong SAR, Algeria, Austria, Luxembourg, Switzerland, Portugal, Spain, Denmark, Finland, Sweden, Norway, and the United Kingdom belong to the OBOR country group. However, these countries or regions are generally regarded as non-OBOR countries by the authoritative OBOR dataset hosted by Social Science Academic Press (China) and reports, such as the report by Du and Zhang [1]. Thus, we followed the country categorization provided by Du and Zhang [1] rather than Liu et al. [2] (Table A1 and Figure A1 in Appendix A).
In a study by Du and Zhang [1], the effect of the OBOR initiative on China’s OFDI is analyzed by applying the difference-in-differences (DID) technique to firm-level data. They concluded that China’s OFDI favors Russia, Central and West Asia, and Western Europe, and increases more significantly in the continental OB countries than in the maritime OR countries. However, the OBOR and non-OBOR countries are not two randomly selected groups, and therefore, estimation results from a simple DID are biased by the selection problem in acquisition literature. Better control on the heterogeneity of the OB, OR, and non-OBOR countries can improve the validity of these conclusions.
In view of the growing attention focused on China’s OBOR initiative and the debate about the growing importance of China’s OFDI, several problems still remain and should be further analyzed before we can have a consensus on this subject. First of all, China’s OFDI used to be regarded as infrastructure-led investment and was focused on the mining and energy industries before the OBOR initiative was proposed [10]. As the OBOR initiative is also regarded as infrastructure-led and resource-seeking, the OBOR countries can receive massive infrastructure investment from China to improve the availability and quality of their logistics facilities [3]. Hence, the infrastructure improvement in the OBOR countries can mitigate the disadvantages of infrastructure distance of the host countries from China and boost resource-seeking FDI inflow from China. Du and Zhang [1] argued that, in order to increase international competitiveness and meet the needs of domestic consumption, the objective of China’s OFDI has shifted from seeking production factors to seeking market power. Thus, the shifting motivation of China’s OFDI from natural resources to the global market is still a problem, calling for thorough study under the OBOR initiative.
Second, China is regarded as a model of state capitalism [1] and China’s policy and environment that are based on its political and economic institutions are not completely compatible with international standards and customs. However, the stable political situation, liberal policies, and governance of the host countries can attract more OFDI from China [10,11]. On the other hand, the degraded institutional environment and weak governance of the host country could also be considered as an advantage by China’s OFDI [12,13,14]. Hence, institution-based OFDI can be encouraged by the institutional distance of host countries from China. Nevertheless, this institutional distance significantly reduced by high-level policy coordination, international political cooperation, and government support under the OBOR initiative [3] discourages institution-based OFDI. As a consequence, in order to provide an understanding of the institutional distance influence of host countries on China’s OFDI, this paper sheds new light on the institution-based OFDI from China under the OBOR initiative.
Third, China has a long history of Confucian tradition, which is different from the cultural backgrounds of most host countries. The cultural distance of host countries is expected to impede FDI from China [10], but could increase the cultural attraction and encourage FDI. This paper not only considers the economic and institutional differences between China and the OBOR countries, but also reveals the mechanism of the cultural tradition of ‘harmony in diversity’ in these OBOR countries to promote China’s OFDI. Therefore, we endeavored to identify the economic, institutional, and cultural determinants of China’s OFDI in the OBOR countries.
This paper’s contributions involve three aspects: first, we establish a panel dataset over the period of 2010–2015, including 216 countries/regions (74 OBOR countries and 142 countries outside the OBOR), in which we also identified 49 land belt (OB) countries and 25 sea road (OR) countries. This dataset includes almost all countries and regions around world. For simplicity, we did not differentiate between countries and regions in this paper. We use country dummies for all relevant countries and regions in the next sections. To the best of our knowledge, it is the largest sample used for this subject. Second, we measure the variables of natural resource, market size, infrastructure facility, institution, and culture of the host countries. The effects of these variables under the OBOR initiative estimated to investigate the impact of the shifting motivation and infrastructure, institution, and cultural distance on China’s OFDI. Third, in order to correct the selection biases, we combine DID estimation with matching techniques to identify the causal impacts of the OBOR initiative on China’s OFDI. Our basic conclusion is that the OBOR initiative has positively influenced China’s OFDI. The rest of the paper is as follows: Section 2 reviews the literature and sets up our hypotheses, Section 3 describes data and variables, Section 4 introduces the empirical methodology, Section 5 presents the empirical results, and conclusions are drawn in Section 6.
2. Literature Review
2.1. Resource-Seeking
Dunning [15,16] developed the main theoretical framework for FDI determinants and identified three advantages of abroad investment—ownership, location, and internalization—and three motivations of FDI: resource-seeking, market-seeking, and efficiency-seeking [10,12,13,14,17]. Efficiency-seeking FDI mainly seeks low-cost locations, which is unlikely for China’s OFDI since China’s labor cost is comparatively low, and hence is not considered here [10]. When comparing these different theoretical motivations of OFDI activity, China has used OFDI to seek domestically scarce resources, such as petroleum, fishery, timber, and minerals [10,18,19,20,21]. Buckley et al. [10] argued that China’s OFDI is significantly positively related to host natural resources, but insignificantly associated with patents as proxy of strategic asset. Cheung and Qian [13], Kolstad and Wiig [14], and Wang et al. [11] also argued that natural resources are significantly positively associated with China’s OFDI. Chang [22] claimed that China’s OFDI prefers to invest in the host country’s fuel resources. Thus, OFDI from China has typically been considered as natural resource-seeking.
Internalization theory supports a positive association between China’s OFDI and the natural resource endowment of the host countries [10,23]. This paper focuses on the resource-seeking motivation of China’s OFDI under the OBOR initiative. The more resources the host countries have, the greater China’s OFDI. This relationship might be strengthened by the OBOR initiative and become more prominent in the OBOR countries after 2013. Thus, our first hypothesis is as follows:
Hypothesis 1.
The OBOR initiative boosts the resource-seeking motivation of OFDI from China in OBOR countries.
2.2. Market-Seeking
Market-seeking is regarded as an important motivation of China’s OFDI. Numerous studies [24,25,26,27,28] show that FDI has been directed toward larger market sizes for the economies of scale and efficient utilization of resources. Buckley et al. [10] found a significantly positive association between China’s OFDI and host market size. Cheung and Qian [13] and Chang [22] also found that horizontal market-oriented FDI is attracted by the market size of the host country. Large economies present more opportunities for China’s OFDI to generate profits than small economies. The market-seeking hypothesis holds that larger host markets can attract more FDI from China. The positive association between market size and China’s OFDI might be strengthened by the OBOR initiative and become more significant in the OBOR countries after 2013. Thus, our second hypothesis is as follows:
Hypothesis 2.
The OBOR initiative boosts the market-seeking motivation of OFDI from China in OBOR countries.
2.3. Infrastructure-Led Outward Foreign Direct Investment
Previous studies show that infrastructure improvement in the host countries, such as the transportation, information, and communication networks, can attract more FDI. Therefore, China needs to upgrade its industry structure, especially for the infrastructure construction industry, which has surplus capacity. If the OBOR initiative was mainly an infrastructure-led integration scheme, the massive investment from China could develop infrastructure in the OBOR countries, and in turn attract more FDI from China. Coughlin et al. [29] found that the U.S., with extensive transportation infrastructure, could have received more FDI in 1981–1983. Additionally, developing countries could improve infrastructure quality to attract OFDI from the U.S. [30]. Similarly, Cheng and Kwan [31] argued that the density of roads is important for inward FDI in China. More reports confirm the positive association between infrastructure improvement and FDI [32,33,34,35,36].
Infrastructure also plays a central role in international cooperation and development under the OBOR initiative, as most of the OBOR countries are substantially short of infrastructure investment [2]. Busse et al. [7] found that China has established and improved much-needed infrastructure in Africa, thereby decreasing transaction costs and enhancing trade and growth rates. Thus, better infrastructure in the developed non-OBOR host countries can complement China’s OFDI, whereas worse infrastructure in the underdeveloped OBOR countries also attracts infrastructure-led FDI from China. We examined the effect of infrastructure on China’s OFDI by considering the infrastructure distances of host countries from China under the OBOR initiative. The larger the infrastructure distance, the more China’s OFDI invested in the host country. The relationship between the infrastructure improvement and FDI might be strengthened by the OBOR initiative and become more prominent for the OBOR countries after 2013, which is hypothesized as follows:
Hypothesis 3.
The OBOR initiative boosts infrastructure-led OFDI from China in OBOR countries.
2.4. Institution-Based Outward Foreign Direct Investment
As the second largest FDI inflow/outflow country while also a developing country, China has a different institutional environment from developed countries and regions with large FDI inflow/outflow, such as Hong Kong SAR, Japan, the Netherlands, the United Kingdom, and the U.S. Some empirical studies examined the institutional pattern of China’s OFDI, and analyzed differences from the host countries. Calvo et al. [37], Femandez-Arias [38], and Femandez-Arias and Montiel [39] identified the social and political conditions in host countries as potential determinants of FDI decisions. Fedderke and Romm [36] addressed policy-related factors including corporate tax, product market regulations, openness, trade barriers, and non-policy factors including political and economic stability. Sekkat and Veganzones-Varoudakis [40] noted that trade, exchange market regulations, and business or investment climate are important for FDI inflow. Buckley et al. [10] regarded policy liberalization and political risk as the important determinants of China’s OFDI. They found that China’s OFDI is positively associated with policy liberalization in China after 1992 and the political stability in the host countries. Wang et al. [11] showed that institutions and taxation both matter in China’s OFDI.
However, Cheung and Qian [13] argued that institutional quality is insignificant in determining FDI. Kolstad and Wiig [14] argued that, as a host country’s institutional environment worsens, China’s OFDI becomes more attracted by its natural resources. Amighini et al. [12] found that China’s OFDI is associated with weak governance in low-income countries. Thus, the more stable the political situation, the more liberal the policy, and the better the governance of the developed host countries, the more China’s OFDI is attracted. Conversely, worse institutional environment and weak governance of the developing host countries could also be considered as an advantage associated with China’s OFDI. Following this tradition of studies on institution-based OFDI, this paper uses a similar framework to more systematically analyze institutional determinants of China’s OFDI and focuses on how the institutional distances of host countries influence China’s OFDI. Given the OBOR initiative can considerably reduce the institutional distance of the OBOR countries for Chinese investors through international policy coordination and cooperation, and prevent them from taking advantage of the local institutional environment, our fourth hypothesis is as follows:
Hypothesis 4.
The OBOR initiative reduces the institution-based OFDI from China in OBOR countries.
2.5. Cultural Distance
Chinese culture believes in harmony in diversity, which is an ancient philosophical system based on mutual benefit and interest for people from different cultural backgrounds. Since 1979, cultural connection with Taiwan, Hong Kong, Macau, Singapore, Indonesia, Thailand, and Malaysia has helped China integrate into the world economy, especially by the inflow FDI from these countries and regions [41,42,43,44]. Buckley et al. [10] suggested that cultural distance is a negative determinant of China’s OFDI, as the cultural proximity of host countries can increase FDI from China. As the OBOR initiative focuses not only on China’s economic integration into the global economy, but also on the cultural communication and convergence with the world, the OBOR initiative might mitigate the negative effects of cultural distance and increase China’s OFDI in the OBOR countries. Hence, we have a hypothesis as follows:
Hypothesis 5.
The OBOR initiative mitigates the negative effect of cultural distance on OFDI from China in OBOR countries.
3. Data Description and Measurement
3.1. Dependent Variable
This paper investigates whether and how the OBOR initiative influences China’s OFDI by using data from 2010 to 2015. The dependent variable is China’s OFDI net flows (total OFDI outflows with net counter-investment of less than 10%) to 216 sample countries, including 49 land belt (OB) countries, 25 sea road (OR) countries, and 142 non-OBOR countries. This is a full sample published by the Chinese Ministry of Commerce in the detailed Statistical Bulletin every year (Table 1), and the largest sample in the studies on this subject, to our knowledge. The dependent variable was measured as a natural logarithm of real net China’s OFDI (lnrofdi) in millions of US dollars in 2010. We used the GDP deflator provided by the World Bank to deflate the nominal values. Since the real OFDI net flows could be negative values (for example, the minimum value of the real OFDI net flows was $10,177.16 million in 2010) or zero (no OFDI), we set the natural logarithm values of these cases as 0, i.e., lnrofdi = 0. It is equivalent to top up to $1 million for these 68 extreme cases with negative OFDI values and 424 cases with no OFDI. This assumption is commonly used in the related literature to facilitate logarithmic transformation [1,45,46].
3.2. Main Explanatory Variables
First of all, the natural resource (nr) endowment is measured as the share of natural resource rent in GDP (%), provided by the World Development Indicators [47]. Estimates of this variable rely on methods and sources of the World Bank [48]. Higher values of this variable suggest more natural resource endowment and more dependence on natural resources in the host country. Aleksynska and Havrylchyk [49] argued that countries with rich natural resources can increase their FDI inflows. Thus, we expected the nr endowment would have a significantly positive effect on China’s OFDI. Additionally, we measured the market size as the natural logarithm of real GDP (lnrgdp). The GDP deflator provided by the World Development Indicators [47] was used to deflate the nominal GDP into U.S. dollars in 2010. This variable can reflect the absorptive capacity or market potential of the host country, so was expected to have significantly positive effects on China’s OFDI.
Second, infrastructure facilities—like airports, railways, telecommunication, and Internet access—are important determinants of FDI. We used six variables of infrastructure facilities in the host countries: (1) lnairf—log form air transport freight (million ton-km); (2) rd—railway density, which is total railway kilometers (% of country area); (3) landline—individuals using landline phone (% of population); (4) mobile—individuals using a mobile phone (% of population); (5) Internet—individuals using the internet (% of population); and (6) broadband—fixed broadband subscriptions (% of population). These variables were also derived from World Development Indicators data [47].
Exploratory factor analysis of these six variables using all 216 host countries and China showed that one principal component with an eigenvalue of 2.9 accounted for 74% of the variance and the loadings on this component were all around or exceeded 0.3: lnairf (0.292), rd (0.383), landline (0.888), mobile (0.972), internet (0.520), and broadband (0.870). The overall Kaiser–Meyer–Olkin (KMO) measure of sampling adequacy was 0.764, which is more than 0.7 and suggested a good factor analysis. A factor of infrastructure facilities (infra) was derived from these six variables for all 216 host countries and China, which varied from −1.065 (weak) to 3.51(strong), indicating improvement of infrastructure facilities. Next, we determined the factor value of China over the period of 2010–2015 as the baseline of infrastructure facility variable (cinfra). The infrastructure facility distance variable (fd) is the absolute difference between the infrastructure facility variables of host countries (infra) and China (cinfra), that is, fd = |infra–cinfra|.
Third, we measured institutional quality using data from Worldwide Governance Indicators [50]. A factor of institutional quality (wgi) was calculated using six social and political governance variables that reveal the overall profiles of host countries’ political situations: (1) government effectiveness (ge), (2) regulatory quality (rq), (3) control of corruption (cc), (4) political stability and absence of violence/terrorism (ps), (5) voice and accountability (va), and (6) rule of law (rl). These variables all varied from −2.5 to 2.5 (i.e., weak to strong), indicating improvement of institutional quality in the host countries.
Exploratory factor analysis of these six variables using all 216 host countries and China showed that one principal component with an eigenvalue of 4.45 accounted for 83% of the variance and that loadings on this component all exceeded 0.75: ge (0.9611), rq (0.928), cc (0.9629), ps (0.7521), va (0.8325), and rl (0.9849). The overall KMO measure was 0.892 for the sampling adequacy, which is close to 0.9 and suggested a good factor analysis. Thus, a factor of worldwide governance indicators (wgi) was derived from these six variables for all 216 host countries and China, which varied from −2.28 (weak) to 1.93 (strong), indicating improvement in institutional quality. In addition, we determined the factor value for China over the period of 2010 to 2015 as the baseline of institution variable (cwgi). The institutional distance variable (id) was the absolute difference between the institution variables of host countries (wgi) and China (cwgi), that is, id = |wgi—cwgi|.
Finally, cultural distance of the host countries from China was measured as an index (cd) derived from the six cultural dimensions in Hofstede [51,52]: (1) power distance (pdi), where higher values mean higher inequality; (2) individualism/collectivism (idv), where higher values denote more individualism; (3) masculinity/femininity (mas), where higher values denote more masculinity; (4) uncertainty avoidance (uai), where higher values mean more uncertainty avoidance; (5) long-term/short-term (lts), where higher values indicate more short-term orientation; and (6) indulgence/restraint (inr), where higher values denote more indulgence. From Hofstede’s six-dimension culture dataset on the Hofstede-insights website, Chinese culture is highly unequal (pdi = 80), more collective (idv = 20), highly masculine (mas = 66), uncertainty tolerant (uai = 30), long-term oriented (lts = 87), and very restricted (inr = 24). We measured the cultural distance index (cd) by extending the Kogut and Singh’s [53] model (also Fu et al. [54])
where cdjt is the cultural distance index of a host country j in year t, Cij is the ith cultural dimension in jth country, Ci,China is the ith cultural dimension in China, Vi stands for the variance of the ith cultural dimension, and Tjt is the years of a formal diplomatic relationship with China for country j in year t (provided by Ministry of Foreign Affairs) [55] to capture the cultural communication and convergence process. Hong Kong uses 1997 and Macau uses 1999 as the beginning year. For those countries/regions without a formal diplomatic relationship with China, we assumed Tjt to be 0.5 years to allow the inverse of Tjt in Equation (1). Higher values of cdjt indicate more cultural distance of host countries from China. We also tried the exploratory factor analysis for these six variables. However, one principal component with an eigenvalue of 1.68 only accounted for 51.8% of the variance. In addition, most of the loadings on this component were less than 30%. The overall KMO measure was only 0.531 for sampling adequacy, suggesting a complex pattern of national culture against factor analysis
3.3. Control Variables
We controlled the business regulations and their enforcement in the host countries by using the Doing Business data from the World Bank [56], which provides objective measures of business regulations and their enforcement according to 10 sets of indicators. These are combined into an overall ease of the doing business index (dbi), with higher values suggesting better business regulations and enforcement. Better business environment in the host countries is supposed to attract more FDI from China [36,40]. Hence, the above institutional quality variable (wgi) mainly concerns the political governance situations, while the doing business index mainly concerns the business governance situations in the host countries.
We also controlled the labor force (lab, % population), the economic structure (indserv, a ratio of an industrial sector to a service sector), OBOR country dummy (obor = 1 for OBOR countries) and OBOR year dummy (post = 1 for the years after 2013). Table 1 presents the descriptive statistics of all dependent variables, main explanatory variables, and control variables.
4. Methodology
Following the above discussion, the log-linear ordinary least square (OLS) estimation based on an expanded gravity model for determinants of China’s OFDI [10,54] was written as
where China’s OFDI into the host country j in year t could be positively associated with natural resources (α1 > 0), market size (α2 > 0), infrastructure facilities distance (α3 > 0), and institutional distance (α4 > 0), but negatively associated with cultural distance (α5 < 0) of host countries. In addition, for control variables in the vector of Xjt, better business environment and more labor resources in the host countries could encourage China’s OFDI. The industrialization of the host countries might have a competition relationship with Chinese investment, which would have a negative effect on FDI.
lnrofdijt = α0 + α1nrjt + α2lnrgdpjt + α3fdjt + α4idjt + α5cdjt + α6Xjt + Yt + εjt
We followed the existing literature [1,2,57,58], and employed the DID setting to estimate the OBOR initiative’s effect on China’s OFDI and the year dummies to capture the dynamics of the macro-economy in a specific year. The two-year period from 2014 to 2015 was the post-initiative period (OBOR initiative dummy, post = 1), and correspondingly, the three-year period of 2010–2013 was the pre-initiative period (post = 0). The two-year period from 2014 to 2015 should be long enough for Chinese investors to adjust their investment patterns in response to the announcement of the OBOR initiative.
We also constructed country dummies of OB, OR, and OBOR, and used the non-OBOR countries as a baseline group. The absence of OBOR policy for these non-OBOR countries provides a meaningful control group for China’s OFDI. Hence, we could control the global trend in China’s OFDI in our regression analysis. Table A1 and Figure A1 in the Appendix show the list of the OB (49), OR (25), and non-OBOR (142) countries. The DID estimation equation is specified as
where β1 reflects the effect of OBOR countries compared with non-OBOR countries before the initiative, β2 reflects the incremental effect of OBOR countries after the initiative, and the effect of non-OBOR after initiative is reflected into the separated term post in regression to capture the spillovers of OBOR initiative which is absorbed by year dummies. The OBOR initiative might have been based on a better investment history in the OBOR countries than those outside even before the initiative, so β1 > 0 was expected. China’s OFDI in the host country j in year t could be positively associated with OBOR initiative, so we expected β2 > 0. In order to test Hypotheses 1–5, we inserted dummies of OBOR and OBOR*post with natural resource endowment, market size, infrastructure facilities distance, institutional distance, and cultural distance, which was shown as
lnrofdijt = β0 + β1OBORj + β2OBORjpost + β3nrjt + β4lnrgdpjt + β5fdjt + β6idjt +
β7cdjt + β8Xjt + Yt + εjt
β7cdjt + β8Xjt + Yt + εjt
lnrofdijt = β0 + β1OBORj + β2OBORj × post + β31nrjt + β32nrjt × OBORj + β33nrjt × OBORj × post
+ β41lnrgdpjt + β42lnrgdpjt × OBORj + β43lnrgdpjt × OBORj × post
+ β51fdjt + β52fdjt × OBORj + β53fdjt × OBORj × post
+ β61idjt + β62idjt × OBORj + β63idjt × OBORj × post
+ β71cdjt + β72cdjt × OBORj + β73cdjt × OBORj × post
+ β8Xjt + Yt + εjt
+ β41lnrgdpjt + β42lnrgdpjt × OBORj + β43lnrgdpjt × OBORj × post
+ β51fdjt + β52fdjt × OBORj + β53fdjt × OBORj × post
+ β61idjt + β62idjt × OBORj + β63idjt × OBORj × post
+ β71cdjt + β72cdjt × OBORj + β73cdjt × OBORj × post
+ β8Xjt + Yt + εjt
According to Hypotheses 1–5, β33, β43, β53, β63, and β73 were expected to be positive. The OLS method was adopted to estimate the DID, in Equations (3) and (4). These estimations were weighted by the population of each country (pop), which is a standard approach to account for country heterogeneity [59].
In the above DID estimation, we assumed that the selection of OBOR countries was random. To correct the potential selection biases addressed by investment and international trade literature [60,61,62,63,64], we combined the above DID approach with propensity score matching (PSM) techniques to estimate the causal impacts of the OBOR initiative on China’s OFDI. The evaluation of a treatment effect of the OBOR initiative involved comparing China’s actual OFDI outcome with the counterfactual situation, where the OBOR countries were not included in the OBOR initiative, and was written as
where OFDIpost1 stands for the China’s OFDI in an OBOR country during the post-initiative period of 2014–2015 after the treatment year of t; OFDIpost0 is China’s OFDI if it is not an OBOR country; Xt−1 contains the set of is a dummy variable of countries being included in the OBOR initiative in year t.
E(OFDIpost1 − OFDIpost0|Xt−1,OBORt = 1) = E(OFDIpost1|Xt−1,OBORt = 1) −
E(OFDIpost0|Xt−1,OBORt = 1)
E(OFDIpost0|Xt−1,OBORt = 1)
However, the counterfactual performance OFDIpost0 is unobservable. To construct a comparable baseline group of host countries and reduce the dimensionality problem, we relied on Rosenbaum and Rubin’s [65] approach to use the probability included in the OBOR initiative (OBORt = 1) conditional on the ex-ante characteristics of countries (Xt−1), which includes the pre-entry characteristics of a country, captured by the main explanatory variables and control variables in period t − 1 [66]. A logit model was implemented to predict the probability of being selected as an OBOR country as the propensity score and was described as
where the cumulative logistic probability function is represented as Λ.
According to the propensity score, each OBOR country was matched to an actual non-OBOR country using the one-to-one nearest neighbor matching method. Hence, we combined the DID setting with the matching techniques and relaxed the strong assumption of random selection [67]. This allowed the OBOR initiative to be based on the expected pre-entry characteristics of a country and on an unobservable time-invariant [68]. Therefore, the DID estimator was expressed as
PSMDID = E(OFDIpost1 − OFDIt−11|Xt−1,OBORt = 1) − E(OFDIpost0 −
OFDIt−10|Xt−1,OBORt = 0)
OFDIt−10|Xt−1,OBORt = 0)
Equation (7) can be operationalized by estimating a regression equation including all main explanatory and control variables as
where Δlnrofdij,post denotes the changes in China’s real log form OFDI in the host country j after the OBOR initiative year t, and β denotes the effect of the OBOR initiative on China’s OFDI, which is estimated by applying the population-weighted OLS regression of Equation (3) to the matched dataset.
Δlnrofdij,post = β0 + β1OBORjt + β2nrjt + β3lnrgdpjt + β4fdjt + β5idjt + β6cdjt
+ β7Xjt + Yt + εit
+ β7Xjt + Yt + εit
5. Empirical Results
5.1. Baseline Results
Table 2 presents the baseline results of the estimation using Equations (2)–(4). The first column is a simplified specification only including dummies of OBOR, OBOR*post, and years. China’s OFDI in the OBOR countries was about 40% higher than in the non-OBOR countries before the initiative, suggesting a good foundation of international investment in these countries. After the initiative, China’s OFDI increased by 46.2% in the OBOR countries. These results revealed that the OBOR initiative has better stimulated China’s OFDI in these related countries after the announcement in 2013 compared with other countries outside the OBOR group, which is consistent with the findings reported by Liu et al. [3] and Du and Zhang [1].
As Column (2) adds the main explanatory variables to the regression using Equation (3) and the coefficient of OBOR becomes significantly negative (−39.2%), China’s higher OFDI in the OBOR countries before the initiative in Column (1) is actually due to the variation in the main explanatory variables across two country groups. The significant difference between the OBOR and non-OBOR countries also supports the application of the matching DID approach in the next section. The OBOR*post coefficient did not change greatly (42.2%), demonstrating the positive policy effect of the OBOR initiative still holds for China’s OFDI. Moreover, resource-seeking motivation was significant for China’s OFDI. With the share of natural resource rent in GDP increased by 1% in the host countries, FDI from China would have increased by 4.4%, which is consistent with the existing literature that considered China’s OFDI highly resource-motivated [13,14,22]. China’s OFDI was also motivated by market-seeking, as a 1% increase in market size increased China’s OFDI by 0.677%.
Infrastructure facility distance is able to well attract China’s OFDI. A one-point increase in infrastructure facility distance from China, that is, a standard deviation of the infrastructure facility factor (infra), improved the OFDI from China by 64.8%. This suggested that China tended to invest in countries with greater infrastructure facility distance. Since we defined the infrastructure facility distance variable (fd) as the absolute difference between host countries and China, either better or worse infrastructure in the host countries could well attract China’s OFDI. Existing literature [31,69,70,71] confirms that better infrastructure of the host countries means better investment environment, which has a positive effect on FDI inflow. On the other hand, Liu et al. [3] and Du and Zhang [1] argued that China’s OFDI is so infrastructure-led that China’s foreign investments are mainly large infrastructure construction projects. Hence, a host country that lacks infrastructure facilities brings more opportunity to China, especially for those poor countries with less technology and fewer finance channels for large infrastructure projects. Thus, the infrastructure facility distance (either better or worse) of host countries from China has a positive effect on China’s OFDI.
Institutional distance can also attract China’s OFDI. A one-point increase in institutional distance from China, that is, a standard deviation of the institutional quality factor (wgi), attracted more OFDI from China by 32.3%. Hence, China’s OFDI preferred countries with institutional distance. Many authors, such as Buckley et al. [10], found a positive association between high institutional quality and China’s OFDI. On the contrary, Amighini et al. [12] argued that the weak governance of low-income countries encourages Chinese FDI. China’s OFDI might take advantage of low-quality institutions of host countries to obtain the privileges in terms of resources, markets, and infrastructure projects [1]. Hence, a host country that lacks high-quality institutions might present more opportunities for China’s OFDI, which indicates the positive effect of institutional distance on institution-based OFDI from China into the host countries.
However, cultural distance of the host countries has a significantly negative effect on China’s OFDI. A one-point increase in cultural distance from China decreased China’s OFDI by 28.8%. This confirms the previously reported cultural proximity as a positive determinant of China’s OFDI [10,41,42,43,44]. Therefore, the results in Column (2) supported the motivations of both resource-seeking and market-seeking in Hypotheses 1 and 2, the positive effect of infrastructure facility distance and institutional distance in Hypotheses 3 and 4, and the negative effect of cultural distance in Hypothesis 5.
Column (3) adds the control variables to the regression using Equation (3). The main change is that the institutional distance variable becomes insignificant, the positive effect of which is captured by the doing business index (dbi). A one-point increase in dbi more strongly attracted China’s OFDI by 1.4%, so a standard deviation increase in dbi (13.78 points in Table 1) increased China’s OFDI by 19.3%. It suggested that China tended to invest in better business environments, regardless of their political governance, and Chinese multinationals are more sensitive to business governance than political institutional quality.
Liu et al. [3] provided two reasons for China’s OFDI being indifferent to host countries’ political instability. First, as the main driving force of China’s OFDI being guided by the government, the investment behavior of Chinese state-owned enterprises (SOEs) is motivated by both profit and political overtones. Hence, in countries with higher political risk, government support may effectively compensate for Chinese SOEs’ investment loss [72]. Second, the political relations between China and potential hosts affect firms’ FDI. Countries with long-term relationships tend to attract more FDI [73], whereas these countries might not have high-quality political institutions. For instance, African countries with long-term political relationships with China have improved their economic relationship since 2000 and have more strongly attracted China’s OFDI [7]. Thus, China’s OFDI might prefer better business environments to better political governance.
In addition, labor force is considered as a kind of resource of the host countries. As China’s domestic labor costs keep rising, the rich labor force in the host country may motivate these resource-seeking investors from China. With a 1% increase in labor force proportion of host countries, Chinese FDI increased by 5.2%. When the labor cost increases in China, the efficiency-seeking motive might become stronger in China’s OFDI. However, we have no data for wage costs for each country in this study. The labor force variable here was rather like a resource-seeking measure than an efficiency-seeking measure. However, the economic structure had no significant effect on Chinese FDI.
5.2. Hypothesis Testing
Using the DID estimation results in Column (4) of Table 2, we tested Hypotheses 1–5. First of all, there was no evidence that the OBOR initiative boosted the resource-seeking motivation of OFDI from China. The resource-seeking motivation was still significantly positive for the non-OBOR countries (nr, 7%), but there was no significant difference between OBOR and non-OBOR countries before (nr*OBOR, −1.1%, insignificant) and after (nr*OBOR*post, −2.7%, close to 10% significance level). This finding is in line with Liu et al.’s [3] conclusion that China’s OFDI does not see OBOR countries as natural resources providers. The negative sign and proximity to the 10% significance level for the coefficient of the after-initiative interaction even suggests the OBOR initiative has, to some degree, reduced the resource-seeking motivation of China’s OFDI in the OBOR countries. Thus, Hypothesis 1 for the initiative’s boosting effect on the resource-seeking motivation in the OBOR countries was not supported by our study.
Second, the OBOR initiative boosted Chinese market-seeking motivation in the OBOR countries. The market-seeking motivation was significantly positive for the non-OBOR countries (lnrgdp, 0.708). However, the market-seeking motivation of China’s OFDI was significantly lower in the OBOR countries before the initiative (−0.265), which was strengthened by the OBOR initiative after 2013 (0.185). Liu et al. [3] also argued that China’s OFDI in the OBOR countries was mainly motivated by market-seeking and domestic manufacturing capacity transfer. Thus, Hypothesis 2 of the initiative’s boosting effect on the market-seeking motivation was supported by evidence in the OBOR countries.
Third, the OBOR initiative does not appear to boost the positive effect of infrastructure distance on Chinese OFDI in the OBOR countries. The infrastructure distance had a significantly positive effect on China’s OFDI in the non-OBOR countries (fd, 1.197). However, there was no significant increase for interactions with dummies for OBOR countries (fd*OBOR, 0.009, insignificant) for years after the initiative (fd*OBOR*post, 0.366, insignificant). This indicates that the positive effect of infrastructure distance on the OBOR countries was not significantly different from the non-OBOR countries, either before or after the initiative. Infrastructure distance of host countries, either further or shorter, in the OBOR or non-OBOR countries, similarly attracted China’s OFDI. For instance, the developed non-OBOR countries, such as the U.S., the United Kingdom, and Switzerland attracted Chinese investment by using their better infrastructure environment, whereas developing OBOR countries, such as Azerbaijan, Kazakhstan, and Pakistan, provided more investment opportunities. Hence, foreign investment with the Chinese government’s stimulus packages—such as financial support and Chinese currency (RMB) settlement—may not be outlets in the OBOR countries after initiative implementation to absorb the excess productivity of the Chinese construction industry. The OBOR policy had no significantly complementary effect on the infrastructure facilities in the OBOR host countries, so did not lead to more investment in that country. Thus, Hypothesis 3 of the boosting effect of the OBOR initiative with infrastructure-led China’s OFDI in the OBOR countries was not supported by our study.
Fourth, China’s OFDI has been positively related to the institutional distance in the non-OBOR countries (19.9%) as expected by institution-based theory. The positive effect of political institutional distance might be partially captured by the doing business index (1.3%), so it was not significant here. The institution-based OFDI was significantly lower in the OBOR countries before and after the initiative (−1.139), whereas the OBOR initiative after 2013 did not add any significant increase in China’s OFDI in these countries. Hence, Chinese investors have not taken advantage of the OBOR countries’ institutional environment before or after the initiative, suggesting the existence of a good foundation of institutional cooperation. China’s OFDI is not institution-based in the OBOR countries, and the larger institutional distance has actually impeded OFDI from China. International policy coordination and cooperation under the OBOR initiative aim to reduce the political uncertainty and risks in the OBOR countries. It was found that the reduction in the institutional distance of OBOR countries could increase Chinese FDI in these countries, supporting the mitigating effect on institution-based OFDI in Hypothesis 4.
Finally, cultural distance was significantly negative in the non-OBOR countries (cd, −35%) as expected given previous reports such as Buckley et al. [10]. The negative effect of cultural distance was significantly lower in the OBOR countries, both before (34.1%) and after the initiative (−5.5%, which is insignificantly different from pre-initiative period). This suggested that even the cultural distance has a significantly negative effect on China’s OFDI in the OBOR countries. The long history of cultural communication between China and these OBOR countries has been helpful for Chinese oversea investment by alleviating the negative effect of cultural distance. The OBOR initiative might not have increased the cultural convergence in the short term, but it is a continuation of the long ‘harmony in diversity’ tradition of cultural communication with these OBOR countries. Thus, Hypothesis 5 was supported by our study.
We thank one of the anonymous reviewers for highlighting the potential endogeneity issue in our estimation. We estimated the results in Table 2 by using Generalized Method of Moments (GMM), where lagged values of the explanatory variables of infrastructure distance, institutional distance, and cultural distance were used as instruments. The GMM IV results were not significantly different from the ones presented in Table 2. In all estimated equations, whereas the Hansen J statistics were insignificant and suggested valid instruments, and C statistics were also insignificant and indicated efficiency loss in GMM IV results. Therefore, in the remainder of this paper, we present only OLS estimation results. Interested readers can contact the authors for instrumented results.
5.3. Results by Country Group
DID results by groups of OB, OR, and non-OBOR countries are presented in Table 3. Columns (1) and (2) replace the OBOR dummy with dummies for OB and OR countries, and re-estimate the effect of the OBOR initiative on China’s OFDI by using Equation (3). Hence, the OBOR countries are classified into the land belt (OB) countries and the sea road (OR) countries. We found that China’s OFDI was significantly higher in the OR countries before (60.3%) and after (57.6%) the initiative. All main explanatory and control variables had similar results to those in Table 2.
Another scenario is presented separately in Columns (3)–(5) in Table 3 for the three country groups. A significantly positive association between China’s OFDI and natural resources endowments was found in all OB (2.8%), OR (19.4%), and non-OBOR (5.9%) countries, but obviously the resource-seeking motivation was the most prominent in the OR countries. China’s OFDI in the OB countries (1.063) was more market-seeking motivated than in the OR (0.322) and non-OBOR (0.786) countries. Moreover, China’s OFDI was more infrastructure-led in the OB countries (1.818) than in the OR countries (0.914) and non-OBOR countries (1.394). The effect of institutional distance on China’s OFDI was significantly lower in the OB countries (−1.898) than in the OR countries and non-OBOR countries in which the effects were insignificant. A significant negative relationship between China’s OFDI and cultural distance was found in all OB (−46.3%), OR (−33.8%,) and non-OBOR (−30.9%) countries, but the relationship was larger and more significant in the OB countries.
Next, for control variables, the doing business index was only significantly positive in the OR countries (3.8%), but insignificant in the other two groups. Similar to natural resources, the labor force was more significantly positive in the OR (5.4%) and non-OBOR (3.7%) countries than in the OB countries (insignificant), suggesting more resource-seeking motivation. Industrialization showed a significantly negative effect only in the non-OBOR countries (−9.2%), which may have a competitive economic structure with China.
Finally, the year dummies captured the policy effect of the OBOR initiative. As shown in Columns (1) and (2) of Table 3, the strongest effect was found in the OR countries, increasing from 0.95 in 2012 to 1.326 in 2015. There was only a temporary policy shock for the OB countries in 2014 (0.65), whereas the spill-over effects in the non-OBOR countries were lower in 2014 (0.495) and quickly declined in the next year (−0.467). Therefore, we conclude that the OBOR initiative had a more significantly positive effect on the maritime road (OR) countries. Du and Zhang [1] found that China’s OFDI rose more significantly in countries along the continental route than the maritime road. This finding is perhaps because they employed firm-level data from the China Global Investment Tracker, which only includes investment projects more than USD $100 million. At the same time, China’s OFDI in the OR countries is more natural resource- and labor-seeking and more sensitive to doing business environment than in the OB countries.
The OBOR initiative only created a temporary policy shock for the continental belt (OB) and non-OBOR countries. The long term and spill-over effects of the initiative in these countries still requires more evidence. China’s OFDI in the OB countries is more market-seeking motivated, more infrastructure-led, and more sensitive to institutional and cultural distance from China. The OBOR initiative—which aimed to improve international political cooperation, policy coordination, government support, and cultural communication—could have a more effective influence on Chinese FDI in the OB countries. These results also confirm the country heterogeneity and selection bias problem in the policy study of the OBOR initiative, creating a call for better control of the DID approach. Hence, in the next section, we employ PSM DID to perform the sensitivity tests for our baseline results.
5.4. Matching and DID Results
5.4.1. Logit Estimation
We first estimated the probability of being selected as an OBOR country using the matching equation shown in Equation (6). Table 4 presents the estimation results using the logit model. All explanatory variables (except the year dummies) were lagged one year in the matching process to provide more consistent estimates of coefficients [74,75].
Natural resources was negatively related to the probability of being selected as an OBOR country (−0.016), whereas the market size was positively associated with the selection chance (0.57). This is consistent with our findings that the OBOR initiative was not seeking natural resources providers, but was more motivated by market-seeking and domestic manufacturing capacity transfer [3]. Infrastructure distance (−1.538) and cultural distance (−1.288) had a negative effect on the selection of OBOR country, suggesting that infrastructure similarity and cultural proximity are important criteria for the entry into the initiative. Additionally, the Chinese government’s selection was neither based on political institutional distance nor business environment. Nor did the initiative aim to seek labor force resources or complementary economic structures in the OBOR countries.
The purpose of the OBOR initiative is to create regional economic cooperation and joint prosperity. Harmony and inclusiveness are basic principles, so the OBOR initiative is open and cooperative in nature and does not exclude any interested parties [2]. It is not surprising that some interested developed countries, such as Belgium, France, Germany, Israel, Italy, Japan, Korea, and Singapore, are also included in the initiative. Therefore, the selection pattern of OBOR countries reflects two sides of the harmony in diversity tradition. On the one hand, the Chinese government is seeking partnership in terms of market cooperation, policy coordination of infrastructure facility, and further cultural communication and convergence. This is called ‘qiú tóng’, which means seeking common ground. On the other hand, the Chinese government’s selection is avoiding natural resource- and labor-seeking, and allowing diversity in political and business institutions and economic structure. This is called ‘cún yì’, which means reserving difference. Thus, the OBOR selection principle of seeking common ground and reserving difference—in other words, agreeing to disagree—reflects the most important tradition of harmony in diversity followed by the OBOR initiative.
5.4.2. Matching Procedure
In order to examine the impact of the OBOR initiative on the China’s OFDI into the host countries, we attempted to match each OBOR country with a non-OBOR country that had the most similar propensity score. The balancing test results from the matching procedure are shown in Table 5. In order to gauge the pre-entry difference between the OBOR and non-OBOR countries, the covariates of the logit equation using the matched sample were compared with the unmatched sample. In this paper, standardized differences between OBOR and the matched non-OBOR countries should be lower compared to the un-matched sample. For instance, the bias in the lagged market size (L.lnrgdp) was reduced by 74.9%. The bias of lagged cultural distance (L.cd) was reduced by 97.4%. A similar pattern was also found for lagged labor force (L.lab, bias reduction 16.7%). For the overall propensity score (_pscore), the bias was reduced by 99.9%, suggesting a good match overall.
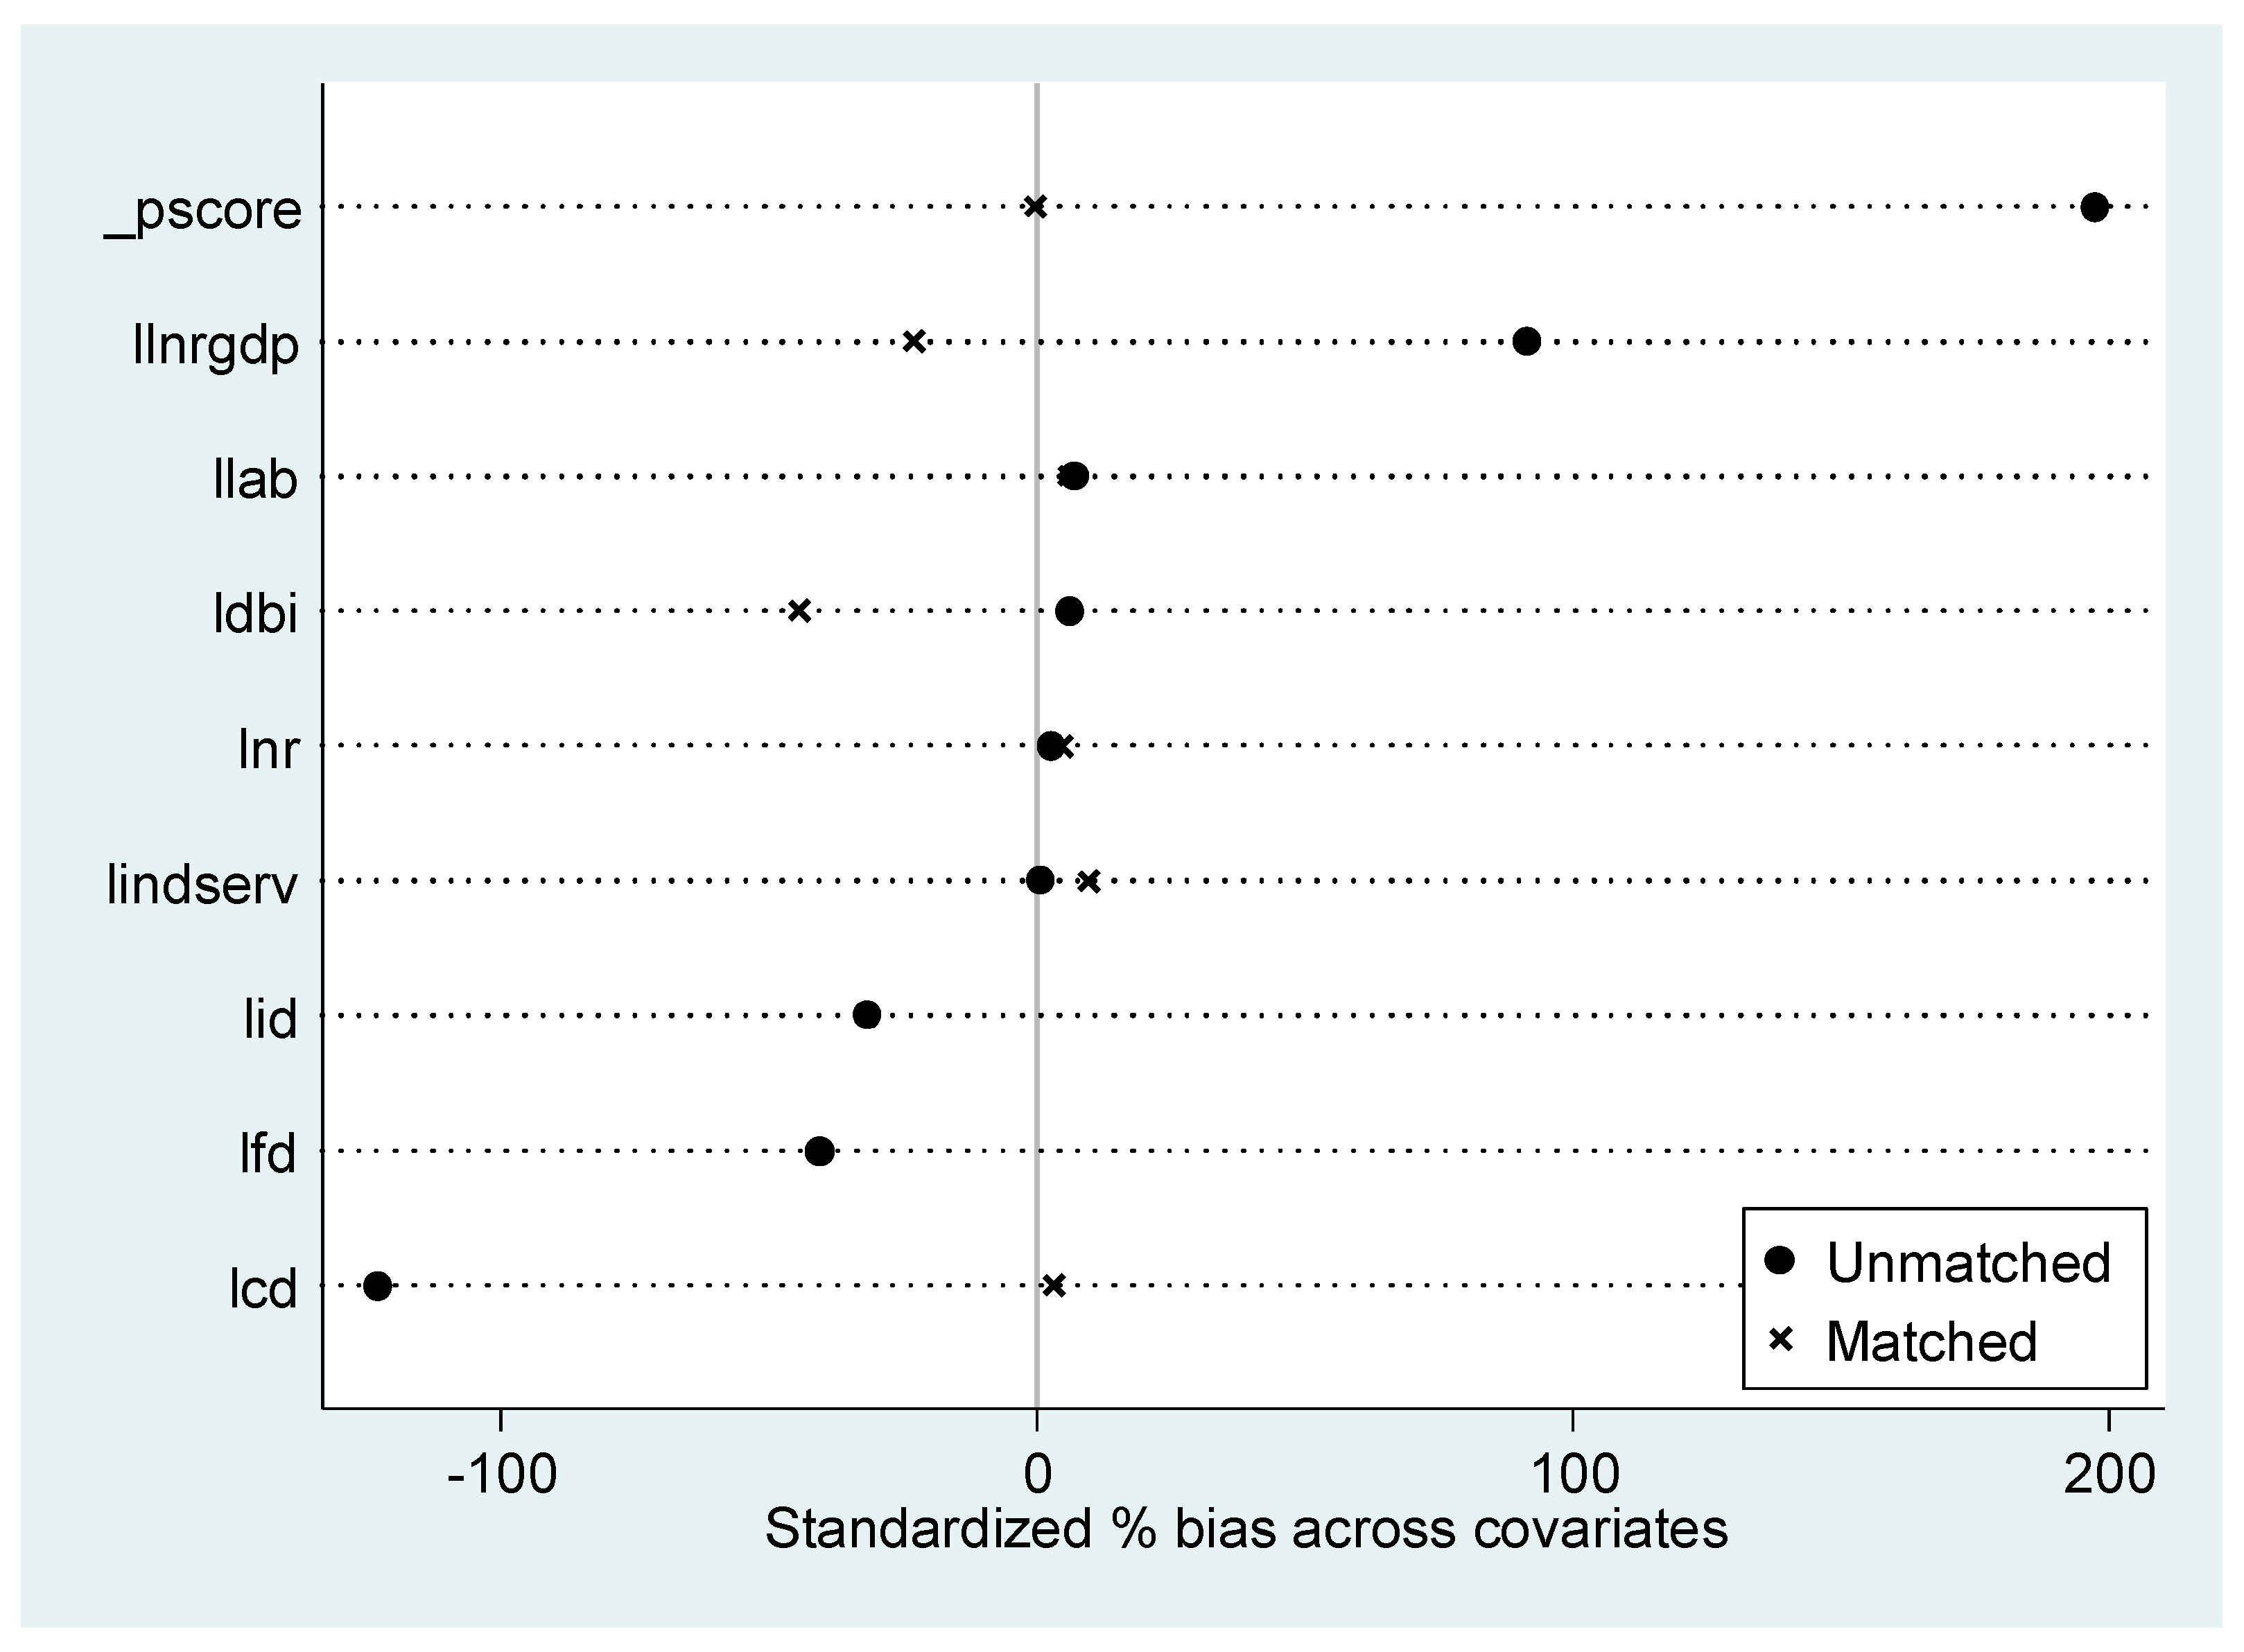
For other explanatory and control variables, the selection biases were too small to be relevant in the selection of OBOR countries. Selection biases were too small for variables such as the natural resource (L.nr, 2.7%), doing business index (L.dbi, 6.4%), and economic structure (L.indser, 0.8%), or changed little after matching, such as infrastructure facility distance (L.fd, −0.3%) and institutional distance (L.id, −1.1%). Thus, these variables were basically random factors in the selection process that did not need matching to correct the biases, or the matching approach could not reduce the biases (Figure 2). This is consistent with our findings in Table 4, which showed that the Chinese government’s selection was not based on political institutional distance or business environment. Neither did the initiative aim to seek natural or labor resources nor complementary economic structure. The selection was more concerned with the market potential and the cultural distance of the host countries.
These results were confirmed when performing t-tests for the equality of means in OBOR and non-OBOR countries, without significant differences in the selection variables between the two groups after matching. For instance, the difference in cultural distance (L.cd) between the OBOR and non-OBOR countries was significant (p = 0.00) in the unmatched sample, but insignificant (p = 0.655) in the matched sample. The test statistics showed that the propensity score (_pscore) differences between the OBOR and non-OBOR countries was significant (p = 0.00) in the unmatched sample, but were small and insignificant (0.98) between the OBOR countries (treatment group) and the matched non-OBOR countries (control group). Hence, improvements in the estimation validity and reliability are mainly due to the bias reduction of the cultural distance variable.
Figure 2 depicts how the matching procedure reduced the selection biases by decreasing the differences in the covariates between the matched and unmatched samples. The very similar propensity score (_pscore) of the OBOR (treated) and non-OBOR (untreated) countries in the matched sample is presented at the top of Figure 2, which is around the zero vertical line. However, its unmatched sample is on the right-hand side of the zero vertical line. Obviously, the main improvement was due to the cultural distance at the bottom (L.cd, unmatched at the left-hand side, matched at the vertical line) and the market size at the top of Figure 2 (L.lnrgdp, unmatched at the right-hand side, matched at the zero vertical line). For the other variables, the biases were too small, and hence, bias reduction could be ignored. The comparison between the OBOR and non-OBOR countries in the matched sample supports DID estimation on the treatment effect of the OBOR initiative. Hence, the propensity score matching (PSM) should have provided a more valid and reliable comparison group of the non-OBOR countries with the OBOR countries to estimate the impact of the OBOR initiative.
5.4.3. Difference-in-Differences Estimation
We estimated Equation (8) by applying a population-weighted OLS regression in Equations (3) and (4) to the matched dataset. Table 6 presents the results estimated using the matching DID method for China’s OFDI. First of all, the coefficient significance of the OBOR dummies disappeared in Column (1). This suggests that the OBOR initiative did not affect China’s OFDI if the economic, institutional, and cultural characteristics of the non-OBOR countries were similar to those of the OBOR countries. Hence, the OBOR initiative is a Chinese national strategy for economic integration and a partnership with the selected OBOR countries.
Second, Column (2) adds the main explanatory variables to the regression using Equation (3). The coefficient of the OBOR dummy was still significantly negative (−30.3%), as in Table 2, but the coefficient of the interaction OBOR*post became insignificant. Resource-seeking (4.2%) and market-seeking (0.679%) motivations were still significantly positive for China’s OFDI. Infrastructure facility distance (74.4%) and institutional distance (23.9%) attracted more China’s OFDI, as cultural distance still had a significantly negative effect on China’s OFDI (−24%).
Third, Column (3) adds the control variables to the regression using Equation (3). Labor force was still considered as a kind of endowment that more strongly attracts OFDI from China (4.6%). The main change is that the significance of the coefficients of both institutional distance and doing business variables disappeared. Additionally, the industrialization of host countries had a significantly negative effect on Chinese FDI (−12.4%). China’s OFDI was insensitive to political and business governance of the host countries, but was more sensitive to the competition of local industrialization if those non-OBOR countries had similar characteristics to the OBOR countries. Thus, DID estimation using the matched data did not change our basic conclusion, except that the effect of political and business governance of the host countries was less effective, and complementary economic structure became more important.
Finally, the estimation result using Equation (4) is presented in Column (4) of Table 6. Hypothesis 1 was not supported by the matching DID results, as the OBOR initiative might have decreased the resource-seeking motivation of OFDI from China (−0.03, nearly significant at the 10% level). However, Hypothesis 2 on the boosting effect of the OBOR initiative on the market-seeking motivation in the OBOR countries was supported (0.276 after the initiative). Hence, the OBOR initiative boosted the market-seeking motivation rather than the resource-seeking motivation in the OBOR countries, even after we controlled for the potential selection biases. Moreover, there was no significantly increasing effect of the initiative on the positive effect of infrastructure distance. Since the OBOR initiative did not boost the infrastructure-led OFDI in the OBOR countries, Hypothesis 3 was not supported by matching DID results. Hypothesis 4 was supported by the mitigating effect on institution-based OFDI before (−0.824) and after (−0.221) the initiative in the OBOR countries. Cultural distance was significantly negative in the non-OBOR countries (−25.5%), whereas the increasing effect of the OBOR countries on China’s OFDI was still significantly positive (28.4%). The OBOR initiative continues the long tradition of cultural convergence with these OBOR countries, which supported Hypothesis 5. Therefore, the matching DID results did not change our basic conclusions about the hypotheses.
6. Conclusions
China’s OFDI has increased significantly. This paper estimates the treatment effects of the OBOR initiative on China’s OFDI by combining a DID estimator with matching techniques. We found that China’s OFDI in the OBOR countries was about 40% higher than in the non-OBOR countries, suggesting a good foundation of international investment even before the initiative. After the initiative, the OFDI from China increased by 46.2% in the post-announcement period of 2014–2015. These results revealed that the OBOR initiative has stimulated China’s OFDI in these related countries after 2013, compared with other countries outside the OBOR. Further analysis showed that the growth in China’s OFDI mainly occurred in the Maritime Silk Road (OR) countries rather than in the Continental Economic Belt (OB) countries.
However, after we controlled the heterogeneity across the OBOR and non-OBOR countries by using the matching approach, the significance of the stimulating effect of the OBOR initiative disappeared for China’s OFDI. This confirmed that the boosting effect of OBOR initiative on China’s OFDI, rather than a pure policy effect, mainly reflects the different economic, institutional, and cultural characteristics of the OBOR countries from the non-OBOR countries. It is also worth noting that Chinese partnership with the OBOR countries is not due to random selection. On the contrary, the OBOR countries have been carefully assessed based on country’s characteristics—such as natural resources, market size, infrastructure, institutional distance, and culture proximity—in which cultural proximity and market size were especially important for inclusion into the initiative. However, the political and business institutions, labor resources, and economic structure of host countries were not as important as expected in the selection process, reflecting a principle of seeking common ground while maintaining differences, i.e., ‘qiú tong cún yì’.
We also found the OBOR initiative reduced the resource-seeking motivation and boosted the market-seeking motivation of China’s OFDI. Our results cast doubts on the infrastructure-led and institution-based strategy of the OBOR initiative, but supported the boosting effect of the OBOR initiative on institutional cooperation and cultural convergence. Especially, cultural proximity represents two sides of the same coin, so it is not only the most important criteria to be included in the OBOR initiative, but also the most important factor in attracting China’s OFDI. The harmony in diversity belief is deeply rooted in Chinese philosophy in reducing the cultural obstacles for political and economic cooperation between countries. Thus, the OBOR initiative is a sustainable continuation and development of the long tradition of economic, institutional, and cultural convergence with the OBOR countries, rather than a temporary policy shock.
There are some limitations to be addressed in future research. First, we focused primarily on country characteristics as antecedent factors of OBOR country selection, so our model does not account for other possible drivers. Second, our dataset was constructed by archival and country-level data from many data sources (mainly from the World Bank), which might be more consistent and reliable than survey-based studies since all data were aggregated by national statistics departments. Future research may focus more on case studies and survey-based data covering companies, which may allow us to obtain more proxies. Additionally, there are many giant Chinese companies—such as Alibaba, JD.com, and Tencent—which acquire foreign technologies and assets [76], but these were not studied in detail. If future research can include these Chinese firms’ foreign investment, conclusions could be more convincing.
Author Contributions
Conceptualization, L.K., Y.Z. and A.P.; Data curation, F.P.; Funding acquisition, L.K. and F.P.; Investigation, L.K. and F.P.; Methodology, L.K., Y.Z. and A.P.; Supervision, Y.Z.; Visualization, F.P.; Writing—original draft, L.K. and F.P.; Writing—review & editing, L.K. and F.P.
Funding
This research was funded by the China National Social Science Fund (No. 14BJL028); the Shanghai Young Eastern Scholar (No. QD2015049) and the Shanghai Dawn Scholar (No. 15SG53).
Conflicts of Interest
The authors declare no conflict of interest.
Appendix A

Table A1.
Country categorization of the Silk Road Economic Belt (One Belt, OB), the New Maritime Silk Road (One Road, OR), and non-OBOR.
Table A1.
Country categorization of the Silk Road Economic Belt (One Belt, OB), the New Maritime Silk Road (One Road, OR), and non-OBOR.
| OB (49) | OR (25) | Non-OBOR (142) |
|---|---|---|
| Afghanistan, Albania, Armenia, Azerbaijan, Belarus, Belgium, Bhutan, Bosnia and Herzegovina, Bulgaria, Czech, Estonia, France, Georgia, Germany, Hungary, Iran, Iraq, Israel, Jordan, Kazakhstan, Kuwait, Kyrgyzstan, Latvia, Lebanon, Lithuania, Macedonia, Moldova, Mongolia, Montenegro, Nepal, Netherlands, Oman, Pakistan, Poland, Qatar, Romania, Russia, Saudi Arabia, Serbia, Slovakia, Slovenia, Syria, Tajikistan, Turkey, Turkmenistan, Ukraine, United Arab Emirates, Uzbekistan, Yemen | Bahrain, Bangladesh, Brunei, Cambodia, Croatia, Cyprus, East Timor, Egypt, Greece, India, Indonesia, Italy, Japan, Kenya, Laos, Malaysia, Maldives, Myanmar, Nigeria, Philippines, Singapore, South Korea, Sri Lanka, Thailand, Vietnam | Algeria, American Samoa, Andorra, Angola, Antigua and Barbuda, Argentina, Aruba, Australia, Austria, Bahamas, Barbados, Belize, Benin, Bermuda, Bolivia, Botswana, Brazil, British Virgin Islands, Burkina Faso, Burundi, Cabo Verde, Cameroon, Canada, Cayman Islands, Central African Republic, Chad, Channel Islands, Chile, Colombia, Comoros, Congo, Dem. Rep., Congo, Rep., Costa Rica, Cote d'Ivoire, Cuba, Curacao, Denmark, Djibouti, Dominica, Dominican Republic, Ecuador, El Salvador, Equatorial Guinea, Eritrea, Ethiopia, Faroe Islands, Fiji, Finland, French Polynesia, Gabon, Gambia, Ghana, Gibraltar, Greenland, Grenada, Guam, Guatemala, Guinea, Guinea-Bissau, Guyana, Haiti, Honduras, Hong Kong SAR, Iceland, Ireland, Isle of Man, Jamaica, Kiribati, Korea, Dem. People’s Rep, Kosovo, Lesotho, Liberia, Libya, Liechtenstein, Luxembourg, Macau SAR, Madagascar, Malawi, Mali, Malta, Marshall Islands, Mauritania, Mauritius, Mexico, Micronesia, Monaco, Morocco, Mozambique, Namibia, Nauru, New Caledonia, New Zealand, Nicaragua, Niger, Northern Mariana Islands, Norway, Palau, Panama, Papua New Guinea, Paraguay, Peru, Portugal, Puerto Rico, Rwanda, Samoa, San Marino, Sao Tome and Principe, Senegal, Seychelles, Sierra Leone, Sint Maarten (Dutch Part), Solomon Islands, Somalia, South Africa, South Sudan, Spain, St. Kitts and Nevis, St. Lucia, St. Martin (French Part), St. Vincent and The Grenadines, Sudan, Suriname, Swaziland, Sweden, Switzerland, Tanzania, Togo, Tonga, Trinidad And Tobago, Tunisia, Turks and Caicos Islands, Tuvalu, Uganda, United Kingdom, United States, Uruguay, Vanuatu, Venezuela, RB, Virgin Islands (U.S.), West Bank and Gaza, Zambia, Zimbabwe |
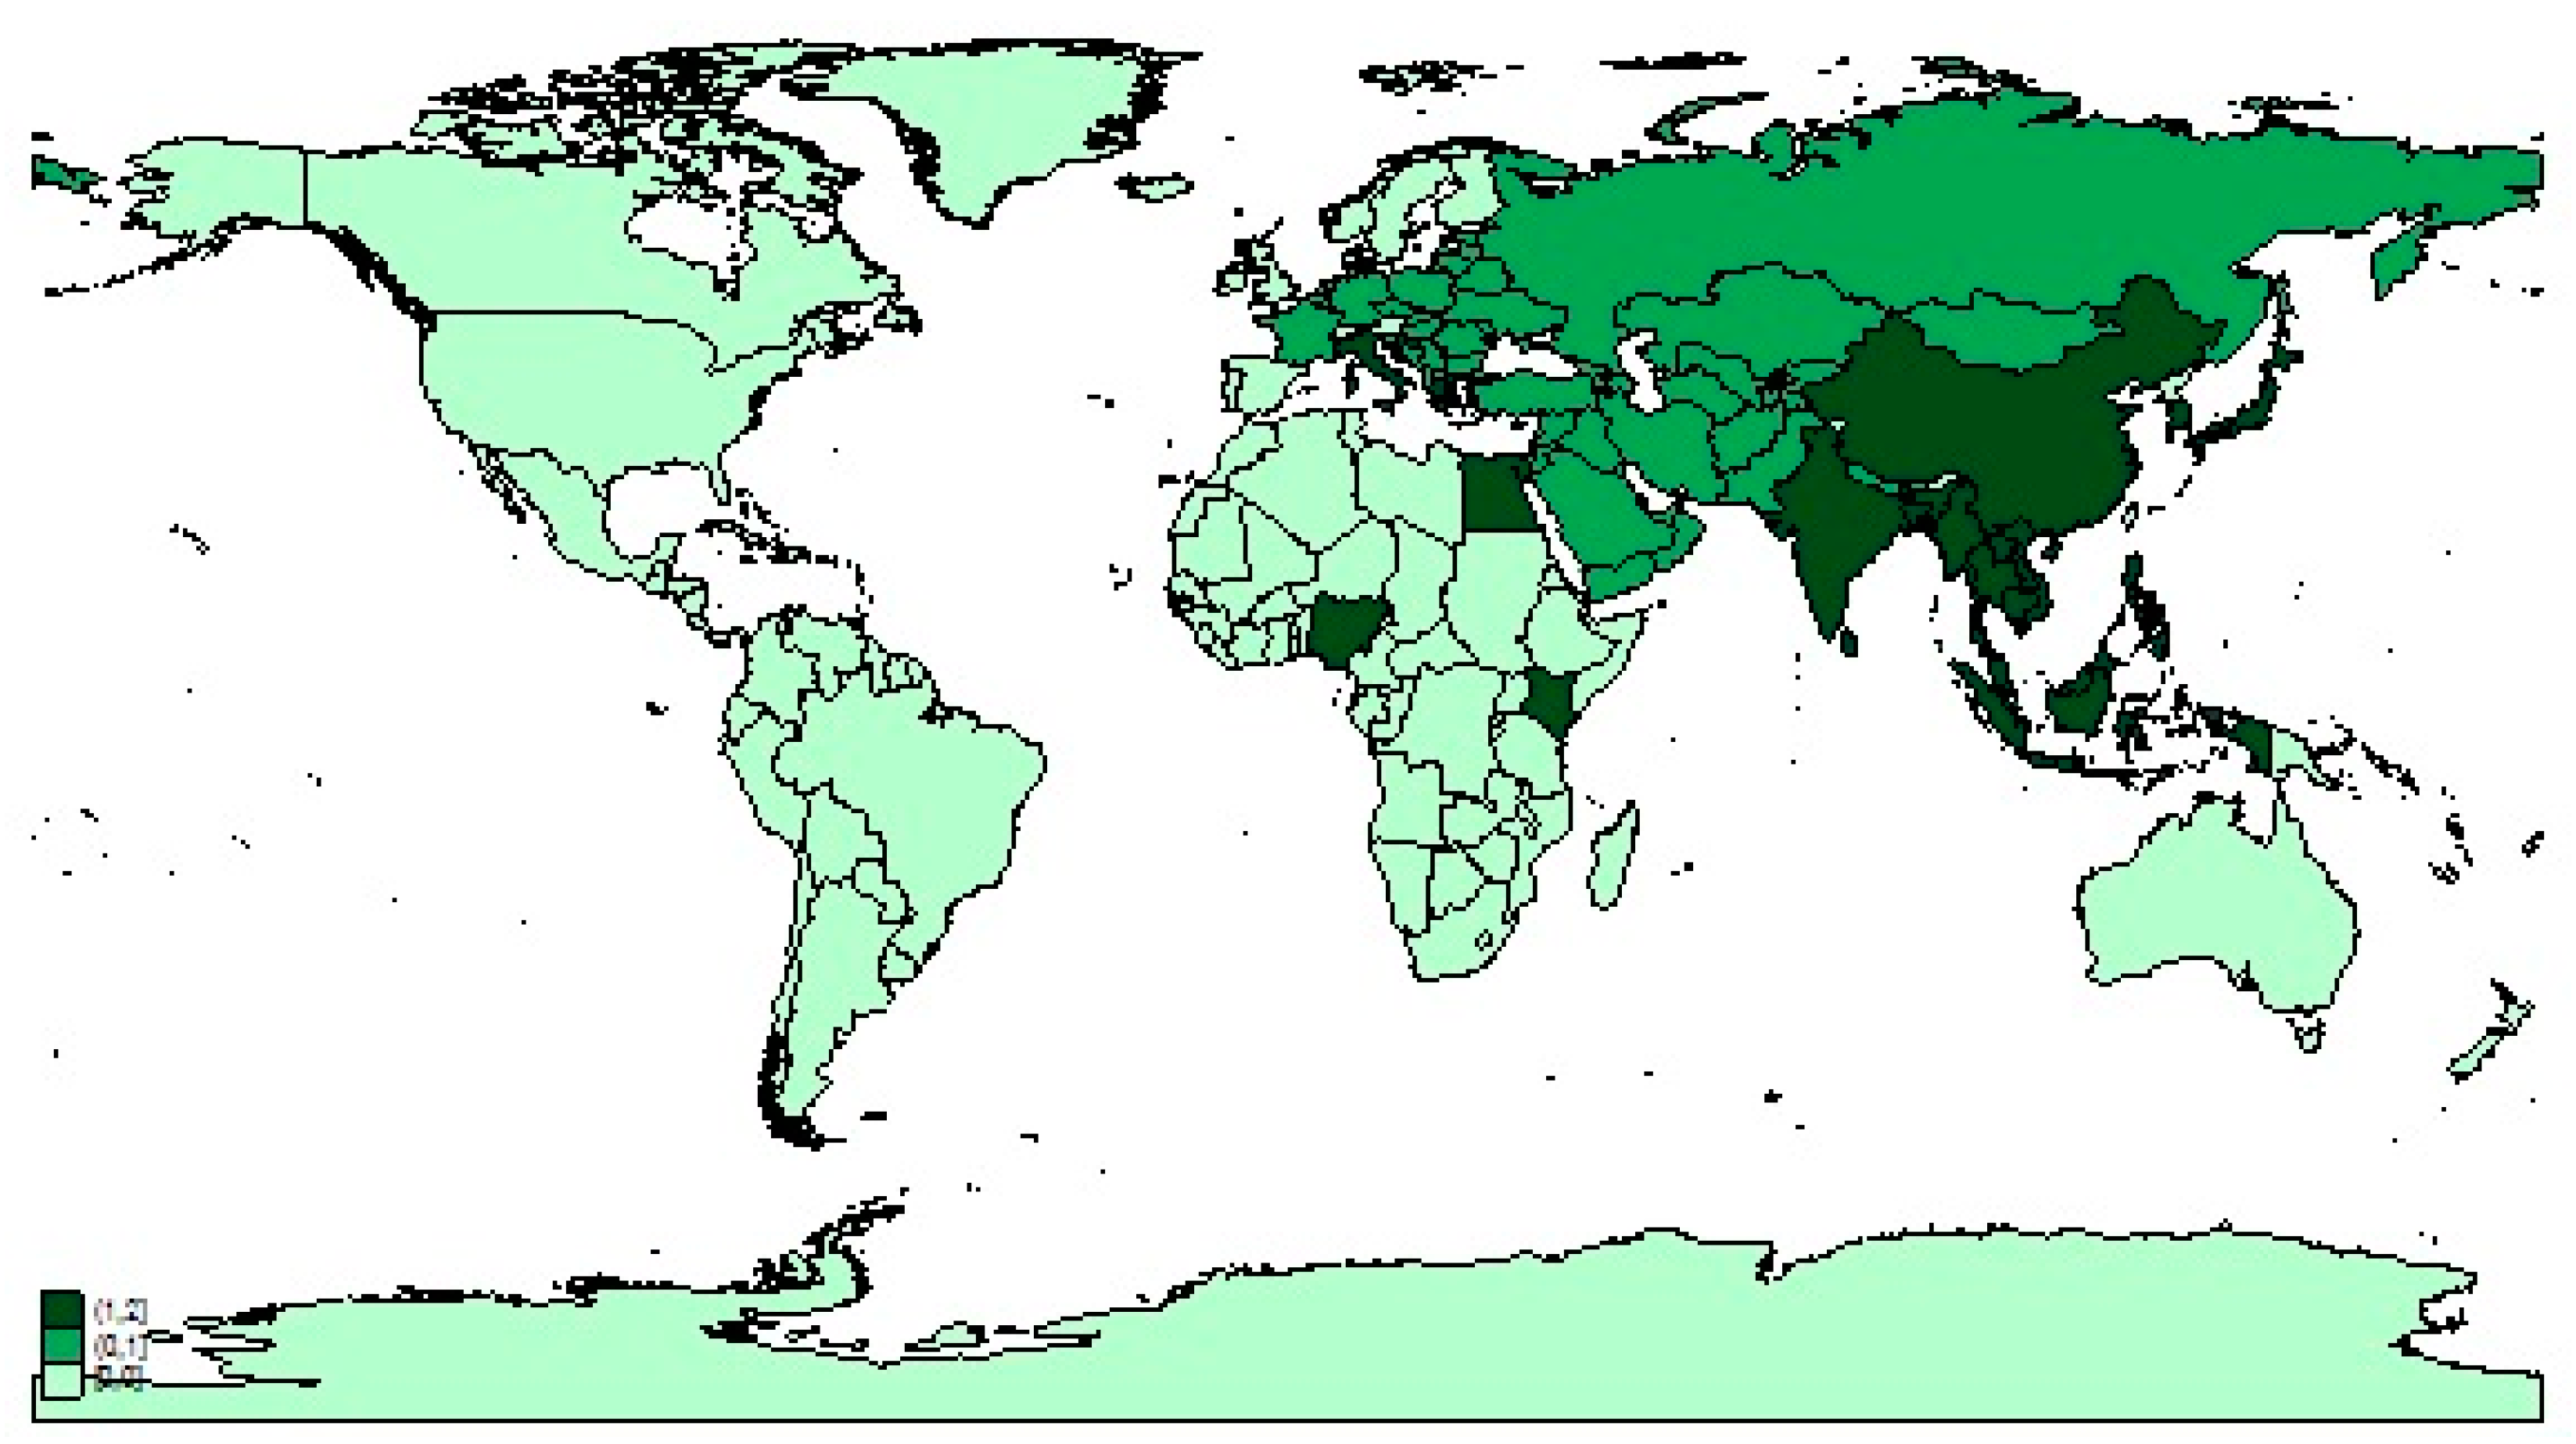
Figure A1.
Countries covered by OBOR initiative. Notes: Silk Road Economic Belt (OB, green), New Maritime Silk Road (OR, dark green), and non-OBOR (light green).
Figure A1.
Countries covered by OBOR initiative. Notes: Silk Road Economic Belt (OB, green), New Maritime Silk Road (OR, dark green), and non-OBOR (light green).

References
- Du, J.; Zhang, Y. Does one belt one road strategy promote Chinese overseas direct investment? China Econ. Rev. 2018, 47, 189–205. [Google Scholar] [CrossRef]
- Huang, Y.P. Understanding China’s belt & road initiative: Motivation, framework and assessment. China Econ. Rev. 2016, 40, 314–321. [Google Scholar]
- Liu, H.Y.; Tang, Y.K.; Chen, X.L.; Poznanska, J. The determinants of Chinese outward FDI in countries along “one belt one road”. Emerg. Mark. Financ. Trade 2017, 53, 1374–1387. [Google Scholar] [CrossRef]
- Sauvant, K.P.; Chen, V.Z. China’s regulatory framework for outward foreign direct investment. China Econ. J. 2014, 7, 141–163. [Google Scholar] [CrossRef]
- Swaine, M.D. Chinese views and commentary on the “One Belt, One Road” initiative. China Leadersh. Monit. 2015, 47, 1–24. [Google Scholar]
- UNCTAD. World Investment Report 2017: Investment and the Digital Economy; United Nations: New York, NY, USA; Geneva, Switzerland, 2017. [Google Scholar]
- Busse, M.; Erdogan, C.; Mühlen, H. China’s impact on Africa—The role of trade, FDI and aid. Kyklos 2016, 69, 228–262. [Google Scholar] [CrossRef]
- Chen, H. China’s “One Belt, One Road” initiative and its implications for Sino-African investment relations. Transnatl. Corp. Rev. 2016, 8, 178–182. [Google Scholar] [CrossRef]
- Kaliszuk, E. Chinese and South Korean investment in Poland: A comparative study. Transnatl. Corp. Rev. 2016, 8, 60–78. [Google Scholar] [CrossRef]
- Buckley, P.J.; Clegg, L.J.; Cross, A.R.; Liu, X.; Voss, H.; Zheng, P. The determinants of Chinese outward foreign direct investment. J. Int. Bus. Stud. 2007, 38, 499–518. [Google Scholar] [CrossRef] [Green Version]
- Wang, Y.; Du, J.; Wang, K. The determinants of location choices of China’s ODI: Institutions, taxation and resources. Front. Econ. China 2015, 10, 540–565. [Google Scholar]
- Amighini, A.; Rabellotti, R.; Sanfilippo, M. China’s outward FDI: An industry-level analysis of host country determinants. Front. Econ. China 2011, 8, 309–336. [Google Scholar]
- Cheung, Y.W.; Qian, X.W. The empirics of China’s outward direct investment. Pac. Econ. Rev. 2008, 14, 312–341. [Google Scholar] [CrossRef]
- Kolstad, I.; Wiig, A. What determines Chinese outward FDI? J. World Bus. 2012, 47, 26–34. [Google Scholar] [CrossRef] [Green Version]
- Dunning, J.H. Trade, location of economic activity and the MNE: A search for an eclectic approach. In The International Allocation of Economic Activity; Ohlin, B., Hesselborn, P.O., Wijkman, P.M., Eds.; Macmillan: London, UK, 1977; pp. 395–418. [Google Scholar]
- Dunning, J.H. Multinational Enterprises and the Global Economy; Addison-Wesley: Wokingham, UK, 1993. [Google Scholar]
- Zhang, X.; Daly, K. The determinants of China’s outward foreign direct investment. Emerg. Mark. Rev. 2011, 12, 389–398. [Google Scholar] [CrossRef]
- Ye, G. Chinese transnational corporations. Transnatl. Corp. 1992, 1, 125–133. [Google Scholar]
- Zhan, J.X. Transnationalization and outward investment: The case of Chinese firms. Transnatl. Corp. 1995, 4, 67–100. [Google Scholar]
- Cai, K.G. Outward foreign direct investment: A novel dimension of China’s integration into the regional and global economy. China Q. 1999, 160, 856–880. [Google Scholar] [CrossRef]
- Wu, F.; Sia, Y.H. China’s rising investment in Southeast Asia: Trends and outlook. J. Asian Bus. 2002, 18, 41–61. [Google Scholar]
- Chang, S.C. The determinants and motivations of China’s outward foreign direct investment: A spacial gravity model. Glob. Econ. Rev. 2014, 43, 244–268. [Google Scholar] [CrossRef]
- Buckley, P.J.; Casson, M. The Future of the Multinational Enterprise; Macmillan: London, UK, 1976. [Google Scholar]
- UNCTAD. World Investment Report 1998: Trends and Determinants; United Nations: New York, NY, USA; Geneva, Switzerland, 1998. [Google Scholar]
- Chakrabarti, A. The determinants of foreign direct investments: Sensitivity analyses of cross-country regressions. Kyklos 2001, 54, 89–114. [Google Scholar] [CrossRef]
- Taylor, R. Globalization strategies of Chinese companies: Current developments and future prospects. Asian Bus. Manag. 2002, 1, 209–225. [Google Scholar] [CrossRef]
- Zhang, Y. China’s Emerging Global Businesses: Political Economy and Institutional Investigations; Palgrave Macmillan: Basingstoke, UK, 2003. [Google Scholar]
- Deng, P. Outward investment by Chinese MNCs: Motivations and implications. Bus. Horiz. 2004, 47, 8–16. [Google Scholar] [CrossRef]
- Coughlin, C.C.; Terza, J.V.; Arromdee, V. State characteristics and the location of foreign direct investment within the United States. Rev. Econ. Stat. 1991, 73, 675–683. [Google Scholar] [CrossRef]
- Wheeler, D.; Mody, A. International investment location decisions: The case of U.S. firms. J. Int. Econ. 1992, 33, 57–76. [Google Scholar] [CrossRef]
- Cheng, L.K.; Kwan, Y.K. What are the determinants of the location of foreign direct investment? The Chinese experience. J. Int. Econ. 2000, 51, 379–400. [Google Scholar] [CrossRef]
- Asiedu, E. On the determinants of foreign direct investment to developing countries: Is Africa different? World Dev. 2002, 30, 107–118. [Google Scholar] [CrossRef]
- Deichmann, J.; Karidis, S.; Sayek, S. Foreign direct investment in turkey: Regional determinants. Appl. Econ. 2003, 35, 1767–1778. [Google Scholar] [CrossRef]
- Li, S.; Park, S.H. Determinants of locations of foreign direct investment in China. Manag. Organ. Rev. 2006, 2, 95–119. [Google Scholar] [CrossRef]
- Bellak, C.; Leibrecht, M.; Damijan, J.P. Infrastructure endowment and corporate income taxes as determinants of foreign direct investment in Central and Eastern European countries. World Econ. 2009, 22, 267–290. [Google Scholar] [CrossRef]
- Fedderke, J.W.; Romm, A.T. Growth impact and determinants of foreign direct investment into South Africa, 1956–2003. Econ. Model. 2006, 23, 738–760. [Google Scholar] [CrossRef]
- Calvo, G.A.; Leiderman, L.; Reinhart, C.M. Inflows of capital to developing countries in the 1990s. J. Econ. Perspect. 1996, 10, 123–139. [Google Scholar] [CrossRef]
- Femandez-Arias, E. The new wave of private capital inflows: Push or pull? J. Dev. Econ. 1996, 48, 389–418. [Google Scholar] [CrossRef]
- Fermandez-Arias, E.; Montiel, P.J. The surge in capital inflows to developing countries: An analytical overview. World Bank Econ. Rev. 1996, 10, 51–77. [Google Scholar] [CrossRef]
- Sekkat, K.; Veganzones-Varoudakis, M.A. Openness, investment climate, and FDI in developing countries. Rev. Dev. Econ. 2007, 11, 607–620. [Google Scholar] [CrossRef]
- Henley, J.; Kirkpatrick, C.; Wilde, G. Foreign direct investment in China: Recent trends and current policy issues. World Econ. 1999, 22, 223–243. [Google Scholar] [CrossRef]
- Yeung, H.W.C. The internationalisation of ethnics Chinese business firms from Southeast Asia: Strategies, processes and competitive advantages. Int. J. Urban Reg. Res. 1999, 23, 88–102. [Google Scholar] [CrossRef]
- Sikorski, D.; Menkhoff, T. Internationalisation of Asian business. Singap. Manag. Rev. 2000, 22, 1–17. [Google Scholar]
- Ng, L.F.Y.; Tuan, C. Building a favourable investment environment: Evidence for the facilitation of FDI in China. World Econ. 2002, 25, 1095–1114. [Google Scholar] [CrossRef]
- Katz, L.F.; Murphy, K.M. Changes in relative wages, 1963–1987: Supply and demand factors. Q. J. Econ. 1992, 107, 35–78. [Google Scholar] [CrossRef]
- Saarimaa, T. Tax incentives and demand for mortgage debt: Evidence from the Finnish 1993 tax reform. Int. J. Hous. Policy 2010, 10, 19–40. [Google Scholar] [CrossRef]
- World Bank. World Development Indicators, World Bank. 2017. Available online: https://datacatalog.worldbank.org/dataset/world-development-indicators (accessed on 5 April 2018).
- World Bank. The Changing Wealth of Nations: Measuring Sustainable Development in the New Millennium; Environment and Development; World Bank: Washington, DC, USA, 2011. [Google Scholar]
- Aleksynska, M.; Havrylchyk, O. FDI from the south: The role of institutional distance and natural resources. Eur. J. Political Econ. 2013, 29, 38–53. [Google Scholar] [CrossRef]
- World Bank. Worldwide Governance Indicators, World Bank. 2018. Available online: https://datacatalog.worldbank.org/dataset/worldwide-governance-indicators (accessed on 5 April 2018).
- Hofstede, G. Cultural constraints in management theories. Executive 1993, 7, 81–94. [Google Scholar] [CrossRef]
- Hofstede, G. Do American theories apply in China? In Cross-Cultural Management; SISU: Shanghai, China, 2015; Volume 3, pp. 21–27. [Google Scholar]
- Kogut, B.; Singh, H. The effect of national culture on the choice of entry mode. J. Int. Bus. Stud. 1988, 19, 411–432. [Google Scholar] [CrossRef]
- Fu, X.M.; Chen, H.X.; Xue, Z.K. Construction of the belt and road trade cooperation network from the multi-distances perspective. Sustainability 2018, 10, 1439. [Google Scholar] [CrossRef]
- Ministry of Foreign Affairs. A Summary of the Dates of the Establishment of Diplomatic Relations between the People’s Republic of China and Other Countries. Ministry of Foreign Affairs of P.R.C. Available online: http://www.fmprc.gov.cn/web/ziliao_674904/2193_674977/ (accessed on 15 August 2018).
- World Bank. Doing Business. The World Bank, 2018. Available online: http://www.doingbusiness.org (accessed on 5 April 2018).
- Hanna, R. US environmental regulation and FDI: Evidence from a panel of US-based multinational firms. Am. Econ. J. Appl. Econ. 2010, 2, 158–189. [Google Scholar] [CrossRef]
- Cai, X.; Lu, Y.; Wu, M.; Yu, L. Does environmental regulation drive away inbound foreign direct investment? Evidence from a quasi-natural experiment in China. J. Dev. Econ. 2016, 123, 73–85. [Google Scholar] [CrossRef]
- Stevenson, B.; Wolfers, J. Economic growth and happiness. In Brookings Papers on Economic Activity; Spring: Palo Alto, CA, USA, 2008. [Google Scholar]
- Arnold, J.M.; Javorcik, B.S. Gifted kids or pushy parents? Foreign direct investment and plant productivity in Indonesia. J. Int. Econ. 2009, 79, 42–53. [Google Scholar] [CrossRef] [Green Version]
- Vogel, A.; Wagner, J. Higher productivity in importing German manufacturing firms: Self-selection, learning from importing, or both? Rev. World Econ. 2010, 145, 641–665. [Google Scholar] [CrossRef]
- Peng, F.; Kang, L.; Jiang, J. Selection and institutional shareholder activism in Chinese acquisitions. Manag. Decis. 2013, 51, 141–162. [Google Scholar] [CrossRef] [Green Version]
- Chang, S.J.; Chung, J.; Moon, J.J. When do foreign subsidiaries outperform local firms? J. Int. Bus. Stud. 2013, 44, 853–860. [Google Scholar] [CrossRef]
- Borisov, A.; Goldman, E.; Gupta, N. The corporate value of (corrupt) lobbying. Rev. Financ. Stud. 2016, 29, 1039–1071. [Google Scholar] [CrossRef]
- Rosenbaum, P.R.; Rubin, D.B. The central role of the propensity score in observational studies for causal effects. Biometrika 1983, 70, 41–55. [Google Scholar] [CrossRef] [Green Version]
- Caliendo, M.; Kopeinig, S. Some practical guidance for the implementation of propensity score matching. J. Econ. Surv. 2008, 22, 31–72. [Google Scholar] [CrossRef]
- Blundell, R.; Dias, M.C. Evaluation methods for non-experimental data. Fisc. Stud. 2000, 21, 427–468. [Google Scholar] [CrossRef]
- Heckman, J.J.; Ichimura, H.; Todd, P.E. Matching as an econometric evaluation estimator: Evidence from evaluating a job training programme. Rev. Econ. Stud. 1997, 64, 605–654. [Google Scholar] [CrossRef]
- Asiedu, E. Foreign direct investment in Africa: The role of natural resources, market size, government policy, institutions and political instability. World Econ. 2006, 29, 63–77. [Google Scholar] [CrossRef]
- Kamal, M.A.; Li, Z.; Akhmat, G.; Bashir, M.F.; Khan, K. What determines China’s FDI inflow to South Asia? Mediterr. J. Soc. Sci. 2014, 5, 254–263. [Google Scholar]
- Urata, S.; Kawai, H. The determinants of the location of foreign direct investment by Japanese small and medium sized enterprises. Small Bus. Econ. 2000, 15, 79–103. [Google Scholar] [CrossRef]
- Duanmu, J.L. The effect of corruption distance and market orientation on the ownership choice of MNEs: Evidence from China. J. Int. Manag. 2011, 17, 162–174. [Google Scholar] [CrossRef] [Green Version]
- Li, Q.; Liang, G. Political Relations and Chinese Outbound Direct Investment: Evidence from Firm- and Dyadic-Level Tests; RCCPB Working Paper #19; Indiana University: Bloomington, IN, USA, 2012. [Google Scholar]
- Filatotchev, I.; Kepelyushnikov, R.; Dyomina, N.; Aukusionek, S. The effects of ownership concentration on investment and performance in privatised firms in Russia. Manag. Decis. Econ. 2001, 22, 299–313. [Google Scholar] [CrossRef]
- Leonidou, S.C.; Katsikeas, C.S. The export development process—An integrative review of empirical models. J. Int. Bus. Stud. 1996, 27, 517–551. [Google Scholar] [CrossRef]
- UNCTAD. World Investment Report 2014: Investing in the SDGs: An Action Plan; United Nations: New York, NY, USA; Geneva, Switzerland, 2014. [Google Scholar]
Figure 1.
China’s inward and outward foreign direct investment (FDI) in current USD billion during the period 1980–2016. Source: World Investment Report 2011 and One Belt One Road 2017 [6].
Figure 1.
China’s inward and outward foreign direct investment (FDI) in current USD billion during the period 1980–2016. Source: World Investment Report 2011 and One Belt One Road 2017 [6].

Figure 2.
Standardized percentage bias across covariates, matched, and unmatched samples.

Table 1.
Descriptive statistics of variables: 1296 observations from 216 countries during 2010–2015.
Table 1.
Descriptive statistics of variables: 1296 observations from 216 countries during 2010–2015.
| Variable | Description | Mean | Std. Dev. | Min | Max | Data Source |
|---|---|---|---|---|---|---|
| Dependent variable | ||||||
| lnrofdib | Natural logarithm of real FDI net flows | 2.35 | 2.52 | −3.95 | 11.25 | Chinese Ministry of Commerce |
| Main explanatory variables | ||||||
| nr | Share of natural resource rent in GDP (%) | 7.40 | 11.49 | 0.00 | 60.83 | World Development Indicators (World Bank) |
| lnrgdp | Natural logarithm of real GDP | 23.77 | 2.38 | 17.22 | 30.44 | ibid |
| fd | Index, higher value = more infrastructure distance from China | 0.85 | 0.51 | 0.00 | 3.49 | ibid |
| cinfra | Factor, higher value = better infrastructure facilities in China | 0.11 | 0.19 | −0.16 | 0.46 | ibid |
| infra | Factor, higher value = better infrastructure facilities | 0.00 | 0.98 | −1.06 | 3.51 | ibid |
| lnairf | Log form air transport freight (million ton-km) | 2.61 | 2.95 | 0.00 | 10.59 | ibid |
| rd | Railway density, this is total railway kilometers (% of country area) | 1.32 | 3.16 | 0.00 | 28.01 | ibid |
| Internet | Individuals using a landline phone (% of population) | 42.00 | 29.13 | 0.00 | 98.32 | ibid |
| broadband | Individuals using a mobile phone (% of population) | 11.72 | 13.17 | 0.00 | 61.74 | ibid |
| mobile | Individuals using the Internet (% of population) | 100.03 | 42.82 | 1.14 | 324.44 | ibid |
| landline | Fixed broadband subscriptions (% of population) | 20.54 | 20.43 | 0.00 | 141.18 | ibid |
| id | Index, higher value = more institutional distance from China | 0.86 | 0.67 | 0.00 | 2.41 | Worldwide Governance Indicators (World Bank) |
| cwgi | Factor, higher value = better institutional quality in China | −0.43 | 0.06 | −0.50 | −0.34 | ibid |
| wgi | Factor, higher value = better institutional quality | 0.00 | 0.99 | −2.28 | 1.93 | ibid |
| ge | Government effectiveness | 0.07 | 1.04 | −2.45 | 2.24 | ibid |
| rq | Regulatory quality | 0.07 | 1.04 | −2.53 | 2.26 | ibid |
| cc | Control of corruption | 0.08 | 1.05 | −1.77 | 2.40 | ibid |
| ps | Political stability and absence of violence/terrorism | 0.01 | 0.98 | −3.13 | 1.94 | ibid |
| va | Voice and accountability | 0.06 | 1.02 | −2.26 | 1.74 | ibid |
| rl | Rule of law | 0.07 | 1.05 | −2.42 | 2.10 | ibid |
| cd | Index, higher value = more cultural distance from China | 3.24 | 1.47 | 0.16 | 8.16 | Hofstadter-insights website |
| pdi | Power distance, higher values = higher inequality | 63.37 | 19.73 | 11.00 | 100.00 | ibid |
| idv | Individualism/Collectivism, higher values = more individualism | 40.78 | 25.01 | 6.00 | 91.00 | ibid |
| mas | Masculinity/Femininity, higher values = more masculine | 48.50 | 15.81 | 5.00 | 100.00 | ibid |
| uai | Uncertainty avoidance, higher values = more uncertainty avoiding | 60.12 | 19.24 | 8.00 | 100.00 | ibid |
| lts | Long-term/short-term, higher values = more short-term orientation | 39.36 | 21.15 | 0.00 | 100.00 | ibid |
| ivr | Indulgence/restraint, higher values = more indulgent | 52.09 | 22.32 | 0.00 | 100.00 | ibid |
| Dipyear | Years of formal diplomatic relationship | 33.20 | 18.81 | 0.00 | 66.00 | Ministry of Foreign Affairs |
| Control variables | ||||||
| dbi | Ease of doing business index | 61.72 | 13.78 | 20.24 | 91.24 | Doing Business (World Bank) |
| lab | Labor force (% population) | 45.13 | 11.50 | 19.90 | 140.18 | World Development Indicators (World Bank) |
| indserv | Economic structure (industry to service ratio) | 0.65 | 1.88 | 0.00 | 39.84 | ibid |
| Weights | ||||||
| pop | Population | 2.67 × 10⁷ | 9.44 × 10⁷ | 10,025 | 1.31 × 10⁹ | ibid |
Table 2.
Effects of the One Belt, One Road (OBOR) policy announcement on China’s outward foreign direct investment (OFDI), 2010–2015.
Table 2.
Effects of the One Belt, One Road (OBOR) policy announcement on China’s outward foreign direct investment (OFDI), 2010–2015.
| Dependent Variable: Log form China’s OFDI | (1) | (2) | (3) | (4) |
|---|---|---|---|---|
| OBOR | 0.400 *** | −0.392 *** | −0.179 | 6.967 *** |
| (0.148) | (0.134) | (0.132) | (1.721) | |
| OBOR *post | 0.462 * | 0.422 ** | 0.391 ** | −4.843 ** |
| (0.252) | (0.191) | (0.184) | (2.087) | |
| Natural resource | 0.044 *** | 0.062 *** | 0.070 *** | |
| (0.006) | (0.006) | (0.009) | ||
| Market size | 0.677 *** | 0.642 *** | 0.708 *** | |
| (0.026) | (0.028) | (0.047) | ||
| Infrastructure distance | 0.648 *** | 1.029 *** | 1.197 *** | |
| (0.140) | (0.141) | (0.232) | ||
| Institutional distance | 0.323 *** | −0.131 | 0.199 | |
| (0.109) | (0.116) | (0.169) | ||
| Cultural distance | −0.288 *** | −0.259 *** | −0.350 *** | |
| (0.047) | (0.049) | (0.067) | ||
| Doing business | 0.014 ** | 0.013 ** | ||
| (0.006) | (0.006) | |||
| Labor force | 0.052 *** | 0.057 *** | ||
| (0.007) | (0.007) | |||
| Industry/service | −0.088 | −0.076 | ||
| (0.058) | (0.057) | |||
| nr*OBOR | −0.011 | |||
| (0.012) | ||||
| nr*OBOR*post | −0.027 | |||
| (0.018) | ||||
| lnrgdp*OBOR | −0.265 *** | |||
| (0.062) | ||||
| lnrgdp*OBOR*post | 0.185 ** | |||
| (0.077) | ||||
| fd*OBOR | 0.009 | |||
| (0.348) | ||||
| fd*OBOR*post | 0.366 | |||
| (0.384) | ||||
| id*OBOR | −1.139 *** | |||
| (0.270) | ||||
| id*OBOR*post | −0.003 | |||
| (0.308) | ||||
| cd*OBOR | 0.341 *** | |||
| (0.102) | ||||
| cd*OBOR*post | −0.055 | |||
| (0.139) | ||||
| Year dummies | Yes | Yes | Yes | Yes |
| Adjusted R-squared | 0.029 | 0.445 | 0.485 | 0.519 |
| N | 1296 | 1296 | 1296 | 1296 |
Notes: Parentheses below the estimated coefficients present their estimated standard errors. Estimations are weighted by population of each country (pop). ***, **, and * denote significance levels of 1, 5, and 10%, respectively.
Table 3.
Effects of OBOR policy announcement on China’s OFDI by country group.
| Dependent Variable: Log Form China’s OFDI | (1) | (2) | (3) | (4) | (5) |
|---|---|---|---|---|---|
| All | All | OB | OR | Non-OBOR | |
| OB | −0.077 | −0.183 | |||
| (0.197) | (0.156) | ||||
| OB *post | 0.193 | 0.270 | |||
| (0.337) | (0.249) | ||||
| OR | 0.603 *** | −0.146 | |||
| (0.157) | (0.153) | ||||
| OR *post | 0.576 ** | 0.444 ** | |||
| (0.268) | (0.198) | ||||
| Natural resource | 0.063 *** | 0.028 * | 0.194 *** | 0.059 *** | |
| (0.006) | (0.016) | (0.040) | (0.008) | ||
| Market size | 0.634 *** | 1.063 *** | 0.322 *** | 0.786 *** | |
| (0.030) | (0.078) | (0.090) | (0.045) | ||
| Infrastructure distance | 0.984 *** | 1.818 *** | 0.914 ** | 1.394 *** | |
| (0.151) | (0.339) | (0.435) | (0.205) | ||
| Institutional distance | −0.095 | −1.898 *** | −0.313 | 0.211 | |
| (0.125) | (0.360) | (0.372) | (0.145) | ||
| Cultural distance | −0.259 *** | −0.463 *** | −0.338 ** | −0.309 *** | |
| (0.049) | (0.149) | (0.139) | (0.058) | ||
| Doing business | 0.015 ** | 0.010 | 0.038 ** | −0.003 | |
| (0.006) | (0.015) | (0.016) | (0.008) | ||
| Labor force | 0.052 *** | 0.007 | 0.054 ** | 0.037 *** | |
| (0.007) | (0.012) | (0.022) | (0.010) | ||
| Industry/service | −0.092 | −0.082 | 0.925 | −0.092 * | |
| (0.059) | (0.539) | (0.823) | (0.049) | ||
| Year 2011 | 0.408 ** | 0.242 * | 0.285 | 0.432 | −0.210 |
| (0.199) | (0.147) | (0.324) | (0.265) | (0.203) | |
| Year 2012 | 0.643 *** | 0.505 *** | 0.094 | 0.950 *** | 0.112 |
| (0.198) | (0.147) | (0.324) | (0.269) | (0.202) | |
| Year 2013 | 0.470 ** | 0.341 ** | 0.104 | 0.657 ** | 0.120 |
| (0.197) | (0.147) | (0.325) | (0.275) | (0.202) | |
| Year 2014 | 0.569 ** | 0.514 *** | 0.650 ** | 1.199 *** | 0.495 ** |
| (0.255) | (0.189) | (0.328) | (0.280) | (0.201) | |
| Year 2015 | 0.110 | 0.047 | 0.070 | 1.326 *** | −0.467 ** |
| (0.254) | (0.192) | (0.333) | (0.322) | (0.204) | |
| Adjusted R-squared | 0.049 | 0.484 | 0.517 | 0.498 | 0.602 |
| N | 1296 | 1296 | 294 | 150 | 852 |
Notes: Parentheses below the estimated coefficients present their estimated standard errors. Estimations are weighted by population of each country (pop). ***, **, and * stand for significance levels of 1, 5, and 10%, respectively.
Table 4.
Logit estimation using matching Equation (6), with a one-year lag for explanatory variables.
Table 4.
Logit estimation using matching Equation (6), with a one-year lag for explanatory variables.
| Dependent Variable: OBOR Countries | Estimated Coefficient | Standard Error |
|---|---|---|
| Natural resources (one-year lag) | −0.016 ** | 0.008 |
| Market size (one-year lag) | 0.570 *** | 0.051 |
| Infrastructure distance (one-year lag) | −1.538 *** | 0.243 |
| Institutional distance (one-year lag) | −0.039 | 0.189 |
| Cultural distance (one-year lag) | −1.288 *** | 0.095 |
| Business environment (one-year lag) | 0.001 | 0.010 |
| Labor force (one-year lag) | −0.005 | 0.011 |
| Industry/service (one-year lag) | −0.018 | 0.045 |
| Year dummy | Yes | |
| N | 1080 | |
| Pseudo R2 | 0.4149 | |
Notes: ***, **, and * respectively stand for significance levels of 1%, 5%, and 10%.
Table 5.
Balancing test for the matching process.
| Variable | Sample | Treated | Control | % Bias | Bias Reduction | t | p > t |
|---|---|---|---|---|---|---|---|
| L.nr | Unmatched | 7.9863 | 7.6545 | 2.7 | 0.43 | 0.665 | |
| Matched | 8.063 | 7.5136 | 4.6 | −65.6 | 0.65 | 0.515 | |
| L.lnrgdp | Unmatched | 25.063 | 23.116 | 91.6 | 13.81 | 0 | |
| Matched | 24.989 | 25.478 | −23 | 74.9 | −3.27 | 0.001 | |
| L.fd | Unmatched | 0.70258 | 0.90019 | −40.6 | −6.19 | 0 | |
| Matched | 0.69925 | 0.89736 | −40.7 | −0.3 | −5.29 | 0 | |
| L.id | Unmatched | 0.73075 | 0.93162 | −31.6 | −4.72 | 0 | |
| Matched | 0.74748 | 0.9506 | −31.9 | −1.1 | −4.31 | 0 | |
| L.cd | Unmatched | 2.2601 | 3.7592 | −122.9 | −18.23 | 0 | |
| Matched | 2.3008 | 2.2616 | 3.2 | 97.4 | 0.45 | 0.655 | |
| L.dbi | Unmatched | 61.933 | 61.092 | 6.4 | 0.95 | 0.344 | |
| Matched | 62.109 | 67.954 | −44.4 | −594.9 | −6.37 | 0 | |
| L.lab | Unmatched | 45.607 | 44.824 | 7.1 | 1.06 | 0.291 | |
| Matched | 45.673 | 45.021 | 5.9 | 16.7 | 0.93 | 0.351 | |
| L.indserv | Unmatched | 0.66932 | 0.65671 | 0.8 | 0.1 | 0.918 | |
| Matched | 0.66465 | 0.50292 | 9.6 | −1182.3 | 1.42 | 0.156 | |
| _pscore | Unmatched | 0.65183 | 0.18144 | 197.4 | 31.33 | 0 | |
| Matched | 0.6426 | 0.64307 | −0.2 | 99.9 | −0.03 | 0.98 |
Table 6.
Effects of OBOR policy announcement on China’s OFDI, matched sample.
| (1) | (2) | (3) | (4) | |
|---|---|---|---|---|
| OBOR | −0.065 | −0.303 ** | −0.086 | 7.771 *** |
| (0.172) | (0.152) | (0.152) | (2.075) | |
| OBOR*post | −0.042 | 0.200 | 0.150 | −6.682 ** |
| (0.301) | (0.236) | (0.230) | (2.952) | |
| Natural resource | 0.042 *** | 0.056 *** | 0.066 *** | |
| (0.006) | (0.007) | (0.011) | ||
| Market size | 0.679 *** | 0.626 *** | 0.729 *** | |
| (0.035) | (0.038) | (0.055) | ||
| Infrastructure distance | 0.744 *** | 0.980 *** | 1.359 *** | |
| (0.170) | (0.171) | (0.270) | ||
| Institutional distance | 0.239 * | −0.039 | 0.189 | |
| (0.141) | (0.146) | (0.199) | ||
| Cultural distance | −0.240 *** | −0.165 ** | −0.255 *** | |
| (0.061) | (0.064) | (0.094) | ||
| Doing business | 0.008 | 0.005 | ||
| (0.007) | (0.007) | |||
| Labor force | 0.046 *** | 0.049 *** | ||
| (0.008) | (0.008) | |||
| Industry/service | −0.124 * | −0.100 | ||
| (0.065) | (0.064) | |||
| nr*OBOR | −0.012 | |||
| (0.014) | ||||
| nr*OBOR*post | −0.030 | |||
| (0.020) | ||||
| lnrgdp*OBOR | −0.286 *** | |||
| (0.077) | ||||
| lnrgdp*OBOR*post | 0.276 ** | |||
| (0.116) | ||||
| fd*OBOR | −0.371 | |||
| (0.407) | ||||
| fd*OBOR*post | 0.262 | |||
| (0.453) | ||||
| id*OBOR | −0.824 ** | |||
| (0.328) | ||||
| id*OBOR*post | −0.221 | |||
| (0.407) | ||||
| cd*OBOR | 0.284 ** | |||
| (0.133) | ||||
| cd*OBOR*post | −0.172 | |||
| (0.177) | ||||
| Year dummies | Yes | Yes | Yes | Yes |
| Adjusted R-squared | 0.012 | 0.401 | 0.431 | 0.464 |
| N | 983 | 983 | 983 | 983 |
Notes: Parentheses below the estimated coefficients present their estimated standard errors. Estimations are weighted by the population of each country (pop). ***, **, and * represent significance levels of 1%, 5%, and 10%, respectively.
© 2018 by the authors. Licensee MDPI, Basel, Switzerland. This article is an open access article distributed under the terms and conditions of the Creative Commons Attribution (CC BY) license (http://creativecommons.org/licenses/by/4.0/).
Share and Cite
MDPI and ACS Style
Kang, L.; Peng, F.; Zhu, Y.; Pan, A. Harmony in Diversity: Can the One Belt One Road Initiative Promote China’s Outward Foreign Direct Investment? Sustainability 2018, 10, 3264. https://doi.org/10.3390/su10093264
AMA Style
Kang L, Peng F, Zhu Y, Pan A. Harmony in Diversity: Can the One Belt One Road Initiative Promote China’s Outward Foreign Direct Investment? Sustainability. 2018; 10(9):3264. https://doi.org/10.3390/su10093264
Chicago/Turabian StyleKang, Lili, Fei Peng, Yu Zhu, and An Pan. 2018. "Harmony in Diversity: Can the One Belt One Road Initiative Promote China’s Outward Foreign Direct Investment?" Sustainability 10, no. 9: 3264. https://doi.org/10.3390/su10093264
Note that from the first issue of 2016, this journal uses article numbers instead of page numbers. See further details here.