Effects of Market Reform on Facility Investment in Electric Power Industry: Panel Data Analysis of 27 Countries

1
Department of Industrial Engineering, College of Engineering, Yonsei University, 50, Yonsei-Ro, Seodaemun-gu, Seoul 120-749, Korea
2
Graduate School of Engineering Practice, Seoul National University, 1, Gwanak-ro, Gwanak-Gu, Seoul 151-742, Korea
3
Science and Technology Policy Institute, Sejong National Research Complex 370, Sicheong-Daero, Sejong-Si 30147, Korea
*
Author to whom correspondence should be addressed.
Sustainability 2018, 10(9), 3235; https://doi.org/10.3390/su10093235
Submission received: 26 August 2018
/
Revised: 5 September 2018
/
Accepted: 5 September 2018
/
Published: 10 September 2018
(This article belongs to the Collection Power System and Sustainability)
Abstract
:In this study, we analyzed the effects of electricity market reform on investment in generation facilities. We used the data of 27 OECD member countries and considered ownership structure, horizontal and vertical unbundling, change of transaction method, and government regulation as explanatory variables for market reform. We used four regression models, in which we examined the effects of market reform on the capacity of generation facilities, supply reserve ratio, total investment, and base-load share, respectively. For each panel regression model, we performed a Hausman test to identify the model between random effect and fixed effect. Based on the estimation results, we found that electricity market reform has a negative effect on generation facilities in most countries. Both privatization and regulation have negative impacts on the generation facility and base-load share. On the other hand, the level of liberalization of transactions have positive effects on the generation facility, supply reserve ratio, and base-load share. The empirical analysis also showed that horizontal unbundling does not have a meaningful effect on investment, but vertical unbundling contributes to increasing the supply reserve ratio.
1. Introduction
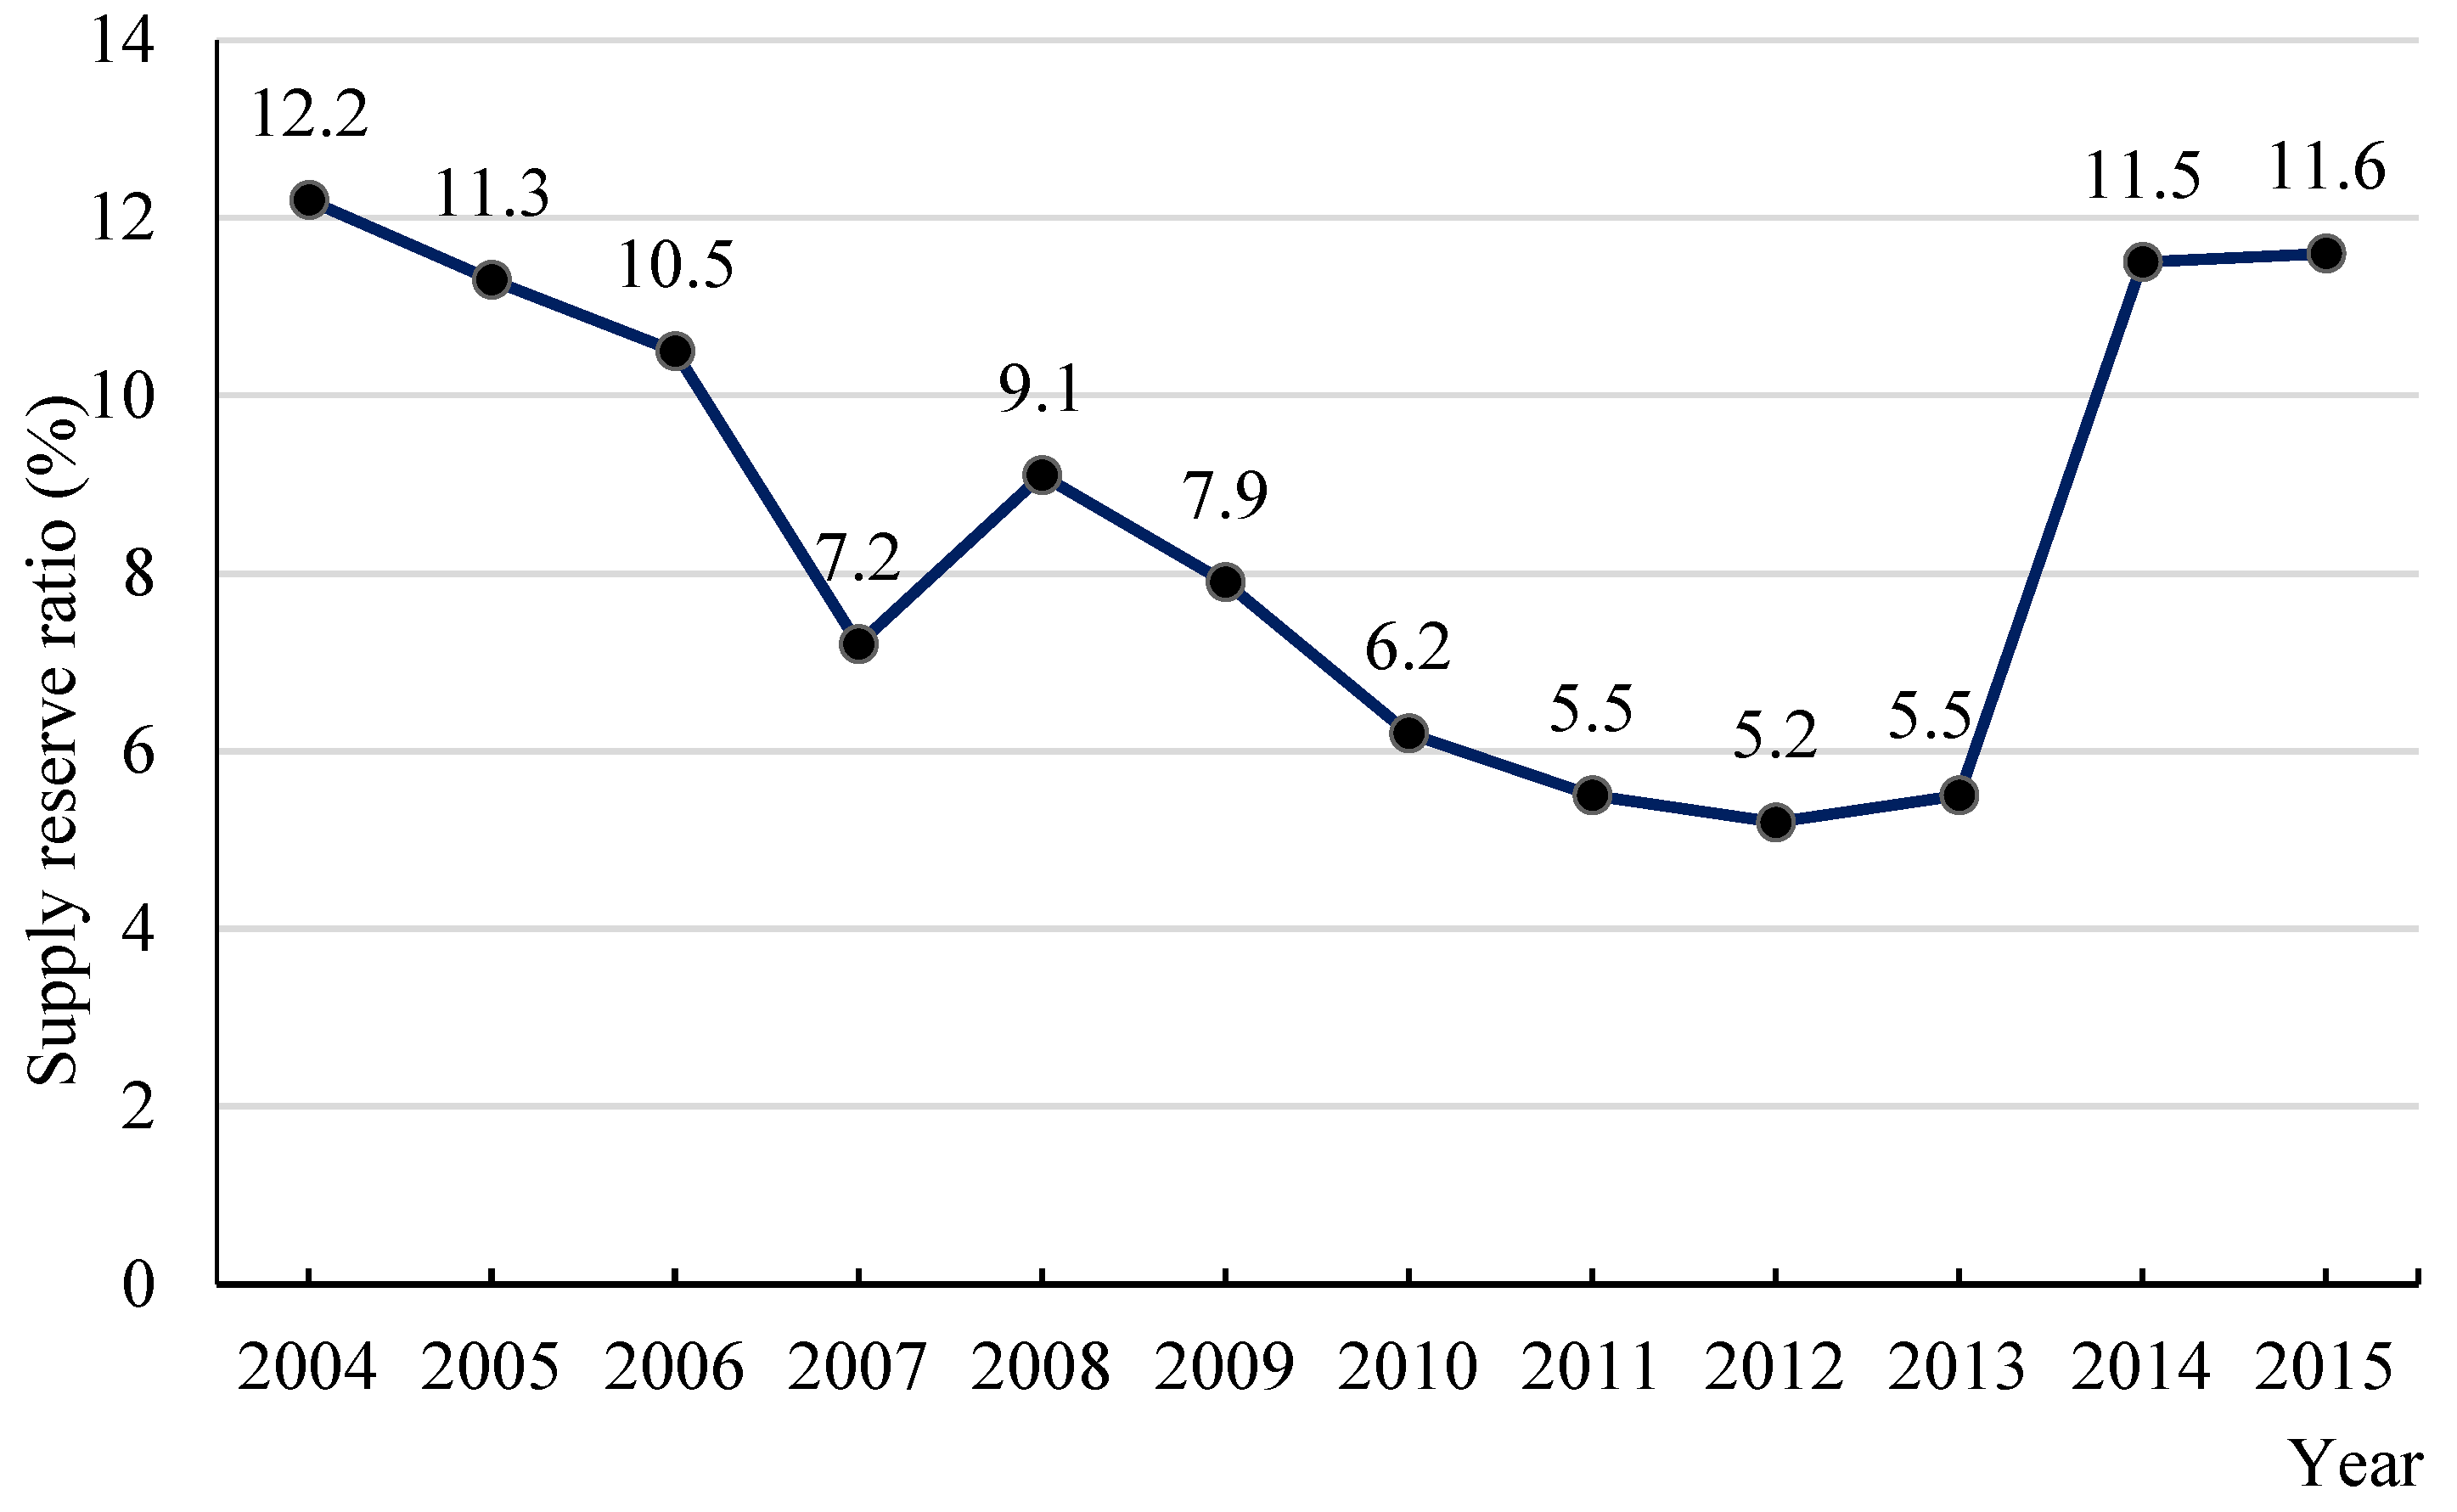
A long-term investment plan is essential for stable power supply because the construction process takes a long time from the investment decision to completion of the facilities. Investment decision-making in the event of a power shortage cannot resolve the imbalance of the supply and demand of electricity. In the case of South Korea, construction times are 6–7 years for a nuclear power plant, 4–5 years for a bituminous coal-fired power plant, and 2–3 years for a gasification combined cycle power plant [1] (NB. In this paper, Korea refers to the Republic of Korea (ROK)). Especially in Korea, it is impossible to import electricity in an emergency due to the isolated power grid. Therefore, optimum investment beforehand is crucial to maintaining a stable power supply.
In Korea, the supply reserve ratio had decreased consistently by 2013 (see Figure 1), and people experienced rolling blackouts in 2011 due to the imbalance of electricity supply and demand. Although the supply reserve ratio has increased since 2014 because of repaired or newly-constructed plants, a long-term electricity-generation mix is another challenge associated with the 2015 Paris Climate Change Conference (COP21), because coal-fired power ranks number one in total power generation by 38.7% [2]. The COP21 reached an agreement on reducing greenhouse gas emissions, and the Korean government proposed a decrease in the proportion of coal-fired power and an increase in nuclear and renewable energy [3].
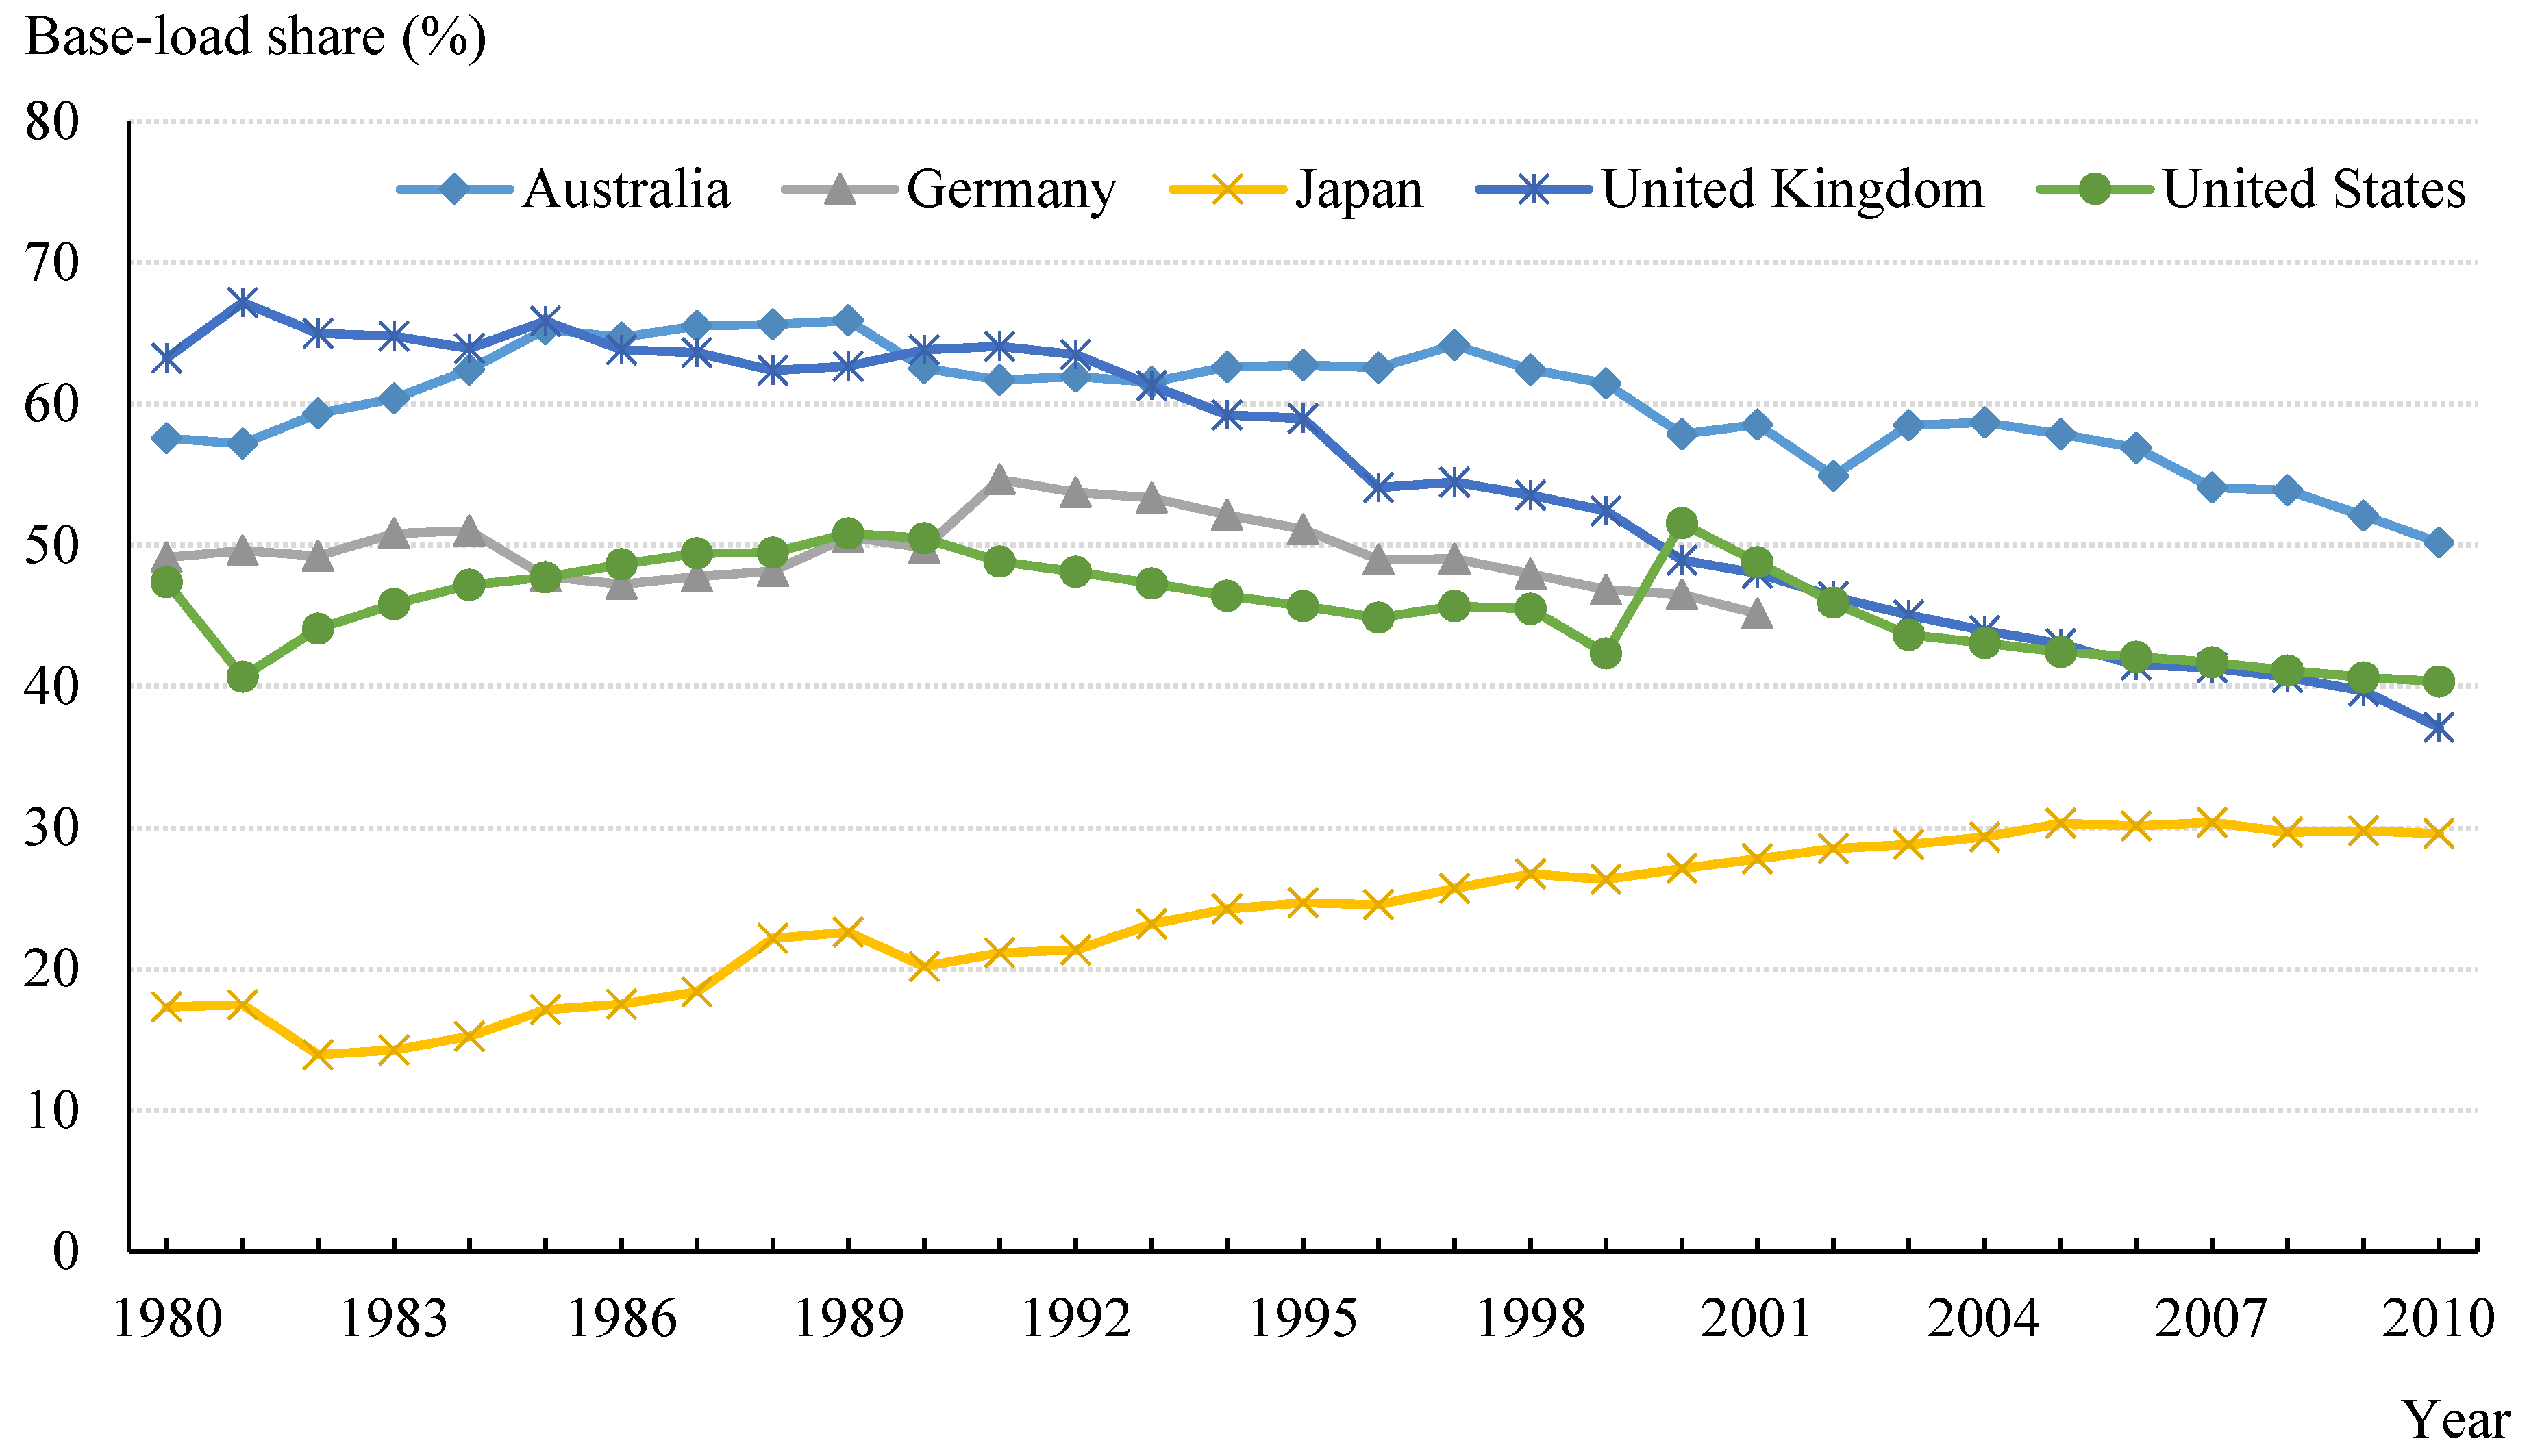
The scale or sector of investments in new power sources and facilities depends on fuel prices and government policies, such as licensing, carbon tax, renewable portfolio standards (RPSs), and market reform. Among the government policies in the energy sector, market reform is a key determinant of the scale of investment because it fundamentally affects the competition and incentive structure of the electric power industry. For example, Figure 2 shows the Organisation for Economic and Co-operation Development (OECD) member countries’ annual average growth rates of generation facilities before and after 10 years of market reform. After the time of market reform, the growth rate decreased in these countries. Furthermore, Figure 3 shows the base-load share, which tends to fall after market reform in the OECD member countries, except Japan.
The electric power industry had been operated in the form of monopolistic public or private companies under the regulations due to its technical and economic characteristics [5,6]. However, with the advent of new technologies such as combined gas turbines, the economies of scale were weakened in the power generation sector, and in some countries such as the United Kingdom, inefficiency in the monopoly system began to appear as a national problem [7]. In addition, due to political orientation that emphasizes the role of the market, neoliberalism was diffused globally [8]. Therefore, in the 1990s, under such backgrounds and purposes, many countries implemented market reform on the electric power industry, starting with the United Kingdom. At that time, the main purpose of the market reform was efficiency improvement through the introduction of competition, but privatization has been carried out to secure national fiscal revenues in some countries, regardless of the inefficiency [9,10].
At the beginning of the market reform, countries promoted liberalization by the forced unbundling of the vertical monopoly system of the United Kingdom, or by the sectoral opening of the monopoly franchise of the United States [11]. Particularly, the reform plan of the United Kingdom, which focused on the introduction of competition such as vertical/horizontal unbundling, privatization, and spot-based power trading, became a reference for market reform in other countries [12]. Thus, most of the existing studies on the electric power industry focused only on a socially-desirable industrial structures or the optimal scale of a desirable number of companies, and the core keywords were economies of scale, management rationalization, and deregulation [13,14]. The electric power market in each country promoted liberalization with the introduction of competition as a top priority, and attempted the unbundling of the competition/noncompetition sectors, as well as the introduction of the independent system operator. Common features after market reform were the introduction of sales competition and bilateral contracts, serving both power generation and sales, a pursuit of supply stability, and the existence of independent regulatory organizations [15].
In the 2000s, various types of industrial structures were developed regarding country-specific conditions—based on trial and error and evaluations—for market reform. Especially, rather than aiming at the competition itself, the policy objectives from the national economic perspective, such as resource adequacy and industrial competitiveness, were the main focus [16]. Therefore, unlike the initial competition-oriented goals, market reform has transformed into a practical approach by simultaneously pursuing competition and integration, as well as combining various market transaction methods in accordance with needs.
The stability and management efficiency of the national energy mix are important factors that determine the types of market reform [17]. For instance, countries with large inefficiency in management or the energy mix prefer rapid reform with unbundling and privatization. In the case of countries with sufficient supply-reserve ratios, they prefer methods of determining facility investments based on the market mechanism. In addition, countries where interchange of electricity is possible prefer reform based on a utility-interactive system. Thus, the market reform of major countries can be classified into three types: unbundling, integration, and utility-interactive. The characteristics of each type are shown in Table 1. Therefore, rather than focusing on how well each type fits into the traditional reform model, efforts to find the most appropriate type of reform should be given priority, based on future industry competitiveness and contribution to the national economy.
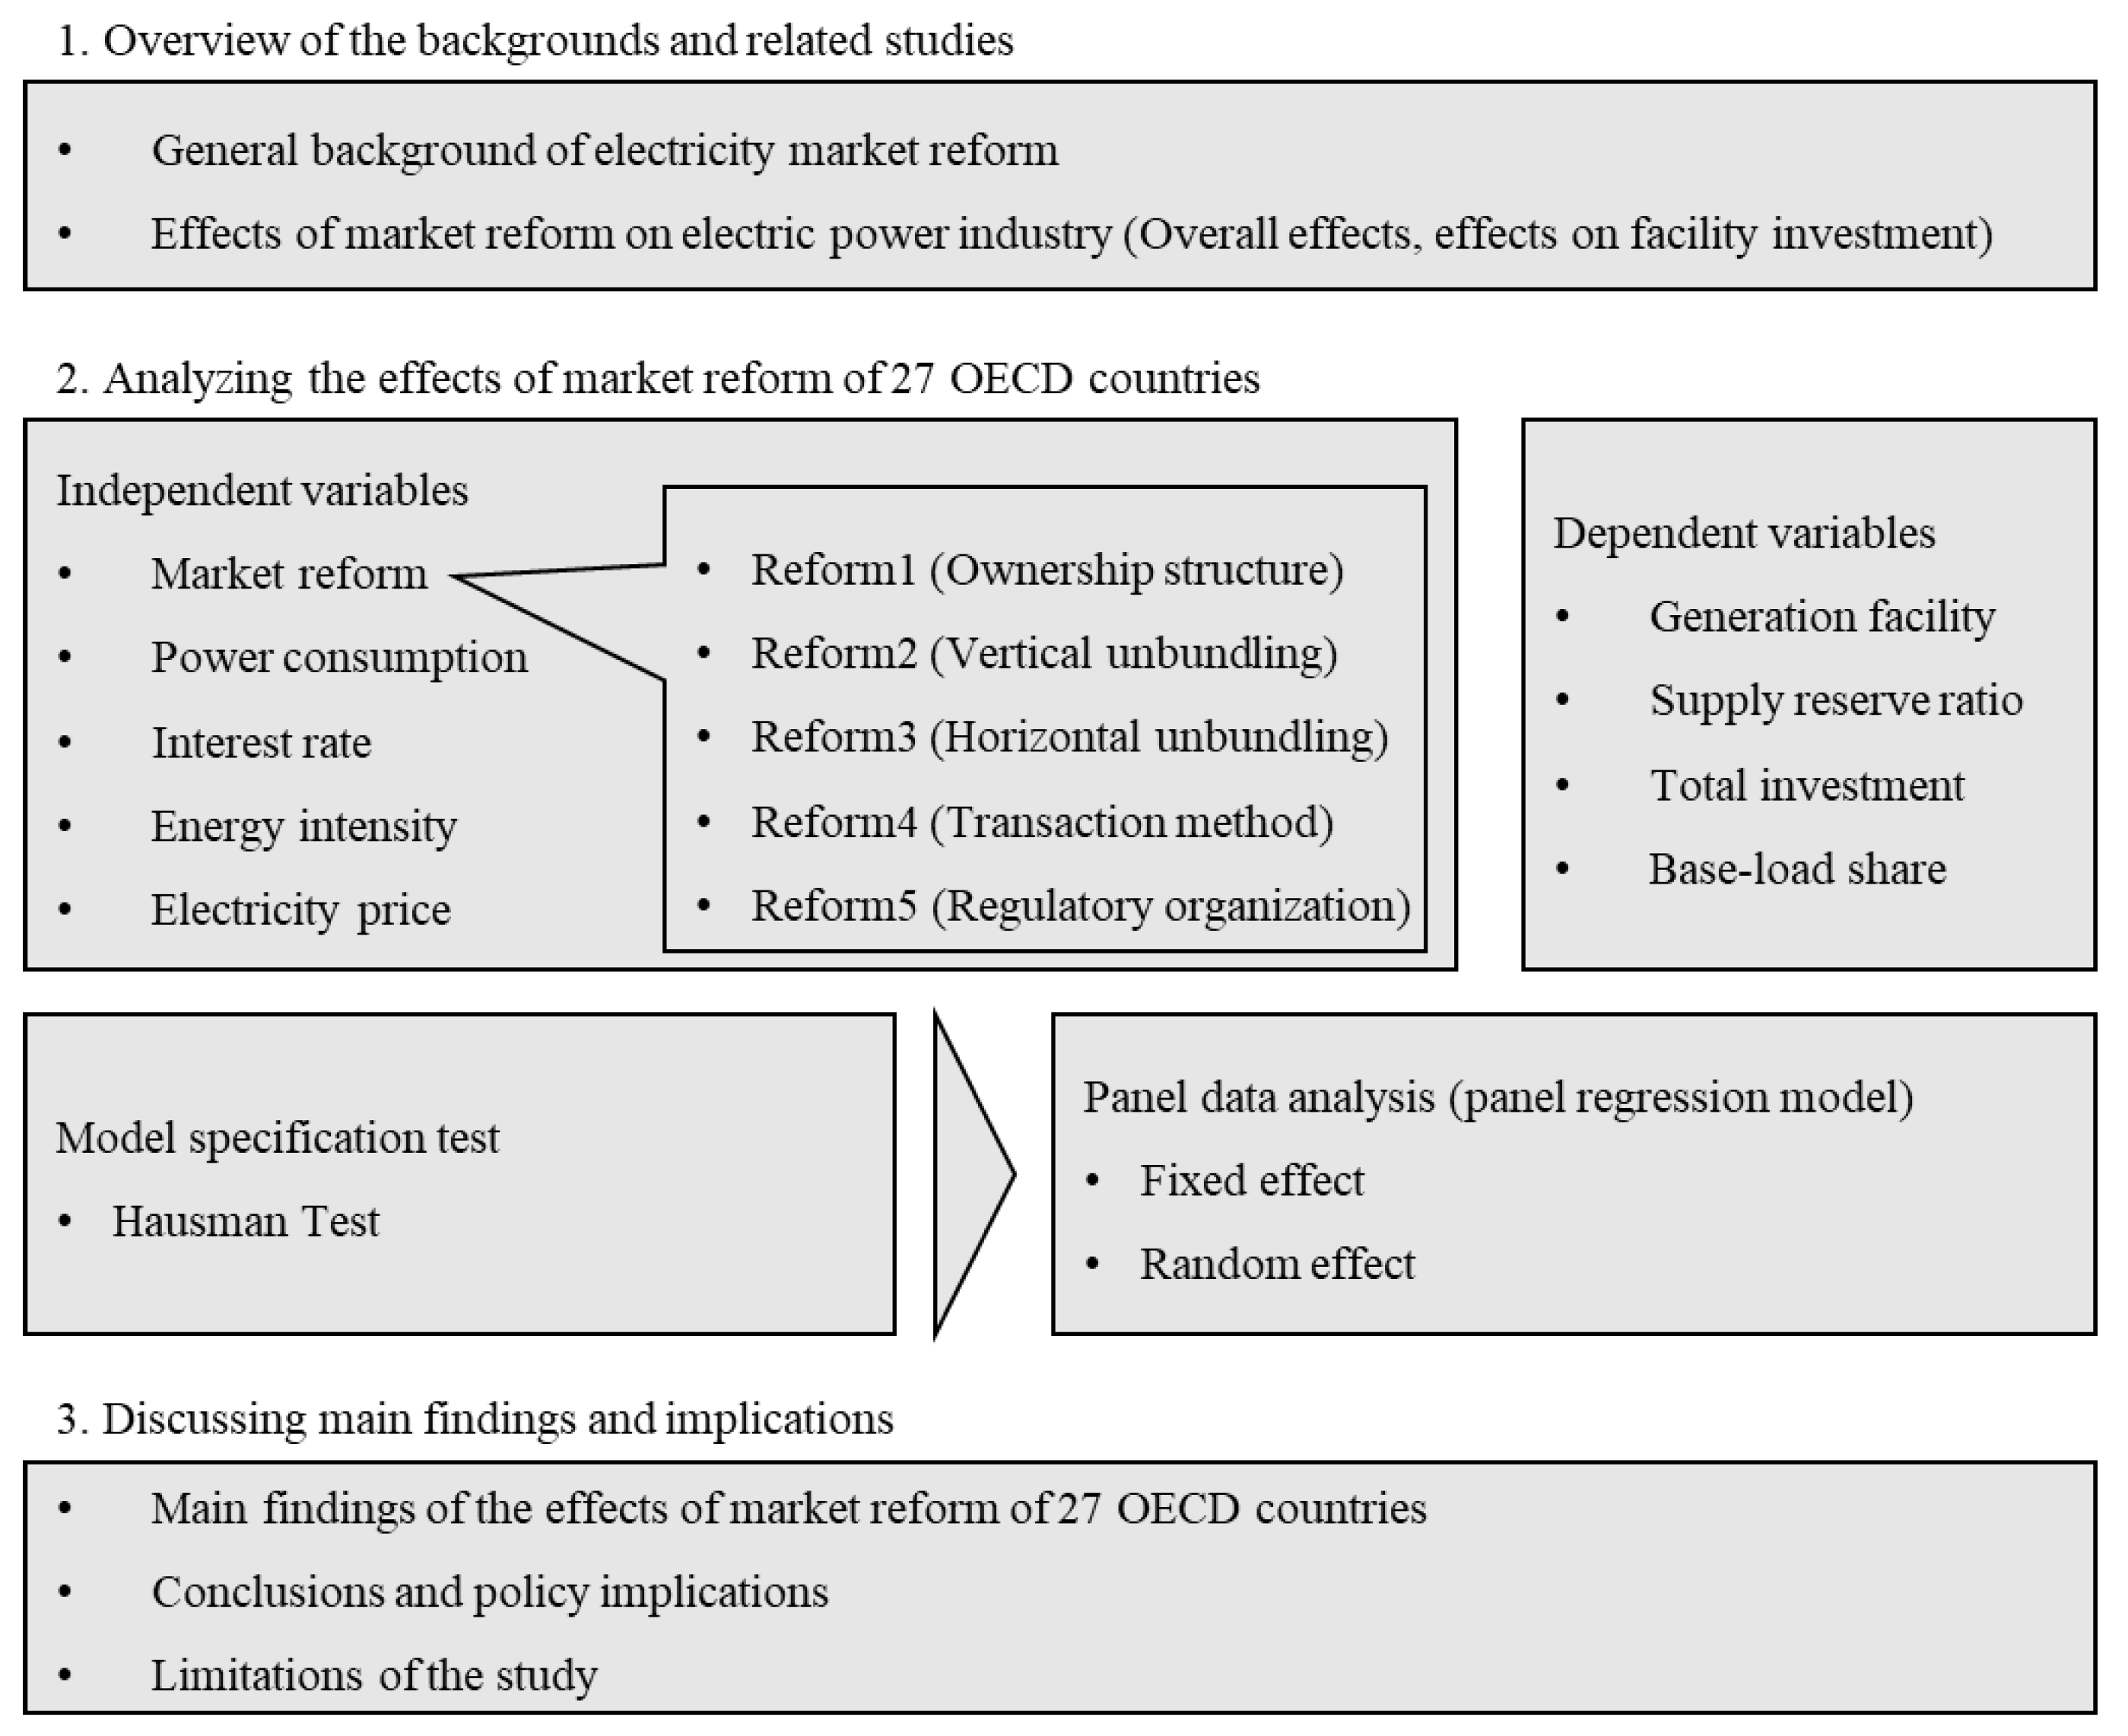
In this study, we used a panel regression model to analyze the effects of the market reform on facility investment in 27 OECD countries. Through empirical analysis, we discuss the impacts of ownership structure, unbundling, change of transaction, and government regulation on investment, and thereby derive policy implications. The schematic overview of this study is provided in Figure 4.
The rest of this study is organized as follows. Section 2 provides an overview of the related previous studies. Section 3 explains the materials and methods used in the analysis. We analyze the effect of the market reform on facility investment through empirical analysis in Section 4. Finally, we discuss the main findings and implications, as well as the limitations of this study in Section 5.
2. Literature Review
Prior to intensively reviewing the effects of electric market reform on facility investment, a discussion of the effects of the reform on the overall electric power industry can be helpful for comprehensive understanding. These effects of market reform can be divided into three perspectives: productivity, consumer, and national economy. The productivity perspective considers the efficiency improvement of plants and profitability of companies; consumer perspective considers the electricity price and supply stability; and national-economy perspective considers research and development (R&D), environmental protection, and facility investment.
2.1. Overall Effects of Market Reform on Electric Power Industry
Table 2 categorizes previous studies analyzing the effects of market reform by their perspective and result. Some analysts have drawn positive conclusions about whether market reform contributes to the productivity and efficiency improvement in the electric power industry. In the case of Japan, productivity was improved in the thermal-power-generation sector after the first and second reforms, which gradually liberalized while maintaining the vertical integration system [18]. In the United States, thermal efficiency was improved in municipal-owned plants, as well as private plants, after the introduction of competition by the reform [19]. However, research has also shown that the unbundling by the reform is not always the optimal method, because there are economies of scale of the production costs in the electric power industry. Ref. [20] estimated the production cost of investor-owned utilities after the reform in the United States, and showed that economies of scale exist in the electric power industry.
The results from the analyses of the effects of market reform on the decline in the electricity price were negative or not significant. In France, Germany, Italy, and the United Kingdom, electricity prices were affected by the power generation method, fuel cost, and per capita power consumption, rather than by market reform [21]. Ref. [22] compared the residential electricity price before and after the passing of the reform laws in the United States, and showed that the effect of the reform on the electricity price was not significant. The estimation result of the regulated electricity price was lower than the actual price, assuming no wholesale market reform, for five independent system operators in the United States [23]. Ref. [24] analyzed the trends of the System Average Interruption Duration Index and System Average Interruption Frequency Index after the reform in Ontario, Canada. They found that both indexes increased in private utilities, and concluded that the effect of the reform on supply stability was also negative.
Moreover, there are both positive and negative effects of market reform on the national economy. Ref. [25] analyzed 70 power generation companies in 15 OECD countries, and found that reform decreases R&D investment. Ref. [26] analyzed the rate of change in the R&D investment for large-scale power generation and transmission facilities in eight European Union (EU) countries, and concluded that both privatization and regulatory reform decrease R&D investment. Furthermore, in order to find the contribution of reform to environmental protection, Ref. [27] analyzed its effect on pollutant emissions for power generation companies in the United States, and confirmed the positive effect of the reform.
To summarize, market reform has generally positive effects from the productivity perspective, but the negative effects from the consumer and national economy perspectives are also significant. In the following section, we focus on the effect of the reform on facility investment, which is the main research topic of this study.
2.2. Effects of Electricity Market Reform on Facility Investment
By the early 2000s, due to the limitation of data, theoretical models were mainly used in analyses of the effects of market reform on facility investment in the electricity industry; however, recently, this topic has been analyzed with a multi-country panel model, as shown in Table 3.
In the electricity industry, there is a possibility that the methods or sectors of market reform negatively affect generation facilities and grid investment. Investment capabilities can be weakened, and the amount of grid investment can be strategically lowered to avoid competition [36]. Thus, the government should allow power generation companies to sell electricity easily, and should be able to provide incentives for new construction [37]. Moreover, in case of inducing investment with a competition system through horizontal unbundling, large-scale licensees impede the penetration of new and small licensees. Therefore, the additional investment incentive may not occur.
Vertical unbundling, which splits grids, in contrast with horizontal unbundling, can partially solve the problem of the strategic reduction of investment [45,49]. Ref. [50] compelled the vertical unbundling in this regard. In the case of grid licensee managing a power generation company simultaneously, improving the grid quality increases the entire profit due to the increased profit from the generation. However, in the case of vertical unbundling, the incentive of grid investment can decrease because there is no benefit from the generation [39,34]. Regarding grid quality, Ref. [46] showed that ownership unbundling causes the deterioration of the grid.
Legal unbundling has the advantage over ownership unbundling when it comes to inducing investment in the upstream industry and maintaining the strengths of vertical unbundling [42]. This is because legal unbundling induces upstream investment to increase the profits from the downstream industry. However, regardless of the profit motive, the dependability and repayment ability can be underestimated by unbundling the power generation sector, leading to the increase of financial expense in investment, which could have an adverse effect on investment [37].
On the other hand, in the case of generation facilities invested by private capital, their compliance becomes uncertain, and there is a possibility of lowering investment strategically to increase profit. This is because increasing the proportion of the companies in the private sector decreases the regulatory power of the government and increases the uncertainty of plants with regard to planning or construction, so that the uncertainty of the proper reserve ratio also increases. The investment incentive of peak-load generation of private company can decrease, because the rise of electricity price can increase profit when the electricity supply is less than the power demand [38]. On the other hand, the investment will increase to compensate for the loss of industry profit, because the competition can be intensified due to the privatization and relaxed barriers [40]. The results of the studies of international comparisons differ in that they find that privatization is both positively [40] and negatively [43] related to investment.
Changing transaction methods, like imposing a bilateral contract, option, and forward contract to wholesale markets, also has positive effects on investment by lessening the financial hazards of facility investment [37,51]. Besides the change in transaction method, the decision method of electricity price or the cost itself also affect facility investment. Rather than the decision method using the rate of return (RoR), incentive regulation, which controls the incentive after deciding the maximum cost of the power, is more profitable for increasing the investment incentive [44]. Under the RoR regulation, the government can adjust the price, which is “cost + a certain level of profit”, by disallowing some of accounting costs of power generation companies, but this can give a negative signal to investors [37].
There is a positive correlation between electricity price and investment, because the higher the price, the larger the investment incentive; the amount of the investment increases by 3–4% when the electricity price increases by 10% [34]. Furthermore, the excessive intervention of the government with regard to the electricity price aggravates the profitability of licensees, and this can be a cause of the instability of supply and demand [37].
It is understood that market reform can decrease investment in base-load power. If a period of investment payback or facilities construction is long, project risk becomes higher, and the investment cannot be sufficient without a guarantee of higher returns. As a result, the proportion of generation facilities with relatively less investment costs and shorter construction periods is likely to increase [37]. However, it is possible to maintain a proper energy mix by the government regulations of plant licensing. In the United Kingdom, there was a case for suspending the licensing of new gas power plants, as the gas power generation increased rapidly after the reform. In Korea, on the other hand, electricity capacity markets after the reform failed to reflect the opportunity costs of the generation facilities, so the base-load share dropped. The proportion of time that the system marginal price (SMP) is determined by peak generators increased to 93% in 2010 from 65% in 2001 because of insufficient base-load generators [52]. However, the peak-load share may not increase because of the electricity price system, as well as economic feasibility in Korea. As a result of forecasting the energy mix change of Korea using the Wien Automatic System Planning Package (WASP) model, one of cost minimization models, the proportion of gas generation did not increase because of its low economic feasibility, although a higher carbon tax is levied on coal and petroleum [53]. Furthermore, under the current Korean electricity price system, which pays a capacity cost to solve the missing money problem by the price ceiling policy, it is difficult to increase the proportion of gas generation.
3. Materials and Methods
We analyzed the statistical relationships between the dependent variables, with regard to investments in the electricity industry, and independent variables, with regard to market reform. The effect of market reform on the base-load share has only been analyzed qualitatively in the extant literature. In addition, the effect of the electricity price on investment is only analyzed empirically by [34]. As such, in this section, we check the effects of market reform quantitatively through various models. We use data of 27 countries that performed electricity market reform from 1980 to 2010, which are Australia, Austria, Belgium, Canada, Denmark, Finland, France, Germany, Greece, Hungary, Iceland, Italy, Japan, Korea (ROK), Luxembourg, Mexico, the Netherlands, New Zealand, Norway, Poland, Portugal, Spain, Sweden, Switzerland, the United Kingdom, and the United States. We use data from 1980 to 2010, but due to the lack of data on the supply reserve ratio in some countries, we use the data of the available period.
Like the recent studies analyzing the relationships between market reform and investment, we use a panel regression model considering random effects and fixed effects for empirical analysis as follows:
We use four different variables as dependent variables (), which are: the capacity of generation facilities, supply reserve ratio, total investment in the electricity industry, and base-load share. The capacity of generation facilities is the power-generation capacity of each country, and the supply reserve ratio is defined as follows:
The total investment is the amount of investment in the overall electricity industry including power generation, transmission, and distribution. To analyze the impact of market reform on the energy mix, we use the base-load share data as a dependent variable.
The explanatory variables include policy variables related to market reform () and control variables representing country characteristics (). is a dummy variable indicating whether country i reforms the electricity market at time t, so it has values of 0 and 1 indicating before and after the reform, respectively. The time when each country starts the reform is referenced from the study of [54]. It also indicates the types of reform and their levels in the electricity market in country i. In Models 5–8, we evaluate the level of market reform using a five-point scale in terms of ownership structure (level of privatization), vertical unbundling, horizontal unbundling, transaction method (level of liberalization), and regulatory organization. Here, the market reform level of each country is measured as the total sum of the above five variables, derived by evaluation opinions of Korean experts from industry and academia, such as KEPCO. For the control variables, electric power consumption is the net generation of electricity, and the interest rate is the lending interest rate of the private generation sector. Furthermore, energy intensity is primary energy consumption as a proportion of gross domestic product, and the electricity price is the retail price of the electricity. and are coefficients of the explanatory variables to be estimated.
The term denotes a constant, and the denotes a random error. In the model specification, researchers choose the random effect model or the fixed effect model regarding the assumption of the constant term . The random effect model assumes that is a time variant, whereas the fixed effect model assumes that is a time invariant. First, the regression model is estimated using both the random effect and the fixed effect; then the correlations between the results of the two models are tested through Hausman test. The Hausman test is a model specification test which has been widely used for the panel data analysis to identify models between random effect and fixed effect models [55,56]. If the correlation is not significant, the estimation results of the random effect model is chosen; if it is significant, the fixed effect model is chosen. In this study, we estimate both the random effect model and the fixed effect model, and discuss the analysis results by focusing on the most valid model.
Data on the generation facilities, supply reserve ratios, base-load shares, and electricity prices are from [4], and data on power consumption and energy intensity are from [57]. The total investment data are from [58], and interest rate data are from [59]. Table 4 shows the correlations among market reform, interest rate, power consumption, and energy intensity. In addition, there are five types of market reform, so the correlations among the control variables, including the five types of reform, are shown in Table 5.
4. Results and Discussion
4.1. Investment after Market Reform
We estimated four models using different dependent variables, using the dummy variable indicating market reform as an explanatory variable. As a result of the Hausman test, it was desirable to reject the null hypothesis that the correlation between and explanatory variables of Model 1 is zero (χ2 = 116.32). Thus, we chose the estimation results of the fixed effect model for Model 1 and the random effect model for Model 2, 3, and 4. Table 6 shows the estimation results.
First, regarding market reform itself, it only has negative effects on generation facilities amongst the dependent variables. In general, a supply reserve ratio below a certain low value is a critical problem, but an excessively high reserve ratio also could be an important issue for effective investment. Thus, Model 2, which analyzes the absolute value of the reserve ratio shows very low explanatory power.
Generation facilities, total investment, and electricity price have positive correlations with each other. Considering the results of Models 1, 3, and 4, it is natural that generation facilities and total investment increase as electric power consumption increases. Thus, an increase in the power consumption or electricity price increases the generation facilities and total investment, but it does not have a statistically significant effect on the supply reserve ratio. The positive correlations of electricity price, generation facilities, and total investment mean that we should consider that lowering the cost through market reform can have a negative influence on facility investment. Furthermore, regarding the interest rate and energy intensity, Models 1, 2, and 3 show that they have no statistically significant effect on the generation facilities, supply reserve ratio, and total investment.
Moreover, the base-load share is positively related to power consumption, energy intensity, and electricity price, but negatively related to the interest rate because it is more cost-effective to increase the base-load share under an energy overconsumption system with high consumption or energy intensity. In general, the base-load share increases under good investment conditions with a low interest rate or high electricity price because the construction cost of base-load generation facilities is high in general.
4.2. Investment by Level of Market Reform
To analyze the effect of the type and level of market reform on facility investment, we estimated four different models (Models 5–8) by including five types of market reform as the explanatory variables. Each variable of the five types of the market reform has a value of 1 to 5 based on its level. As a result of the Hausman test, the null hypothesis was rejected in Model 5, 6, and 8. Therefore, we chose the estimation results of the fixed effect model for Model 5, 6, and 8 and the random effect model for Model 7. Table 7 shows the estimation results.
We can find that as the ratio of the power generation of private companies increases, there are negative effects on generation facility and base-load share. This result coincides with the previous literature, which concludes that the privatization of the electricity market has a negative influence on facility investment. Especially, in the case of base-load facilities, it is possible for the private company to reduce its investment because of the high uncertainty due to the large investment amount and long construction time.
Vertical unbundling has a positive relationship with the supply reserve ratio, which means that the strategy of European Union, i.e., pushing ahead with investment expansion through vertical unbundling, is meaningful. However, as the effects of vertical unbundling on investment vary depending on whether the method of vertical unbundling is ownership or legal unbundling, we need an additional analysis to distinguish these two bundling types. Furthermore, horizontal unbundling does not significantly affect the generation facility.
The level of liberalization of the transaction method has a positive effect on generation facility, supply reserve ratio, and base-load share. It seems that the operation of spot and future markets and activation of bilateral contracts decrease the risk of investment by lowering the uncertainty of future demand and price. However, the demand for the future market to reduce the volatility of the electricity price may not be high when the number of participants is very limited, and price volatility is low because of government intervention on the electricity price, like in Korea [60].
The level of establishment of regulatory organizations has a negative influence on generation facility and base-load share. Moreover, the generation facility has a negative correlation with the interest rate, while the base-load share has a positive correlation with energy intensity and negative correlation with the electricity price. In addition, the electricity price has a positive correlation with the total investment, which is the same result as that of [34]. As expected, power consumption increases the total investment and reduces the supply reserve ratio. The effects of other control variables are similar to the results of the previous studies [34,40,41,46].
In the case of Korea, the efficiency of combined cycle power decreases because it has four distinct seasons, and the price of natural gas is high due to the cross-subsidy. Thus, the peak-load share is not likely to increase [53], but we should be aware of the tipping effect of peak-load generation due to changes in investment incentives, as the empirical analysis shows. Regulatory organization can be a burden to companies, so it can have a negative effect on facility investment. The regulation of the electricity price can also negatively affect investment and base-load share. With regard to the level of price regulation, whether the level can induce adequate facility investment as well as prices and consumer benefits needs to be considered. Vertical unbundling contributes to raising the reserve ratio, whereas horizontal unbundling does not have any significant effect on investment. The effect on investment is limited because the generation facilities and total investment were not statistically affected. Imposing spot and future markets, as well as bilateral contracts, have positive effects on investment by lowering the volatility risks of the price and demand, but in the case of the future market in the Korean electric power market, the benefits of the imposition may not be large.
5. Conclusions
This study analyzes the effects of market reform on generation facilities, supply reserve ratio, total investment in the electricity industry, and base-load share. For the empirical analysis, we performed four panel regression models using the data of 27 OECD countries. The panel data analysis showed that the electricity market reform has a negative effect on the generation facility, and has no statistically significant effect on supply reserve ratio, the amount of investment, and base-load share. When we considered five types of the market reform, we found that privatization of the electricity market has negative effects on the generation facility and base-load share. Vertical unbundling has a positive effect on the supply reserve ratio, but the horizontal unbundling has no statistically significant effect on the facility investment.
From the results, we also found that the generation facilities decreased after market reform under the assumption of ceteris paribus. This means that electricity market reform, which has been conducted to increase the efficiency of the electricity market in many countries, has a negative effect on facility investment, and it seems that there is the danger of hindering the supply stability. In addition, the electricity supply and price can be unstable and volatile from privatization and a low base-load share. In particular, when the construction compliance of the private power-generation companies is decreased and there is no compulsory institutional method to force it, as in Korea, market reform can be a negative factor in the supply stability of electricity.
The limitations of this study are as follows. First, our analysis does not cover the entire 1980–2010 period for some countries due to the lack of data. Second, despite the significant implications presented here, it is a challenge to generalize the results because the detail structures and policies of the electricity industry vary by country. Therefore, future studies need to consider supplementary data and additional explanatory variables to overcome these limitations.
Author Contributions
J.L. and Y.C. designed and developed the idea of the paper. C.P. and Y.C. reviewed related previous studies. Y.K. and J.L. analyzed the data. All authors wrote and reviewed the~manuscript.
Funding
This work was partly supported by the Korea Electric Power Corporation (KEPCO).
Conflicts of Interest
The authors declare no conflicts of interest.
References
- KPX (Korea Power Exchange). Trends in Generation Facilities by Plant; KPX: Jeollanam-do, Korea, 2015. (In Korean) [Google Scholar]
- KEPCO (Korea Electric Power Corporation). Statistics of Electric Power in Korea; KEPCO: Naju, Korea, 2016. (In Korean) [Google Scholar]
- Kim, S.; Yang, M.; Lee, J. The Potential Role of Nuclear Power in Mitigating Greenhouse Gas Emissions and Implications; Korean Society for Energy: Seoul, Korea, 2016. (In Korean) [Google Scholar]
- IEA (International Energy Agency). Energy statistics of OECD; IEA: Paris, France, 2013. [Google Scholar]
- Filipović, S.; Tanić, G. The policy of consumer protection in the electricity market. Econ. Ann. 2018, 53, 157–182. [Google Scholar] [CrossRef]
- Meyer, P.A. The Municipally Owned Electric Company’s Exemption from Utility Commission Regulation: The Consumer’s Perspective. Case West. Res. Law Rev. 1982, 33, 294. [Google Scholar]
- Miller, R.L. Starlite economics: Requirements and methods. In Proceedings of the 16th International Symposium on Fusion Engineering, Champaign, IL, USA, 30 September–5 October 1995. [Google Scholar]
- Sirasoontorn, P.; Quiggin, J. The political economy of privatization in the Thai electricity industry. J. Asia Pac. Econ. 2007, 12, 403–419. [Google Scholar] [CrossRef]
- Abbott, M. Determining levels of productivity and efficiency in the electricity industry. Electr. J. 2005, 18, 62–72. [Google Scholar] [CrossRef]
- Dekrajangpetch, S.; Sheblé, G.B. Structures and formulations for electric power auctions. Electr. Power Syst. Res. 2000, 54, 159–167. [Google Scholar] [CrossRef]
- Bacon, R.W.; Besant-Jones, J. Global electric power reform, privatization, and liberalization of the electric power industry in developing countries 1. Annu. Rev. Energy Environ. 2001, 26, 331–359. [Google Scholar] [CrossRef]
- Littlechild, S. Competition and contracts in the Nordic residential electricity markets. Util. Policy 2006, 14, 135–147. [Google Scholar] [CrossRef]
- Joskow, P.L. Restructuring, competition and regulatory reform in the US electricity sector. J. Econ. Perspect. 1997, 11, 119–138. [Google Scholar] [CrossRef]
- Kaserman, D.L.; Mayo, J.W. The measurement of vertical economies and the efficient structure of the electric utility industry. J. Ind. Econ. 1991, 39, 483–502. [Google Scholar] [CrossRef]
- Biskas, P.N.; Bakirtzis, A.G. Decentralised security constrained DC-OPF of interconnected power systems. IEE Proc. Gener. Transm. Distrib. 2004, 151, 747–754. [Google Scholar] [CrossRef]
- Kiesling, L.L. Deregulation, Innovation and Market Liberalization: Electricity Regulation in a Continually Evolving Environment; Routledge: Abingdon, UK, 2008. [Google Scholar]
- KDI (Korea Development Institute). Cases Study of Market Reform of Overseas Electric Power Industry and Its Implications; Final Report; KDI: Seoul, Korea, 2008. (In Korean) [Google Scholar]
- Nakanoa, M.; Managi, S. Regulatory reforms and productivity: An empirical analysis of the Japanese electricity industry. Energy Policy 2008, 36, 201–209. [Google Scholar] [CrossRef]
- Craig, J.D.; Savage, S.J. Market restructuring, competition and the efficiency of electricity generation: Plant-level evidence from the United States 1996 to 2006. Energy J. 2013, 34, 1–31. [Google Scholar]
- Arocena, P.; Coelli, T.; Saal, D. Measuring Economies of Integration in the US Power Industry: How Costly Is Vertical Unbundling; Aston Business School Research Papers; Aston University: Birmingham, UK, 2010. [Google Scholar]
- Florio, M. Electricity prices as signals for the evaluation of reforms: An empirical analysis of four European countries. Int. Rev. Appl. Econ. 2007, 21, 1–27. [Google Scholar] [CrossRef]
- Hickey, E.A.; Carlson, J.L. An analysis of trends in restructuring of electricity markets. Electr. J. 2010, 23, 47–56. [Google Scholar] [CrossRef]
- Mount, T. Electricity Restructuring: Success of Failure? Technology Policy Institute Working Paper; Technology Policy Institute: Washington, DC, USA, 2008. [Google Scholar]
- Cronin, F.J.; Motluk, S. Ten years after restructuring: Degraded distribution reliability and regulatory failure in Ontario. Util. Policy 2011, 19, 235–243. [Google Scholar] [CrossRef]
- Kim, J.; Kim, Y.; Flacher, D. R&D investment of electricity-generating firms following industry restructuring. Energy Policy 2012, 48, 103–117. [Google Scholar]
- Schmitt, S.; Kucsera, D. The Impact of the Regulatory Reform Process on the R&D Investment of European Electricity Utilities. Rev. Netw. Econ. 2014, 13, 35–67. [Google Scholar]
- Sharabaroff, A.; Boyd, R.; Chimeli, A. The environmental and efficiency effects of restructuring on the electric power sector in the United States: An empirical analysis. Energy Policy 2009, 37, 4884–4893. [Google Scholar] [CrossRef]
- Fabrizio, R.K.; Rose, N.; Wolfram, C. Does competition reduce costs? Assessing the impact of regulatory restructuring on US electric generation efficiency. Am. Econ. Rev. 2007, 97, 1250–1277. [Google Scholar] [CrossRef]
- Aghdam, R.F. Dynamics of productivity change in the Australian electricity industry: Assessing the impacts of electricity reform. Energy Policy 2011, 39, 3281–3295. [Google Scholar] [CrossRef]
- Lenard, T.M.; Mcgonegal, S. Evaluating the Effects of Wholesale Electricity Restructuring; Technology Policy Institute: Washington, DC, USA, 2008. [Google Scholar]
- Swadley, A.; Yucel, M. Did residential electricity rates fall after retail competition?—A dynamic panel analysis. Energy Policy 2011, 39, 7702–7711. [Google Scholar] [CrossRef]
- Blumsack, S.; Lester, B.L.; Jay, A. Prices and costs for electric utilities under regulation and restructuring. In Proceedings of the Alfred Sloan Foundation Industry Studies Program Annual Meeting, Boston, MA, USA, 1–2 May 2008. [Google Scholar]
- Zarnikaua, J.; Whitworth, D. Has electric utility restructuring led to lower electricity prices for residential consumers in Texas? Energy Policy 2006, 34, 2191–2200. [Google Scholar] [CrossRef]
- Gugler, K.; Rammerstorfer, M.; Schmitt, S. Ownership unbundling and investment in electricity markets—A cross country study. Energy Econ. 2013, 40, 702–713. [Google Scholar] [CrossRef]
- Chaton, C.; Guillerminet, M. Competition and environmental policies in an electricity sector. Energy Econ. 2013, 36, 215–228. [Google Scholar] [CrossRef] [Green Version]
- Borenstein, S. The competitive effects of transmission capacity in a deregulated electricity industry. RAND J. Econ. 2000, 31, 294–325. [Google Scholar] [CrossRef]
- KEEI (Korea Energy Economics Institute). A Study of Ensuring Security in Electricity Supply under a Newly Restructured Market System; Research Paper; Korea Energy Economics Institute: Seongan-dong, Korea, 2001. (In Korean) [Google Scholar]
- Peluchon, B. Is Investment in Peak Generation Assets Efficient in a Deregulated Electricity Sector; Research Symposium European Electricity Markets: The Hague, The Netherlands, 2003. [Google Scholar]
- Buehler, S.; Schmutzler, A.; Benz, M.A. Infrastructure Quality in Deregulated Industries: Is there an Underinvestment Problem? Int. J. Ind. Organ. 2004, 22, 253–267. [Google Scholar] [CrossRef] [Green Version]
- Alesina, A.; Ardagna, S.; Nicoletti, S.; Schiantarelli, F. Regulation and Investment. J. Eur. Econ. Assoc. 2005, 3, 791–825. [Google Scholar] [CrossRef] [Green Version]
- Lyon, T.; Mayo, J. Regulatory Opportunism and Investment Behavior: Evidence from the U.S. Electric Utility Industry. RAND J. Econ. 2005, 36, 628–644. [Google Scholar] [CrossRef]
- Cremer, H.; Cremer, J.; de Donder, P. Legal Versus Ownership Unbundling in Network Industries; Working Paper; University of Toulouse: Toulouse, France, 2006. [Google Scholar]
- Zhang, Y.-F.; Parker, D.; Kirkpatrick, C. Electricity Sector Reform in Developing Countries: An Econometric Assessment of the Effects of Privatisation. J. Regul. Econ. 2008, 33, 159–178. [Google Scholar] [CrossRef] [Green Version]
- Cambini, C.; Rondi, L. Incentive Regulation and Investment: Evidence from European Energy Utilities. J. Regul. Econ. 2010, 38, 1–26. [Google Scholar] [CrossRef]
- Schmitt, S.; Rammerstorfer, M. Ownership Unbundling, Investments and Consumer Prices—A Panel Data Analysis; Working Paper; Institute for Regulatory Economics, Vienna University of Economics and Business: Wien, Austria, 2010. [Google Scholar]
- Nardi, P. Transmission network unbundling and grid investments. Evidence from the UCTE countries. Util. Policy 2012, 23, 50–58. [Google Scholar] [CrossRef]
- Meletiou, A.; Cambini, C.; Masera, M. Regulatory and ownership determinants of unbundling regime choice for European electricity transmission utilities. Util. Policy 2018, 50, 13–25. [Google Scholar] [CrossRef]
- Imam, M.; Jamasb, T.; Llorca, M. Power Sector Reform and Corruption: Evidence from Sub-Saharan Africa; EPRG Working Paper 1801; University of Cambridge: Cambridge, UK, 2018. [Google Scholar]
- Leautier, T.-O. Transmission constraints and imperfect markets for power. J. Regul. Econ. 2001, 19, 27–54. [Google Scholar] [CrossRef]
- European Union Commission. An Energy Policy for Europe; European Union Commission: Brussels, Belgium, 2007. [Google Scholar]
- KDI (Korea Development Institute). Causes of the Crisis in the Electricity Industry and Future Policy Directions; KDI Policy Forum; KDI: Seoul, Korea, 2013; Volume 252. (In Korean) [Google Scholar]
- KDI (Korea Development Institute). Competition Policy for the Electricity Industry of Korea; KDI Research Paper; KDI: Seoul, Korea, 2012. (In Korean) [Google Scholar]
- KEEI (Korea Energy Economics Institute). Study of the Effects of Electric Industry Restructuring on Power Generation Fuels; Basic Research Paper; KDI: Seoul, Korea, 2004. (In Korean) [Google Scholar]
- Al-Sunaidy, A.; Green, R. Electricity deregulation in OECD countries. Energy 2006, 31, 769–787. [Google Scholar] [CrossRef]
- Hartarska, V.; Nadolnyak, D. Do regulated microfinance institutions achieve better sustainability and outreach? Cross-country evidence. Appl. Econ. 2007, 39, 1207–1222. [Google Scholar] [CrossRef]
- Hausman, J.A. Specification tests in econometrics. Econometrica 1978, 46, 1251–1271. [Google Scholar] [CrossRef]
- EIA (Energy Information Administration). Electric Power Annual 2012; Energy Information Administration, U.S. Department of Energy: Washington, DC, USA, 2014.
- EUROSTAT-Data. Annual Detailed Enterprise Statistics of Manufacturing, Gas, and Water Supply; Eurostat: Luxembourg, 2013. [Google Scholar]
- World Bank. Power Market Structure: Revisiting Policy Options; The World Bank: Washington, DC, USA, 2013. [Google Scholar]
- KRX (Korea Exchange). Feasibility Study on the Introduction of Electricity Futures; Summary Report; KRX: Busan, Korea, 2013. (In Korean) [Google Scholar]
Figure 1.
Supply reserve ratio in Korea [1].
Figure 1.
Supply reserve ratio in Korea [1].

Figure 2.
Annual growth rates of generation facilities in major OECD countries [4]. In the case of the United Kingdom, we compared five years before and after market reform due to the lack of data.
Figure 2.
Annual growth rates of generation facilities in major OECD countries [4]. In the case of the United Kingdom, we compared five years before and after market reform due to the lack of data.
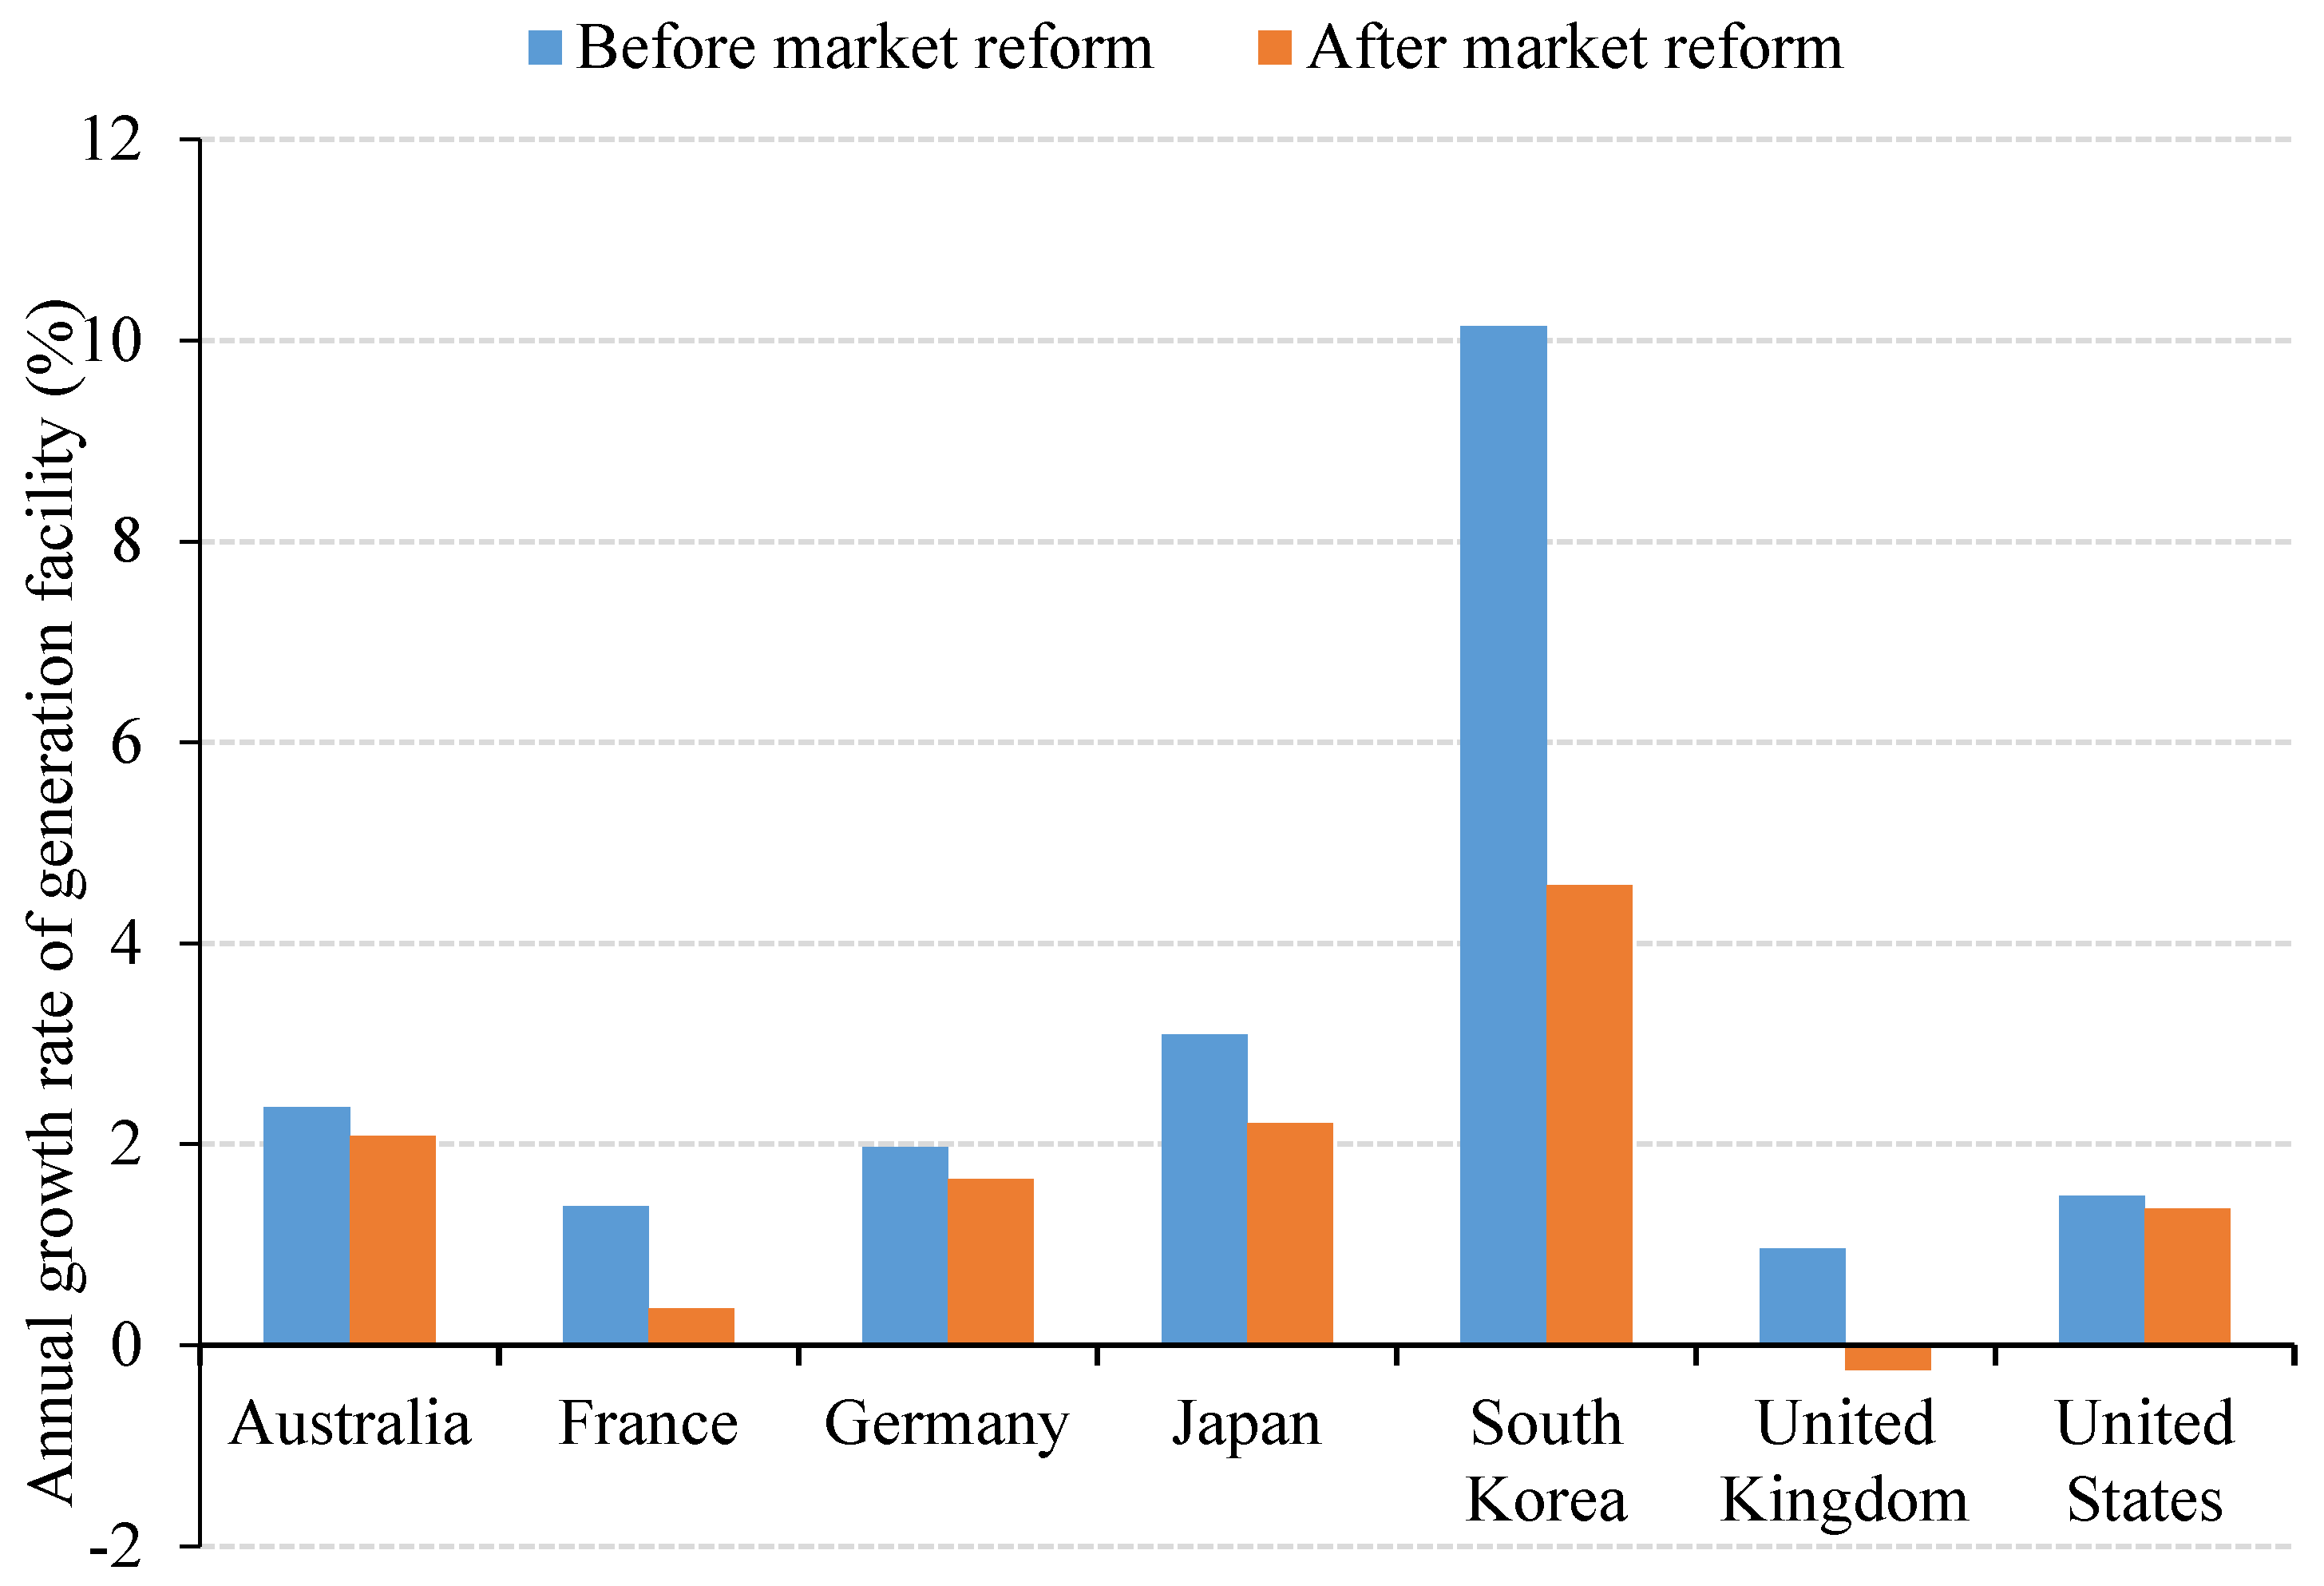
Figure 3.
Base-load shares of major OECD countries [4].
Figure 3.
Base-load shares of major OECD countries [4].

Figure 4.
Schematic overview of this study.

Table 1.
Types of market reform of major countries.
| Type | Characteristics | Countries |
|---|---|---|
| Unbundling |
| United Kingdom, United States (CAL), Australia |
| Integration |
| France, Germany |
| Utility-Interactive |
| United States (PJM), Norway, Sweden |
Table 2.
Studies on overall effects of market reform.
| Perspectives | Positive | Positive and Negative | Negative |
|---|---|---|---|
| Productivity | [18,19,28] | [20,29] | [30] |
| Consumer | [22] | [31] | [21,23,24,32,33] |
| National economy | [27,34] | [25,26,35] |
Table 3.
Previous studies analyzing the relationship between market reform and facility investment in electricity industry.
Table 3.
Previous studies analyzing the relationship between market reform and facility investment in electricity industry.
| Study | Methodology | Subject of Analysis | Result of Research | |
|---|---|---|---|---|
| Dependent Variables | Explanatory Variables | |||
| Borenstein et al. (2000) [36] | Cournot model (theory) | - | - |
|
| KEEI (2001) [37] | Case study | - | - |
|
| Peluchon (2003) [38] | Market equilibrium (theory) | - | - |
|
| Buehler et al. (2004) [39] | Market equilibrium (theory) | - | - |
|
| Alesina et al. (2005) [40] | Dynamic panel model | Investment/capital | Ownership structure, barrier to entry, comprehensive regulation |
|
| Lyon and Mayo (2005) [41] | Panel model | Investment | Characteristics of power generation company and state government |
|
| Cremer et al. (2006) [42] | Market equilibrium (theory) | - | - |
|
| Zhang et al. (2008) [43] | Panel model | Output capacity | Regulatory level, degree of competition and privatization |
|
| Cambini and Rondi (2010) [44] | Panel model | Rate of investment | Rate of return, incentive regulation |
|
| Schmitt and Rammerstorfer (2010) [45] | Static/dynamic panel model | Investment/employment, electric power cost | Ownership unbundling, entry barrier, degree of privatization |
|
| Nardi (2012) [46] | Median value verification | Facility capacity, quality of transmission network and interconnections | Ownership unbundling, legal unbundling |
|
| Gugler et al. (2013) [34] | Panel model | Investment/capital | Vertical unbundling, privatization, wholesale market, entry regulation, electricity price |
|
| Meletiou et al. (2018) [47] | Panel model | Probability of unbundling regime adoption | Energy intensity, electricity price, electricity consumption |
|
| Imam et al. (2018) [48] | Panel model, dynamic GWM | Technical efficiency, access rates, per capita GDP | Privatization, regulatory, electricity consumption |
|
Table 4.
Correlations between reform and control variables.
| Reform | Interest Rate | Power Consumption | Energy Intensity | Electricity Price | |
|---|---|---|---|---|---|
| Reform | −0.16 | 0.16 | −0.12 | 0.41 | |
| Interest rate | −0.07 | 0.27 | −0.19 | ||
| Power consumption | 0.13 | −0.03 | |||
| Energy intensity | −0.56 | ||||
| Electricity price |
Table 5.
Correlations between five types of reform and control variables.
| Reform1: Structure of Possession | Reform2: Vertical Unbundling | Reform3: Horizontal Unbundling | Reform4: Transaction Method | Reform5: Regulatory Organization | Interest Rate | Power Consumption | Energy Intensity | Electricity Price | |
|---|---|---|---|---|---|---|---|---|---|
| Reform1: Structure of possession | 0.47 | 0.5 | 0.57 | 0.37 | −0.42 | 0.49 | −0.33 | 0.28 | |
| Reform2: Vertical unbundling | 0.75 | 0.65 | 0.54 | −0.40 | 0.07 | −0.48 | 0.22 | ||
| Reform3: Horizontal unbundling | 0.63 | 0.63 | −0.56 | 0.08 | -0.4 | 0.35 | |||
| Reform4: Transaction Method | 0.7 | −0.60 | 0.13 | −0.50 | 0.37 | ||||
| Reform5: Regulatory organization | −0.51 | 0.15 | −0.45 | 0.27 | |||||
| Interest rate | −0.07 | 0.27 | -0.19 | ||||||
| Power consumption | 0.13 | −0.03 | |||||||
| Energy intensity | −0.56 |
Table 6.
Estimation results for factors affecting facility investment.
| Model 1 (N = 618) | Model 2 (N = 351) | Model 3 (N = 87) | Model 4 (N = 576) | |||||
|---|---|---|---|---|---|---|---|---|
| Dependent Variable | Generation Facility | Supply Reserve Ratio | Total Investment | Base-Load Share | ||||
| Model | RE | FE | RE | FE | RE | FE | RE | FE |
| Reform | −6.0 × 100 *** (−4.78) | −2.5 × 100 * (−1.87) | −1.6 × 10⁻⁴ (−0.00) | −7.1 × 10⁻³ (−0.12) | −2.6 × 10² (−0.76) | −6.3 × 10² (−1.65) | −9.9 × 10⁻³ (−1.62) | −1.0 × 10⁻² * (−1.7) |
| Power consumption | 2.5 × 10⁻¹ *** (149.68) | 2.2 × 10⁻¹ *** (62.49) | −5.8 × 10⁻⁶ (−0.22) | −5.5 × 10⁻⁵ (−0.23) | 1.3 × 101*** (8.07) | 3.2 × 10 *** (4.63) | 5.37 × 10⁻⁵ *** (3.63) | 5.2 × 10⁻⁵ *** (3.4) |
| Interest rate | −1.4 × 10⁻² (−0.65) | −4.5 × 10⁻³ (−0.23) | −1.6 × 10⁻⁴ (−0.28) | −3.0 × 10⁻⁴ (−0.49) | −9.0 × 100 (−0.25) | 2.3 × 10 (0.55) | −1.5 × 10⁻⁴ * (−1.75) | −1.4 × 10⁻⁴ * (−1.72) |
| Energy intensity | 2.2 × 10⁻⁴ (0.65) | −2.7 × 10⁻⁴ (−0.5) | −3.6 × 10⁻⁶ (−0.55) | 7.2 × 10⁻⁶ (0.32) | 5.4 × 10⁻¹ (0.59) | −3.2 × 10⁻² (−0.24) | 1.8 × 10⁻⁵ *** (7.48) | 1.8 × 10⁻⁵ *** (7.08) |
| Electricity price | 3.4 × 10⁻³ *** (2.57) | 3.0 × 10⁻³ ** (2.29) | −6.0 × 10⁻⁵ (−1.50) | −8.5 × 10⁻⁶ (−0.16) | 4.7 × 10⁻¹ ** (2.13) | 3.7 × 10⁻¹ (1.66) | 1.2 × 10⁻⁵ ** (2.03) | 1.2 × 10⁻⁵ ** (1.99) |
| Constant | −6.4 × 10⁻¹ (−0.17) | 1.3 × 10 ** (2.46) | 2.8 × 10⁻¹ *** (3.00) | 1.4 × 10⁻¹ (0.62) | −1.0 × 10³ (−1.17) | −3.3 × 10³ ** (−2.52) | 1.2 × 10⁻¹ ** (2.51) | 1.2 × 10⁻¹ *** (5.07) |
| R2 | 0.9939 | 0.9939 | 0.0075 | 0.0007 | 0.8254 | 0.8186 | 0.2049 | 0.2045 |
| Hausman χ2 (p-value) | 116.32 (0.000) | 2.87 (0.720) | 8.52 (0.130) | 1.68 (0.8912) | ||||
Values in parentheses are t-values. RE and FE indicate random effect model and fixed effect model, respectively. * Statistically significant at 90% level of confidence; ** Statistically significant at 95% level of confidence; *** Statistically significant at 99% level of confidence.
Table 7.
Estimation results for effects of five types of reform on facility investment.
| Model 5 (N = 114) | Model 6 (N = 63) | Model 7 (N = 16) | Model 8 (N = 103) | |||||
|---|---|---|---|---|---|---|---|---|
| Dependent Variable | Generation Facility | Supply Reserve Ratio | Total Investment | Base-Load Share | ||||
| Model | RE | FE | RE | FE | RE | FE | RE | FE |
| Reform1 (Ownership structure) | −1.2 × 101 *** (−5.51) | −2.9 × 101 *** (−5.01) | 2.5 × 10⁻² *** (3.49) | −1.8 × 10⁻² (−0.87) | 7.5 × 10² (1.41) | 6.2 × 10² (0.9) | −2.1 × 10⁻² ** (−2.33) | −2.4 × 10⁻² * (−1.83) |
| Reform2 (Vertical unbundling) | −1.0 × 100 (−0.49) | 3.1 × 100 (1.22) | −6.8 × 10⁻³ (−0.56) | 2.2 × 10⁻² ** (2.27) | −6.5 × 10² (−0.82) | −3.4 × 10³ (−2.15) | 1.2 × 10⁻² (1.28) | 9.3 × 10⁻³ (1.67) |
| Reform3 (Horizontal unbundling) | −3.3 × 100 (−1.63) | −9.5 × 10⁻¹ (−0.41) | −6.4 × 10⁻³ (−0.44) | −1.7 × 10⁻² (−1.32) | 4.0 × 10² (0.82) | 4.4 × 10³ (2.00) | −2.5 × 10⁻² ** (−2.43) | −2.8 × 10⁻³ (−0.50) |
| Reform4 (Transaction method) | 1.3 × 101 *** (4.66) | 1.8 × 101 *** (5.80) | 9.5 × 10⁻³ (1.07) | 2.5 × 10⁻² *** (3.12) | −6.3 × 10² (−0.74) | −1.4 × 10³ (−1.29) | 5.3 × 10⁻³ (0.41 | 2.0 × 10−2 * (3.11) |
| Reform5 (Regulatory organization) | −1.7 × 100 (−0.70) | −4.9 × 100 * (−1.80) | 2.0 × 10⁻² (1.31) | −3.7 × 10⁻³ (−0.34) | −3.2 × 10² (−0.50) | −5.5 × 10² (−0.95) | −5.8 × 10⁻³ (−0.42) | −1.9 × 10⁻² * (−2.69) |
| Power consumption | 2.6 × 10⁻¹ *** (111.67) | 2.0 × 10⁻¹ *** (9.28) | −1.2 × 10⁻⁵ (−1.44) | −1.5 × 10⁻⁴ *** (−2.85) | 1.1 × 101 ** (2.34) | −4.1 × 101 (−1.27) | −3.5 × 10⁻⁶ (−0.36) | 5.6 × 10⁻⁵ (1.08) |
| Interest rate | −1.5 × 100 * (−1.96) | −2.2 × 100 * (−1.92) | 5.8 × 10−3 * (1.94) | −4.8 × 10⁻³ (−1.56) | −3.7 × 10² (−0.62) | 1.6 × 10³ (2.05) | 8.1 × 10⁻³ ** (2.38) | −3.0 × 10⁻³ (−1.33) |
| Energy intensity | −3.1 × 10⁻³ * (−1.96) | −8.6 × 10⁻³ (−1.54) | −4.6 × 10⁻⁷ (−0.07) | 1.3 × 10⁻⁵ (0.78) | 1.3 × 10⁻¹ (0.06) | 7.2 × 100 (1.51) | −2.2 × 10⁻⁵ *** (−3.17) | 4.6 × 10−5 * (3.07) |
| Electricity price | 1.6 × 10⁻¹ ** (2.36) | 4.9 × 10⁻³ (0.60) | −4.4 × 10⁻⁶ (−0.11) | 3.5 × 10⁻⁵ (1.04) | 3.2 × 100 ** (2.02) | 6.4 × 100 * (2.32) | −1.5 × 10⁻⁴ *** (−5.24) | −3.2 × 10⁻⁵ * (−1.83) |
| Constant | 1.6 × 101 (0.60) | 1.8 × 10² ** (2.38) | 8.9 × 10⁻⁵ (0.00) | 2.0 × 10⁻¹ (0.88) | −7.1 × 10² (−0.04) | −3.5 × 10⁴ (−0.94) | 9.0 × 10⁻¹ *** (7.68) | 1.9 × 10⁻¹ (0.90) |
| R2 | 0.9965 | 0.9874 | 0.5989 | 0.1208 | 0.9322 | 0.0205 | 0.6243 | 0.1025 |
| Hausman χ2 (p-value) | 17.93 (0.036) | 401.41 (0.000) | 10.57 (0.306) | 76.84 (0.000) | ||||
Values in parentheses are t-values. RE and FE indicate random effect model and fixed effect model, respectively. * Statistically significant at 90% level of confidence; ** Statistically significant at 95% level of confidence; *** Statistically significant at 99% level of confidence.
© 2018 by the authors. Licensee MDPI, Basel, Switzerland. This article is an open access article distributed under the terms and conditions of the Creative Commons Attribution (CC BY) license (http://creativecommons.org/licenses/by/4.0/).
Share and Cite
MDPI and ACS Style
Lee, J.; Cho, Y.; Koo, Y.; Park, C. Effects of Market Reform on Facility Investment in Electric Power Industry: Panel Data Analysis of 27 Countries. Sustainability 2018, 10, 3235. https://doi.org/10.3390/su10093235
AMA Style
Lee J, Cho Y, Koo Y, Park C. Effects of Market Reform on Facility Investment in Electric Power Industry: Panel Data Analysis of 27 Countries. Sustainability. 2018; 10(9):3235. https://doi.org/10.3390/su10093235
Chicago/Turabian StyleLee, Juyong, Youngsang Cho, Yoonmo Koo, and Chansoo Park. 2018. "Effects of Market Reform on Facility Investment in Electric Power Industry: Panel Data Analysis of 27 Countries" Sustainability 10, no. 9: 3235. https://doi.org/10.3390/su10093235
Note that from the first issue of 2016, this journal uses article numbers instead of page numbers. See further details here.