Hybrid Input-Output Analysis of Embodied Carbon and Construction Cost Differences between New-Build and Refurbished Projects


1
Faculty of Society & Design, Bond University, Robina QLD 4226, Australia
2
Building and Real Estate Department, The Hong Kong Polytechnic University, Hong Kong, China
*
Author to whom correspondence should be addressed.
Sustainability 2018, 10(9), 3229; https://doi.org/10.3390/su10093229
Submission received: 10 August 2018
/
Revised: 4 September 2018
/
Accepted: 4 September 2018
/
Published: 10 September 2018
(This article belongs to the Special Issue Circular Economy—Sustainable Energy and Waste Policies)
Abstract
:Refurbishing buildings helps reduce waste, and limiting the amount of embodied carbon in buildings helps minimize the damaging impacts of climate change through lower CO2 emissions. The analysis of embodied carbon is based on the concept of life cycle assessment (LCA). LCA is a systematic tool to evaluate the environmental impacts of a product, technology, or service through all stages of its life cycle. This study investigates the embodied carbon footprint of both new-build and refurbished buildings to determine the embodied carbon profile and its relationship to both embodied energy and construction cost. It recognizes that changes in the fuel mix for electricity generation play an important role in embodied carbon impacts in different countries. The empirical findings for Hong Kong suggest that mean embodied carbon for refurbished buildings is 33–39% lower than new-build projects, and the cost for refurbished buildings is 22–50% lower than new-build projects (per square meter of floor area). Embodied carbon ranges from 645–1059 kgCO2e/m2 for new-build and 294–655 kgCO2e/m2 for refurbished projects, which is in keeping with other studies outside Hong Kong. However, values of embodied carbon and cost for refurbished projects in this study have a higher coefficient of variation than their new-build counterparts. It is argued that it is preferable to estimate embodied energy and then convert to embodied carbon (rather than estimate embodied carbon directly), as carbon is both time and location specific. A very strong linear relationship is also observed between embodied energy and construction cost that can be used to predict the former, given the latter. This study provides a framework whereby comparisons can be made between new-build and refurbished projects on the basis of embodied carbon and related construction cost differentials into the future, helping to make informed decisions about which strategy to pursue.
1. Introduction
The social and environmental benefits of building preservation compared to new construction are generally accepted—for example: Jacobs [1] made the point that the ‘greenest’ buildings are the ones we already have. Socially, these projects help to maintain continuity of a community for the benefit of future generations and can conserve buildings that might otherwise be obsolete, fall into disrepair, or be prematurely demolished [2]. Environmentally, these projects lessen the demand for new resources through reuse of part or all of a building’s fabric, reduce debris sent to landfill, and minimize a building’s ecological footprint through the reclamation of carbon embodied in existing materials [3]. However economically, the cost of these projects may be more or less than a new-build, depending on the extent of conservation work, the latent conditions of the project, and the complexities involved in construction. New-build projects arguably have fewer constraints and can offer higher levels of utility through new design concepts and technologies.
Embodied carbon is the invisible part of any building’s energy profile. More focus is applied to operational performance through the myriad energy rating tools and calculators available in the marketplace. Yet, many studies have shown that the embodied component can be significant e.g., Reference [4,5,6,7,8]. Hence, using materials for construction that possess low embodied carbon intensity can help to mitigate some of the damaging effects of climate change, all of which can be slated back to human-induced carbon emissions into the atmosphere [9]. Minimizing our use of carbon is a fundamental strategy that the majority of global nations have agreed to uphold [10].
Embodied carbon arises when new buildings/structures are created, or where new materials are introduced as part of existing (including heritage) building/structure refurbishment. There is little understanding of the actual savings that heritage projects may deliver in regard to retained embodied carbon [11]. Moreover, there is no agreed specialized tool available to measure embodied carbon intensities for building materials in current use in Hong Kong [12]. International databases can only be used as a rough guide. A research gap exists in how to make informed choices between whether to pursue a new-build or refurbished project strategy in different jurisdictions.
The aim of this paper is to determine the influence of embodied carbon in both new-build and refurbished projects in the context of Hong Kong, and to quantify the relationship between the amount of embodied carbon and the cost of undertaking these works.
This research adopts the principles of hybrid input-output analysis [4,13] for calculating the embodied energy of building materials, and then computes the embodied carbon using principles articulated in RICS [14] for a number of completed case studies in Hong Kong. These empirical cases comprise both new-build and refurbished projects completed in the last five years, for a range of functional purposes. Refurbished projects are defined as those where the majority of the structure of an existing building is retained, and may include change of use. Hong Kong was chosen because it is one of the most densely populated urban cities in the world per square meter of land area, and comprises a dynamic melting pot for new construction, urban renewal, heritage protection, and demolition activities [15].
It is hypothesized that the average quantity of embodied carbon per square meter for refurbished projects is significantly less than new-build projects. However, where a refurbished project is more expensive than the average cost of a new-build, the embodied carbon saving can be converted into monetary terms and used to defend the case for the additional cost.
In the only other comparative study of new-build and refurbished projects undertaken to date, to our knowledge, Langston [16] found that embodied energy was strongly correlated with the cost of construction across thirty commercial or quasi-commercial projects in Melbourne. This relationship has never been tested for projects in other countries. Therefore, this study will attempt to do so for Hong Kong. The method adopted is appropriate for use in other locations.
2. Underpinning Literature
RICS [14] (p. 5) defines embodied carbon (EC) as:
Carbon emissions associated with energy consumption (embodied energy) and chemical processes during the extraction, manufacture, transportation, assembly, replacement and deconstruction of construction materials or products. Embodied carbon can be measured from cradle-to-gate, cradle-to-site, cradle-to-end of construction, cradle-to-grave, or even cradle-to-cradle. The typical embodied carbon datasets are cradle-to-gate. Embodied carbon is usually expressed in kilograms of CO2e per kilogram of product or material.
Included in the cradle-to-gate system boundary are all the upstream carbon requirements for completion of work constructed on site. It specifically excludes operational (recurrent) carbon footprints, such as those arising from heating, ventilation, air-conditioning, and cooling (HVAC) systems and all carbon-based electricity required to power machines and building technologies. It also excludes the carbon transactions involved in demolition and removal/recycling at end-of-life.
EC is seen as a direct measure of climate change [17]. It is distinct from embodied energy (EE), which may comprise carbon-based or non-carbon-based fuel sources (e.g., renewables) such as solar and wind. Electricity is the main power source for construction, regardless of its generation method, although a small proportion is attributable to direct use of combustible fuels, particularly in extraction and transportation processes. Practitioners have not really embraced these types of calculations in a routine manner [18].
The analysis of EC is based on the concept of life cycle assessment (LCA). LCA is a systematic tool to evaluate the environmental impacts of a product, technology, or service through all stages of its life cycle. A typical LCA study includes the stages of raw material extraction, manufacture, transport/distribution, construction, usage, maintenance, and end-of-life scenarios like replacement, disposal, or recycling. The term ‘embodied’ refers to initial phases of the full life cycle, and is distinct from ‘operational’ and ‘disposal’ phases that occur after delivery or purchase of the product, technology, or service, but should ideally take account of new materials used in maintenance or component replacement [19].
Measurement of EC is the dominant approach today, but EE is still in use and was employed almost exclusively prior to the early part of the 21st Century. The conversion from EE to EC is based on the fuel mix involved in energy generation in various regions of the world. A country that uses only clean renewable energy, for example, has no interest in EC other than what they import from other carbon-based economies. In the future, the world needs to minimize the use of carbon-based fuels [17]. This will minimize the importance of EC but will have no effect on the ongoing interest in EE. However, if energy becomes abundant, clean, and largely free, understanding energy demand will be more about infrastructure capacity and sharing paradigms than environmental impact.
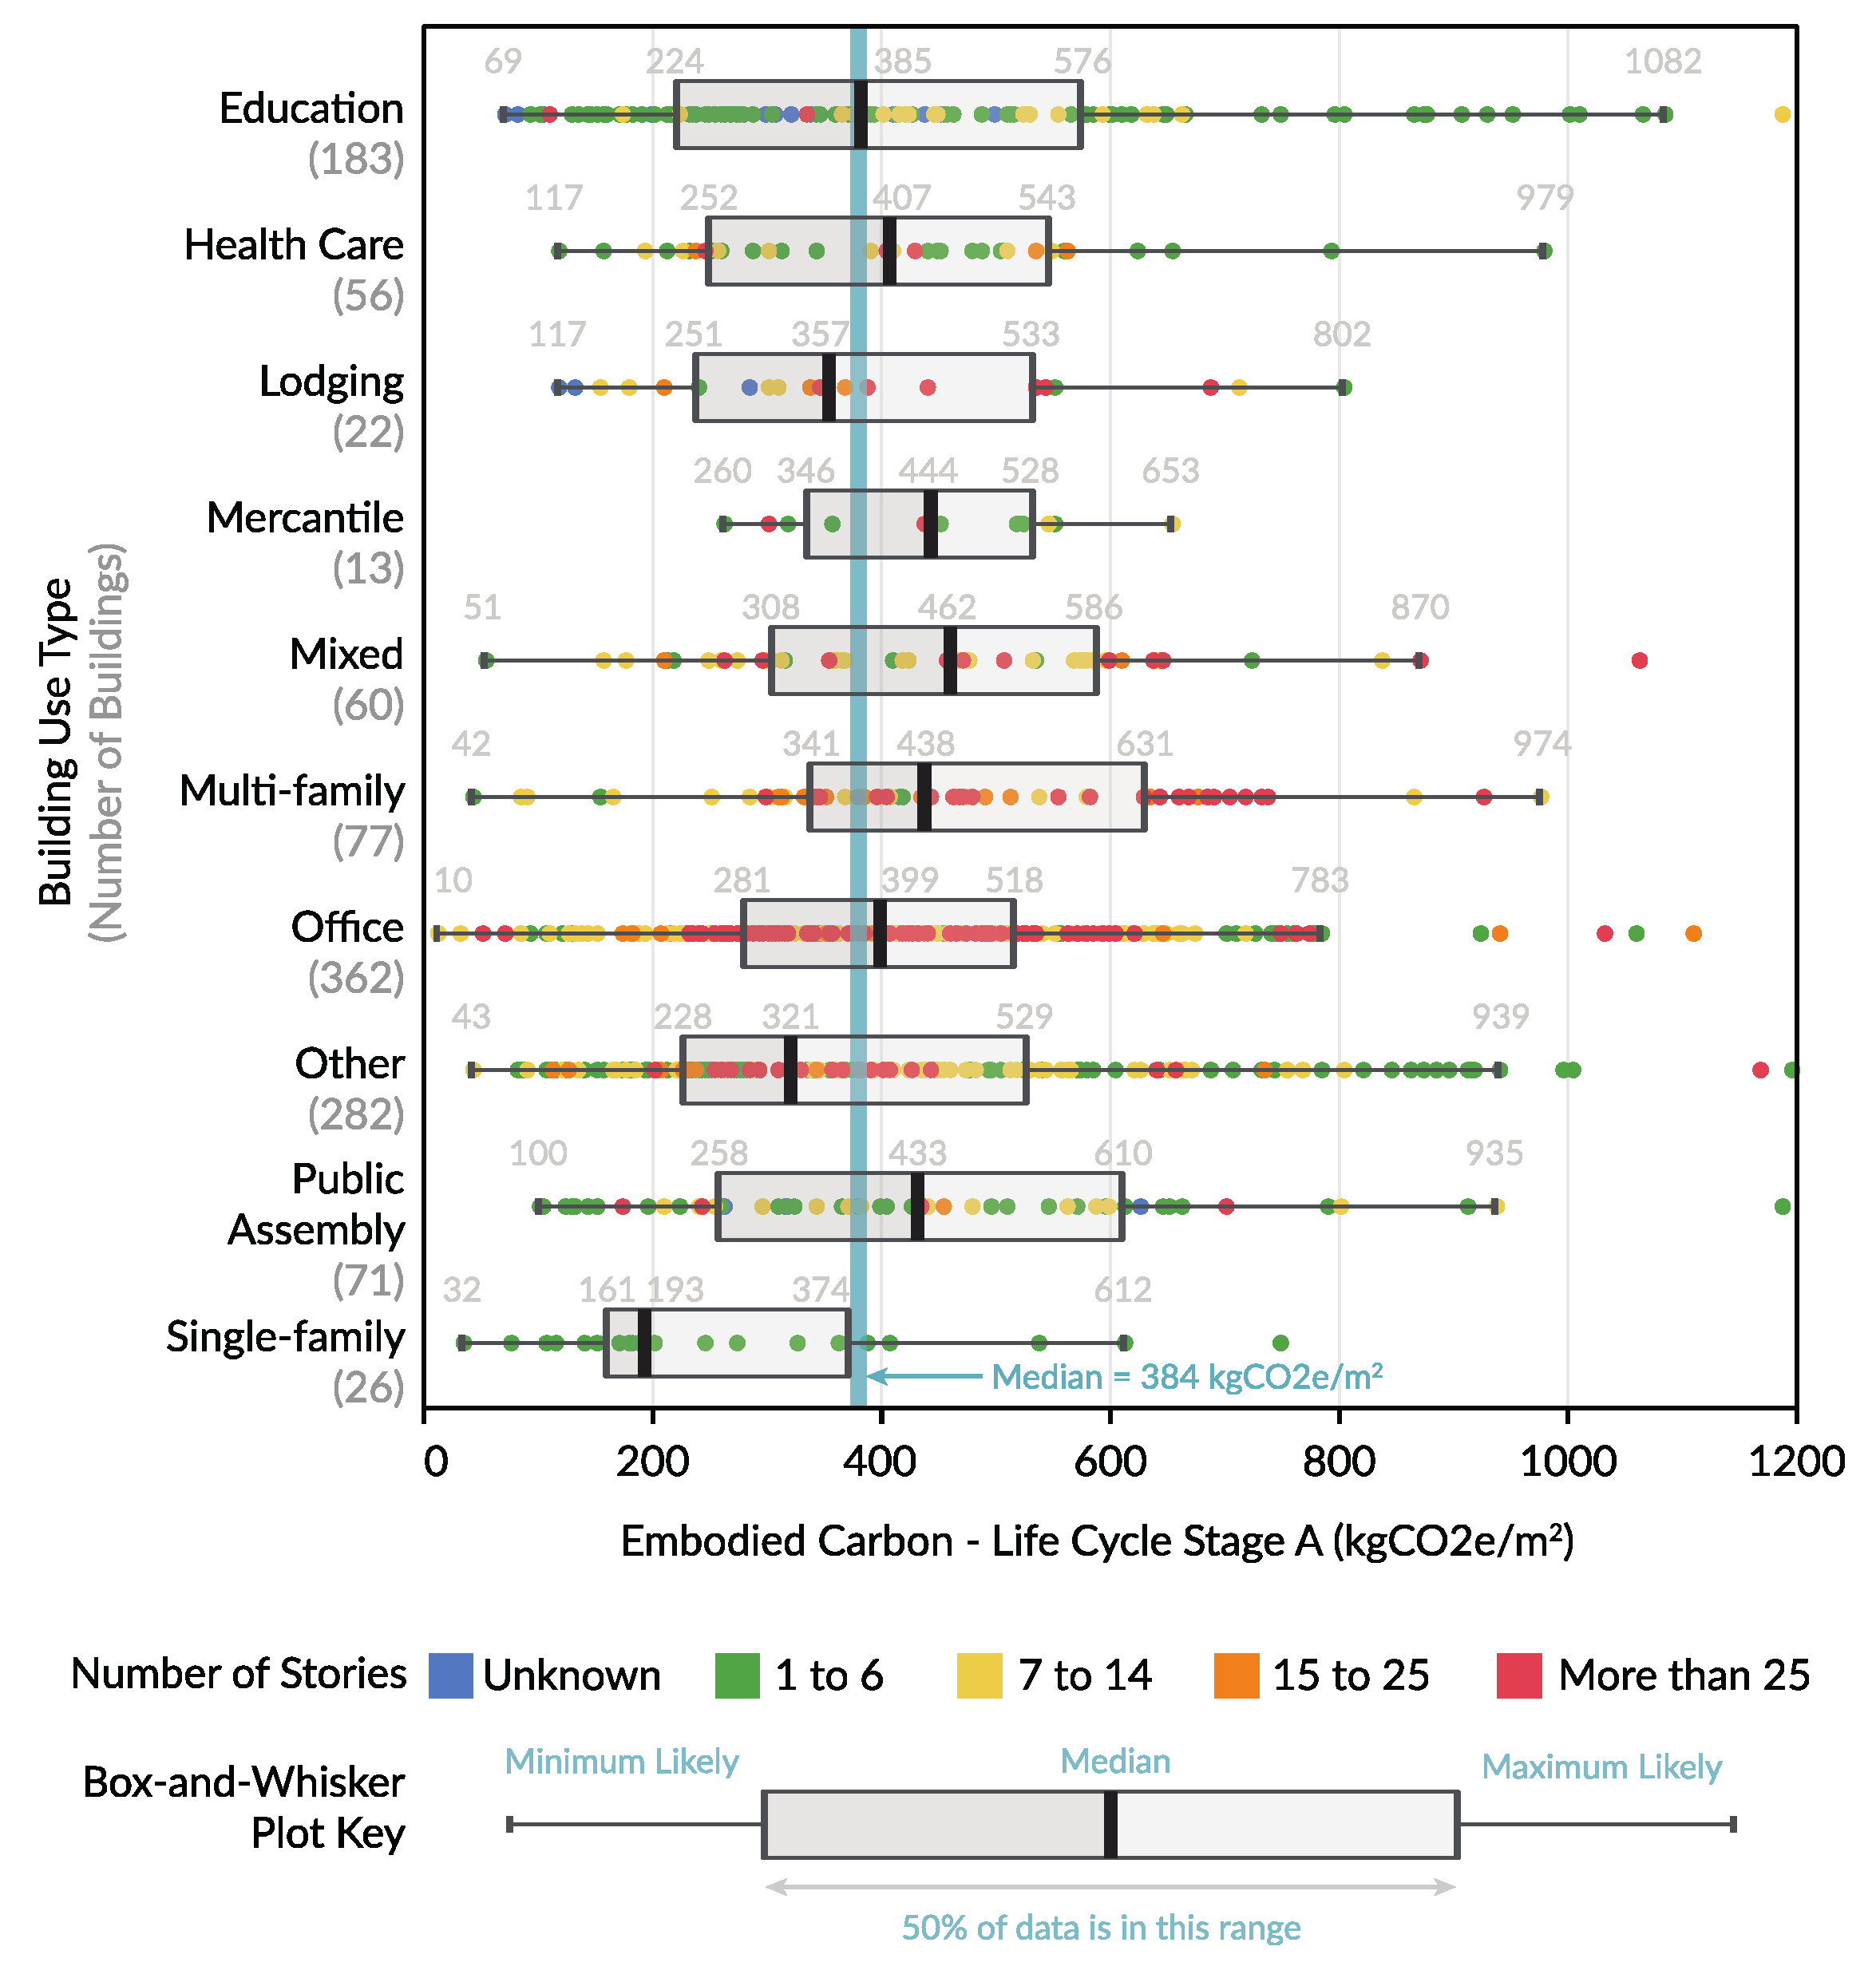
CLF [20] is the largest study to date on embodied carbon of buildings. It is a global study containing over one thousand buildings (including new-build and refurbished projects). It presents EC (kgCO2e/m2) data and draws conclusions across the entire dataset. Figure 1 summarizes the analysis of the Embodied Carbon Benchmark Database (ECBD).
Prior to the ECBD, the construction industry had seen few efforts to benchmark EC. Some include the Athena Report for Incorporating Whole Building LCA Benchmarks into the IE4B, the European SuPerBuildings Project, the Australian Materials and Buildings Products Life Cycle Inventory Database, and the French “Construisons Ensemble HQE Performance” [20]. There are some inherent and acknowledged limitations with the ECBD. These limitations comprise [20] (p. 8):
- 1.
- The database reports initial embodied carbon of buildings and does not include maintenance, energy use, or end of life impacts, nor building related components such as site work, mechanical/electrical systems and furnishings.
- 2.
- It is not appropriate to use this data to make comparative assertions between building types or categories.
- 3.
- This database is not a statistically representative sample of current building practices and is weighted to larger, more prominent buildings than those that make up the complete building stock.
In regard to point 1 above, ECBD is likely to under-report EC.
The main source of relevant embodied energy data pertaining to Hong Kong was found in Chen et al. [22]. The study focused on residential buildings. The objectives of their study were to: (1) develop a model suitable for estimating EE usage in residential buildings in Hong Kong; (2) understand the EE usage profiles for residential buildings, which will help to reveal the elements with significant EE reduction potential; and (3) provide information and data on EE, which may be used as a basis on which building regulations for energy efficiency and regional energy policy of buildings could be implemented [22].
However, this data is not actually specific to Hong Kong, but is an average of data from a range of global sources. The same can be said for other research conducted by Chau et al. [23,24,25], focused on various Hong Kong case studies. A comparison between data from Chen et al. [22] and the ICE database [26] shows some consistency on key materials, and appears more reliable than the ranges reported in Chau et al. [23,24,25]. In fact, in the latter case, it is noted “since embodied energy data are not specifically collected by national agencies, the data used for estimating the CO2 emissions in buildings are generally extracted from multiple sources and may not be of good quality” [24] (p. 33).
The latest EE research for Hong Kong can be found in Chau et al. [27]. They list EE intensities (11 common materials only) from a range of non-HK sources including Hammond and Jones [26]. They were focused on the deconstruction of a high-rise concrete-framed office building in Hong Kong. They acknowledge that a majority of building materials in Hong Kong are imported from Mainland China, but a lack of EE data for virgin and recycled building materials also exists there. Using Hammond and Jones [26] as a basis, they adjusted EE intensities for assumed transportation energies both within China and from China to Hong Kong.
Constructing a more reliable database of EE intensities suitable for use in both Mainland China and Hong Kong is a recommended area of further research [12]. De Wolf et al. [6], in a large study of the global practice of embodied carbon modeling for the built environment, concluded that governments should mandate for improved data quality as well as support the development of a more transparent and simplified methodology.
Langston [16] studied the EE implications for 30 individual buildings in Melbourne through discovering and quantifying a reliable linear relationship with construction cost data. From the relationship, EE could be calculated knowing only the estimated cost of construction expressed in 2004 terms, and the gross floor area. Cost, therefore, can act as a surrogate for the integral consideration of energy issues during the design stage of projects. Using this approach, what may have taken weeks or months to estimate could be achieved in a matter of minutes, making EE analysis accessible to every building project (existing or planned). The method underpinning the study was set out in Treloar [4].
Gan et al. [28] found that EC mapped against number of storeys (40–100) produced an upward concave curve, suggesting an optimum building height can be determined. However, this study was based on a geometric model of a typical high-rise building, and did not use real data. Wu et al. [29], based on a study of 26 actual residential and commercial buildings in China, found that green buildings had slightly higher EC/m2 than non-green buildings, but with much lower operational emissions, and this phenomenon was significant in residential buildings. Gan et al. [30] found that structural steel and rebar accounted for the majority of EC in the frame of high-rise buildings in Hong Kong.
Chau et al. [31] investigated the cost of the Hong Kong Building Environmental Assessment Method (HKBEAM). They found that the economic benefit-cost ratios of prescribed criteria under the (then) HKBEAM structure varied considerably. Lam et al. [32] analyzed 25 commercial buildings in Hong Kong, including three Grade A office buildings, four Grade B office buildings, one Grade C office building, four retail centers, and three hotels. They found no statistical differences in the average life cycle environmental impacts for different building types. However, concrete, reinforcement bar, copper cables, and busbars were ranked to be the most significant materials or components to total life cycle environmental impacts. In a later study, Lam et al. [33] called for a framework for developing green specifications to promote sustainability in Hong Kong. Finally, Ng and Chau [34] looked at different waste management strategies and found that recycling had the highest energy saving potential for EE (53%), compared to reusing (6.2%), and incineration (0.4%).
3. Method
The nature of this study demanded an empirical research method [35]. On the basis of a number of recent case studies reflecting either new-build or refurbished projects, construction and cost data were obtained to deduce EE using a quantitative process of converting material quantities of work first into mass (kg), then into energy (GJ), and finally into carbon (kg CO2e). The researchers acted as impartial ‘observers’. The accuracy of the data were not questioned—simply converted into different units. For reasons of client confidentiality, the data were de-identified and no contextual information was available other than a basic description of the building type and its date of completion. The objectiveness of the study, however, enabled testing of a hypothesis that the average quantity of EC/m2 for refurbished projects is significantly less than new-build.
Case studies are useful to observe real phenomena in particular contexts, to provide description, to test theory, and to generate theory [36,37]. For each case, a list of building materials and quantities (such as may be found in a cost plan) were required. EE and EC were derived from this list using a theory base of hybrid input-output analysis [4,13,38,39], including all the upstream carbon implications involved in mining, manufacture, transport, and installation onsite, and expressed in kgCO2e/m2 of construction floor area (CFA). However, rather than do so from first principles using input-output data specific to Hong Kong, the researchers used energy intensities derived from the literature as others have had to do in all previous Hong Kong studies, as well as in China [40]. The construction costs were noted from the cost plans, converted to 2016 terms where necessary, and similarly expressed per square meter.
RICS [14] sets out guidance for how to perform these calculations. However, what it does not clearly state is that EC intensities change over time according to the type of energy generation relevant in the country where the materials are extracted, manufactured, and transported to site. Globally, countries are attempting to reduce the amount of carbon used in generating electricity [17], which is the largest component of EE involved in upstream processes. EC intensities are a bit like construction costs in some respects—they are linked to a particular point in time and a particular location—so they are in constant motion.
EE intensities are largely fixed. They change (up or down) over the longer term as technology impacts upstream processes, and differ marginally from country to country due to transportation distances and methods. For these reasons, this study will estimate EE and then compute EC using a single conversion factor appropriate to the relevant local fuel mix of electricity generation.
For a country like Australia this is relatively straightforward, as the majority of raw materials used in construction are likely to be local. Those materials that are imported could come from China or a range of other countries according to availability and price. There is an assumption that these other countries have a mix of both higher and lower generation factors [24], which will tend to neutralize the variances that might exist. Hong Kong, on the other hand, has few natural resources and most of its manufacturing base has moved to Mainland China. Therefore, the majority of raw materials are imported. China still uses largely coal-fired power stations [41] but is making great inroads to reduce carbon through renewable energy. It is estimated that the generation factor for China will become lower than Australia in the near future, and probably on a par with Hong Kong [42].
The Environment Bureau [43] discusses future power generation options for Hong Kong. On the basis of this document, a suitable current EE-EC conversion factor is estimated for use in this study. Note that this is significantly higher than the factor estimated by Chau et al. [24]. The factor will, of course, reduce over time (see Table 1). The future conversion factor for Hong Kong is only a target. It may be more appropriate to use China’s fuel mix given most of Hong Kong’s goods are imported from the mainland. If so, the conversion factor should be more like 69.40 kgCO2e/GJ, which is 18.07% higher than the current mix in Hong Kong [44]. Xu et al. [45] suggested that the high emission coefficients of most Chinese industrial sectors lead to higher emissions embodied in China’s exports than its imports. So EC for Hong Kong may be slightly under-reported.
The empirical approach in this study involved approaching around 25 quantity surveying consultancies in Hong Kong to request data in the form of cost plans. Projects had to be either new-build or refurbished and also no more than five years old so that cost adjustment did not need to be too significant. Approximately equal numbers of each category were sought—ideally at least 30 in total so to support meaningful regression.
From the items of work within these cost plans, material quantities are converted to mass (kg) and multiplied by EE intensities. Total EE, expressed in gigajoules (GJ), is computed as the sum of all the materials in the project via a spreadsheet application. A cradle-to-gate approach is adopted. Upon completion, the total EE is converted to EC using the current fuel mix data from Table 1.
As noted earlier, there are no EE intensities specific to Hong Kong. Chen et al. [22] published a short list of common building materials with EE intensities expressed in MJ/kg as part of their research into Hong Kong residential buildings. These were used as the basis for calculations in this study. Other intensities needed had to be sourced from the literature, including those contained in the ICE database [26], which apply generically to a range of countries. ICE contained other information that was very useful for converting measured units of m3, m2, m, etc. to kilograms for each material.
The construction cost is taken directly from the cost plan and updated to 2016 prices where necessary, using a Building Price Index. The CFA is also taken directly from the cost plan. This is used to enable comparison of Cost, EE, and EC per square meter of total floor space. While building shape and layout can have an influence on EE and EC per square meter [28,29,30,31,32,33,34,35,36,37,38,39,40,41,42,43,44,45,46], this type of information was not available to the researchers.
4. Case Study Results
With the valued cooperation of just two large Quantity Surveying consultancies in Hong Kong, 26 project cost plans were attained. These comprised 14 new-build projects and 12 refurbished projects. It was not possible to reach the initial target of thirty projects, largely because of concerns over confidentiality of client data. Of the 14 new-build projects, all of which were designated as high quality residential apartments, 12 were high-rise and two were low-rise (defined as 1–3 floors). Of the 12 refurbished projects, all of which were designated as high quality low/medium-rise office space except one high quality high-rise apartment, seven involved structural work and four involved mainly decorative (cosmetic) upgrades. One of the refurbished office projects was rejected as it was confined to façade replacement and did not relate to a measurable floor area. Unfortunately, none of the refurbished projects were heritage classified.
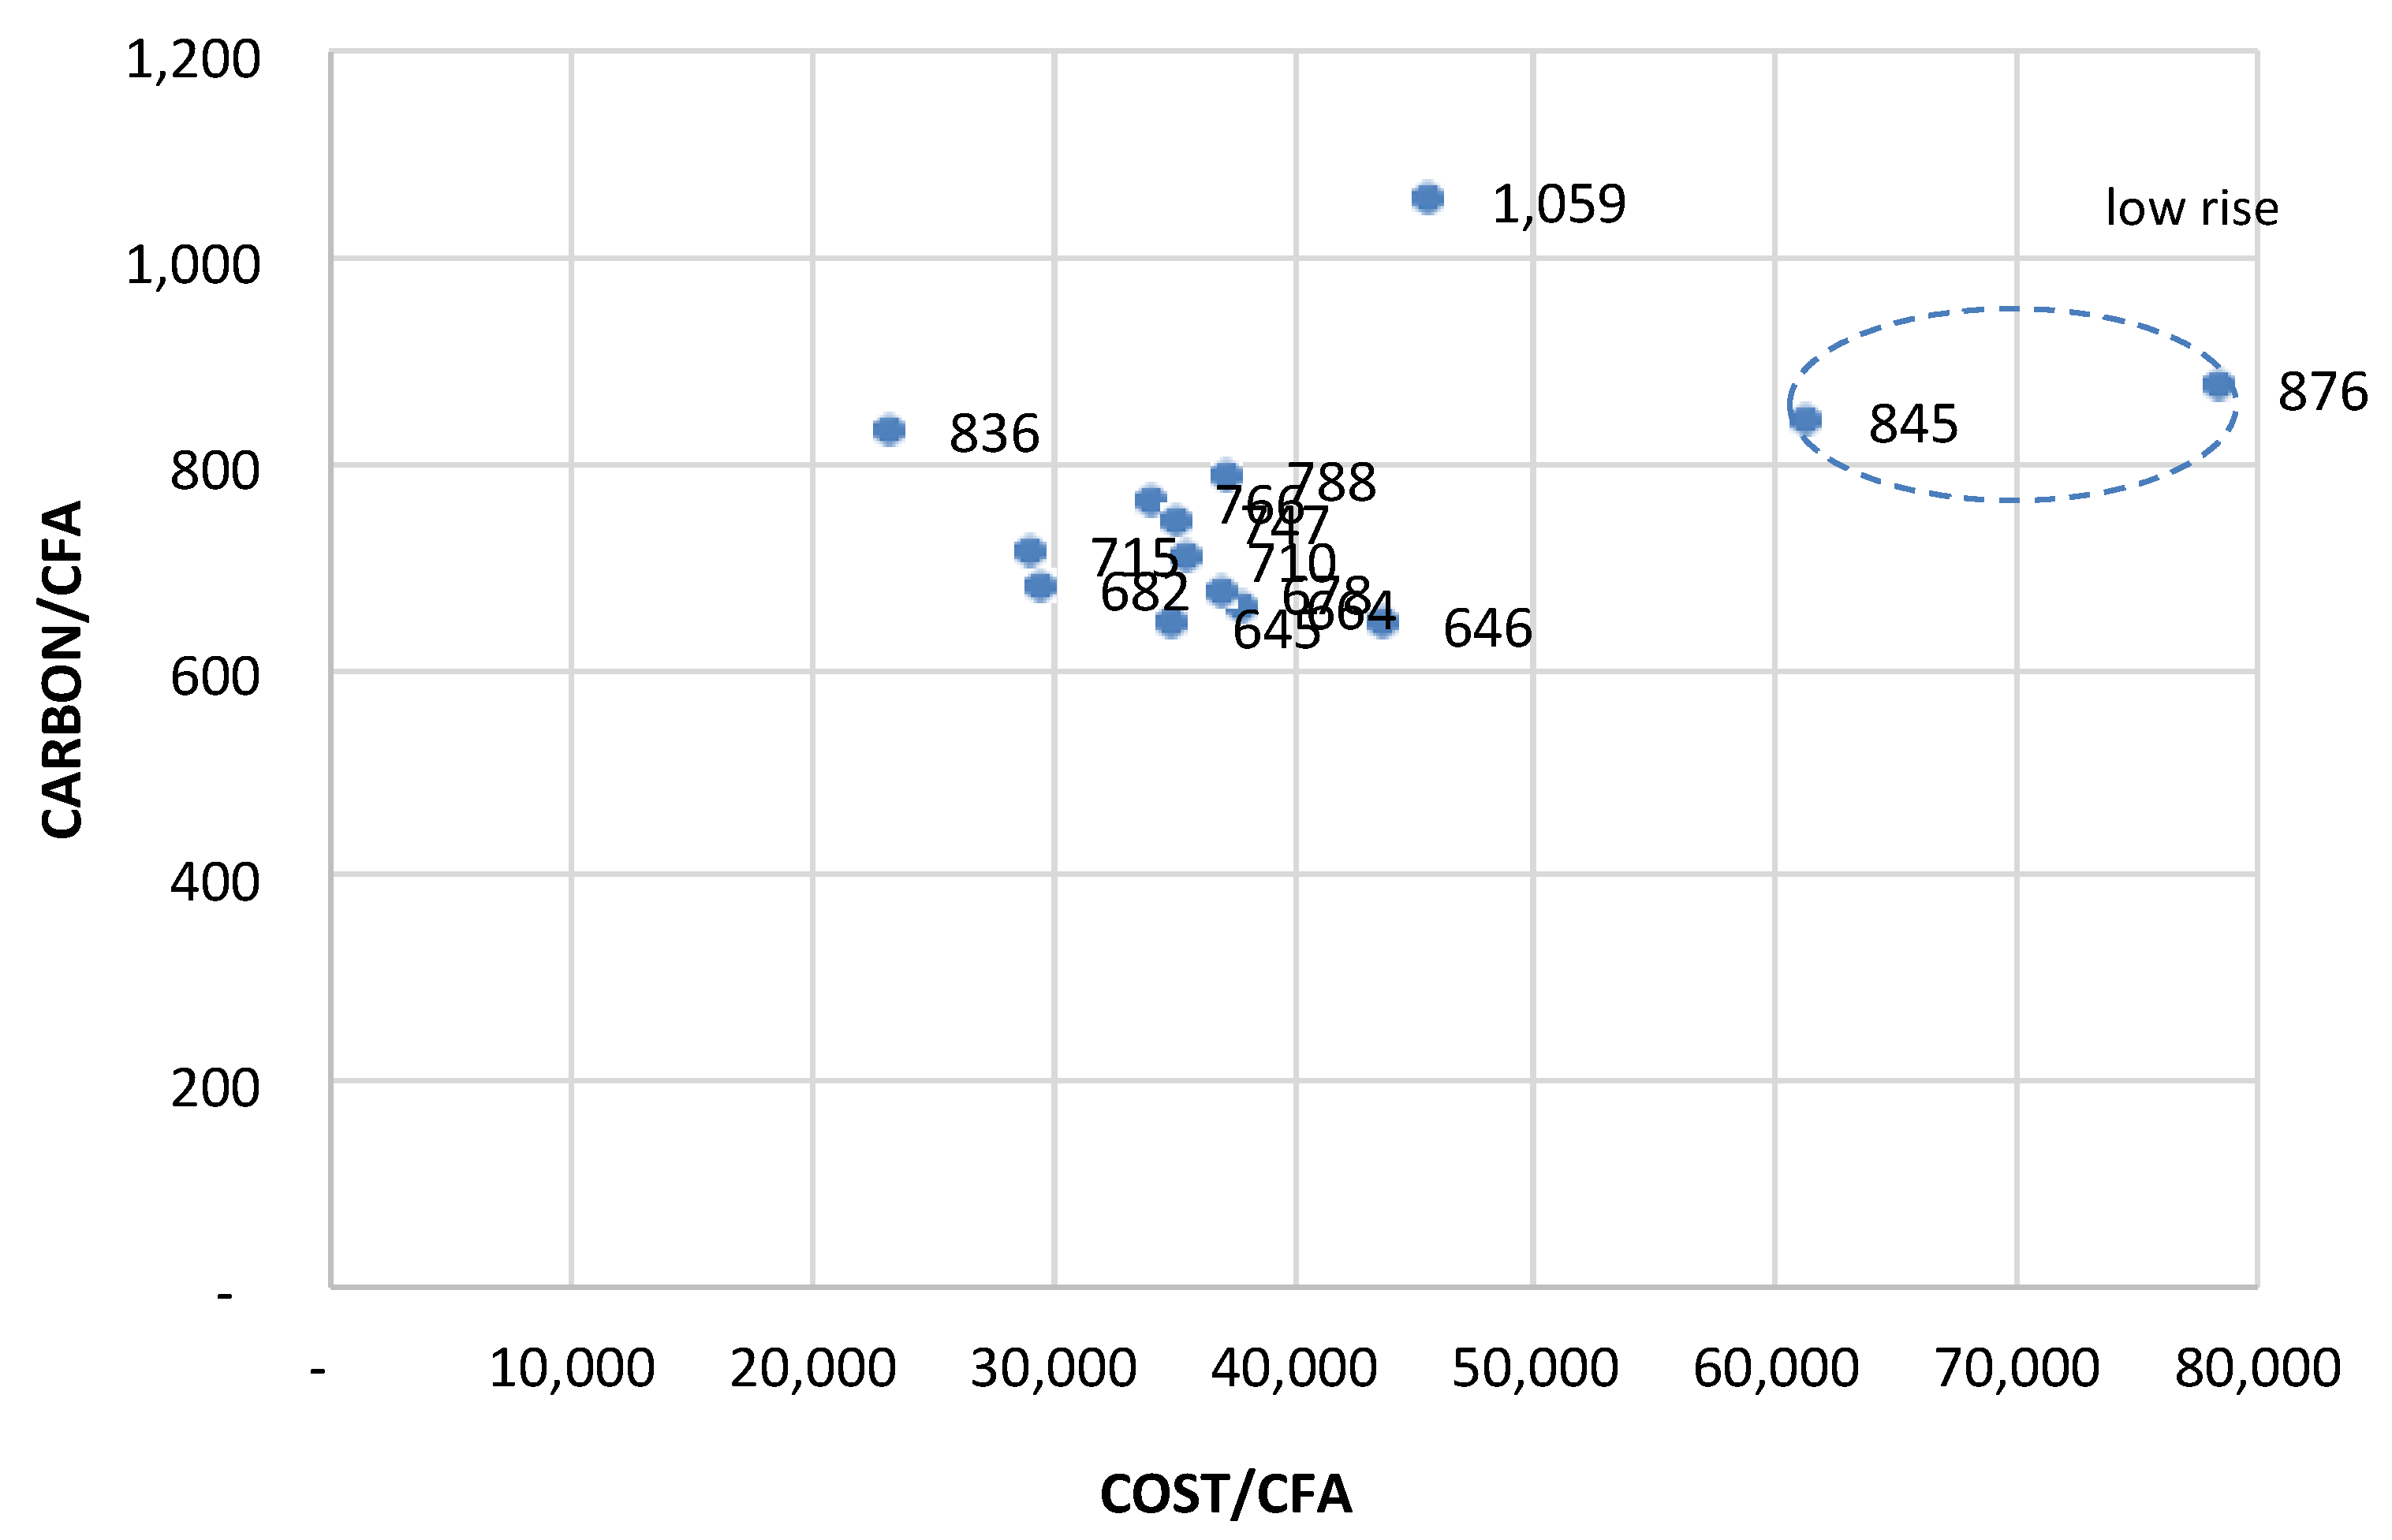
Projects 4 and 10 are both low-rise construction. They are less efficient in key elements such as foundations, roof, and external envelope, and so it is not surprising that they have higher Cost/CFA. The coefficient of variation (CoV) for Cost/CFA is 35.4%. If these projects are removed, the CoV falls to 17.4%. Figure 2 plots the values for EC/CFA against Cost/CFA.
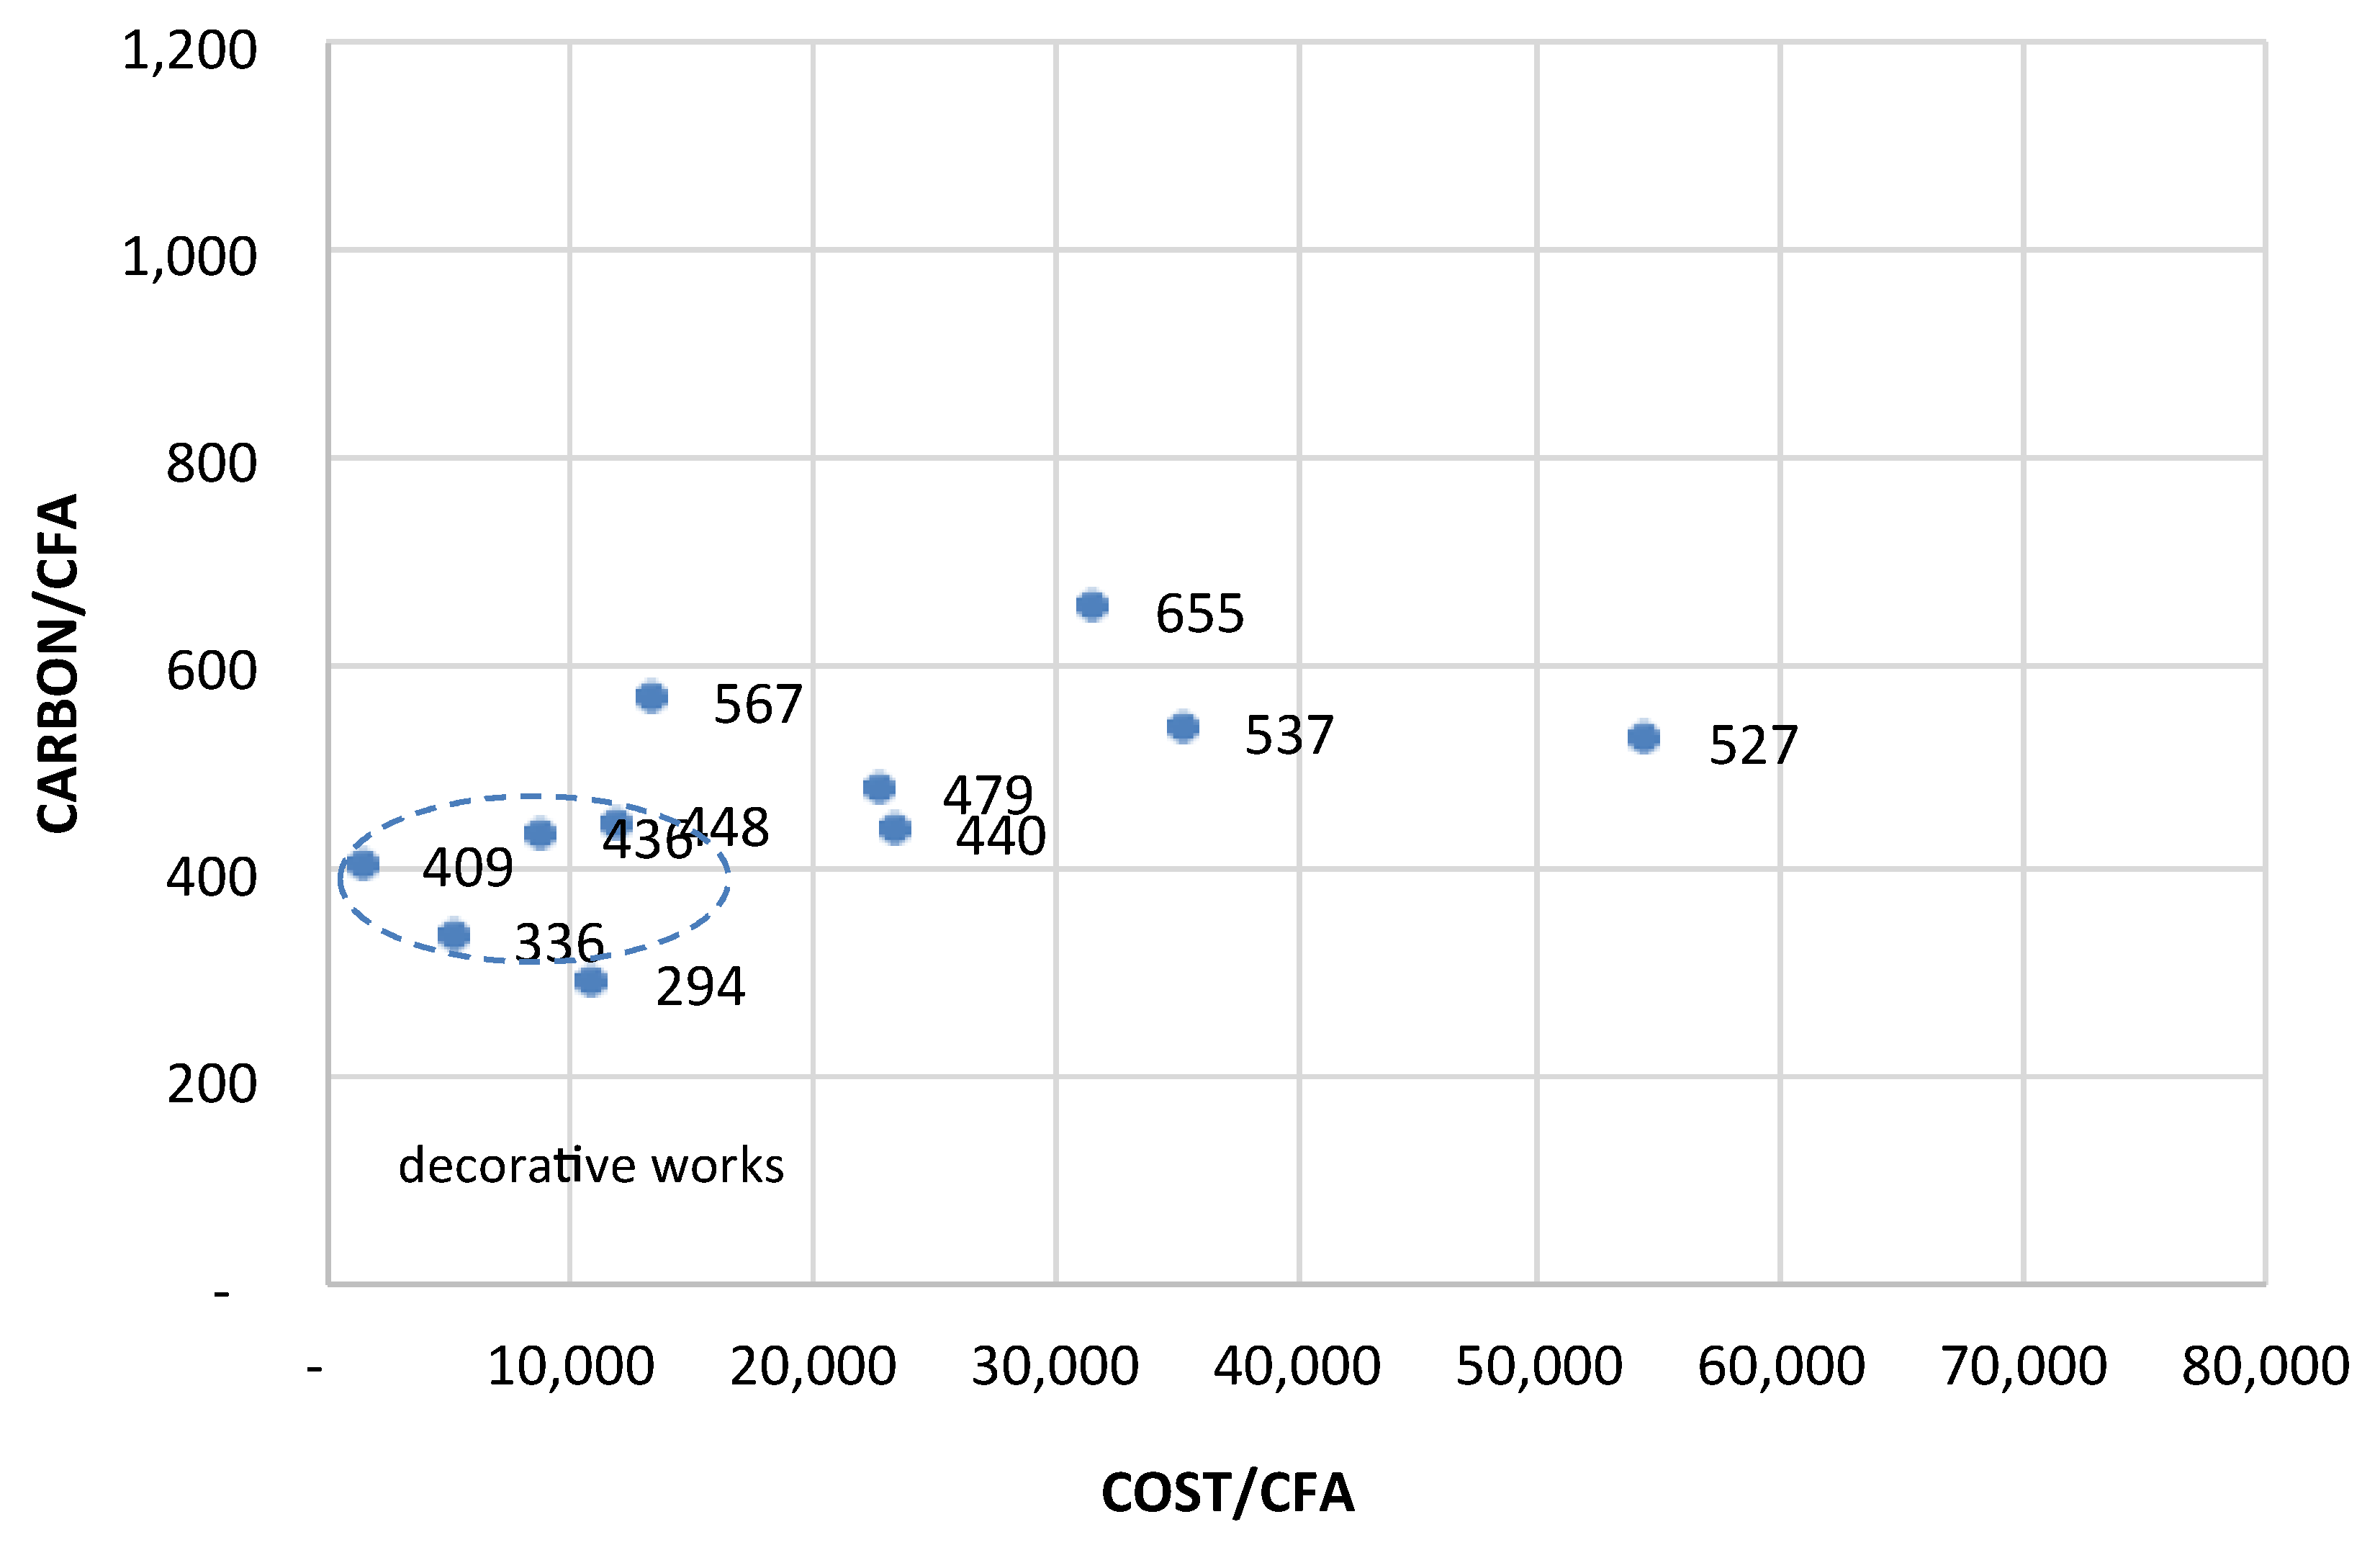
Project 23 is rejected, as it has no relevant CFA. Projects 21, 24, 25, and 26 are all decorative upgrades involving no structural work, and so it is not surprising that they have lower Cost/CFA. The CoV for Cost/CFA is 78.9%. If these four projects are removed, the CoV falls to 54.2%. Refurbished projects have higher cost variance than new-build projects. Figure 3 plots the values for EC/CFA against Cost/CFA.
The mean values for EE/CFA, EC/CFA, and Cost/CFA are lower for the refurbished projects. It is likely that Cost/CFA could be volatile, especially where problems on site are unexpectedly found or where heritage restoration is involved. Neither seemed present in our case studies. However, several projects are considered outliers.
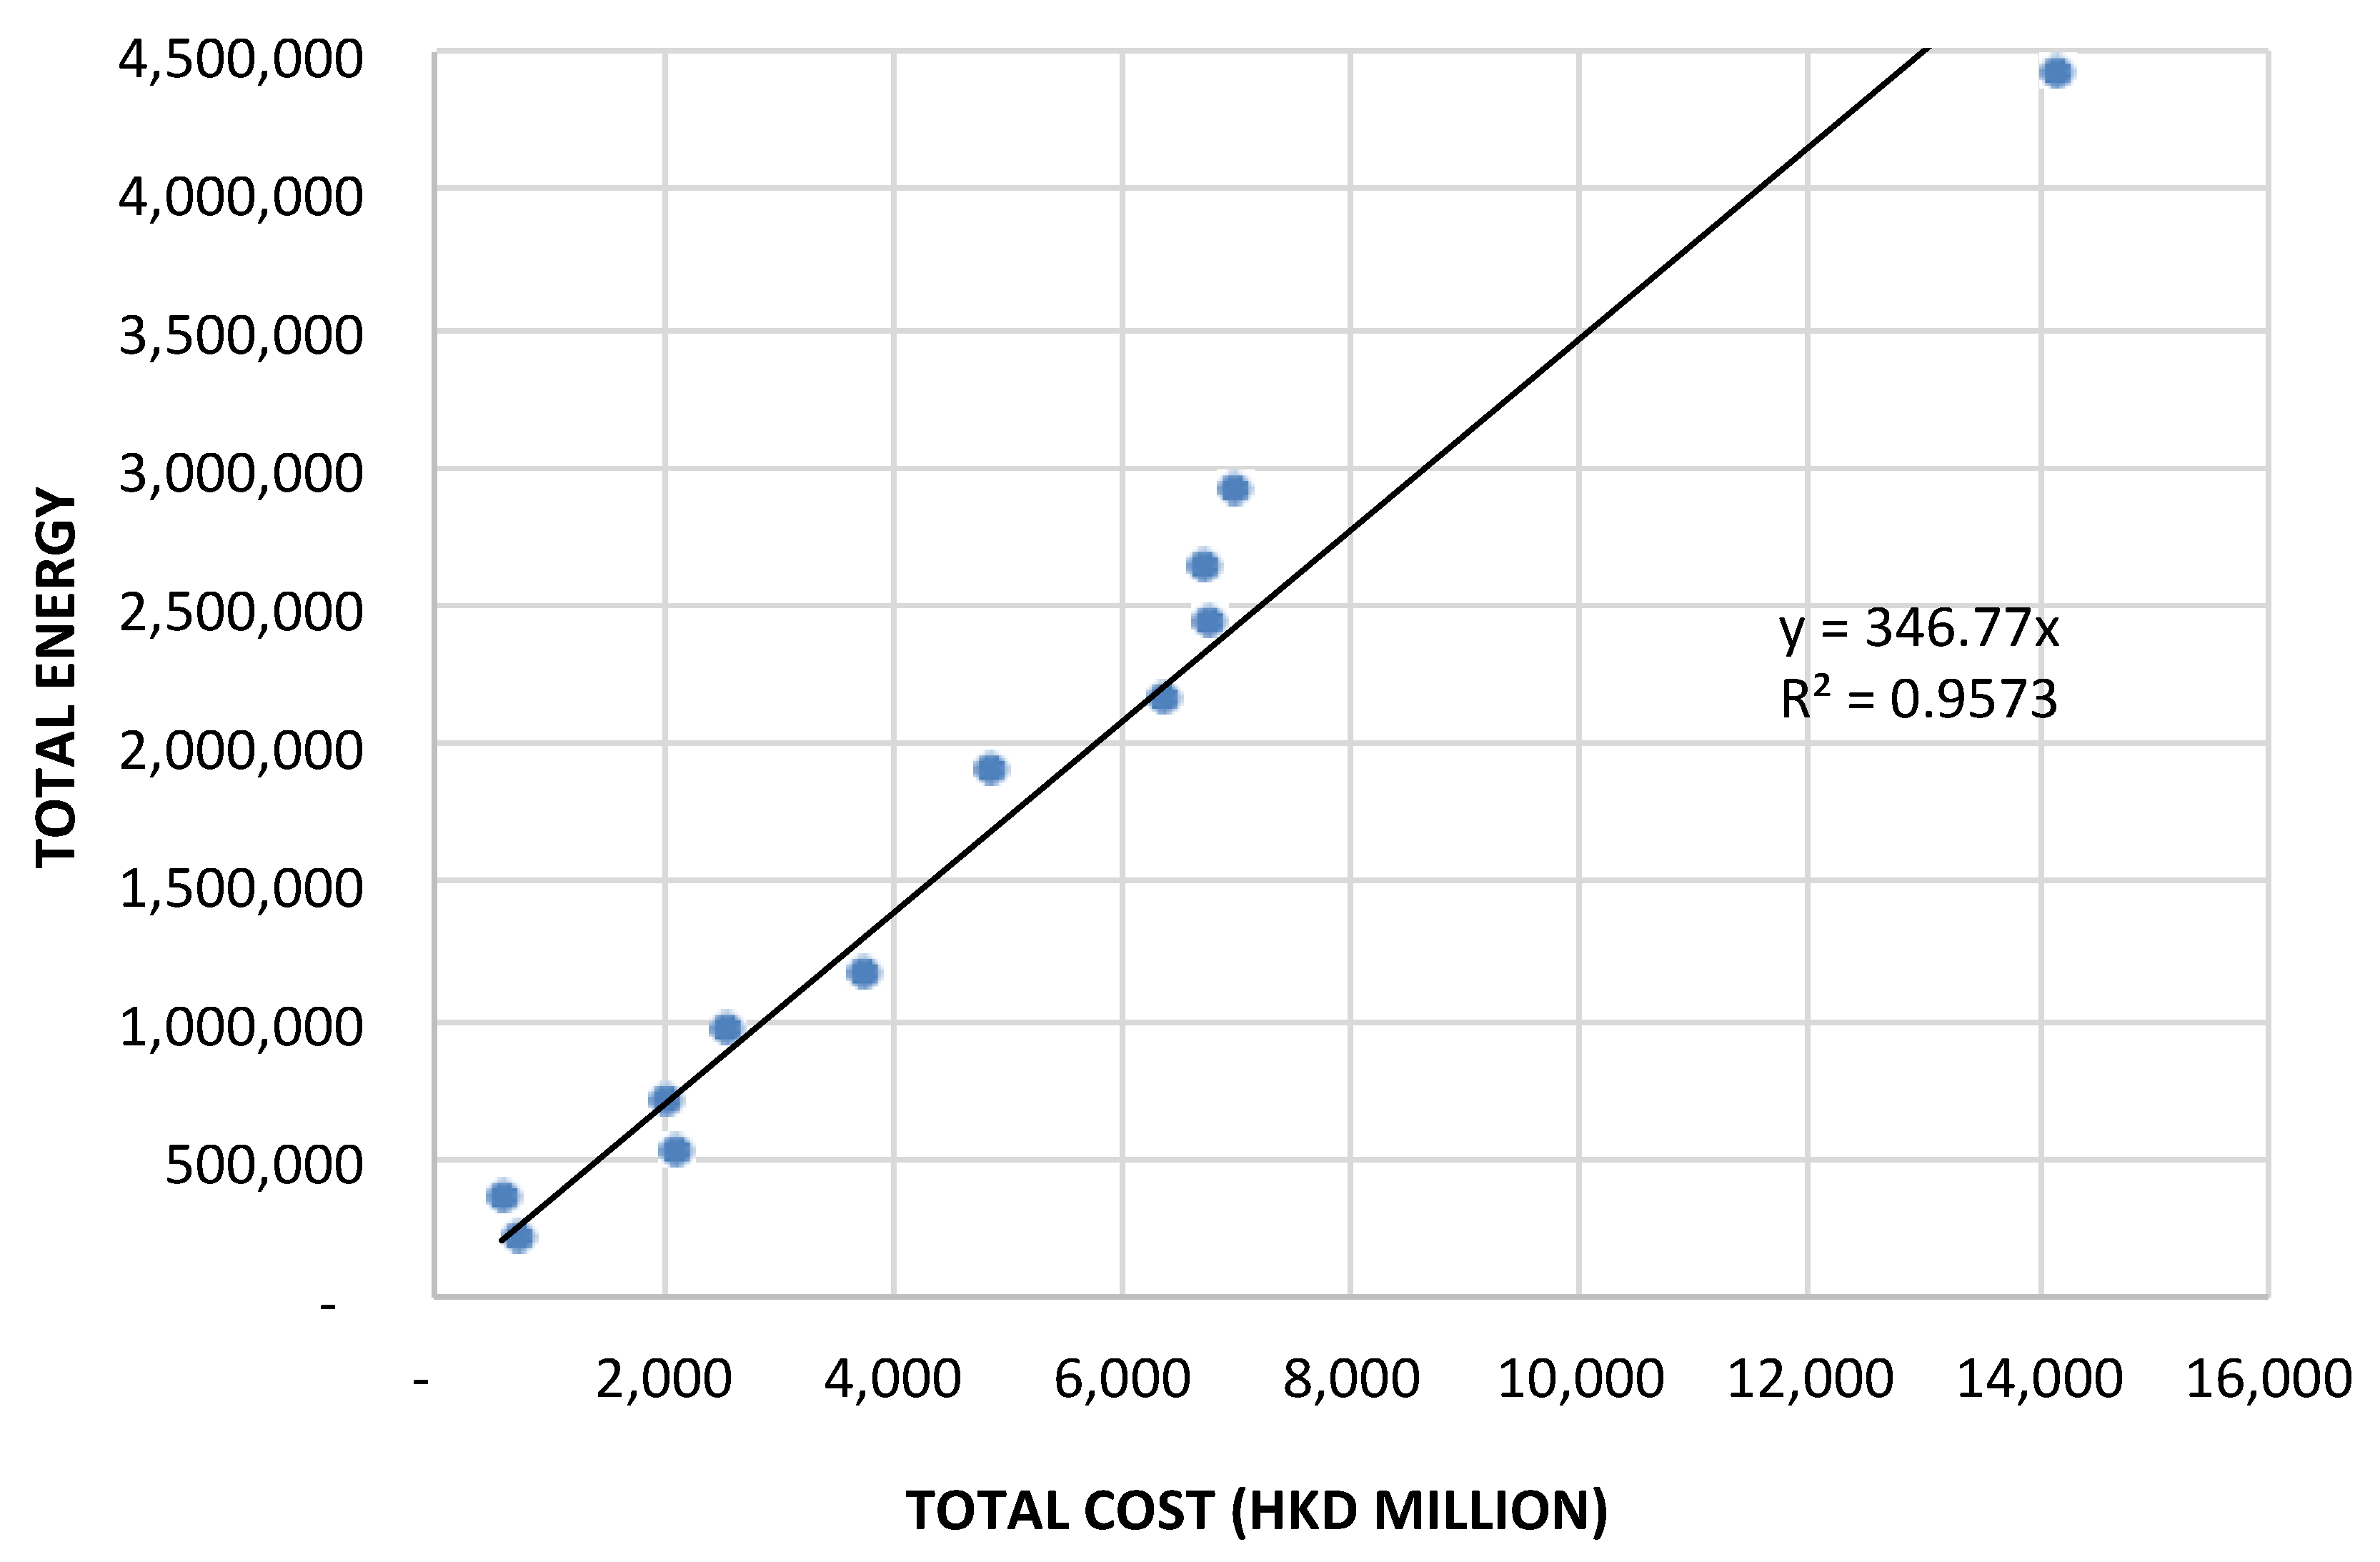
After removing the outliers stated above, a very strong relationship is found between EE and Cost for new-build (N) projects. Using Equation (1), an r2 of 0.9573 shows that EE (or EC) can be reliably predicted from Cost. EC equals EE multiplied by the current conversion factor for energy generation in Hong Kong. This is estimated to be 58.78 kgCO2e/GJ now, moving to 48.72 kgCO2e/GJ in the medium term future, or if China’s fuel mix is used instead, 69.40 kgCO2e/GJ now, moving to 63.16 kgCO2e/GJ in the medium term future (an increase in EC of 18.07% and 29.64%, respectively).
EEN = 346.77 × Cost
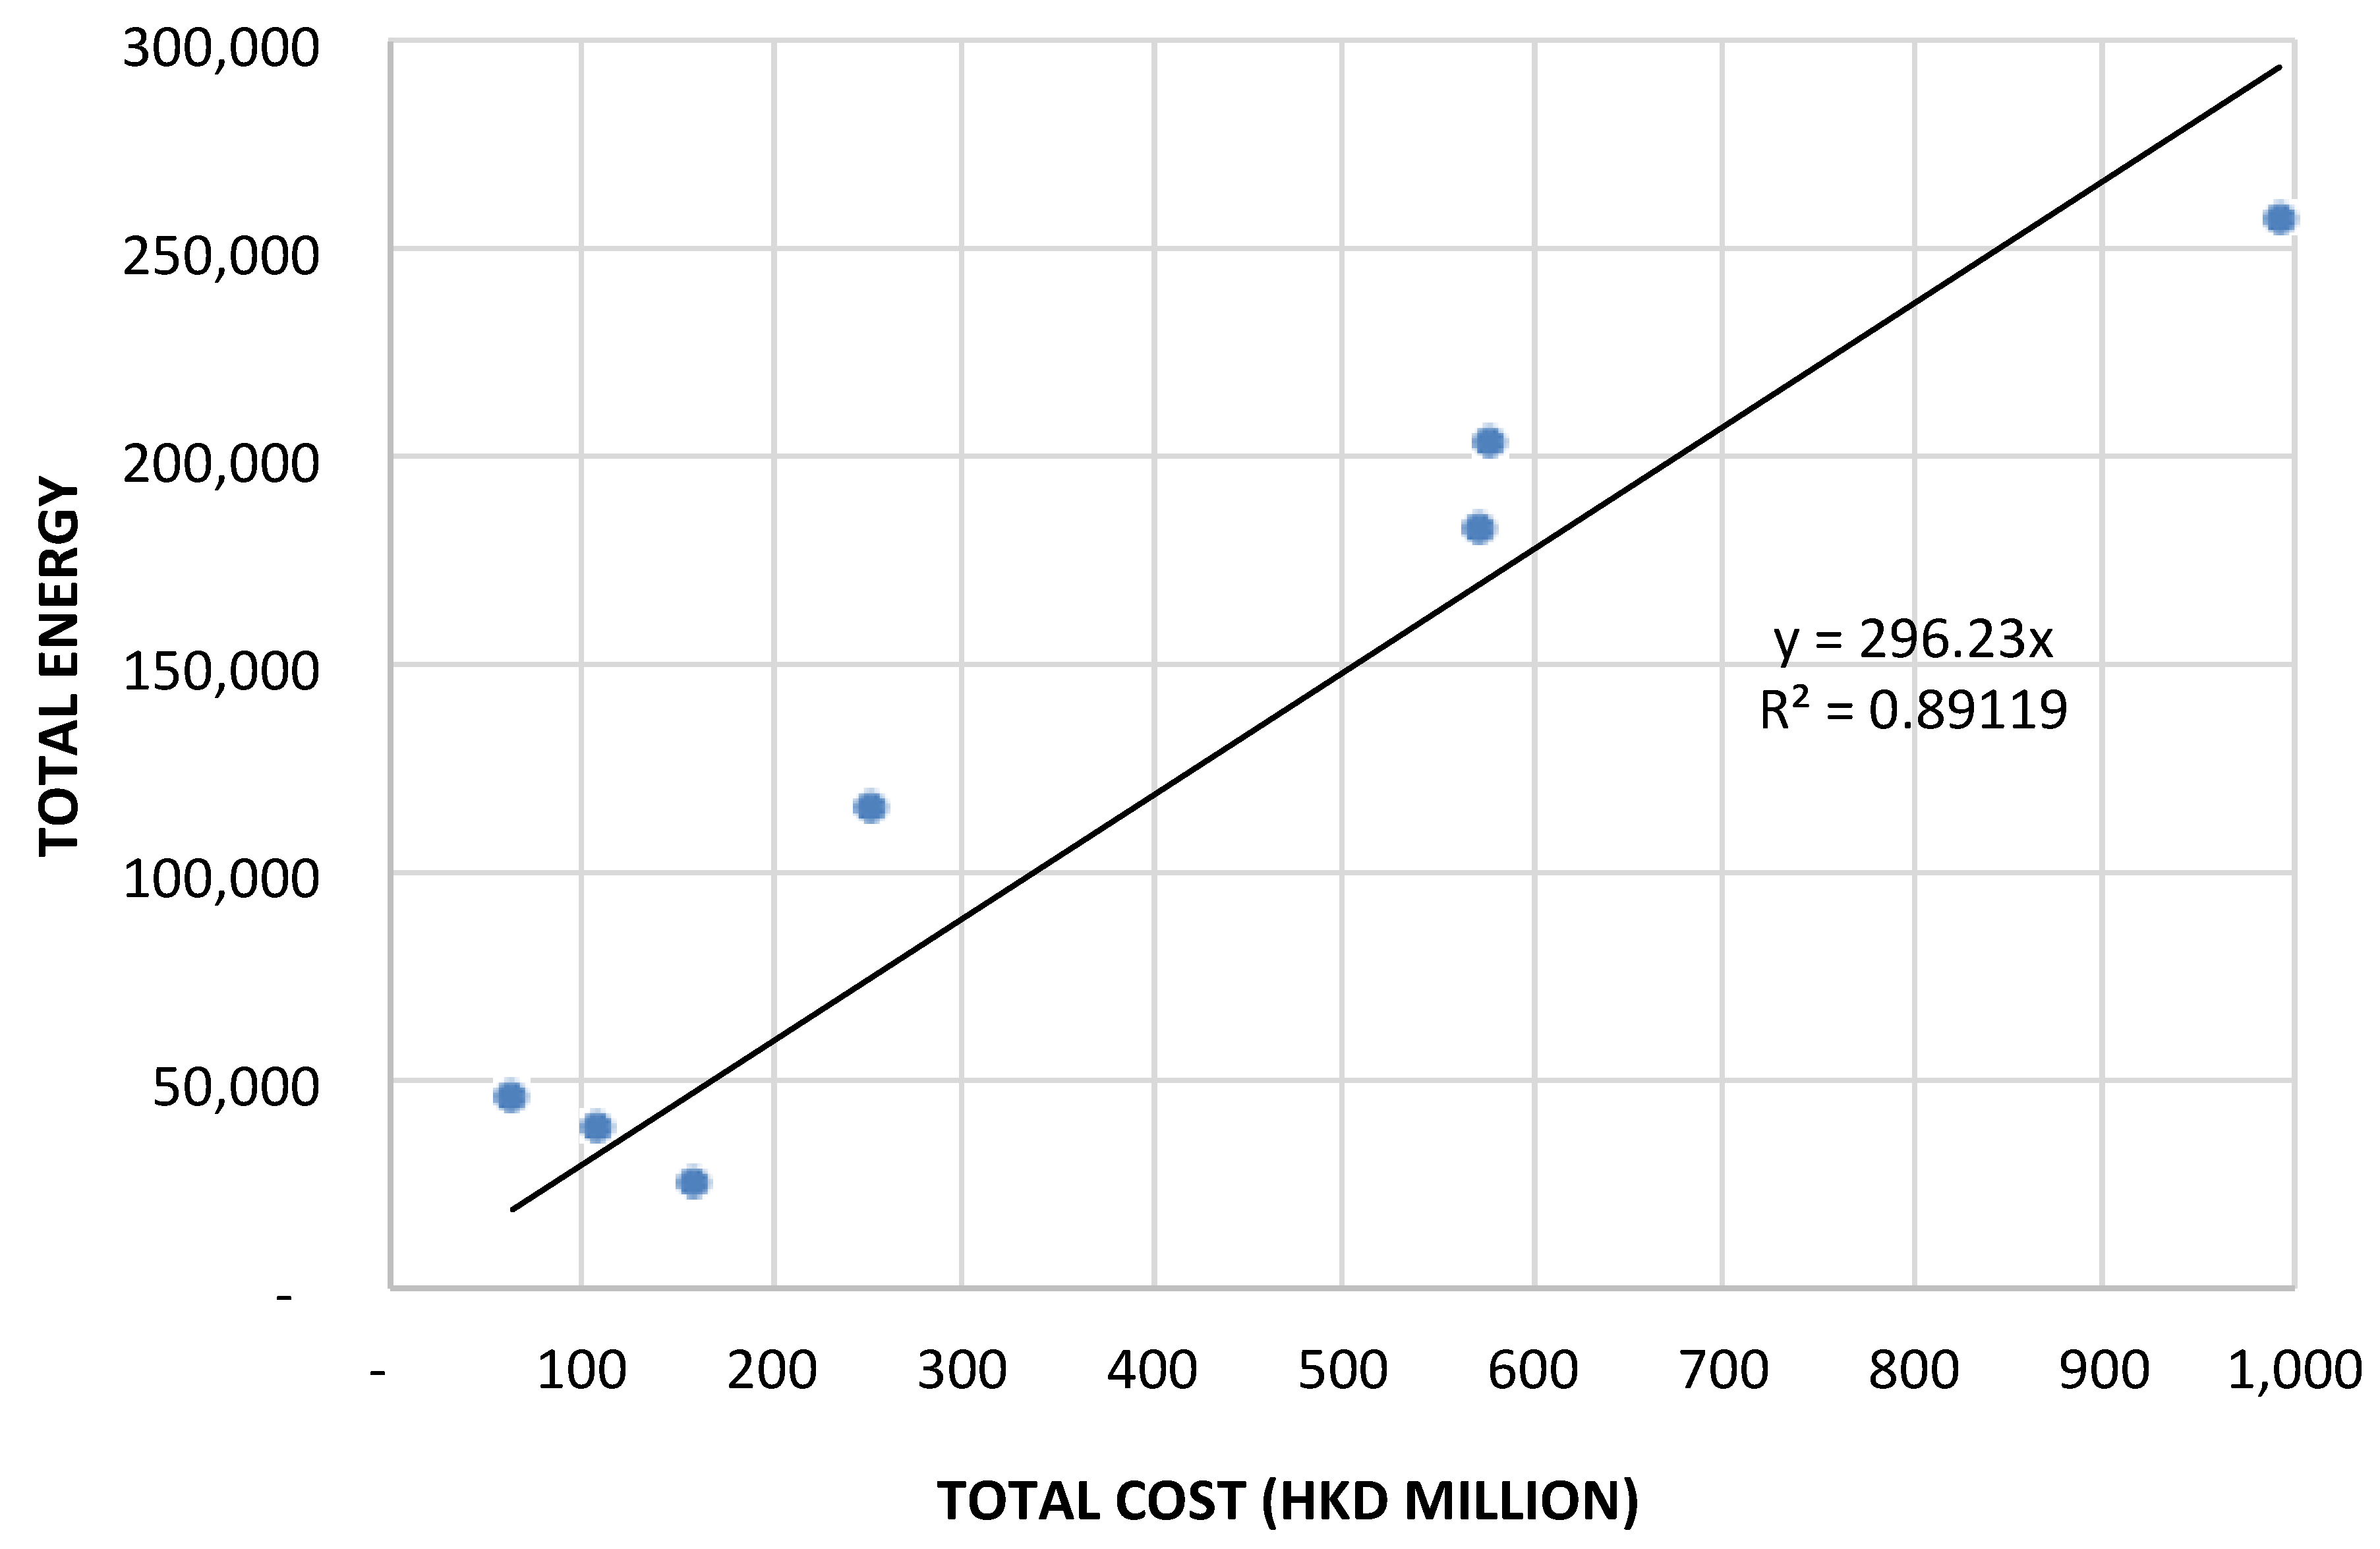
Refurbished (R) projects are also shown to have a very strong relationship between EE and Cost. Using Equation (2), an r2 of 0.8912 shows that EE (or EC) can be reliably predicted from Cost.
EER = 296.23 × Cost
Figure 4 and Figure 5 show this correlation graphically. The gradient of the line changes according to a variety of factors, including the EE-EC conversion factor and construction price inflation, but the correlation is likely to remain quite similar.
Overall, it is proven from the data collected that refurbished projects normally can be expected to have lower EE and EC through the reuse of materials in place during renovation activities. For projects that are a combination of new-build and refurbished, the constants in Equations (1) and (2) can be interpolated. These values are relevant for 2016 prices, and should be adjusted downwards in future years to reflect construction price inflation.
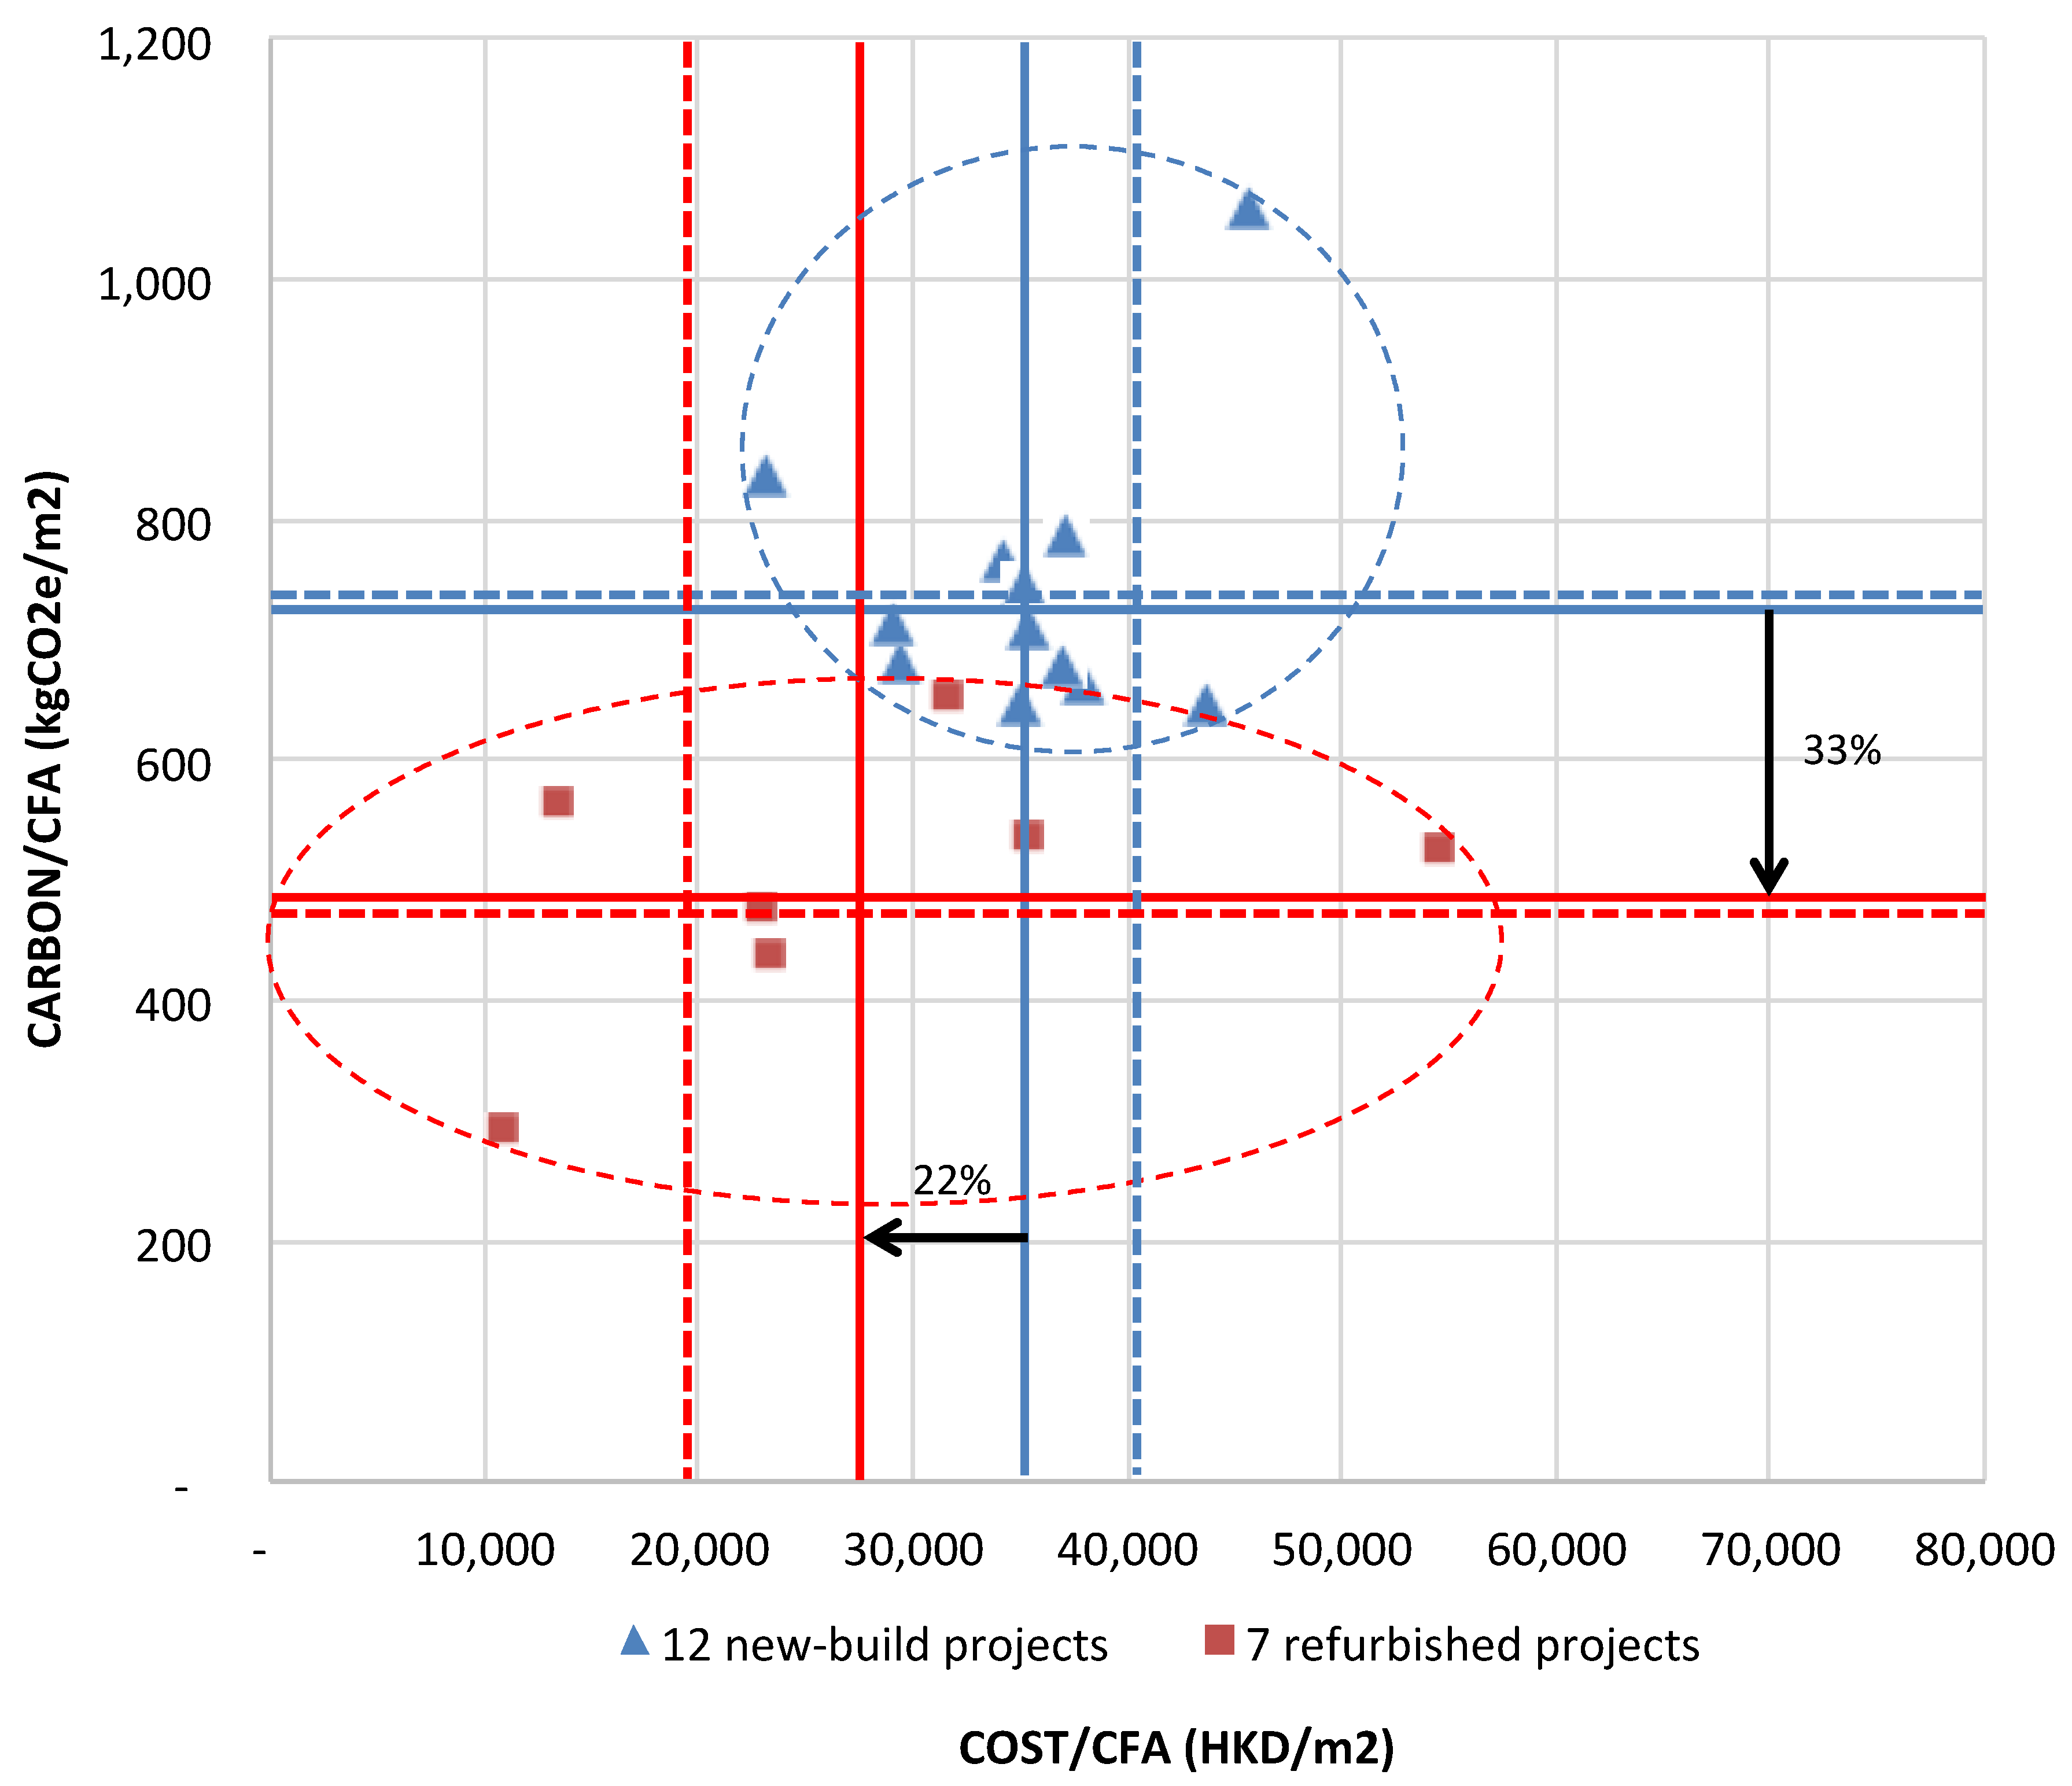
Figure 6 combines both new-build and refurbished projects together. The mean for each is computed to determine the likely reduction in EC and Cost per square meter. This is shown as 33% and 22%, respectively. The horizontal and vertical dotted lines represent mean EC and Cost prior to removal of outliers, and compute reductions of 39% and 50%, respectively.
Refurbished projects are likely to display higher variance, and in particular it may be likely that the cost of some complex refurbishments could exceed demolition and subsequent new-build. In such cases, the saving in EC could be multiplied by the international carbon price to make a case for why existing buildings, particularly for those with high heritage value, might be retained. The international carbon price varies currently in the range USD < 1 to 126/tCO2e [47]. Even assuming a future Hong Kong price might be about midway on this scale at USD 50/tCO2e, this would translate to a cost offset of about HKD 116/m2 (i.e., 761/1000 × 0.39 × 50 × 7.82, or 761 kgCO2e/m2 converted to tCO2e/m2 @ 39% saving (refurbished/new-build with no outliers removed) × USD 50/tCO2e × 7.82 HKD exchange rate). It is likely that to affect a decision between new-build and refurbishment, the cost offset would need to be at least 10% of the new-build price (i.e., HKD 4000/m2). This translates to a required carbon price of USD 1725/tCO2e—which is quite unrealistic.
5. Discussion
There is an urgency now to move away from the use of carbon as an energy source. The reality is that this transition cannot be achieved quickly [10]. International agreements have been made to ensure global warming this century is kept well below 2 °C compared to pre-industrial levels [9]. Doubts exist about our collective ability to achieve this target, but it is still considered possible given strong political will and cooperation [10,48].
As countries move to decarbonize, the conversion rate for EE-EC reduces towards zero. Therefore, in the future, if we are successful, the relationship between EC and Cost will be of theoretical interest only, presumably because renewable energy will be abundant and environmentally friendly. Until then, strategies to reduce the amount of carbon embodied in construction will be of importance, not only in monetary terms, but in order to ensure our planet remains habitable. The constructed environment is a major player in energy demand when the upstream and downstream energy footprint is considered over the full life cycle of buildings [10]. Can the world decarbonize in time? If it does, then ultimately EC is irrelevant. If it doesn’t, the human race might be irrelevant.
Langston [16] was one of the first to realize that embodied energy and construction cost were strongly correlated. This study, comprising thirty randomly selected (business-as-usual) projects in Melbourne, found that the relationship between EE and Cost (in 2004 AUD terms) was y = 0.0078x (i.e., EE could be predicted via multiplying the construction cost in 2004 by 0.0078). The relationship showed an r2 = 0.9542 across the thirty projects, similar to that found for Hong Kong. Although this work did not address EC, many years later an Australian conversion rate for EE-EC was determined as 65.07 kgCO2e/GJ [49].
Conversion from EE to EC is recommended to be a single calculation in the final step, and although a strong correlation will always be found between EC and Cost, the gradient of the regression line is likely to become smaller (i.e., flatter) over time. Cost also changes over time because of inflation, which is why Equations (1) and (2) are useful only if Cost in the future is first backdated to 2016. These relationships also depend on estimated values of energy intensity for the various new materials used within the project, the quantity (mass) of these materials, and the extent to which materials are recycled.
Energy intensities are the least significant of these factors. Not surprisingly, virgin aluminum had the highest intensity of 191 MJ/kg, followed by a number of other lightweight products such as plastics, sealants, paints, and insulation. At the other end of the scale, heavy materials such as aggregate (0.02–0.1 MJ/kg), ceramics (2.5–5.47 MJ/kg), and concrete (0.94–2.0 MJ/kg) can be found.
Steel products have mid-range energy intensities (8.9–34.8 MJ/kg), but given their mass, can have a significant impact on total embodied energy. Materials that are typically common in buildings comprise concrete, steel, glass (15.9–16.3 MJ/kg), plasterboard (6.1 MJ/kg), and timber (5.18–18.9 MJ/kg). Therefore, the combination of energy intensity and total mass of materials used within the project compute the total embodied energy, which is usually expressed as GJ/CFA. The 12 material types mentioned above are estimated to account for about 50% of the overall embodied energy footprint, while building services (HVAC, electrical, and plumbing) and fit-out (built-in fitments and furnishings) account for 18% and 12%, respectively.
However, the most significant factor affecting embodied energy footprints is the extent to which materials are recycled. This may take the form of steel, timber, and aggregate harvested from previous demolished/deconstructed projects, or in the case of refurbished projects, the amount of materials left in place. Recycled materials have lower embodied energy than new materials, and when left in place effectively constitute a free resource. Refurbished projects that reuse the structure can deliver lower embodied energy footprints than new projects (even when recycled materials are used), as is clear from the results of this study. Therefore, while energy intensities of materials may be one of three prime variables in embodied energy calculations, the mass of materials used is more influential, and limiting this mass through retaining the existing high-mass building structure is the most critical factor of all.
In terms of EC, the previous factors can all be rendered negligible if the energy mix comprises low carbon fuel types. Moving away from coal, oil, and gas fuels to non-fossil fuels such as solar and wind, hydro-electricity, and nuclear power affect the EE-EC conversion factor, and is clearly the most strategic solution to achieving long-term environmentally friendly outcomes. However, this takes time. It also is a function of where new materials are sourced. If a new building is constructed in Country A and all of its resources are purchased from Country B, then the energy mix that underpins the manufacture of these materials in Country B affects the calculations for Country A. Ignoring the carbon impacts because they lie outside the system boundary, and hence responsibility, of Country A is merely a false economy.
This is particularly important for countries like Hong Kong, which cannot realistically be separated from Mainland China where many of its material needs are obtained. However, this is also important for other countries rich in natural resources, like Australia, where purchasing decisions involving imports from other countries must be closely managed. Strategies such as green labeling and embodied carbon bar coding may be necessary to accurately account for these international computational challenges. Advances in technology and changes in the business-as-usual processes for building procurement may also have an effect.
6. Conclusions and Limitations
This research provides insight into the carbon implications of construction practices. The empirical results found that the likely reductions in EC and Cost per square meter for refurbished projects compared with new-build are 33% and 22%, respectively. This study provides a framework whereby comparisons can be made between new-build and refurbished projects on the basis of EC and in the context of related construction cost differentials.
This study did not test or generate theory, but rather applied current understanding of EC principles to explore what differences in carbon and cost exist between new-build and refurbished buildings in Hong Kong, which has not been done before. In the process, the researchers were able to test the hypothesis that the average quantity of EC/m2 for refurbished projects is significantly less than that for new-build projects. Cost/m2 was also shown to be less, although it is speculated that this will depend on a number of factors such as latent conditions and the expected standard of restoration work. When making comparisons between new-build and refurbished projects, the same energy intensities apply, so any errors largely cancel out.
On the basis of square meter rates, the merits of refurbished projects can be considered in economic terms by estimating the value of building material reuse via a future Hong Kong carbon price. Refurbished projects, particularly involving heritage conservation, comprise many socio-political considerations. It is unlikely that the economic value of the embodied carbon saving through refurbishment will ever influence the decision to proceed or not in any substantive way, but it nevertheless contributes to a better understanding of the current impact of carbon pricing on restoration activities.
There are a number of limitations with this study that need to be declared. First, the data provided by quantity surveying consultancies in Hong Kong was de-identified so as not to impair client confidentiality, and hence did not include contextual information such as location, drawings, or specification. Rather, the data received was a series of construction items taken directly from cost plans complete with their unit of measure (m2, m3, etc.) and quantity. These data were converted into mass (kg) for each material and multiplied by a corresponding EE intensity (GJ/kg) from a variety of international sources. Second, no reliable EE intensities for Hong Kong or China were discovered, and all previous research here has used generic international intensities from a range of sources as noted. Third, the findings are derived from a small sample of buildings in Hong Kong based on projects the Quantity Surveying firms had worked on over a five-year period. It was unfortunate that further case studies could not be obtained. It was also unfortunate that no heritage buildings were available to be included in the analysis.
The linear relationship between EE and Cost for both new-build and refurbished projects is likely to be more robust than the relationship between EC and Cost, since in the former case changes in the fuel mix (specifically due to the transition over time from a carbon-based economy to one using renewable energy) do not impact on the calculation. The practical implications of this suggests that EE can be determined quickly from the estimated construction cost (expressed in HKD for a 2016 base date) without the need to create a complex inventory of materials and corresponding energy intensities.
However, the future of embodied carbon decision-making lies in the hands of global moves to decarbonize national economies through use of non-fossil fuel sources of electricity generation. At some point in the future, hopefully at least, the topic of embodied carbon footprints will be redundant. Until then, built environment stakeholders have a role to play in minimizing environmental damage by careful design and a mindset of reuse, including recycling of demolished materials, design for longevity, and adaptive reuse of buildings when their initial usefulness wanes or their purpose becomes obsolete. Rather than embodied energy, ‘embodied pollution’ in upstream material manufacture might be a more fruitful pursuit.
Author Contributions
Each author’s individual contributions are as follows: Conceptualization, C.L., E.H.W.C. and E.H.K.Y.; Methodology, C.L. and E.H.W.C.; Validation, C.L., E.H.W.C. and E.H.K.Y.; Formal Analysis, C.L. and E.H.W.C.; Investigation, C.L. and E.H.W.C.; Resources, E.H.W.C. and E.H.K.Y.; Data Curation, C.L. and E.H.W.C.; Writing—Original Draft Preparation, C.L. and E.H.W.C.; Writing—Review & Editing, C.L., E.H.W.C. and E.H.K.Y.; Supervision, E.H.W.C., C.L. and E.H.K.Y.; Project Administration, E.H.W.C. and E.H.K.Y.; Funding Acquisition, E.H.W.C., E.H.K.Y. and C.L.
Funding
This research was funded by the Hong Kong Research Grant Council (RGC)—GRF grant number no. 152006/14E.
Acknowledgments
The authors are thankful to individual professionals and consultancy firms for providing cost information for this study, in particular the two major QS firms: RLB (Hong Kong) and Arcadis (Hong Kong)
Conflicts of Interest
The authors declare no conflict of interest.
References
- Jacobs, J. The Death and Life of Great American Cities; Random House: New York, NY, USA, 1961. [Google Scholar]
- Yung, E.H.K.; Chan, E.H.W.; Xu, Y. Sustainable development and the rehabilitation of a historic urban district—Social sustainability in the case of Tianzifang in Shanghai. Sustain. Dev. 2014, 22, 95–112. [Google Scholar] [CrossRef]
- Pomponi, F.; de Wolf, C.; Moncaster, A. (Eds.) Embodied Carbon in Buildings: Measurement, Management and Mitigation; Springer: Berlin, Germany, 2018. [Google Scholar]
- Treloar, G.J. Embodied Energy Analysis of Construction of Office Buildings. Master’s Thesis, Deakin University, Geelong, Australia, 1994. [Google Scholar]
- Luo, Z.; Yang, L.; Liu, J. Embodied Carbon Emissions of Office Buildings: A Case Study of China’s 78 Office Buildings. Build. Environ. 2016, 95, 365–371. [Google Scholar] [CrossRef]
- De Wolf, C.; Pomponi, F.; Moncaster, A. Measuring Embodied Carbon Dioxide Equivalent of Buildings: A Review and Critique of Current Industry Practice. Energy Build. 2017, 140, 68–80. [Google Scholar] [CrossRef]
- Zhang, X.; Wang, F. Analysis of Embodied Carbon in the Building Life Cycle Considering the Temporal Perspectives of Emissions: A Case Study in China. Energy Build. 2017, 155, 404–413. [Google Scholar] [CrossRef]
- Kumanayake, R.; Luo, H.; Paulusz, N. Assessment of Material Related Embodied Carbon of an Office Building in Sri Lanka. Energy Build. 2018, 166, 250–257. [Google Scholar] [CrossRef]
- United Nations Framework Convention on Climate Change. 2016. Available online: http://unfccc.int/paris_agreement/items/9485.php (accessed on 3 September 2018).
- IEA. Energy Efficiency Market Report 2016; International Energy Agency (IEA): Paris, France, 2016; Available online: https://www.iea.org/eemr16/files/medium-term-energy-efficiency-2016_WEB.PDF (accessed on 3 September 2018).
- Jackson, M. Embodied Energy and Historic Preservation: A Needed Reassessment. J. Preserv. Technol. 2005, 36, 47–52. [Google Scholar]
- Pan, W.; Qin, H.; Zhao, Y. Challenges for Energy and Carbon Modeling of High-rise Buildings: The Case of Public Housing in Hong Kong. Res. Conserv. Recycl. 2017, 123, 208–218. [Google Scholar] [CrossRef]
- Lenzen, M.; Murray, S.A. A Modified Ecological Footprint Method and its Application to Australia. Ecol. Econ. 2001, 37, 229–255. [Google Scholar] [CrossRef]
- RICS. Methodology to Calculate Embodied Carbon, 1st ed.; Royal Institution of Chartered Surveyors (RICS) Guidance Note (Global): London, UK, 2014. [Google Scholar]
- Chan, E.H.W.; Lee, G.K.L. Design Considerations for Environmental Sustainability in High Density Development: A Case Study of Hong Kong. Environ. Dev. Sustain. 2009, 11, 359–374. [Google Scholar] [CrossRef]
- Langston, Y.L. Embodied Energy Modeling of Individual Buildings in Melbourne: The Inherent Energy-cost Relationship. Ph.D. Thesis, Deakin University, Geelong, Australia, 2006. [Google Scholar]
- UN Environment and International Energy Agency. Towards a zero-emission, efficient, and resilient buildings and construction sector. Global Status Report 2017. Available online: https://globalabc.org/uploads/media/default/0001/01/35860b0b1bb31a8bcf2f6b0acd18841d8d00e1f6.pdf (accessed on 3 September 2018).
- Abanda, F.H.; Nkeng, G.E.; Tah, J.H.M.; Ohandja, E.N.F.; Manija, M.B. Embodied Energy and CO2 Analyses of Mud-brick and Cement-block Houses. AIMS Energy 2014, 2, 18–40. [Google Scholar]
- Langston, C. Life-Cost Approach to Building Evaluation; Elsevier: New York, NY, USA; UNSW Press: Sydney, Australia, 2005. [Google Scholar]
- CLF. Embodied Carbon Benchmark Study: LCA for Low Carbon Construction (Part 1); The Carbon Leadership Forum (CLF), University of Washington: Seattle, WA, USA, 2017; Available online: http://carbonleadershipforum.org/clf-embodied-carbon-benchmark-study/ (accessed on 3 September 2018).
- Simonen, K.; Rodriguez, B.; De Wolf, C. Benchmarking the Embodied Carbon of Buildings. Technol. Archit. Des. 2017, 1, 208–218. [Google Scholar] [CrossRef]
- Chen, T.Y.; Burnett, J.; Chau, C.K. Analysis of Embodied Energy Use in the Residential Building of Hong Kong. Energy 2001, 26, 323–340. [Google Scholar] [CrossRef]
- Chau, C.K.; Yik, F.W.H.; Hui, W.K.; Liu, H.C.; Yu, H.K. Environmental Impacts of Building Materials and Building Services Components for Commercial Buildings in Hong Kong. J. Clean. Prod. 2007, 15, 1840–1851. [Google Scholar] [CrossRef]
- Chau, C.K.; Hui, W.K.; Ng, W.Y.; Powell, G. Assessment of CO2 Emissions Reduction in High-rise Concrete Office Buildings using Different Material Use Options. Res. Conserv. Recycl. 2012, 61, 22–34. [Google Scholar] [CrossRef]
- Chau, C.K.; Leung, T.M.; Ng, W.Y. A Review on Life Cycle Assessment, Life Cycle Energy Assessment and Life Cycle Carbon Emissions Assessment on Buildings. Appl. Energy 2015, 143, 395–413. [Google Scholar] [CrossRef]
- Hammond, G.; Jones, C. ICE Inventory of Carbon and Energy, version 2.0; Sustainable Energy Research Team (SERT), University of Bath: Bath, UK, 2011; Available online: http://www.circularecology.com/embodied-energy-and-carbon-footprint-database.html#.WbCn_yN94nU (accessed on 3 September 2018).
- Chau, C.K.; Xu, J.M.; Leung, T.M.; Ng, W.Y. Evaluation of the Impacts of End-of-life Management Strategies for Deconstruction of a High-rise Concrete Framed Office Building. Appl. Energy 2017, 185, 1595–1603. [Google Scholar] [CrossRef]
- Gan, V.J.L.; Chan, C.M.; Tse, K.T.; Lo, I.M.C.; Cheng, J.C.P. A Comparative Analysis of Embodied Carbon in High-rise Buildings regarding Different Design Parameters. J. Clean. Prod. 2017, 161, 663–675. [Google Scholar] [CrossRef]
- Wu, X.; Peng, B.; Lin, B. A Dynamic Life Cycle Carbon Emission Assessment on Green and Non-green Buildings in China. Energy Build. 2017, 149, 272–281. [Google Scholar] [CrossRef]
- Gan, V.J.L.; Cheng, J.C.P.; Lo, I.M.C.; Chan, C.M. Developing a CO2-e Accounting Method for Quantification and Analysis of Embodied Carbon in High-rise Buildings. J. Clean. Prod. 2017, 141, 825–836. [Google Scholar] [CrossRef]
- Chau, C.K.; Burnett, J.; Lee, W.L. Assessing the Cost Effectiveness of Environmental Assessment Scheme. Build. Environ. 2000, 35, 307–320. [Google Scholar] [CrossRef]
- Lam, P.T.I.; Chan, E.H.W.; Poon, C.S.; Chau, C.K.; Chun, K.P. Factors Affecting the Implementation of Green Specifications in Construction. J. Environ. Manag. 2010, 91, 654–661. [Google Scholar] [CrossRef] [PubMed]
- Lam, P.T.I.; Chan, E.H.W.; Chau, C.K.; Poon, C.S.; Chun, K.P. Environmental Management System vs. Green Specifications: How do They Complement Each Other in the Construction Industry? J. Environ. Manag. 2011, 92, 788–795. [Google Scholar] [CrossRef] [PubMed]
- Ng, W.Y.; Chau, C.K. New Life of the Building Materials: Recycle, Reuse and Recovery. Energy Procedia 2015, 75, 2884–2891. [Google Scholar] [CrossRef]
- Fellows, R.; Liu, A. Research Methods for Construction, 4th ed.; Wiley-Blackwell: Hoboken, NJ, USA, 2015. [Google Scholar]
- Eisenhardt, K.M. Building Theories from Case Study Research. Acad. Manag. Rev. 1989, 14, 532–550. [Google Scholar] [CrossRef]
- Yin, R.K. Case Study Research and Applications: Design and Methods, 6th ed.; Sage Publications Inc.: Thousand Oaks, CA, USA, 2017. [Google Scholar]
- Zhang, X.; Wang, F. Assessment of Embodied Carbon Emissions for Building Construction in China: Comparative Case Studies using Alternative Methods. Energy Build. 2016, 130, 330–340. [Google Scholar] [CrossRef]
- Pomponi, F.; Moncaster, A. Scrutinising Embodied Carbon in Buildings: The Next Performance Gap Made Manifest. Renew. Sustain. Energy Rev. 2018, 81, 2431–2442. [Google Scholar] [CrossRef]
- Yeo, X.; Ng, R.; Song, B. Technique for Quantification of Embodied Carbon Footprint of Construction Projects using Probabilistic Emission Factor Estimators. J. Clean. Prod. 2016, 119, 135–151. [Google Scholar] [CrossRef]
- Energy Post China’s Electricity Mix: Changing So Fast That CO2 Emissions May Have Peaked. 2016. Available online: http://energypost.eu/chinas-electricity-mix-changing-fast-co2-emissions-may-peaked/ (accessed on 3 September 2018).
- EIA. China: International Analysis; U.S. Energy Information Administration (EIA): Washington, DC, USA, 2015. Available online: https://energy.gov/sites/prod/files/2016/04/f30/China_International_Analysis_US.pdf (accessed on 3 September 2018).
- Environment Bureau. Future Fuel Mix for Electricity Generation: Planning Ahead for a Better Fuel Mix; Consultation Document; HKSAR Environment Bureau: Hong Kong, China, 2014. Available online: http://www.enb.gov.hk/sites/default/files/en/node2605/Consultation%20Document.pdf (accessed on 3 September 2018).
- Greig, C. Will Climate and Emissions Targets Really Curb China’s Coal Consumption? Only Time Will Tell, The Conversation 2016. Available online: https://theconversation.com/will-climate-and-emissions-targets-really-curb-chinas-coal-consumption-only-time-will-tell-60328 (accessed on 3 September 2018).
- Xu, X.; Mu, M.; Wang, Q. Recalculating CO2 Emissions from the Perspective of Value-added Trade: An Input-output Analysis of China’s Trade Data. Energy Policy 2017, 107, 158–166. [Google Scholar] [CrossRef]
- Lotteau, M.; Loubet, P.; Sonnemann, G. An Analysis to Understand How the Shape of a Concrete Residential Building Influences Embodied Energy and Embodied Carbon. Energy Build. 2017, 154, 1–11. [Google Scholar] [CrossRef]
- World Bank. Carbon Pricing Watch 2017. 2017. Available online: https://openknowledge.worldbank.org/bitstream/handle/10986/26565/9781464811296.pdf?sequence=4&isAllowed=y (accessed on 3 September 2018).
- Pomponi, F.; Moncaster, A. Embodied Carbon Mitigation and Reduction in the Built Environment: What does the Evidence Say? J. Environ. Manag. 2016, 181, 687–700. [Google Scholar] [CrossRef] [PubMed]
- Langston, C. Green Roof Evaluation: A Holistic ‘Long Life, Loose Fit, Low, Energy’ Approach. Constr. Econ. Build. 2015, 15, 76–94. [Google Scholar] [CrossRef]
Figure 1.
Embodied Carbon Benchmark Database (ECBD) findings—Source: Simonen et al. [21], reproduced with permission of lead author.
Figure 1.
Embodied Carbon Benchmark Database (ECBD) findings—Source: Simonen et al. [21], reproduced with permission of lead author.

Figure 2.
New-build embodied carbon/construction floor area (EC/CFA) versus Cost/CFA.

Figure 3.
Refurbished EC/CFA versus Cost/CFA.

Figure 4.
New-build embodied energy (EE) versus Cost (outliers removed).

Figure 5.
Refurbished EE versus Cost (outliers removed).

Figure 6.
New-build versus Refurbished EC and Cost Comparison.


Table 1.
Hong Kong electricity generation mix—Source: Environment Bureau [43].
Table 1.
Hong Kong electricity generation mix—Source: Environment Bureau [43].
| Generation Type | Now (2012) | Emission Factor (kgCO2e/GJ) | Future (2023) | Emission Factor (kgCO2e/GJ) |
|---|---|---|---|---|
| Coal-fired power | 53% | 89.60 | 20% | 89.60 |
| Natural gas | 22% | 51.33 | 60% | 51.33 |
| Nuclear | 23% | 0.00 | 20% | 0.00 |
| Others | 2% | 0.00 | ||
| Fuel mix: | 58.78 | 48.72 | ||
Table 2.
New-build projects.
| ID | CFA | Cost | EE | EE/CFA | EC/CFA | Cost/CFA | Comment |
|---|---|---|---|---|---|---|---|
| 1 | 25,477 | 588 | 362,195 | 14.22 | 836 | 23,093 | |
| 2 | 107,663 | 3750 | 1,181,816 | 10.98 | 645 | 34,835 | |
| 3 | 19,735 | 748 | 222,860 | 11.29 | 664 | 37,880 | |
| 4 | 17,901 | 1097 | 257,327 | 14.38 | 845 | 61,271 | low-rise |
| 5 | 164,533 | 4827 | 1,910,130 | 11.61 | 682 | 29,339 | |
| 6 | 384,137 | 14,165 | 4,430,499 | 11.53 | 678 | 36,875 | |
| 7 | 53,969 | 2000 | 723,626 | 13.41 | 788 | 37,067 | |
| 8 | 240,846 | 6963 | 2,929,006 | 12.16 | 715 | 28,912 | |
| 9 | 146,775 | 6689 | 2,644,634 | 18.02 | 1059 | 45,574 | |
| 10 | 15,785 | 1236 | 235,325 | 14.91 | 876 | 78,277 | low-rise |
| 11 | 48,496 | 2113 | 533,310 | 11.00 | 646 | 43,570 | |
| 12 | 74,292 | 2532 | 968,524 | 13.04 | 766 | 34,086 | |
| 13 | 192,047 | 6749 | 2,439,680 | 12.70 | 747 | 35,145 | |
| 14 | 179,725 | 6365 | 2,170,321 | 12.08 | 710 | 35,415 | |
| Mean: | 12.95 | 761 | 40,096 |
Notes: CFA = construction floor area (m2); Cost = HKD (millions); EE = embodied energy (GJ); EC = embodied carbon (kgCO2e); EE>EC conversion = 58.78 kgCO2e/GJ.
Table 3.
Refurbished projects.
| ID | CFA | Cost | EE | EE/CFA | EC/CFA | Cost/CFA | Comment |
|---|---|---|---|---|---|---|---|
| 15 | 23,161 | 253 | 115,684 | 4.99 | 294 | 10,905 | |
| 16 | 28,150 | 992 | 257,119 | 9.13 | 537 | 35,236 | |
| 17 | 2900 | 158 | 26,009 | 8.97 | 527 | 54,410 | |
| 18 | 4712 | 107 | 38,376 | 8.14 | 479 | 22,784 | |
| 19 | 4800 | 64 | 46,299 | 9.65 | 567 | 13,300 | |
| 20 | 24,490 | 571 | 183,204 | 7.48 | 440 | 23,316 | |
| 21 | 275 | 3 | 2095 | 7.62 | 448 | 11,891 | decorative |
| 22 | 18,294 | 577 | 203,727 | 11.14 | 655 | 31,557 | |
| 23 | n/a | 71 | 4199 | n/a | n/a | n/a | façade |
| 24 | 610 | 3 | 3485 | 5.71 | 336 | 5082 | decorative |
| 25 | 10,155 | 13 | 70,617 | 6.95 | 409 | 1325 | decorative |
| 26 | 4010 | 35 | 29,741 | 7.42 | 436 | 8728 | decorative |
| Mean: | 7.93 | 466 | 19,867 |
Notes: CFA = construction floor area (m2); Cost = HKD (millions); EE = embodied energy (GJ); EC = embodied carbon (kgCO2e); EE>EC conversion = 58.78 kgCO2e/GJ.
© 2018 by the authors. Licensee MDPI, Basel, Switzerland. This article is an open access article distributed under the terms and conditions of the Creative Commons Attribution (CC BY) license (http://creativecommons.org/licenses/by/4.0/).
Share and Cite
MDPI and ACS Style
Langston, C.; Chan, E.H.W.; Yung, E.H.K. Hybrid Input-Output Analysis of Embodied Carbon and Construction Cost Differences between New-Build and Refurbished Projects. Sustainability 2018, 10, 3229. https://doi.org/10.3390/su10093229
AMA Style
Langston C, Chan EHW, Yung EHK. Hybrid Input-Output Analysis of Embodied Carbon and Construction Cost Differences between New-Build and Refurbished Projects. Sustainability. 2018; 10(9):3229. https://doi.org/10.3390/su10093229
Chicago/Turabian StyleLangston, Craig, Edwin H. W. Chan, and Esther H. K. Yung. 2018. "Hybrid Input-Output Analysis of Embodied Carbon and Construction Cost Differences between New-Build and Refurbished Projects" Sustainability 10, no. 9: 3229. https://doi.org/10.3390/su10093229
Note that from the first issue of 2016, this journal uses article numbers instead of page numbers. See further details here.