A Framework of Production Planning and Control with Carbon Tax under Industry 4.0

Department of Business Administration, National Central University, 300, Jhongda Rd., Jhongli, Taoyuan 32001, Taiwan
*
Author to whom correspondence should be addressed.
Sustainability 2018, 10(9), 3221; https://doi.org/10.3390/su10093221
Submission received: 23 August 2018
/
Revised: 4 September 2018
/
Accepted: 5 September 2018
/
Published: 8 September 2018
(This article belongs to the Special Issue Modelling and Analysis of Sustainability Related Issues in New Era)
Abstract
:In recent years, the international community has placed great emphasis on environmental protection issues. The United Nations has also successively enacted relevant laws and regulations to restrain international greenhouse gas emissions and some countries implemented carbon tax levies to reduce air pollution. The tire industry is a manufacturing industry with high pollution and high carbon emissions; therefore, the purpose of this paper is to propose a framework of production planning and control with carbon tax under Industry 4.0 and use the tire industry as the illustrative example. In this framework, the mathematical programming model, with Activity-Based Costing (ABC) and Theory of Constraints (TOC) for production planning, is used to achieve the optimal solution under various production and sale constraints in order to find the optimal product-mix maximizing the profit. On the other hand, Industry 4.0 utilizes new technologies such as 3D printing, robot and automated guided vehicle (AGV) and links all the components in the manufacturing systems by using various sensor systems, Cyber-Physical Systems (CPS) and Internet of Things (IoT) to collect and monitor the activity data of all the components in real-time, to give intelligent responses to various problems that may arise in the factory by the real-time analysis results of cloud computing and big data and to attain the various benefits of Industry 4.0 implementation. The parameters of the mathematical programming model will be updated periodically from the new big data set. In this paper, an illustrative example is used is used to demonstrate the application of the model. From the optimal solution and sensitivity analyses on increasing the raw material’s prices and carbon taxes will affect the profits. This framework can provide a general approach to help companies execute production management in the way of more efficiency, less cost, lower carbon emission and higher quality across the value chain for the tire industry and other industries.
1. Introduction
While Industry 4.0 has emerged in the manufacturing industry in recent years, the introduction of Industry 4.0 in the manufacturing industry is still rare [1]. In recent years, consolidating the real economy has been emphasized by governments at all levels as one of the important components of the economy, thus, modern manufacturing industries are receiving great attention by related industries and governments at all levels. Hermann et al. [2] pointed out that interoperability and modularity result in the processing of huge amounts of data, as produced by these heterogeneous devices; data processing and integration with other systems for industrial processes, including the core context of Industry 4.0, remain research challenges.
In recent years, the international community has placed considerable emphasis on environmental protection issues and the United Nations has also successively enacted relevant laws and regulations such as international greenhouse gas emissions and the 2015 Paris Accord (UNFCC, 2016), in the hope that the environment we live in will not continue to deteriorate. Due to the developments of science and technology and the result of high industrialization, anthropocentric greenhouse gases are continually generated and accumulated, leading to increased global warming with deteriorating climate and environmental ecology. In the past decade, it has been well recognized that environmental and economic performance are mutually reinforcing, such as improved environmental performance leading to lower costs, increased sales and raising economic efficiency. Different perspectives and empirical studies suggest that more attention should be paid to the causal relationship between eco-efficiency and different environmental management approaches [3,4], as well as their economic consequences. For example, the implementation of the carbon tax will help to improve the environment.
The purpose of this paper is to propose a framework of production planning and control with carbon tax under Industry 4.0 and use the tire industry as the illustrative example. This framework is shown in Figure 1. In this framework, the mathematical programming model is used to imitate the real situation of business to achieve the optimal solution under various production and sale constraints, where Activity-Based Costing (ABC) [5] is used to calculate the accurate costs of activities and products for the tire industry and Theory of Constraints (TOC) [6,7] is used to formulate the constraints related to production and sale or cost-associated. This is the “production planning” part of the framework, which will give the optimal production and sale target and the profit target in the manufacturing operation for the management, that is, it uses the mathematical programming model to find the optimal product-mix maximizing the profit under various constraints.
On the other hand, the related technologies of Industry 4.0 are used to control the manufacturing activities to achieve the profit and sale targets. Industry 4.0 is composed of three tiers of technologies including the automation technologies for manufacturing activities, the Manufacturing Execution Systems (MES) for shop floor control [8,9,10,11] and the Enterprise Resource Planning Systems (ERP) [12] for big data analysis [13,14,15] and cloud computing [16]. That is, Industry 4.0 utilizes new technologies such as 3D printing, robot and automated guided vehicle (AGV) [17,18] and links all the components in the manufacturing systems by using various sensors systems, Cyber-Physical Systems (CPS) [19,20] and Internet of Things (IoT) [15,21,22]. Then, the system will real-timely collect and monitor the activity data of all the components and give intelligent responses to various problems that may arise in the factory by the real-time analysis results of cloud computing and big data [22]. The parameters of the mathematical programming model will be updated periodically from the new big data set. For example, ABC cost parameters can be updated from more real data.
Based on the framework mentioned above, the remainder of this paper is organized into five sections. Section 2 describes the research background of this research. Section 3 develops the green production planning model for the tire industry with ABC and TOC. An illustrative example is presented in Section 4 to demonstrate how to apply the model proposed in this paper and to conduct the sensitivity analysis. Shop floor control under Industry 4.0 in Tire industry is explained in Section 5. Finally, conclusions are presented in Section 6.
2. Research Background
2.1. Brief of Industry 4.0
The Industrial Internet of Things (IIoT) addresses the economic, ecological and social aspects of sustainable value creation for manufacturers. The core of technology is more important than its technical foundation and economic discussions are still in infancy. Using exploratory multi-case research methods and semi-structured interviews with experts from manufacturing companies in three major German industries, Kiel et al. [23] found that achieving sustainable industrial value creation can be achieved through expanding technology integration of data and information. The rise of the third industrial revolution was mainly driven by the computerization of manufacturing and manufacturing processes supported by business processes and information technology, beginning with the development of smart goods, three-dimensional printers and substantive core links [15]. The development of the Internet of Things (IoT) and big data is the key concept and core of Industry 4.0. The implementation of Industry 4.0 has had profound impact on industrial value creation. Therefore, the relevance of the relevant opportunities and challenges in Industry 4.0 is studied. As a driving factor for the implementation of Industry 4.0 in the context of sustainable development, different perspectives are adopted from different company scales and industry sectors. It was found that strategy, operations, environmental and social opportunities were positive drivers of Industry 4.0 implementation, while competitiveness and future viability, as well as organizational and production challenges, hampered its progress [24]. The system is continuously developed for a variety of industries, including big data, personnel, animal or atmospheric phenomena and so forth it can instantly collect these constantly updated data for analysis.
The world is currently facing the challenge of growing capital and consumer demand, while ensuring sustainable human survival and environmental and economic development. In order to cope with this challenge, industrial value creation must be sustainable and the development of Industry 4.0 offers tremendous opportunities for sustainable manufacturing. Recent research and practice developments have outlined the different opportunities for sustainable manufacturing that showcase Industry 4.0, which use cases of retrofitting manufacturing equipment as a specific opportunity for sustainability [25]. The growth of Industry 4.0 requires more sustainable production plans to continue producing high quality products. The intelligent production systems of the future will be able to automatically configure the production of a variety of products and use it as the driver for the implementation of Industry 4.0 in terms of sustainable development [26,27]. Information needs analysis can help reduce big data to smart data and identify possible contextual key elements. A demonstration application has been developed for the provision of context-related information [28].
2.2. Green Production and Environmental Protection in the Tire Industry
In recent years, due to environmental concerns, new green manufacturing technologies have been widely explored and applied to improve operation technology and have also been used in the manufacturing investments [29,30,31,32]. In recent years, the issue of global warming has drawn ever-greater attention and carbon taxes have been adopted by various countries, such as Denmark, Norway, Sweden and the Netherlands, to reduce their carbon dioxide emissions. Economists and international organizations demand the introduction of carbon taxes as a cost-effective way to decrease greenhouse gas emissions [32,33]. Moreover, carbon duty guidelines can also promote the growth and application of renewable power sources, lay a solid foundation for implementing environmental measures and assist in the growth of the global economy [33,34,35]. With rapid technological progress, the tire industry has been pushed to recognize the need for environmental protection for the sustainable development of enterprises in regard to indispensable factors, such as raw materials. By embracing the concept of environmental protection, processes and products must support care of the environment and cherish resources, as well as improved product designs, equipment and surrounding operations. In addition, with the increase in corporate social responsibility awareness, the tire industry must consider the cost of carbon emissions, in order to accurately predict tire production costs and reduce the impact on environmental pollution.
2.3. The Current Application of Industry 4.0 in Tire Industry
In recent years, the consolidation of the economy has been emphasized by governments at all levels and this industrial production is classified as the Industrial Internet of Things (IoT) or Industry 4.0 [36]; the modern manufacturing industry receives great attention by related industry and governments at all levels. Various industries are working hard to improve manufacturing efficiency [37]. Beier et al. [38] proposed a way to support manufacturing execution systems to provide support for developers and practitioners. As the tire production process is complex [39], the Manufacturing Execution System (MES) in the tire production process becomes more complex. Due to the complexity of the tire process, as compared with common process industries, the design of the system architecture and the realization of an information network are much more complex; with the influence of many types of uncertain factors in the production process, the difficulty of implementing MES is increased. Thus, we must improve the traditional MES [8,9], as based on the actual situation of tire production processes, in order to meet the requirements of tire production processes.
Since 2014, with the rise of German Industry 4.0, which proposed and implemented the big data analytics architecture [40] and agenda, the data analysis of literature points out the existing deficiencies and potential research directions as the foundation for future Industry 4.0 research and related topics [41]. The tire manufacturing industry has had to abandon traditional manufacturing to achieve intelligent chemical plants; the former labor-intensive production methods oriented throughout the factory production process now sees workers replaced by smart robots. Workers only need to confirm the key activities and adjustments and press a few buttons; intelligent robots can complete the vast majority of work. Previous manual preparations of very heavy materials required a lot of labor; now, the AGV car [17,18] will automatically carry the material to its destination. After the tires are formed, the robot will automatically take the tire and move it directly to the next manufacturing process. The entire process of things, people, tooling, equipment and location information intelligent matching can truly achieve quality tracking and traceability, which enables the global tire industry to achieve the whole process of an intelligent enterprise. Through Industry 4.0 intelligent plants, the future tire industry can significantly reduce the labor intensity of employees, thus, enabling the product to achieve high-end, high value-added, high quality and energy efficiency to reach the advanced global level. In the era of intelligent manufacturing [42], the tire industry has to seize the opportunity to transition from a traditional manufacturing enterprise to an internet platform business.
2.4. Sustainability and Industry 4.0
Kamble et al. [43] proposed a sustainability Industry 4.0 framework which included three tiers: (1) Industry 4.0 related technologies (IoT, Big data, Cloud computing, Simulation & prototype, 3D printing, Augmented reality and Robotic systems), (2) Process integration (Human-machine collaboration, Shop floor-equipment) and (3) Sustainable outcomes (Economic, Process automation and safety and Environmental protection). This framework means that companies can uses the related technologies of Industry 4.0 to achieve the process integration which interconnect all the elements (machines, equipment, people, work-in-process and products) of the manufacturing systems in order to efficiently execute the manufacturing tasks using the least resources, time and energy and generating least waste and emissions. This will result in three pillars of sustainability [25,44,45]: (1) economic sustainability through using least resources, time and energy, (2) social sustainability through placing importance on the right or health of employees, community and other stakeholders, (3) environmental sustainability through using least energy, generating least waste and emission and recycling the resources [46,47,48,49,50]. Sustainable Industry 4.0 concept was applied in supply chains [51,52] and industrial value creation [23,24,25,45]; it also was investigated in different countries [38].
3. Production Planning Model with ABC and TOC
ABC was developed in mid-1980 and had been a general costing method since then. In the model proposed in this paper, ABC is used to measure the costs of activities. ABC cost system can be applied to solve the shortcomings of the traditional cost system. While traditional cost system allocates factory (indirect) overhead to products by using the volume-related allocation bases (such as direct labor, direct material and machine hour), ABC allocates factory (indirect) overhead to products by using volume-related or volume-unrelated allocation bases which consider the causal relationship between overhead and products [53,54]. Especially, two-stage ABC assignment method first assigns the overhead (or resource) cost to activities by using resource drivers and then assigns activity costs to products (or cost objects) by using activity drivers [55]. That is, activities is the intermediate of ABC cost assignment and there are four levels of activities in the factory: (1) unit-level activities (performed one time when a unit is produced such machining, 100% inspection, etc.), (2) batch-level activities (performed one time for a batch such as material handling, set-up, scheduling, sampling inspection, etc.), (3) product-level activities (performed one time for each kind of product such as product design, advertising, etc.) and (4) facility-level activities (performed for maintaining the factory operation) [56].
The ABC method can be customized to analyze different types of board decision making, which includes price and product-mix [56,57], environmental management [58], green building project, strategy and construction method selection [59,60,61,62], green supply chain management [63,64], green airline fleet planning [11], outsourcing solutions [65] and green airline fleet planning [66]. This article applies mathematical programming models and analyzes the most profitable tire product mix using the ABC approach. The ABC system has four benefits: (1) accurately identifying product costs and expenses; (2) identifying activity drivers and obtaining accurate information on value-added and non-value-added activity costs; (3) assigning costs to products or activities that consume resources by a causal way; (4) determining of non-value-added activity costs to find the opportunities and priorities of cost reduction [55,67]. These benefits can be applied to the ABC mathematical programming model of the tire industry.
In addition, systematic analysis of overhead cost be used to find the optimal product mix decisions through linear programming and TOC [56]. Patterson [68] focused on the concept of throughput accounting, which directly links product mix solution to the TOC theory. Plenert’s (1993) [53] economic planning includes using an integer linear programming method and TOC to find the optimal product mix with various restricted capital. Tsai et al. [60] employed TOC-based arithmetic to obtain the best product mix solution. This study also uses the TOC approach to determine production priorities, as this approach can be applied to a variety of study themes for deriving the best product mix [56,57,58,69].
When Germany introduced Industry 4.0 in 2011, it symbolized the beginning of the fourth industrial revolution. While previous linear programming models were widely used to solve production planning problems [70,71,72,73,74,75], another important feature combined with today’s Industry 4.0 [35] is the capability to gather and make use of large amounts of data. An important driver behind Industry 4.0 is the internet and related connectivity elements, as used on the shop floor, enable machines to communicate and collaborate for production control. Therefore, this paper considers that these concepts can be used to solve the complex processes of producing tires and collect a large amount of follow-up production and control data by means of the real-time interconnection, which can propel the future research of the tire industry into the Industry 4.0 structure [25].
3.1. A Production Process for a Typical Tire Company
In the tire industry, the production process can be divided into six major activities: kneading, pressing out, cutting off, forming, vulcanizing and inspecting: (1) Kneading (j = 1): All the rubber materials, such as soot and so forth, are sent to a kneading machine, in order to change the strength of the rubber, plastic, elasticity, durability and conduct mixed rubber manufacturing of tire products. (2) Pressing out (j = 2): The pressing out activity applies glue and friction to produce heat to cook the rubber. (3) Cutting off (j = 3): In the cutting-off activity, the product is sent to the cutting machine to cut the tire size and add other different elements using the cutting machine. (4) Forming (j = 4): It is then sent to the molding assembly to carry out the forming activity, with all the materials, strips and steel rings, a prototype of the tire will be formed. (5) Vulcanizing (j = 5): The fifth activity is to carry out the vulcanizing activity, which is to rearrange the rubber molecules; the heating and molding works will be carried out by means of steam. (6) Inspecting (j = 6): The next inspecting activity is carried out and the finished goods are transported to the warehouse. The tire manufacturing flow chart is shown in Figure 2. In this model, assume that (1) these six activities are unit-level activities which use the resources of direct material, direct labor and machine hour, (2) there is only one batch-level activity considered in the model, that is, material handling and (3) it does not consider the product-level and facility-level activities since their costs are included in the other fixed cost.
3.2. Assumptions
In the production planning model proposed in this paper, there are the following assumptions:
- The unit price of products remains unchanged within the relevant range of planning.
- The unit direct material costs are constant within the relevant range of planning.
- By working overtime with higher wage rates, direct labor resources can be expanded.
- The activities required for the tire production process and their activity drivers and the resources required for each activity and their resource drivers has been determined through ABC analyses.
- There are hundreds of materials for producing tires. This paper assumes that the five materials (natural rubber, soot, synthetic rubber, cord and bead) with the highest proportion in the manufacturing process are used as the direct material inputs. Other materials are not included in the research of this mathematical programming model.
- Carbon tax cost is considered as a variable cost, which is dependent on the quantity of carbon emissions and different carbon tax rates are used for different carbon tax ranges. Assume that all kinds of emissions have been calculated to the carbon equivalent.
- The data assumed in this study are in metric tons for carbon emission and U.S. dollars for amounts, as shown in Table 1.
3.3. Green Production Planning Model
3.3.1. Notations
The following notations for variables and parameters were used in this paper:
Variables:
| the production quantity of product i for Company T; | |
| , | a set of 0–1 variables of SOS1 (special ordered set of type 1), where only one variable will be non-zero [76,77]; |
| , , | a set of 0–1 variables of SOS1 (special ordered set of type 1), where only one variable will be non-zero [76,77]; |
| , , , | a set of non-negative variables of SOS2 (special ordered set of type 2), where at most two adjacent variables may be non-zero in the order of a given set [76,77]; |
| , , | a set of non-negative variables of SOS2 (special ordered set of type 2), where at most two adjacent variables may be non-zero in the order of a given set [76,77]; |
| the number of batches for material handling of product i; |
Parameters:
| the unit sales price of product i; | |
| the unit cost of the material k; | |
| the requirements of material k for producing a unit of product i; | |
| the quantity of material k available for use; | |
| the normal direct labor hours available; | |
| the maximal working hours at the first overtime rate plus the normal direct labor hours available; | |
| the maximal working hours at the first and second overtime rate plus the normal direct labor hours available; | |
| total direct labor costs at the normal direct labor hours available (); | |
| total direct labor costs at the maximal working hours at the first overtime rate plus the normal direct labor hours available (); | |
| total direct labor costs at the maximal working hours at the first and second overtime rate plus the normal direct labor hours available (); | |
| the actual operating activity costs for each activity driver in activity j; | |
| the number of machine hours required to produce one unit of product i in activity j = 1~6; | |
| the number of machine hours required to transport one batch of product i in activity j = 7; | |
| the quantity of product i for a batch in activity j; | |
| the requirement of direct labor hours for one unit of product i; | |
| TDL | total direct labor hours used from Equation (3); |
| the number of machine hours available for activity j; | |
| CEC1 | the total carbon tax cost at the upper limit of total carbon emission quantity of the first carbon tax range (CE1); |
| CEC2 | the total carbon tax cost at the upper limit of total carbon emission quantity of the first carbon tax range (CE2); |
| CEC3 | the total carbon tax cost at the upper limit of total carbon emission quantity of the third carbon tax range (CE3); |
| the total quantity of carbon emission from Equation (15); | |
| CE1 | the upper limit of total carbon emission quantity of the first carbon tax range; |
| CE2 | the upper limit of total carbon emission quantity of the second carbon tax range; |
| CE3 | the upper limit of total carbon emission quantity of the third carbon tax range; |
| the cost of material handling for one batch of product i; | |
| the quantity of carbon emission for producing one unit of product i. |
3.3.2. The Objective Function
The objective function of the green production planning model under ABC and Industry 4.0 is to maximize profit (π), as follows:
The profit function in the model is shown in Equation (1). , the first term of Equation (1) is total revenue. , the second term of Equation (1), is total direct material cost. Direct labor cost is of Equation (1) in the third term. of Equation (1) in the fourth term is the material handling cost, where the activity of material handling is the batch-level activity. Carbon emission cost is of Equation (1) in the fifth term. Other fixed cost is of Equation (1) in the sixth term. Tire environmental regulatory costs, including the handling of regular inspections, the relevant costs and environmental standards value specifications, in accordance with local government laws and regulations, are fixed costs, thus, they can be expressed as a constant (USD $20,000 in the example data). Company T will make the green product-mix decision based on the current capacity.
3.3.3. Direct Material Quantity Constraints
Total direct material cost is , the second term of Equation (1) and the associated constraint is shown in Equation (2):
Direct material quantity constraints:
where, is the requirements of material k for producing a unit of product i and is the quantity of material k available for use.
3.3.4. Direct Labor Cost Function
Suppose that direct labor hours can be extended by overtime work at higher pay rates. The direct labor cost function is shown in Figure 3. The normal labor hours available is and it can be extended to and ; the total direct labor costs are , and at , and , respectively. The third term in Equation (1), that is, [] is the total direct labor cost. is the cost of non-discretional labor hours and is the cost of total overtime work at two different higher pay rates. The constraints associated with direct labor are shown in Equations (3)–(11):
Direct labor hour constraints:
The total direct labor constraint in Equation (3) is the TDL. and is a SOS1 set of 0–1 variables, where only one of these variables will be non-zero; , and is a SOS2 set of non-negative variables, where there may be up to two adjacent variables in the order given to the group, which are non-zero. If = 1, then = 0 from Equation (8), = 0 from Equation (6). , 1 from Equations (4) and (5) and + = 1 from Equation (7). Therefore, total direct labor hours and total labor costs are and , respectively. It means that the company works overtime at the first overtime rate. On the other hand, if = 1, then = 0 from Equation (8), = 0 from Equation (4), , ≤ 1 from Equations (5) and (6) and + = 1 from Equation (7). Thus, the total direct labor hours required is from Equations (3) and total labor cost is , respectively. It means there will be overtime work at the second overtime rate.
3.3.5. Machine Hour Constraints
In the tire manufacturing process, each activity has a different machine for operation. Due to the complexity of the tire manufacturing process, in this study, the mathematical programming model assumes that the related cost of a machine for an activity is included in the fixed costs, F, meaning the last term of Equation (1). Let aij be the number of machine hours required to produce one unit of product i in activity j = 1, 2, 3, 4, 5, 6; Therefore, the associated machine hour constraints are shown in Equation (12):
Machine hour constraints:
3.3.6. Batch-Level Activity Cost Function for Material Handling
In the tire manufacturing process, we must first obtain the relevant materials from the warehouse for mixing operations and the finished goods are moved to the warehouse. In this study, we assume the material from the warehouse is to be carried out at a specific number for a batch. Therefore, the total material handling cost is and the constraints associated with material handling are shown in Equations (13) and (14):
Material handing constraints:
where, is the quantity of product i for a batch in activity j; is the number of batches for material handling of product i; is the cost of material handling for one batch of product i; is the number of machine hours required to transport one batch of product i in activity j = 7. Note that the material required for each batch is transported in one time. Thus, Equation (13) is the constraint for the production quantity for product i and Equation (14) is the constraint for the resource hours of material handling. The total material handling cost is , the fourth term of Equation (1).
3.3.7. Carbon Tax Function
Wang et al. [78] showed that levying taxes can slightly increase the GDP. Energy taxes have impact on the cost of the energy industry due to rising energy costs. Shrinking production scale, capital and labor may require transfer to low-energy, low-emission industries. Energy taxes can reduce the concentration of air pollutants, thereby, improving air quality. In addition, the calculation of capital and operating expenses is based on a simulation of carbon emissions and economic performance under efficiency taxes, as based on the quality and energy balances obtained; the results show that all of the assessed environmental impact indicators are performing well [79]. Therefore, such economic, environmental and health improvement will have positive impact on the country’s energy tax. According to Tsai et al. [31], the new green manufacturing technology (GMT) can reduce carbon emissions and the cost of carbon emissions should be measured using the life cycle assessment (LCA) method. LCA is a method to compare the impact on the environment from the fluoroscopy of the entire life cycle of a technology, product, or service. Based on previous research, we consider all the environmental impacts of carbon emissions in the tire manufacturing process. According to the method of Ward and Chapman [80], Equation (15) is used to quantify carbon emissions. Since carbon emissions are also considered taxable at different rates, the total carbon tax cost function is a piecewise linear function, as shown in Figure 4. As carbon emissions increase, taxes will increase. Carbon emissions can be increased from CE1 to CE2 and CE3. Therefore, the total carbon tax costs are CEC1, CEC2 and CEC3 at the quantities of CE1, CE2 and CE3, respectively. Total carbon tax cost is the fifth term in Equation (1), as follows:
The total cost of carbon emission = CEC1 δ1 + CEC2 δ2 + CEC3 δ3
The constraints associated with carbon emissions are shown in Equations (15)–(21):
Carbon emission constraints:
Total carbon emission quantity is from Equation (15). In Equations (16)–(21), (, , ) is a SOS1 set of 0–1 variables, where only one of these variables will be non-zero from Equation (21). (, , , ) is a SOS2 set of non-negative variables, where there may be up to two adjacent variables in the order given to the group, which are non-zero. If = 1, then , = 0 from Equation (21); , = 0 from Equations (18) and (19); , ≤ 1 from Equations (16) and (17); and + = 1 from Equation (20). Thus, the total quantity of carbon emissions and the total carbon tax cost are () and (CEC1), from Equation (15) and Equation (1), respectively. It means that the quantity of carbon emission falls within the first range of carbon tax, that is, [0, . If = 1, then , = 0 from Equation (21); , = 0 from Equations (16) and (19); , ≤ 1 from Equations (17) and (18); and + = 1 from Equation (20). Thus, the total quantity of carbon emissions and the total carbon tax cost are ( + ) and (CEC1 + ), respectively. It means that the quantity of carbon emission falls within the second range of carbon tax, that is, [ If = 1, similarly, it means that the quantity of carbon emissions falls within the third range of carbon tax, that is, [].
4. Illustration
As an illustration, company T in the tire industry has been established in Taiwan for more than 50 years. There are 11 tire manufacturing companies in the world, with more than 24,000 worldwide employees and paid-in capital exceeding 30 billion yuan. The main products are various kinds of tires and rubber products. Company T is used to illustrate how to apply the green decision-making model proposed in this paper.
To implement air pollution control, tire companies have changed all heavy oil boilers to natural gas boilers; however, this equipment exhausts gas for production process combustion and cannot effectively reduce carbon emissions. As a result, carbon emissions have seriously affected air pollution and have to be controlled.
4.1. Example Data and Optimal Decision Analysis
Assume that the following costs for producing the products of Company T have been calculated: (1) direct material cost; (2) kneading activity cost; (3) squeeze out activity cost; (4) cut activity cost; (5) forming activity cost; (6) vulcanization activity cost; (7) inspection activity cost; (8) material handing activity cost; (9) carbon tax cost; (10) direct labor cost. Assume also that Company T has three main products: PCR (Passenger Car Radial) (i = 1), TBR (Truck & Bus Radial) (i = 2) and MC (Motorcycle) (i = 3) and that these products consume the same direct materials. In this illustration, the quantity of each product is in the thousands and the cost and input costs are in U.S. dollars. The data for this illustration are shown in Table 1. Total fixed cost is USD $20,000; the green product-mix decision model is presented according to Equations (1)–(21), as follows:
Subject to:
Direct material quantity constraints:
Direct labor hour constraints:
- 1 + 1.5 + 0.5 − 1760 − 2200 − 2640 = 0
Machine hour constraints:
- 5 + 10 + 1 ≤ 13,200,000
- 2 + 4 + 1 22,000,000
- 2 + 3 + 1 22,000,000
- 3 + 5 + 1 26,400,000
- 2 + 3 + 1 13,200,000
- 3 + 6 + 1 6,600,000
Material handing constraints:
- 5 ≤ 0
- 10 ≤ 0
- 1 ≤ 0
- 2 + 3 + 1 1,760,000
Carbon emission constraints:
- 0.2 + 0.1 + 0.1 − 700 − 850 − 950 = 0
We solved this mathematical programming model with LINGO 16.0 software and obtained the optimal solution with product-mix, resource consumption, carbon emission and tax and total profit as shown in Table 2.
According to Table 2, the optimal solution is (, , ) = (1,020,000, 60,000, 1,300,000), which requires 7,040,000 units (= 4 × 1,020,000 + 6 × 60,000 +2 × 1,300,000) of the first kind of material, 3,940,000 units (= 2 × 1,020,000 + 10 × 60,000 + 1 × 1,300,000) of the second kind of material, 8,600,000 units (= 5 × 1,020,000 + 15 × 60,000 + 2 × 1,300,000) of the third kind of material, 3,700,000 units (= 2 × 1,020,000 + 6 × 60,000 + 1 × 1,300,000) of the fourth kind of material, 4,240,000 units (= 2 × 1,020,000 + 15 × 60,000 + 1 × 1,300,000) of the fifth kind of material, 7,000,000 (= 5 × 1,020,000 + 10 × 60,000 + 1 × 1,300,000) of the first kind of machine hours, 3,580,000 (= 2 × 1,020,000 + 4 × 60,000 + 1 × 1,300,000) of the second kind of machine hours, 3,520,000 (= 2 × 1,020,000 + 3 × 60,000 + 1 × 1,300,000) of the third kind of machine hours, 4,660,000 (= 3 × 1,020,000 + 5 × 60,000 + 1 × 1,300,000) of the fourth kind of machine hours, 3,520,000 (= 2 × 1,020,000 + 3 × 60,000 + 1 × 1,300,000) of the fifth kind of machine hours, 4,720,000 (= 3 × 1,020,000 + 6 × 60,000 + 1 × 1,300,000) of the sixth kind of machine hours and 1,726,000 (= 2 × 204,000 + 3 × 6000 + 1 × 1,300,000) material handing machine hours. In addition, it will consume 1,760,000 direct labor hours (= 1 × 1,020,000 + 1.5 × 60,000 + 0.5 × 1,300,000); and the carbon emission quantity is 340,000 (= 0.2 × 1,020,000 + 0.1 × 60,000 + 0.1 × 1,300,000) tons, which is just within the first carbon tax range. The total profit π is USD $57,320,000.
Company T obtains the optimal solution through the above green ABC mathematical programming model. In the future, Company T will engage in green production and introduce the related technology of Industry 4.0 step-by-step. Then, its relevant ABC data can be acquired directly from the relevant departments (e.g., accounting, research and development, procurement and production departments) with direct access to materials, sales price and other related costs. Regarding carbon tax costs, information on carbon emission regulations and carbon costs can be obtained from government agencies and the company’s management. However, the TOC program used in this study provides the tire industry with the opportunity to identify and use the most restrictive new green manufacturing technologies in the future, which enables the tire industry to find the best combination of various products. While investing in new green manufacturing technologies can be prohibitively expensive, good environmental investments in the tire industry can maximize profits by adopting the TOC process.
4.2 Sensitivity Analysis
The green tire manufacturing ABC decision model of this study does not consider the significance of capacity expansion. The possibility or profit of expanding capacity must be evaluated by sensitivity analysis, which conducts successful assessment of the resources invested to expand capacity. Tire managers may end up with suboptimal solutions when the level of expansion of various tire resources is determined in the wrong way. In addition, with the ABC decision model for green tire manufacturing, it is difficult to simultaneously consider two or more capacity expansions. Suppose the tire company plans to maximize profits by conducting sensitivity analyses to change the costs of carbon emissions and material prices, in order to explore their effects on product-mix and profit. In this study, the above assumptions are applied to ABC mathematical programming model and sensitivity analysis is conducted. Tire material prices and carbon taxes increase and decrease by 10%, 20%, 30% and so forth (as shown in Table 3).
The finding show that the material price and carbon tax cost increased from 10% to 30%, while the total profit decline rate increased from 78% to 226%, indicating that, under these three circumstances, the original total profit of USD $57,320 of the tire industry will take place (as shown in Figure 5), thus, turning profit to loss and total profit declines. On the contrary, if the material price and carbon tax cost are reduced from 10% to 30%, the increase in total profit would increase from 78% to 235%, indicating that the tire industry would have a total original profit of USD $57,320 in these three cases; increase total profit and exceed 2.35 times the original total profit (as shown in Figure 6).
Sensitivity analysis of the above six conditions found that the change in the total profit of the tire industry was mainly due to the increase and decrease of the material price and the carbon tax cost. Therefore, the tire industry should strictly increase the total profit in the case of Control costs, in order to avoid any loss of profit.
5. Shop Floor Control under Industry 4.0 in the Tire Industry
Shop floor control (SFC) mainly comprises a collection of production process-related information [81], meaning it is a method to parameterize the real-time shop floor data for control [11], as collected by the Manufacture Execution System (MES); however, MES focuses on the control of field-related equipment. Due to the complicated manufacturing process of tires and the development of related control technologies, the cost of manufacturing equipment for tires is high. Compared with other traditional industries, the tire industry MES should integrate Enterprise Resource Planning (ERP), including measurement, analyzing and improving the consumption of resources for sustainable development in manufacturing, the standards for environmental performance assessment and optimization and real-time energy indicators for production systems to gather relevant data in a real-time manner [82]. SFC may include the following functions to control the production to achieve the production/sale and profit target under various constraints.
- (1)
- Status Monitoring: Analysis of huge data sets (Big Data) could allow quick and accurate decision-making. For example, productivity improvements can be achieved by analyzing device performance and degradation for real-time feedback on configuration and optimization. Herman et al. [2] proposed a cloud-based IoT application architecture that will improve the deployment of intelligent industrial systems for remote monitoring and scrolling. Additionally, this can generate huge amounts of data during operation time due to the potential presence of hundreds or even thousands of sensors, considered as Big Data [83]. While cloud computing employed in industrial environments can bring benefits, it also poses challenges for the storage of Big Data, which describes cloud computing as a cloud-manufacturing counterpart to industrial environments [84], with the focus on increasing agility in the industrial environment and enabling the supply chain to capture the largest data sets [16,85,86].
- (2)
- Work-in-process tracking: With the development of ERP, more and more manufacturing enterprises are interested in the integration of ERP and MES systems [87,88]. The MES system architecture is designed for short-term production support. Simulation testing can be used to support the decision-making process; the real-time dynamics of MES and WIP can be performed more accurately [89]; RFID and wireless information networks can capture real-time field data from manufacturing plants to monitor and reduce WIP inventory [90,91]. The correct use of materials according to the actual needs can reduce the investment in production material and the integration of ERP and MES can achieve the purpose of sharing resource and integrating the related information in management decision-making. MES uses RFID technology to improve the efficiency of data collection [92,93]. Another data collection approaches under Industry 4.0 were proposed such as the multi-mode data acquisition method [94] and the Sophos-MS’s practical solution design and development [95].
- (3)
- Throughput tracking: We can track the tire manufacturing process-related information; however, in order to understand whether the production quantity of tire manufacturing can be completed as scheduled, we can integrate ERP with the MES to truly track the progress of tire production; we can also immediately review the reasons for handling backward production and then find the possible solutions [96,97].
- (4)
- Capacity feedback: In the Industry 4.0 environment, the right application of big data management is one of the most important factors. The “Product Planning Software” concept and structure is a new process planning, operation sequencing and scheduling method, as presented by [97]. In order to track the utilization of capacity, sensors are added to each machine to track its utilization. By knowing the utilization of capacity, the tire manufacturing process can be controlled without increasing idle costs or inventory costs. In addition, bottleneck detection with the sensors systems and IoT in production can improve production efficiency and stability in order to increase capacity utilization [98,99]. This capacity utilization tracking can assist in the application of Theory of Constraints in the production planning stage.
- (5)
- Quality control: The MES and ERP systems collect information for production process control through automated equipment and the management software system mode of operation, tire quality is detected [100]. The production control system of smart manufacturing under Industry 4.0 should be able to real-timely respond to various production problems and to effectively coordinate different resources of different departments to solve the problems encountered [96]. Beyond this, Industry 4.0 can focus on predictive maintenance for machines before the production problems occur through the big data analyses of troubling sounds or images [101,102,103]. Besides, Rødseth et al. [104] developed an integrated planning (IPL) approach which simultaneously executed production and maintenance planning in production scheduling.
- (6)
- Real-time interconnection: Delima and Balaunzarán [105] claim that smart manufacturing under Industry 4.0 has four characteristics: (1) self-awareness of current state of the production process, (2) real-time predictive capabilities for possible production problems arise such as products’ bad quality and machine breakdown, (3) a high level of real-time automation of activities across the production process, (4) real-time interconnection. The characteristic of real-time interconnection is to connect all the system components of machines, equipment, persons, materials and products at the factory level through Cyber-Physical Systems (CPS) [106,107] and Industrial Internet of Things (IIoT) [108,109,110,111,112]. It also can connect with suppliers and customers at the external supply chain level [105,106]. Under these circumstances, companies can do the works from product development to after-sale services with more efficiency, lower cost, lower carbon emission and higher quality [113].
6. Discussion
In the mathematical programming model, this research considers the carbon tax cost in addition to the related costs of the tire industry. This model is used to get the optimal product-mix maximizing the profits of the tire company under various constraints at the stage of production planning. As the costs of the tire industry are mainly affected by the fluctuations of the raw materials and increasing of carbon tax, profits will be seriously affected; therefore, this study further tests sensitivity by using the proposed mathematical programming model. If the cost of materials and the cost of carbon taxes increase or decrease by 10% to 30%, the six situations are analyzed and tested. When material and carbon costs are increased by 10% to 30%, the results show that the total profit will be substantially reduced from USD $72,268,000 to USD $57,320,000 and the percentage of the total profit reduction will be up to negative 226%. Conversely, if the material and carbon costs are reduced by 10% to 30%, the results show that the total profit will increase substantially from USD $57,320,000 to USD $192,062,000 and the gross profit percentage will be increased up to 235%. The mathematical programming model of this study shows that the fluctuation of raw materials and the increased carbon tax are the factors affecting the maximum profit of the tire industry. As a result, the tire industry should carefully consider the costs of raw materials and carbon emissions to successfully obtain the appropriate profits.
One of the main features of Industry 4.0 is mass customization through integrating all components in the manufacturing system [113]. However, this feature is not suitable for the tire industry. Industry 4.0 can provide tire companies the following benefits: (1) improved efficiency and productivity through process automation, visualization and control (2) reduced costs through improved efficiency and productivity and efficient resource utilization, recycling and reuse, (3) increased and quick innovation through computer-aided design (CAD) or 3D design capabilities and reduced product launch time, (4) improved product quality through predictive maintenance and quality monitoring by using big data analysis, (5) improved sustainability through monitoring and control of carbon and other emissions, (6) increased customer satisfaction through better customer services of the rapid responsiveness and deep information availability and then (7) achieving higher revenues and profits [114,115].
This paper claims that the related technologies and techniques of Industry 4.0 can be used to efficiently control the production to achieve the targets of sales and profits set at the production planning stage and to attain the benefits mentioned above through status monitoring, work-in-process tracking, throughput tracking, capacity feedback, quality control with predictive maintenance and real-time interconnection across the value chain [116]. In addition, the activity cost calculation and activity improvement of Activity-Based Costing (ABC) will be easily achieved since all the components in the manufacturing systems can be connected and monitored under Industry 4.0. In the literature, seldom research explored the combination of the mathematical programming model and Industry 4.0 except the applications in the textile [117] and paper [118] industries, which have different production processes and activities.
7. Conclusions
This paper aims to propose a linkage of the mathematical programming model for production control and Industry 4.0 for production control. At the stage of production control, ABC is used to measure the costs of activities and TOC is used to identify the constraints of production or sales, which form the mathematical programming model for production planning. The outputs of production planning model will be the targets of business operation, including production/sale and profit targets. Industry 4.0 is used to control the production to attain the production/sale and profit targets by using three tiers of technologies including the automation technologies, the Manufacturing Execution Systems (MES) and the Enterprise Resource Planning Systems (ERP). Section 3 and Section 4 proposed a production planning model with ABC and TOC and presented an illustration for demonstrating the application of the model; Section 5 discusses the shop floor control techniques for production control with status monitoring, work-in-process tracking, throughput tracking, capacity feedback, quality control with predictive maintenance and real-time interconnection across the value chain in order to achieve the planning targets and various Industry 4.0 benefits. The main contribution of this paper is to provide a framework for production planning and control with carbon tax through mathematical programming model and Industry 4.0 related technologies.
At present, there are few studies in the literature combining the mathematical programming model and Industry 4.0 related technologies in production planning and control with carbon tax. The managerial implication of this framework is that it can provide a general approach to help companies execute production management in the way of more efficiency, less cost, lower carbon emission and higher quality across the value chain for the tire industry. Besides, this framework also can be applied to other industries.
However, there are some research limitations in this research which can derive the future research directions. First, the model assumes that the unit prices of products and the unit costs of direct materials are constant within the relevant range of planning. It may be extended to consider the relationship between the product prices and the market demands and to consider the purchase quantity discounts of materials within the relevant range of planning. Second, the model uses a continuous piecewise linear carbon tax function of three carbon tax ranges with the increasing carbon tax rates, called “Carbon tax function with extra progressive tax rates.” It can consider the discontinuous carbon tax function with full progressive tax rates which uses the increasing carbon tax rates for all carbon emission quantity at the different carbon tax ranges. It also can consider the free carbon tax quantity for the carbon tax function mentioned above. Third, the model only considers a batch-level activity, that is, material handling, in order to simplify the model. It can consider other batch-level activities such set-up and scheduling and consider the product-level activities such as product design and product advertising. Fourth, the framework in Figure 1 provides the periodic feedback and updated parameters to next period’s production planning. However, the next ideal approach is providing various decision models in the model base of Industry 4.0 for Cloud Computing and Big Data analysis in order for frequent adjustment to the situation at that time.
Author Contributions
W.-H.T. provided the research idea, the research purpose and designed the research; Y.-H.L. collected and analyzed the data and wrote the paper; W.-H.T. provided the research method, supervised, corrected and revised this paper. All authors have read and approved the final manuscript.
Funding
This research was funded by the Ministry of Science and Technology of Taiwan under Grant No. MOST106-2410-H-008-020-MY3.
Acknowledgments
The authors are extremely grateful to the sustainability journal editorial team and reviewers who provided valuable comments for improving the quality of this article. The authors also would like to thank the Ministry of Science and Technology of Taiwan for financial support of this research under Grant No. MOST106-2410-H-008-020-MY3.
Conflicts of Interest
The authors declare no conflict of interest.
References
- Lasi, H.; Fettke, P.; Kemper, H.G.; Feld, T.; Hoffmann, M. Industry 4.0. Bus. Inf. Syst. Eng. 2014, 6, 239–242. [Google Scholar] [CrossRef]
- Hermann, M.; Pentek, T.; Otto, B. Design principles for Industrie 4.0 scenarios: A literature review. In Proceedings of the 2016 49th Hawaii International Conference on System Sciences, Koloa, HI, USA, 5–8 January 2016; pp. 3928–3939. [Google Scholar]
- Schaltegger, S.; Synnestvedt, T. The link between ‘green’ and economic success: Environmental management as the crucial trigger between environmental and economic performance. J. Environ. Manag. 2002, 65, 339–346. [Google Scholar]
- Menoni, M.; Morgavi, H. Is eco-efficiency enough for sustainability? Int. J. Perform. Eng. 2014, 10, 337–346. [Google Scholar]
- Yahya-Zadeh, M. Product-mix decisions under activity-based costing with resource constraints and non-proportional activity costs. J. Appl. Bus. Res. 1998, 14, 39–46. [Google Scholar] [CrossRef]
- Lockhart, J.; Taylor, A. Environmental Considerations in Product Mix Decisions Using ABC and TOC. Manag. Account. Q. 2007, 9, 13–31. [Google Scholar]
- Onwubolu, G.C.; Mutingi, M. Optimizing the multiple constrained resources product mix problem using genetic algorithms. Int. J. Prod. Res. 2001, 39, 1897–1910. [Google Scholar] [CrossRef]
- Kletti, J. Manufacturing Execution System—MES; Springer: Berlin, Germany, 2007. [Google Scholar]
- De Ugarte, B.S.; Artiba, A.; Pellerin, R. Manufacturing execution system—A literature review. Prod. Plan. Control 2009, 20, 525–539. [Google Scholar] [CrossRef]
- Almada-Lobo, F. The Industry 4.0 revolution and the future of manufacturing execution systems (MES). J. Innov. Manag. 2016, 3, 16–21. [Google Scholar]
- Timo, I.F.; Mónica, R.L.; Christian, B.; Friedrich, M.; Bernd, K.; Urlich, B.; Waldemar, S. Agent-based communication to map and exchange shop floor data between MES and material flow simulation based on the open standard CMSD. IFAC-PapersOnLine 2016, 49, 1526–1531. [Google Scholar] [CrossRef]
- Liu, W.; Chua, T.J.; Larn, J.; Wang, F.-Y.; Yin, X. APS, ERP and MES systems integration for semiconductor backend assembly. In Proceedings of the 7th International Conference on Control, Automation, Robotics and Vision, Singapore, 2–5 December 2002; pp. 1403–1408. [Google Scholar]
- Lee, J.; Kao, H.-A.; Yang, S. Service innovation and smart analytics for industry 4.0 and big data environment. Procedia CIRP 2014, 16, 3–8. [Google Scholar] [CrossRef]
- Wang, S.; Wan, J.; Zhang, D.; Li, D.; Zhang, C. Towards smart factory for industry 4.0: A self-organized multi-agent system with big data based feedback and coordination. Comput. Netw. 2016, 101, 158–168. [Google Scholar] [CrossRef]
- Krzysztof, W. Internet of Things, Big Data, Industry 4.0—Innovative Solutions in Logistics and Supply Chains Management. Procedia Eng. 2017, 182, 763–769. [Google Scholar]
- Xu, X. From cloud computing to cloud manufacturing. Robot. Comput.-Integr. Manuf. 2012, 28, 75–86. [Google Scholar] [CrossRef]
- Bechtsis, D.; Tsolakis, N.; Vouzas, M.; Vlachos, D. Industry 4.0: Sustainable material handling processes in industrial environments. Comput. Aided Chem. Eng. 2017, 40, 2281–2286. [Google Scholar]
- Wan, J.; Tang, S.; Hua, Q.; Li, D.; Liu, C.; Lloret, J. Context-aware cloud robotics for material handling in cognitive industrial internet of things. IEEE Internet Things J. 2018, 5, 2272–2281. [Google Scholar] [CrossRef]
- .Jazdi, N. Cyber physical systems in the context of Industry 4.0. In Proceedings of the 2014 IEEE International Conference on Automation, Quality and Testing, Robotics, Cluj-Napoca, Romania, 22–24 May 2014; pp. 1–4. [Google Scholar]
- Lee, J.; Bagheri, B.; Kao, H.-A. A cyber-physical systems architecture for industry 4.0-based manufacturing systems. Manuf. Lett. 2015, 3, 18–23. [Google Scholar] [CrossRef]
- Wan, J.; Tang, S.; Shu, Z.; Li, D.; Wang, S.; Imran, M.; Vasilakos, A.V. Software-Defined Industrial Internet of Things in the Context of Industry 4.0. IEEE Sens. J. 2016, 16, 7373–7380. [Google Scholar] [CrossRef]
- Dujin, A.; Blanchet, M.; Rinn, T.; Von Thaden, G.; De Thieullo, G. Industry 4.0—The New Industrial Revolution: How Europe Will Succeed; Roland Berger Strategy Consultants: Munich, Germany, 2014. [Google Scholar]
- Kiel, D.; Müller, J.M.; Arnold, C.; Voigt, K.I. Sustainable Industrial Value Creation: Benefits and Challenges of Industry 4.0. Int. J. Innov. Manag. 2017, 21. [Google Scholar] [CrossRef]
- Müller, J.M.; Kiel, D.; Voigt, K.I. What Drives the Implementation of Industry 4.0? The Role of Opportunities and Challenges in the Context of Sustainability. Sustainability 2018, 10, 247. [Google Scholar] [CrossRef]
- Stock, T.; Seliger, G. Opportunities of sustainable manufacturing in industry 4.0. Procedia CIRP 2016, 40, 536–541. [Google Scholar] [CrossRef]
- Biljana, L.R.S.; Kire, V.T. A review of Internet of Things for smart home: Challenges and solutions. J. Clean. Prod. 2017, 140, 1454–1464. [Google Scholar]
- Berawi, M.A. Utilizing big data in industry 4.0: Managing competitive advantages and business ethics. Int. J. Technol. 2018, 9, 430–433. [Google Scholar] [CrossRef]
- Hendrik, U.; FrankBörner, E. Context Related Information Provision in Industry 4.0 Environments. Procedia Manuf. 2017, 11, 796–805. [Google Scholar]
- Kong, G.; White, R. Toward cleaner production of hot dip galvanizing industry in China. J. Clean. Prod. 2010, 18, 1092–1099. [Google Scholar] [CrossRef]
- Puurunen, K.; Vasara, P. Opportunities for utillising nanotechnology in reaching near-zero emissions in the paper industry. J. Clean. Prod. 2007, 15, 1287–1294. [Google Scholar] [CrossRef]
- Tsai, W.H.; Chen, H.C.; Liu, J.Y.; Chen, S.P.; Shen, Y.S. Using activity-based costing to evaluate capital investments for green manufacturing technologies. Int. J. Prod. Res. 2011, 49, 7275–7292. [Google Scholar] [CrossRef]
- European Environment Agency. Environmental Taxes, Implementation and Environmental Effectiveness; European Environment Agency: Copenhagen, Denmark, 1996. [Google Scholar]
- Lin, B.; Li, X. The effect of carbon tax on per capita CO2 emission. Energy Policy 2011, 39, 5137–5146. [Google Scholar] [CrossRef]
- Kunsch, P.; Springael, J. Simulation with system dynamics and fuzzy reasoning of a tax policy to reduce CO2 emission in the residential sector. Eur. J. Oper. Res. 2008, 185, 1285–1299. [Google Scholar] [CrossRef]
- Liao, Y.; Deschamps, F.; Loures, E.D.F.R.; Ramos, L.F.P. Past, present and future of Industry 4.0-a systematic literature review and research agenda proposal. Int. J. Prod. Res. 2017, 55, 3609–3629. [Google Scholar] [CrossRef]
- Conegrey, T.; Gerald, J.D.F.; Valeri, L.M.; Tol, R.S.J. The impact of a carbon tax on economic growth and carbon dioxide emission in Ireland. J. Environ. Plan. Manag. 2013, 56, 934–952. [Google Scholar] [CrossRef]
- Gianluca, D.; Joel, S.B.; Paolo, C. A Novel Methodology to Integrate Manufacturing Execution Systems with the Lean Manufacturing Approach. Procedia Manuf. 2017, 11, 2243–2251. [Google Scholar]
- Beier, G.; Niehoff, S.; Ziems, T.; Xue, B. Sustainability aspects of a digitalized industry—A comparative study from China and Germany. Int. J. Precis. Eng. Manuf.-Green Technol. 2017, 4, 227–234. [Google Scholar] [CrossRef]
- Giti Tire. The Tire Production Process is a Very Meticulous and Complex. Available online: http://www.corp.giti.com/images/newsdetailattach_20128194115667.pdf (accessed on 18 August 2018).
- Maribel, Y.S.; Jorge, O.E.S.; Carina, A.; Francisca, V.L.; Eduarda, C.; Carlos, C.; Bruno, M.; João, G. A Big Data system supporting Bosch Braga Industry 4.0 strategy. Int. J. Inf. Manag. 2017, 37, 750–760. [Google Scholar]
- Dekker, R.; Bloembof, J.; Mallidis, I. Operations research for greenlogistics—An overview of aspects, issues, contributions and challenges. Eur. J. Oper. Res. 2012, 219, 671–679. [Google Scholar] [CrossRef]
- Liu, C.; Jiang, P. A Cyber-physical System Architecture in Shop Floor for Intelligent Manufacturing. Procedia CIRP 2016, 56, 372–377. [Google Scholar] [CrossRef]
- Kamble, S.S.; Gunasekaran, A.; Gawankar, S.A. Sustainable industry 4.0 framework: A systematic literature review identifying the current trends and future perspectives. Process Saf. Environ. Prot. 2018, 117, 408–425. [Google Scholar] [CrossRef]
- Basiago, A.D. Economic, social and environmental sustainability in development theory and urban planning practice. Environmentalist 1999, 19, 145–161. [Google Scholar] [CrossRef]
- Stock, T.; Obenaus, M.; Kunz, S.; Kohl, H. Industry 4.0 as enabler for a sustainable development: A qualitative assessment of its ecological and social potential. Process Saf. Environ. Prot. 2018, 118, 254–267. [Google Scholar] [CrossRef]
- Carvalho, N.; Chaim, O.; Cazarini, E.; Gerolamo, M. Manufacturing in the fourth industrial revolution: A positive prospect in sustainable manufacturing. Procedia Manuf. 2018, 21, 671–678. [Google Scholar] [CrossRef]
- Blunck, E.; Werthmann, H. Industry 4.0—An opportunity to realize sustainable manufacturing and its potential for a circular economy. In Proceedings of the DIEM: Dubrovnik International Economic Meeting, Dubrovnik, Croatia, 12–14 October 2017; Available online: https://hrcak.srce.hr/187419 (accessed on 23 August 2018).
- De Man, J.C.; Strandhagen, J.O. An Industry 4.0 research agenda for sustainable business models. Procedia CIRP 2017, 63, 721–726. [Google Scholar] [CrossRef]
- De Sousa Jabbour, A.B.L.; Jabbour, C.J.C.; Foropon, C.; Filho, M.G. When titans meet—Can industry 4.0 revolutionise the environmentally-sustainable manufacturing wave? the role of critical success factors. Technol. Forecast. Soc. Chang. 2018, 132, 18–25. [Google Scholar] [CrossRef]
- Waibel, M.W.; Steenkamp, L.P.; Moloko, N.; Oosthuizen, G.A. Investigating the effects of Smart Production Systems on sustainability elements. Procedia Manuf. 2017, 8, 731–737. [Google Scholar] [CrossRef]
- Ding, B. Pharma industry 4.0: Literature review and research opportunities in sustainable pharmaceutical supply chains. Process Saf. Environ. Prot. 2018, 119, 115–130. [Google Scholar] [CrossRef]
- Luthra, S.; Mangla, S.K. Evaluating challenges to industry 4.0 initiatives for supply chain sustainability in emerging economies. Process Saf. Environ. Prot. 2018, 117, 168–179. [Google Scholar] [CrossRef]
- Plenert, G. Optimizing theory of constraints when multiple constrained resources exist. Eur. J. Oper. Res. 1993, 70, 126–133. [Google Scholar] [CrossRef]
- Tsai, W.H.; Kuo, L. Operating Costs and Capacity in the Airline Industry. J. Air Transp. Manag. 2004, 10, 269–275. [Google Scholar] [CrossRef]
- Tsai, W.H. Quality cost measurement under activity-based costing. Int. J. Q. Reliab. Manag. 1998, 15, 719–752. [Google Scholar] [CrossRef]
- Tsai, W.H.; Lai, C.W.; Tseng, L.J.; Chou, W.C. Embedding Management Discretionary Power into An ABC Model for A Joint Products Mix Decision. Int. J. Prod. Econ. 2008, 115, 210–220. [Google Scholar] [CrossRef]
- Tsai, W.H.; Kuo, L.; Lin, T.W.; Kuo, Y.C.; Shen, Y.S. Price elasticity of demand and capacity expansion features in an enhanced ABC product-mix Decision Model. Int. J. Prod. Res. 2010, 48, 6387–6416. [Google Scholar] [CrossRef]
- Tsai, W.H.; Lin, W.R.; Fan, Y.W.; Lee, P.L.; Lin, S.J.; Hsu, J.L. Applying A Mathematical Programming Approach for A Green Product Mix Decision. Int. J. Prod. Res. 2012, 50, 1171–1184. [Google Scholar] [CrossRef]
- Tsai, W.H.; Lin, S.J.; Liu, J.Y.; Lin, W.R.; Lee, K.C. Incorporating life cycle assessments into building project decision-making: An energy consumption and CO2 emission perspective. Energy 2011, 36, 3022–3029. [Google Scholar] [CrossRef]
- Tsai, W.H.; Shen, Y.S.; Lee, P.L.; Chen, H.C.; Kuo, L.; Huang, C.C. Integrating information about the cost of carbon through activity-based costing. J. Clean. Prod. 2012, 36, 102–111. [Google Scholar] [CrossRef]
- Tsai, W.H.; Lin, S.J.; Lee, Y.F.; Chang, Y.C.; Hsu, J.L. Construction method selection for green building projects to improve environmental sustainability by using an MCDM approach. J. Environ. Plan. Manag. 2013, 56, 1487–1510. [Google Scholar] [CrossRef]
- Tsai, W.H.; Yang, C.H.; Huang, C.T.; Wu, Y.Y. The Impact of the Carbon Tax Policy on Green Building Strategy. J. Environ. Plan. Manag. 2017, 60, 1412–1438. [Google Scholar] [CrossRef]
- Tsai, W.H.; Hung, S.J. A fuzzy goal programming approach for green supply chain optimisation under activity-based costing and performance evaluation with a value-chain structure. Int. J. Prod. Res. 2009, 47, 4991–5017. [Google Scholar] [CrossRef]
- Tsai, W.H.; Hung, S.J. Treatment and recycling system optimisation with activity based costing in WEEE reverse logistics management: An environmental supply chain perspective. Int. J. Prod. Res. 2009, 47, 5391–5420. [Google Scholar] [CrossRef]
- Tsai, W.H.; Lai, C.W. Outsourcing or capacity expansions: Application of activity based costing model on joint product decisions. Comput. Oper. Res. 2007, 34, 3666–3681. [Google Scholar] [CrossRef]
- Tsai, W.H.; Lee, K.C.; Lin, H.L.; Liu, J.Y.; Chou, Y.W.; Lin, S.J. A mixed activity based costing decision model for green airline fleet planning under the constraints of the European Union Emissions Trading Scheme. Energy 2012, 39, 218–226. [Google Scholar] [CrossRef]
- Kaplan, R.S. Management accounting for advanced technological environments. Science 1989, 245, 819–823. [Google Scholar] [CrossRef] [PubMed]
- Patterson, M.C. The product-mix decision: A comparison of theory of constraints and labor-based management accounting. Prod. Invent. Manag. J. 1992, 33, 80–85. [Google Scholar]
- Kaplan, R.S.; Cooper, R. Cost & Effect: Using Integrated Cost Systems to Drive Profitability and Performance; Harvard Business School Press: Boston, MA, USA, 1998. [Google Scholar]
- Srinivassan, A.; Carey, M.; Morton, T. Resource Pricing and Aggregate Scheduling in Manufacturing Systems; Graduate School of Industrial Administration, Carnegie-Mellon University: Pittsburgh, PA, USA, 1988. [Google Scholar]
- Karmarkar, U. Capacity loading and release planning with work-in-process and lead times. J. Manuf. Oper. Manag. 1989, 2, 105–123. [Google Scholar]
- Chu, S.C.K. Optimal master production scheduling in a flexible manufacturing system: The case of total aggregation. In Proceedings of the First Conference on the Operational Research Society of Hong Kong, Hong Kong, China, 21–22 June 1991; pp. 103–108. [Google Scholar]
- Asmundsson, J.; Rardin, R.; Turkseven, C.; Uzsoy, R. Production Planning with Resources Subject to Congestion. Nav. Res. Logist. 2009, 56, 142–157. [Google Scholar] [CrossRef]
- Kefeli, A.; Uzsoy, R.; Fathi, Y.; Kay, M. Using a mathematical programming model to examine the marginal price of capacity resources. Int. J. Prod. Econ. 2011, 131, 383–391. [Google Scholar] [CrossRef]
- Kacar, N.B.; Uzsoy, R. Estimating clearing functions for production resources using simulation optimization. IEEE Trans. Autom. Sci. Eng. 2015, 12, 539–552. [Google Scholar] [CrossRef]
- Beale, E.M.L.; Tomlin, J.A. Special facilities in a general mathematical programming system for non-convex problems using ordered sets of variables. Oper. Res. 1969, 69, 447–454. [Google Scholar]
- Williams, H.P. Model Building in Mathematical Programming, 2nd ed.; Wiley: New York, NY, USA, 1985; pp. 173–177. [Google Scholar]
- Wang, B.; Liu, B.; Niu, H.; Liu, J.; Yao, S. Impact of energy taxation on economy, environmental and public health quality. J. Environ. Manag. 2017, 206, 85–92. [Google Scholar] [CrossRef] [PubMed]
- Igor, L.W.; George, V.B.; Jose, L.D.M.; Ofelia, D.Q.F.A. Carbon dioxide utilization in a microalga-based biorefinery: Efficiency of carbon removal and economic performance under carbon taxation. J. Environ. Manag. 2017, 203, 988–998. [Google Scholar]
- Ward, S.C.; Chapman, C.B. Risk-management perspective on the project lifecycle. Int. J. Proj. Manag. 1995, 13, 145–149. [Google Scholar] [CrossRef]
- Zhong, R.Y. Analysis of RFID datasets for smart manufacturing shop floors. In Proceedings of the 15th IEEE International Conference on Networking, Sensing and Control, ICNSC 2018, Zhuhai, China, 27–29 March 2018. [Google Scholar]
- Gontarz, A.; Hampl, D.; Weiss, L.; Wegener, K. Resource Consumption Monitoring in Manufacturing Environments. CIRP Ann.-Manuf. Technol. 2015, 26, 264–269. [Google Scholar] [CrossRef]
- Manyika, J.; Chui, M.; Brown, B.; Bughin, J.; Dobbs, R.; Roxburgh, C.; Byers, A.H. Big Data: The Next Frontier for Innovation, Competition and Productivity. McKinsey Global Institute Report. 2011. Available online: https://www.mckinsey.com/business-functions/digital-mckinsey/our-insights/big-data-the-next-frontier-for-innovation (accessed on 18 August 2018).
- Zhong, R.Y.; Wang, L.; Xu, X. An IoT-enabled real-time machine status monitoring approach for cloud manufacturing. Procedia CIRP 2017, 63, 709–714. [Google Scholar] [CrossRef]
- Da Silva, P.R.S.; Amaral, F.G. An integrated methodology for environmental impacts and costs evaluation in industrial processes. J. Clean. Prod. 2009, 17, 1339–1350. [Google Scholar] [CrossRef]
- Jestratjew, A.; Kwiecień, A. Using Cloud Storage in Production Monitoring Systems. In Communications in Computer and Information Science; Kwiecień, A., Gaj, P., Stera, P., Eds.; CN 2010: Computer Networks; Springer: Berlin/Heidelberg, Germany, 2010; pp. 226–235. [Google Scholar]
- Ahmed, E.; Moutaz, H. The Future of ERP Systems: Look backward before moving forward. Procedia Technol. 2012, 5, 21–30. [Google Scholar]
- Telukdarie, A. MES to ERP integration: Rapid deployment toolset. In Proceedings of the IEEE International Conference on Industrial Engineering and Engineering Management, Bali, Indonesia, 4–7 December 2016; pp. 1030–1035. [Google Scholar]
- Rafal, C.; Adam, Z.; Lukasz, H.; Huseyin, E. Agent-based manufacturing execution systems for short-series production scheduling. Comput. Ind. 2016, 82, 245–258. [Google Scholar]
- Zhong, R.Y.; Dai, Q.Y.; Qu, T.; Hu, G.J.; Huang, G.Q. RFID-enabled real-time manufacturing execution system for mass-customization production. Robot. Comput.-Integr. Manuf. 2013, 29, 283–292. [Google Scholar] [CrossRef]
- Huang, G.Q.; Zhang, Y.F.; Jiang, P.Y. RFID-based wireless manufacturing for walking-worker assembly islands with fixed-position layouts. Robot. Comput.-Integr. Manuf. 2007, 23, 469–477. [Google Scholar] [CrossRef]
- Zhixin, Y.; Pengbo, Z.; Lei, C. RFID-enabled indoor positioning method for a real-time manufacturing execution system using OS-ELM. Neurocomputing 2016, 174, 121–133. [Google Scholar]
- Wang, C.; Jiang, P.; Lu, T. Production events graphical deduction model enabled real-time production control system for smart job shop. Proc. Inst. Mech. Eng. Part C 2018, 232, 2803–2820. [Google Scholar] [CrossRef]
- Uhlemann, T.H.J.; Lehmann, C.; Steinhilper, R. The Digital Twin: Realizing the Cyber-Physical Production System for Industry 4.0. Procedia CIRP 2017, 61, 335–340. [Google Scholar] [CrossRef]
- Longo, F.; Nicoletti, L.; Padovano, A. Smart operators in industry 4.0: A human-centered approach to enhance operators’ capabilities and competencies within the new smart factory context. Comput. Ind. Eng. 2017, 113, 144–159. [Google Scholar] [CrossRef]
- Bauza, M.B.; Tenboer, J.; Li, M.; Lisovich, A.; Zhou, J.; Pratt, D.; Ewards, J.; Zhang, H.; Turch, C.; Knebel, R. Realization of industry 4.0 with high speed CT in high volume production. CIRP J. Manuf. Sci. Technol. 2018, 22, 121–125. [Google Scholar] [CrossRef]
- Trstenjak, M.; Cosic, P. Process Planning in Industry 4.0 Environment. Procedia Manuf. 2017, 11, 1744–1750. [Google Scholar] [CrossRef]
- Roser, C.; Lorentzen, K.; Deuse, J. Reliable shop floor Bottleneck detection for flow lines through process and inventory observations. Procedia CIRP 2014, 19, 63–68. [Google Scholar] [CrossRef]
- Jia, Z.; Zhang, L.; Arinez, J.; Xiao, G. Performance analysis for serial production lines with Bernoulli Machines and Real-time WIP-based Machine switch-on/off control. Int. J. Prod. Res. 2016, 54, 6285–6301. [Google Scholar] [CrossRef]
- Teittinen, H.; Pellinen, J.; Järvenpää, M. ERP in action—Challenges and benefits for management control in SME context. Int. J. Account. Inf. Syst. 2013, 14, 278–296. [Google Scholar] [CrossRef]
- Peres, R.S.; Dionisio Rocha, A.; Leitao, P.; Barata, J. IDARTS—Towards intelligent data analysis and real-time supervision for industry 4.0. Comput. Ind. 2018, 101, 138–146. [Google Scholar] [CrossRef]
- Yan, J.; Meng, Y.; Lu, L.; Li, L. Industrial big data in an Industry 4.0 environment: Challenges, schemes and applications for predictive maintenance. IEEE Access 2017, 5, 23484–23491. [Google Scholar] [CrossRef]
- Kiangala, K.S.; Wang, Z. Initiating predictive maintenance for a conveyor motor in a bottling plant using industry 4.0 concepts. Int. J. Adv. Manuf. Technol. 2018, 97, 3251–3271. [Google Scholar] [CrossRef]
- Rødseth, H.; Schjølberg, P.; Wabner, M.; Frieß, U. Predictive Maintenance for Synchronizing Maintenance Planning with Production. Lect. Notes Electr. Eng. 2018, 451, 439–446. [Google Scholar]
- Delima, A.; Balaunzarán, M. Industry 4.0: The Fourth Industrial Revolution. 10 April 2018. Available online: http://insights.neoris.com/blogneoris/industry-4.0 (accessed on 20 August 2018).
- Sokolov, B.; Ivanov, D. Integrated scheduling of material flows and information services in industry 4.0 supply networks. IFAC-PapersOnLine 2015, 28, 1533–1538. [Google Scholar] [CrossRef]
- Bagheri, B.; Yang, S.; Kao, H.-A.; Lee, J. Cyber-physical systems architecture for self-aware machines in industry 4.0 environment. IFAC-PapersOnLine 2015, 28, 1622–1627. [Google Scholar] [CrossRef]
- Faul, A.; Jazdi, N.; Weyrich, M. Approach to interconnect existing industrial automation systems with the industrial internet. In Proceedings of the 2016 IEEE 21st International Conference on Emerging Technologies and Factory Automation (ETFA), Berlin, Germany, 6–9 September 2016. [Google Scholar]
- Jun, C.; Lee, J.Y.; Yoon, J.-S.; Kim, B.H. Applications’ integration and operation platform to support smart manufacturing by small and medium-sized enterprises. Procedia Manuf. 2017, 11, 1950–1957. [Google Scholar] [CrossRef]
- Åkerman, M.; Fast-Berglund, Å.; Halvordsson, E.; Stahre, J. Modularized assembly system: A digital innovation hub for the Swedish smart industry. Manuf. Lett. 2018, 15, 143–146. [Google Scholar] [CrossRef]
- Weber, K.M.; Gudowsky, N.; Aichholzer, G. Foresight and Technology Assessment for the Austrian Parliament—Finding New Ways of Debating the Future of Industry 4.0. Futures 2018. Available online: https://www.terkko.helsinki.fi/article/19090791_foresight-and-technology-assessment-for-the-austrian-parliament-finding-new-ways-of-debating-the-future-of-industry-40 (accessed on 20 August 2018). [CrossRef]
- Gravina, R.; Palau, C.E.; Manso, M.; Liotta, A.; Fortino, G. Integration, Interconnection and Interoperability of IoT Systems; Springer: Berlin, Germany, 2018. [Google Scholar]
- Mourtzis, D.; Fotia, S.; Boli, N.; Pittaro, P. Product-service system (PSS) complexity metrics within mass customization and Industry 4.0 environment. Int. J. Adv. Manuf. Technol. 2018, 97, 91–103. [Google Scholar] [CrossRef]
- Dalenogarea, L.S.; Beniteza, G.B.; Ayalab, N.F.; Frank, A.G. The expected contribution of Industry 4.0 technologies for industrial performance. Int. J. Prod. Econ. 2018, 204, 383–394. [Google Scholar] [CrossRef]
- Almada-Lobo, F. Six Benefits of Industrie 4.0 for Businesses. Control Engineering. 25 May 2017. Available online: https://www.controleng.com/single-article/six-benefits-of-industrie-40-for-businesses/5c57cc3925c0ff323553da64108d5c0c (accessed on 4 September 2018).
- Moktadir, M.A.; Ali, S.M.; Kusi-Sarpong, S.; Shaikh, M.A.A. Assessing challenges for implementing Industry 4.0: Implications for process safety and environmental protection. Process Saf. Environ. Prot. 2018, 117, 730–741. [Google Scholar] [CrossRef]
- Tsai, W.-H. Green production planning and control for the textile industry by using mathematical programming and Industry 4.0 techniques. Energies 2018, 11, 2072. [Google Scholar] [CrossRef]
- Tsai, W.-H.; Lai, S.-Y. Green Production Planning and Control Model with ABC under Industry 4.0 for the Paper Industry. Sustainability 2018, 10, 2932. [Google Scholar] [CrossRef]
Figure 1.
Framework of this Research—The Linkage of Mathematical Programming Model and Industry 4.0.
Figure 1.
Framework of this Research—The Linkage of Mathematical Programming Model and Industry 4.0.

Figure 2.
Tire manufacturing flow chart.

Figure 3.
Direct labor cost.
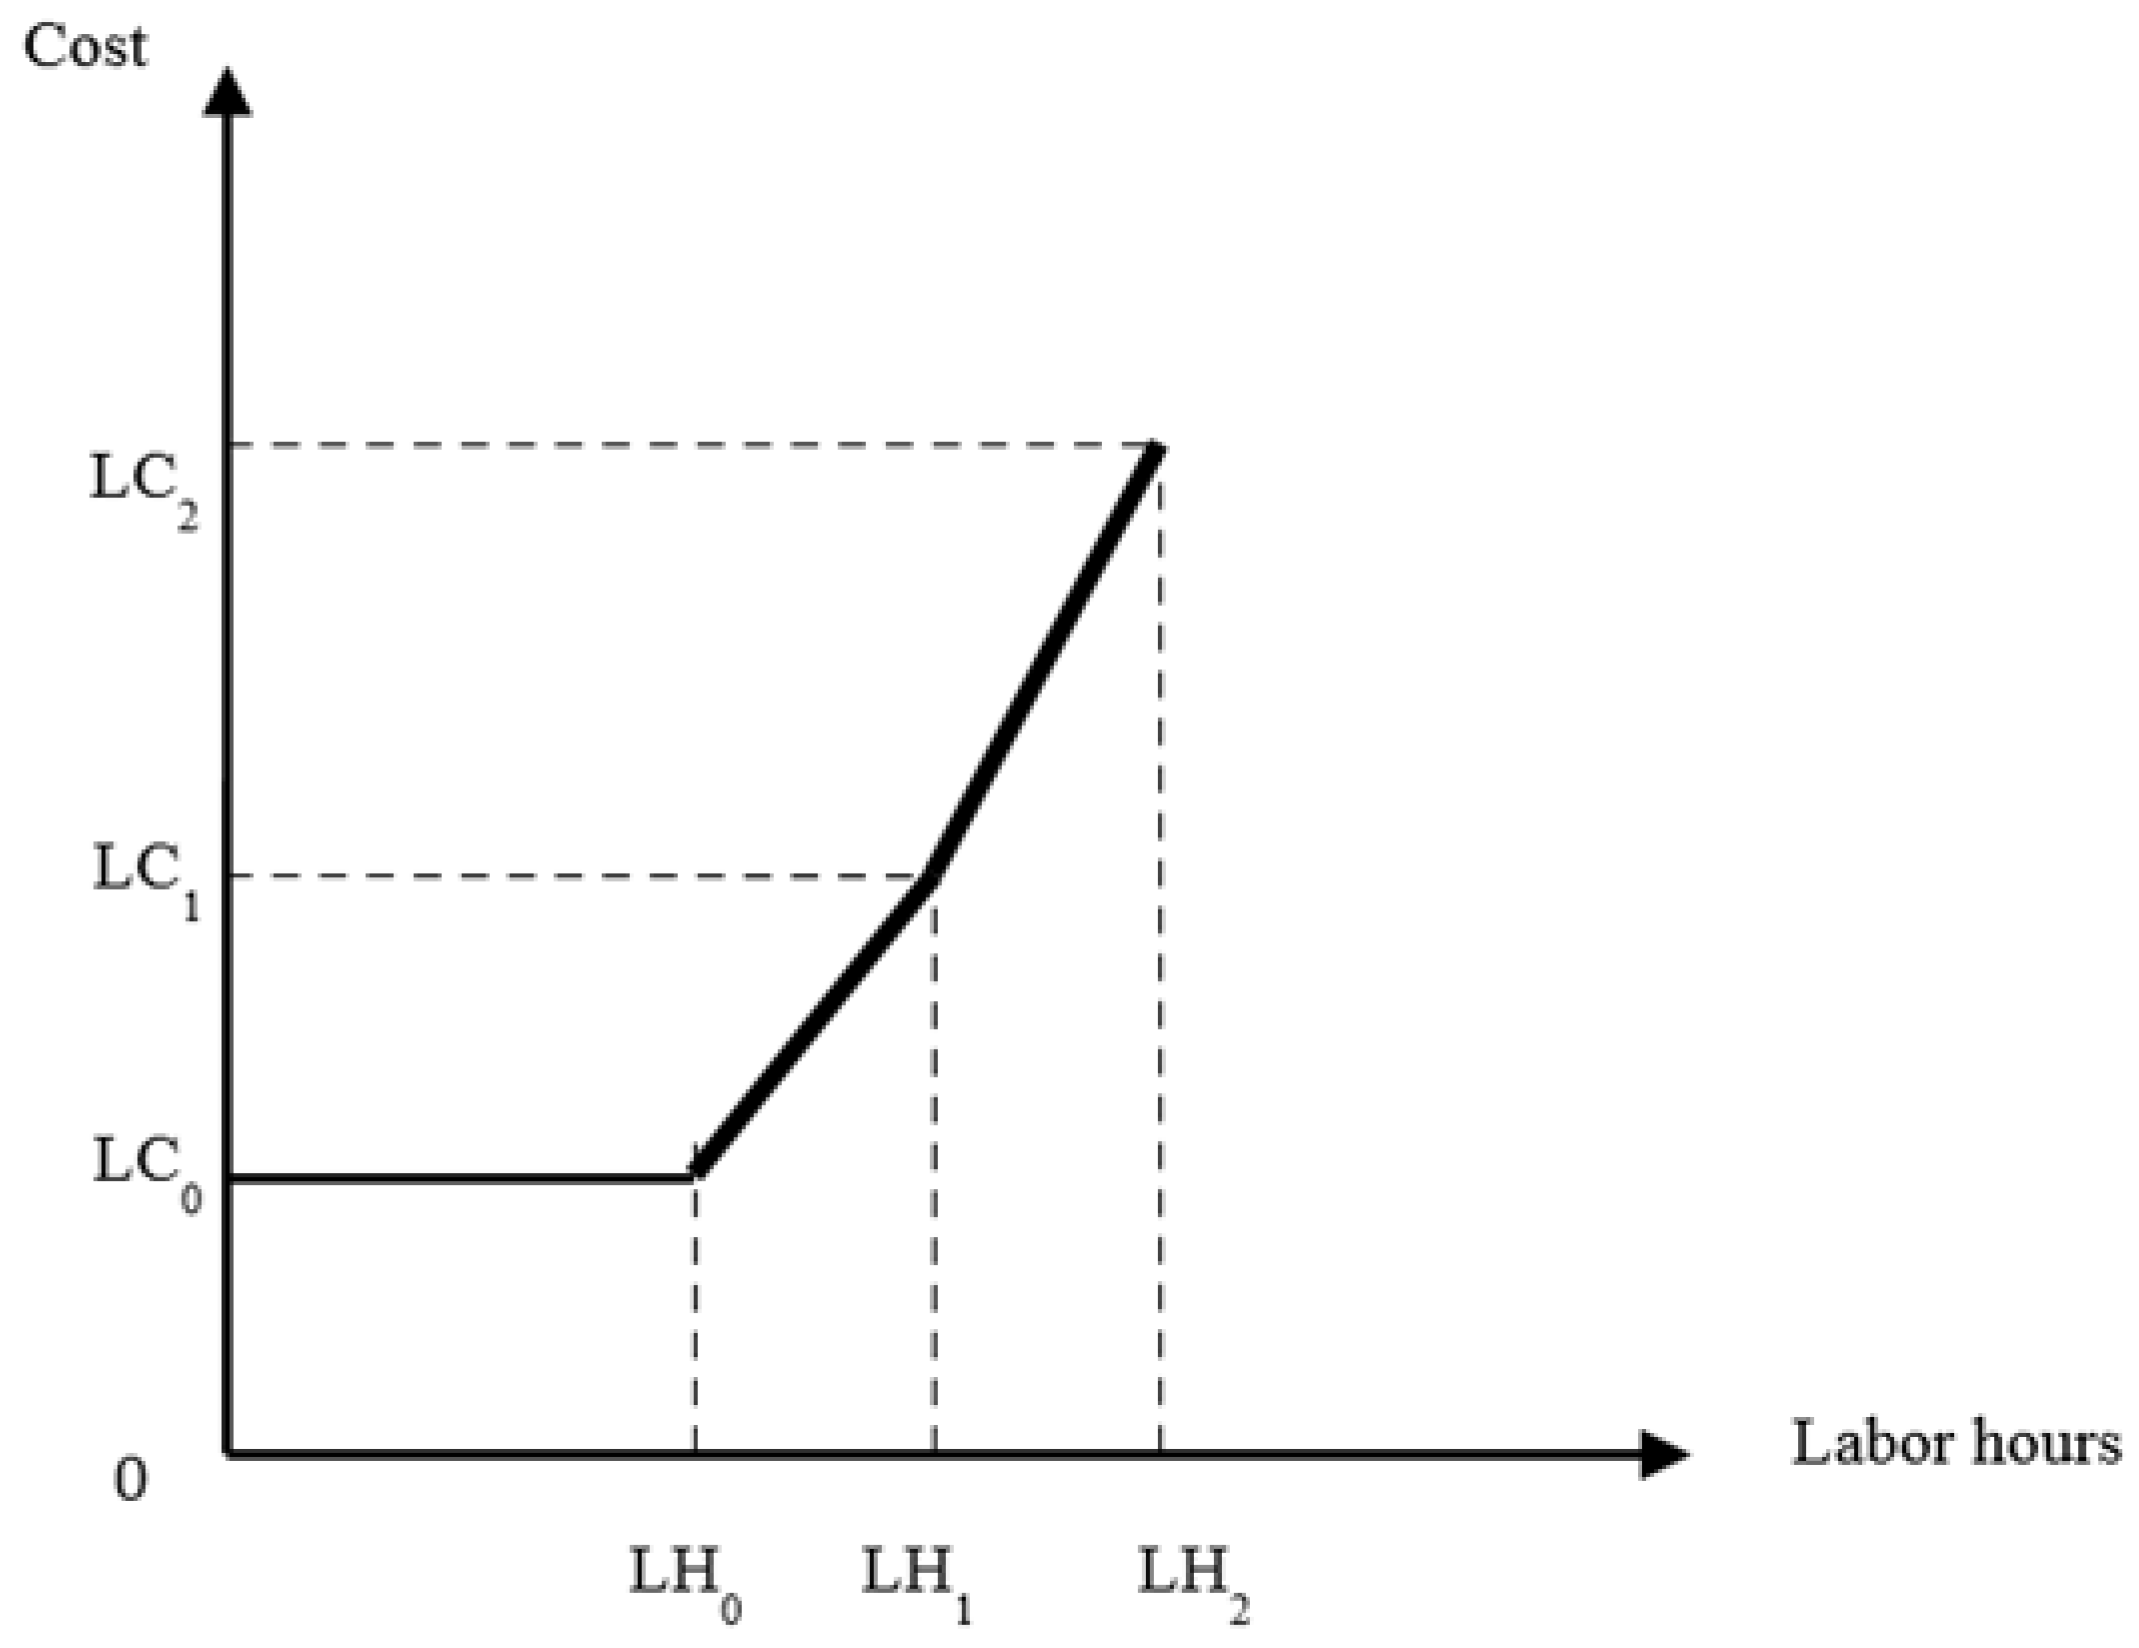
Figure 4.
Carbon tax costs.

Figure 5.
Sensitivity analysis of changes in gross profit.
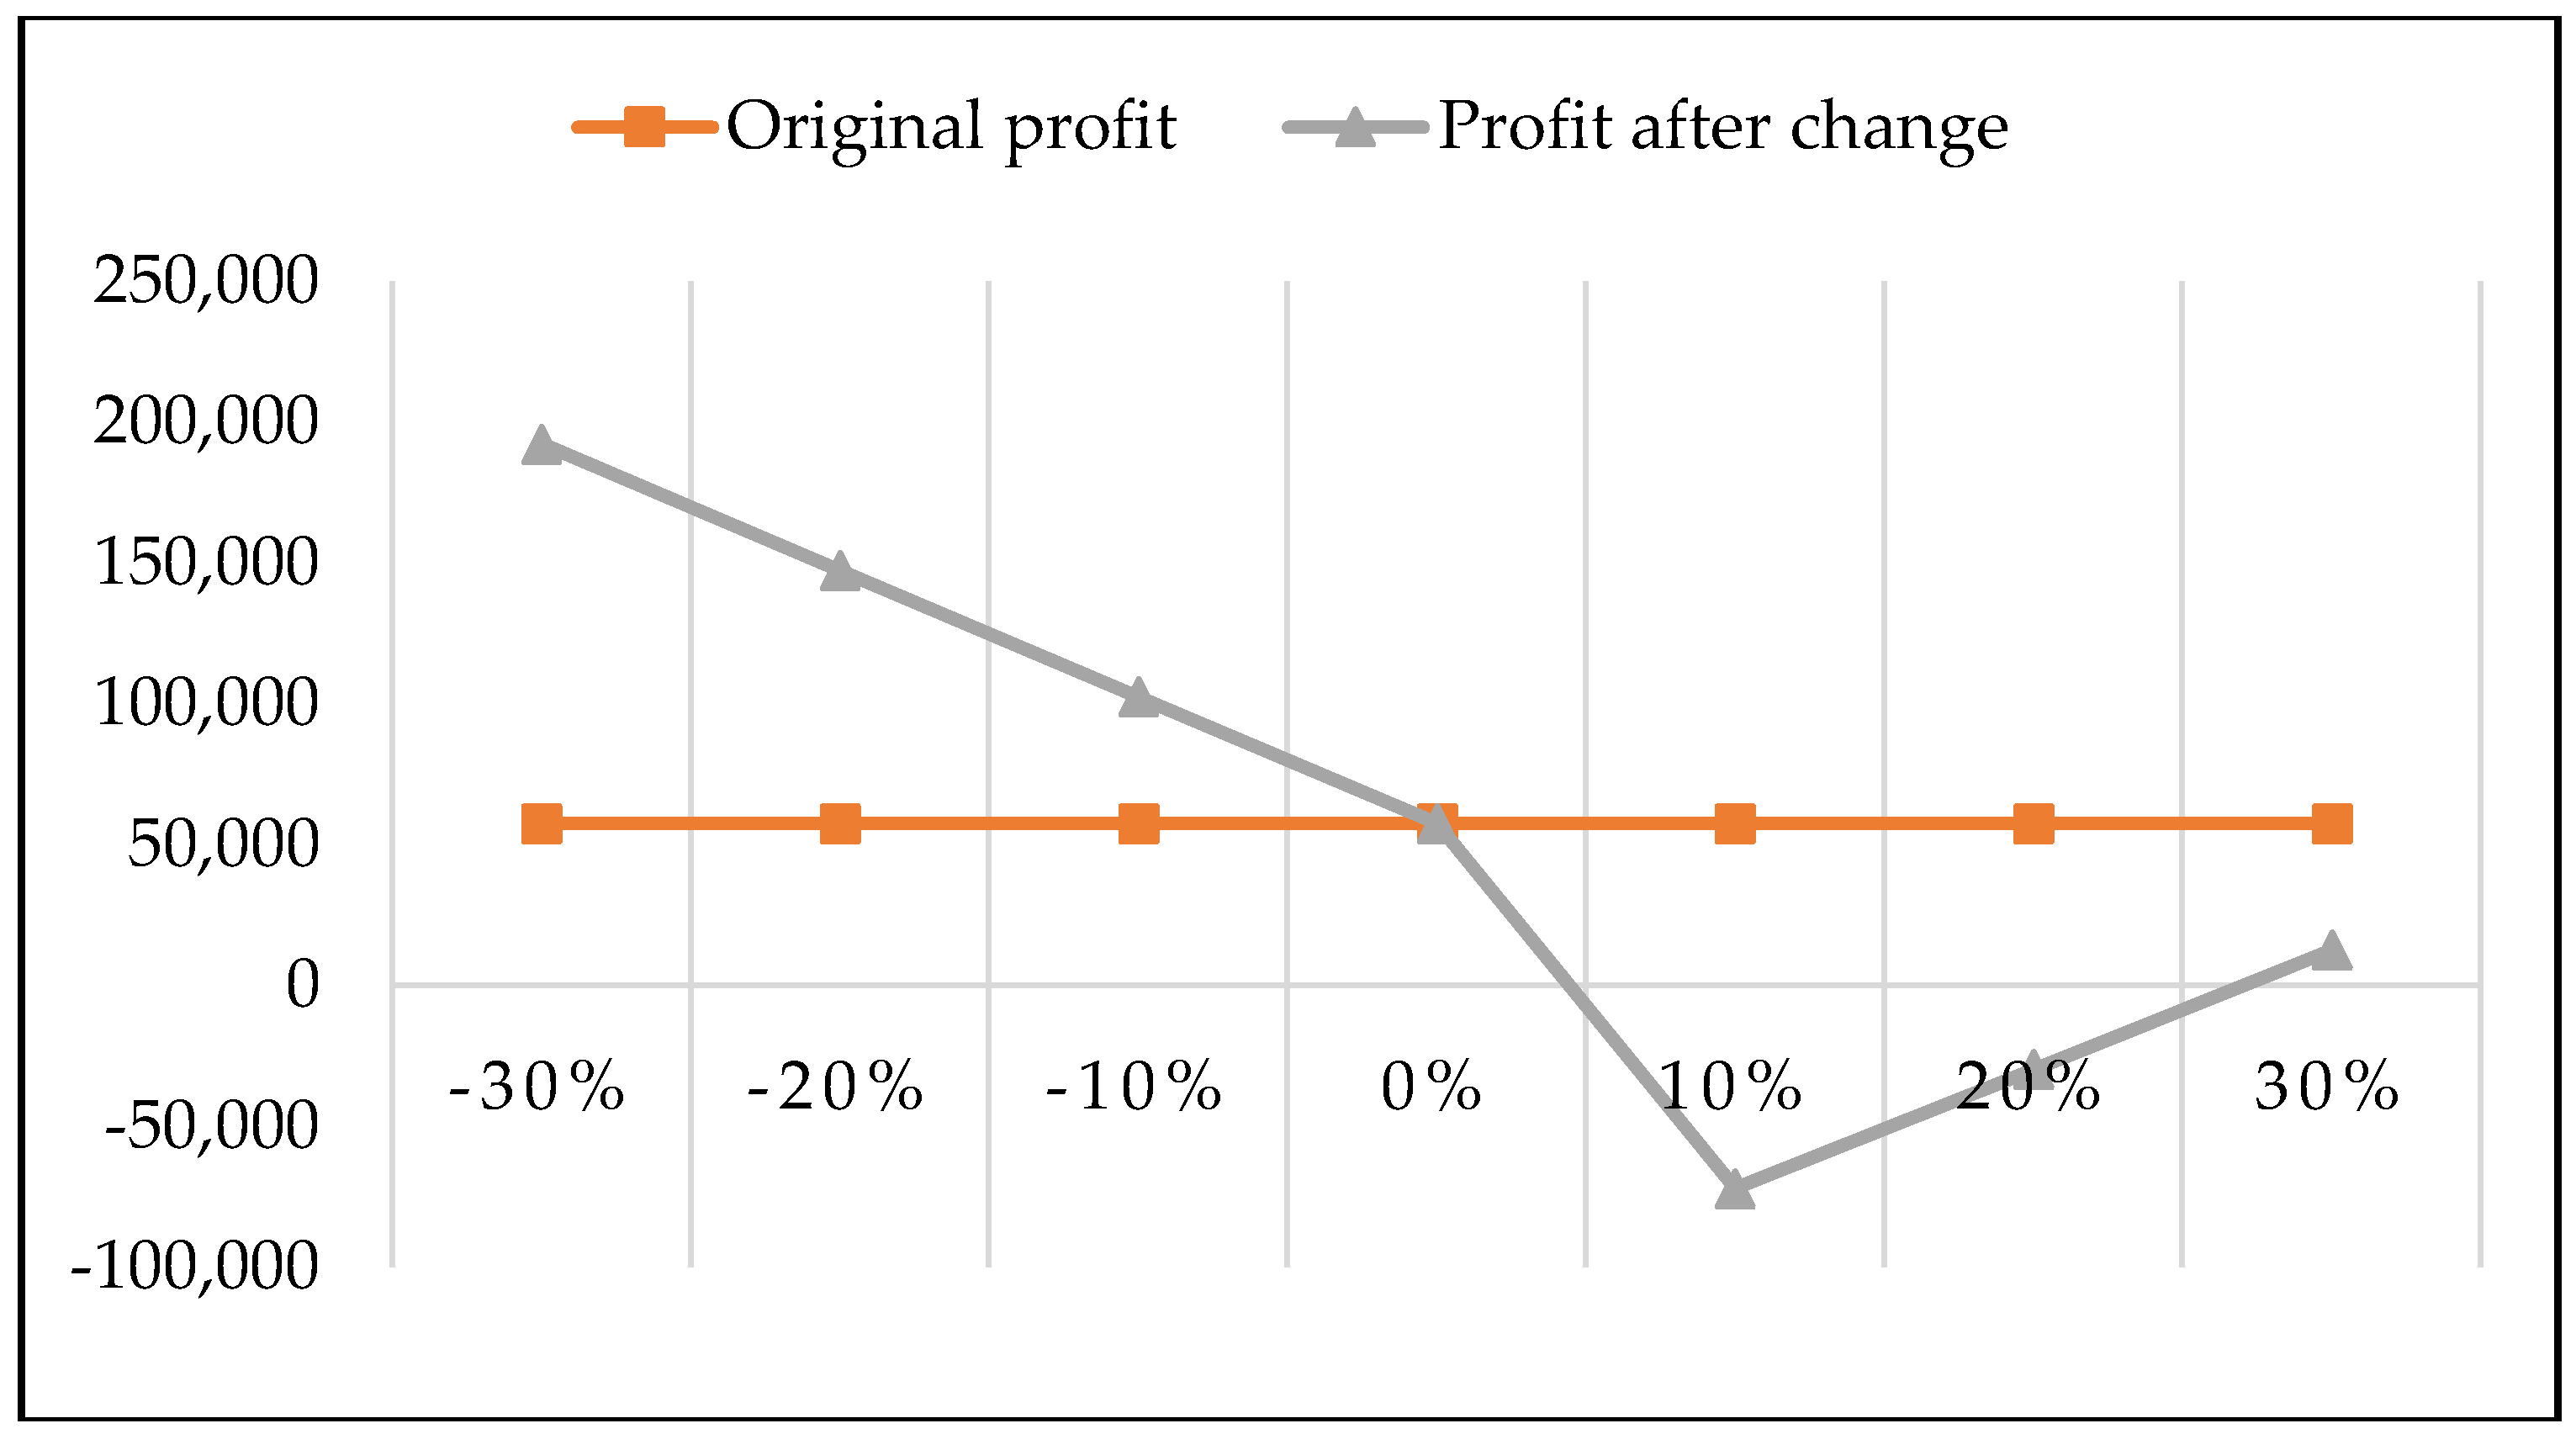
Figure 6.
Sensitivity analysis of changes in total profit increase and decrease.


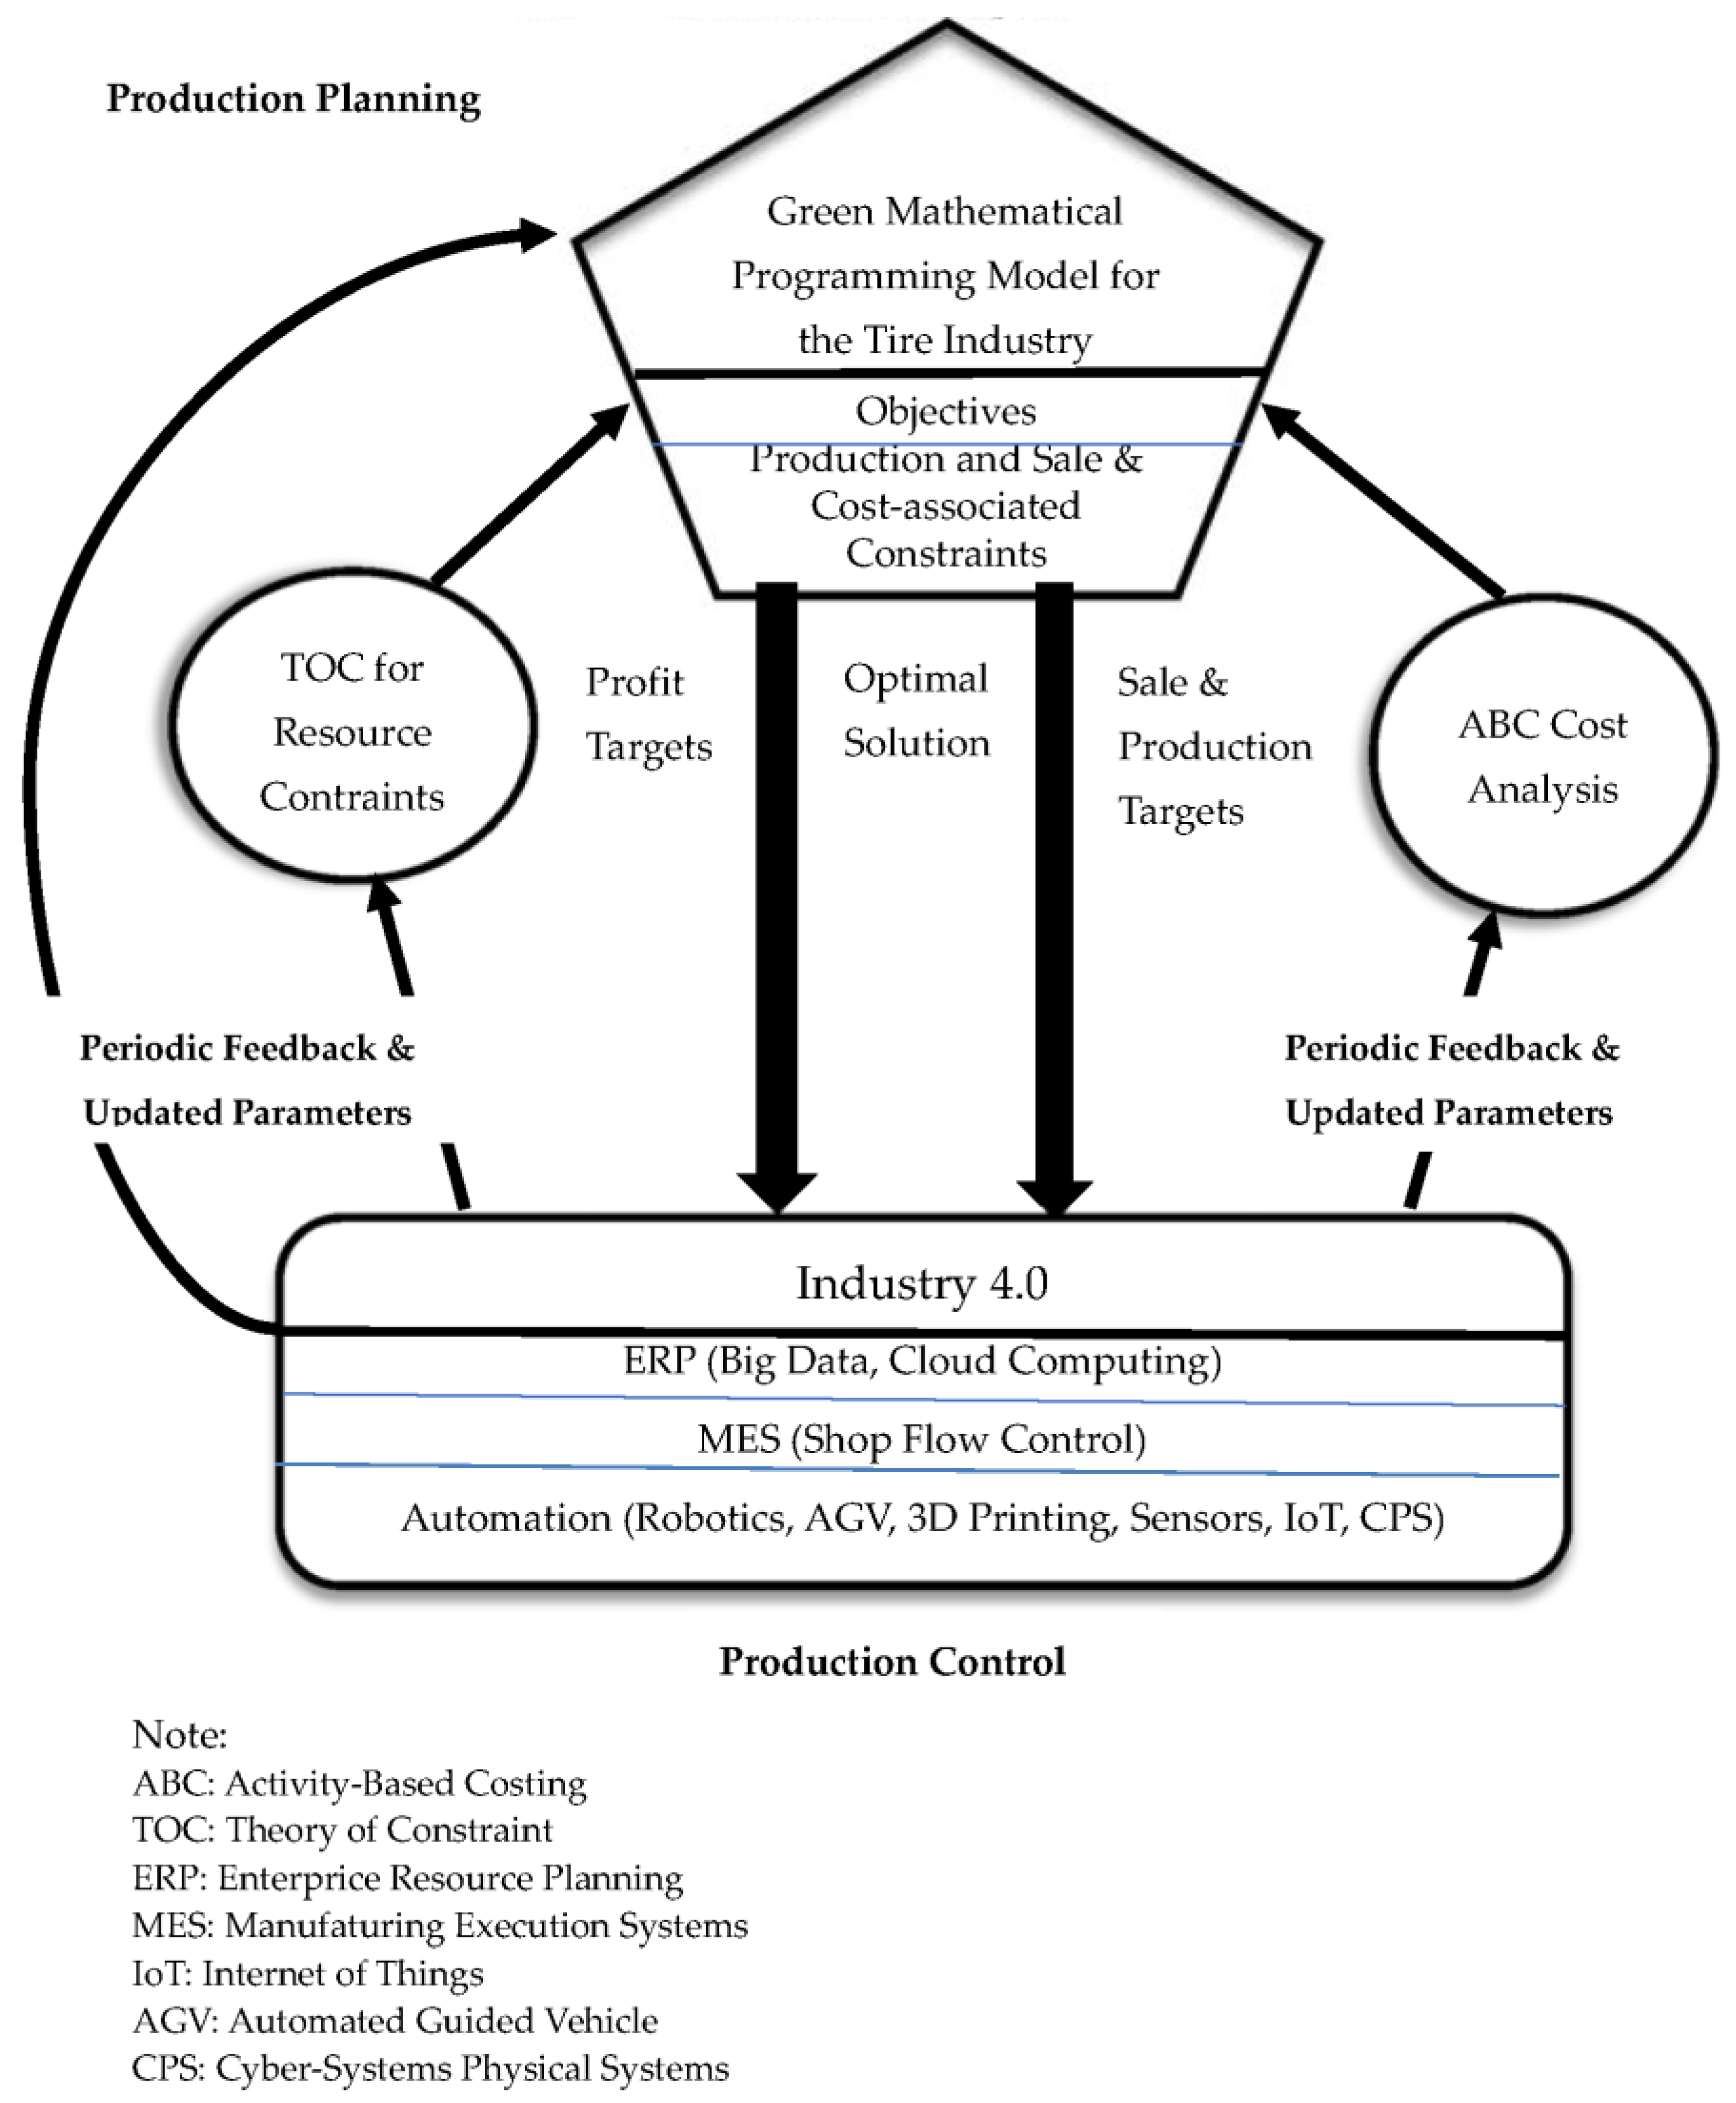
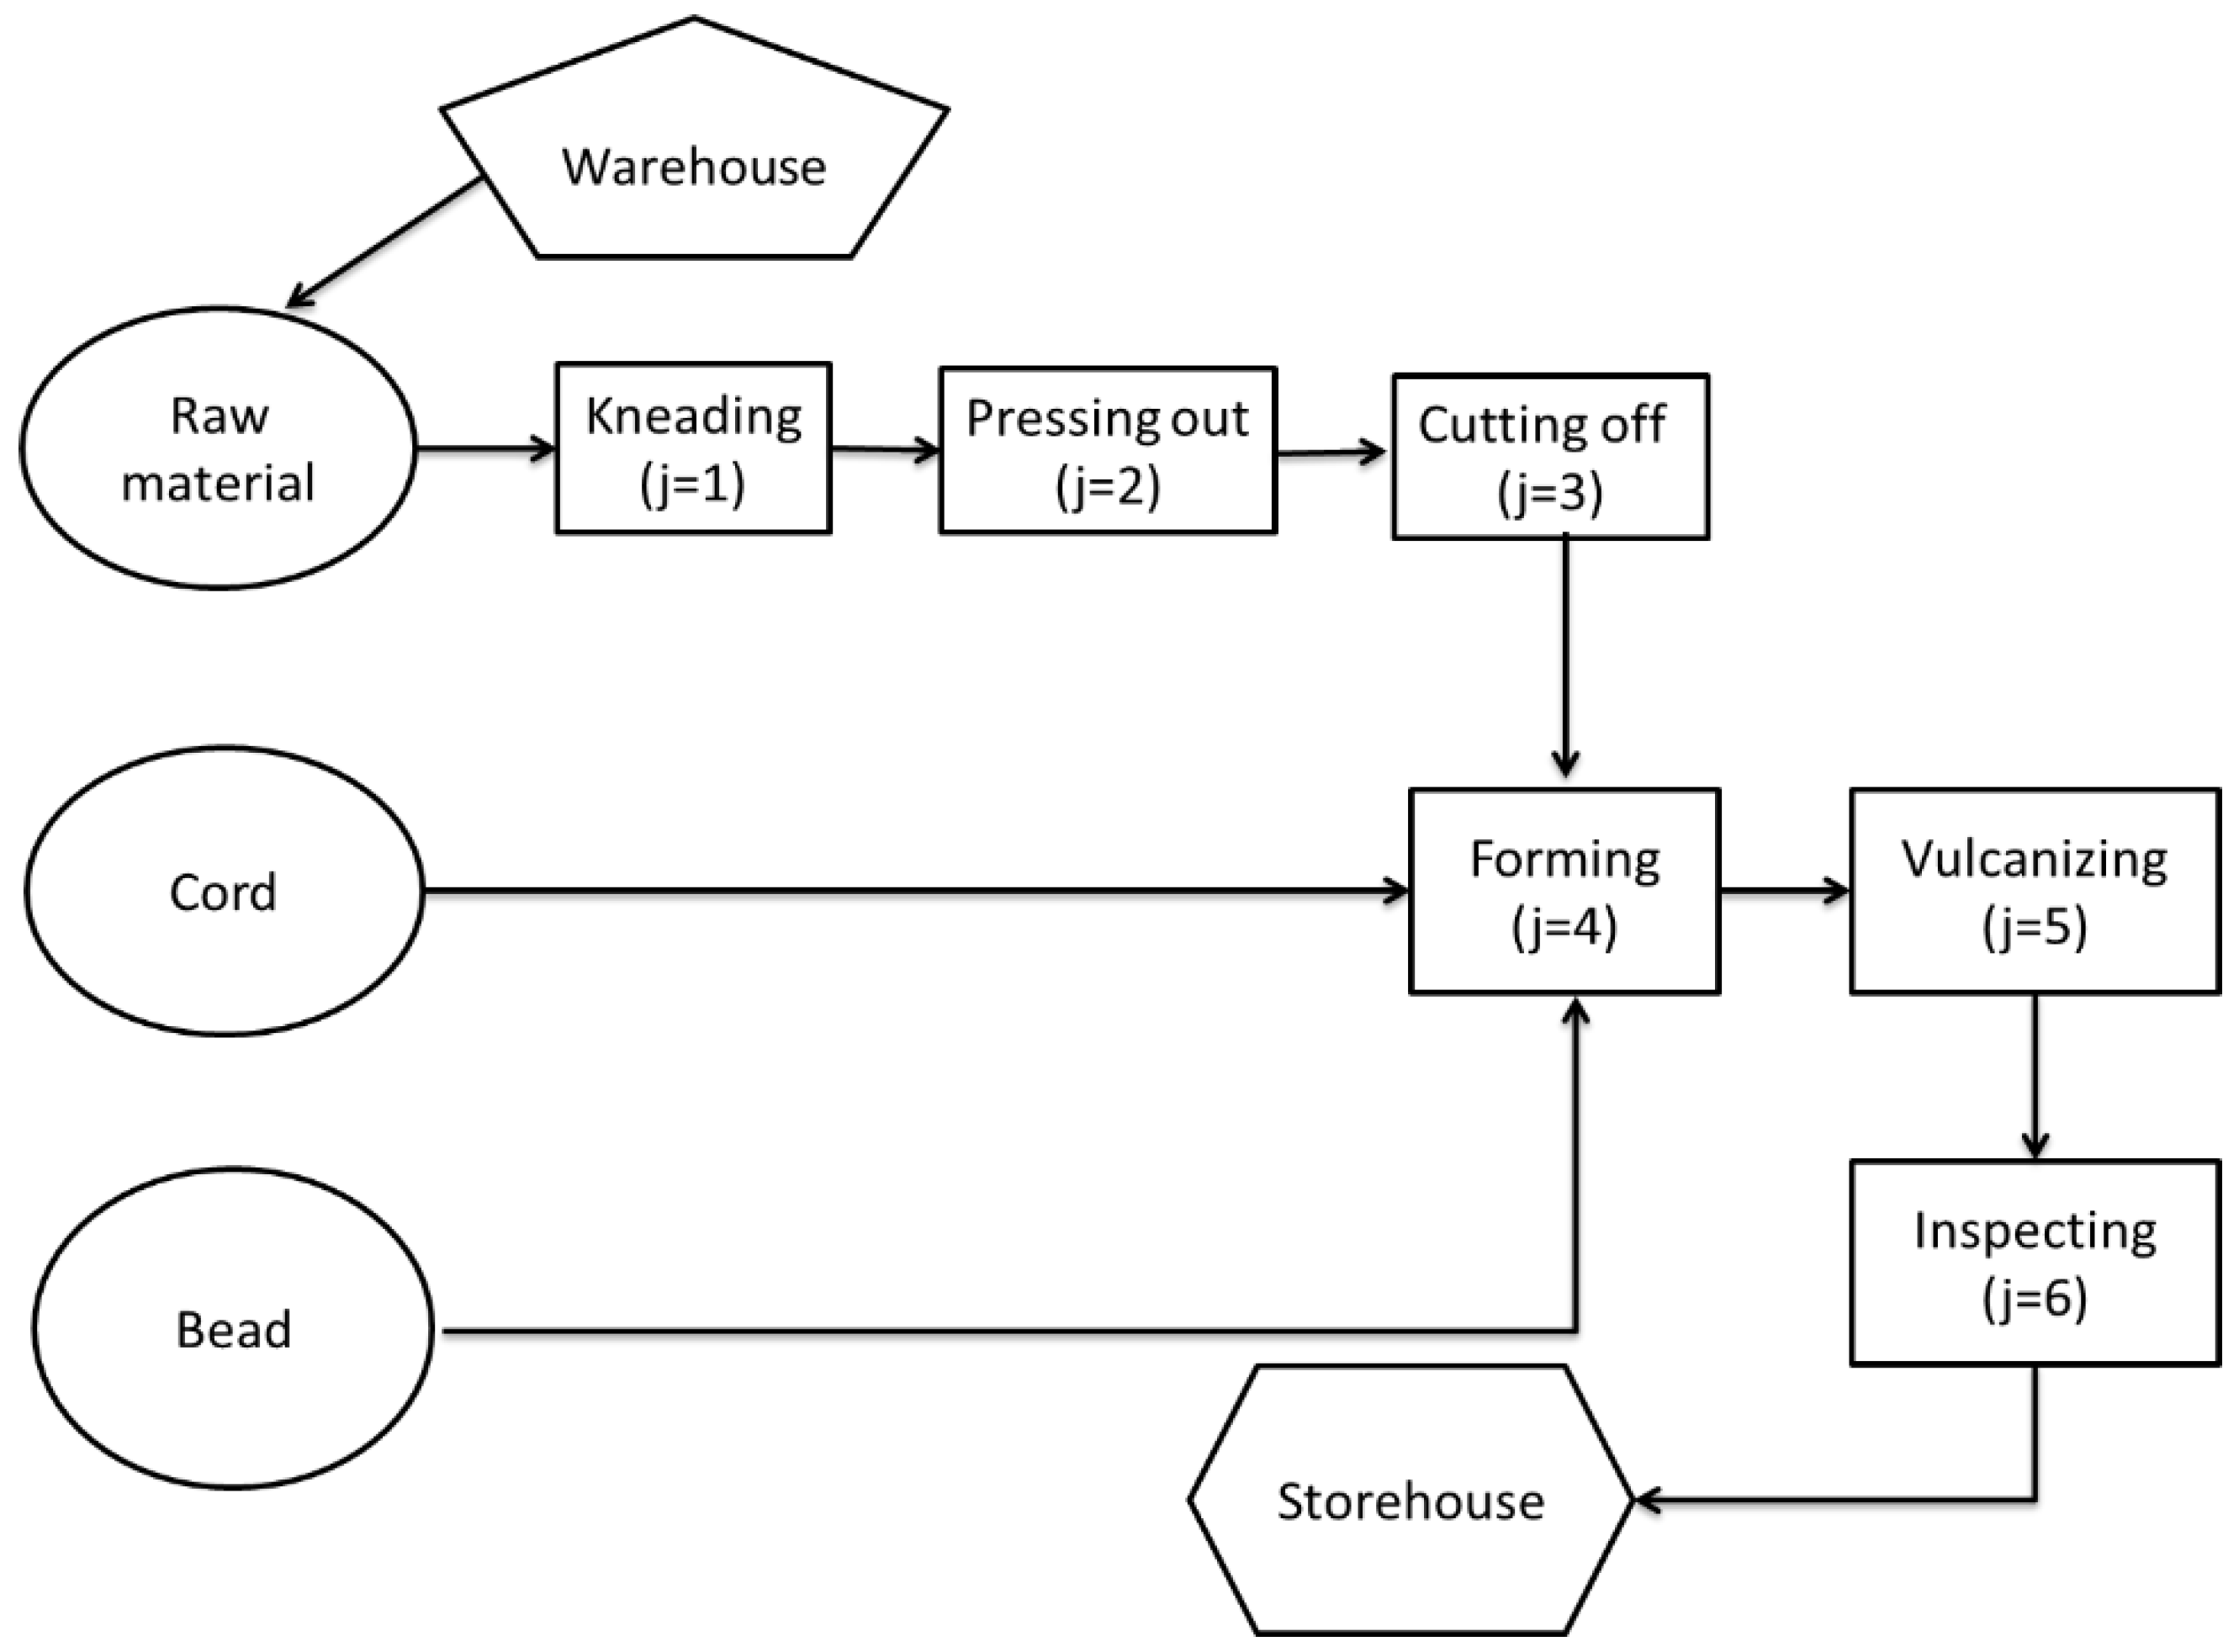
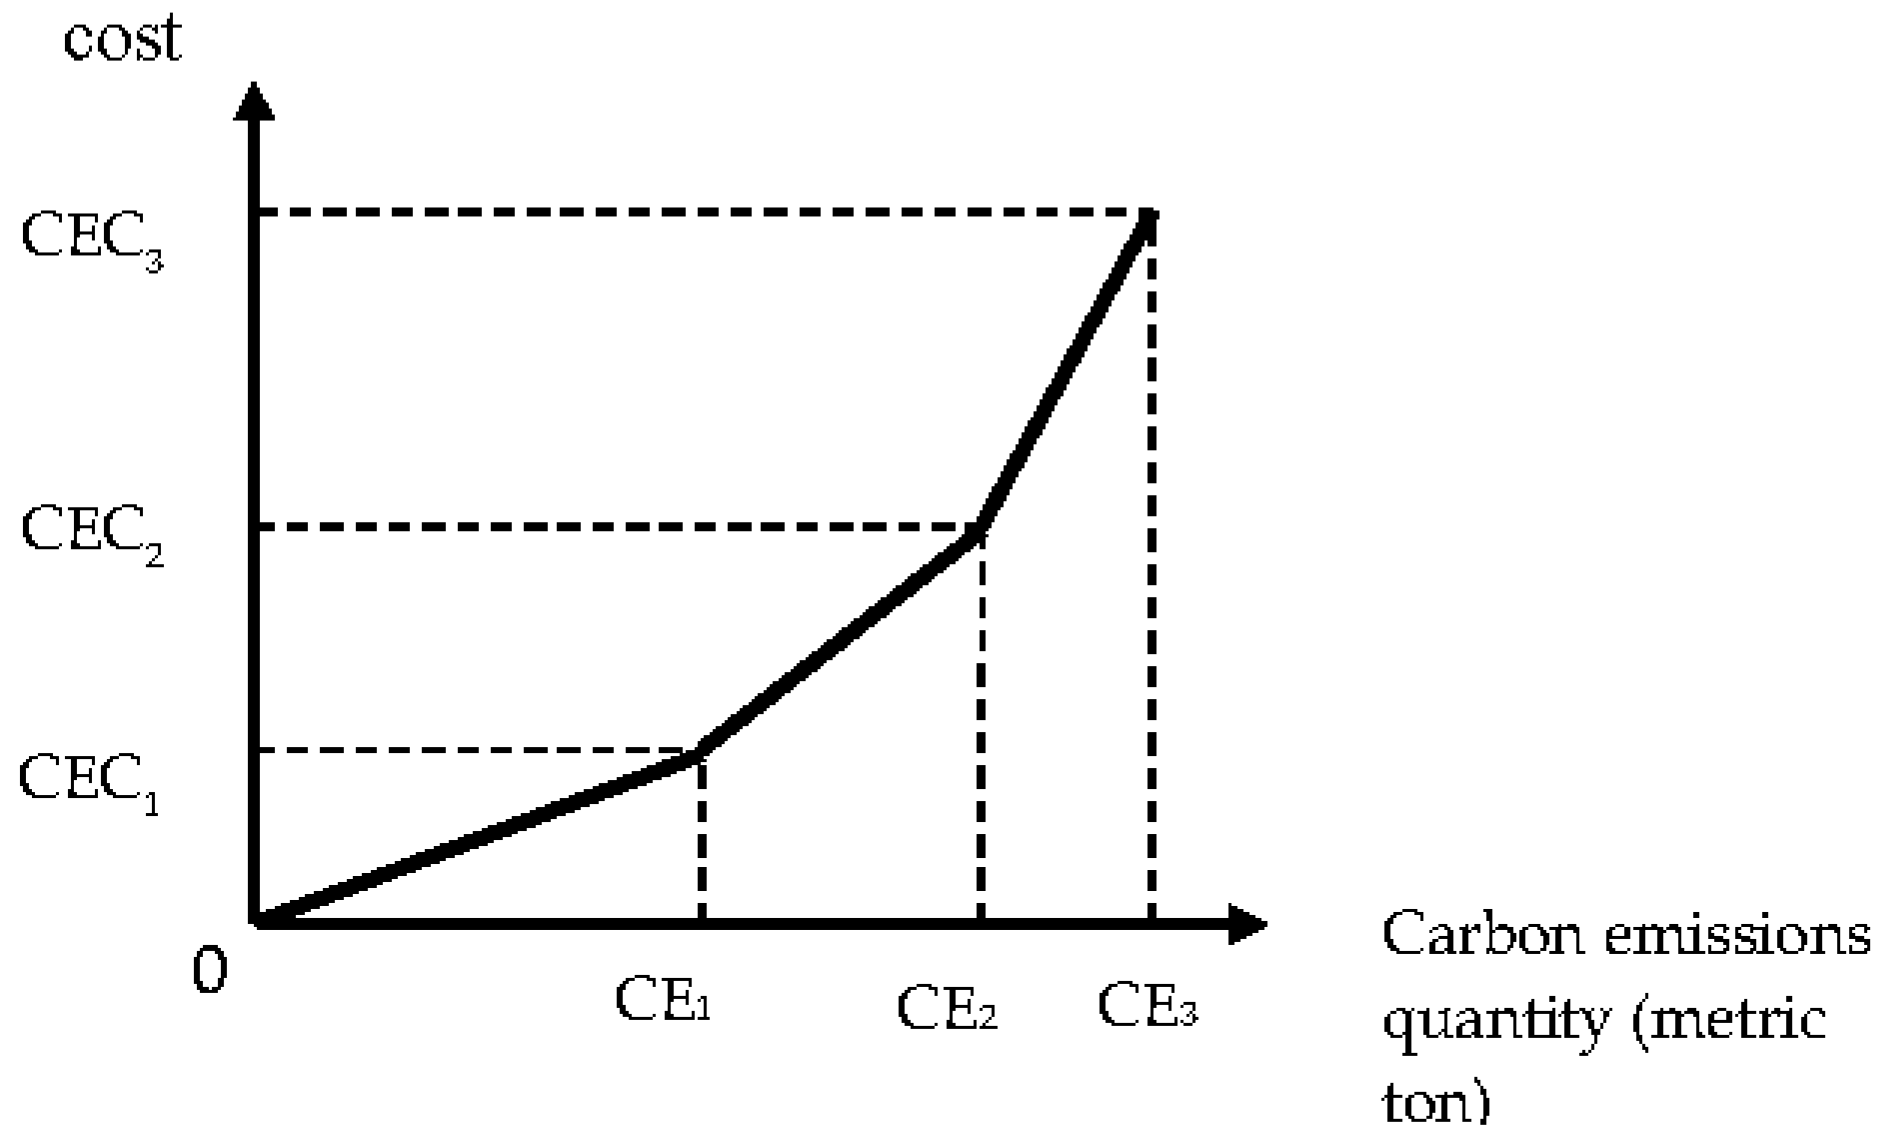
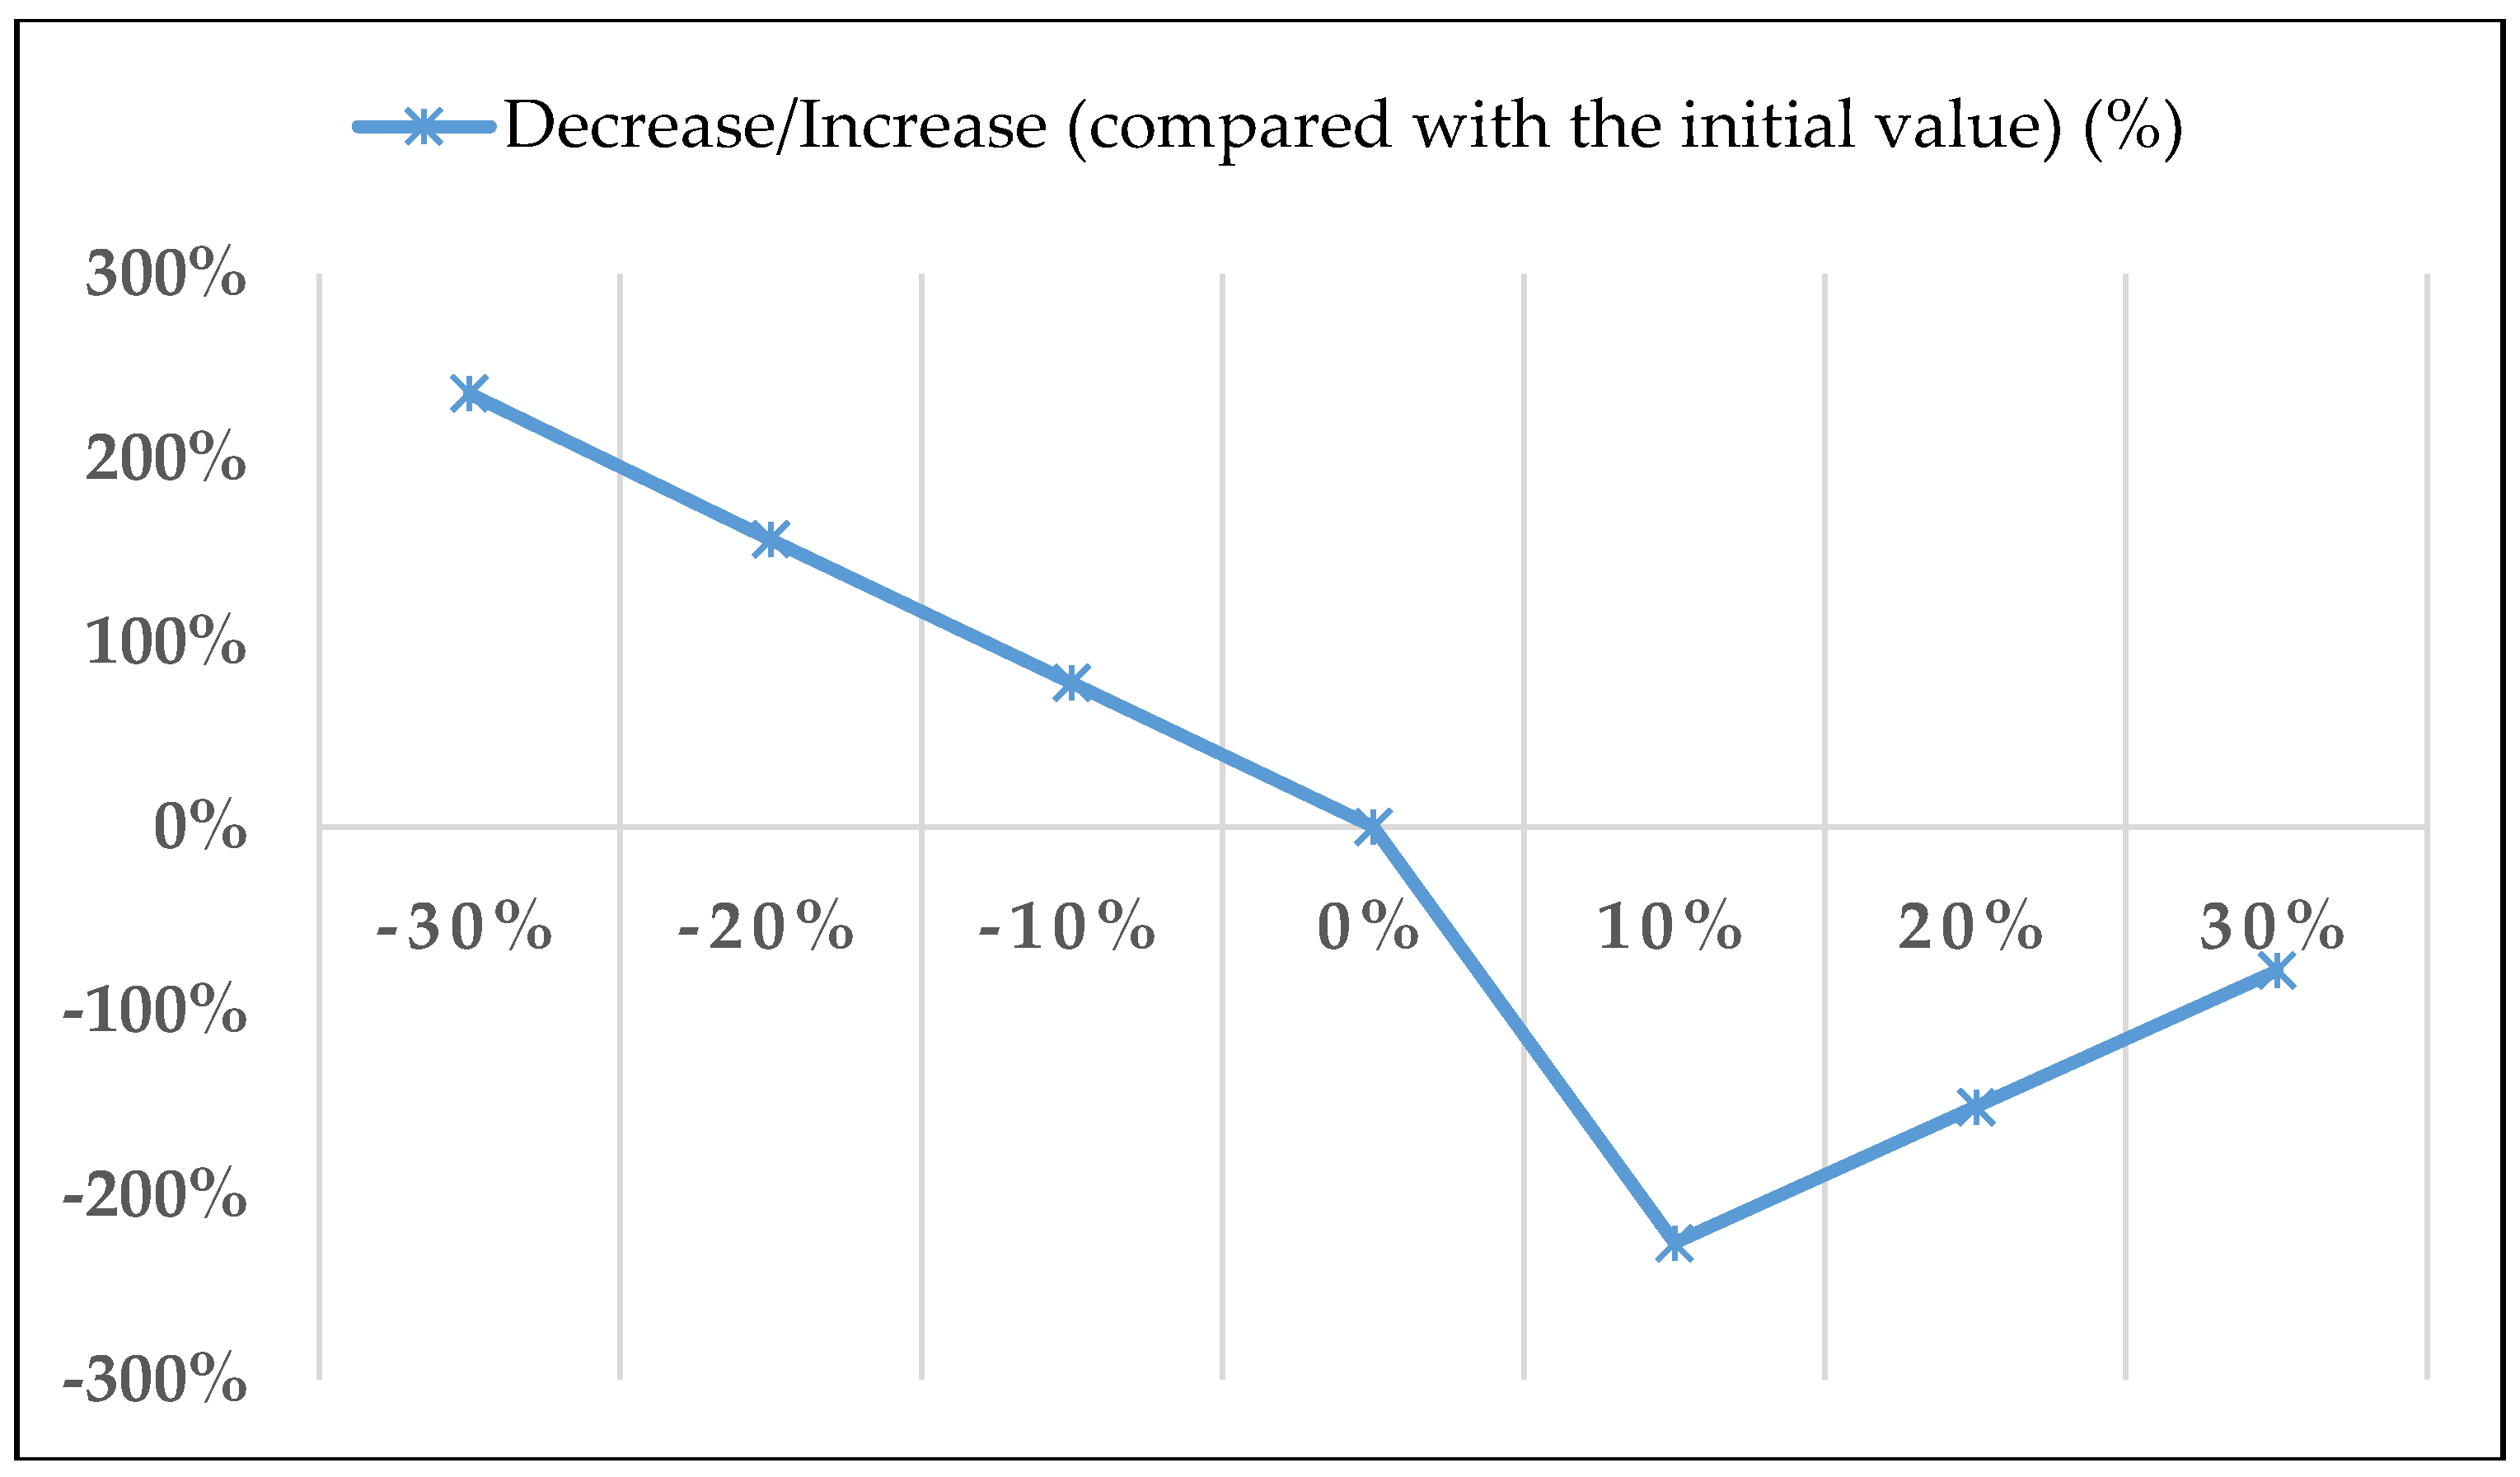
Table 1.
Data for Illustrative Example.
| Product | PCR (i = 1) | TBR (i = 2) | MC (i = 3) | Available Capacity (thousand) | ||||
|---|---|---|---|---|---|---|---|---|
| Maximum demand: (thousand) | j | Qi | 1000 | 100 | 1500 | |||
| Selling price: (USD) | Si | 300 | 1000 | 150 | ||||
| Direct material: | k = 1 | 20 | 4 | 6 | 2 | W1 = 10,500 | ||
| (USD/ton) | k = 2 | 10 | 2 | 10 | 1 | W2 = 8000 | ||
| k = 3 k = 4 k = 5 | 5 37 21 | 5 2 2 | 15 6 15 | 2 1 1 | W3 = 8600 W4 = 7000 W5 = 7800 | |||
| Machine hour constraint: | ||||||||
| Kneading Pressing out Cutting off Forming Vulcanizing Inspecting | Machine hours Machine hoursMachine hours Machine hours Machine hours Machine hours | 1 2 3 4 5 6 | 5 2 2 3 2 3 | 10 4 3 5 3 6 | 1 1 1 1 1 1 | MH1 = 13,200 MH2 = 22,000 MH3 = 22,000 MH4 = 26,400 MH5 = 13,200 MH6 = 6600 | ||
| Material handling constraint: | ||||||||
| Machine hours (hr) Cost (USD) | q1 = 50; q2 = 150; q3 = 10 | 7 | 2 5 | 3 10 | 1 1 | MH7 = 1760 | ||
| Direct labor constraint: | ||||||||
| Cost: Labor hours (hr) | LC0 = 7040 LH0 = 1760 | LC1 = 11,000 LH1 = 2200 | LC2 = 15,840 LH2 = 2640 | 1 | 1.5 | 0.5 | ||
| Wage rate (USD/hr) | r0 = 4 | r1 = 9 | r2 = 11 | |||||
| Carbon emission constraint: | ||||||||
| Cost (USD) Emission quantities | CEC1 = 7000 CE1 = 700 | CEC2 = 10,000 CE2 = 850 | CEC3 = 13,000 CE3 = 950 | 0.2 | 0.1 | 0.1 | ||
| Tax rate (USD/ton) | T1 = 10 | T2 = 20 | T3 = 30 | |||||
| Total fixed cost: (USD) | 20,000 | |||||||
Table 2.
Optimal solutions, Resource consumption, Carbon emission and tax and Total profit.
| =1,020,000 | =60,000 | =1,300,000 | |||
| =1 | =0 | =0 | |||
| =204,000 | =6000 | =1,300,000 | |||
| =0.49 | =0 | =0 | |||
| =0.51 | =1 | =0 | |||
| =1 | =0 | =0 | |||
| Machine hours | Direct material quantity | Direct labor hour = 1,760,000 | |||
| 1 | 7,000,000 | 1 | 7,040,000 | Carbon emission quantity = 340,000 | |
| 2 | 3,580,000 | 2 | 3,940,000 | Carbon tax = $3,400,000 (USD) | |
| 3 | 3,520,000 | 3 | 8,600,000 | Total profit π = $57,320,000 (USD) | |
| 4 | 4,660,000 | 4 | 3,700,000 | ||
| 5 | 3,520,000 | 5 | 4,240,000 | ||
| 6 | 4,720,000 | ||||
| 7 | 1,726,000 | ||||
Table 3.
Sensitivity Analysis on direct material and carbon cost.
| Direct Material and Carbon Cost Decrease/Increase Ratio (%) | Original Profit (A) | Profit after Change (B) | Decrease/Increase Profit (C) = (B − A) | Decrease/Increase (Compared with the Initial Value) (%) (D = C/A) |
|---|---|---|---|---|
| −30% | 57,320 | 192,062 | 134,742 | 235% |
| −20% | 57,320 | 147,148 | 89,828 | 156% |
| −10% | 57,320 | 102,234 | 44,914 | 78% |
| −0% | 57,320 | 57,320 | 0 | 0% |
| 30% | 57,320 | −72,268 | −129,588 | −226% |
| 20% | 57,320 | −29,952 | −87,272 | −152% |
| 10% | 57,320 | 12,406 | −44,914 | −78% |
Unit: Thousands of USD.
© 2018 by the authors. Licensee MDPI, Basel, Switzerland. This article is an open access article distributed under the terms and conditions of the Creative Commons Attribution (CC BY) license (http://creativecommons.org/licenses/by/4.0/).
Share and Cite
MDPI and ACS Style
Tsai, W.-H.; Lu, Y.-H. A Framework of Production Planning and Control with Carbon Tax under Industry 4.0. Sustainability 2018, 10, 3221. https://doi.org/10.3390/su10093221
AMA Style
Tsai W-H, Lu Y-H. A Framework of Production Planning and Control with Carbon Tax under Industry 4.0. Sustainability. 2018; 10(9):3221. https://doi.org/10.3390/su10093221
Chicago/Turabian StyleTsai, Wen-Hsien, and Yin-Hwa Lu. 2018. "A Framework of Production Planning and Control with Carbon Tax under Industry 4.0" Sustainability 10, no. 9: 3221. https://doi.org/10.3390/su10093221
Note that from the first issue of 2016, this journal uses article numbers instead of page numbers. See further details here.