What Is the Efficiency of Fast Urbanization? A China Study
by
 , ,
, ,
Yitian Ren
1,2,3 ,
,
Heng Li
3,
Liyin Shen
1,2,*,
Yu Zhang
1,2,3,
Yang Chen
1,2,3 and
Jinhuan Wang
1,2,3 1
School of Construction Management and Real Estate, Chongqing University, Chongqing 400030, China
2
International Research Center for Sustainable Built Environment, Chongqing University, Chongqing 400030, China
3
Department of Building and Real Estate, The Hong Kong Polytechnic University, Hong Kong, China
*
Author to whom correspondence should be addressed.
Sustainability 2018, 10(9), 3180; https://doi.org/10.3390/su10093180
Submission received: 23 July 2018
/
Revised: 3 September 2018
/
Accepted: 3 September 2018
/
Published: 5 September 2018
(This article belongs to the Section Sustainable Urban and Rural Development)
Abstract
:Urbanization is commonly described as the process of population flow from rural to urban areas. As the largest developing country, China has experienced an unprecedentedly fast and large urbanization process since 1980s, which will continue for the coming future. The immense scale of the process has brought multidimensional benefits across all sectors in the country, yet also consumed a vast amount of resources and caused various types of environmental problems. The conflict between limited resources and an unstoppable urbanization process has become a pressing issue, which presents the urgent need for efficiency pursuance in the process of urbanization in order to ensure sustainable urban development. It is considered that the improvement of urbanization efficiency in large developing countries such as China has great implications for global sustainability. There is little existing study conducted to understand what efficiency achieved in the current fast urban development era in China. This study investigates the urbanization efficiency and its changes in the contemporary China. A set of input-output indicators are employed for analyzing the efficiency, in which both desirable and undesirable outputs are considered. The Super-efficiency Slack-based Measure (SBM) model and DEA-based Malmquist Production Index (MPI) are adopted collectively for conducting data analysis. The research is conducted at provincial level in China and the data collected for analysis are from 30 provinces for the period of 2006–2015. The results from this study show that the overall urbanization efficiency in China during the surveyed period is low, although certain improvement has been achieved. The difference between good and poor performers is considerable. In general, those provinces with better social and economic background have better urbanization efficiency performance. East China is much better than the rest of China, whilst Southwest region has the poorest performance.
1. Introduction
Urbanization began during the industrial revolution period when workers moved from rural areas to cities to obtain jobs in factories. It is one of the fundamental characteristics of the civilization of human society. In the contemporary era, urbanization commonly refers to the process of population flow from rural to urban areas [1]. Government aims to generate multiple benefits through implementing urbanization programs, including, for example, economic growth, transportation convenience, better living quality, and harmonious urban-rural relationship [2]. In fact, urbanization becomes an important social process in the 21st century, particularly in many developing countries such as China. The urbanization development in large countries including China has made a significant contribution to the progress of global urbanization. Since the implementation of reform and open policy in early 1980s, the urbanization process in China has experienced a rapid and unprecedented development era, with the increase of the urbanization rate from 17.92% in 1978 to 58% in 2017, giving an average annual increase rate of 1.03% [3]. In comparison, the urbanization rate at global level increased from 38.48% to 54.73% during the same period of 1978–2017, giving an average annual increase rate of only 0.42% [3].
In line with its dramatically fast urbanization process, China has been witnessing the largest scale of migration from rural to urban areas over last three decades, resulting in the huge increase of urban population from 172.45 million in 1978 to 792.98 million in 2016 [3,4]. It is widely considered that urbanization has been a driving power to the development of China across all sectors in the country [2]. China has rocked up to the second largest country globally in terms of GDP scale, for which the urbanization scheme of the country has made the special contribution [5].
Nevertheless, the immense scale of urbanization programs in China has been consuming vast amounts of resources, including labor forces, land, energy, water, timber, and other natural resources [6]. It was reported that the water consumption in urban areas in China has risen sharply from 7.87 billion m3 in 1978 to 56.05 billion m3 in 2015 [7]. The speed of resources consumption in China is alarming, particularly on those non-renewable resources for implementing urbanization programs. There are more than 400 Chinese cities suffering from severe water shortage [7]. A number of reports suggest that resources consumption is not efficient in the current fast urbanization process in China. For example, Guan et al. [7] found that the energy consumption per GDP in China is 2.3 times higher than that of the world’s average level, 4.1 times higher than that of the average level of European Union countries, 7.6 times higher than that of Japan, and even much higher than many developing countries. During the past four decades, large scales of agricultural land have been acquired in China for urban sprawl in the urbanization process, but yet significant amount of urbanized areas are unoccupied. The phenomena of unoccupied urbanized areas are referred as “Ghost City”, a typical type of land and capital waste in China [8,9]. Nevertheless, it has been widely appreciated that the conflict between limited supply and increasing demand of resources for urbanization development has become serious, particularly in developing countries [1,6,10,11,12,13]. It is therefore a pressing issue to pursue the efficiency in urbanization process in order to save resources for sustainable urban development.
As the world’s largest developing nation, China is determined to continue its urbanization process in the coming future, and an understanding on whether the resources are used efficiently in its current urbanization process is essential. This understanding can help reveal the quality of current urbanization process and the level of waste, if any, on various types of resources. Without the understanding, measures cannot be taken appropriately to improve the quality of urbanization process, consequently, the existing problem, such as “Ghost City”, will remain and even become worse, and the sustainability of urbanization will be sabotaged.
Urbanization is a complicated “input-output” system process, and its efficiency is widely measured by comparing the outputs or benefits gained with the resources inputted. An efficient urbanization process will be recognized if the process costs less resources whilst generates more benefits. Previous studies appreciated that the performance of urbanization efficiency is attributed by many factors, particularly the urban development modes and the composition structure between industrial sectors [14]. In the context of a big developing country such as China, by examining the urbanization efficiency between provinces or regions, the experience and lessons gained in different regions can be mined for sharing with each other. This way will enable the improvement of urbanization efficiency across the country, which can in turn promote the sustainable urbanization process.
In order to measure urbanization efficiency, it is important to employ an appropriate measurement tool. According to previous studies, there are two typical efficiency measures, parametric methods and non-parametric methods. The parametric methods require pre-estimate hypothesis about the relations between inputs and outputs, for which Stochastic Frontier Analysis (SFA) model is representative. Non-parametric methods have no request for the prior hypothesis on the relations between inputs and outputs, and therefore they are considered to be able to avoid the possible problems caused by improper pre-estimation [15]. There are several non-parametric methods, such as Data Envelopment Analysis (DEA) model and Free Disposal Hull (FDH) model [16]. Among them, DEA is the most widely adopted, which was proposed originally by Charnes et al. [17]. DEA is a heuristic model for evaluating the efficiency of a specific Decision-Making Unit (DMU) through comparing a group of DMUs with an efficient production frontier [18]. In applying DEA, a set of input-output indicators will be adopted [19]. This method has been applied in various fields for efficiency study, such as banking and insurance industries [20,21], governmental administration [22], public transportation [23,24], regional economy [25], as well as low-carbon economy development [26].
Several previous studies have also applied DEA method in investigating the efficiency of urbanization development in China. For example, Jia et al. [27] estimated the urbanization efficiency at both district and county levels in Chengdu city in the year 2015 based on a three-stage DEA model. In their study, land, capital, and labor are used as input factors, and economic performance, population, and social development are output indicators. By adopting jointly DEA method and Malmquist Productivity Index (MPI), Song et al. [28] estimated the urbanization efficiency in a sample of ten prefecture-level cities in Shaanxi province in China for the period of 2003–2014. It was found that the overall urbanization efficiency in these cities declined during the surveyed period, and the gaps of efficiency performances between the cities increased. Zhang & Jiao [29] applied DEA method for estimating the urbanization efficiency in Yangtze River delta for the period of 1990–2011. Their findings suggest that the overall urbanization efficiency in the area has improved significantly during the study period, but there was a clear spatial distribution of different levels of efficiency. Xu et al. [30] adopted DEA-Cross model and investigated the urbanization efficiency in twelve prefecture-level cities in Gansu province for the period 2005-2009, and classified these cities into three categories, namely, “high inputs with high outputs”, “high inputs with low outputs”, and “low inputs with low outputs”.
Some other scholars adopted DEA method for evaluating the eco-efficiency of cities. For example, Yin et al. [14] adopted DEA method in evaluating the eco-efficiency of 30 Chinese provincial capital cities for the year of 2009, in which the input factors are capital, labor, land, water consumption, and energy consumption, and the output indicators are GDP value and pollutant emission. Their study suggests that half of the provincial capital cities in China are fairly eco-efficient. By adopting the Super-efficiency DEA model, Bai et al. [31] measured the relationship between urbanization and urban eco-efficiency of prefecture-level cities in China during the period 2006-2013, by employing the input factors of labor, capital, land, and resources consumption and the output factor of economic level. Their study reveals that during the urbanization process, urban eco-efficiency at prefecture-level cities in China has experienced a three-stage evolution, namely, increasing, declining, and increasing.
In the international context, there are handful studies using DEA method for analyzing the efficiency of urban development. For example, Gudipudi et al. [32] estimated the urban eco-efficiency of 88 European cities by using an advanced regression residual method and DEA model, suggesting that larger cities are usually more eco-efficient and that Stockholm, Munich, and Oslo have relatively better performance. Deilmann et al. [33] investigated the urban economic and ecological efficiency respectively for 116 cities in Germany from the perspective of land consumption. Their study reveals that the medium-sized and industrialized cities in Germany make the most efficient use of land. Morais & Camanho [34] adopted DEA model for evaluating the performance of 206 European cities in concerns of urban life quality, with considering the outputs of demography, economy, education, environment, transport, and culture. They found that those best performance cities are mainly located in Germany, Netherlands, and Belgium, whilst those poor performance cities are largely located in Romania, Italy, and Poland.
The above discussions demonstrate that the outputs used in previous studies for measuring urbanization efficiency are usually limited to benefit indicators such as economic performance or GDP value. However, urbanization process does not only generate benefit outputs but also produce undesirable outputs such as greenhouse gas emission, water pollution, and other types of pollutant discharge. Therefore, both good outputs (benefits) and undesirable outputs should be taken into account in order to reflect holistically the effects brought by urbanization process. Furthermore, the performance of urbanization efficiency is dynamic, which changes in line with social-economic development and environmental performance. Nevertheless, little existing study has investigated this dynamic change. With these limitations, the existing research results on urbanization efficiency are considered not able to provide adequate information to support decision-making for efficiency improvement, which would further hinder the practice of sustainable urbanization, particularly in large developing countries such as China.
This study therefore aims to evaluate the efficiency of the fast urbanization process in China from a holistic perspective, in which a set of input-output indicators is employed, and both desirable and undesirable outputs are incorporated. This holistic efficiency measurement will be used to measure and compare the urbanization efficiency between different regions and individual provinces. On the other hand, the dynamic changes of the urbanization efficiency during the surveyed period will be tracked. Effective measures for improving the urbanization efficiency in the context of China will also be discussed.
The rest of this paper will be organized as follows: Section 2 describes the research method. Section 3 presents the composition of input-output indicators and research data. Section 4 presents data analysis. Section 5 discusses the performance of urbanization efficiency at both provincial and regional level in and the effective measures to improve the efficiency performance.
2. Research Method
This study adopts the following two methods. (1) Super-efficiency Slack-based Measure (SBM) model is used to measure the urbanization efficiency at provincial level. (2) DEA-based Malmquist Production Index (MPI) is applied to track the dynamic changes of urbanization efficiency.
2.1. Super-Efficiency Slack-Based Measure (SBM) Model
There are two traditional DEA methods, namely, CCR (Charnes, Cooper, and Rhodes) model and BCC (Banker, Charnes, and Cooper) model. But both of the models have been criticized for their limitations in measuring system efficiency as they do not take into account the slack variables for both inputs and outputs [17,35]. Slack variables refer to the excess of input and the shortage of desirable outputs. In particular, traditional DEA methods assume that all the outputs of a production system are valuable and should be maximized for given inputs [26,36,37]. Nevertheless, the undesirable output is unavoidable in a production process, and has significant effects on the efficiency of the production process. To address these limitations embodied in the traditional DEA methods, Super-efficiency Slacks-Based Measure (Super-efficiency SBM) model is introduced by other researchers [36,38,39,40], which allows for taking into account undesirable outputs and these slack variables. Therefore, Super-efficiency SBM model is considered suitable for adoption in this study. The procedures of applying Super-efficiency SBM are highlighted as follows.
Urbanization is considered as a systematic process. An efficient urbanization process will be appreciated if the process costs fewer inputs whilst generating more desirable outputs and fewer undesirable outputs. Suppose that an urbanization process has n independent homogeneous decision-making units (DMUs). There are three types of factors in each DMU: Inputs, desirable outputs, and undesirable outputs. Each DMU consumes types of inputs and produces types of desirable outputs and types of undesirable outputs. The three types of factors can be denoted by three vectors respectively: Input vector, ; desirable output vector, ; and undesirable output vector, .
As there are n DMUs in urbanization process system, the three matrices, , , and , can be defined as follows:
As there are relations: , a production possibility set (P) can be defined as the following Equation (1):
where is the non-negative intensity vector, indicating that Equation (1) is subject to the condition of constant returns to scale (CRS). The inequality of means that the actual input is equal to or greater than the requested input. indicates that the actual desirable output level is equal to or less than the expected. Lastly, indicates that the actual undesirable output is equal to or greater than the expected.
In line with the above discussion, Slack-Based Measure (SBM) model can be used to measure the efficiency of DMU. According to the principle of SBM model, if a DMU to be measured is specified as , its efficiency value, , is described as follows:
where refers to the inputs excess, refers to the shortage of desirable outputs, and refers to the excess of the undesirable outputs. The vector is therefore called slack vector. The efficiency measurement, , assumes a value in the range
Only when the conditions of , , , and are met, then the urbanization process of DMU specified with is considered as SBM-efficient. Otherwise, if , the urbanization development of DMU is considered SBM-inefficient [36,39].
However, it should be noted that, in model (2), when the number of DMU becomes large, it is possible that several or many different DMUs perform full efficiency with the value of . In other words, the efficiency values of several or many DMUs can be 1 if the number of DMU is sufficiently large. In order to be able to discriminate DMUs even there are some units having same SBM efficiency values (), the Super-efficiency SBM model is further adopted.
Super-efficiency SBM model is a development of SBM model. Assume that there are a number of SBM-efficient DMUs (with value of ) according to (2), including the DMU . Under this circumstance, it is necessary to further measure the efficiency of DMU by a new efficiency value and differentiate it from other SBM-efficient DMUs. This new value will be given by applying the Super-efficiency SBM model.
Super-efficiency SBM model is based on the production possibility set , spanned by excluding , which is described as following Equation (3):
The new efficiency value of DMU , denoted as , is calculated according to the formula (4):
Model (4) allows that , the efficiency of DMU , may be larger than 1. In other words, the circumstance that there might be a number of DMUs with the efficiency value will be avoided by using the Super-efficiency SBM model (4).
2.2. DEA-Based Malmquist Production Index (MPI)
The Super-efficiency SBM model (4) is effective to measure the urbanization efficiency between different DMUs for a specific time period t, but it is not capable to assist in analyzing the dynamic changes of urbanization efficiency performance. In this regard, DEA-based Malmquist Production Index (MPI) is adopted for analyzing the dynamic changes. MPI model was first proposed by Sweden economist Malmquist [41] as a quantitative measure to analyze the changes of consumption in different time periods. DEA-based MPI was further proposed by Färe and Grosskopf in 1994 for evaluating the dynamic change of productivity efficiency over a period of time [26,42]. According to Zhang et al. [26] and Ma et al. [15], the procedures of adopting DEA-based MPI are as follows.
Assume that and are the measured efficiency values of for the time period and ( respectively by using the inputs and outputs obtained in the time period . For further assumption, and are the efficiency values of at the time period and (, respectively, by using the inputs and outputs obtained in the time period (. Then, according to the principle of DEA-based MPI, the dynamic change of the efficiency performance of from time period to (, denoted as , can be obtained as follows:
According to model (5), an improvement of urbanization efficiency in from the time period to ) will be appreciated if . Otherwise, it is considered that the has made no progress or even deteriorated in terms of urbanization efficiency over the time period.
3. Research Data
The research data for are collected for the period of 2006–2015 from official sources in relation to the 30 provinces in China Mainland, including the China Statistical Yearbook (2007–2016) and China Energy Statistical Yearbook (2007–2016).
3.1. Selection of Input and Output Indicators
To apply the research methods described in Section 2, a set of input-output indicators need to be selected. Figure 1 presents a framework on the input-output dimensions for measuring the efficiency of an urbanization system. The figure shows that there are five dimensional inputs in an urbanization system, namely, capital, labor, land, water resource, and energy. By referring to previous studies, the indicators for measuring the scale of these input dimensions are selected, as shown in Table 1.
For the output dimensions, as presented in Figure 1, the desirable outputs include six major aspects, namely, population aggregation, economy increment, urbanization habitation, urban living standard, urban landscaping, and urban-rural integration. By referring to previous studies, the indicators for measuring these desirable outputs are selected, as listed in Table 2.
These output aspects are considered important to reflect the performance of urbanization from social and economic perspectives. The two aspects of population aggregation and economic increment need to be further elaborated. In referring to population aggregation, it is measured by urbanization rate (O1), which is defined as the ratio of urban resident population to the total population in a given province or area. In China, urban resident populations are divided into those registered with urban “hukou” and those rural-to-urban migrants without urban “hukou”. The two groups of population are included in this study in the calculation of urbanization rate. This approach reflects the population aggregated in urbanized area and it is widely adopted in defining urbanization rate in previous studies [27,31,59]. In referring to the output aspect of economic increment, it is measured by non-agricultural GDP (O2), which is the GDP value of secondary and tertiary industries.
The most typical undesirable outputs brought by urbanization process include greenhouse gases emission and water pollution, as well appreciated in previous studies [67,68,69,70]. The indicator CO2 emission (O8) is employed to measure the level of greenhouse gases emission [26,37], and waste water discharge (O9) is selected for measuring the level of water pollution [52,69]. CO2 emission is the most significant cause to global warming. The scale of CO2 emission is much larger than that of the emission from other types of pollutant gases such as NOx and SO2. For example, the CO2 emission in Beijing in 2015 was 6257 × 104 ton, whilst there was only 13 × 104 ton for the NOX and 7 × 10⁴ ton for the SO2 [71]. On the other hand, the discharge of waste water during the urbanization process affects significantly the public health and ecological integrity, which becomes a prominent challenge to be addressed for sustainable development [69]. In fact, water is vulnerable to be overexploited and polluted by anthropogenic activities. Therefore, it is considered reasonable to adopt CO2 emission and total waste water discharge to measure the undesirable output of urbanization process in this study.
3.2. Data Processing
In referring to the indicators listed in Table 1 and 2, their performance data in 30 provinces in China for the time period 2006–2015 are collected from the China Statistical Yearbook (2007–2016) and China Energy Statistical Yearbook (2007–2016). It is necessary to note that the monetary variables are converted into 2005 constant prices, in which I1 is deflated with price index of investment in fixed assets, O2 is deflated with GDP deflators, O4 is deflated with consumer price index (CPI), and O5 is deflated with total wage index of employed persons in urban units.
There are no official data available about the undesirable output “CO2 emissions” (O8) at the provincial level in China. As an alternative, the CO2 emission calculation guideline published by the Intergovernmental Panel on Climate Change (IPCC) [72] is used. In using IPCC guideline, CO2 emissions from burning fossil fuels can be estimated by adopting the following formula (6):
where denotes the total CO2 emissions in year t for a specific province from n types of fossil fuel consumption. Eight types of fossil fuel are considered in this study, including raw coal, crude oil, gasoline, kerosene, diesel oil, fuel oil, liquefied Petroleum gases, and natural gas. denotes the total consumption of fossil fuel in the year , indicates the lower calorific value of the fuel , represents the carbon emission factor of fossil fuel , and is the oxidation rate of the carbonaceous fuel . The coefficient (44/12) in model (6) denotes the ratio of the molecular weight of CO2 (44) to the molecular weight of carbon (12).
According to the report published by the Energy Research Institute (ERI) under the National Development and Reform Commission [73], the coefficients of the eight types of carbonaceous fuels in China are obtained, as shown in Table 3. As a result, the data for O8 for each individual province can be processed and obtained.
4. Data Analysis
According to the methods described in Section 2 and the research data presented in Section 3, with the assistance of computer programme Max DEA, the values of (urbanization efficiency) and MPI (dynamic changes of urbanization efficiency) for the 30 provinces in China during the surveyed period are calculated. Table 6 and Table 7 present the results of and MPI respectively. From Table 6, it can be seen that the performance of urbanization efficiency varies considerably between individual provinces. But Table 7 suggests that most of the surveyed provinces have been showing certain degree of improvement.
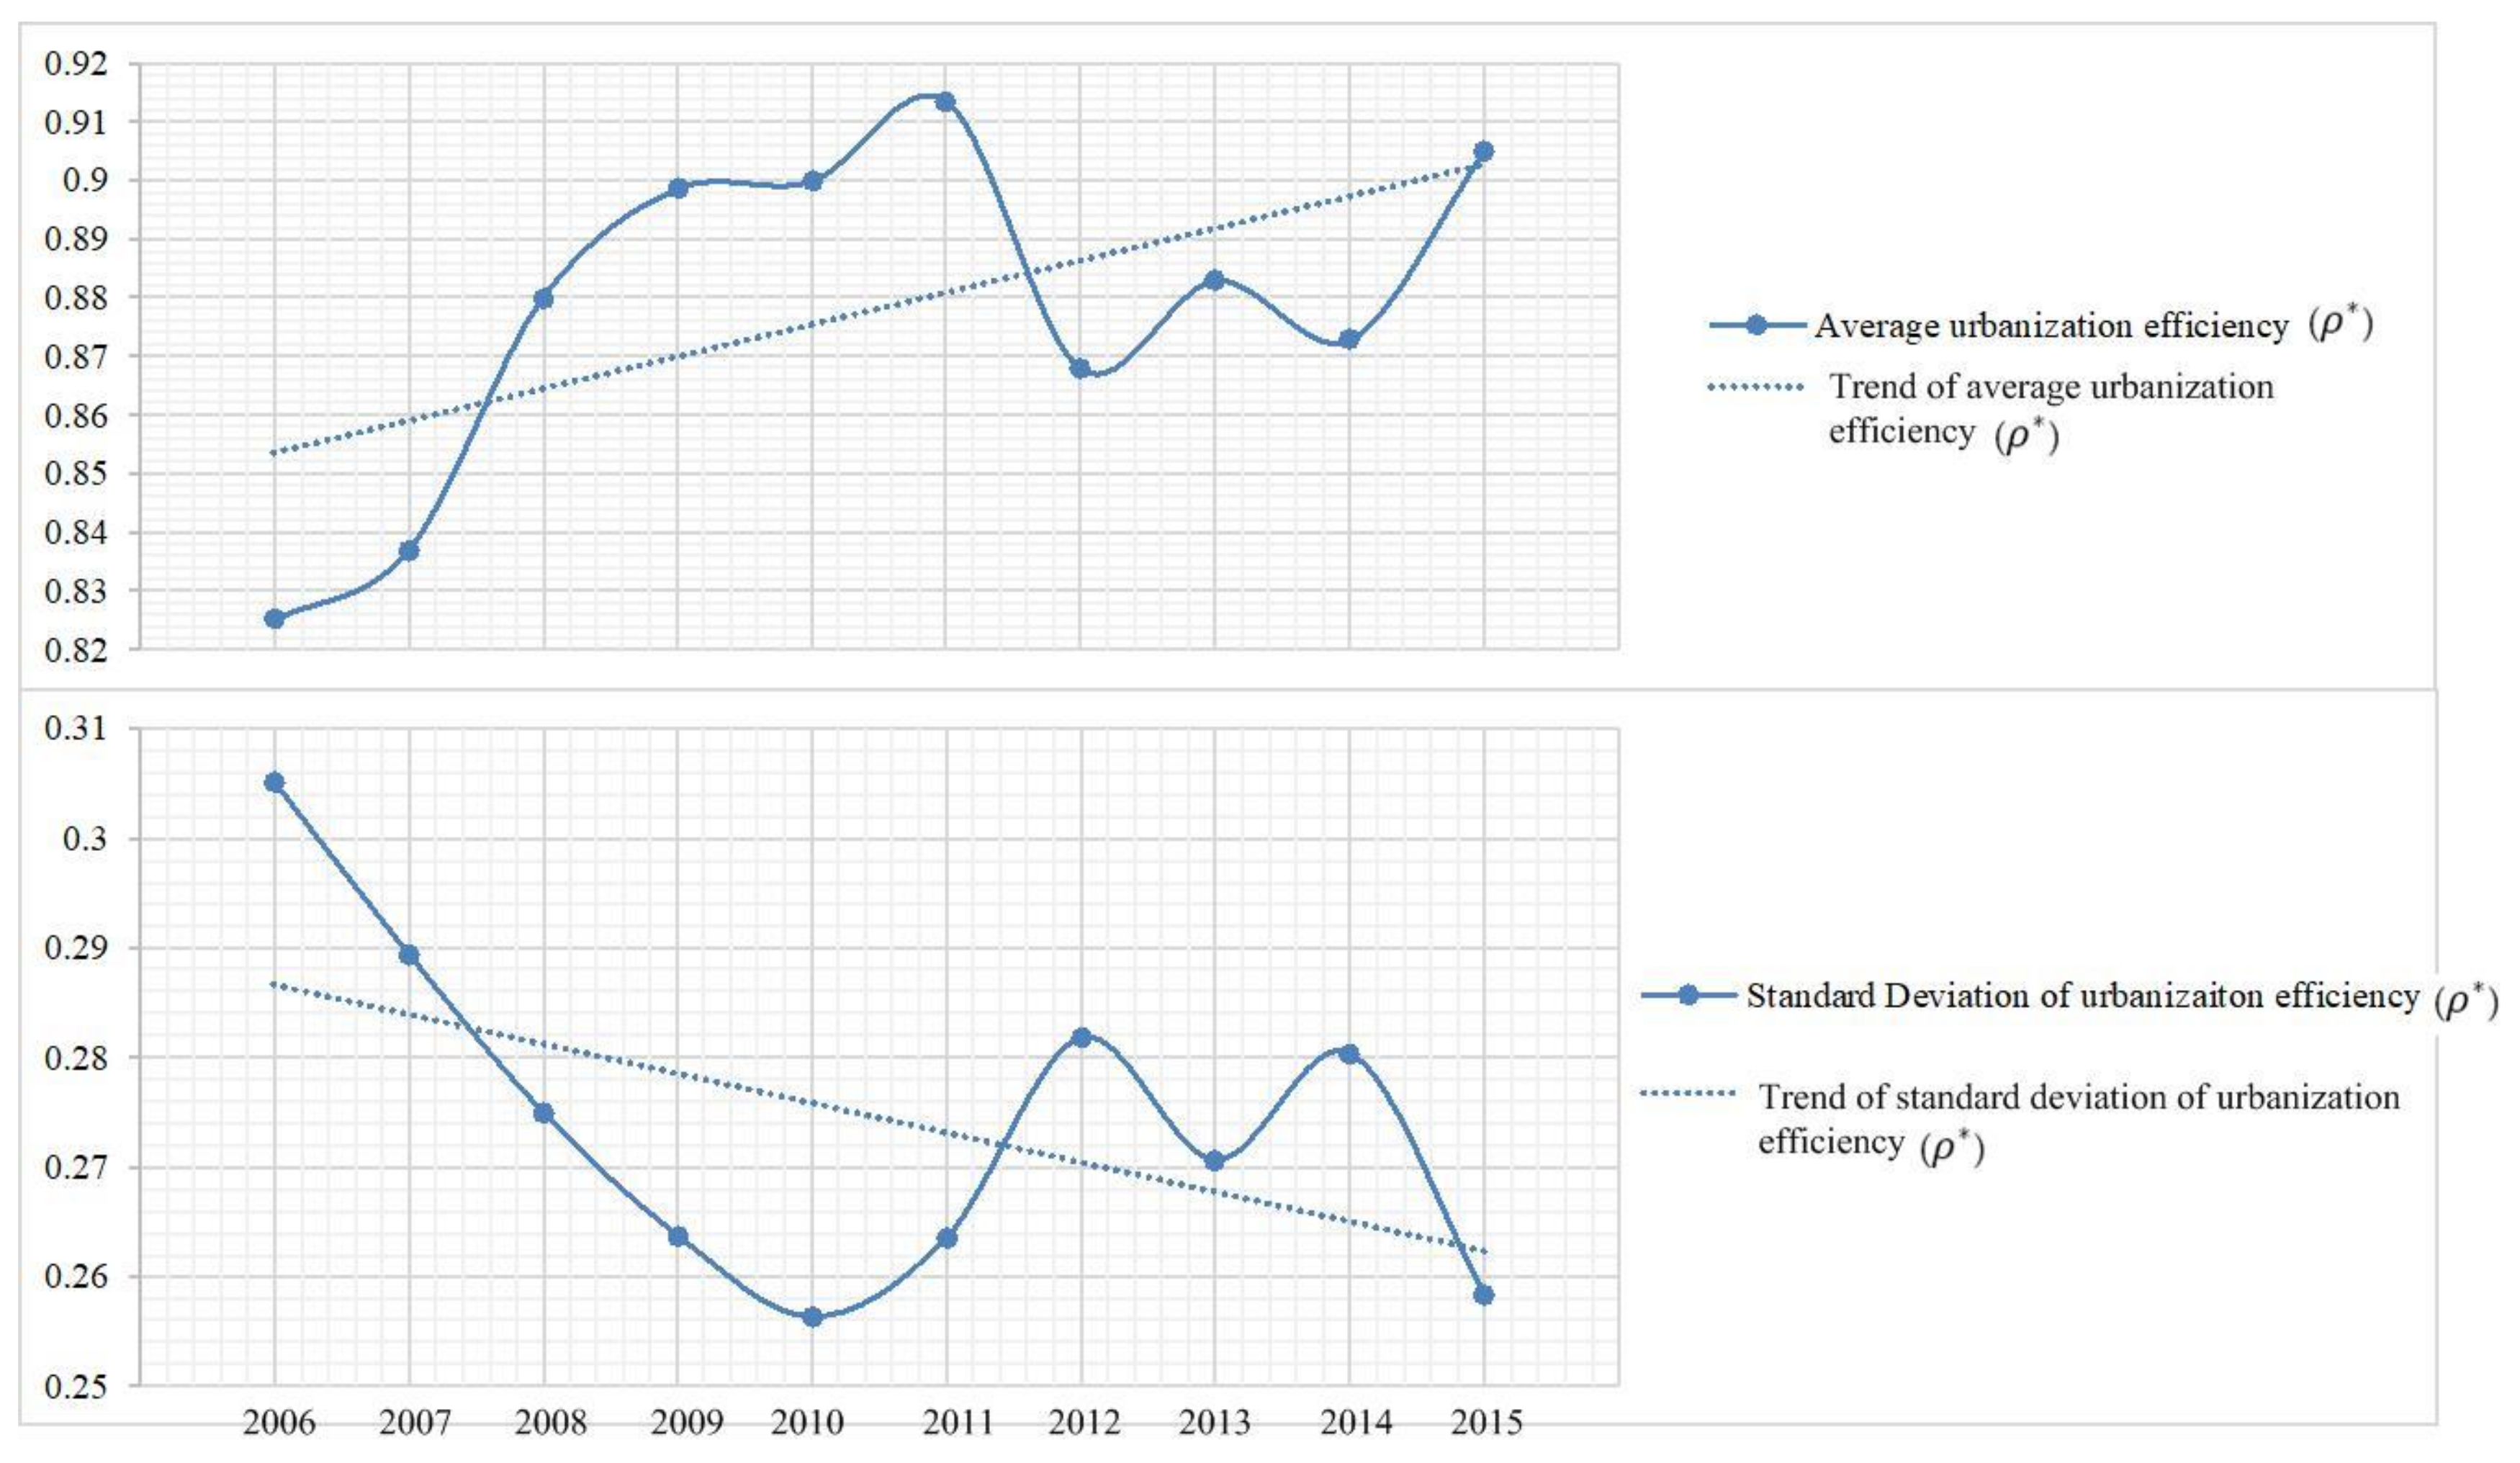
The results about the national average and standard deviation of in Table 6 can be presented graphically in Figure 2, suggesting that the average performance is improving at national level. It also demonstrates that the deviation in performance between provinces has been narrowing. Furthermore, by employing the data in Table 7, Figure 3 can be produced to illustrate the annual average performance and the standard deviation of MPI between the 30 surveyed provinces. Figure 3 suggests a moderate efficiency increment at national level during 2006–2015, whilst a difference in making progress on efficiency performance remains between different provinces.
5. Discussion
5.1. The Urbanization Efficiency Performance from National Perspective
According to Table 6, the average performance in urbanization efficiency at national level across the period 2006 to 2015 is relatively low, with the efficiency value = 0.8782. The information at provincial level in Table 6 can be further demonstrated graphically in Figure 4. It can be seen from the figure that urbanization efficiency varies significantly both horizontally (between provinces) and vertically (between years during the surveyed period). In general, Eastern provinces have relatively better performance. This may be attributed mainly by the advancement of technologies, economic performance, and social welfare systems in these provinces. In particular, the advanced social welfare system in these provinces allows the benefit-sharing of rural-to-urban migrants, such as the accessibility to urban public housing and education opportunities.
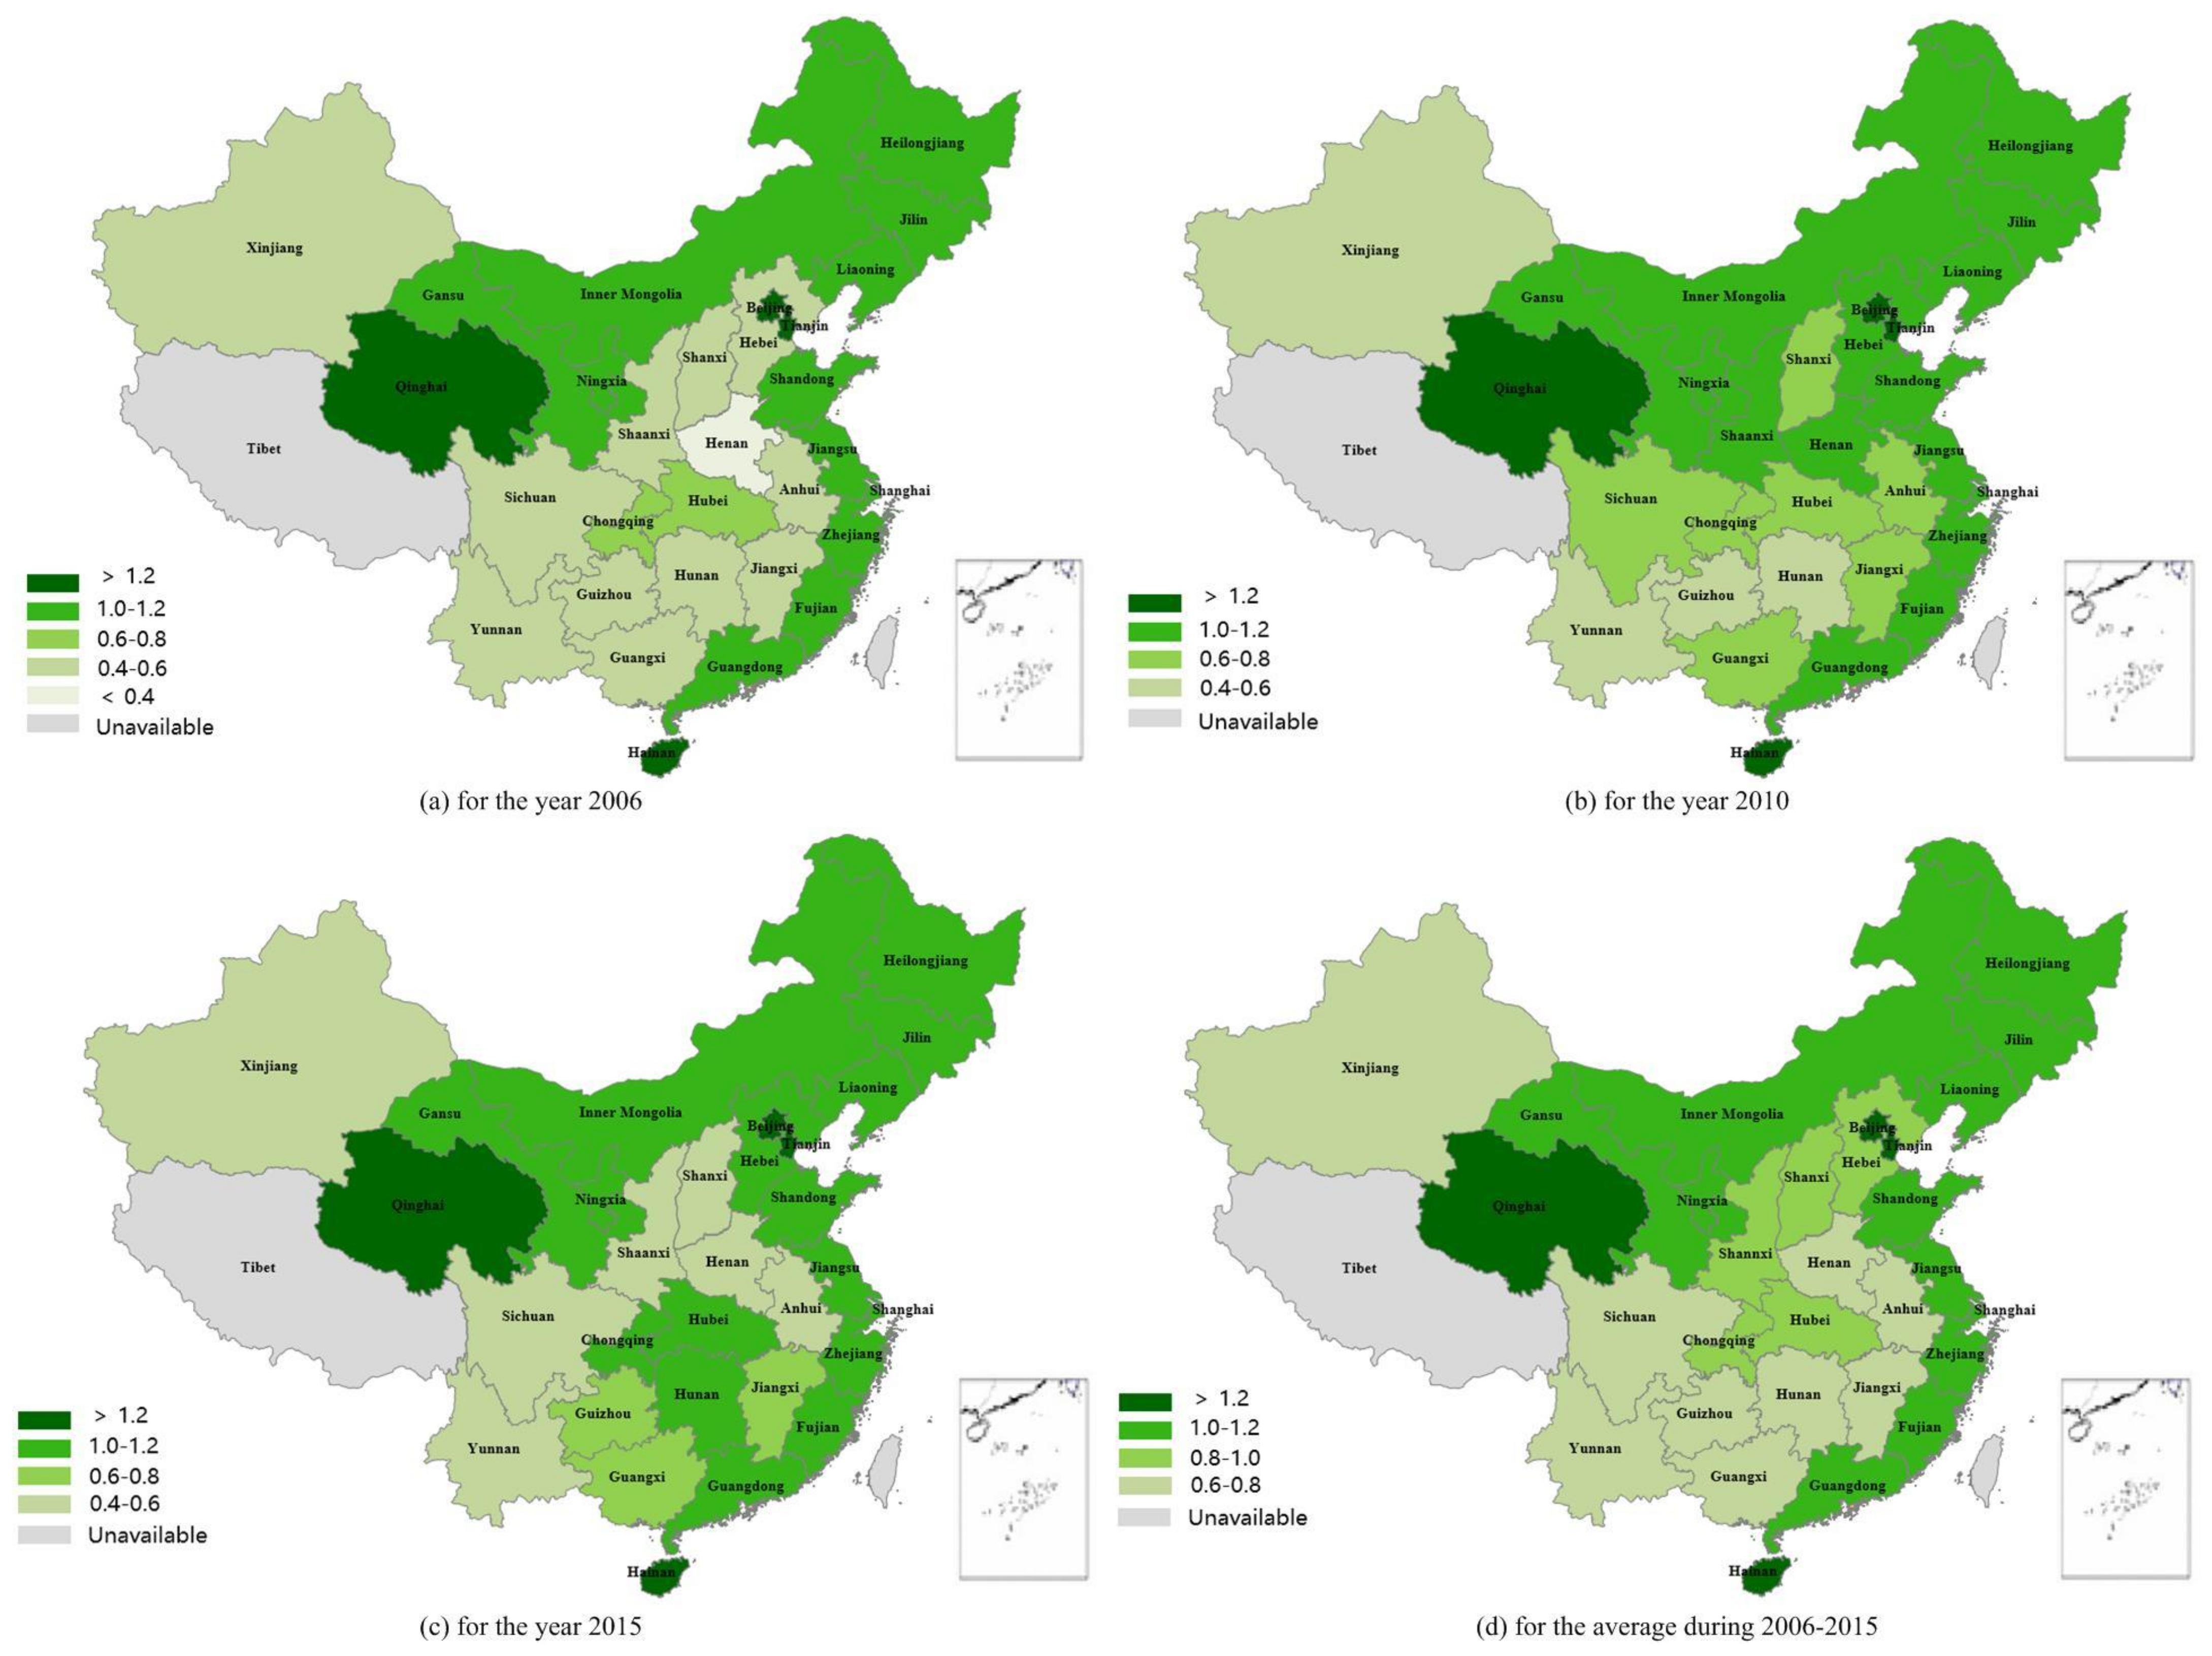
Furthermore, the information in Table 6 can be plotted on to a map of China to obtain an understanding on the spatial distribution of urbanization efficiency across the country, as shown in Figure 5. Figure 5a–d present the spatial distribution for the sample years of 2006, 2010, and 2015, and for the average performance of the whole surveyed period, respectively. It can be seen that in the year 2006, sixteen provinces achieved good urbanization efficiency (with ), including Beijing, Tianjin, Liaoning, Jilin, Heilongjiang, Shanghai, Jiangsu, Zhejiang, Fujian, Guangdong, Hainan, Inner Mongolia, Shandong, Gansu, Qinghai, and Ningxia. The number of the good performing provinces increased to nineteen in 2010, and to twenty in 2015. These facts indicate that the overall performance of urbanization efficiency in China has been improving with good progress.
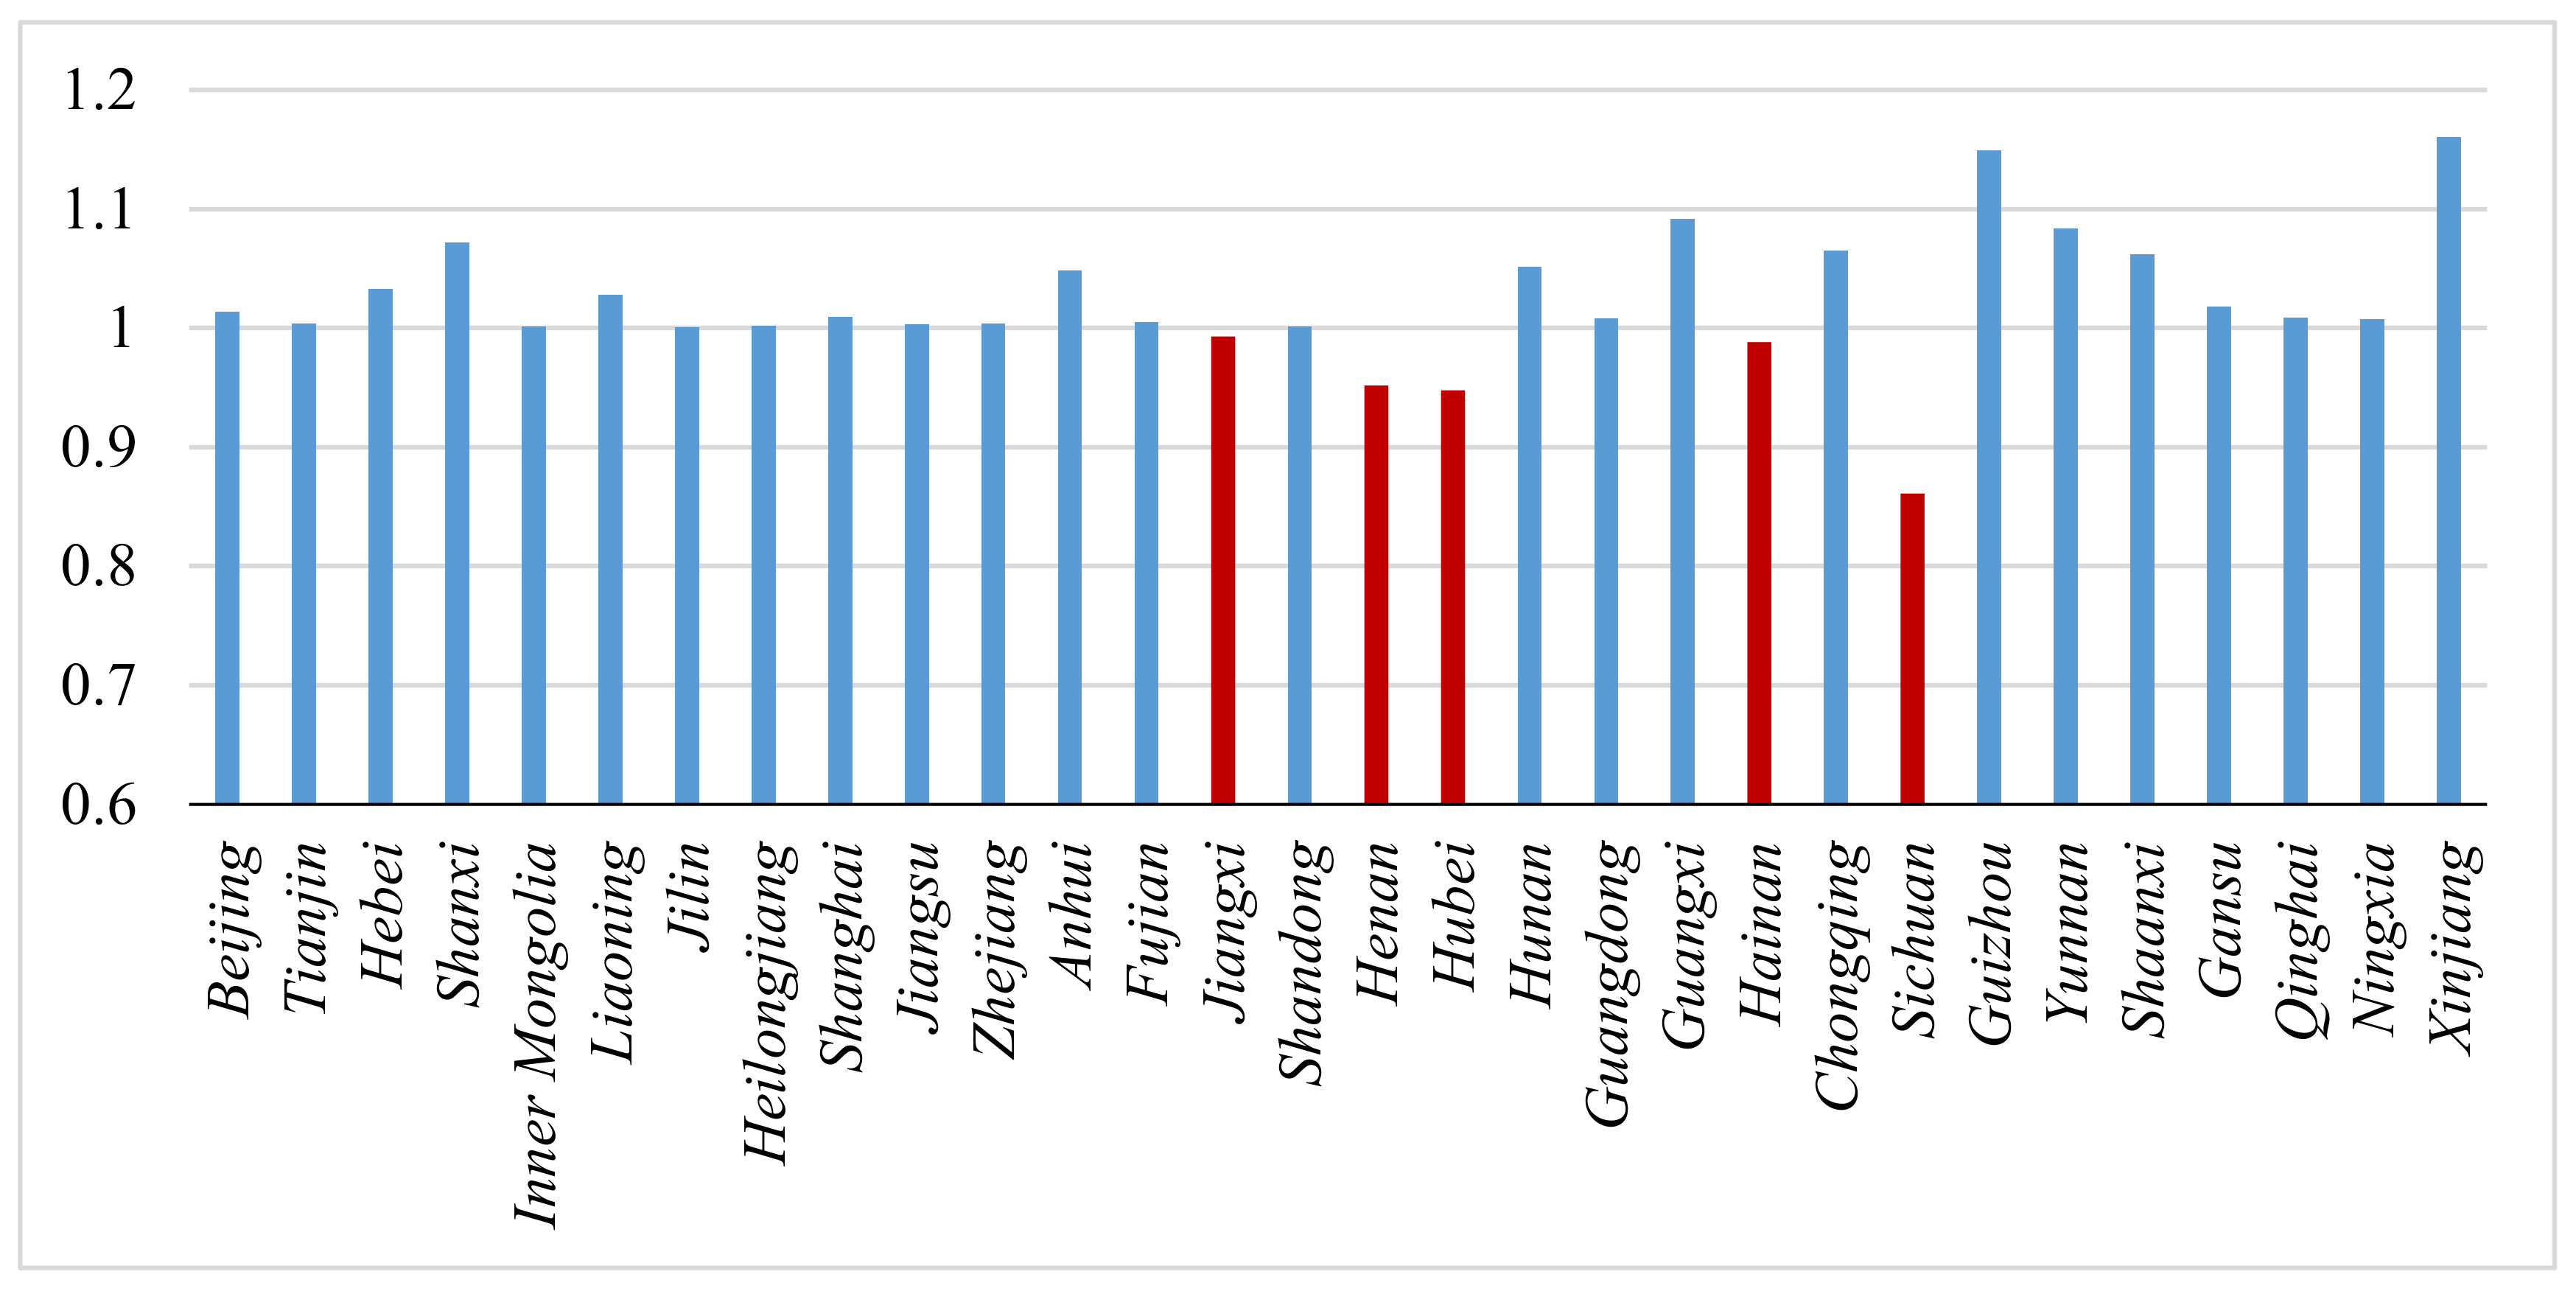
The improvement of urbanization efficiency in China can also be evidenced by the values of MPI, namely, the dynamic changes of urbanization efficiency, as shown in Table 7. The table shows that the overall average MPI across the country is reasonably good with an average MPI value of 1.0225, and most of the surveyed provinces have obtained the annual average MPI values of larger than 1. By using the data in Table 7, Figure 6 can be produced to demonstrate graphically the improvement between the surveyed provinces during 2006–2015. The figure tells that most of the provinces have gained a positive improvement (with MPI > 1) except Jiangxi, Henan, Hubei, Hainan, and Sichuan.
The improvement in urbanization efficiency in China is attributed to many factors, such as the improvement of technologies to increase productivity and mitigate the discharge of waste water and CO2 emission. It appears that there is significant improvement in reducing both CO2 emission and waste water. Based on the data presented in Section 3, the annual increase rate of CO2 emission in China declined significantly from 6.29% for 2006–2007 to 1.66% for 2014–2015. The annual increase rate of waste water discharge decreased from 8.23% for 2006–2007 to 2.67% for 2014–2015. The Chinese government has implemented various policies for improving urbanization efficiency in its Eleventh and Twelfth Five-year Plans. For instance, the policies implemented by the Ministry of Housing and Urban-Rural Development in the Eleventh Five-year Plan has limited the scale of land acquisition for urban sprawl but raised the criteria for the quality of urbanization [74,75]. The Chinese Central Government has introduced a policy in 2013 for providing better housing conditions as well as other social welfares to those populations who migrated to the cities from rural areas [76]. As pilot practice, some local governments have played down the effects of “hukou” system for allowing more free mobility of the population within the local territory and improving the welfare of the rural migrants [77]. For example, the government of Guangdong province has introduced policy measures to allow rural migrants share the benefits of health care, housing insurance, pension welfare, and other public service [78]. The “New-type Urbanization Plan (2014–2020)” published by China State Council has emphasized the priority of building up social welfare system for both rural and urban residents in the process of implementing further urbanization programs [79]. It is considered that these policy measurements have made good contributions to the improvement of urbanization efficiency through increasing desirable outputs of O1, O5, O6, and O7 and reducing undesirable outputs of O8 and O9. According to the statistics described in Section 3, the average green coverage in built-up area increased from 33.52% to 38.99% nationwide during the surveyed period. The income ratio of rural to urban residents has increased from 33.19% to 39.43%, indicating significant progress in urban-rural integration during the urbanization development.
5.2. The Urbanization Efficiency Performance at Regional Level
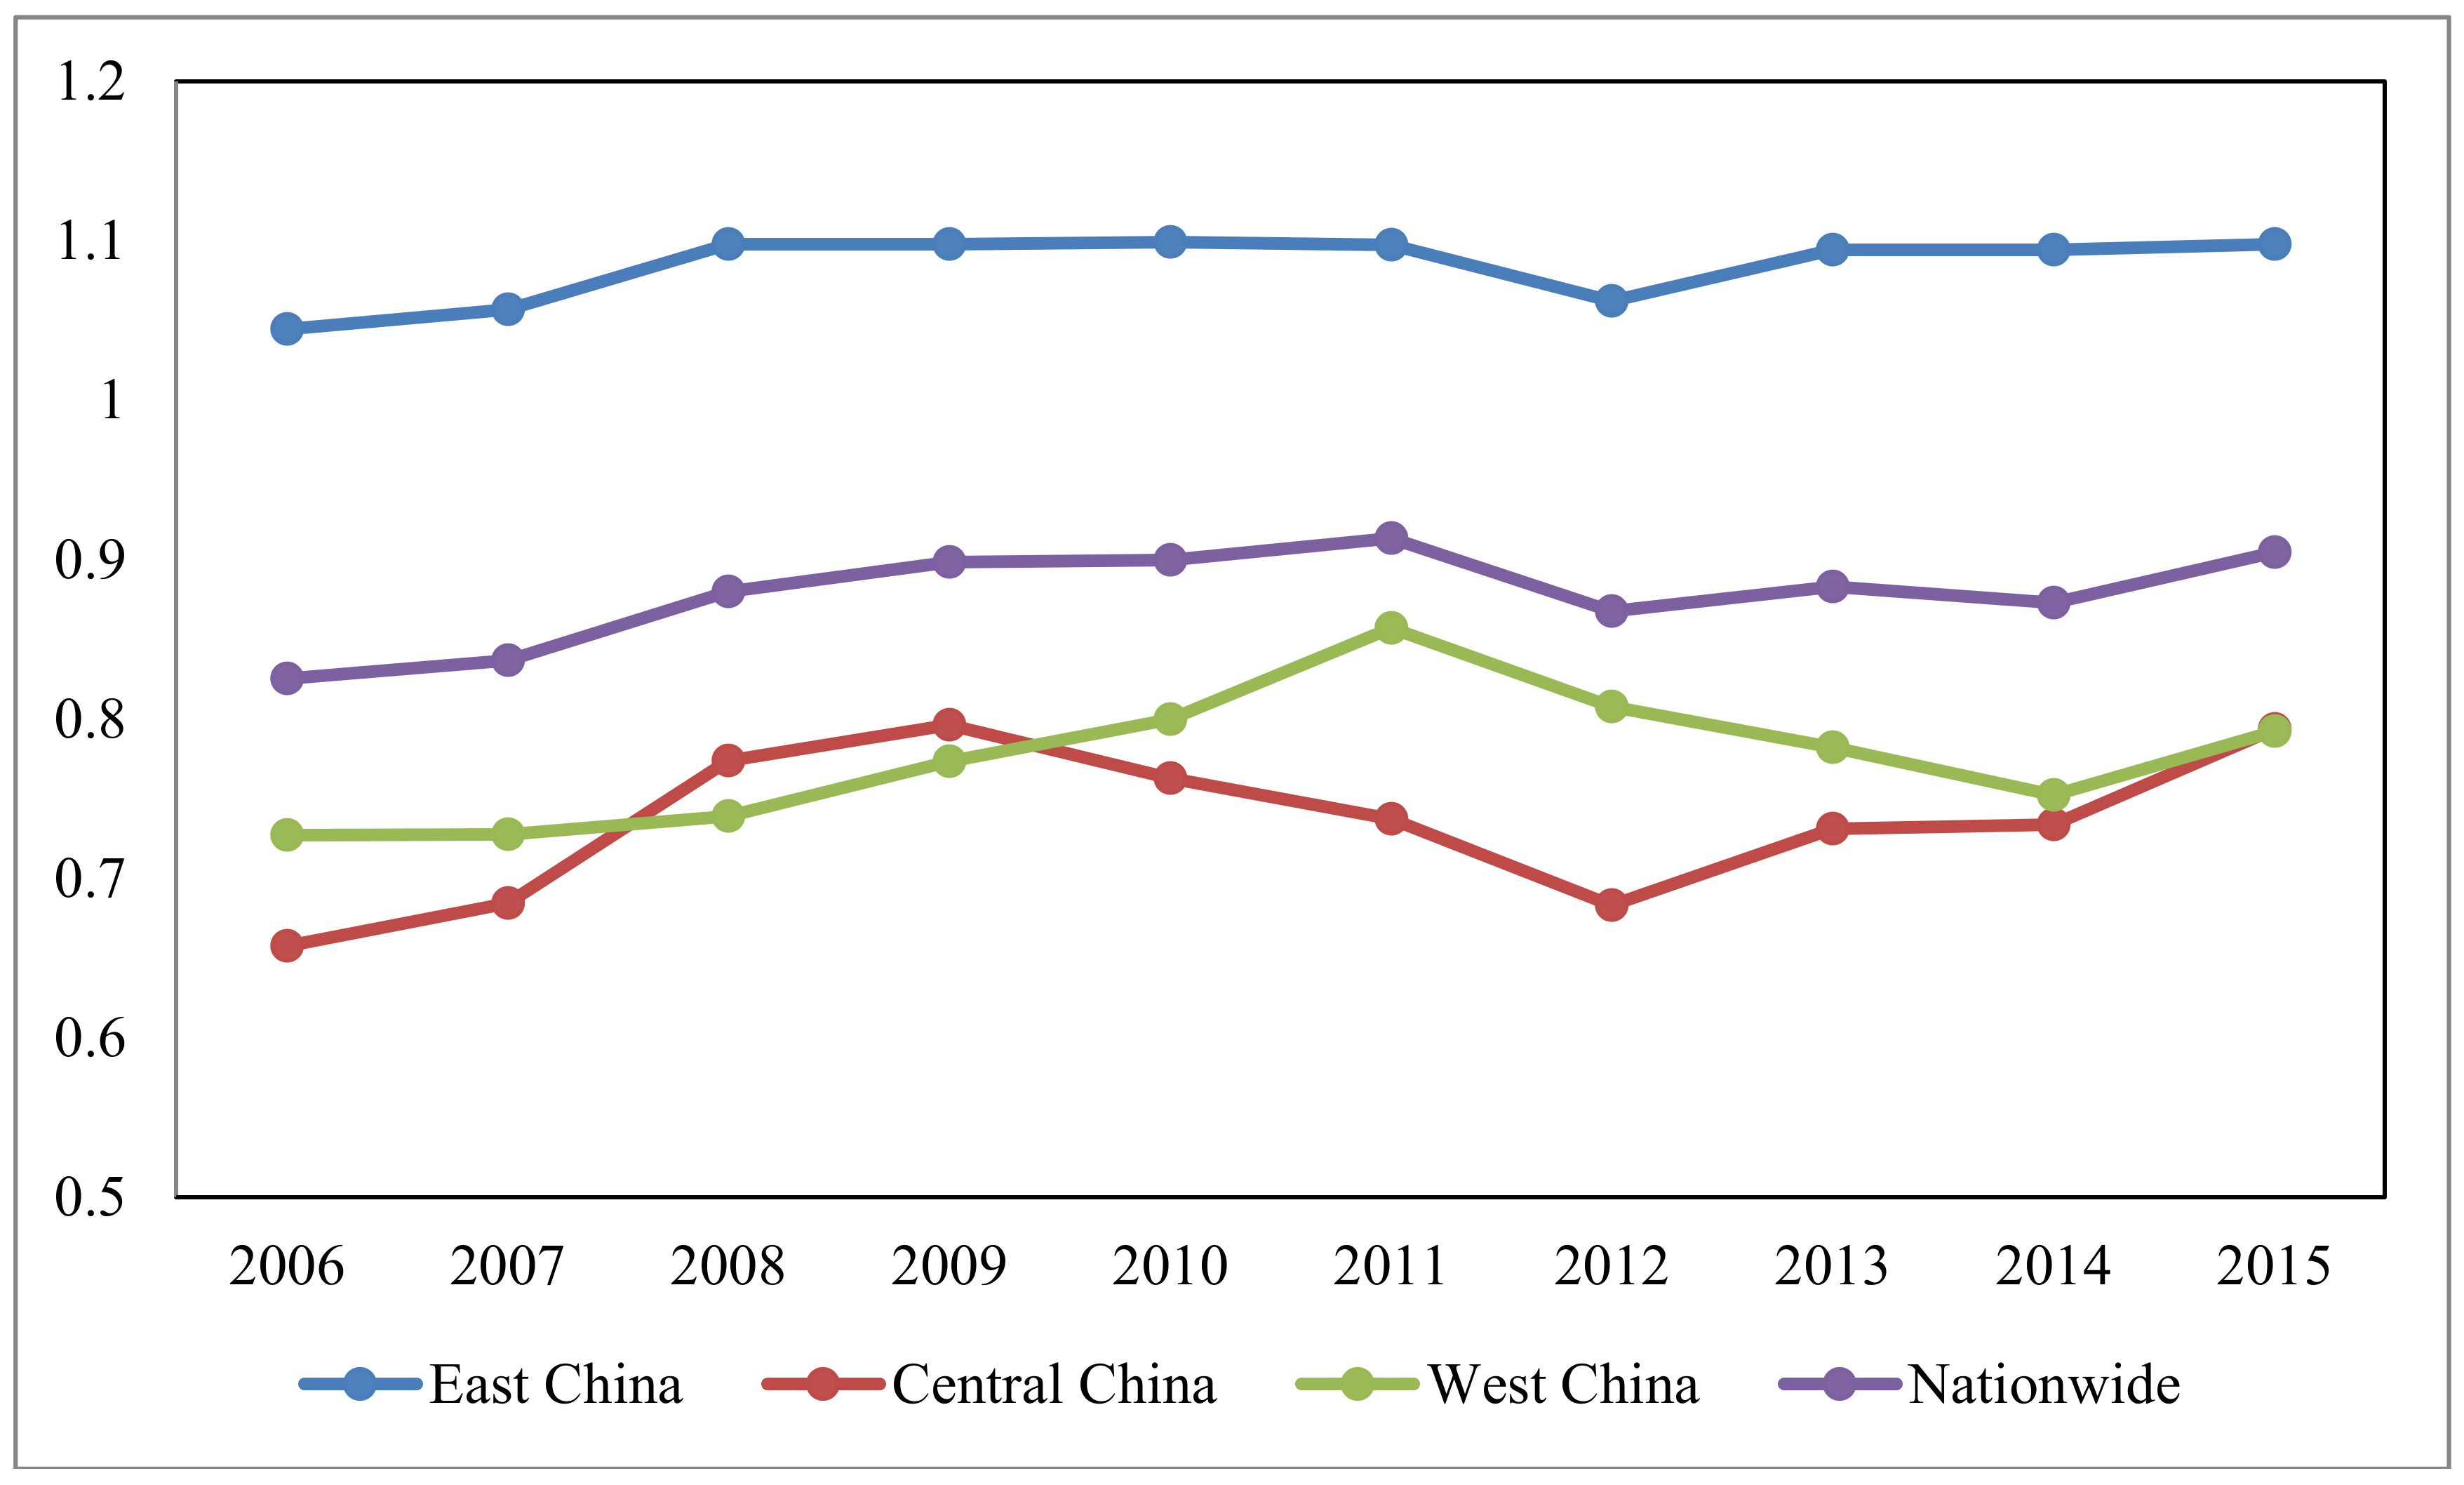
China is divided into Eastern, Central, and Western regions according to the zoning division defined by the Chinese National Development and Reform Commission (NDRC) [80]. The East part of China includes eleven provinces, namely Beijing, Tianjin, Hebei, Liaoning, Shanghai, Zhejiang, Fujian, Shandong, Guangdong, and Hainan. The Central China includes Shanxi, Jilin, Heilongjiang, Anhui, Jiangxi, Henan, Hubei, and Hunan. The West China includes Inner Mongolia, Guangxi, Chongqing, Sichuan, Guizhou, Yunnan, Shaanxi, and Tibet (Tibet is excluded for analysis in this study due to the unavailability of data). It can be seen from Figure 4 and Figure 5 that there are significant differences in the performance of urbanization efficiency between these three regions. By applying the data in Table 6, the average urbanization efficiency within each region can be obtained, as shown in Figure 7. The figure shows that the urbanization efficiency in East China is much better than that in Central and West regions. East China has much more advanced technologies and management skills than that of Central and West part of China [26,36,81]. The social economy in the East part is also much more advanced, thus the provinces in this region have better affordability in improving urbanization efficiency. According to the data described in Section 3, the average per capita non-agricultural GDP in East China is over 39,800 RMB, whilst it is only about 17,600 in the West part. The average carbon emission per unit GDP in East China is 0.55 ton/104 RMB, whilst it is 0.98 ton/104 RMB in West China.
The regional divisions in China are also defined from economic performance perspective, including eight economic zones [82], namely, Northeast (Liaoning, Jilin, Heilongjiang), North Coast (Beijing, Tianjin, Hebei and Shandong), East Coast (Shanghai, Jiangsu, Zhejiang), South Coast (Fujian, Guangdong, Hainan), Middle Yellow River (Shanxi, Inner Mongolia, Henan, Shaanxi), Middle Yangtze River (Anhui, Jiangxi, Hubei, Hunan), Southwest (Guangxi, Chongqing, Sichuan, Guizhou, Yunnan), and Northwest (Tibet, Gansu, Qinghai, Ningxia, Xinjiang). According to the data in Table 6, the average urbanization efficiency in those eight economic zones during the survey time period can be obtained and illustrated in Figure 8. The figure tells that South Coast zone is the best in urbanization efficiency, with the average value of 1.15. South Coast region has been making dramatic progress in improving the quality of urban development. The provinces in this region, such as Guangdong and Fujian, have been implementing actively energy-saving innovation methods [83]. The data described in Section 3 demonstrate that the energy consumption per unit of GDP in South coast region has decreased dramatically from 0.83 to 0.47 tce/104 RMB during the surveyed time period of 2006–2015. For another example, it was reported that Guangdong province has implemented the policy to allow the migrant workers to apply urban public housing without considering “hukou” and have their children registered for receiving education without extra fees, whilst these policy measures are not available in most provinces in China [78,84]. In fact, the accessibility to urban public housing and education enrollment is the fundamental need to migrants in order to allow them to integrate into urban society. Only if those migrant workers truly integrate into urban area will they consider the urban area where they live as their hometown. Then they will have a sense of not only the proudness but also the commitments to the development of the urban area. For example, they will become more active in participating in the promotion of environmental management, energy saving, and green buildings. In this regard, provinces such as Guangdong and Fujian can achieve much better performance of urbanization efficiency as they have introduced various measures to allow migrant workers have the accessibility to urban benefits.
Figure 8 also shows that the urbanization in other economic regions such as North Coast, East Coast, and Northeast is fairly efficient, with the average value of 1.097, 1.028, and 1.026, respectively, whilst Southwest zone has very poor performance with the value of 0.58. Southwest region is traditionally disadvantaged by the poor natural environment and the less-developed technology and economy [4,36,63,85]. Over last several decades, a great scale of resources, in particular the land, has been consumed in this region for urbanization and large volume of carbon emissions and waste water have been generated. According to the statistics for the year 2015, presented in Section 3, the energy consumption and the carbon emission per unit of GDP in Southwest Region were 0.70 tce/104 RMB and 0.67 ton/104 RMB, respectively, whilst these two indexes were 0.54 and 0.40 respectively in East China. This suggests that Southwest region has been adopting extensive development pattern. The disadvantages in Southwest region have in turn triggered the population outflow during the urbanization process, which is supported by “push-pull theory”. Therefore, large scale of labor force, in particular those well-educated and skillful people, have migrated from Southwest China to advanced areas such as East coast China [4]. It is considered that the shortage of well-educated labor forces contributes significantly to the poor urbanization efficiency in Southwest China.
5.3. Experiences and Lessons
The experiences gained by those good performers and the lessons received by those poor performers can be analyzed as follows.
Top performers in urbanization efficiency
According to Table 6, most of the top performers are located in East China, including Beijing, Tianjin, Shanghai, Jiangsu, Fujian, Guangdong, and Hainan. As appreciated earlier, East China has better technologies and management skills for improving urbanization efficiency. For example, Beijing and Tianjin have been promoting green buildings to reduce emissions in urban areas [86]. The data described in Section 3 suggests that the annual growth rate of carbon emission in Beijing has decreased remarkably from 7.53% in 2007 to −0.32% in 2015. This index for Tianjin was 5.94% in 2007, and reduced to 1.79% in 2015. Another good performer Guangdong has been promoting effectively energy saving and green building in the process of implementing urbanization. It was reported that Guangdong province has built more than 81 million km2 of new green buildings and renovated more than 20.5 million km2 of existing buildings to green building during the Twelfth Five-year plan (2011–2015), which is the largest scale in this perspective among all provinces in the country [87]. In fact, these top performing provinces have been introducing various measures for both increasing the desirable outputs and for reducing the inputs or undesirable outputs, thus they have achieved good performance of urbanization efficiency.
It is interesting to note that Qinghai and Ningxia are ranked as 4th and 6th in terms of urbanization efficiency whilst they are traditionally not considered as top performers in terms of social and economic development. The results suggest that those economically and socially disadvantageous regions can also achieve good performance in urbanization efficiency. On the other hand, the measurement “efficiency” is a relative measure by comparing the input and output indexes. It has been found that both Qinghai and Ningxia generated a very small scale of undesirable outputs. For the case of Qinghai, the undesirable output is very low as the province has little heavy industries. The annual average carbon emission in Qinghai province was 2062 × 104 ton during the surveyed period, whilst the national performance was 14,654 × 104 ton. The annual average waste water discharge in Qinghai was 21,235 × 104 ton, whilst the national performance of this was 211,200 × 104 ton. Therefore, it is considered that the low level of undesirable outputs is the major contributor to the good performance of the urbanization efficiency enjoyed by these two provinces.
Another interesting case is Heilongjiang, which is ranked 7th. In fact, the economy of Heilongjiang is considered not advanced according to the official statistics in comparing to those advanced provinces. For example, according to the data described in Section 3, the per capita non-agricultural GDP in Heilongjiang in 2015 was 34,400 RMB, whilst it was 95,000 RMB in Tianjin and 78,700 RMB in Beijing. Heilongjiang has been implementing a different mode for urbanization development. Historically, Heilongjiang has established many agriculture-oriented townships. The local farmers have been instructed to relocate to nearby towns and commute to their farms to work. By concentrating the dispersed rural population in a number of agricultural townships, the government aims to improve the farmers’ housing conditions and accessibility to public services, and at the same time to stimulate economic development by freeing more land for farming. This type of township-oriented development mode is distinct from the city-centered urbanization mode. The township-oriented development mode allows that both urban construction and agrarian development coexist and is able to ensure better integration between urban and rural areas [88]. Therefore, the urbanization process in this province is not dominated by developing urban infrastructures and heavy industries. Accordingly, there is less carbon emission and waste water generated.
There are also case provinces where the urbanization efficiency has been improved significantly during the surveyed period whilst they are not ranked as top good performers, such as Hebei. The data in Table 6 shows that Hebei was ranked 29th in 2006 but moved up to 17th in 2015. In taking the opportunity of implementing urbanization, Hebei province has restructured the composition of their economic sectors by increasing the proportion of tertiary industry and reducing secondary industry. It was reported that the secondary industry accounted for more than 53% in Hebei in 2006 and reduced to 48% in 2015 [71]. The reduction of secondary industry, particularly those heavy industries which are large emitters, contributes significantly to the emission reduction. According to the statistics described in Section 3, the carbon emission per unit of GDP in Hebei province declined significantly from 1.26 to 0.69 ton/104 RMB during 2006–2015. It appears that Hebei province has adopted effectively energy saving strategy. The data in Section 3 also shows that the energy consumption per unit of GDP in this province was 1.89 tce/104 RMB in 2006, and decreased to 0.98 tce/104 RMB by the year 2015.
In summary, the typical experiences gained in these top performers in obtaining good urbanization efficiency performance include less reliance on the secondary and heavy industry, the implementation on energy saving and technology innovation, promotion of green buildings, the provision of employment opportunities, and welfare to urban residents, particularly to the migrant workers.
Bottom players in urbanization efficiency
There are a number of provinces where the urbanization efficiency is very poor, such as Yunnan, Sichuan, Guizhou, Guangxi, and Xinjiang, the five bottom players, as shown in Table 6. All these bottom performers are from the West part of the country. These provinces are relatively poor in terms of economic and social development, and they have less resources invested on technology innovation in urbanization process. For example, according to the official statistics, the investment on research and development (R&D) by industrial enterprises in Yunnan province was 619,588 × 104 RMB in the year 2015, whilst this index was 2,440,875 × 104 RMB in Beijing and 3,526,665 in Tianjin, respectively, in the same year [71]. The economy for the bottom performer is largely characterized with extensive development pattern. In other words, the economy in these provinces is driven mainly by consuming resources for development with the dominance of heavy industry, which generates great amount of emissions. For example, the carbon emission per unit of GDP was 1.16 ton/104 RMB in Xinjiang in 2015, whilst it was only 0.27 ton/104 RMB in Beijing. The energy consumption per unit of GDP in Guizhou is 0.95 tce/104 RMB, whilst this index is only 0.29 tce/104 RMB in Beijing. As less resources are contributed to improving technology development and management skills, the productivity in these provinces is low. It was reported that the per capita non-agricultural GDP in Guizhou was 16,800 RMB in 2015, whilst it was 95,000 RMB in Tianjin. Furthermore, as appreciated early, the provinces in West China have been facing with the challenges of brain-drain and the outflow of labor forces [4,63,85]. It is difficult, if not impossible, to improve urbanization efficiency without talents’ contributions.
In summary, the lessons received in those poor performers in urbanization efficiency are in multiple aspects, typically including the lag of technology innovation, the adoption of extensive development pattern, the insufficiency of resources invested on public facilities, and the loss of talents and labor forces.
The above discussions indicate that the central government in China should introduce policies to promote the transfer of technologies and experiences from those good performers to the poor ones in further urbanization process. With the promotion of these technologies and experience in those poor performance provinces, they can generate more desirable outputs whilst consuming less resources and producing less emissions. In turn, they can contribute to the improvement of the overall efficiency and sustainability of the urbanization process in China.
6. Conclusions
Urbanization is an “input-output” system process. This study suggests that the input-output indicators should incorporate both desirable and undesirable outputs in order to measure properly the efficiency of urbanization. By using a set of holistic input-output indicators, this study has examined the urbanization efficiency in the context of China. The findings demonstrate that the overall efficiency in the fast urbanization era in China is relatively low, but a moderate level of improvement has been achieved. At both the regional and provincial levels, the differences between good and poor performers are very significant. In general, the provinces with well-established social and economic foundation have good performance, such as Beijing, Tianjin, Guangdong, Shanghai, Fujian, and Jiangsu. The bottom players include Yunnan, Sichuan, Guizhou, Guangxi, Xinjiang, and Henan. At the regional level, it appears that Eastern China is the best region, followed by Central and Western parts, and the Southwest region has the worst performance.
The implementation of urbanization in the past years in China has presented both good experiences and problematic lessons. Exemplary measures include restructuring the composition of industrial sectors, adopting energy saving policies, promoting green building, improving the quality of public services and infrastructures, allowing migrant workers share urban benefits, encouraging the migrants to integrate into urban society by playing down “hukou” effects, and others. All these are found effective for raising urbanization efficiency. On the other hand, the typical lessons have also been received from the urbanization practice in those poor performers, for example, the adoption of extensive development pattern, the phenomenon of brain-drain, the lower priority given to technology innovation, and others.
Urbanization is adopted as the driving engine for development in the contemporary time particularly in those large developing countries such as China. However, only if the scheme of urbanization is efficient can it make contributions to the mission of sustainable development for either a region or nation. This study provides important references for understanding the efficiency of the ongoing fast urbanization in China. By appreciating that the fast urbanization has poor efficiency in general, the Chinese central government can review the ongoing urbanization practice and introduce measures to improve the efficiency. The understanding of the variations of urbanization efficiency between different regions and provinces helps the local governments formulate policy measures to improve their urbanization practice, by considering both the good experiences gained in those good performers and the problematic lessons encountered by those poor performers. Furthermore, this study also makes valuable contributions to the development of literature in the discipline of urbanization efficiency. It particularly highlights the importance of incorporating undesirable outputs into the traditional assessment approach for examining urbanization efficiency. The research framework adopted can be further applied for studying the efficiency of urban development in other countries.
Nevertheless, the authors appreciate that several significant issues associated with urbanization efficiency, particularly in the context of China, have not been fully investigated, such as land acquisition for urban sprawl, housing conditions, and urban benefits for rural-urban migrants. Whilst these issues have been addressed in discussions in Section 5, it is recommended to investigate them in details in future study. Other issues, such as comparison on the factors affecting urbanization efficiency between different countries at international level and the effectiveness of different policy instruments for improving urbanization efficiency under different circumstances, are also recommended as important research questions for future study.
Author Contributions
Conceptualization, Y.R. and L.S.; methodology, H.L. and Y.Z.; software, J.W.; validation, Y.R., Y.C. and Y.Z.; formal analysis, Y.R.; investigation, Y.R. and L.S.; resources, L.S. and H.L.; writing—original draft preparation, Y.R.; writing—review and editing, L.S.; supervision, H.L. and L.S.; funding acquisition, L.S. and H.L.
Funding
This research was funded by National Social Science Foundation of China, grant number 17ZDA062, 15AZDO25 and 15BJY038.
Acknowledgments
This study was supported by the National Social Science Foundation of China (Grant No. 17ZDA062, 15AZDO25 and 15BJY038). The authors also would like to appreciate the editors and the three anonymous reviewers for their constructive comments and advice.
Conflicts of Interest
The authors declare no conflict of interest.
References
- Chan, K.W.; Hu, Y. Urbanization in China in the 1990s: New definition, different series, and revised trends. China Rev. 2003, 3, 49–71. [Google Scholar]
- Shen, L.; Ren, Y.; Xiong, N.; Li, H.; Chen, Y. Why small towns can not share the benefits of urbanization in China? J. Clean. Prod. 2018, 174, 728–738. [Google Scholar] [CrossRef]
- World Bank Open Data. 2017. Available online: http://data.worldbank.org/ (accessed on 30 March 2018).
- Miller, T. China’s Urban Billion: The Story Behind the Biggest Migration in Human History; Zed Books Ltd.: London, UK, 2012. [Google Scholar]
- International Monetary Fund. 2016. Available online: http://www.imf.org/external/index.htm (accessed on 30 March 2018).
- Bakirtas, T.; Akpolat, A.G. The Relationship between Energy Consumption, Urbanization, and Economic Growth in New Emerging-Market Countries. Energy 2018, 147, 110–121. [Google Scholar] [CrossRef]
- Guan, X.; Wei, H.; Lu, S.; Dai, Q.; Su, H. Assessment on the urbanization strategy in China: Achievements, challenges and reflections. Habitat Int. 2018, 71, 97–109. [Google Scholar] [CrossRef]
- Jiang, Y.; Mohabir, N.; Ma, R.; Zhu, P. Sorting through Neoliberal Variations of Ghost Cities in China. Land Use Policy 2017, 69, 445–453. [Google Scholar] [CrossRef]
- Zheng, Q.; Deng, J.; Jiang, R.; Wang, K.; Xue, X.; Lin, Y.; Huang, Z.; Shen, Z.; Li, J.; Shahtahmassebi, A.R. Monitoring and assessing “ghost cities” in Northeast China from the view of nighttime light remote sensing data. Habitat Int. 2017, 70, 34–42. [Google Scholar] [CrossRef]
- Peerzado, M.B.; Magsi, H.; Sheikh, M.J. Land use conflicts and urban sprawl: Conversion of agriculture lands into urbanization in Hyderabad, Pakistan. J. Saudi Soc. Agric. Sci. 2018. [Google Scholar] [CrossRef]
- Dash, N.; Balachandra, P. Benchmarking urban sustainable efficiency: A case of Indian cities. Transp. Res. Procedia 2016, 14, 1809–1818. [Google Scholar] [CrossRef]
- Elliott, R.J.; Sun, P.; Zhu, T. The direct and indirect effect of urbanization on energy intensity: A province-level study for China. Energy 2017, 123, 677–692. [Google Scholar] [CrossRef]
- Ebeke, C.H.; Etoundi, S.M.N. The Effects of Natural Resources on Urbanization, Concentration, and Living Standards in Africa. World Dev. 2017, 96, 408–417. [Google Scholar] [CrossRef]
- Yin, K.; Wang, R.; An, Q.; Yao, L.; Liang, J. Using eco-efficiency as an indicator for sustainable urban development: A case study of Chinese provincial capital cities. Ecol. Indic. 2014, 36, 665–671. [Google Scholar] [CrossRef] [Green Version]
- Hailiang, M.; Dechun, H.; Huize, Y. Total-factor energy efficiency analysis of three major economic regions in China: Based on super-DEA and Malmquist. China Pop. Resour. Environ. 2011, 21, 38–42. [Google Scholar]
- Leleu, H. A linear programming framework for free disposal hull technologies and cost functions: Primal and dual models. Eur. J. Oper. Res. 2006, 168, 340–344. [Google Scholar] [CrossRef]
- Charnes, A.; Cooper, W.W.; Rhodes, E. Measuring the efficiency of decision making units. Eur. J. Oper. Res. 1978, 2, 429–444. [Google Scholar] [CrossRef]
- Coelli, T. A multi-stage methodology for the solution of orientated DEA models. Oper. Res. Lett. 1998, 23, 143–149. [Google Scholar] [CrossRef]
- Cook, W.D.; Seiford, L.M. Data envelopment analysis (DEA)–Thirty years on. Eur. J. Oper. Res. 2009, 192, 1–17. [Google Scholar] [CrossRef]
- Eling, M.; Luhnen, M. Efficiency in the international insurance industry: A cross-country comparison. J. Bank. Financ. 2010, 34, 1497–1509. [Google Scholar] [CrossRef]
- Song, Z.J.; Zhang, Z.Y.; Yuan, M. DEA efficiency analysis of Chinese bank companies. Syst. Eng. Theory Pract. 2009, 12, 017. [Google Scholar]
- Chuanzhong, D.U.; Zhang, L. Measuring the local government efficiency of the chinese provinces with multiple-target constrains: Based on the dea model with preference. China Econ. Stud. 2015, 6, 15–25. [Google Scholar]
- Lozano, S.; Gutiérrez, E. A slacks-based network DEA efficiency analysis of European airlines. Transp. Plan. Technol. 2014, 37, 623–637. [Google Scholar] [CrossRef]
- Barbot, C.; Costa, Á.; Sochirca, E. Airlines performance in the new market context: A comparative productivity and efficiency analysis. J. Air Transp. Manag. 2008, 14, 270–274. [Google Scholar] [CrossRef] [Green Version]
- Fei, W.; Liu, X.; Yang, C. Economic and Environmental Efficiencies Based on Material Flow Analysis and Data Envelopment Analysis: A Case Study of Liaoning Province. Acta Ecol. Sin. 2015, 35, 3797–3807. [Google Scholar] [CrossRef]
- Zhang, J.; Zeng, W.; Wang, J.; Yang, F.; Jiang, H. Regional low-carbon economy efficiency in China: Analysis based on the Super-SBM model with CO2 emissions. J. Clean. Prod. 2017, 163, 202–211. [Google Scholar] [CrossRef]
- Jia, S.; Wang, C.; Li, Y.; Zhang, F.; Liu, W. The urbanization efficiency in Chengdu City: An estimation based on a three-stage DEA model. Phys. Chem. Earth Parts A/B/C 2017, 101, 59–69. [Google Scholar] [CrossRef]
- Song, L.; Zhang, Y.; Guo, Y.J. The Regional Differences and Spatial Pattern of Shaanxi Province under the Restriction of Environment. Hum. Geogr. 2016, 6, 016. [Google Scholar]
- Rongtian, Z.; Huafu, J. Measurement and spatial correlation pattern of urbanization efficiency in the Changjiang River Delta. Sci. Geogr. Sin. 2015, 35, 433–439. [Google Scholar]
- Xu, J.W.; Xu, X.Y.; Chen, X.P.; Cui, L.X.; Lu, C.P.; Xue, B. Evaluation on urban efficiencies of Gansu Province based on DEA-cross model. J. Nat. Resour. 2013, 4, 9. [Google Scholar]
- Bai, Y.; Deng, X.; Jiang, S.; Zhang, Q.; Wang, Z. Exploring the relationship between urbanization and urban eco-efficiency: Evidence from prefecture-level cities in China. J. Clean. Prod. 2017, 195, 1487–1496. [Google Scholar] [CrossRef]
- Gudipudi, R.; Lüdeke, M.K.; Rybski, D.; Kropp, J.P. Benchmarking urban eco-efficiency and urbanites’ perception. Cities 2017, 74, 109–118. [Google Scholar] [CrossRef]
- Deilmann, C.; Hennersdorf, J.; Lehmann, I.; Reißmann, D. Data envelopment analysis of urban efficiency—Interpretative methods to make DEA a heuristic tool. Ecol. Indic. 2018, 84, 607–618. [Google Scholar] [CrossRef]
- Morais, P.; Camanho, A.S. Evaluation of performance of European cities with the aim to promote quality of life improvements. Omega 2011, 39, 398–409. [Google Scholar] [CrossRef] [Green Version]
- Banker, R.D.; Charnes, A.; Cooper, W.W. Some models for estimating technical and scale inefficiencies in data envelopment analysis. Manag. Sci. 1984, 30, 1078–1092. [Google Scholar] [CrossRef]
- Li, H.; Fang, K.; Yang, W.; Wang, D.; Hong, X. Regional environmental efficiency evaluation in China: Analysis based on the Super-SBM model with undesirable outputs. Math. Comput. Model. 2013, 58, 1018–1031. [Google Scholar] [CrossRef]
- Zhou, Z.J.; Hu, J.H. Evaluation of low carbon economy development efficiency based on a super-SBM model. Resour. Sci. 2013, 35, 2457–2466. [Google Scholar]
- Tone, K. A slacks-based measure of efficiency in data envelopment analysis. Eur. J. Oper. Res. 2001, 130, 498–509. [Google Scholar] [CrossRef] [Green Version]
- Tone, K. A slacks-based measure of super-efficiency in data envelopment analysis. Eur. J. Oper. Res. 2002, 143, 32–41. [Google Scholar] [CrossRef] [Green Version]
- Tone, K. Dealing with undesirable outputs in DEA: A slacks-based measure (SBM) approach. GRIPS Res. Rep. Ser. 2003, I-2003-0005. [Google Scholar] [CrossRef]
- Malmquist, S. Index numbers and indifference surfaces. Trabajos Estadística 1953, 4, 209–242. [Google Scholar] [CrossRef]
- Färe, R.; Grosskopf, S.; Norris, M.; Zhang, Z. Productivity growth, technical progress, and efficiency change in industrialized countries. Am. Econ. Rev. 1994, 84, 66–83. [Google Scholar]
- Bian, Y.; Yang, F. Resource and environment efficiency analysis of provinces in China: A DEA approach based on Shannon’s entropy. Energy Policy 2010, 38, 1909–1917. [Google Scholar] [CrossRef]
- Chuanjiang, L.; Guiran, H. Analysis on relation of rual labor transfer and regional competitiveness: An empirical analysis by taking Chongqing as an example. China Pop. Resour. Environ. 2013, 23, 116–121. [Google Scholar]
- Zhou, Y.; Xing, X.; Fang, K.; Liang, D.; Xu, C. Environmental efficiency analysis of power industry in China based on an entropy SBM model. Energy Policy 2013, 57, 68–75. [Google Scholar] [CrossRef]
- Song, M.L.; Wang, S.H. DEA decomposition of China’s environmental efficiency based on search algorithm. Appl. Math. Comput. 2014, 247, 562–572. [Google Scholar] [CrossRef]
- Nucci, F.; Riggi, M. Labor force participation, wage rigidities, and inflation. J. Macroecon. 2018, 55, 274–292. [Google Scholar] [CrossRef]
- Chang, Y.T.; Zhang, N.; Danao, D.; Zhang, N. Environmental efficiency analysis of transportation system in China: A non-radial DEA approach. Energy Policy 2013, 58, 277–283. [Google Scholar] [CrossRef]
- Temple, J.B.; Rice, J.M.; McDonald, P.F. Mature age labour force participation and the life cycle deficit in Australia: 1981–82 to 2009–10. J. Econ. Ageing 2017, 10, 21–33. [Google Scholar] [CrossRef]
- Deilmann, C.; Lehmann, I.; Reißmann, D.; Hennersdorf, J. Data envelopment analysis of cities–Investigation of the ecological and economic efficiency of cities using a benchmarking concept from production management. Ecol. Indic. 2016, 67, 798–806. [Google Scholar] [CrossRef]
- Wang, X.J. Relative Efficiency Evaluation of Land Urbanization and Population Urbanization in China. Ecol. Econ. 2016, 32, 14–17. [Google Scholar]
- Liu, Y.; Song, Y.; Arp, H.P. Examination of the relationship between urban form and urban eco-efficiency in China. Habitat Int. 2012, 36, 171–177. [Google Scholar] [CrossRef]
- Wu, H.Q.; Shi, Y.; Xia, Q.; Zhu, W.D. Effectiveness of the policy of circular economy in China: A DEA-based analysis for the period of 11th five-year-plan. Resour. Conserv. Recycl. 2014, 83, 163–175. [Google Scholar] [CrossRef]
- Hubacek, K.; Guan, D.; Barrett, J.; Wiedmann, T. Environmental implications of urbanization and lifestyle change in China: Ecological and water footprints. J. Clean. Prod. 2009, 17, 1241–1248. [Google Scholar] [CrossRef]
- Domene, E.; Saurí, D. Urbanisation and water consumption: Influencing factors in the metropolitan region of Barcelona. Urban Stud. 2006, 43, 1605–1623. [Google Scholar] [CrossRef]
- Liu, Q.; Wang, S.; Zhang, W.; Li, J.; Zhao, Y.; Li, W. China’s municipal public infrastructure: Estimating construction levels and investment efficiency using the entropy method and a DEA model. Habitat Int. 2017, 64, 59–70. [Google Scholar] [CrossRef]
- Shahbaz, M.; Lean, H.H. Does financial development increase energy consumption? The role of industrialization and urbanization in Tunisia. Energy Policy 2012, 40, 473–479. [Google Scholar] [CrossRef] [Green Version]
- Dogan, E.; Turkekul, B. CO2 emissions, real output, energy consumption, trade, urbanization and financial development: Testing the EKC hypothesis for the USA. Environ. Sci. Pollut. Res. 2016, 23, 1203–1213. [Google Scholar] [CrossRef] [PubMed]
- Jianshuang, F.; Lei, Z.; Xiaofen, Y. The Coordination between Scale, Quality and Efficiency of Urbanization in China. J. Macro-Qual. Res. 2016, 2, 003. [Google Scholar]
- Jianshuang, F.; Xiaofen, Y.; Lihua, Z. Comprehensive Efficiency Level and Driving Factors of China’s Regional Urbanization. Sci. Geogr. Sin. 2015, 35, 1077–1085. [Google Scholar]
- Chen, M.; Lu, D.; Zha, L. The comprehensive evaluation of China’s urbanization and effects on resources and environment. J. Geogr. Sci. 2010, 20, 17–30. [Google Scholar] [CrossRef]
- Byomkesh, T.; Nakagoshi, N.; Dewan, A.M. Urbanization and green space dynamics in Greater Dhaka, Bangladesh. Landsc. Ecol. Eng. 2012, 8, 45–58. [Google Scholar] [CrossRef]
- Chen, Y.; Ren, Y.T.; Huang, Y.L.; Shen, L.Y. Indicators for Guiding Sustainable Development of Townships in Mountainous Regions in Southwest China. In Proceedings of the 21st International Symposium on Advancement of Construction Management and Real Estate; Springer: Singapore, 2017; pp. 917–926. [Google Scholar]
- Molero-Simarro, R. Inequality in China revisited. The effect of functional distribution of income on urban top incomes, the urban-rural gap and the Gini index, 1978–2015. China Econ. Rev. 2017, 42, 101–117. [Google Scholar] [CrossRef]
- Young, A. Inequality, the urban-rural gap, and migration. Q. J. Econ. 2013, 128, 1727–1785. [Google Scholar] [CrossRef]
- Al-mulali, U.; Fereidouni, H.G.; Lee, J.Y.; Sab, C.N.B.C. Exploring the relationship between urbanization, energy consumption, and CO2 emission in MENA countries. Renew. Sustain. Energy Rev. 2013, 23, 107–112. [Google Scholar] [CrossRef]
- Martínez-Zarzoso, I.; Maruotti, A. The impact of urbanization on CO2 emissions: Evidence from developing countries. Ecol. Econ. 2011, 70, 1344–1353. [Google Scholar] [CrossRef] [Green Version]
- Du, L.; Wei, C.; Cai, S. Economic development and carbon dioxide emissions in china: Provincial panel data analysis. China Econ. Rev. 2012, 23, 371–384. [Google Scholar] [CrossRef]
- Liu, L.; Wu, T.; Xu, Z.; Pan, X. The Water-Economy Nexus and Sustainable Transition of the Pearl River Delta, China (1999–2015). Sustainability 2018, 10, 2595. [Google Scholar] [CrossRef]
- Wang, J.; Da, L.; Song, K.; Li, B.L. Temporal variations of surface water quality in urban, suburban and rural areas during rapid urbanization in Shanghai, China. Environ. Pollut. 2008, 152, 387–393. [Google Scholar] [CrossRef] [PubMed]
- National Bureau of Statistics of China, 2016. Available online: http://data.stats.gov.cn/index.htm (accessed on 5 March 2018).
- Intergovernmental Panel on Climate Change (IPCC). IPCC Guidelines for National Greenhouse Gas Inventories. 2006. Available online: www.ipcc.ch (accessed on 5 March 2018).
- National Coordination Committee Office on Climate Change and Energy Research Institute under the National Development and Reform Commission. National Greenhouse Gas Inventory of the People’s Republic of China; Chinese Environmental Science Press: Beijing, China, 2007. (In Chinese)
- The State Council of the People’s Republic of China, 2006. Available online: http://www.gov.cn/ztzl/gmjj/ (accessed on 10 March 2018).
- China News Service, 2010. Available online: http://www.chinanews.com/cj/2010/10-26/2612688.shtml (accessed on 10 March 2018).
- The State Council of the People’s Republic of China, 2013. Available online: http://www.gov.cn/ldhd/2013-12/14/content_2547880.htm (accessed on 10 March 2018).
- The State Council of the People’s Republic of China, 2013. Available online: http://www.gov.cn/jrzg/2013-12/06/content_2543618.htm (accessed on 10 March 2018).
- People’s Government of Guangdong Province. Available online: http://zwgk.gd.gov.cn/006939748/201507/t20150707_589735.html (accessed on 20 March 2018).
- National New-Type Urbanization Plan (2014-2020). China State Council. 2014. Available online: http://www.gov.cn/zhengce/2014-03/16/content_2640075.htm (accessed on 20 March 2018).
- National Development and Reform Commission. Available online: http://www.ndrc.gov.cn/ (accessed on 20 March 2018).
- Guo, Y.; Xia, X.; Zhang, S.; Zhang, D. Environmental Regulation, Government R&D Funding and Green Technology Innovation: Evidence from China Provincial Data. Sustainability 2018, 10, 940. [Google Scholar]
- Development Research Center of the State Council of China, 2005. Available online: http://www.drc.gov.cn/ (accessed on 30 March 2018).
- Zhai, X.; Reed, R.; Mills, A. Embracing off-site innovation in construction in China to enhance a sustainable built environment in urban housing. Int. J. Constr. Manag. 2014, 14, 123–133. [Google Scholar] [CrossRef]
- People’s Government of Guangdong Province, 2012. Available online: http://zwgk.gd.gov.cn/006939748/201301/t20130106_362025.html (accessed on 30 March 2018).
- Shen, L.; Chen, Y.; Li, H.; Wei, X.; Ren, Y. Development orientations for attracting investments—A perspective of less-developed townships in China. Cities 2018, 76, 84–95. [Google Scholar] [CrossRef]
- People’s Daily Online, 2017. Available online: http://tj.people.com.cn/gb/n2/2017/0306/c375366-29810698.html (accessed on 10 April 2018).
- Guangdong Provincial Department of Housing and Urban-Rural Development, 2017. Available online: http://zwgk.gd.gov.cn/006939799/201707/t20170714_713374.html?keywords (accessed on 10 April 2018).
- Liu, S.; Zhang, P.; Lo, K. Urbanization in remote areas: A case study of the Heilongjiang Reclamation Area, Northeast China. Habitat Int. 2014, 42, 103–110. [Google Scholar] [CrossRef]
Figure 1.
The input-output dimensions of urbanization system.
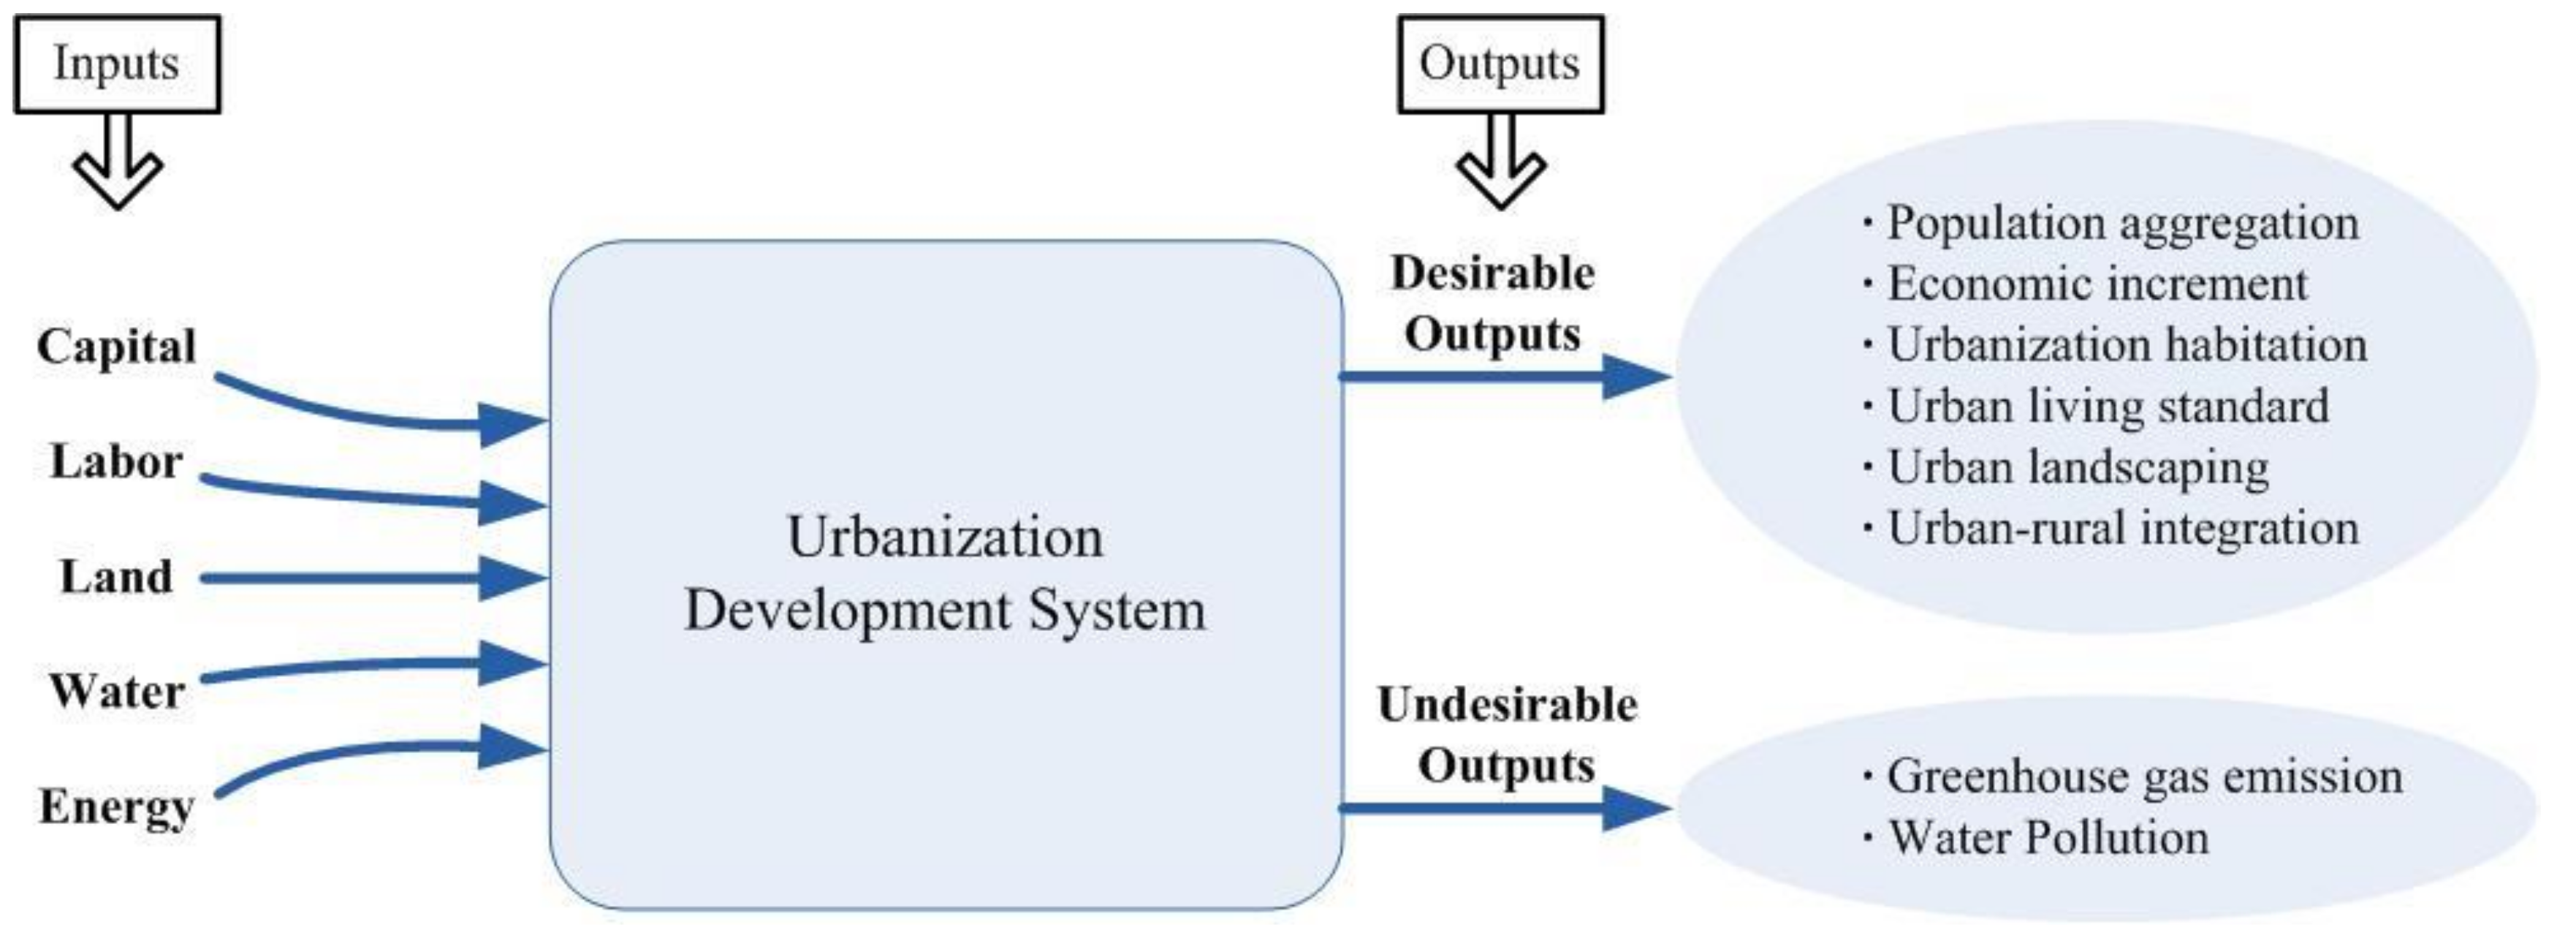
Figure 2.
National average and standard deviation of during the surveyed period.

Figure 3.
National average and standard deviation of Malmquist Productivity Index (MPI) during the surveyed period.
Figure 3.
National average and standard deviation of Malmquist Productivity Index (MPI) during the surveyed period.
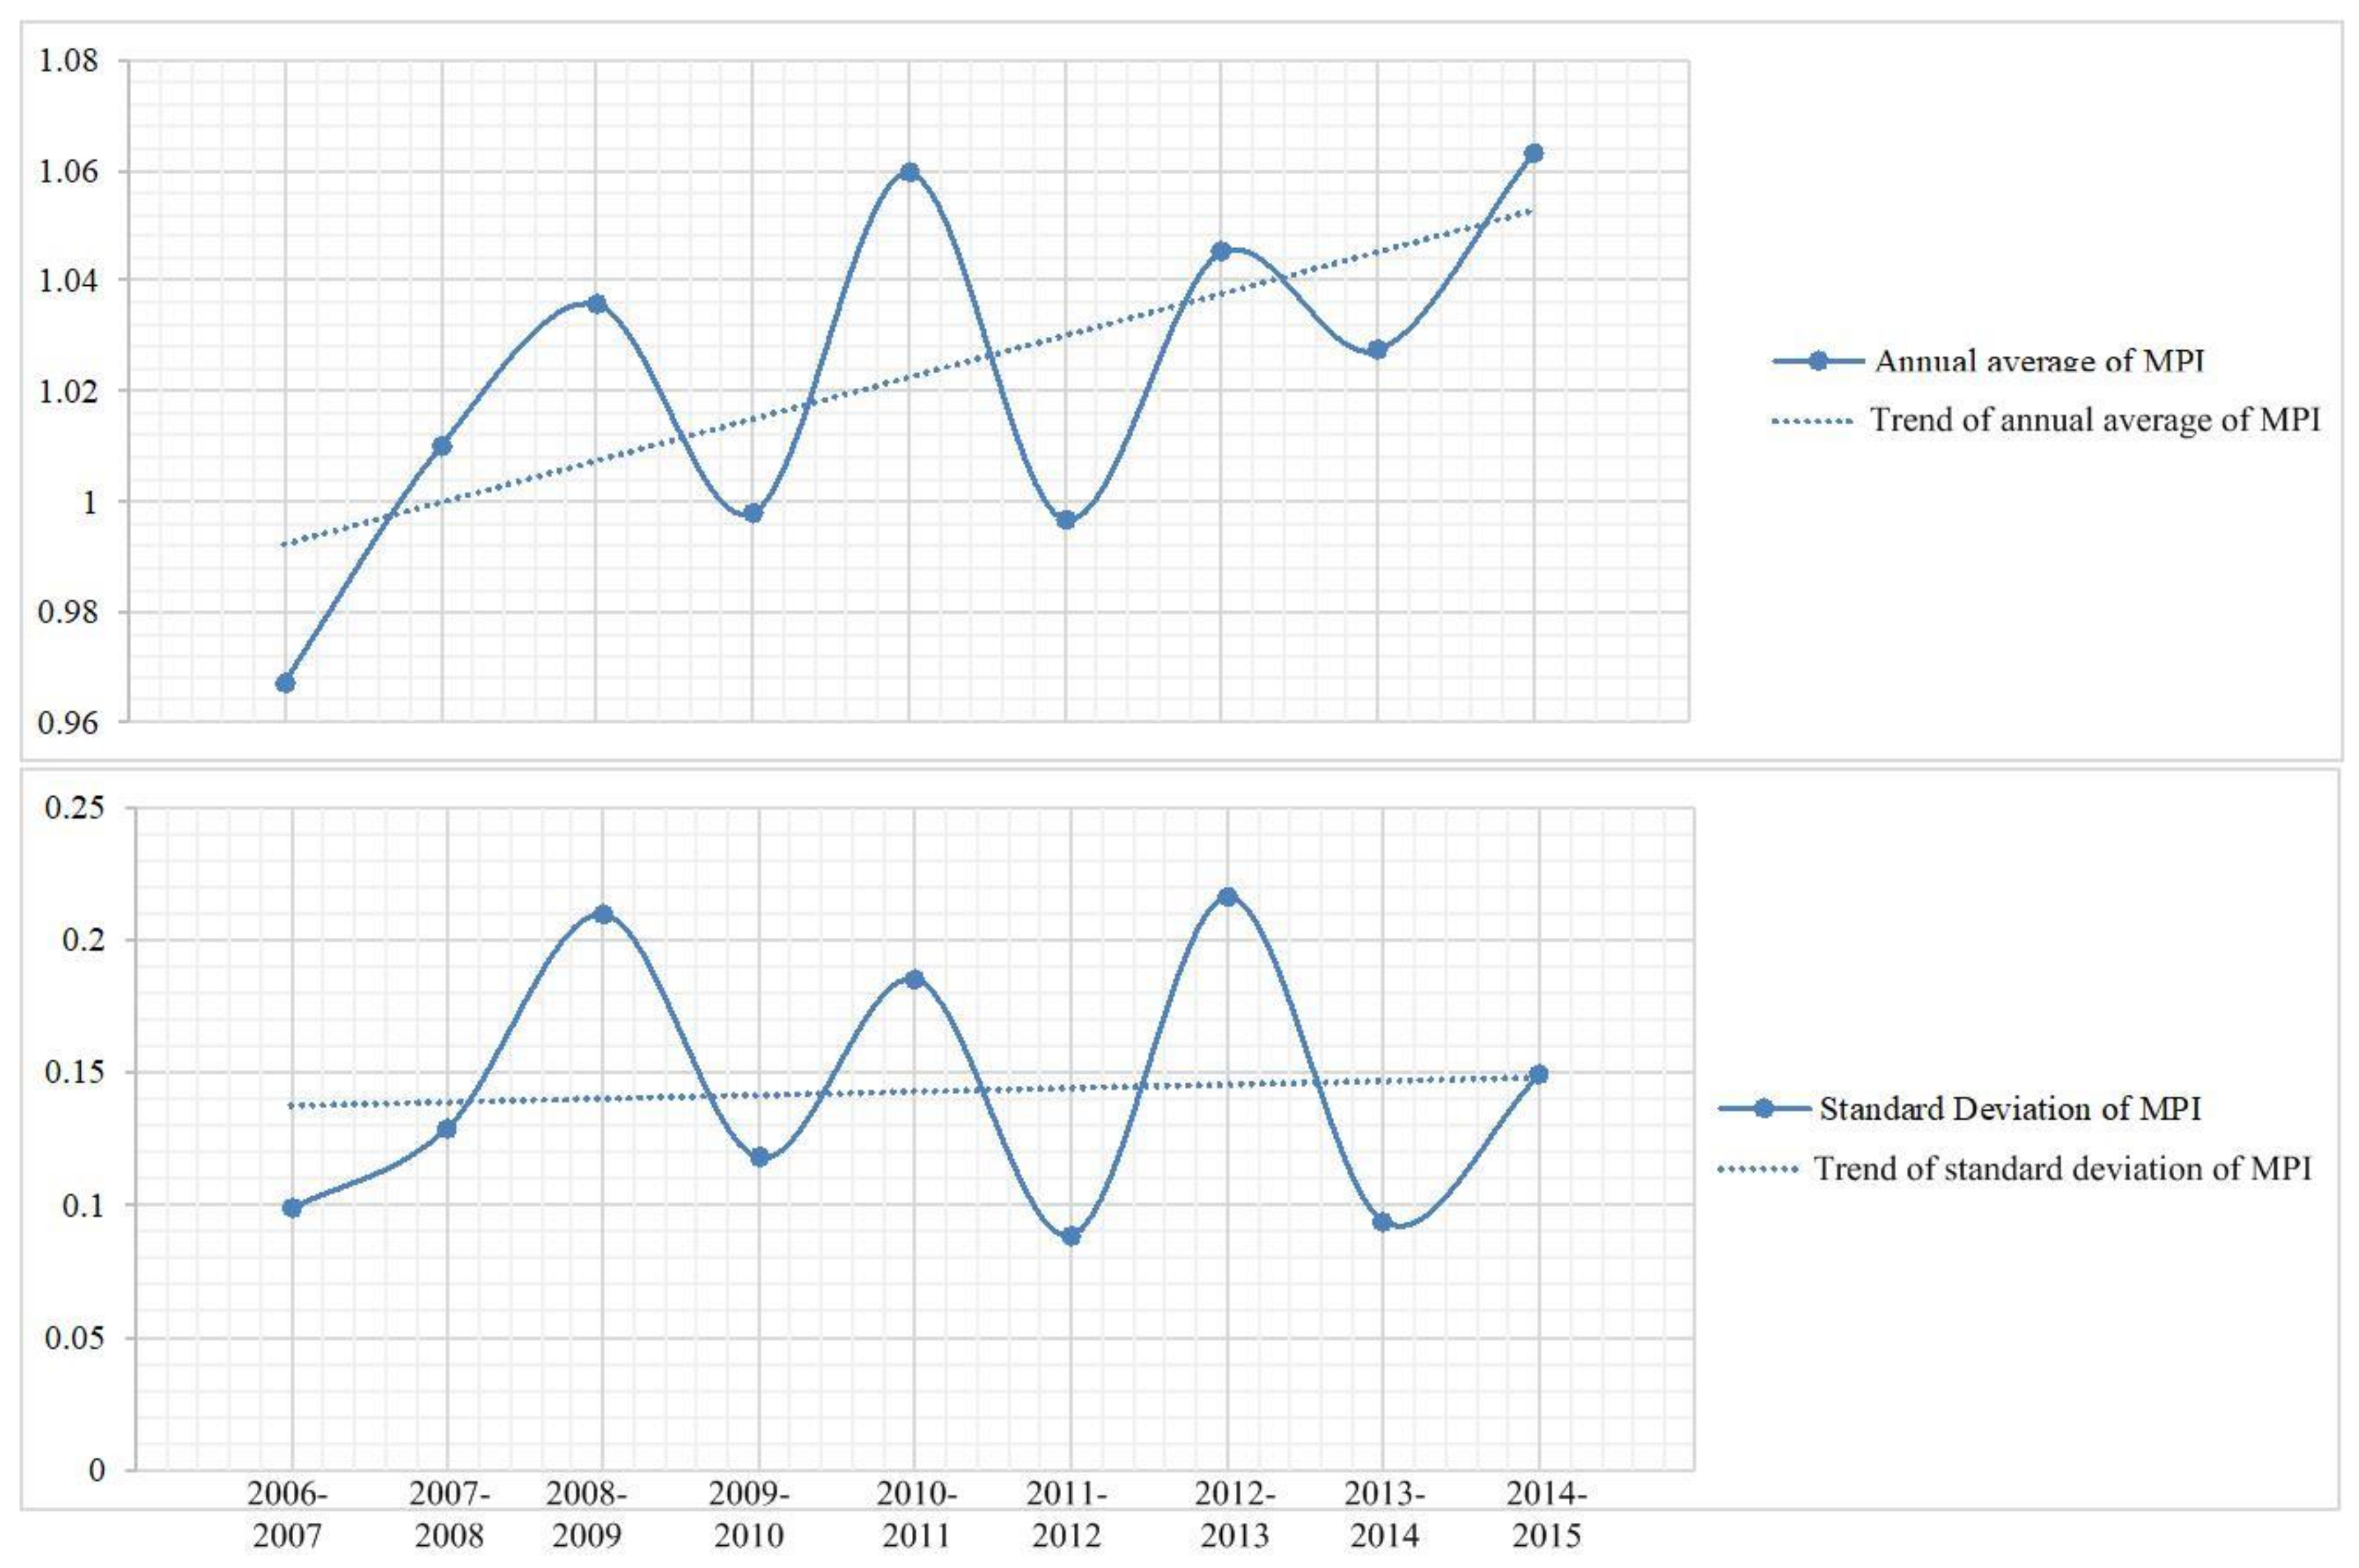
Figure 4.
Distribution of urbanization efficiency () between individual provinces in China during 2006–2015.
Figure 4.
Distribution of urbanization efficiency () between individual provinces in China during 2006–2015.
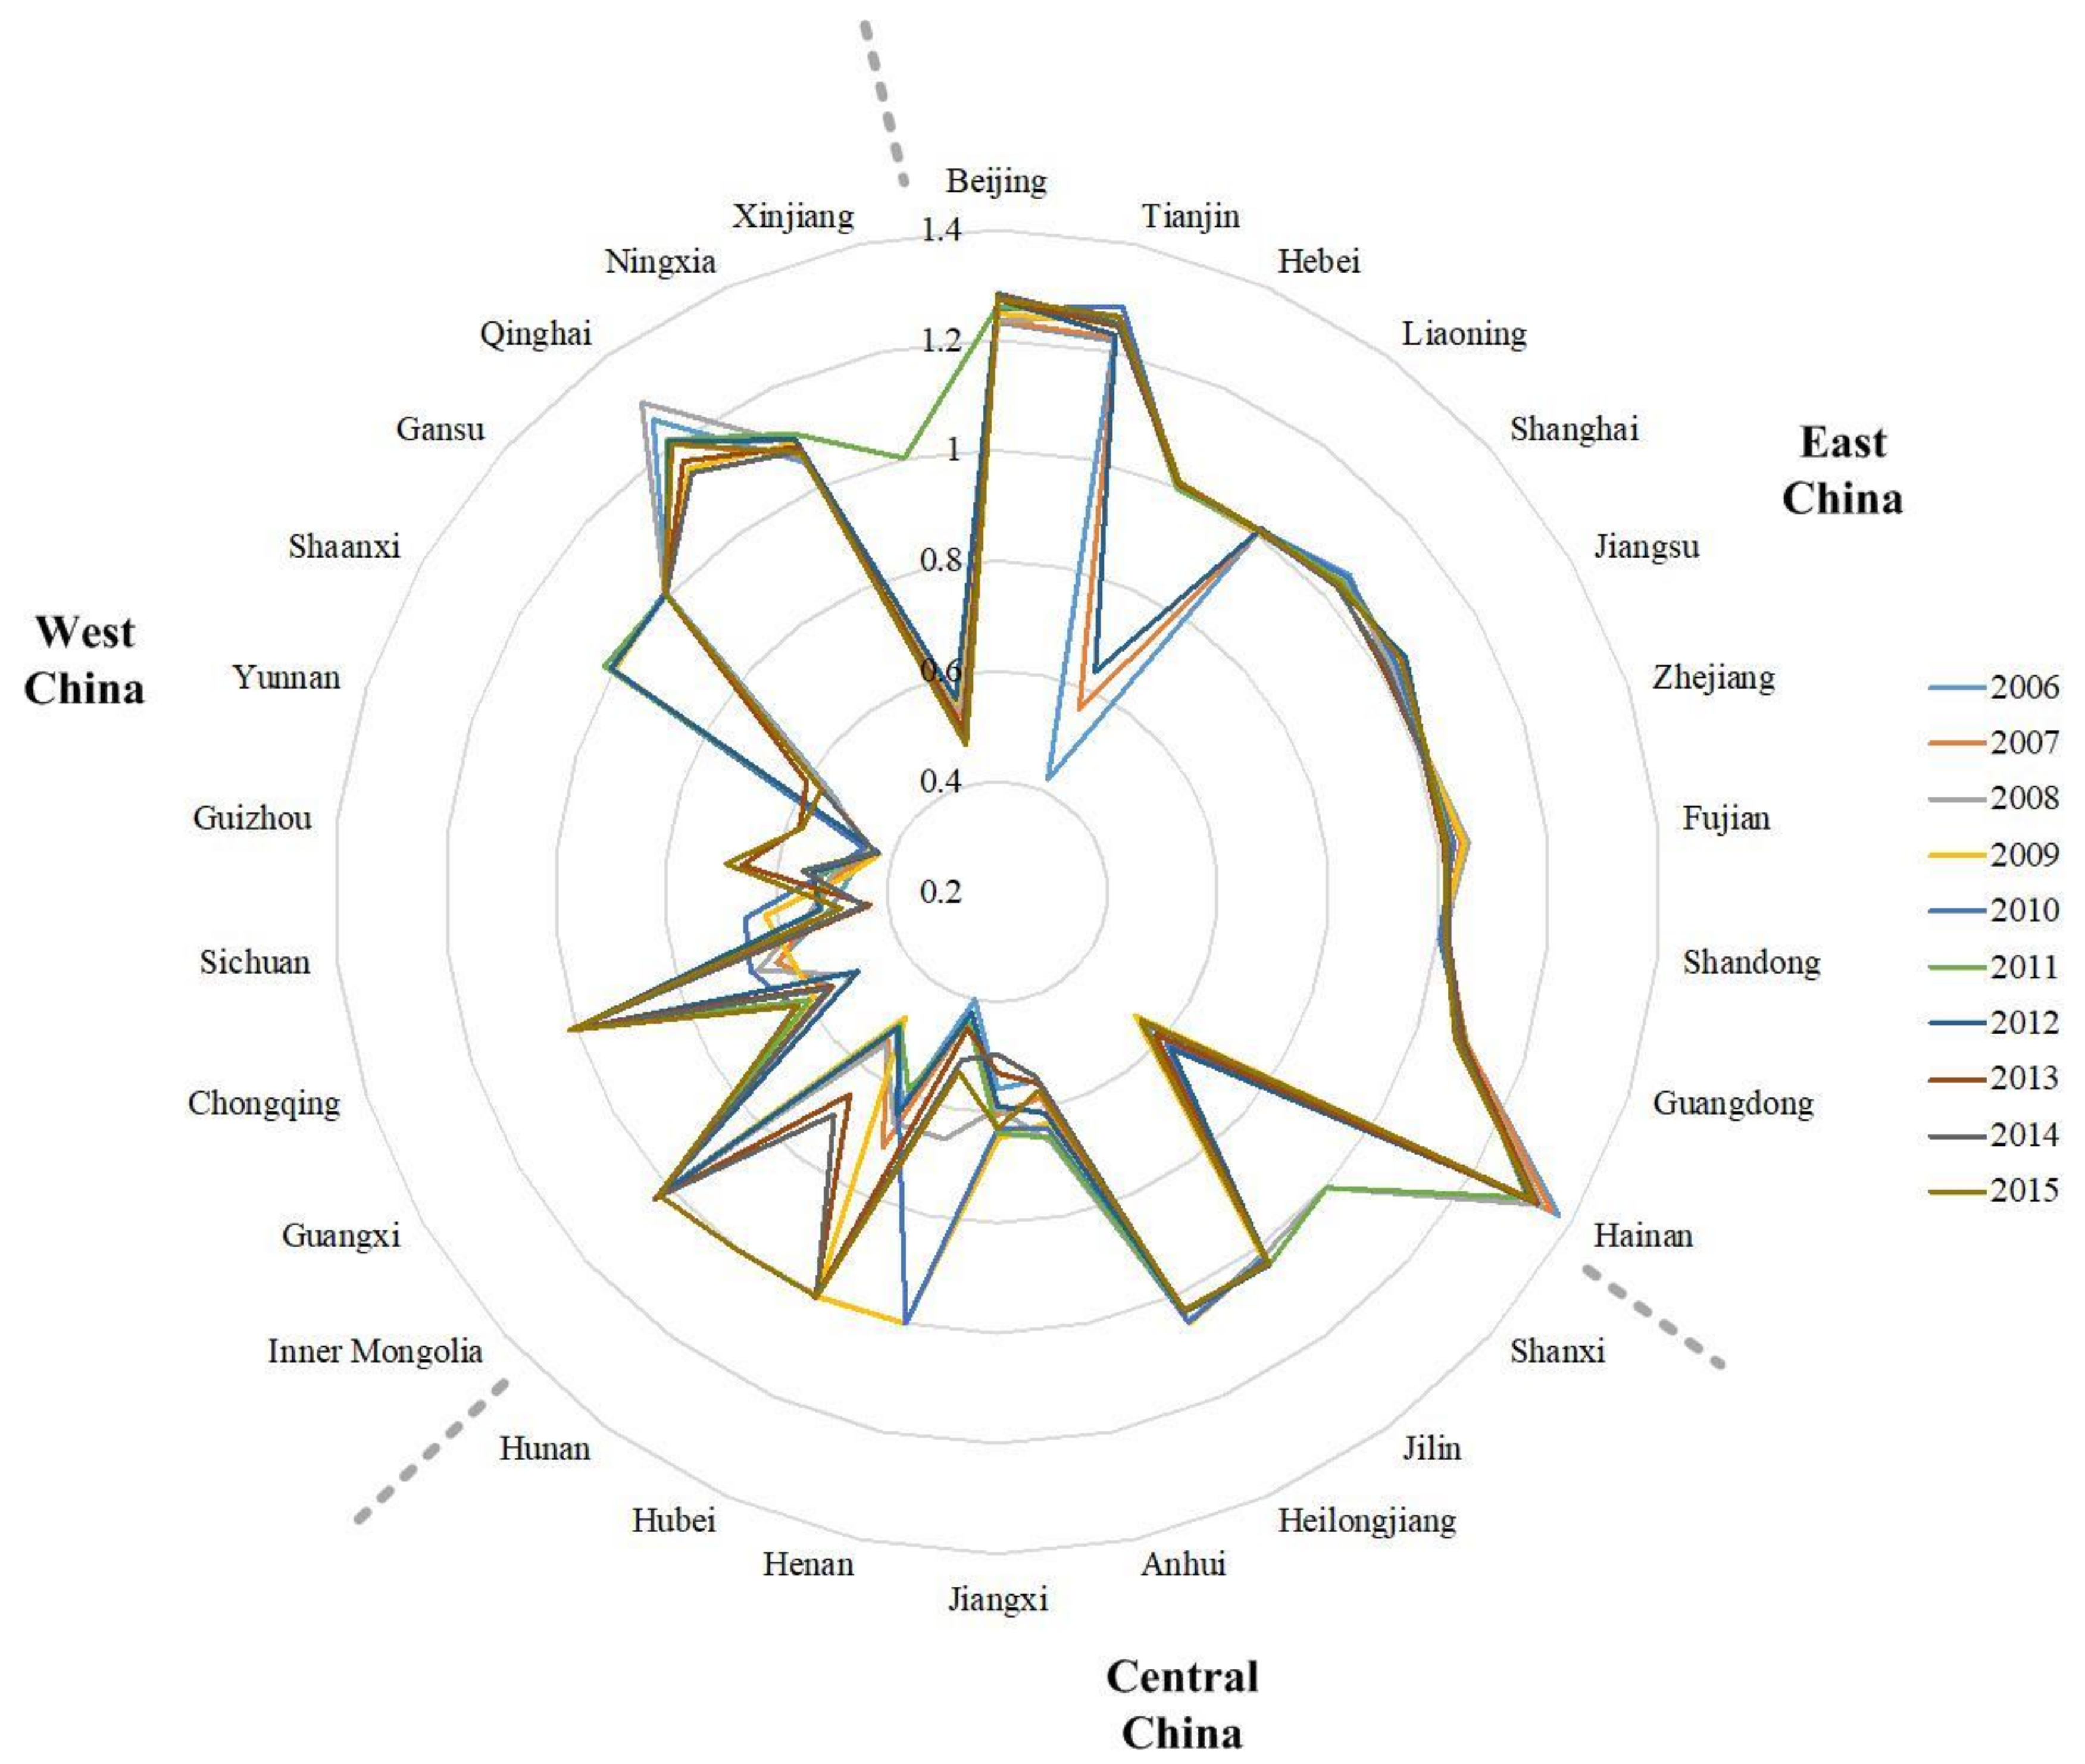
Figure 5.
Spatial distribution of urbanization efficiency in China.

Figure 6.
Average MPI between 30 provinces in China for the period 2006–2015.

Figure 7.
Average performance of in East-Central-West China.

Figure 8.
Average performance of in the eight economic zones in China.


Table 1.
Indicators for measuring the input dimensions of urbanization system.
| Input Indicator | |||
|---|---|---|---|
| Dimension | Indicator | Unit | Key References |
| Capital | Total investment in urban fixed assets (I1) | 108 yuan | [43,44,45,46] |
| Labor | Urban employed persons (I2) | 104 persons | [31,46,47,48,49] |
| Land | Construction land area (I3) | 106 m2 | [29,50,51] |
| Water | Total water consumption (I4) | 108 m3 | [52,53,54,55,56] |
| Energy | Total energy consumption (I5) | 104 tce | [36,45,53,57,58] |
Table 2.
Indicators for measuring the output dimensions of urbanization system.
| Output Indicator | ||||
|---|---|---|---|---|
| Type of Outputs | Dimension | Indicator | Unit | Key References |
| Desirable outputs | Population aggregation | Urbanization rate (O1) | % | [27,31,59] |
| Economic increment | Non-agricultural GDP (O2) | 108 yuan | [27,34,43,59] | |
| Urbanization habitation | Urban built-up area (O3) | 106 m2 | [60,61,62] | |
| Urban living standard | Total retail sales of social consumer goods (O4) | 108 yuan | [28,29] | |
| Total wages of urban employed persons (O5) | 108 yuan | [52,63] | ||
| Urban landscaping | Green coverage in built-up area (O6) | % | [33,50,61] | |
| Urban-rural integration | Income ratio of rural to urban residents (O7) | % | [59,60,64,65] | |
| Undesirable outputs | Greenhouse gas emission | CO2 emission (O8) | 104 ton | [26,36,66,67,68] |
| Water Pollution | Total waste water discharge (O9) | 104 ton | [28,52,69] | |
Table 3.
CO2 emission coefficients of major carbonaceous fuels in China.
| Carbonaceous Fuels | LCV (GJ/t) Or (MJ/m3) | CF (t C/TJ) | O |
|---|---|---|---|
| Raw Coal | 20.908 | 25.8 | 0.918 |
| Crude Oil | 41.816 | 20.08 | 0.979 |
| Gasoline | 43.07 | 18.9 | 0.986 |
| Kerosene | 43.07 | 19.6 | 0.98 |
| Diesel Oil | 42.652 | 20.17 | 0.982 |
| Fuel Oil | 41.816 | 21.09 | 0.985 |
| Liquefied Petroleum Gases | 50.179 | 17.2 | 0.989 |
| Natural Gas | 38.931 | 17.2 | 0.99 |
Table 4.
Sample research data for the year 2006.
| Province (DMU) | I1 | I2 | I3 | I4 | I5 | O1 | O2 | O3 | O4 | O5 | O6 | O7 | O8 | O9 |
|---|---|---|---|---|---|---|---|---|---|---|---|---|---|---|
| Beijing | 2605.79 | 513.80 | 1254.00 | 34.30 | 5904.11 | 84.32 | 7787.79 | 1289 | 2917.52 | 1824.12 | 44.40 | 41.42 | 5620.61 | 104,922 |
| Tianjin | 1373.55 | 195.00 | 540.00 | 22.96 | 4525.14 | 75.72 | 4364.66 | 572 | 1206.41 | 485.71 | 37.00 | 43.60 | 3530.10 | 58,834 |
| Hebei | 3364.00 | 501.20 | 1315.00 | 204.00 | 21,690.37 | 38.76 | 9885.81 | 1474 | 3014.04 | 810.63 | 35.60 | 36.89 | 14,442.53 | 213,672 |
| Shanxi | 1691.47 | 365.50 | 735.00 | 59.29 | 13,497.67 | 42.99 | 4496.92 | 774 | 1427.63 | 646.76 | 31.90 | 31.72 | 8616.68 | 89,142 |
| Inner Mongolia | 2639.57 | 242.60 | 779.00 | 178.69 | 11,163.11 | 48.65 | 4041.23 | 887 | 1377.11 | 446.24 | 26.60 | 32.26 | 8899.43 | 55,102 |
| Liaoning | 3743.52 | 498.00 | 1847.00 | 141.24 | 15,883.16 | 58.98 | 8251.63 | 1918 | 3053.59 | 935.90 | 36.90 | 39.45 | 10,963.11 | 206,236 |
| Jilin | 1616.05 | 265.90 | 915.00 | 102.90 | 6622.41 | 52.96 | 3509.41 | 1051 | 1492.35 | 431.37 | 31.60 | 37.25 | 8678.56 | 89,855 |
| Heilongjiang | 1614.43 | 496.50 | 1495.00 | 286.21 | 8727.50 | 53.49 | 5442.77 | 1526 | 1800.41 | 753.44 | 28.70 | 38.69 | 6651.83 | 110,201 |
| Shanghai | 3201.77 | 332.50 | 2190.55 | 118.57 | 8967.32 | 88.70 | 10,332.71 | 886 | 2985.46 | 1086.07 | 37.30 | 44.22 | 7621.84 | 222,565 |
| Jiangsu | 6293.52 | 679.40 | 2484.00 | 546.39 | 18,742.19 | 51.89 | 19,846.07 | 2714 | 5781.38 | 1530.07 | 41.70 | 41.27 | 12,684.51 | 508,825 |
| Zhejiang | 4856.45 | 610.80 | 1735.00 | 208.26 | 13,222.53 | 56.51 | 14,358.78 | 1851 | 4683.07 | 1595.73 | 35.50 | 40.16 | 11,301.07 | 303,515 |
| Anhui | 2167.10 | 338.30 | 1148.00 | 241.87 | 7096.39 | 37.10 | 5008.88 | 1202 | 1790.91 | 570.27 | 32.60 | 30.39 | 6963.74 | 164,449 |
| Fujian | 1997.47 | 427.40 | 718.00 | 187.25 | 6840.28 | 50.40 | 6690.82 | 819 | 2363.46 | 787.44 | 36.60 | 35.15 | 7611.88 | 213,401 |
| Jiangxi | 1963.55 | 282.80 | 759.00 | 205.68 | 4660.51 | 38.67 | 3781.72 | 801 | 1259.84 | 417.06 | 34.60 | 36.22 | 25,608.53 | 130,183 |
| Shandong | 7406.01 | 897.60 | 2848.00 | 225.82 | 26,164.31 | 46.10 | 19,001.90 | 3082 | 6203.90 | 1667.87 | 37.50 | 35.83 | 25,608.53 | 299,812 |
| Henan | 3516.61 | 711.30 | 1518.00 | 226.98 | 16,235.32 | 32.47 | 10,081.80 | 1775 | 3411.33 | 1153.30 | 32.80 | 33.24 | 18,131.13 | 268,888 |
| Hubei | 2430.38 | 520.30 | 1351.00 | 258.79 | 10,797.76 | 43.81 | 6322.95 | 1299 | 3018.74 | 760.70 | 37.10 | 34.88 | 12,855.68 | 231,454 |
| Hunan | 2272.27 | 415.50 | 1192.00 | 327.73 | 9879.18 | 38.71 | 6288.15 | 1112 | 2506.47 | 684.96 | 34.70 | 32.27 | 12,130.29 | 235,728 |
| Guangdong | 5931.34 | 954.40 | 2932.00 | 459.40 | 19,765.22 | 63.01 | 24,408.33 | 4084 | 8034.23 | 2415.12 | 38.00 | 31.72 | 17,760.06 | 618,921 |
| Guangxi | 1498.69 | 283.50 | 745.00 | 314.42 | 5515.69 | 34.65 | 3552.03 | 814 | 1409.72 | 478.18 | 32.90 | 27.99 | 5843.39 | 250,584 |
| Hainan | 342.63 | 75.50 | 312.00 | 46.46 | 910.91 | 46.05 | 713.21 | 204 | 274.32 | 116.39 | 38.90 | 34.65 | 1080.69 | 34,962 |
| Chongqing | 1807.28 | 219.70 | 620.00 | 73.20 | 4722.98 | 46.69 | 3461.89 | 667 | 1247.44 | 404.93 | 23.50 | 24.84 | 5009.31 | 145,263 |
| Sichuan | 3078.53 | 520.60 | 1210.00 | 215.13 | 12,538.50 | 34.30 | 6865.01 | 1328 | 3054.56 | 884.00 | 33.50 | 32.11 | 9508.81 | 234,483 |
| Guizhou | 909.22 | 210.50 | 465.00 | 99.98 | 7045.34 | 27.45 | 1876.97 | 396 | 621.24 | 349.28 | 29.40 | 21.77 | 8488.80 | 51,460 |
| Yunnan | 1620.95 | 259.20 | 536.00 | 144.77 | 6640.58 | 30.49 | 3164.39 | 578 | 1049.63 | 457.92 | 25.80 | 22.35 | 6098.28 | 76,760 |
| Shaanxi | 1786.12 | 334.80 | 653.00 | 84.08 | 5905.41 | 39.12 | 4013.29 | 653 | 1355.26 | 546.35 | 36.20 | 24.39 | 6931.96 | 82,204 |
| Gansu | 818.28 | 194.50 | 505.00 | 122.33 | 4743.05 | 31.10 | 1833.23 | 553 | 645.76 | 325.36 | 28.60 | 23.92 | 3572.72 | 42,254 |
| Qinghai | 318.30 | 43.20 | 108.00 | 32.20 | 1903.22 | 39.23 | 547.74 | 111 | 164.83 | 93.05 | 26.70 | 26.20 | 1433.32 | 15,726 |
| Ningxia | 386.96 | 58.70 | 265.00 | 77.63 | 2801.53 | 43.05 | 613.94 | 292 | 178.09 | 121.01 | 29.00 | 30.08 | 2143.42 | 25,276 |
| Xinjiang | 1236.63 | 245.10 | 704.00 | 513.43 | 6047.27 | 37.95 | 2351.06 | 679 | 651.72 | 441.64 | 30.00 | 30.86 | 6256.93 | 57,440 |
Table 5.
Statistical characteristics of the data collected for analysis.
| Indicator | Minimum | Maximum | Mean | Median | Std.dev |
|---|---|---|---|---|---|
| I1 | 318.3 (Qinghai) | 9027.8 (Shandong) | 2879.2 | 2308.8 | 1979.5 |
| I2 | 43.2 (Qinghai) | 1973.3 (Guangdong) | 484.7 | 417.6 | 325.5 |
| I3 | 108.0 (Qinghai) | 4959.0 (Guangdong) | 1441.4 | 1190.0 | 997.6 |
| I4 | 22.3 (Tianjin) | 591.3 (Jiangsu) | 199.4 | 186.0 | 140.6 |
| I5 | 920.0 (Hainan) | 38,899.0 (Shandong) | 12,914.1 | 10,518.5 | 8059.8 |
| O1 | 27.5 (Guizhou) | 89.6 (Shanghai) | 52.4 | 50.0 | 13.9 |
| O2 | 547.7 (Qinghai) | 58,739.2 (Guangdong) | 12,183.3 | 9368.5 | 10,831.5 |
| O3 | 111.0 (Qinghai) | 5633.0 (Guangdong) | 1421.5 | 1152.5 | 1037.9 |
| O4 | 164.8 (Qinghai) | 9686.3 (Guangdong) | 2616.5 | 1850.7 | 2077.3 |
| O5 | 93.1 (Qinghai) | 12,561.3 (Guangdong) | 1961.3 | 1446.0 | 1895.2 |
| O6 | 23.5 (Chongqing) | 49.1 (Beijing) | 37.2 | 37.7 | 4.5 |
| O7 | 21.8 (Guizhou) | 54.2 (Tianjin) | 35.6 | 35.4 | 6.3 |
| O8 | 1080.7 (Hainan) | 34,093.3 (Shandong) | 10,777.0 | 9719.0 | 6047.5 |
| O9 | 15,726.0 (Qinghai) | 911,522.6 (Guangdong) | 211,200.4 | 157,063.7 | 167,501.5 |
Table 6.
The results of urbanization efficiency ().
| Province (DMU) | 2006 | 2007 | 2008 | 2009 | 2010 | 2011 | 2012 | 2013 | 2014 | 2015 | Rank (by Average) |
|---|---|---|---|---|---|---|---|---|---|---|---|
| Beijing | 1.2322 | 1.2349 | 1.2336 | 1.2479 | 1.2544 | 1.2614 | 1.2724 | 1.2740 | 1.2829 | 1.2723 | 2 (1.2566) |
| Tianjin | 1.2201 | 1.2252 | 1.2644 | 1.2521 | 1.2851 | 1.2623 | 1.2320 | 1.2477 | 1.2524 | 1.2656 | 3 (1.2507) |
| Hebei | 0.4231 | 0.5632 | 1.0031 | 1.0052 | 1.0056 | 1.0002 | 0.6346 | 1.0093 | 1.0111 | 1.0106 | 17 (0.8666) |
| Shanxi | 0.5600 | 0.5516 | 1.0020 | 0.5354 | 0.6145 | 1.0013 | 0.6238 | 0.5869 | 0.5505 | 0.5488 | 21 (0.6575) |
| Inner Mongolia | 1.0346 | 1.0296 | 1.0148 | 1.0159 | 1.0070 | 1.0207 | 1.0328 | 1.0322 | 1.0234 | 1.0222 | 12 (1.0233) |
| Liaoning | 1.0087 | 1.0098 | 1.0013 | 1.0028 | 1.0096 | 1.0108 | 1.0139 | 1.0102 | 1.0054 | 1.0112 | 15 (1.0084) |
| Jilin | 1.0144 | 1.0192 | 1.0185 | 1.0188 | 1.0211 | 1.0361 | 1.0367 | 1.0300 | 1.0299 | 1.0340 | 11 (1.0259) |
| Heilongjiang | 1.0502 | 1.0518 | 1.0521 | 1.0566 | 1.0537 | 1.0350 | 1.0332 | 1.0320 | 1.0343 | 1.0298 | 7 (1.0429) |
| Shanghai | 1.0579 | 1.0517 | 1.0459 | 1.0525 | 1.0530 | 1.0403 | 1.0266 | 1.0303 | 1.0262 | 1.0316 | 8 (1.0416) |
| Jiangsu | 1.0176 | 1.0195 | 1.0217 | 1.0335 | 1.0303 | 1.0433 | 1.0517 | 1.0079 | 1.0147 | 1.0436 | 10 (1.0284) |
| Zhejiang | 1.0074 | 1.0135 | 1.0148 | 1.0137 | 1.0144 | 1.0149 | 1.0146 | 1.0091 | 1.0101 | 1.0180 | 14 (1.0131) |
| Anhui | 0.5501 | 0.5814 | 0.6641 | 0.6282 | 0.6393 | 0.6546 | 0.6102 | 0.5548 | 0.5443 | 0.5687 | 22 (0.5996) |
| Fujian | 1.0481 | 1.0452 | 1.0569 | 1.0483 | 1.0318 | 1.0237 | 1.0190 | 1.0115 | 1.0213 | 1.0164 | 9 (1.0322) |
| Jiangxi | 0.5586 | 0.6049 | 0.5947 | 0.6482 | 0.6299 | 0.6389 | 0.5875 | 0.5292 | 0.4950 | 0.6296 | 24 (0.5917) |
| Shandong | 1.0156 | 1.0134 | 1.0089 | 1.0077 | 1.0054 | 1.0183 | 1.0177 | 1.0195 | 1.0198 | 1.0159 | 13 (1.0142) |
| Henan | 0.3998 | 0.4255 | 0.6586 | 1.0007 | 1.0001 | 0.4411 | 0.4258 | 0.4538 | 0.5112 | 0.5337 | 25 (0.5850) |
| Hubei | 0.6242 | 0.7072 | 0.6594 | 1.0022 | 0.6361 | 0.5946 | 0.6437 | 1.0062 | 1.0040 | 1.0039 | 19 (0.7881) |
| Hunan | 0.5026 | 0.5329 | 0.5424 | 0.4797 | 0.5061 | 0.4976 | 0.5037 | 0.6544 | 0.7003 | 1.0006 | 23 (0.5920) |
| Guangdong | 1.0901 | 1.0939 | 1.0894 | 1.0874 | 1.0871 | 1.0904 | 1.0890 | 1.0893 | 1.0807 | 1.0708 | 5 (1.0868) |
| Guangxi | 0.5441 | 0.5517 | 0.5020 | 0.5832 | 0.6208 | 0.5919 | 0.4885 | 0.5431 | 0.5534 | 0.6146 | 27 (0.5593) |
| Hainan | 1.3727 | 1.3570 | 1.3372 | 1.3256 | 1.3158 | 1.3076 | 1.3123 | 1.3280 | 1.3153 | 1.3211 | 1 (1.3292) |
| Chongqing | 0.6183 | 0.6159 | 0.6550 | 0.5926 | 0.6677 | 1.0010 | 1.0092 | 1.0058 | 1.0089 | 1.0113 | 18 (0.8186) |
| Sichuan | 0.5008 | 0.5342 | 0.5396 | 0.6233 | 0.6574 | 0.5199 | 0.5219 | 0.4318 | 0.4425 | 0.4849 | 29 (0.5256) |
| Guizhou | 0.4676 | 0.4907 | 0.4989 | 0.4711 | 0.5150 | 0.5209 | 0.5350 | 0.6630 | 0.5554 | 0.6927 | 28 (0.5410) |
| Yunnan | 0.4561 | 0.4338 | 0.4494 | 0.4225 | 0.4534 | 0.4265 | 0.4266 | 0.5761 | 0.4307 | 0.5694 | 30 (0.4645) |
| Shaanxi | 0.5379 | 0.5488 | 0.5443 | 1.0002 | 1.0070 | 1.0196 | 1.0045 | 0.5982 | 0.5658 | 0.5688 | 20 (0.7395) |
| Gansu | 1.0031 | 1.0056 | 1.0100 | 1.0098 | 1.0096 | 1.0044 | 1.0042 | 1.0048 | 1.0042 | 1.0077 | 16 (1.0064) |
| Qinghai | 1.2575 | 1.2029 | 1.2951 | 1.1492 | 1.2061 | 1.2136 | 1.2103 | 1.1653 | 1.1391 | 1.2031 | 4 (1.2042) |
| Ningxia | 1.0518 | 1.0650 | 1.0840 | 1.0919 | 1.0965 | 1.1072 | 1.0962 | 1.0822 | 1.0725 | 1.0701 | 6 (1.0817) |
| Xinjiang | 0.5283 | 0.5250 | 0.5341 | 0.5479 | 0.5568 | 1.0017 | 0.5562 | 0.4997 | 0.4786 | 0.4726 | 26 (0.5701) |
| National Average | 0.8251 | 0.8368 | 0.8799 | 0.8985 | 0.8997 | 0.9133 | 0.8678 | 0.8829 | 0.8728 | 0.9048 | 0.8782 |
| Standard Deviation | 0.3052 | 0.2895 | 0.2750 | 0.2638 | 0.2563 | 0.2635 | 0.2818 | 0.2706 | 0.2804 | 0.2584 |
Table 7.
The results of dynamic changes of urbanization efficiency (Malmquist Productivity Index, MPI).
Table 7.
The results of dynamic changes of urbanization efficiency (Malmquist Productivity Index, MPI).
| Province (DMU) | 2006–2007 | 2007–2008 | 2008–2009 | 2009–2010 | 2010–2011 | 2011–2012 | 2012–2013 | 2013–2014 | 2014–2015 | Provincial Average |
|---|---|---|---|---|---|---|---|---|---|---|
| Beijing | 1.0106 | 1.0260 | 1.0073 | 0.9964 | 1.0145 | 1.0111 | 1.0360 | 1.0133 | 1.0062 | 1.0135 |
| Tianjin | 0.9954 | 1.0281 | 0.9977 | 1.0191 | 0.9696 | 0.9953 | 1.0069 | 1.0166 | 1.0071 | 1.0040 |
| Hebei | 1.1533 | 1.3326 | 0.9980 | 0.9976 | 1.0008 | 0.7982 | 1.0161 | 0.9994 | 1.0013 | 1.0330 |
| Shanxi | 0.9452 | 1.4152 | 0.5383 | 1.2446 | 1.6983 | 0.7897 | 1.0546 | 1.0047 | 0.9592 | 1.0722 |
| Inner Mongolia | 0.9975 | 0.9894 | 1.0069 | 0.9911 | 1.0038 | 1.0128 | 0.9925 | 1.0058 | 1.0134 | 1.0015 |
| Liaoning | 0.9991 | 1.0002 | 1.2511 | 1.0073 | 0.9917 | 0.9995 | 0.9925 | 0.9997 | 1.0130 | 1.0282 |
| Jilin | 0.9986 | 1.0030 | 1.0019 | 1.0011 | 0.9990 | 0.9983 | 0.9911 | 1.0041 | 1.0090 | 1.0007 |
| Heilongjiang | 1.0063 | 0.9965 | 1.0115 | 0.9997 | 0.9833 | 1.0019 | 1.0093 | 1.0061 | 1.0038 | 1.0020 |
| Shanghai | 1.0153 | 1.0246 | 1.0147 | 1.0138 | 0.9919 | 0.9968 | 1.0044 | 1.0073 | 1.0144 | 1.0092 |
| Jiangsu | 1.0035 | 1.0144 | 1.0078 | 1.0053 | 1.0039 | 1.0074 | 0.9413 | 1.0104 | 1.0358 | 1.0033 |
| Zhejiang | 1.0046 | 1.0076 | 0.9993 | 1.0041 | 1.0112 | 1.0095 | 0.9983 | 0.9985 | 1.0032 | 1.0040 |
| Anhui | 0.9153 | 1.1613 | 1.0095 | 1.0213 | 0.8534 | 1.0211 | 0.8501 | 1.2053 | 1.3987 | 1.0484 |
| Fujian | 1.0008 | 1.0159 | 1.0003 | 0.9959 | 1.0096 | 1.0129 | 1.0078 | 1.0069 | 0.9948 | 1.0050 |
| Jiangxi | 0.7855 | 0.7653 | 1.3874 | 0.7534 | 1.2506 | 1.0005 | 1.0045 | 0.9918 | 0.9976 | 0.9929 |
| Shandong | 1.0006 | 1.0088 | 0.9965 | 0.9984 | 0.9971 | 1.0010 | 0.9886 | 1.0088 | 1.0102 | 1.0011 |
| Henan | 0.6451 | 0.7965 | 0.9899 | 1.0000 | 0.9962 | 1.0310 | 1.0726 | 1.0755 | 0.9592 | 0.9518 |
| Hubei | 1.0484 | 0.7787 | 1.0228 | 0.6304 | 0.9227 | 1.0589 | 1.0675 | 0.9995 | 1.0006 | 0.9477 |
| Hunan | 1.0090 | 1.0105 | 0.8489 | 0.9958 | 1.0186 | 1.0701 | 0.9878 | 1.0839 | 1.4410 | 1.0517 |
| Guangdong | 1.0097 | 1.0022 | 1.0152 | 1.0082 | 1.0019 | 1.0080 | 1.0122 | 1.0051 | 1.0119 | 1.0083 |
| Guangxi | 0.9683 | 0.8473 | 1.2663 | 1.2734 | 1.3526 | 0.9493 | 1.0454 | 1.0568 | 1.0669 | 1.0918 |
| Hainan | 0.9715 | 0.9829 | 0.9896 | 0.9777 | 0.9664 | 0.9995 | 1.0171 | 0.9924 | 0.9969 | 0.9882 |
| Chongqing | 0.9401 | 1.0027 | 0.9581 | 1.0568 | 1.4703 | 1.1529 | 1.0004 | 1.0022 | 1.0013 | 1.0650 |
| Sichuan | 0.7219 | 0.9912 | 0.7544 | 0.7636 | 0.8737 | 0.9505 | 0.5904 | 1.0452 | 1.0590 | 0.8611 |
| Guizhou | 1.0419 | 1.0285 | 1.0404 | 1.0719 | 1.0257 | 1.1672 | 1.5911 | 0.9996 | 1.3780 | 1.1494 |
| Yunnan | 0.9111 | 1.0205 | 1.0234 | 1.0462 | 0.9485 | 1.0963 | 1.7935 | 0.8625 | 1.0486 | 1.0834 |
| Shaanxi | 1.0116 | 0.9807 | 1.8472 | 1.0072 | 1.0181 | 0.9946 | 0.7719 | 0.9631 | 0.9649 | 1.0622 |
| Gansu | 0.9936 | 1.0003 | 0.9991 | 1.0000 | 0.9913 | 0.9988 | 1.1661 | 1.0028 | 1.0093 | 1.0179 |
| Qinghai | 1.0042 | 1.0210 | 1.0049 | 1.0313 | 1.0308 | 1.0258 | 0.9720 | 1.0093 | 0.9799 | 1.0088 |
| Ningxia | 1.0160 | 1.0261 | 1.0083 | 1.0088 | 1.0026 | 0.9979 | 0.9973 | 1.0030 | 1.0062 | 1.0074 |
| Xinjiang | 0.8888 | 1.0174 | 1.0757 | 1.0136 | 1.3895 | 0.7445 | 1.3753 | 1.4415 | 1.4973 | 1.1604 |
| National average | 0.9671 | 1.0099 | 1.0357 | 0.9978 | 1.0596 | 0.9967 | 1.0452 | 1.0274 | 1.0629 | 1.0225 |
| Standard Deviation | 0.0985 | 0.1288 | 0.2094 | 0.1176 | 0.1850 | 0.0884 | 0.2158 | 0.0936 | 0.1488 |
© 2018 by the authors. Licensee MDPI, Basel, Switzerland. This article is an open access article distributed under the terms and conditions of the Creative Commons Attribution (CC BY) license (http://creativecommons.org/licenses/by/4.0/).
Share and Cite
MDPI and ACS Style
Ren, Y.; Li, H.; Shen, L.; Zhang, Y.; Chen, Y.; Wang, J. What Is the Efficiency of Fast Urbanization? A China Study. Sustainability 2018, 10, 3180. https://doi.org/10.3390/su10093180
AMA Style
Ren Y, Li H, Shen L, Zhang Y, Chen Y, Wang J. What Is the Efficiency of Fast Urbanization? A China Study. Sustainability. 2018; 10(9):3180. https://doi.org/10.3390/su10093180
Chicago/Turabian StyleRen, Yitian, Heng Li, Liyin Shen, Yu Zhang, Yang Chen, and Jinhuan Wang. 2018. "What Is the Efficiency of Fast Urbanization? A China Study" Sustainability 10, no. 9: 3180. https://doi.org/10.3390/su10093180
Note that from the first issue of 2016, this journal uses article numbers instead of page numbers. See further details here.