Exploring the Hierarchical Structure of China’s Railway Network from 2008 to 2017


1
School of Architecture and Urban Planning, Huazhong University of Science and Technology, Wuhan 430074, China
2
Hubei Engineering and Technology Research Center of Urbanization, Wuhan 430074, China
3
National & Local Joint Engineering Research Center of Geo-spatial Information Technology, Fuzhou University, Fuzhou 350002, China
4
Key Laboratory of Spatial Data Mining & Information Sharing of MOE, Fuzhou 350002, China
5
School of Geography and Tourism, Shaanxi Normal University, Xi’an 710119, China
6
Geomatics Technology and Application key Laboratory of Qinghai Province, Xining 810001, China
*
Author to whom correspondence should be addressed.
Sustainability 2018, 10(9), 3173; https://doi.org/10.3390/su10093173
Submission received: 19 July 2018
/
Revised: 12 August 2018
/
Accepted: 31 August 2018
/
Published: 5 September 2018
Abstract
:The analysis of transport networks is an important component of urban and regional development and planning. Based on the four main stages of China’s railway development from 2008 to 2017, this paper analyzes the hierarchical and spatial heterogeneity distribution of train flows. We found a high degree of spatial matching with the distribution of China’s main railway corridors. Then, using a classical community detection algorithm, this paper attempts to describe the functional structure and regional effects of China’s railway network. We also explore the impacts of construction policies and changes to train operations on the spatial organizing pattern and evolution of network hierarchies. The results of this empirical study reveal a clear pattern of independent communities, which in turn indicates the existence of a hierarchical structure in China’s railway network. The decreases in both the number of communities and average distance between community centers indicate that the newer high-speed rail services have shortened the connections between cities. In addition, the detected communities are inconsistent with China’s actual administrative divisions in terms of quantity and boundaries. The spatial spillover and segmentation effects cause the railway network in different regions to be self-contained. Finally, the detected communities in each stage can be divided into the categories of monocentric structure, dual-nuclei structure, and polycentric structure according to the number of extracted hubs. The polycentric structure is the dominant mode, which shows that the railway network has significant spatial dependence and a diversified spatial organization mode. This study has great significance for policymakers seeking to guide the future construction of high-speed rail lines and optimize national or regional railway networks.
1. Introduction
A national transportation network can intuitively reflect the functional relationships and connectivity between cities and reveal the spatial pattern and evolution characteristics of urban connections. This information can be applied to the evaluation of urban hierarchical systems and urban agglomeration development levels [1,2,3]. However, few studies have investigated the spatial organization structure between cities to further reveal the role of transportation in the expansion of urban spaces, as well as the relationship between transport network construction and the evolution of urban spatial structures.
Many previous studies have focused on spatial distribution and connectivity structures based on civil aviation network [4,5], railway passenger and cargo flow [6,7], intercity container and automobile passenger flow [8], and other data at a national or regional scale. These studies are also within the scope of the urban network proposed by Taylor [9,10]. Based on this theory, many scholars use GPS (Global Positioning System) tracking data [11], mobile phone signaling data [12], social media data [13], and knowledge network data [14,15] to explore urban spatial interactions and hierarchical structures. For instance, Guimera and Amaral used a community analysis method as well as a geopolitical theory to analyze the global aviation network structure and city roles within that structure [16]. Maggioni et al. built a knowledge innovation network by using patent cooperation between different cities [14]. Alderson and Beckfield utilized the distribution data of the world’s top 500 multinational corporation headquarters and branches in 3692 cities around the world to analyze the most powerful dominating characteristics and structures [17]. Smith and Timberlake used air passenger flow between cities to reflect the network structure between those cities [18]. This is different from the way enterprise networks indirectly reflect the urban network. In general, relatively few studies have been conducted to examine urban hierarchy and agglomeration from the perspective of a railway network.
In recent years in particular, China’s high-speed railway (HSR) service is maintaining a rapid pace in terms of construction, and this network may play an important role in the country’s urban development and regional reconstruction. As a means of rapid transportation, high-speed trains can not only shorten the travel time between cities, but they also affect the connectivity between those cities [19]. To date, studies of the effects of high-speed railways have mainly focused on the accessibility and spatial–temporal shrinking [7,19], regional development [20], and spatial structure [21], as well as other modes of transportation [22,23]. For instance, Gutierrez and Coto-Manan et al. analyzed the development of the high-speed rail system in the European Union. These scholars both concluded that the accessibility of the central region has been significantly improved, and these areas have also experienced many opportunities in terms of development. However, marginal areas (such as Spain and Portugal) have been further marginalized, and their development prospects have not improved significantly [24,25]. Ortega et al. found that high-speed railways promote the equalization of accessibility distribution at a national level. At the micro level, however, equilibrium and polarization coexist [26]. In addition, when a new high-speed rail station is located in a core city, the centrality of that city will be enhanced. However, few studies to date have focused on the structure of urban networks from the perspective of high-speed rail train flows.
The “space of flow” proposed by Castells emphasizes the value of urban nodes in shaping the entire network system [27]. Cities in a transportation network mainly take on the roles of regional transportation hubs, information hubs, and communication hubs [28]. The use of these networks for the purposes of urban hierarchical structure studies allows researchers to focus on the roles and hierarchy of global and regional world cities [9,10,29,30]. With regard to the formation mechanism of urban agglomerations, Whebell used the “corridor theory” to explain and conclude that the driving force behind urban agglomeration is cities actively growing along the main transportation line, thus presenting a linear growth model [31]. However, research into portraying urban networks, or of generating regional spatial structures based on railway flows, is rare.
A railway network is an important and indispensable part of the national transportation network. Correspondingly, the study of intercity relationships and spatial interactions based on railway passenger flow is an important regional spatial structure research method. Current studies of regional spatial structures are also gradually transforming from the traditional central place model to an open, shifting and polycentric network model [32,33]. From both urban and national scales, high-speed rail services have changed the spatial layouts of urban population and industry, thus changing the direction of urban land expansion. Railway networks have also promoted the expansion of multicenter urban development [34]. Understanding the spatial organization structure between cities is conducive to revealing the role of transportation in the expansion of urban spaces, as well as the relationship between high-speed railway construction and the evolution of urban spatial structures.
Fortunately, a significant feature of complex networks is the community structure presented in the network [35]. It is of important practical value to automatically detect communities in large complex networks. Current famous community detection algorithms include Girvan–Newman [36], Walktrap [37], Fast-greedy [35], Multilevel fast unfolding [38], Label Propagation Algorithm (LPA) [39], Speaker–listener LPA [40], and Infomap [41]. Detecting communities helps us understand and develop these networks more effectively. For example, communities in social networks represent physical, social groups that are founded and based on people with the same interests or backgrounds [42]. Communities in paper citation networks share the same topics [43,44]. The communities on the World Wide Web are comprised of numerous websites that discuss closely related topics [45]. In addition, urban network development patterns in the real world can be mapped from different types of intercity flows. This pattern is constrained a certain extent to urban spatial interactions and geographic distances. However, because of limitations in terms of data acquisition, current studies of China’s urban network hierarchy based on the perspective of transportation flows mainly focus on the perspectives of airflow and railway flow extracted from statistical yearbooks. Studies that portray urban networks or regional interactions based on a national scale of the railway flows of all the cities are rarely seen.
At present, China is in a stage of rapid urbanization. Cities in China are undergoing dramatic changes at an unprecedented rate. In recent years, the construction of the high-speed railway network has been booming. This construction boom has had a strong catalytic effect on the urbanization process and has also had an important impact on the spatial structure of urban areas. Therefore, this paper analyzes the hierarchical and spatial heterogeneity distribution of train flows. Our study is based on the railway flows between more than 2600 cities. Moreover, the functional structure and regional effects of China’s urban network are also examined by using a classical community detection algorithm. The significances of this paper are its ability to provide a new method for urban network research, based on national train timetables. In addition, the hierarchical pattern and central structure of China’s railway network are thoroughly explored. Our results could be referenced by policymakers involved in high-speed railway construction, urban system recognition and urban agglomeration development.
The remaining parts of this paper are organized as follows. Section 2 gives a brief introduction to the development of China’s railway system during the past decade and introduces the acquisition of train timetable dataset. Section 3 describes the modeling of railway network and methodology used in our research. Section 4 discusses the analysis results. Section 5 summarizes our findings and discusses future research directions.
2. Development of Railway System and Dataset
2.1. Development of Railway System
Firstly, this paper gives a brief introduction and description of China’s railway development, from 2008 to 2017. Prior to August 2008, there were no high-speed rail services in China. On 1 August 2008, the first intercity high-speed railway line was opened between Beijing and Tianjin. China’s high-speed railway network then entered a period of rapid expansion. The running speed and the frequency of trains on newly built high-speed railway lines are significantly higher than those on traditional lines. These two changes may have different impacts on urban network space structures. In addition, changes in operational policies have occurred during the construction of China’s high-speed rail network. In July 2011, the Ministry of Railways implemented a comprehensive speed reduction policy, in order to ensure the safety of China’s railway network. High-speed trains that previously travelled at speeds of up to 350 km/h are now restricted to a maximum speed of 300 km/h. High-speed trains that were previously allowed to travel at 250 km/h now have a reduced speed limit of 200 km/h. Finally, lines on which trains could travel 200 km/h are now operated with a speed limit of 160 km/h [7]. On 1 January 2013, the Ministry of Railways implemented a price reduction policy. The highest journey price was reduced by 2% of the basic train fare. Adding more high-speed rail lines will also affect the major adjustments to the national train schedule. The train timetable is a fundamental problem in the operation of a train network [46]. The timetable issue will also affect the evolution of China’s high-speed rail (HSR) network structure.
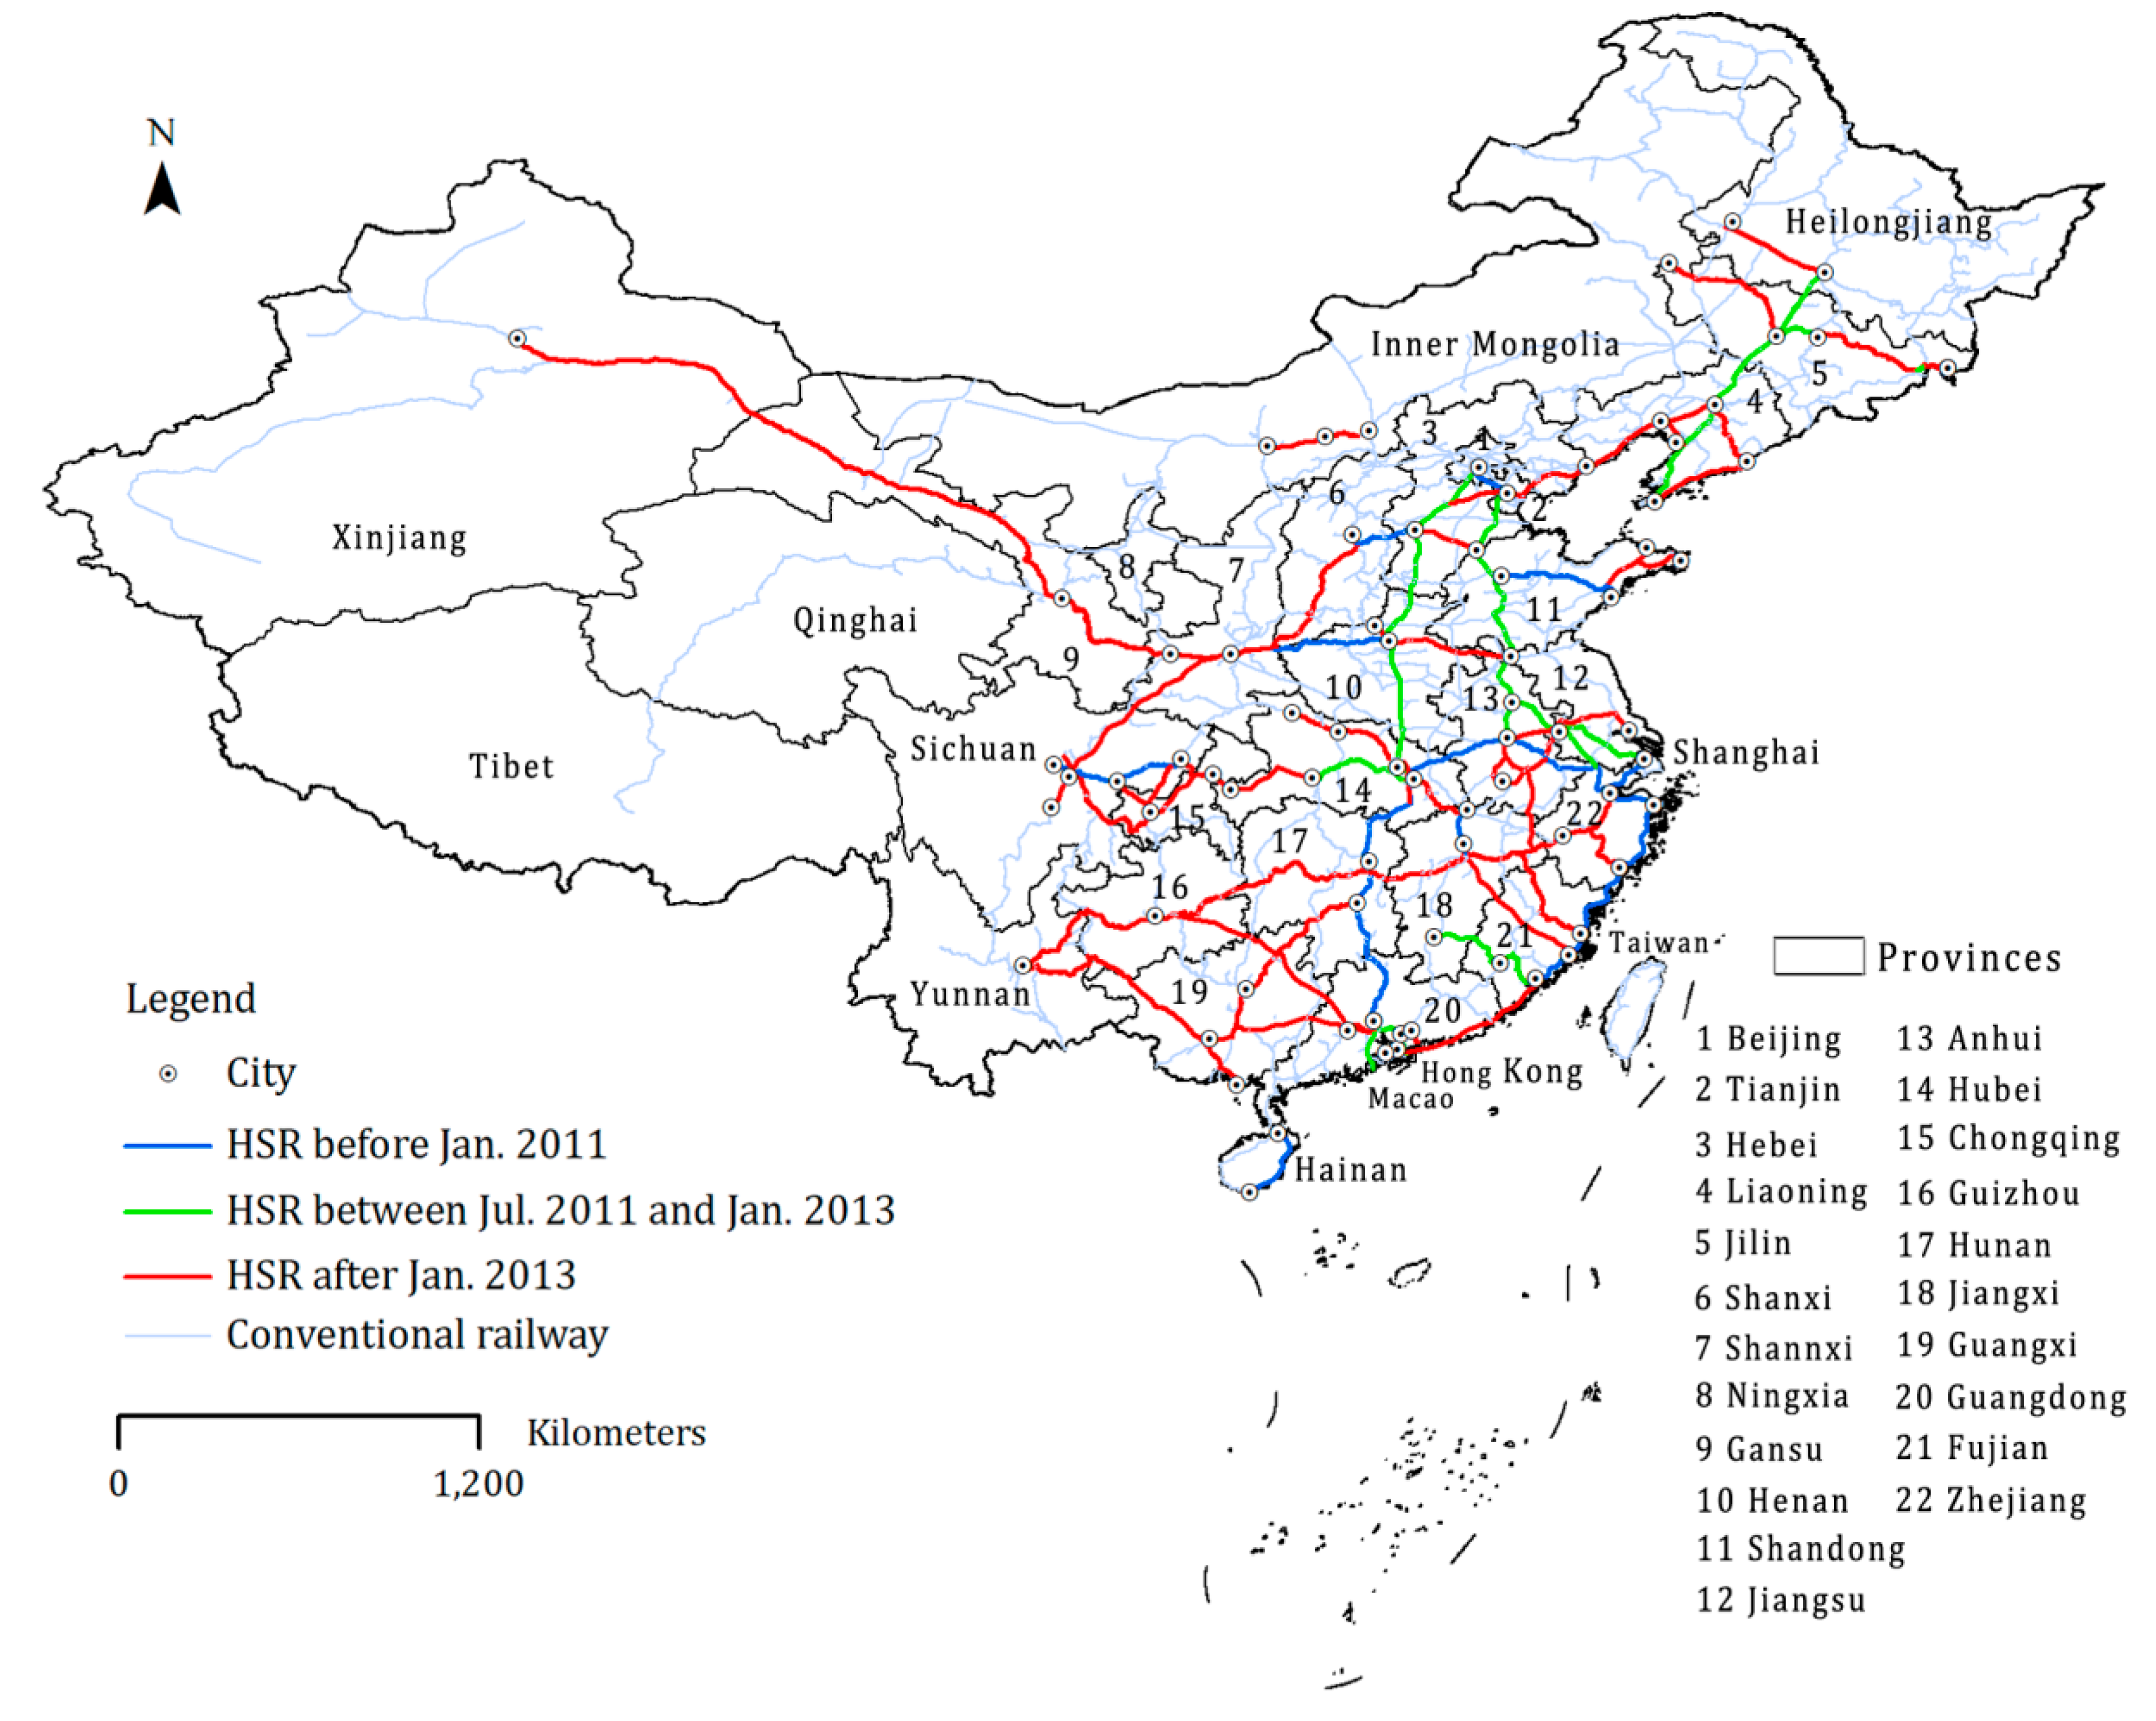
Therefore, this paper divides the development of China’s railway system into four main stages in the years from 2008 to 2017: (1) the stage with traditional rail services only (prior to August 2008); (2) the stage with several HSR lines (between August 2008 and July 2011); (3) the stage with a steadily growing number of HSR lines (between July 2011 and January 2013), and (4) a stage with a rapidly growing number of HSR and intercity-HSR lines (between January 2013 and July 2017), as shown in Table 1. The spatial distributions of railway lines in each stage are shown in Figure 1.
2.2. Train Timetable Data
The traffic flow data in the previous research are usually aviation flow, railway flow, or maritime data from statistics yearbook, while researches by using railway flow data between cities on the national scale are almost rare. The data used in this paper are train timetables of all the cities in China. It can be obtained from the official website of the China Railway System (http://www.12306.cn). The train timetable is a form of information that gives the arrival, departure, and stop times of each train route at each railway station. Table 2 gives an example of the timetable of rail line G651 in stage 3. The coordinates of each station are obtained from Google Maps. The railway systems in Hong Kong, Macao, and Taiwan are excluded in this paper.
3. Methodology
3.1. P-Space Graph of Railway Network
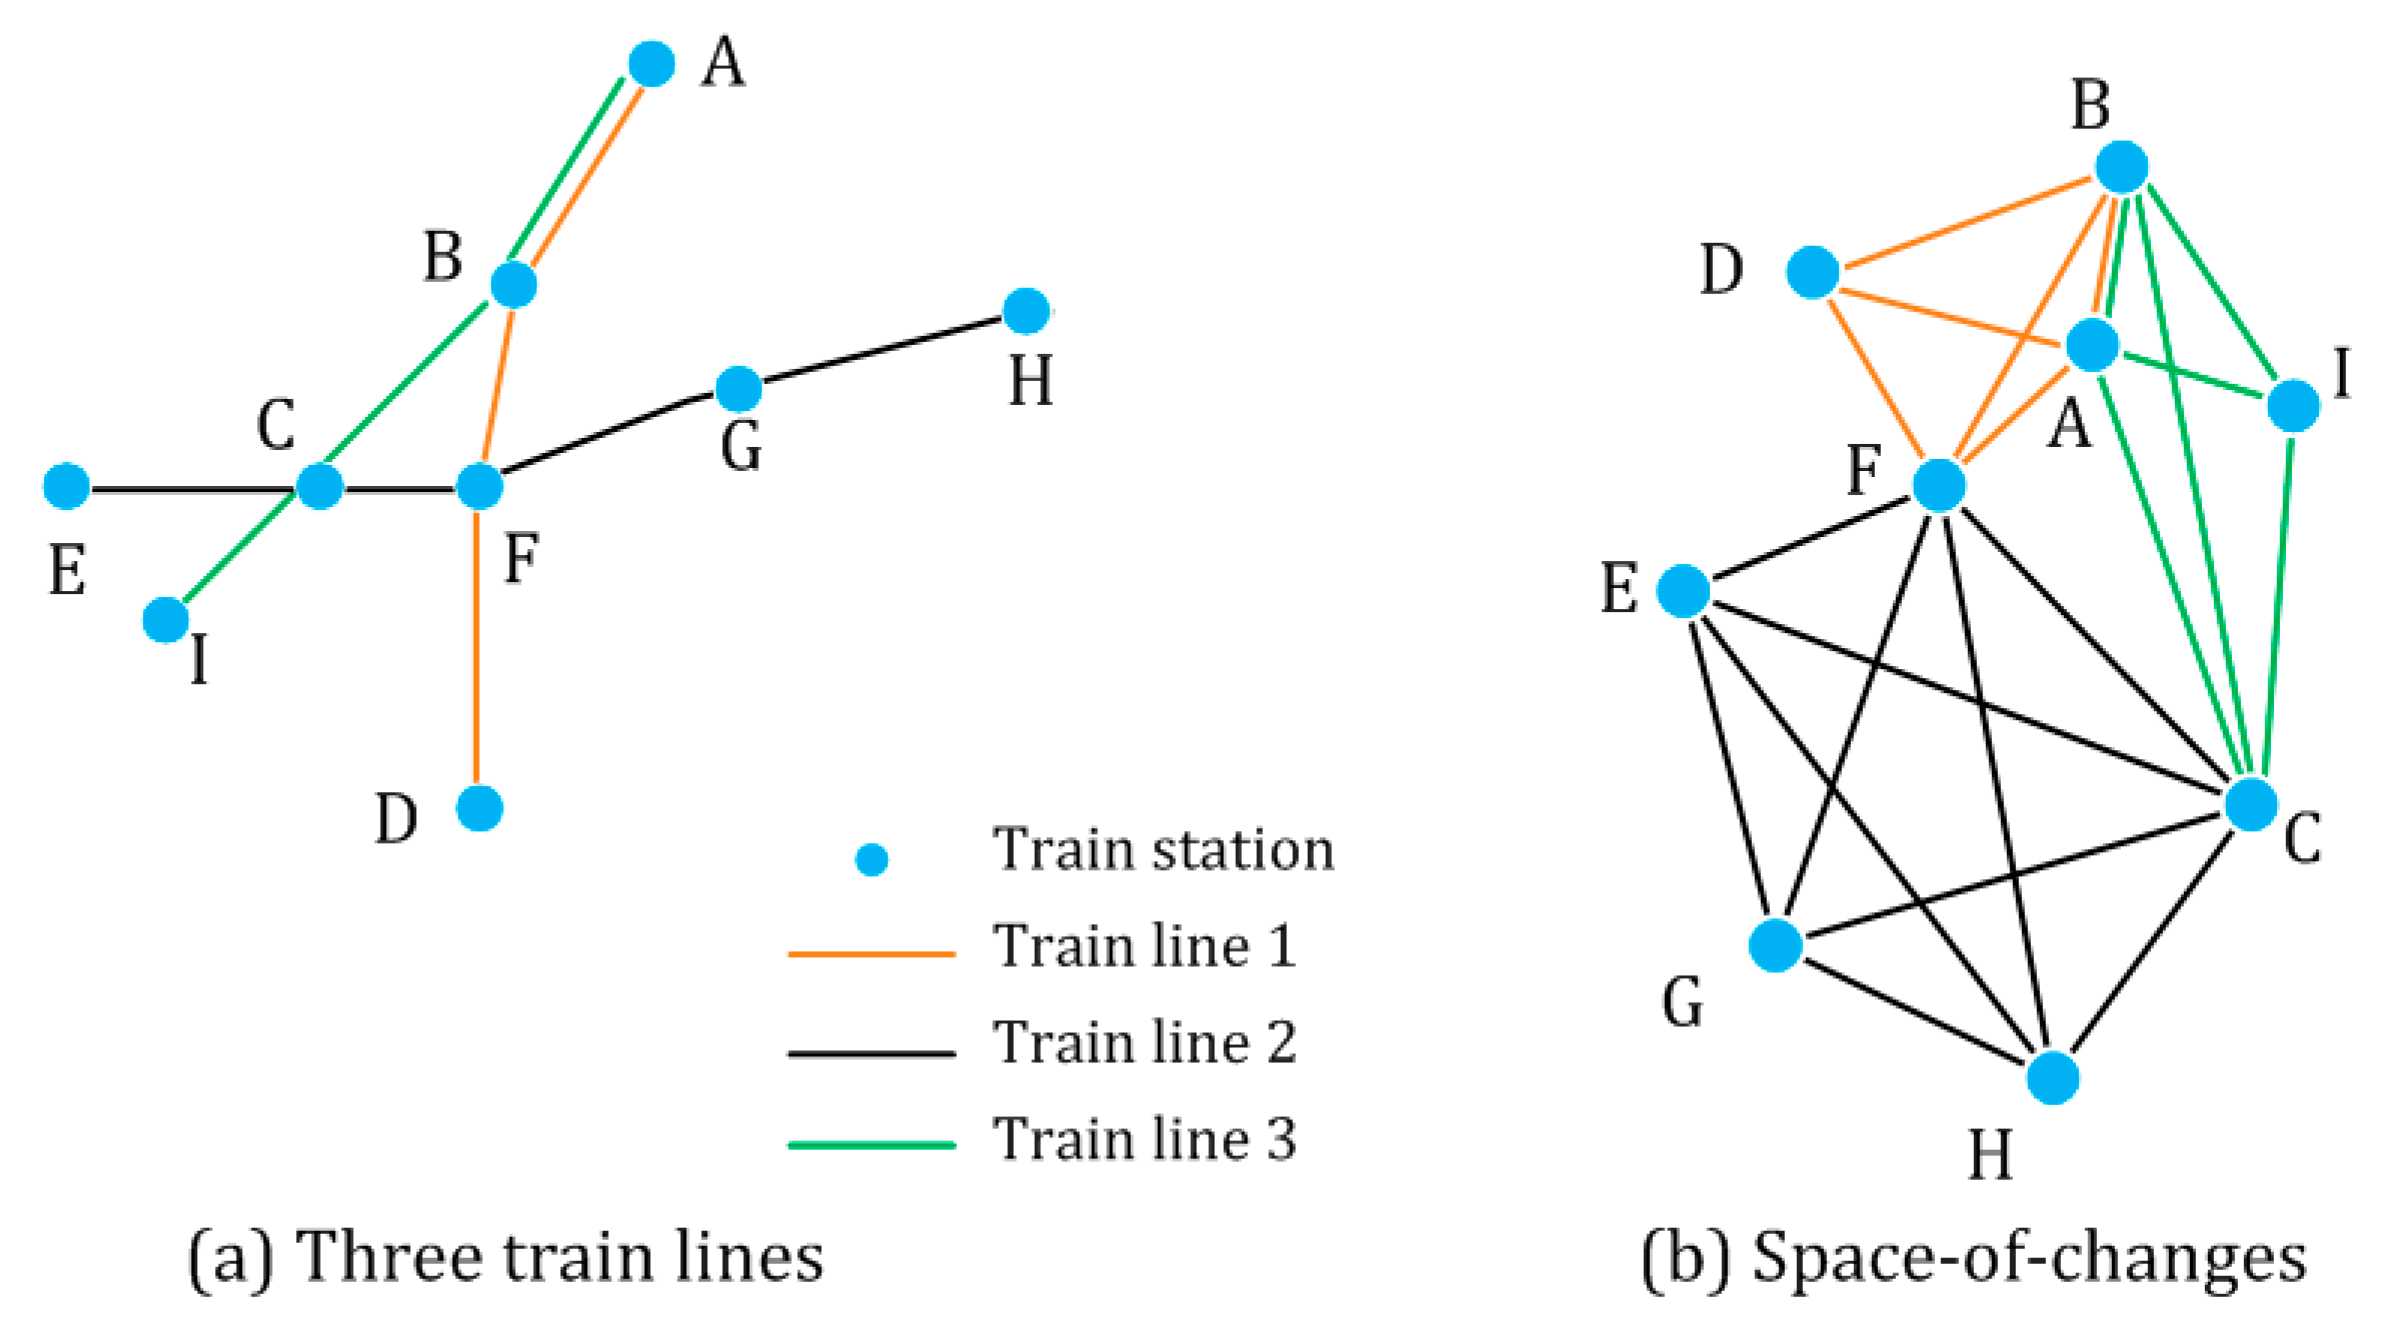
At present, two popular methods are used to transfer traffic routes into a network, namely the L-space model and P-space model [47,48]. In the L-space model, only two adjacent nodes in the same route are considered to be directly connected. However, in the P-space model, all sequential node pairs on the same route are considered to be connected. This method was used early on for a network analysis of Indian railway networks [48]. Unlike the L-space model, the P-space model is more focused on whether two nodes are accessible. Therefore, the P-space model is more suitable for a spatial transfer and correlation analysis. Therefore, this paper uses the P-space model to build a railway network based on train timetables. As shown in Figure 2, for example, Train Line 3 passes through the four cities of A–B–C–I. This line can thus be converted into six links: A–B, B–C, C–I, A–C, A–I, and B–I.
More specifically, there may be two or more stations in one city, e.g., the Wuhan railway station, Hankou railway station, and Wuchang railway station, all of which are located in Wuhan City. In our model, all stations located in one city are treated as one node; i.e., the city where they are located.
3.2. Community Detection for Railway Network
The division of community structure is based on the principle of similarity. The connections between nodes in the same community are very close. In addition, the connections between node pairs in different communities are relatively sparse, as shown in Figure 3. This idea is consistent with the first law of geography [49], which points out that things that are near to each other are also more closely related to each other. In this paper, urban distance refers to the topological distance of the cities in the network and not the geographical distance between cities. The calculation of topological distance considers the intensity of the connection, which has been validated in the community detections of many other networks [50,51]. In other words, the higher the degree of linkages, the smaller the topological distance between that pair of cities will be.
The community detection algorithm used in this paper is the Fast Unfolding algorithm, which is a heuristic community discovery algorithm based on modularity optimization first proposed by Newman and Girvan [36]. This algorithm contains a hierarchy of structures and offers good performance and efficiency. This algorithm can discover the hierarchical structure that exists in a detected community while the modularity of the network is maximized. In this study, we executed the Fast Unfolding algorithm by using the software Gephi.
3.3. Assessing the Influence of Nodes within Each Community
The within-module degree (z-score) and the participation coefficient (p-value) are two popular indicators used to measure the influence of nodes within a specific network [16,52]. The mechanism behind these two indicators is that, if the nodes in a network have similar topological properties, those nodes have a high possibility of playing a similar role in that network. The within-module degree z-score measures the degree centrality of a certain node within a module [52], which is calculated as follows:
Here, is the number of links of node v within its own community j’; and are the mean value and standard deviation, respectively, of of all the nodes within the community.
The participation coefficient (p-value) measures the amount of variation in intermodular node connections. This indicator quantifies the degree of connectivity between a specific node and other nodes that do not belong to the same community. The p-value of node vi is calculated as follows:
Here, is the number of links of node vi with other nodes in community j; is the degree of node vi, and J is the total number of detected communities. After dividing the railway flow network into communities, the role and influence of the nodes in each community are mainly measured by these two indicators [53,54]. Generally, a node is assessed as a hub when the node’s z-score is more than 2.5. In addition, when the node’s p-value is no more than 0.3, this node is a provincial hub. When its p-value is between 0.3 and 0.75, this node is a connector hub [16].
4. Results and Discussions
4.1. The Spatial Connectivity of Railway Networks
Figure 4 visualizes the train flows between cities at each stage. From a macroscopic perspective, the distributions of China’s railway flows are of significant spatial heterogeneity, and the guiding role of railway traffic in regional spatial correlation appears. In addition, the flows show strongly spatial dependence and hierarchical characteristics, and the corridor effect is significant. The common features of the four stages are that the corridor effects are consistent with the horizontal and vertical railway arteries in China. The vertical linkages are also obviously stronger than the horizontal linkages.
In Stage 1, the three vertical and two horizontal corridors constitute the backbone of the railway network. These corridors became the most important development axes of China’s land space development. Of all the corridors, the “three verticals” are mainly along the Beijing–Harbin line, the Beijing–Guangzhou line, and the Beijing–Shanghai line. Due to their high density and radiation range, they form the vertical urban association corridors. In addition, the “two horizontals” are mainly along the Xuzhou–Xi’an and Changsha–Shanghai lines. These are two of the most important regional development axes from eastern to western China. For example, in Stage 1, the link strengths of the Beijing–Wuhan, Changsha–Guangzhou, Beijing–Harbin, Beijing–Shanghai, Changsha–Shanghai, Zhengzhou–Xi’an (and other) railway lines were more than 40. However, horizontal linkages are generally weaker than the linkages of vertical corridors. In Stage 2 and Stage 3, the link strengths of Beijing, Shanghai, Zhengzhou, and Guangzhou, which are important nodes along vertical corridors, obviously increased. Moreover, the link strength of the Changsha–Kunming line in the horizontal corridor also increased.
Until Stage 4, the “four vertical and four horizontal” corridors of China’s railway network had only been preliminarily formed, as shown in Figure 4d. In the four vertical corridors, the link strengths along the Beijing–Zhengzhou line, Wuhan–Guangzhou line, Beijing–Shanghai line, significantly improved at Stage 4, with all now over 140. Meanwhile, the link strength along the Beijing–Harbin line has also increased, but only slightly. In addition, the four horizontal corridors along the Shanghai–Wuhan–Chengdu, Shanghai–Changsha–Kunming, Xuzhou–Xi’an–Urumqi, and Jinan–Shijiazhuang lines all have high linkages (more than 40). These heterogeneous distributions of railway flows have important reference value for anyone seeking to understand the spatial pattern of China’s urban network. It is worth noting that these distribution patterns are consistent with the “developing corridors strategy” proposed in China’s new urbanization plan [55].
Overall, the number of red, blue, and green segments increased from Stage 1 to Stage 4. These are mainly distributed in the central and eastern parts of China. The linkages statistics are shown in Table 3. The maximum and average values of the linkages between cities show an increasing trend from Stage 1 to Stage 4. The maximum value increased from 202 in Stage 1, to 368 in Stage 4. The mean value increased from 7.66 in Stage 1, to 11.44 in Stage 4, representing a growth rate of 49.34%. In addition, the linkages statistics almost remained stable from Stage 2 to Stage 3. However, in terms of spatial distribution, the train flows in the surrounding area of Nanjing and along the Kunming–Changsha line have significantly changed.
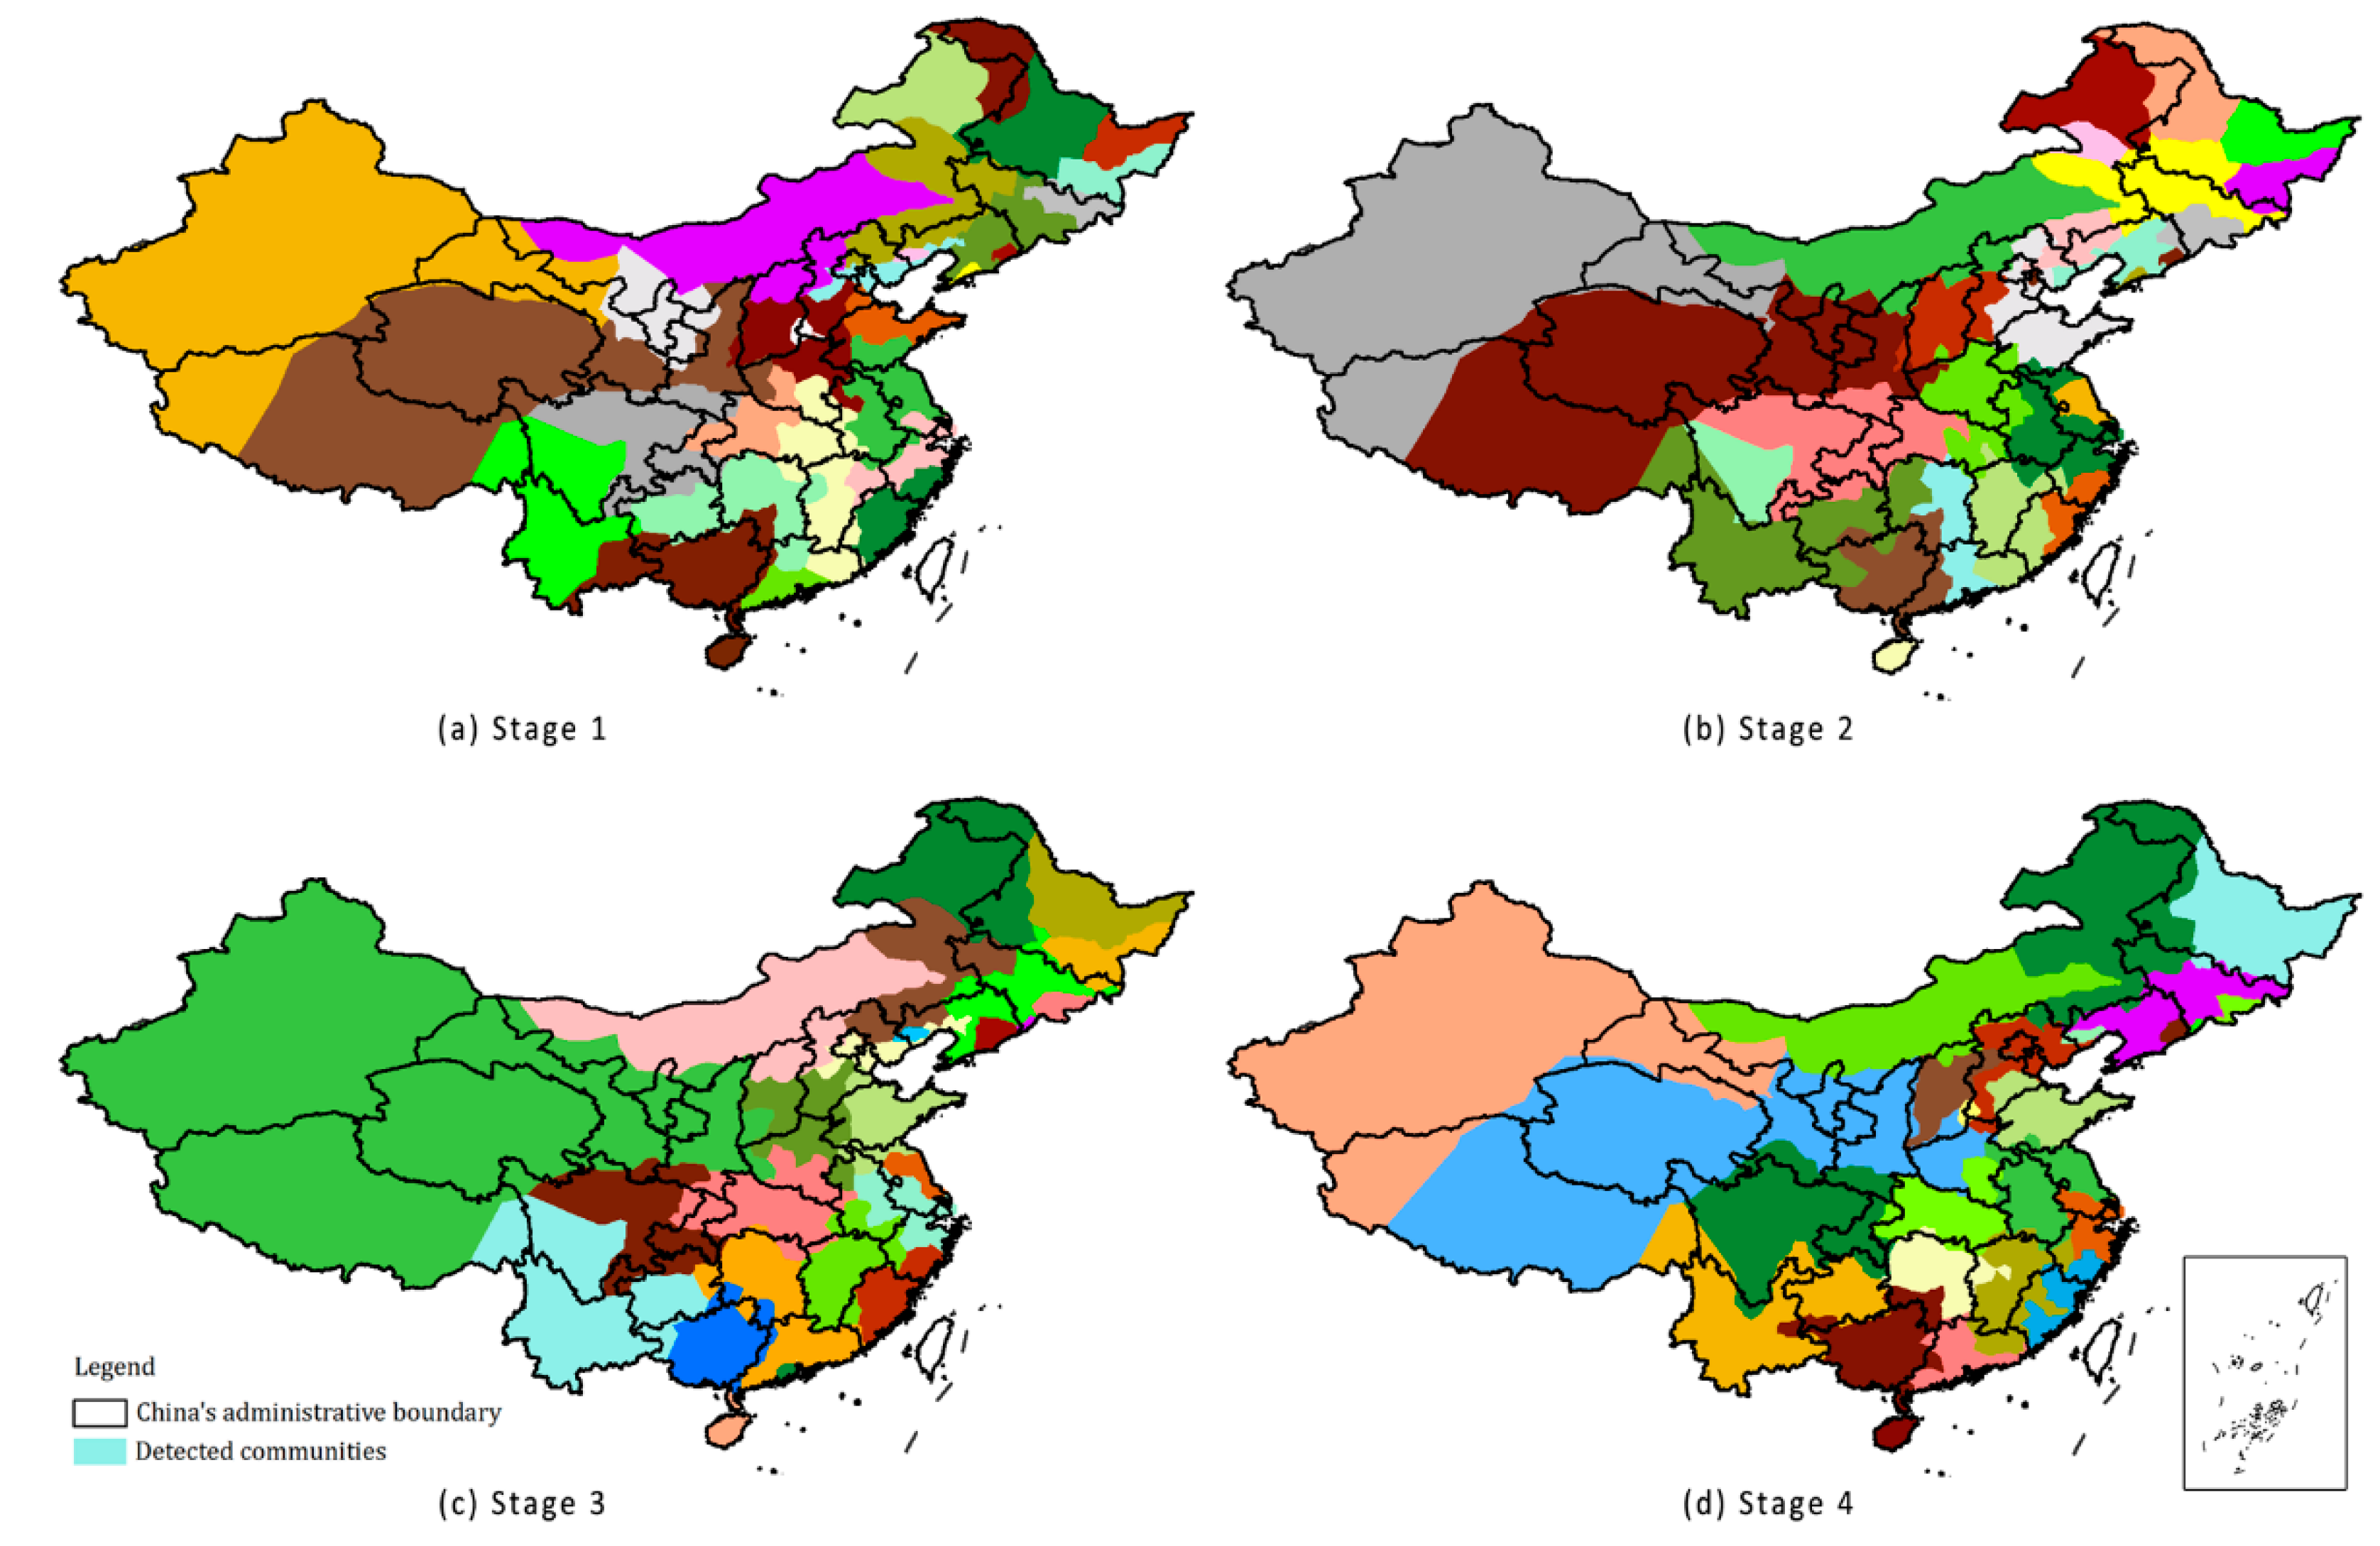
4.2. Community Detection
Based on the railway flow results in the previous section, Table 4 shows the community detection results of the railway network during each stage. The modularity values of the four stages are not obviously changed. They are distributed between 0.83 and 0.86, indicating that the detected community structure of the network is relatively stable. However, the construction of high-speed railways and the adjustment of operational policies have led to significant changes in the community structure of railway networks. The number of communities decreased from 30 in Stage 1, to 24 in Stage 4. The spatial extent and layout of the community also changed, as shown in Figure 5 and Table 4. In general, the continuous introduction of high-speed rail services into the railway network, together with the corresponding rearrangement of train timetables, will result in a decrease in both the number of communities and the average distance between community centers. Combined, this indicates the likelihood of a closer connection between communities.
From Stage 2 to Stage 3, China’s high-speed rail managers implemented both price reduction and speed reduction policies. The train timetable has also undergone major adjustments. The number of detected communities has decreased from 29 to 24, indicating that operational policies have had a profound impact on the linkages between cities and regions. In the process of urban and regional development, the acceleration of regional railway construction projects has served the dual purposes of improving accessibility and developing the regional economy [19]. The major differences in the number of community detections during the different stages are mainly reflected in the northeastern part of China. During Stage 1, the provinces of Inner Mongolia, Heilongjiang, Liaoning, and Jilin were mainly divided into 13 communities. However, during Stage 4, these four provinces were divided into seven communities, a reduction of six in number. In the three provinces of northeast China (Heilongjiang, Liaoning, and Jilin), the number of train stations is very dense (exceeding 660). This figure accounts for 24.50% of the total number of train stations in China. With the opening of the Shenyang–Harbin high-speed railway line in Stage 3, the cities in the northernmost provinces of Heilongjiang and Jilin became more directly and closely linked to the cities in other provinces.
The spatial layout pattern of community structures is influenced by railway corridors, operational policies, administrative divisions, and geographical conditions. The layout pattern also has a high coupling with the spatial distribution of some urban agglomerations in China, such as the Yangtze River delta urban agglomerations centered at Shanghai, and the Pearl River delta urban agglomerations centered at Guangzhou. In addition, from the perspective of spatial extent, most of the community scopes are larger than the urban agglomerations, which are close to the provincial scale. However, some new regional structures have also been identified.
Firstly, the regional spillover effect of the railway network is very obvious. The spatial spillover effect can form interprovincial regional connections across intrinsic administrative boundaries. The direction of spatial spillover is affected by the prevailing geographic conditions. For example, Yunnan is located in southwestern China, and its spillover direction is north and east. In addition, the spillover effect is also affected by the railway corridor. For instance, all cities in the provinces of Qinghai and Tibet are amalgamated into the same community. Moreover, the opening of high-speed rail services will accelerate this spillover effect. For example, during Stage 2, with the opening of the Zhengzhou–Xi’an high-speed railway line, the Qinghai and Tibet community expanded to Ningxia. In addition, the community’s expansion covered the whole Shaanxi Province, as well as the eastern part of Henan Province in Stage 4. Meanwhile, during Stage 1, all cities along the Zhengzhou–Wuhan–Guangzhou railway were amalgamated into the same community. In Stage 2, with the opening of the Wuhan–Guangzhou high-speed railway line, the cities along the Wuhan–Guangzhou high-speed railway were also amalgamated into the same community. The radiation range along the line has expanded to the provinces of Hunan and Fujian.
Secondly, the spatial segmentation effect of intrinsic provincial boundaries is also obvious. This effect is most evident in the northeastern part of China, while independent provinces are being concentrated into shrinking and tight communities. For example, Heilongjiang Province was mainly divided into three communities. Four small communities also appeared in Liaoning Province during Stage 1. Prior to Stage 4, the three provinces of Heilongjiang, Jilin, and Liaoning were divided into two main communities and three small communities. Moreover, the provincial administrative boundary has become an important dividing line in different communities. Examples from Stage 1 include the southern part of Anhui Province and the southern part of Guizhou Province. During Stage 3 and Stage 4, Guangxi Province and the discovered communities were especially highly consistent. However, most of the community borders are inconsistent with intrinsic provincial administrative boundaries. For example, during Stage 1, the southern part of Zhejiang City was amalgamated into the Fujian community. During Stage 3, the southern part of Anhui and the eastern part of Zhejiang were amalgamated into the same community.
4.3. Analyzing the Influences of Nodes
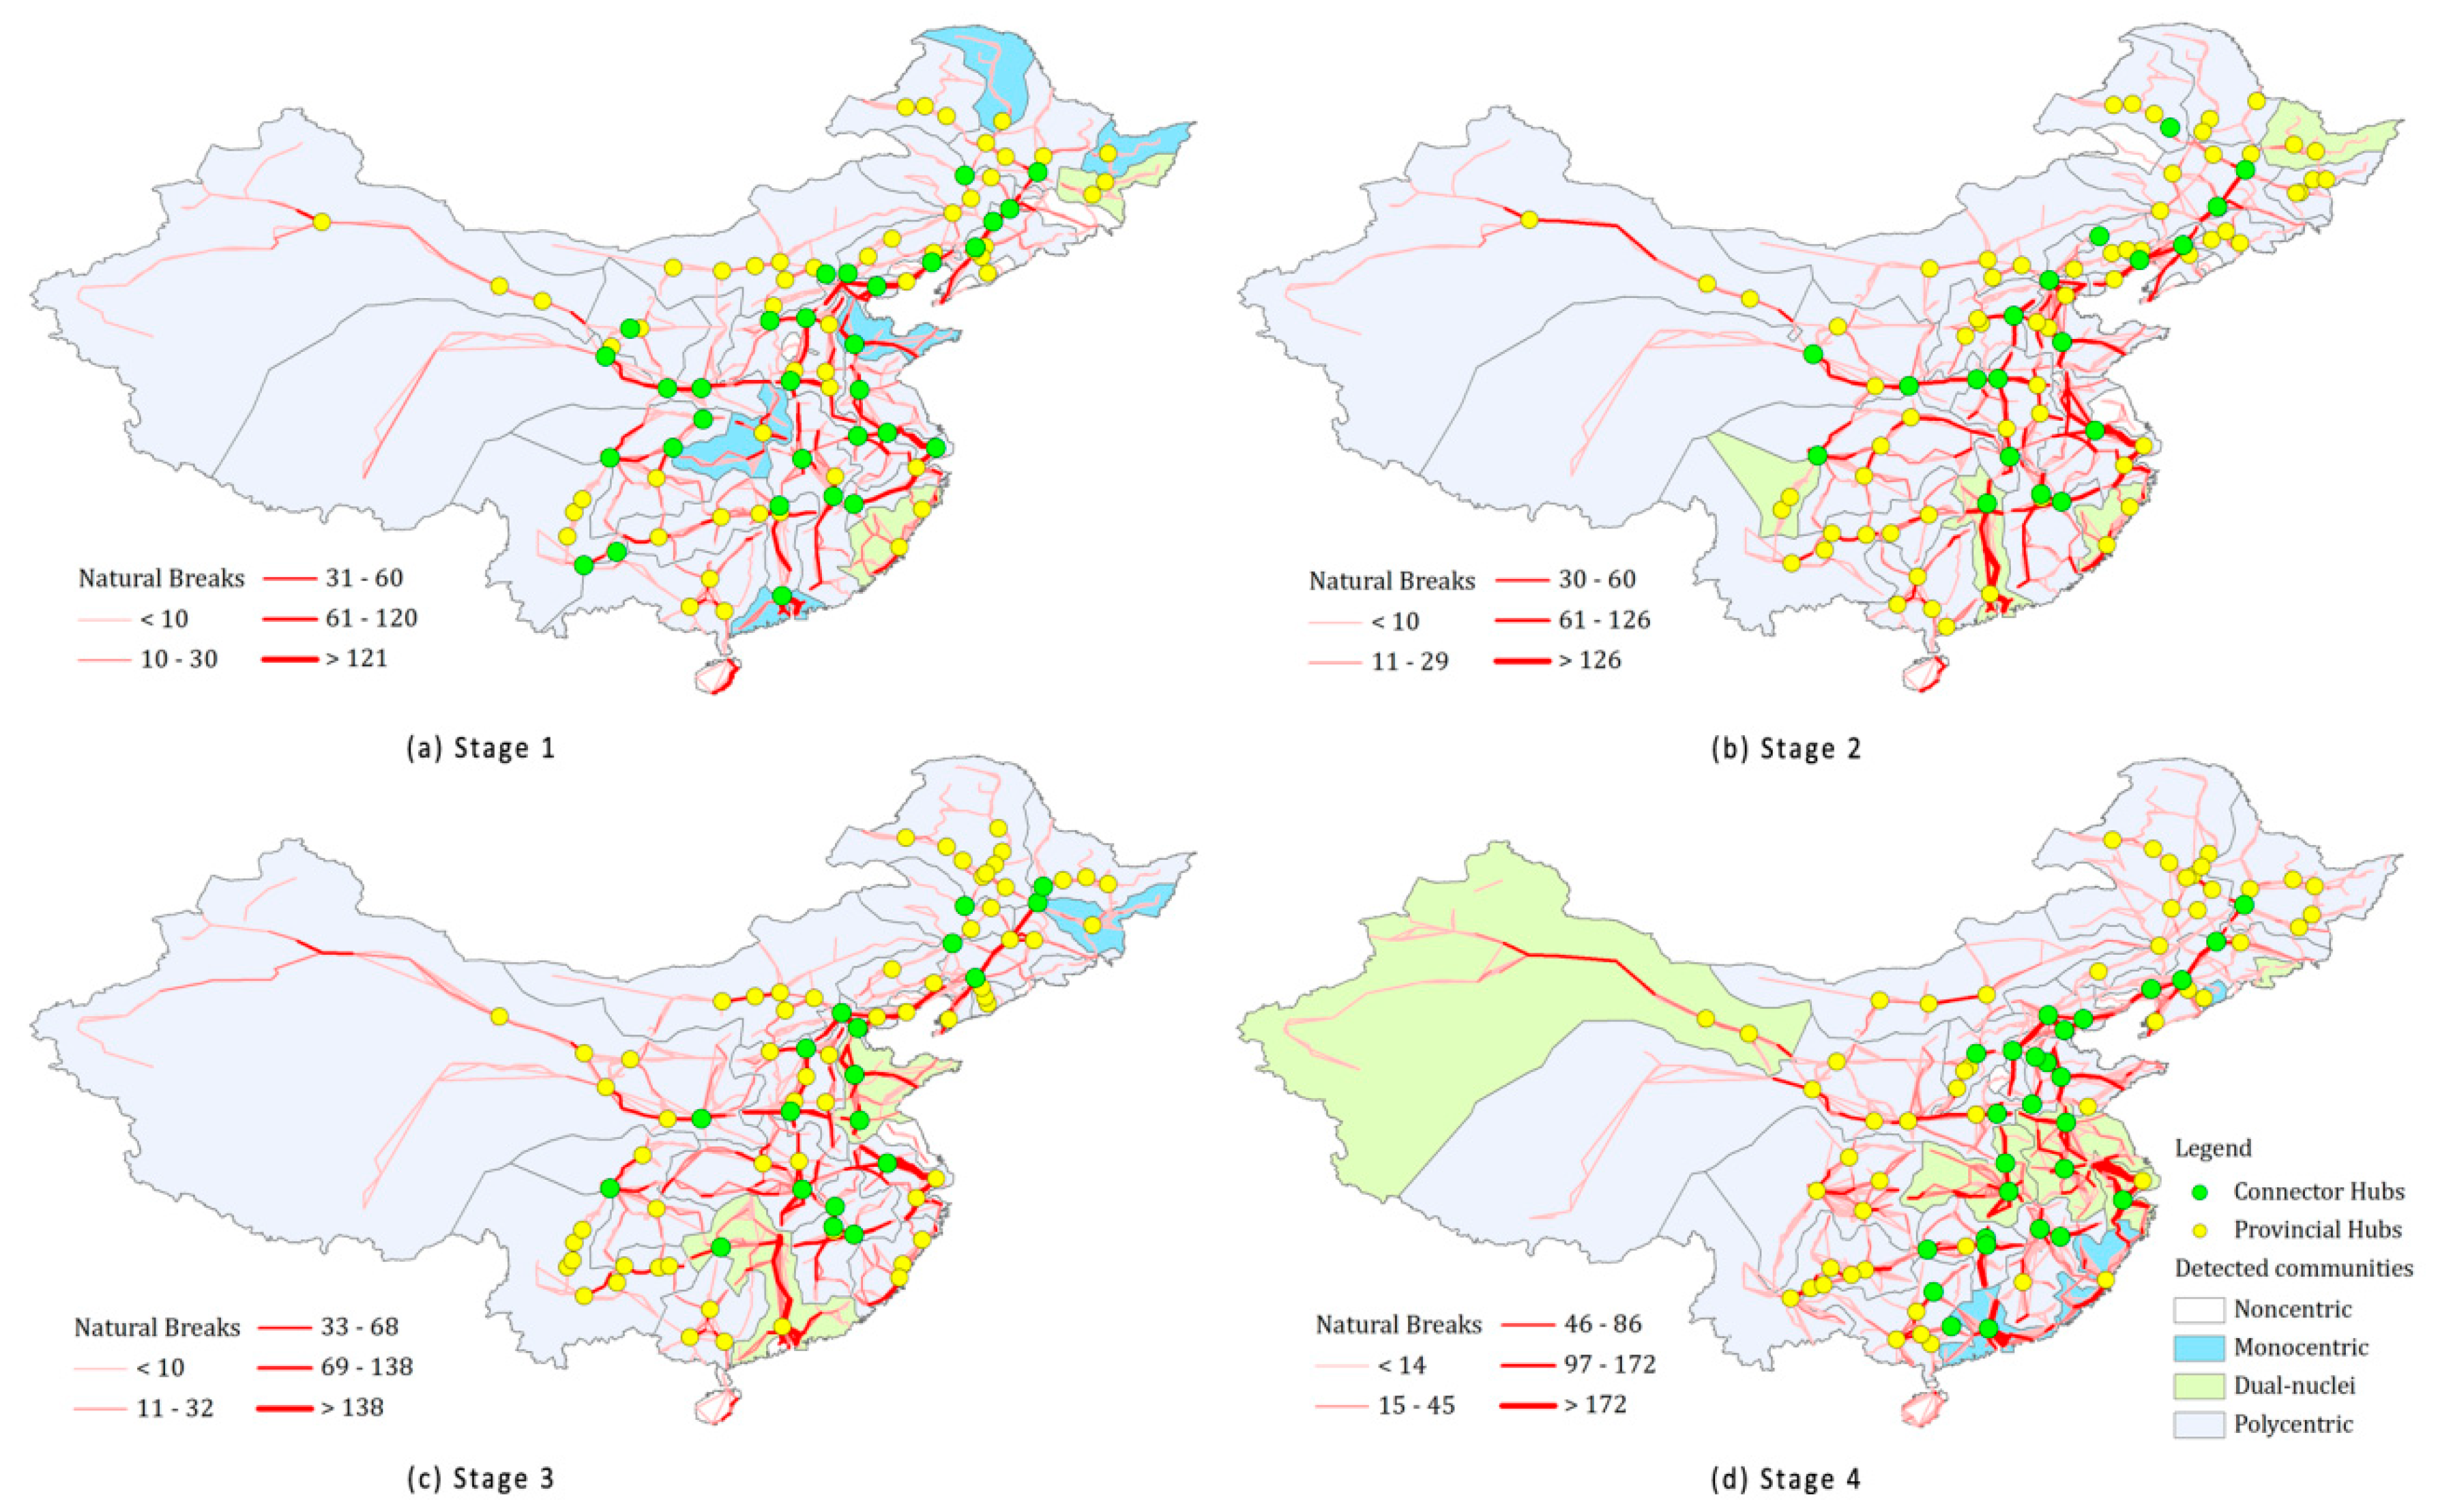
The within-network degree z-score and the participation coefficient p-value for all nodes in different communities were calculated according to Equation (3). By setting the z-score at greater than 2.5 and the range of the p-score, the number of provincial hubs and connector hubs are obtained in each stage [16]. As shown in Table 5, only approximately 3% of the cities are recognized as hubs, and all the other nodes are classified as nonhubs. Overall, railway networks in different regions are self-contained, showing significant spatial dependence and diverse spatial patterns. In addition, multilevel and organized regional systems are prominent.
Provincial hubs have a clear corridor effect. This means that the provincial hubs within the same community are mainly found along the same important rail lines. As shown in Figure 6, the rates of the train flows passing through the provincial hubs are not often the highest, but rather they are the second and third level in terms of the natural breaks division. In addition, the number of hubs in the three northeastern provinces (Heilongjiang, Jilin, and Liaoning) during each stage was as high as 20, with a proportion of more than 23% of all the hubs. The main reason for this is that, in the northeastern part of China, the number of train stations and the density of railway networks are very high. The number of stations in these three provinces is more than 660, which accounts for approximately 24.50% of all of China’s railway stations. This makes creating regional hubs very easy.
Connector hubs are mostly provincial capitals in the provinces. For example, of the 31 connector hubs in existence during Stage 1, 18 were provincial capitals. By Stage 4, of the 27 connector hubs, 15 were provincial capitals. Moreover, the connector hubs are mainly located on the “four horizontal and four vertical” axes of the railway’s skeleton network. With the evolution of China’s railway network, the distribution of connector hubs has also become relatively concentrated. In addition, as is apparent from Figure 6, the rate of train flows passing through the connector hubs is at the highest level in terms of the natural breaks division method. The distribution patterns of provincial hubs and connectivity hubs further indicate that high-level cities are more inclined to overcome the constraints of geographical distance. However, the intercity link strength within the same community is still constrained by real geographical constraints.
4.4. Inner Structure of Each Detected Community
According to the number of provincial and connector hubs, the inner spatial structure of detected communities during each stage can be roughly divided into classifications of monocentric structure, dual-nuclei structure, polycentric structure and noncentric structure. The classification results are shown in Table 6. More than 75% of the communities clearly display a central structure system.
As shown in Table 6, there are 5, 0, 1, and 3 monocentric communities, respectively, from Stage 1 to Stage 4. Figure 6 shows the spatial distribution of different community structures. The monocentric communities are mainly located near national borders. For example, four of the five monocentric communities in Stage 1 were distributed in the northeast, the eastern coastal and the southern coastal areas. In Stage 4, all three of the monocentric communities were distributed in the southern and northeastern regions.
The dual-nuclei structure is also very important in terms of regional transportation planning. In Stages 1 and 2, the dual-nuclei communities were dominated by two provincial hub combinations. For instance, five of the six dual-nuclei communities in Stage 1 and Stage 2 were two combined provincial hubs. During Stage 3, either provincial and connector hubs, or two connector hubs were the dominant combinations, as shown in Figure 6a–d. For example, of the two dual-nuclei communities in Stage 3, one was a provincial and connector hub combination, and the other was a combination of two connector hubs. During Stage 4, two communities were connector hub combinations, while one community was a combination of provincial and connector hubs.
The polycentric structure is dominant in all four stages, with a ratio of more than 54% of all structures. The spatial distribution of the provincial hubs in polycentric communities shows a significant corridor effect. The provincial hubs in the same community are mainly located along the same important rail lines. Previous studies have demonstrated that using a polycentric structure is the optional strategy for future population growth and the rational distribution of employment opportunities [56].
5. Conclusions
Based on the train network flows derived from the train timetables of China’s rail network from 2008 to 2017, this paper thoroughly analyzes the impact of the evolution of high-speed railway services and the changes of operational policies on the hierarchical structure of China’s railway network. The links of China’s railway network are distributed heterogeneously between the railway transport nodes. In Stage 2 and Stage 3, the link strengths of the four main vertical railway corridors are very high. This is especially true of the corridors around some important nodes, such as Beijing, Shanghai, Zhengzhou, and Guangzhou, all of which are located along these lines. In addition, the link strength along the Changsha–Kunming line in the horizontal corridor has also improved. Prior to Stage 4, the “four vertical and four horizontal” corridors of China’s railway network had been preliminarily formed. The link strengths along the Beijing–Zhengzhou line, Wuhan–Guangzhou line, Beijing–Shanghai line have been significantly improved; all are over 140. Meanwhile, the link strength along the Beijing–Harbin line has also increased slightly. Overall, the hierarchy and heterogeneity of China’s railway network are obvious.
The results of this empirical research have also revealed that China’s railway network is complex and characterized by a multicommunity structure. These findings were verified through a popular community detection algorithm. The construction of high-speed rail lines and the adjustment of operational policies have led to significant changes in the community structure of China’s railway network. The number of communities has decreased from 30 in Stage 1, to 24 in Stage 4. From Stage 2 to Stage 3, China’s high-speed rail service managers have implemented price reductions and speed reduction policies. The train timetable has also undergone major adjustments. The number of detected communities has decreased from 29 to 24, thus indicating that operational policies have had a profound impact on the linkages between cities and regions. Moreover, the regional spillover and segmentation effects of the railway network are very obvious. The spillover effect could create interprovincial regional connections across intrinsic administrative borders and boundaries. The direction of spatial spillover is affected by geographic conditions. In addition, the provincial administrative boundary has become an important dividing line in some communities. The segmentation effect could cause an independent province to divide into shrinking and concentrated communities.
Finally, this paper assesses the influence of nodes in each detected community. The provincial hubs have a clear corridor effect, while the connector hubs are almost always the capital cities of the provinces. In addition, railway networks in different regional systems are self-contained, showing significant spatial dependence and multiple spatial forms. The inner spatial structure of detected communities can be roughly divided into four types, namely monocentric structure, dual-nuclei structure, polycentric structure, and noncentric structure. The polycentric structure was the dominant structure during all stages, with a ratio of more than 54%. As the evolution of China’s railway system continued, the combinations of hubs were also transformed. For instance, in Stages 1 and 2, the dual-nuclei communities were dominated by two provincial hub combinations. However, during the last two stages, either provincial and connector hubs, or two connector hubs, were the dominant combinations. The overall accessibility of China’s railway network has been improved, according to other studies [7,19]. Thus, the changing inner structures could be referenced by policymakers seeking to optimize national or regional railway networks. We are currently unable to study other real networks but it is believed that the proposed method could be applied to other infrastructures, such as urban roads and highways, water distribution networks.
China is still in a period of rapid urbanization and industrialization. The country’s urban spatial network structure is still undergoing constant renewal and adjustment. Based on the analysis results of railway flows, further optimizing the allocation of infrastructure resources and improving the network efficiency would be helpful in terms of achieving the overall coordinated development of China’s regions. However, the urban network is very complex, being composed of multiple types of flows (e.g., information flow, capital flow, human flow, and so on). Therefore, we feel it is necessary to introduce multiple elements into any urban network analysis. Although the railway network is in a state of rapid development, the rail network’s efficiency should also be the subject of further research in the future.
Author Contributions
The research was mainly conceived and designed by S.L. and Y.H. S.L., Z.Z., and X.Y. performed the experiments and wrote the manuscript. S.L. and Y.H. reviewed the manuscript and provided comments.
Funding
This research was jointly supported by the National Natural Science Foundation of China (Grants 51478199 and 51538004), the China Postdoctoral Science Foundation (No. 2018M632860, 2017M623112), and the Foundation of Geomatics Technology and Application key Laboratory of Qinghai Province (No. QHDX-2018-08).
Conflicts of Interest
The authors declare no conflict of interest.
References
- Bigotte, J.F.; Krass, D.; Antunes, A.P.; Berman, O. Integrated modeling of urban hierarchy and transportation network planning. Transp. Res. Part A Policy Pract. 2010, 44, 506–522. [Google Scholar] [CrossRef]
- Guerrero, D.; Proulhac, L. Freight flows and urban hierarchy. Res. Transp. Bus. Manag. 2014, 11, 105–115. [Google Scholar] [CrossRef] [Green Version]
- Liu, X.; Gong, L.; Gong, Y.; Liu, Y. Revealing travel patterns and city structure with taxi trip data. J. Transp. Geogr. 2015, 43, 78–90. [Google Scholar] [CrossRef] [Green Version]
- Wallace, E.R. Indirect connectivity and hierarchies of urban dominance. Ann. Assoc. Am. Geogr. 2015, 60, 770–785. [Google Scholar]
- Otiso, K.M.; Derudder, B.; Bassens, D.; Devriendt, L.; Witlox, F. Airline connectivity as a measure of the globalization of African cities. Appl. Geogr. 2011, 31, 609–620. [Google Scholar] [CrossRef] [Green Version]
- Wang, R.; Tan, J.X.; Wang, X.; Wang, D.J.; Cai, X. Geographic coarse graining analysis of the railway network of China. Phys. A Stat. Mech. Its Appl. 2008, 387, 5639–5646. [Google Scholar] [CrossRef]
- Shaw, S.-L.; Fang, Z.; Lu, S.; Tao, R. Impacts of high speed rail on railroad network accessibility in China. J. Transp. Geogr. 2014, 40, 112–122. [Google Scholar] [CrossRef]
- Chen, W.; Liu, W.; Ke, W.; Wang, N. Understanding spatial structures and organizational patterns of city networks in China: A highway passenger flow perspective. J. Geogr. Sci. 2018, 28, 477–494. [Google Scholar] [CrossRef]
- Taylor, P.J.; Catalano, G.; Walker, D.R.F. Measurement of the world city network. Urban Stud. 2002, 39, 2367–2376. [Google Scholar] [CrossRef]
- Taylor, P.J.; Walker, D.R.F.; Catalano, G.; Hoyler, M. Diversity and power in the world city network. Cities 2002, 19, 231–241. [Google Scholar] [CrossRef] [Green Version]
- Zhou, Y.; Fang, Z.; Thill, J.C.; Li, Q.; Li, Y. Functionally critical locations in an urban transportation network: Identification and space–time analysis using taxi trajectories. Comput. Environ. Urban Syst. 2015, 52, 34–47. [Google Scholar] [CrossRef]
- Reades, J.; Calabrese, F.; Ratti, C. Eigenplaces: Analysing cities using the space- time structure of the mobile phone network. Environ. Plan. B Plan. Des. 2009, 36, 824–836. [Google Scholar] [CrossRef]
- Yin, J.; Soliman, A.; Yin, D.; Wang, S. Depicting urban boundaries from a mobility network of spatial interactions: A case study of Great Britain with geo-located Twitter data. Int. J. Geogr. Inf. Sci. 2017, 31, 1293–1313. [Google Scholar] [CrossRef]
- Maggioni, M.A.; Nosvelli, M.; Uberti, T.E. Space versus networks in the geography of innovation: A European analysis. Pap. Reg. Sci. 2007, 86, 471–493. [Google Scholar] [CrossRef]
- Matthiessen, C.W.; Schwarz, A.W.; Find, S. World cities of scientific knowledge: Systems, networks and potential dynamics. An analysis based on Bibliometric indicators. Urban Stud. 2010, 47, 1879–1897. [Google Scholar] [CrossRef]
- Guimerã, R.; Amaral, L.A. Cartography of complex networks: Modules and universal roles. J. Stat. Mech. 2005, 2005, P02001. [Google Scholar] [CrossRef] [PubMed]
- Alderson, A.S.; Beckfield, J. Power and position in the world city system. Am. J. Sociol. 2004, 109, 811–851. [Google Scholar] [CrossRef] [Green Version]
- Smith, D.A.; Timberlake, M.F. World city networks and hierarchies 1977–1997. Am. Behav. Sci. 2001, 44, 1656–1678. [Google Scholar] [CrossRef]
- Cao, J.; Liu, X.C.; Wang, Y.; Li, Q. Accessibility impacts of China’s high-speed rail network. J. Transp. Geogr. 2013, 28, 12–21. [Google Scholar] [CrossRef]
- Chen, C. Reshaping Chinese space-economy through high-speed trains: Opportunities and challenges. J. Transp. Geogr. 2012, 22, 312–316. [Google Scholar] [CrossRef]
- Kim, K.S. High-speed rail developments and spatial restructuring: A case study of the Capital region in South Korea. Cities 2000, 17, 251–262. [Google Scholar] [CrossRef]
- Yang, H.; Zhang, A. Effects of high-speed rail and air transport competition on prices, profits and welfare. Transp. Res. B 2012, 46, 1322–1333. [Google Scholar] [CrossRef]
- Zhang, Q.; Yang, H.; Wang, Q. Impact of high-speed rail on China’s Big Three airlines. Transp. Res. A Policy Pract. 2017, 98, 77–85. [Google Scholar] [CrossRef]
- Gutiérrez, J. Location, economic potential and daily accessibility: An analysis of the accessibility impact of the high-speed line Madrid-Barcelona-French border. J. Transp. Geogr. 2001, 9, 229–242. [Google Scholar] [CrossRef]
- Coto-Millán, P.; Inglada, V.; Rey, B. Effects of network economies in high-speed rail: The Spanish case. Ann. Reg. Sci. 2007, 41, 911–925. [Google Scholar] [CrossRef]
- Ortega, E.; López, E.; Monzón, A. Territorial cohesion impacts of high-speed rail at different planning levels. J. Transp. Geogr. 2012, 24, 130–141. [Google Scholar] [CrossRef]
- Castells, M. The Rise of the Network Society; Blackwetl Publishers: Cambridge, MA, USA, 1996. [Google Scholar]
- Wang, J.; Mo, H.; Wang, F.; Jin, F. Exploring the network structure and nodal centrality of China's air transport network: A complex network approach. J. Transp. Geogr. 2011, 19, 712–721. [Google Scholar] [CrossRef]
- Liu, X.; Derudder, B.; Taylor, P. Mapping the evolution of hierarchical and regional tendencies in the world city network, 2000–2010. Comput. Environ. Urban Syst. 2014, 43, 51–66. [Google Scholar] [CrossRef] [Green Version]
- Huang, Y.; Lu, S.; Yang, X.; Zhao, Z. Exploring railway network dynamics in China from 2008 to 2017. ISPRS Int. J. Geo-Inf. 2018, 7, 320. [Google Scholar] [CrossRef]
- Whebell, C.F.J. Corridors: A theory of urban systems. Ann. Assn. Am. Geogr. 2015, 59, 1–26. [Google Scholar] [CrossRef]
- Taylor, P.J.; Hoyler, M.; Verbruggen, R. External urban relational process: Introducing central flow theory to complement central place theory. Urban Stud. 2010, 47, 2803–2818. [Google Scholar] [CrossRef] [Green Version]
- Castells, M. Globalisation, networking, urbanisation: Reflections on the spatial dynamics of the information age. Urban Stud. 2010, 47, 2737–2745. [Google Scholar] [CrossRef]
- Garcia-López, M.Á.; Hémet, C.; Viladecans-Marsal, E. Next train to the polycentric city: The effect of railroads on subcenter formation. Reg. Sci. Urban Econ. 2017, 67, 50–63. [Google Scholar] [CrossRef] [Green Version]
- Clauset, A.; Newman, M.E.J.; Moore, C. Finding community structure in very large networks. Phys. Rev. E 2004, 70, 066111. [Google Scholar] [CrossRef] [PubMed]
- Girvan, M.; Newman, M.E.J. Community structure in social and biological networks. Proc. Natl. Acad. Sci. USA 2002, 99, 7821–7826. [Google Scholar] [CrossRef] [PubMed] [Green Version]
- Pons, P.; Latapy, M. Computing communities in large networks using random walks. J. Graph Algorithms Appl. 2006, 10, 191–218. [Google Scholar] [CrossRef]
- Blondel, V.D.; Guillaume, J.L.; Lambiotte, R.; Lefebvre, E. Fast unfolding of communities in large networks. J. Stat. Mech. Theory Exp. 2008, 2008, P10008. [Google Scholar] [CrossRef]
- Raghavan, U.N.; Albert, R.; Kumara, S. Near linear time algorithm to detect community structures in large-scale networks. Phys. Rev. E 2007, 76, 036106. [Google Scholar] [CrossRef] [PubMed]
- Xie, J.; Szymanski, B.K.; Liu, X. SLPA: Uncovering overlapping communities in social networks via a speaker-listener interaction dynamic process. In Proceedings of the 11th International Conference on Data Mining Workshops, Vancouver, BC, Canada, 11 December 2011. [Google Scholar]
- Rosvall, M.; Bergstrom, C.T. Maps of random walks on complex networks reveal community structure. Proc. Natl. Acad. Sci. USA 2008, 105, 1118–1123. [Google Scholar] [CrossRef] [PubMed] [Green Version]
- Sun, L.; Axhausen, K.W.; Lee, D.H.; Huang, X. Understanding metropolitan patterns of daily encounter. Proc. Natl. Acad. Sci. USA 2013, 110, 13774–13779. [Google Scholar] [CrossRef] [PubMed]
- Zheng, J.; Gong, J.; Li, R.; Hu, K.; Wu, H.; Yang, S. Community evolution analysis based on co-author network: A case study of academic communities of the journal of “Annals of the Association of American Geographers”. Scientometrics 2017, 113, 845–865. [Google Scholar] [CrossRef]
- Samory, M.; Cappelleri, V.M.; Peserico, E. Quotes reveal community structure and interaction dynamics. In Proceedings of the ACM Conference on Computer Supported Cooperative Work and Social Computing, Portland, OR, USA, 25 February–1 March 2017; pp. 322–335. [Google Scholar]
- Han, Y.; Chen, S.; Feng, Z. Empirical studies on community structure for networked web services. Int. J. Comput. Sci. Issues 2013, 10, 528–534. [Google Scholar]
- Dorfman, M.J.; Medanic, J. Scheduling trains on a railway network using a discrete event model of railway traffic. Transp. Res. B 2004, 38, 81–98. [Google Scholar] [CrossRef]
- Kurant, M.; Thiran, P. Extraction and analysis of traffic and topologies of transportation networks. Phys. Rev. E Stat. Nonlinear Soft Matter Phys. 2006, 74, 036114. [Google Scholar] [CrossRef] [PubMed]
- Sen, P.; Dasgupta, S.; Chatterjee, A.; Sreeram, P.A.; Mukherjee, G.; Manna, S.S. Small-world properties of the Indian railway network. Phys. Rev. E Stat. Nonlinear Soft Matter Phys. 2003, 67, 036106. [Google Scholar] [CrossRef] [PubMed] [Green Version]
- Tobler, W. On the first law of geography: A reply. Ann. Assoc. Am. Geogr. 2004, 94, 304–310. [Google Scholar] [CrossRef]
- Lu, F.; Liu, K.; Duan, Y.; Cheng, S.; Du, F. Modeling the heterogeneous traffic correlations in urban road systems using traffic-enhanced community detection approach. Phys. A Stat. Mech. Its Appl. 2018, 501, 227–237. [Google Scholar] [CrossRef]
- Guerrero, M.; Montoya, F.G.; Baños, R.; Alcayde, A.; Gil, C. Community detection in national-scale high voltage transmission networks using genetic algorithms. Adv. Eng. Inform. 2018, 38, 232–241. [Google Scholar] [CrossRef]
- Sun, Y.; Mburu, L.; Wang, S. Analysis of community properties and node properties to understand the structure of the bus transport network. Phys. A Stat. Mech. Its Appl. 2016, 450, 523–530. [Google Scholar] [CrossRef] [Green Version]
- Rives, A.W.; Galitski, T. Modular organization of cellular networks. Proc. Natl. Acad. Sci. USA 2003, 100, 1128–1133. [Google Scholar] [CrossRef] [PubMed] [Green Version]
- Han, J.D.; Bertin, N.; Hao, T.; Goldberg, D.S.; Berriz, G.F.; Zhang, L.V.; Vidal, M. Evidence for dynamically organized modularity in the yeast protein-protein interaction network. Nature 2004, 430, 88–93. [Google Scholar] [CrossRef] [PubMed]
- National Development and Reform Commission (NDRC). People’s Republic of China. National New Urbanization Planning (2014–2020). Available online: http://ghs.ndrc.gov.cn/zttp/xxczhjs/ghzc/201605 /t20160505_800839.html (accessed on 22 June 2018).
- Romein, A. Polycentric structures in Latin American metropolitan areas: Identifying employment sub-centres. Reg. Stud. 2014, 48, 1954–1971. [Google Scholar]
Figure 1.
China’s railway system and administrative divisions.

Figure 2.
P-space graph of railway network.

Figure 3.
Community detection in weighted network.
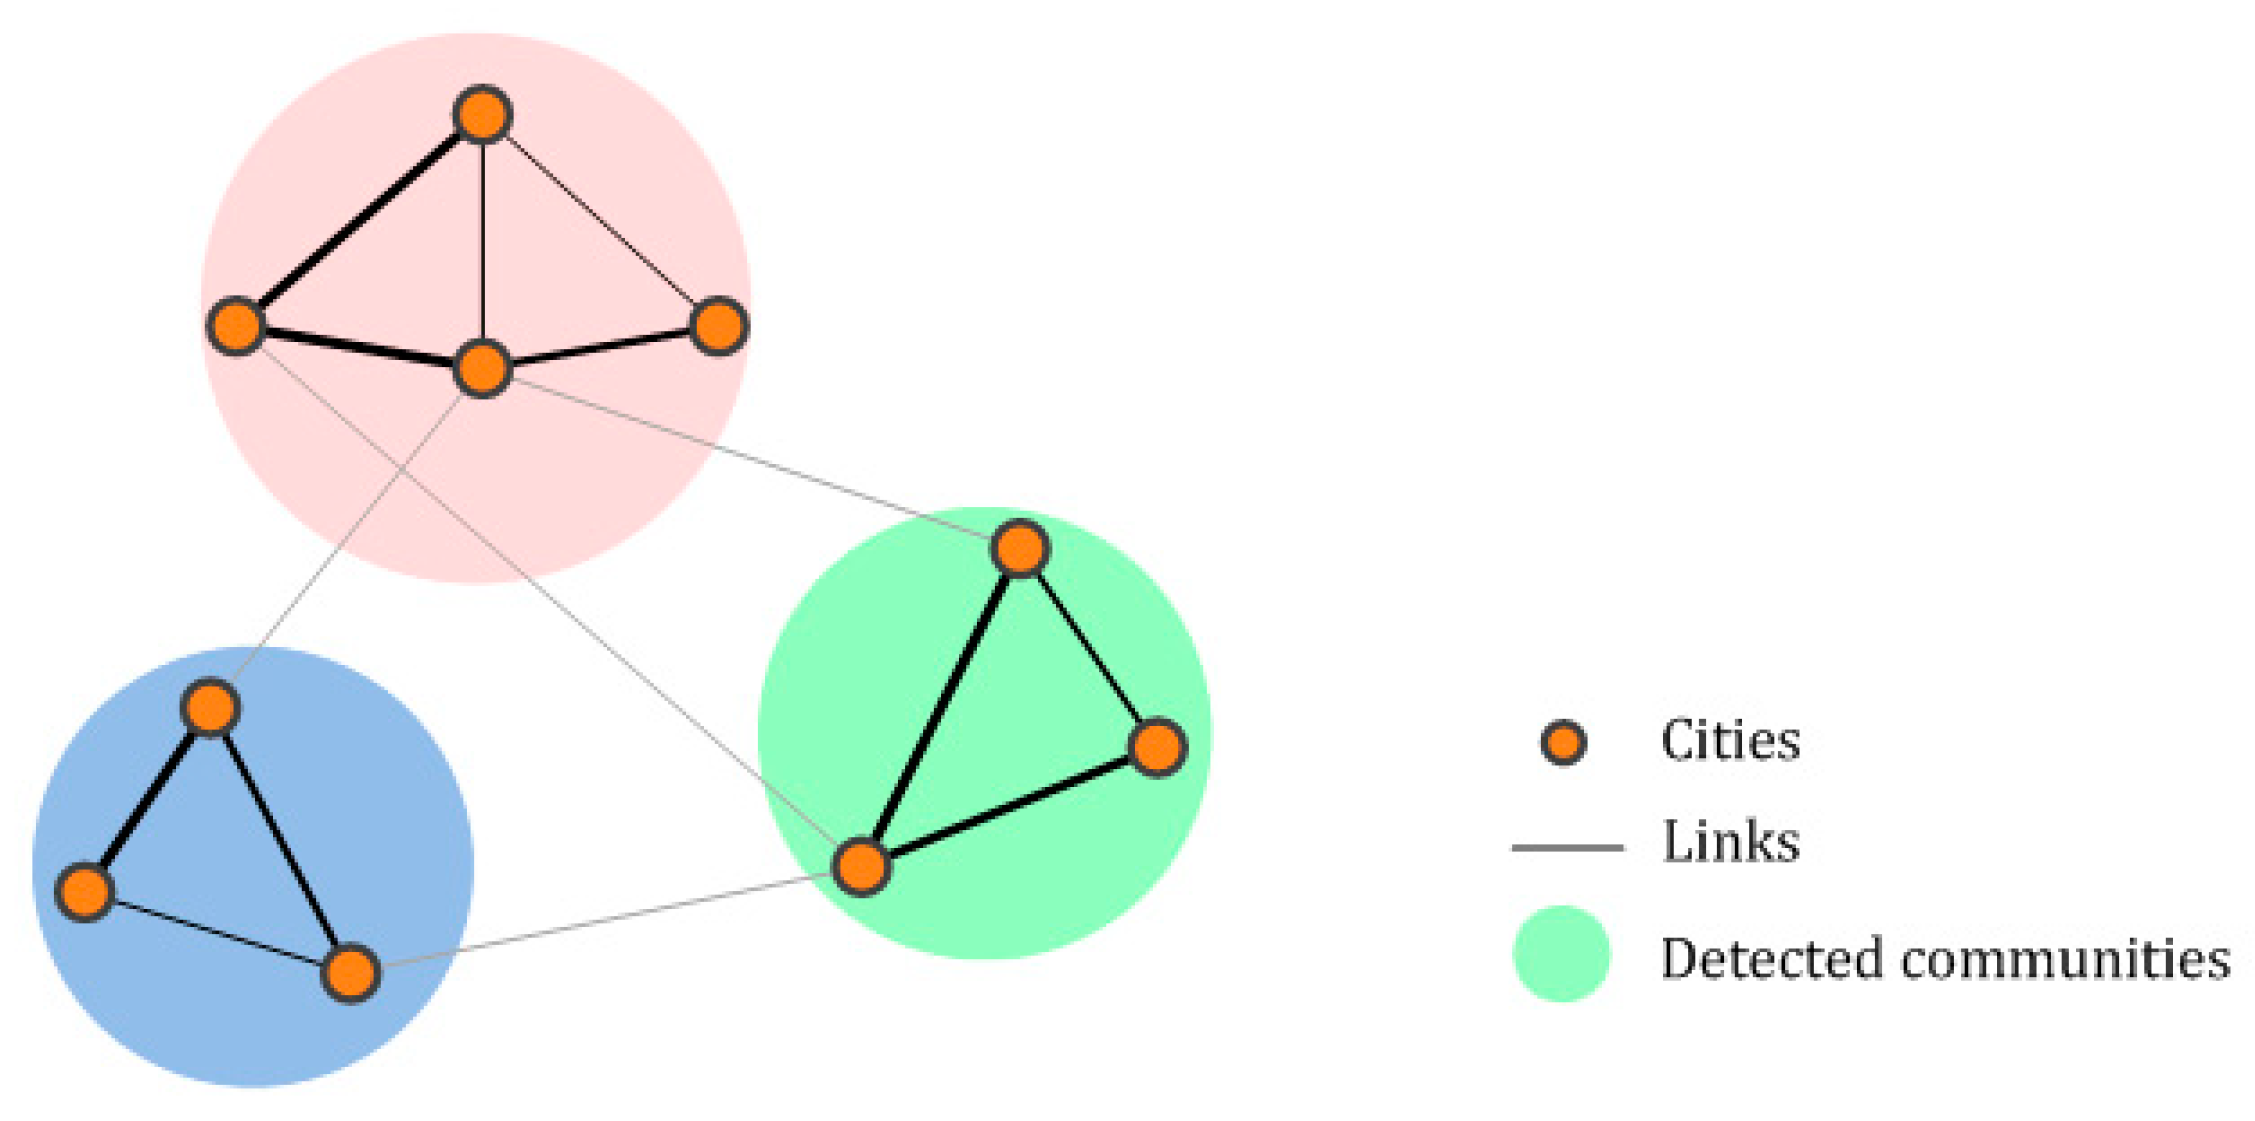
Figure 4.
City links of railway networks in each stage. Figure (a–d) share the same legend.
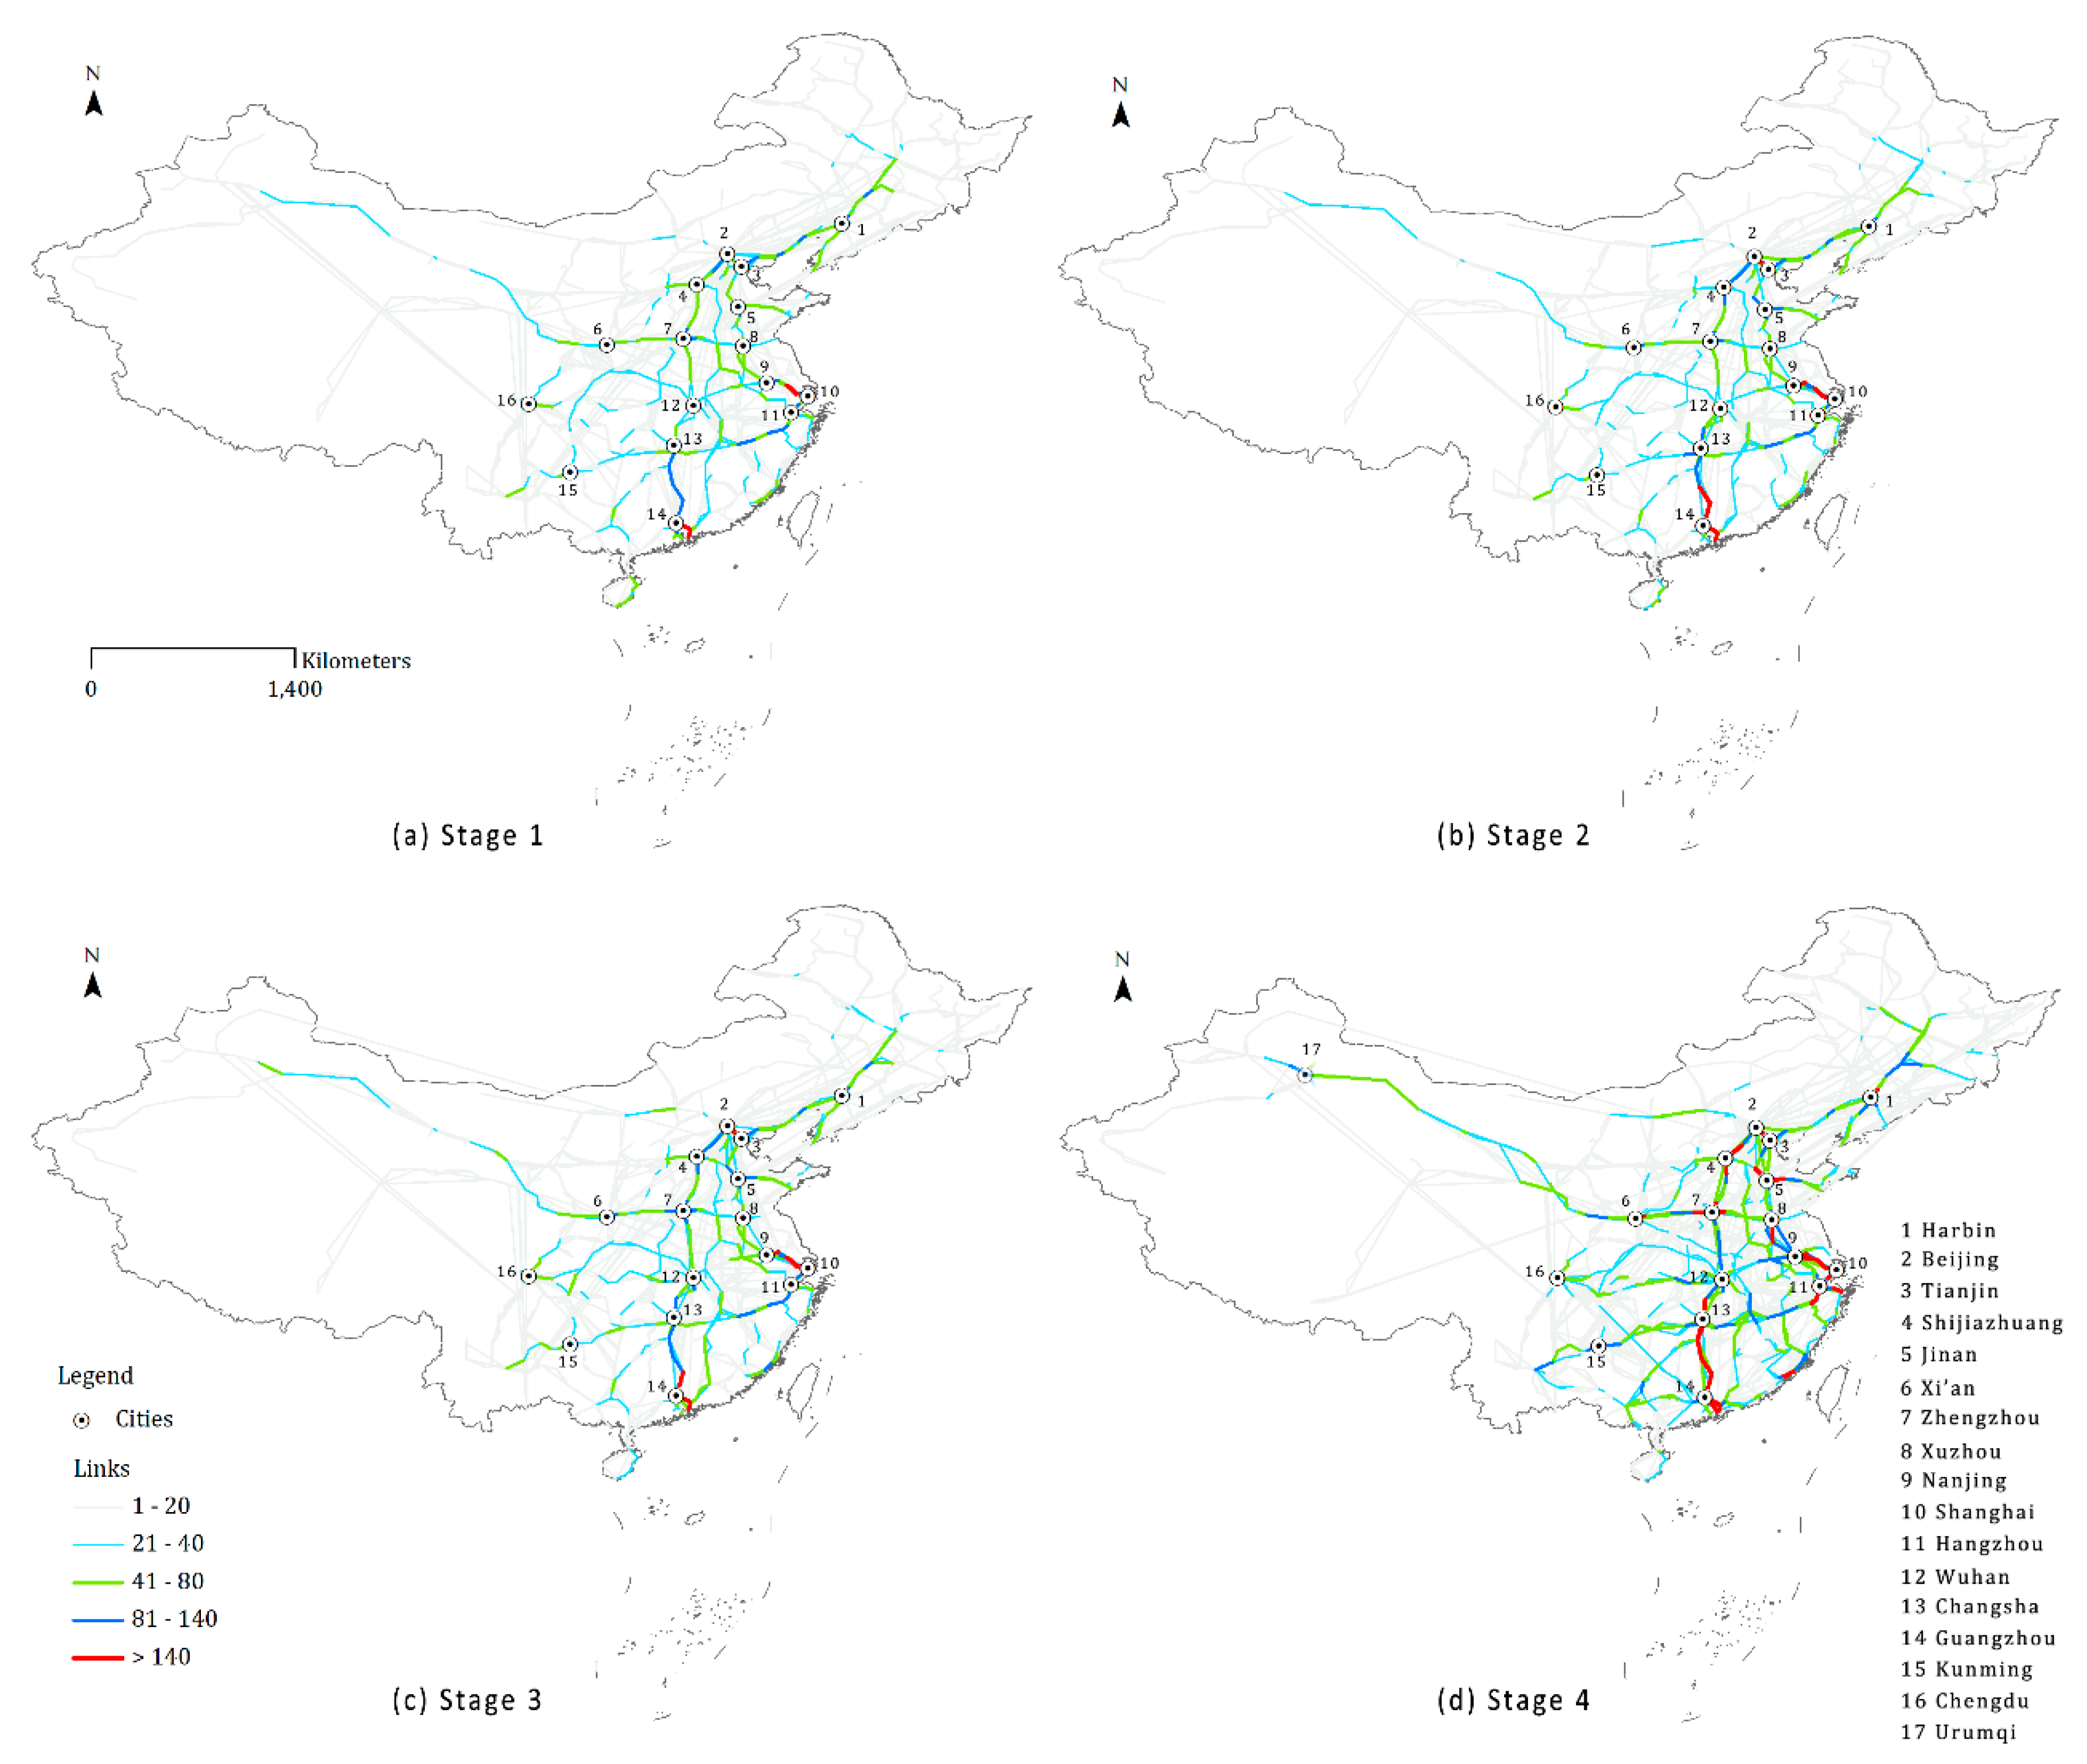
Figure 5.
Community detection results in each stage. Figure (a–d) share the same legend.

Figure 6.
Inner structure of each community during four Stages. Figure (a–d) share the same legend in the lower right corner.
Figure 6.
Inner structure of each community during four Stages. Figure (a–d) share the same legend in the lower right corner.


Table 1.
Four stages of China’s railway system development from 2008 to 2017.
| Stage | Time Period | HSR Lines Construction | Additional Policy Changes |
|---|---|---|---|
| 1 | Before August 2008 | No HSR service | |
| 2 | Between August 2008 and July 2011 | Preliminary construction | Rearrangement of timetable |
| 3 | Between July 2011 and January 2013 | Network skeleton | Speed and price reduction |
| 4 | Between January 2013 and July 2017 | Deep intensification | Rearrangement of timetable |
Table 2.
Timetable of train route G651 in Stage 3.
| Station | Arrival Time | Departure Time | Stop Time (min) | Distance from Origin Station (km) | Ticket Fare (Yuan) |
|---|---|---|---|---|---|
| 1. Beijing West | - | 07:05 | - | - | - |
| 2. Baoding East | 07:46 | 07:48 | 2 | 139 | 64 |
| 3. Shijiazhuang | 08:24 | 08:28 | 4 | 281 | 129 |
| 4. Xingtai East | 08:56 | 08:58 | 2 | 403 | 186 |
| 5. Handan East | 09:14 | 09:16 | 2 | 456 | 209 |
| 6. Hebi East | 09:44 | 09:46 | 2 | 562 | 255 |
| 7. Zhengzhou East | 10:19 | 10:26 | 7 | 693 | 309 |
| 8. Longyanglongmen | 11:07 | 11:09 | 2 | 836 | 368 |
| 9. Huashan North | 12:12 | 12:14 | 2 | 1095 | 471 |
| 10. Xi’an North | 12:48 | - | - | 1216 | 516 |
Table 3.
Statistics of city links.
| City Links | Stage 1 | Stage 2 | Stage 3 | Stage 4 |
|---|---|---|---|---|
| Maximum | 202 | 280 | 282 | 368 |
| Average | 7.66 | 8.20 | 8.90 | 11.44 |
| Minimum | 2 | 2 | 2 | 2 |
| Standard deviation | 13.32 | 15.44 | 16.48 | 21.48 |
Table 4.
Communities detected from railway network.
| Index | Stage 1 | Stage 2 | Stage 3 | Stage 4 |
|---|---|---|---|---|
| Modularity Value | 0.86 | 0.85 | 0.84 | 0.83 |
| Number of Communities | 30 | 29 | 24 | 24 |
| Average distance between communities (km) | 1611.72 | 1574.81 | 1532.26 | 1529.42 |
Table 5.
Descriptive statistics of the influential nodes in China’s railway network.
| Index | z-Score | p-Score | Stage 1 | Stage 2 | Stage 3 | Stage 4 |
|---|---|---|---|---|---|---|
| Provincial Hubs | >2.5 | [0, 0.3] | 53 | 64 | 63 | 53 |
| Connector Hubs | >2.5 | (0.3, 0.75) | 31 | 19 | 19 | 27 |
| Total Hubs | 84 | 83 | 82 | 80 |
Table 6.
Inner structure of communities detected from railway network.
| Community Type | No. of Hubs | Stage 1 | Stage 2 | Stage 3 | Stage 4 |
|---|---|---|---|---|---|
| Noncentric | 0 | 6 (20.00%) | 7 (24.14%) | 5 (20.83%) | 4 (16.67%) |
| Monocentric | 1 | 5 (16.67%) | 0 | 1 (4.17%) | 3 (12.50%) |
| Dual-nuclei | 2 | 2 (6.67%) | 4 (13.79%) | 2 (8.33%) | 4 (16.67%) |
| Polycentric | ≥ 3 | 17 (56.67%) | 18 (62.07%) | 16 (66.67%) | 13 (54.17%) |
© 2018 by the authors. Licensee MDPI, Basel, Switzerland. This article is an open access article distributed under the terms and conditions of the Creative Commons Attribution (CC BY) license (http://creativecommons.org/licenses/by/4.0/).
Share and Cite
MDPI and ACS Style
Lu, S.; Huang, Y.; Zhao, Z.; Yang, X. Exploring the Hierarchical Structure of China’s Railway Network from 2008 to 2017. Sustainability 2018, 10, 3173. https://doi.org/10.3390/su10093173
AMA Style
Lu S, Huang Y, Zhao Z, Yang X. Exploring the Hierarchical Structure of China’s Railway Network from 2008 to 2017. Sustainability. 2018; 10(9):3173. https://doi.org/10.3390/su10093173
Chicago/Turabian StyleLu, Shiwei, Yaping Huang, Zhiyuan Zhao, and Xiping Yang. 2018. "Exploring the Hierarchical Structure of China’s Railway Network from 2008 to 2017" Sustainability 10, no. 9: 3173. https://doi.org/10.3390/su10093173
Note that from the first issue of 2016, this journal uses article numbers instead of page numbers. See further details here.