Solar Photovoltaic Panels Combined with Energy Storage in a Residential Building: An Economic Analysis


Department of Industrial and Information Engineering and Economics, University of L’Aquila, Via G. Gronchi 18, 67100 L’Aquila, Italy
*
Author to whom correspondence should be addressed.
Sustainability 2018, 10(9), 3117; https://doi.org/10.3390/su10093117
Submission received: 24 July 2018
/
Revised: 17 August 2018
/
Accepted: 29 August 2018
/
Published: 31 August 2018
(This article belongs to the Section Economic and Business Aspects of Sustainability)
Abstract
:Renewable energy is a wide topic in environmental engineering and management science. Photovoltaic (PV) power has had great interest and growth in recent years. The energy produced by the PV system is intermittent and it depends on the weather conditions, presenting lower levels of production than other renewable resources (RESs). The economic feasibility of PV systems is linked typically to the share of self-consumption in a developed market and consequently, energy storage system (ESS) can be a solution to increase this share. This paper proposes an economic feasibility of residential lead-acid ESS combined with PV panels and the assumptions at which these systems become economically viable. The profitability analysis is conducted on the base of the Discounted Cash Flow (DCF) method and the index used is Net Present Value (NPV). The analysis evaluates several scenarios concerning a 3-kW plant located in a residential building in a PV developed market (Italy). It is determined by combinations of the following critical variables: levels of insolation, electricity purchase prices, electricity sales prices, investment costs of PV systems, specific tax deduction of PV systems, size of batteries, investment costs of ESS, lifetime of a battery, increases of self-consumption following the adoption of an ESS, and subsidies of ESS. Results show that the increase of the share of self-consumption is the main critical variable and consequently, the break-even point (BEP) analysis defines the case-studies in which the profitability is verified.
1. Introduction
Energy scarcity and climate change are urgent issues worldwide and the development of renewable resources (RESs) aims to achieve a sustainable energy system [1,2]. Solar photovoltaic (PV) energy generates renewable electricity by converting energy from the sun. The PV sector has demonstrated significant progress in recent years, reaching more than 402 gigawatts (GW) of installed capacity in 2017. China (131.1 GW), United States (51 GW), Japan (49 GW), Germany (42.4 GW), Italy (19.7 GW) and India (18.3 GW) cover about 77% of the global power installed [3].
A life cycle assessment, conducted on solar PV systems, quantified the greenhouse gas (GHG) emissions equal to 10.5–50 g CO2 eq/kWh [4]. This environmental effect is balanced by reduction of GHG emissions determined by the use of PV plants as alternative to fossil fuels [5]. GHG emissions released by oil, petrol and natural gas vary from 443 g CO2 eq/kWh to 1050 g CO2 eq/kWh [6].
The reduction of cost of PV modules has driven the economic competitiveness of PV systems [7]. In fact, the price of residential PV system is decreased of about 80% from 2008 to 2016 in most competitive markets [8]. Several countries have reduced the remuneration for feeding electricity into the grid through Feed-in-Tariffs (FITs) and consequently, self-consumption has assumed a key-role in economic evaluation [9]. Self-consumption is referred to the direct use of PV electricity. It is the synchronization between demanded and produced energy [10]. In this way, the prosumer has new economic opportunities because he/she is able to reduce their electricity bills through self-consumption in comparison to the conventional way of purchasing electricity from the grid [11].
The PV production has a stochastic nature caused by intermittencies and ramping events due to cloud coverage [12]. A detailed analysis of ESSs available for power generation is described by the authors of [13]. Their development is expected to increase in buildings and the use of lead acid technology coupled with PV panels increases electricity self-sufficiency in households [14]. Also lithium-ion technology is defined as less costly in long-term economic analysis [15]. In this work, a lead-acid energy storage system (ESS) is chosen because it is defined as the most cost-efficient technology in terms of an increase of self-consumption [16]. The sustainability of decentralized energy systems is a topic that has attracted the attention of several researchers [17,18].
The economic driver represents the main aspect behind the evaluation of residential end-users to use PV self-consumption [19]. It is essential to conduct a comprehensive economic analysis to encourage residential consumers towards the implementation of self-sufficient energy choices [20,21]. The profitability is well-defined in the literature, however the analysis of these systems is extremely difficult. Several parameters play a critical role and their value is characterized by great uncertainty [22,23].
In this direction, this work proposes an economic analysis concerning solar PV panels combined with ESS in a residential building. Discounted Cash Flow (DCF) is used as the methodology and Net Present Value (NPV) and break-even point (BEP) are calculated in a dynamic context. In fact, several variables are considered (levels of insolation, electricity purchase prices, electricity sales prices, investment costs of PV systems, size of batteries, specific tax deduction, investment costs of ESS, useful time of a battery, increases of self-consumption following the adoption of an ESS, and subsidies) in the economic analysis. The current work integrates several strengths of previous studies and a new detailed economic scheme is proposed. This approach provides results concerning the Italian market, but it is possible to extend results also to other markets, due to the use of multiple values regarding critical variables.
The paper is organized as follows. Section 2 presents the methodology used in this paper and an economic model is defined to evaluate the profitability of an integrated PV-battery system in households. Starting by input data, it is possible to calculate NPV and BEP (Section 3). Furthermore, several alternative scenarios based on the critical variables are considered in order to give solidity to results obtained (Section 4). Section 5 presents some concluding remarks.
2. Literature Review
Energy is a condition for realizing a country’s economic development [24]. Literature analysis defines that ESS is a technical solution able to encourage the energy independence in residential sector [25]. Energy production obtained during supply peaks can be saved and deployed during demand peaks. This consideration is relevant for residential users, because their consumption has fluctuations during the day [26]. This permits to design and schedule the integrated plant also in island-mode (i.e., disconnected from the grid) [27].
The development of smart-grid presents a limit characterized by uncertainty regarding wind speed, solar radiation and load fluctuation [28]. A theoretical framework for the joint optimization of a micro-grid is proposed by the authors [29]. The first step is represented by the definition of the capacities of solar power generation, wind power generation and ESS. The second step aims to minimize the operating cost coordinating the power supply and demand in the micro-grid. Another model underlines as micro-grids with excessive RE generations can trade with other micro-grids in deficit of power supplies. Using the Nash bargaining theory, there is a reduction of total costs through energy trading [30].
However, the potential of ESS combined with PV panels contributes to renewable targets not only in electricity sectors. In fact, their combination with electric vehicles represents a step towards sustainable mobility [31] and the same is verified with a combined heat and power system [32].
The main revenue of ESS is given by the increase of self-consumption energy [33]. A literature review has identified this value equal to 10–24% points with ESSs of 0.5–1 kWh per installed kW of PV power [34]. Other authors have, instead, proposed a range more wide: batteries can increase self-consumption also of 20–50% [35]. The impact of batteries on the grid is of the utmost importance [36]. A survey conducted on consumers has defined self-sufficiency and grid independence as the main drivers that encourage the choice of installing ESSs [37].
The environmental aspects are investigated in this development of the ESS sector. The cycle of production of battery emits about 110 kgCO2 eq per kWh of storage capacity. Life cycle, internal efficiency and energy density are defined to be equally strategic for the environmental life cycle of the batteries [38].
The economics of ESS in residential buildings has been addressed in several previous publications and two indicators are typically used: NPV and Levelized cost of electricity (LCOE)—Table 1.
A review on LCOE for both PV and PV hybrid system is provided by [39]. Vanadium redox flow battery has a lower LCOE than one of Lithium-ion. Input parameters for batteries are characterized by a great uncertainty. LCOE changes in function of application (utility energy time-shift, T&D investment deferral, Energy management—community scale, increase of self-consumption, area and frequency regulation, support of voltage regulation) and technology (lead-acid, lithium-ion, sodium-sulfur, vanadium redox flow). Considering all applications, there is no a technology dominant position [16].
The Discounted Cash Flow (DCF) method is used by the authors of [40]. NPV quantifies the profits and BEP defines the values of increase of self-consumption necessary to achieve the economic feasibility.
The value of the distributed solar PV is increased by the utilization of ESS and load control. Their combination is also called “Solar Plus” [41]. A case study located in Hawaii, shows that an 8 kW PV plant coupled with a 7.8 kWh battery presents a NPV equal to 16,851 $ [42].
Other authors have investigated how NPV varies in function of both PV cost and battery cost. The integrated system is profitable varying from 762 € to 2931 € with a PV cost between 1500 €/kW and 1000 €/kW and a battery cost between 250 €/kWh and 1000 €/kWh. While it is unprofitable when PV cost is equal to 2500 €/kW or to 2000 €/kW when a battery cost greater than 500 kWh, it ranges from −1573 € to −331 € [22].
The role of sizing is, instead, investigated by the authors of [43]. Results show that NPV varies from 290 $ to 910 $ in residential applications. LCOE has been calculated for residential PV systems with lithium ion battery storage in United States. It varies from 0.05 $/kWh to 0.48 $/kWh in function of both nominal capacity of PV plant and battery size [44]. The impact of size is investigated also by [45]. PV panels without ESS provide the greatest economic return, while the profitability with ESS is not always verified. NPV varies from −7334 $ to 6429 $. The storage degradation during the life cycle of the system is assumed as a critical variable in the analysis proposed by the authors of [46]. Results underline that there is no economic benefit from integrating ESS with solar PV, also when the cost of battery degradation is not considered.
Another work considers PV system rated power and BES system capacity as critical variables. LCOE is calculated for the Italian territory. It varies from 0.15 €/kWh to 0.23 €/kWh [47]. While another work defines NPV for this territory and the unprofitability is verified in all scenarios. It ranges from −20,549 € to −2227 € [48].
Italy and Germany are two countries typically analyzed in the literature. This can be explained by the consideration that the first significant development of PV sector occurred in these territories. The economic evaluation of systems located in Germany is considered by [23,49]. The first work analyses parameters taken from Tesla’s Powerwall. Three key-factors are identified: the price gap between electricity price and remuneration rate, the battery system’s investment cost and the usable battery capacity. The return on investment (ROI) varies from −50% to 50% and these values push the authors to underline that each installation requires a realistic economic estimation. The second work considers two possible storage scenarios (household energy storage and community energy storage) suitable to residential electricity prosumers.
A comparison among European countries is investigated by the authors of [50]. The profitability of integrated systems is verified only in Germany and Spain. Discounted Payback Time varies from 15 to 26 years. Other works show that integrated PV-ESS can be profitable. This is verified in territories characterized by higher electricity prices and lower FIT values than European conditions [51,52].
From one side, the economic analysis is proposed by several authors. From the other side, the uncertainty is a typical element of this analysis. The wide variety of scenarios is proposed by [33]. Authors propose four groups of scenarios for economic analysis: (i) selling of energy, (ii) self-consumption without storage, (iii) self-consumption with storage, and (iv) Net Metering Scheme. The best economic performance is reached when it is considered self-consumption without storage. Basically, batteries are unprofitable due to the short lifetime and high costs.
Similar results are obtained also in other works. The results show that profitability of PV systems is greater than PV with battery storage. Critical variables are the demand of the households, self-consumption rates, investment costs and electricity prices [53]. The key-role of the savings in electricity bills and consequently the impact of self-consumption rates is investigated by the authors of [54].
Several countries proceed with the adoption of subsidies for integrated PV battery systems. This choice is strategic to increase the share of self-consumption and the FIT scheme is the most effective [55]. The value of subsidies is calculated equal to the difference between the installments paid for the integrated system and the savings obtained from the electricity bill [56]. Two tools are provided to develop the integrated systems. The first is represented by a regional subsidy that provides fund non-repayable of up to 50% of the initial investment cost. The second is a subsidized tax deduction equal to 50% (instead of 36%) and it is cumulative with the previous. The profitability is verified in several scenarios. NPV varies from −317 € to 5136 € [57].
3. Methodology
DCF is a wide economic assessment method that is used to estimate the attractiveness of an investment opportunity [58]. The determination of the investor’s cash flows is based on the incremental approach and an appropriate cost opportunity of capital is used to aggregate cash flows. This method considers only cash inflows and outflows.
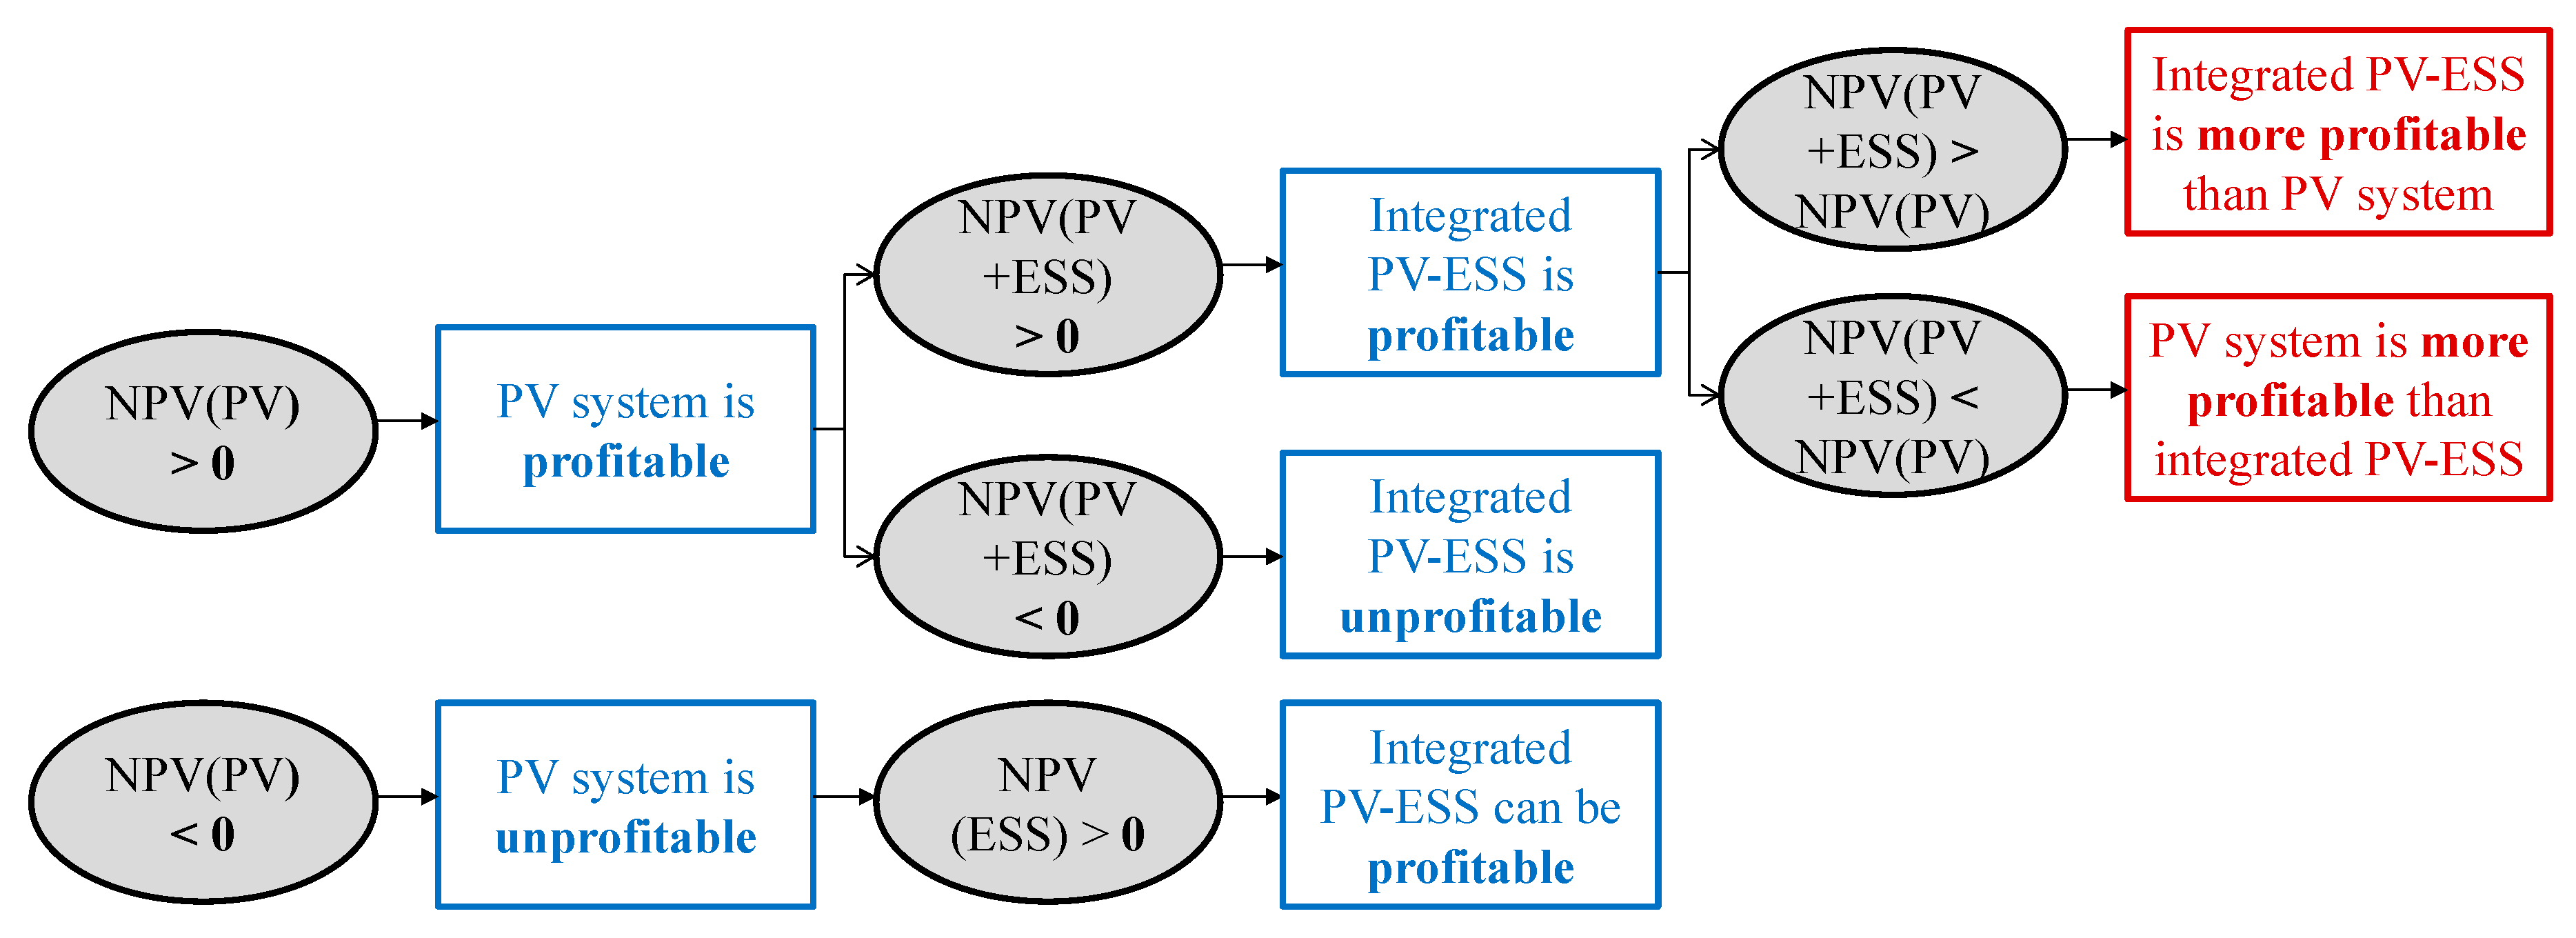
NPV is defined as the sum of the present values of the individual cash flows and it is the financial indicator used in this work [59]. It is equal to difference between discounted cash inflow (DCI) and discounted cash outflow (DCO). Initially, the decision-maker considers the profitability of a PV system. When the condition of financial feasibility is verified, the following step is represented by the application of an ESS.
The following step is to evaluate if the profitability of an integrated PV-ESS is greater or lower than the PV plant. NPV(PV+ESS) is given by the sum of NPV(PV) and NPV(ESS)—see Equation (1)—and consequently, when NPV(ESS) > 0, follows that NPV(PV+ESS) > NPV(PV)—Figure 1.
The economic evaluations of PV systems are widely discussed in the literature [60,61]. The main revenues are subsidies or the percentage of self-consumption in function of developing or developed markets, while operative costs are basically lower than investment ones.
The adoption of storage is characterized by two items of revenue in a market without direct subsidies: (i) fiscal detraction and (ii) saving energy through internal consumption. The Italian Council of Ministers has approved a 50% tax deduction (compared to the usual 36%) for ESS. It is divided into ten equal yearly amounts. The application of an ESS increases the share of self-consumption saving money on the electricity bills [62]. The price of installations of ESS depends by several parameters. It ranges from 1741 € to 2508 € considering a 3-kW plant with a battery capacity of 1.5 kWh and 6 kWh, respectively. The mathematical model used to evaluate the profitability of PV plant combined with energy storage is reported as follows:
Starting with this model and considering cash inflows and outflows, it is possible also to define the BEP. This is the point at which a project becomes profitable, when forecasted revenues exactly equal the estimated total costs [40]. This value is calculated in terms of self-consumption (wself,c) in PV systems and in terms of the increase of self-consumption (∆wself,c) in an integrated PV-ESS project. The rate of self-consumption represents the amount of self-generated electricity that is consumed locally [63].
A PV small size equal to 3 kW (S), typically used in the residential sector, is considered in this paper. The baseline scenario estimates a wself,c equal to 30% [60]. The definition of battery size (B) and the increase of self-consumption (∆wself,c) following the adoption of ESS are chosen according to approach proposed by [34]. For example, a battery size of 1 kWh implies that the ratio between the kWh battery capacity and the installed kW PV (B/S) is equal to 1 and the ∆wself,c is equal to 20%. The four alternative scenarios determined by variation of battery size are proposed as follows:
- B/S = 0.5 (→∆wself,c = 15%).
- B/S = 1.0 (→∆wself,c = 20%).
- B/S = 1.5 (→∆wself,c = 30%).
- B/S = 2.0 (→∆wself,c = 40%).
The economic and technical input data used in this analysis are defined in Table 2. The PV system’s lifetime is estimated at 20 years, the ESS’s useful life is estimated at 6 or 8 years and the opportunity cost of capital is 5%. The selling of energy not self-consumed is calculated according to the approach used by the authors of [60]. The value proposed is greater than the market one because it is considered the contribution related to the net metering scheme which hypothesizes an increase of the energy price produced and sold to the grid.
Investment costs are defined by the literature review, and similar values are proposed in a real market. The entire investment cost is covered by third party funds. It is composed of two components: loan capital share (Clcs) and loan interest share (Clis). The amount of energy produced is calculated with the approach used by [60].
All input factors of Eout are hypothesized fixed and values chosen according to scientific works. In particular, new estimates define significant increases of some variables as crystalline PV module efficiency equal to 20% proposed by Norwegian company REC. At the laboratory level, 21.9% and 21.3% are obtained by Fraunhofer Institute and Trina Solar, respectively [64]. The energy produced by a plant, located in a territory with a level of insolation of 1300 kWh/(m2·year), is equal to 4195 kWh/year during the first year and 3602 kWh/year during the twentieth year because an efficiency reduction factor, is considered. The values of levels insolation are reported in the function of year and for this motive, and the numbers of working days are included in this parameter.
The PV power output curves play a key role in decision making; in fact, the ability of ESS is to match the PV power and load of the building [28,65]. This step is fundamental for defining the share of self-consumption. However, in the context of this work, the approach proposed by the authors of [34] is adopted. A specific value of the ratio B/S, the value of is chosen according to results proposed by the analysis of different case studies. This limit is exceeded by a dynamic approach in which both different levels of insolation and several increases of self-consumption are considered [40].
4. Results
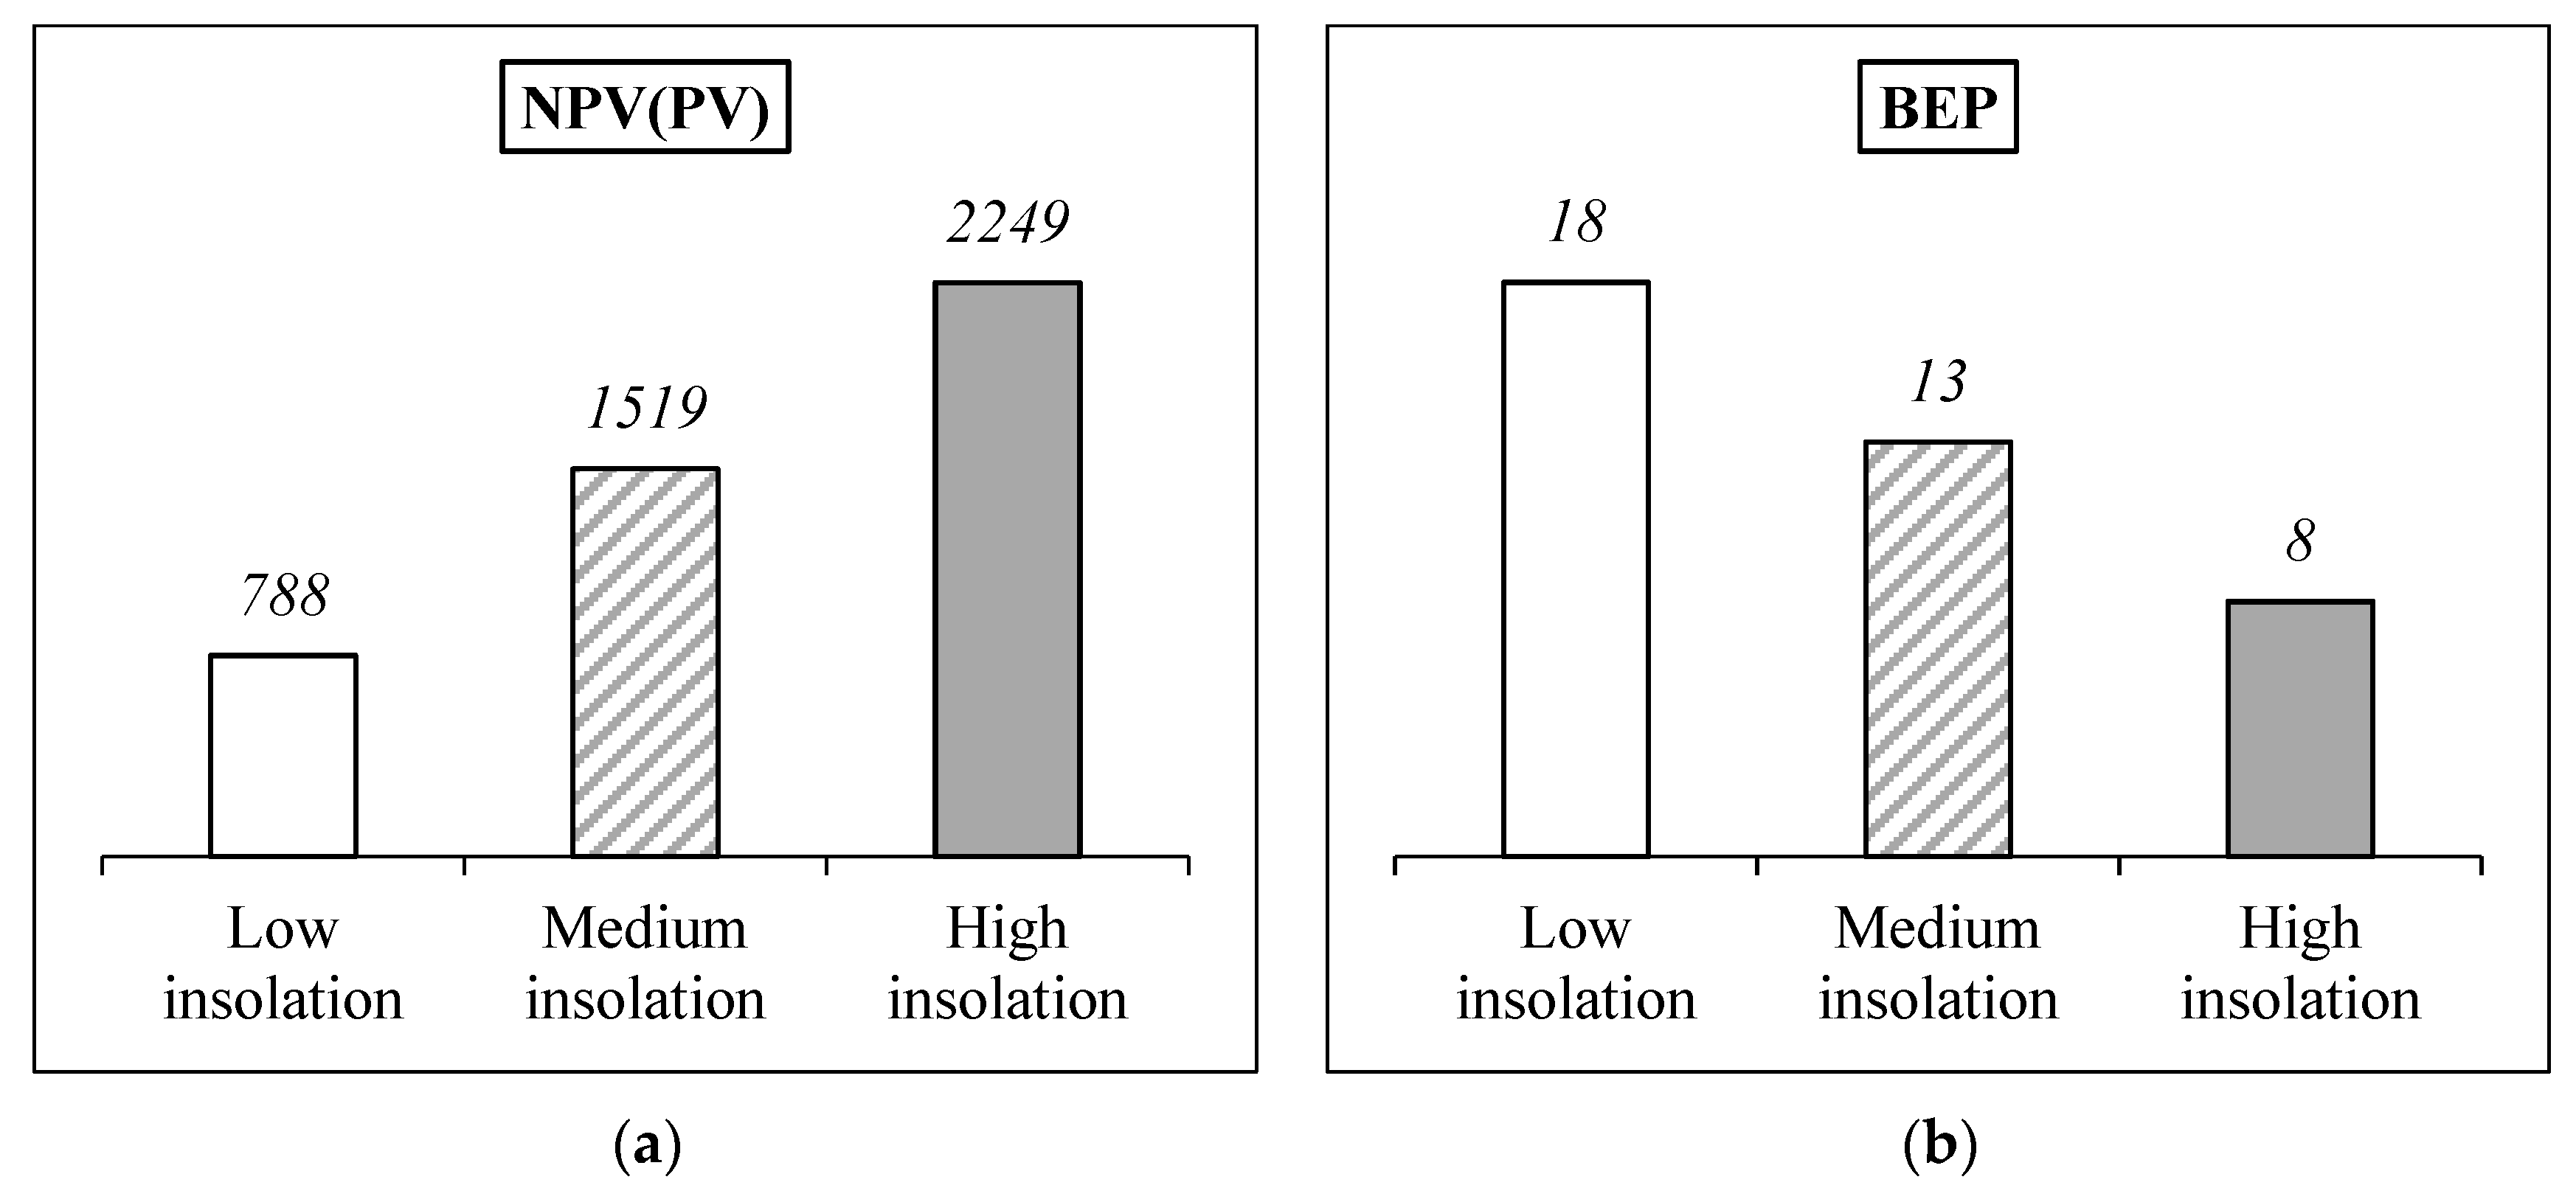
The aim of this work is to propose an economic analysis of solar PV panels combined with energy storage in a residential building. Giving the model assumptions and input data defined in the previous section, NPV and BEP for 3-kW plants are proposed in Figure 2.
Italy present different average annual insolation (tr) due to conformation, and for this reason, three different values are considered in this work [40]:
- Low insolation—1300 kWh/(m2·year).
- Medium insolation—1450 kWh/(m2·year).
- High insolation—1600 kWh/(m2·year).
The financial feasibility of PV plants is verified in the baseline scenario, and the values range from 263 € per kW installed to 750 € per kW installed for the 3-kW plant. BEP analysis proposes the values in which the profitability is verified and these values highlight that the idea of implementing a PV system without self-consumption is not feasible (in fact, in this case NPV is negative). The BEP (in terms of wself,c) that gives a NPV(PV) equal to 0 € varies from 8% with tr = 1600 kWh/(m2·year) to 18% with tr = 1300 kWh/(m2·year).
After the evaluation of PV investments, the following step is represented by the definition of economics resulting by the application of an ESS applied to the PV plant (Figure 3).
Consequently, the decision-maker defines if the revenues derived from the increases of self-consumption justify or lessen the costs of the ESS that incurred during the lifetime of the PV system. As defined in Section 3, another item of revenue is the financial advantage linked to the tax deductions. Its specific value is assumed by policy-makers equal to 50% for investments made in the year zero and 36% for investments needed to replace batteries.
Typically, a baseline scenario is characterized by individual input data, but this work opts to, already in this phase, propose alternative case studies. They are equal to seventy-two determined by combinations of the following variables:
- three levels of insolation.
- two lifetimes of the battery.
- four battery storage capacities.
- three increases of the self-consumption.
This choice is linked to previously published papers. In fact, the literature proposes more values concerning the lifetime of the battery [40,47,66] and 6 and 8 years are two probable values, as highlighted in section 3.
In a case study regarding a specific consumer, it is possible to define exactly the sizing of systems that permits it to maximize technical and economic aspects [67], but this is not true in a generic context. So, we followed the approach used by the authors of [34], who proposed a value of battery capacity that ranges from half to double the PV power installed.
Finally, the literature proposes several values also for the increase of the self-consumption [34,35]. The baseline values are increased and decreased by 5%.
The analysis of Figure 3 shows that all case-studies have revenues derived by the application of an ESS lower than relative costs and consequently, the profitability is never verified. As a result, there are no economic advantages according to the literature (see Table 1) in this baseline scenario when it is used with only a 50% subsidized tax deduction. However, other works underline the positive contribution of these systems:
In this step of the work, NPV(PV + ESS) is calculated (Table 3), starting by NPV(PV)—see Figure 2—and NPV(ESS)—see Figure 3. For example, considering a 3-kW plant with tr = 1450 kWh/(m2·year) and a 3 kWh battery storage capacity with NB = 6 years, characterized by an increase of self-consumption equal to 20%, the following financial result is obtained:
NPV(PV+ESS) = NPV(PV) + NPV(ESS) = 1519 € − 2734 € = −1215 €
The profitability of PV-integrated battery systems is verified in nineteen case-studies (26%). However, the comparison between two investments alternative (PV or PV-ESS) shows that an investor opts to install only a PV plant. In fact, NPV(PV+ESS) is always lower than NPV(PV).
This result is determined by negative economic values of ESS. In fact, also the maximum value of NPV(PV+ESS) equal to 1667 € is lower than NPV(PV) equal to 2249 €. This scenario is verified when the critical variables assumed the maximum value: the ratio between the kWh battery capacity and the installed kW is 2, the lifetime of battery is 8 years, the insolation level is 1600 kWh/(m2·year) and the increase of self-consumption is 45%.
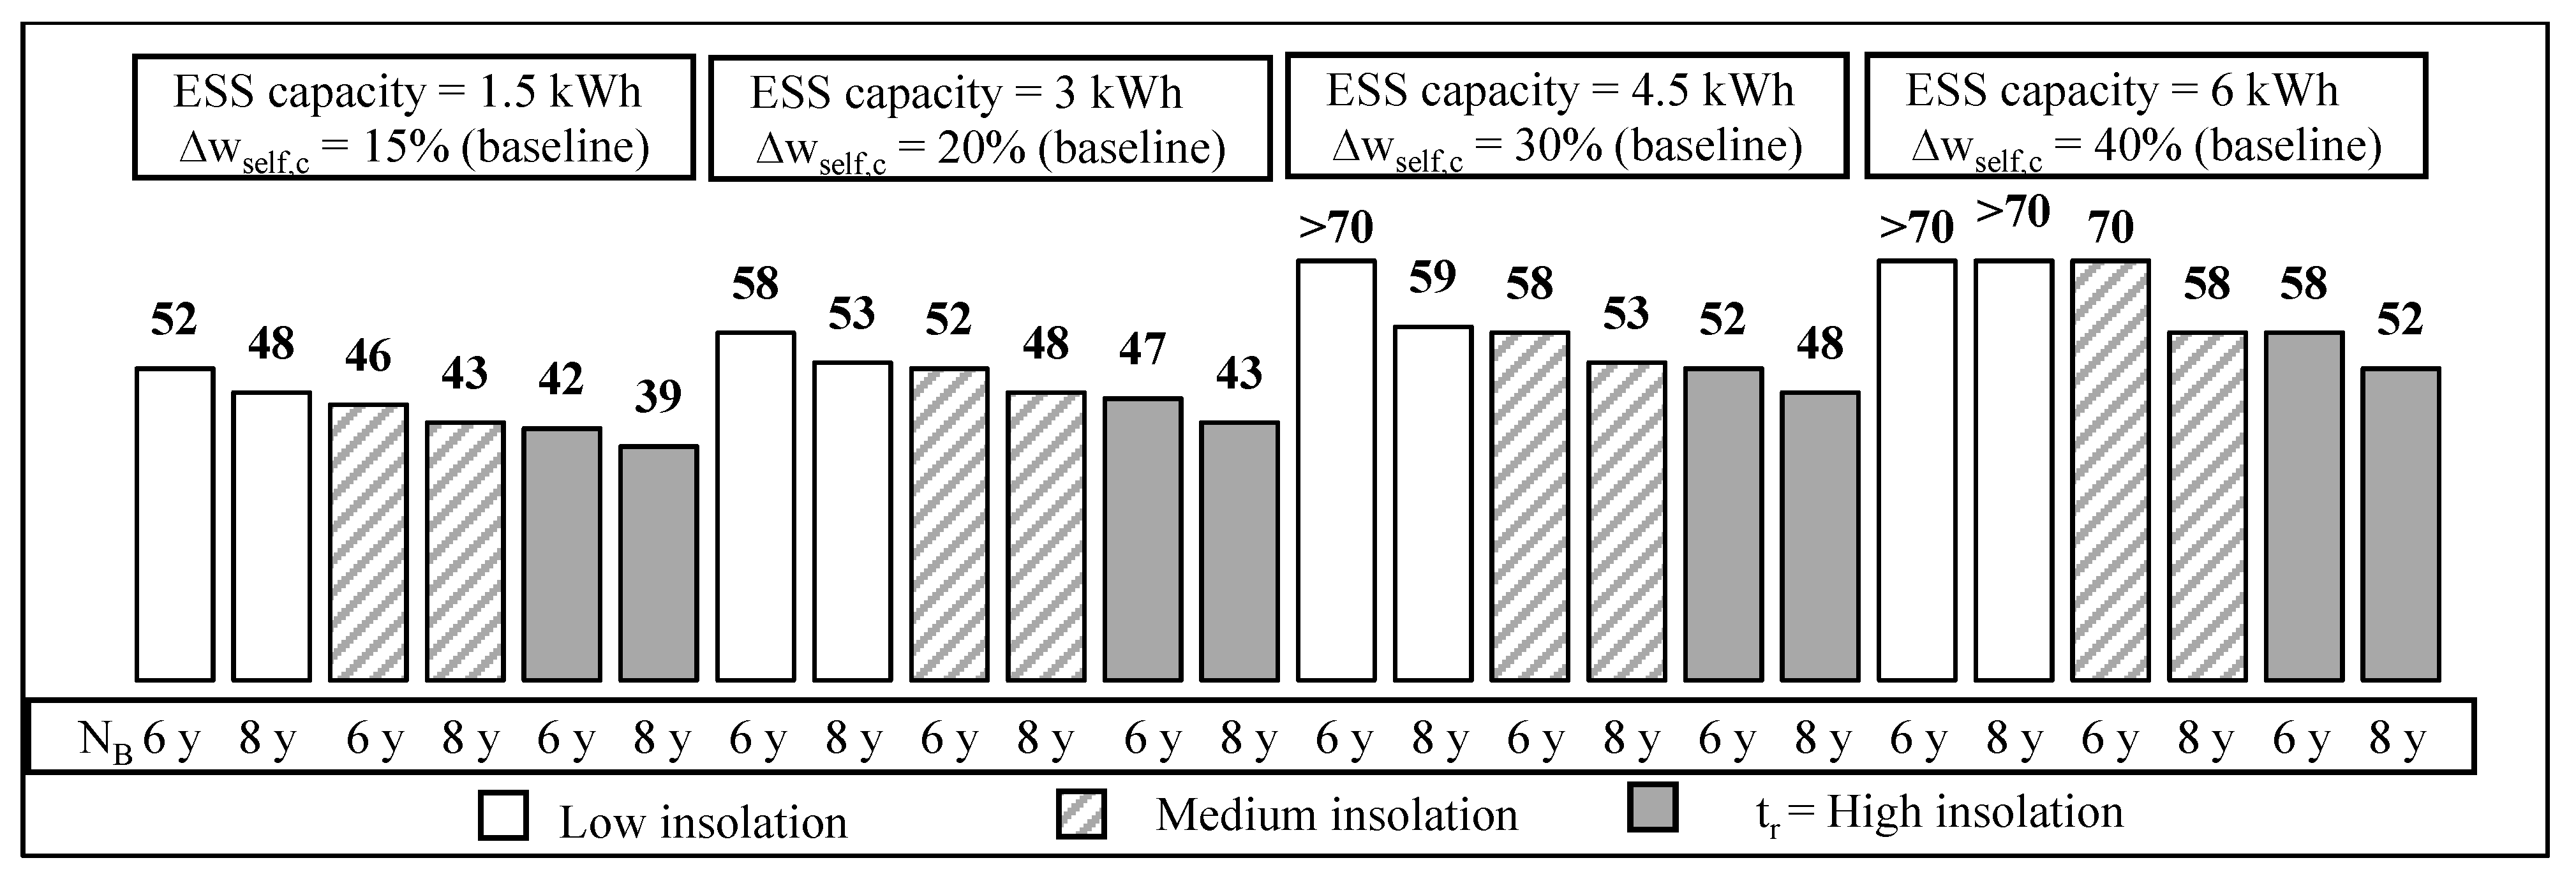
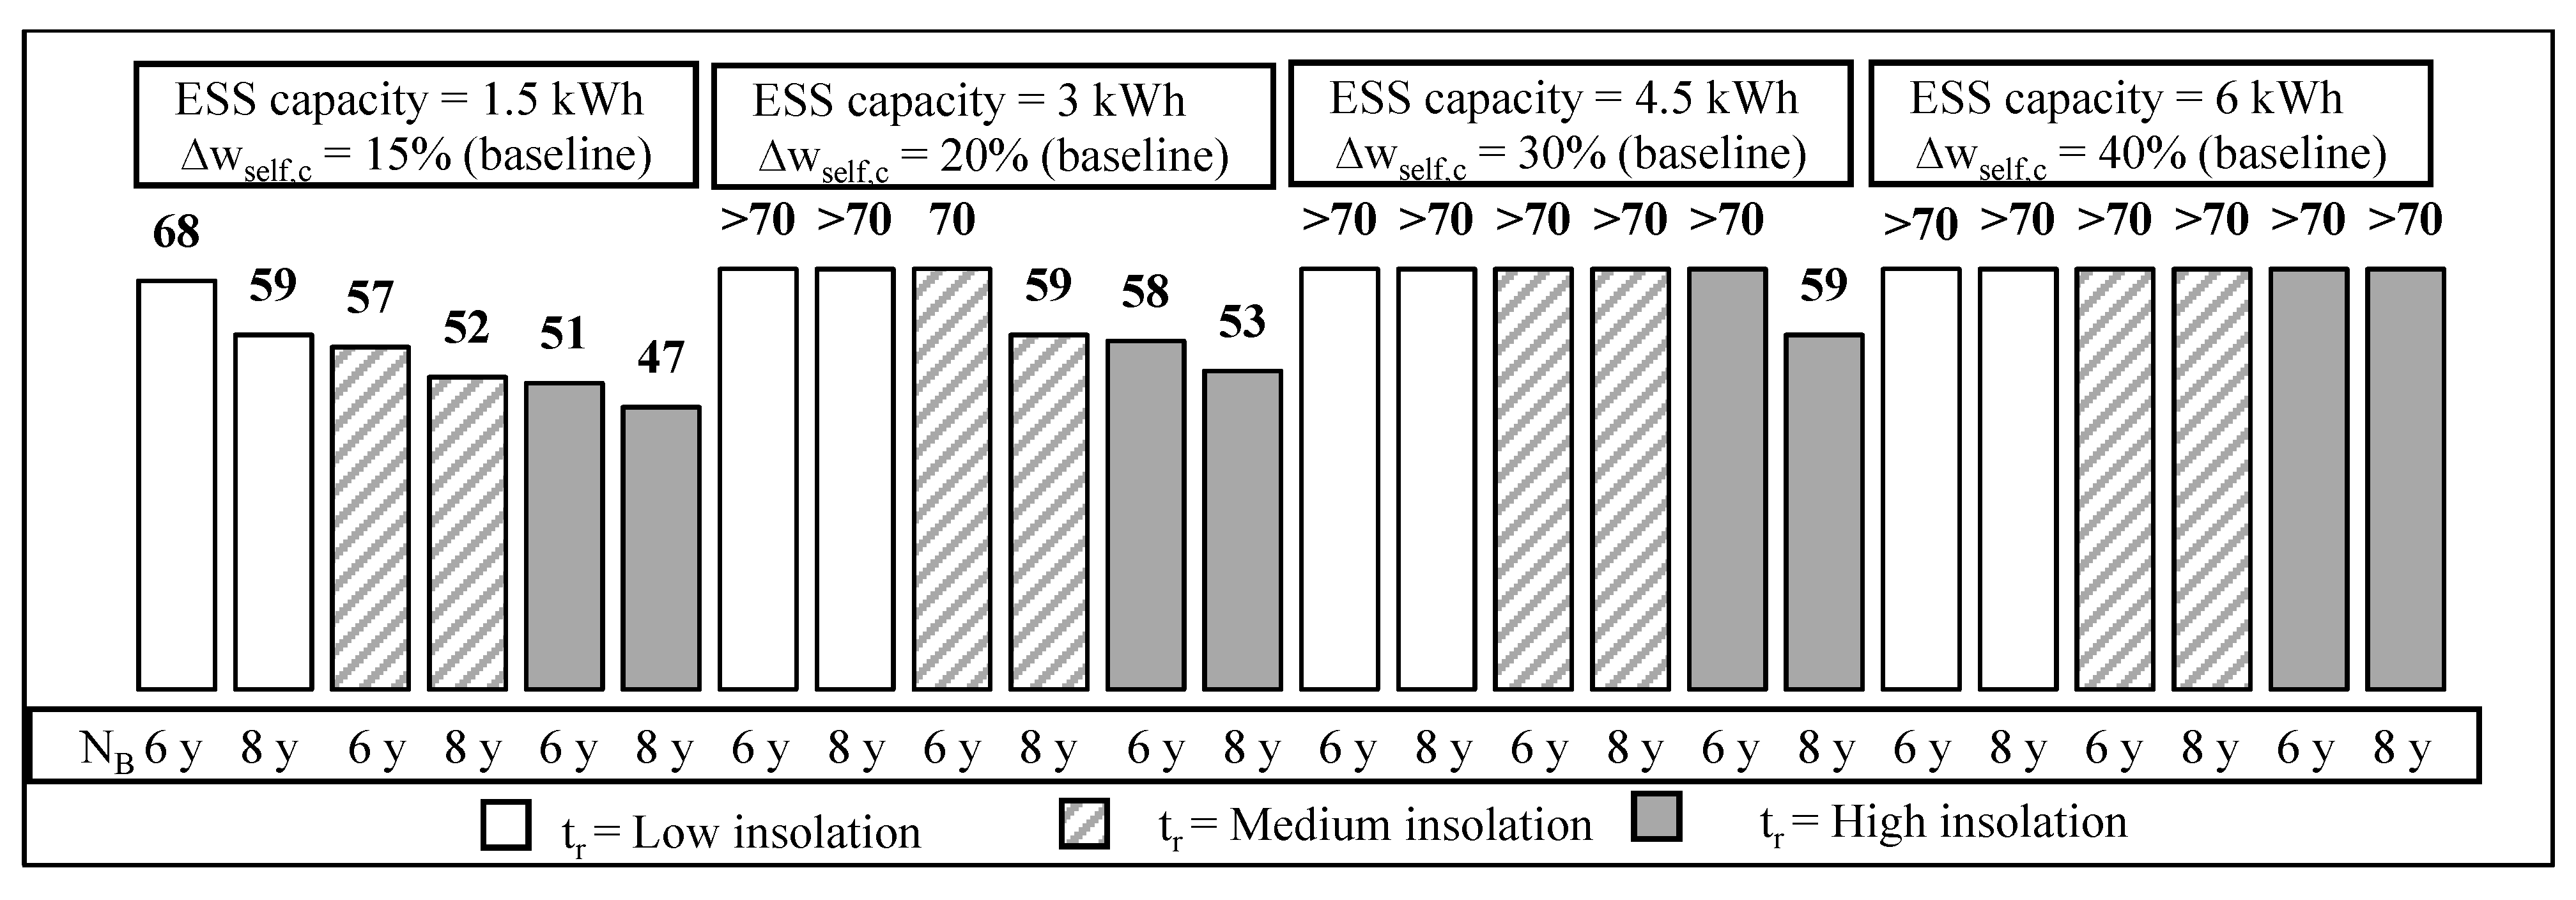
The BEP (in terms of ∆wself,c), that gives a NPV(ESS) equal to 0 €, assumes the following min–max values—Figure 4:
- 39–52% with the ratio B/S = 0.5 (the baseline value is equal to 15%).
- 43–58% with the ratio B/S = 1.0 (the baseline value is equal to 20%).
- 48–>70% with the ratio B/S = 1.5 (the baseline value is equal to 30).
- 52–>70% with the ratio B/S = 2.0 (the baseline value is equal to 40%).
From one side, the profitability is not verified in three case-studies also when all energy produced is stored (>70%). In fact, the maximum increase is equal to 70% considering that the initial self-consumption is equal to 30%.
From the other side, the difference between baseline value and percentages reported in Figure 3 is almost equal to 12% (given by the difference between 52% and 40%), when a capacity battery of 6 kWh is considered. This value become 18%, 23% and 24% when a capacity battery of 4.5 kWh, 3 kWh and 1.5 kWh, respectively, is evaluated. Values obtained are always greater than the baseline ones and the profitability is verified only with significant increases of self-consumption.
The consumer uses directly the electricity generated by a PV plant, when its demand is required during the solar production. If the electricity generation exceeds the household consumptions, it is either stored for later consumption or sold to the grid if the storage is loaded. Consequently, the increases of self-consumption are verified, when the energy demand is not concentrated in periods with low peaks of the energy supply.
Finally, if the consumer uses electricity in the periods of greatest solar productivity, the profitability of investments is characterized by more consistent returns. However, in this situation there is no need to store energy produced and consequently there is also a reduction of the advantage linked to the installation of an ESS. The same is verified also when the consumer uses intelligent machinery. This section proposes several case studies and the following step aims to extend the number of scenarios evaluated.
5. Sensitivity Analysis
NPV results are based on the assumptions of a set of input variables. Hence, a variance of the expected NPV could occur. This limitation can be overcome by implementing a sensitivity analysis on the critical variables [71]. This section is subdivided as follows:
- The variations of costs regarding ESS.
- The application of subsidies to ESS.
- The variation of revenues and costs regarding PV system.
5.1. Energy Storage System—Costs
Starting with the proposition that two critical variables regarding ESS are been already evaluated in the baseline scenario (the lifetime of the battery and battery storage capacities), in this sub-section the role of investment costs of the storage is evaluated [47,66]. Two alternative and optimistic scenarios are proposed as follows:
- A reduction of 10% (scenario ).
- A reduction of 20% (scenario ).
This step of the work considers forty-eight case-studies determined by combinations of the following variables:
- Three levels of insolation.
- Two lifetimes of the battery.
- Four battery storage capacities.
- Two estimations of the battery cost.
The increase of the self-consumption is hypothesized fixed and it is equal to the baseline value. This limit is exceeded by the BEP analysis that will be proposed in the following step of this manuscript. According to previous approach, the economics of ESS (Figure 5) and the financial feasibility of integrated PV-ESS (Table 4) are proposed separately.
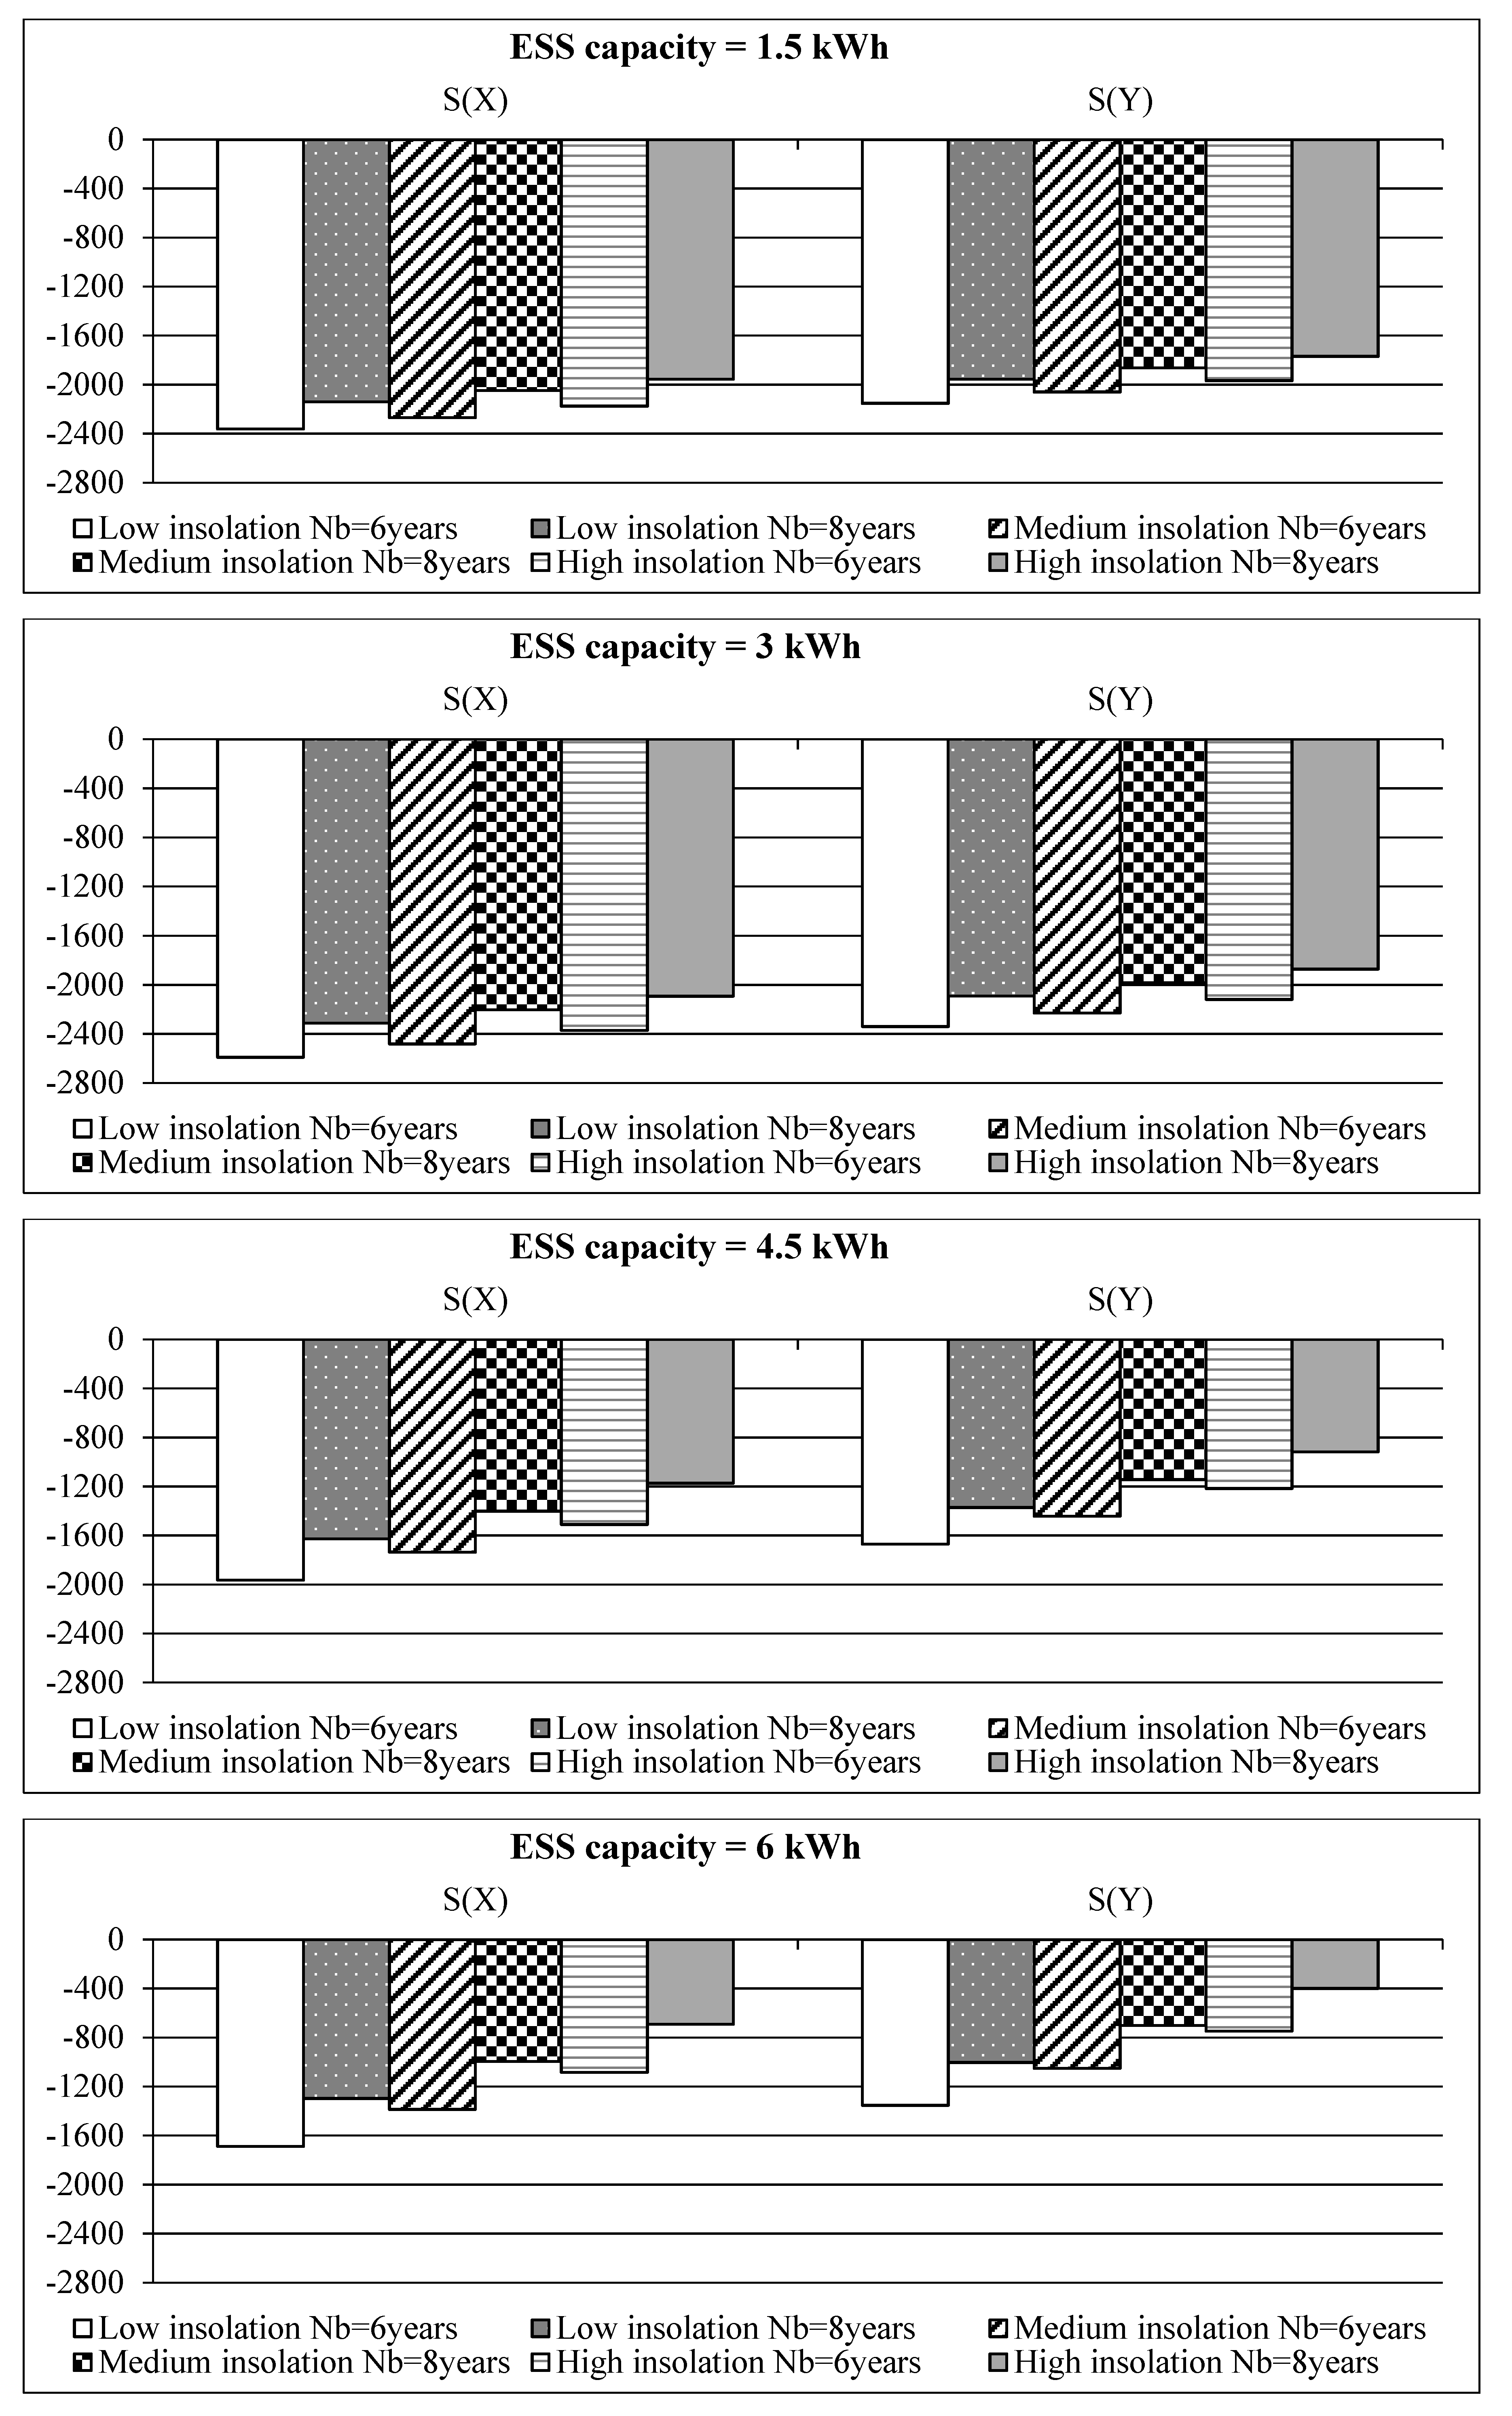
A reduction of 10% investment costs (scenario ) gives an increase of NPV in a range that varies from 185 € with an ESS storage capacity of 1.5 kWh to 337 € with an ESS storage capacity of 6 kWh. When, instead, it shows a reduction of 20% (scenario ), and the increase of NPV varies from 419 € to 673 €.
The negative results obtained in Figure 5 indicate that the increase of self-consumption leads to an increase of revenues smaller than the relative costs. In particular, NPV(ESS) has its maximum value equal to −399 € when is considered the scenario with S = 3 kW, B = 6 kWh, tr = 1600 kWh/(m2·year), NB = 8 years and ∆wself,c = 40% (see Figure 5). This value was, instead, equal to −985 € in the baseline scenario (see Figure 3).
A 3-kW plant combined with energy storage is profitable in twenty-two case-studies (46%) and it is never verified with low levels of insolation (tr = 1300 kWh/(m2·year)). As in the baseline scenario, the consumer never opts to install integrated PV-ESS. In fact, the maximum value of NPV(PV+ESS) equal to 1850 € is lower than NPV(PV) equal to 2249 €.
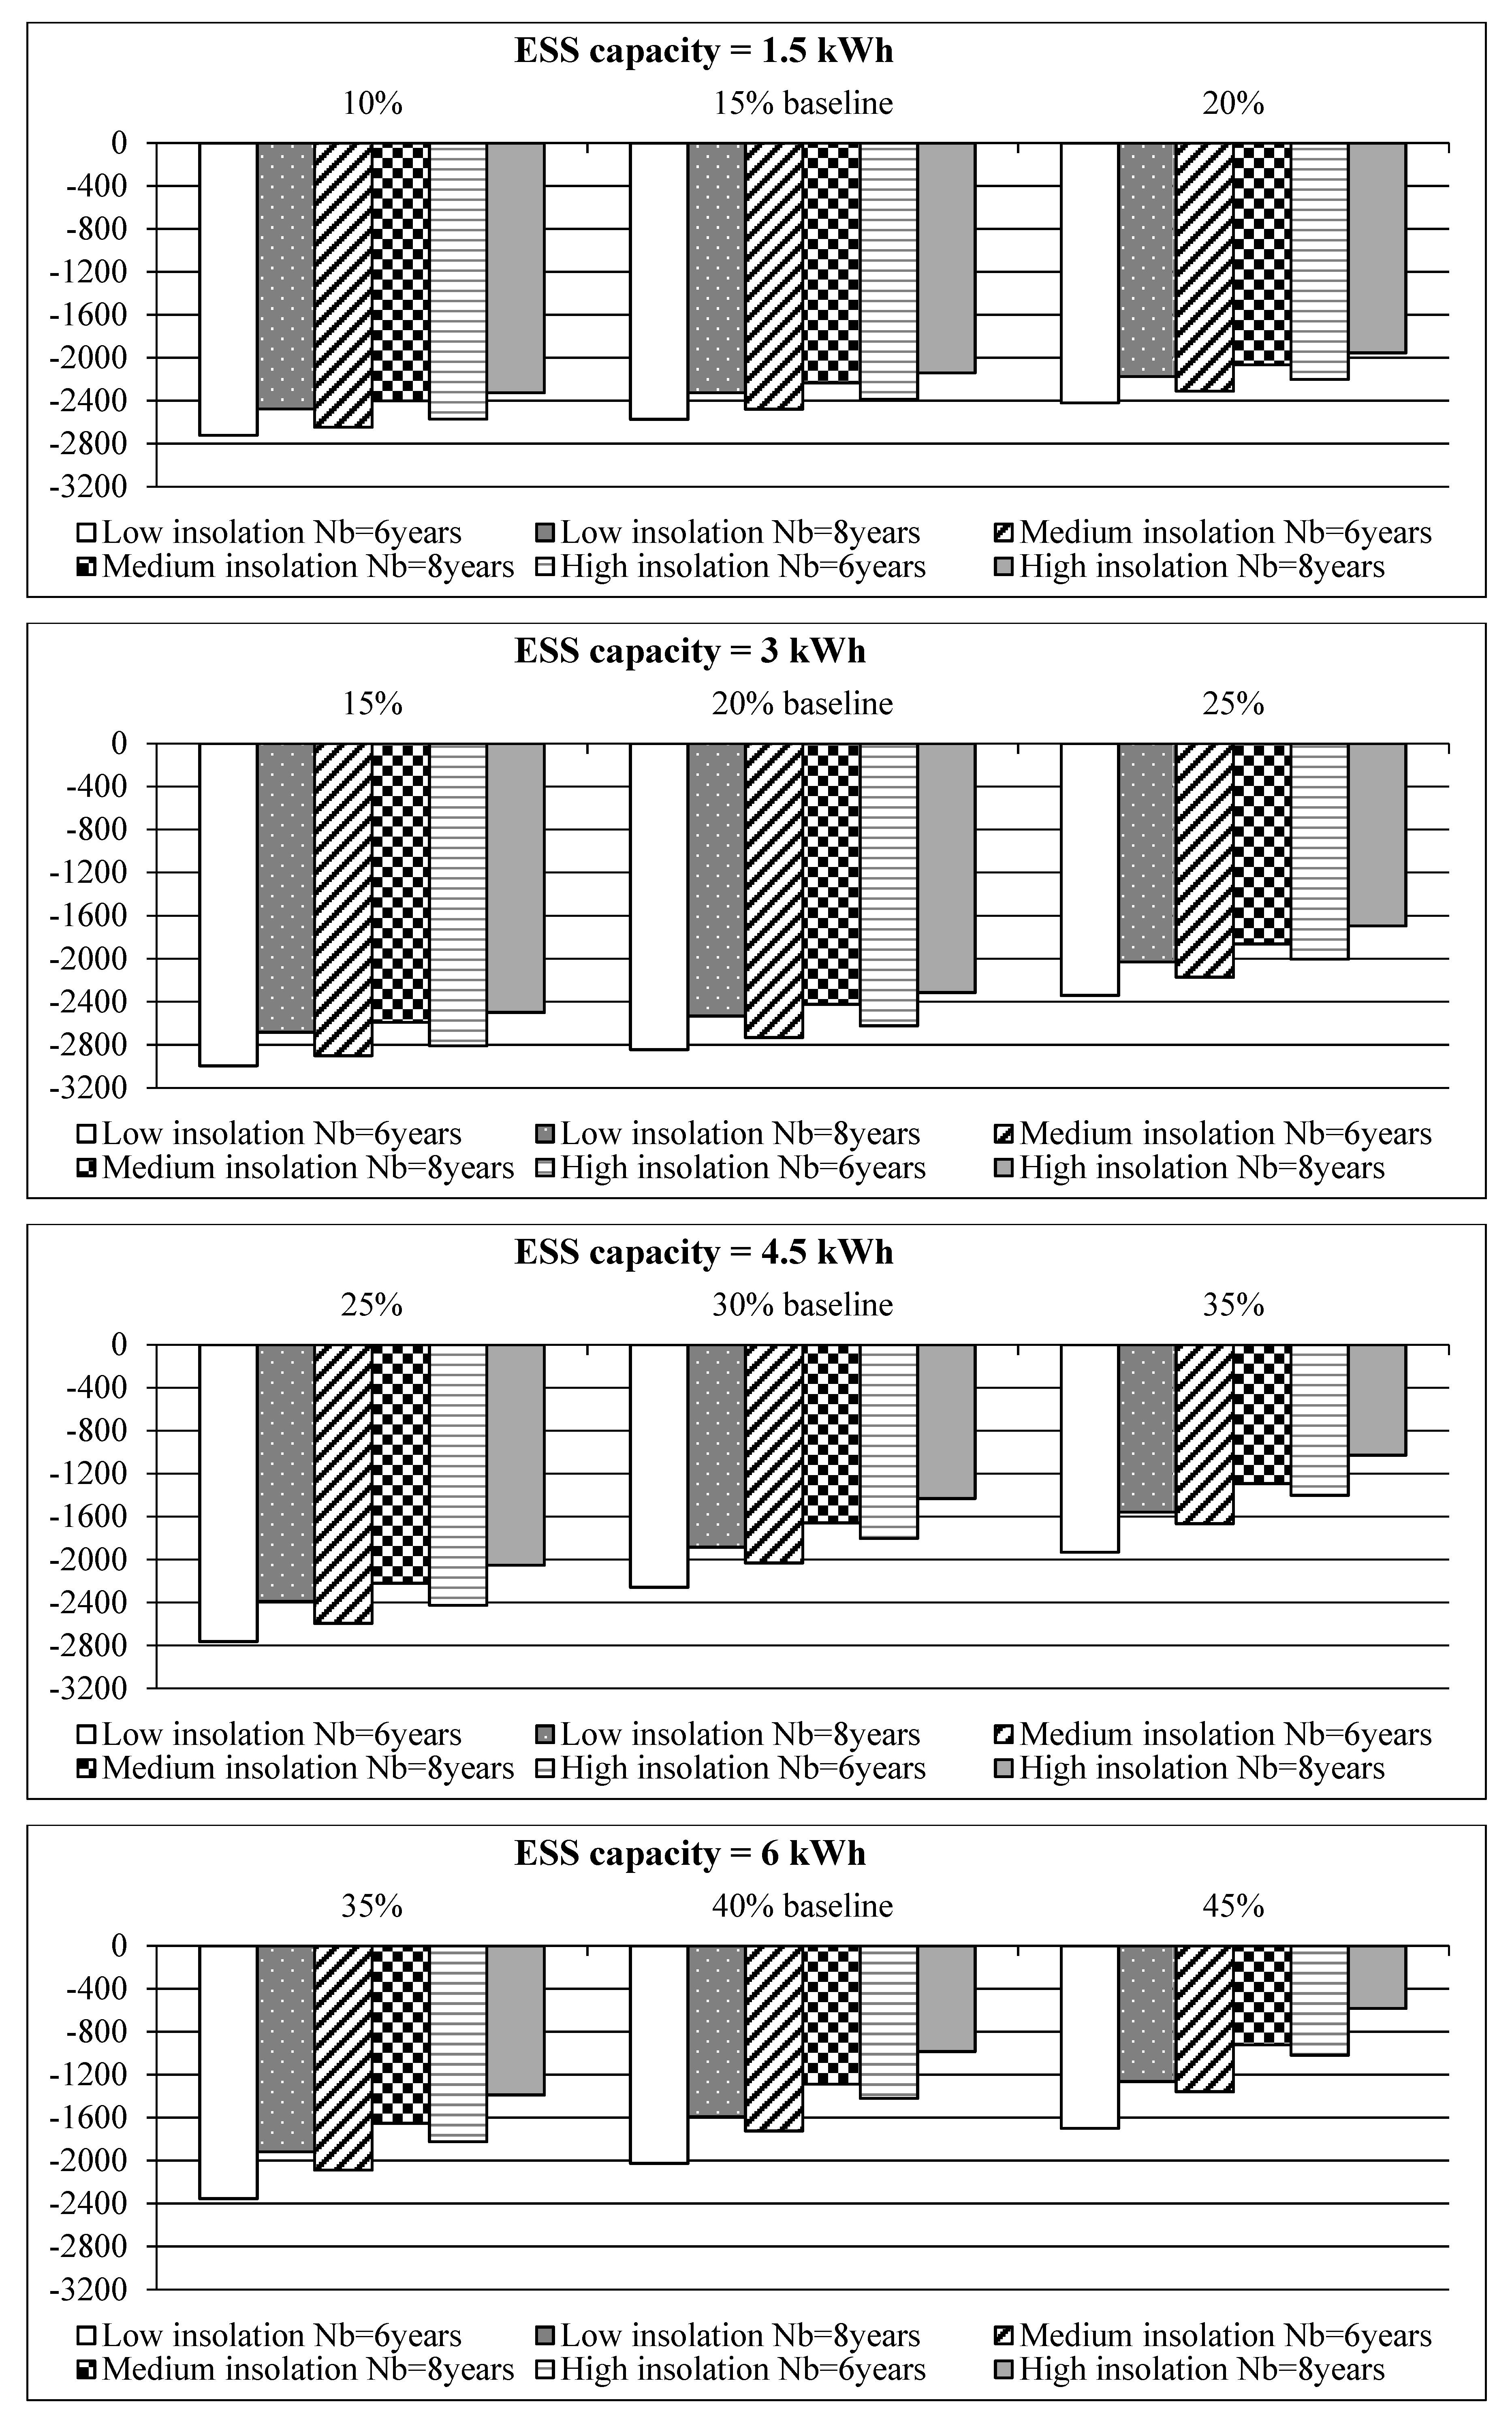
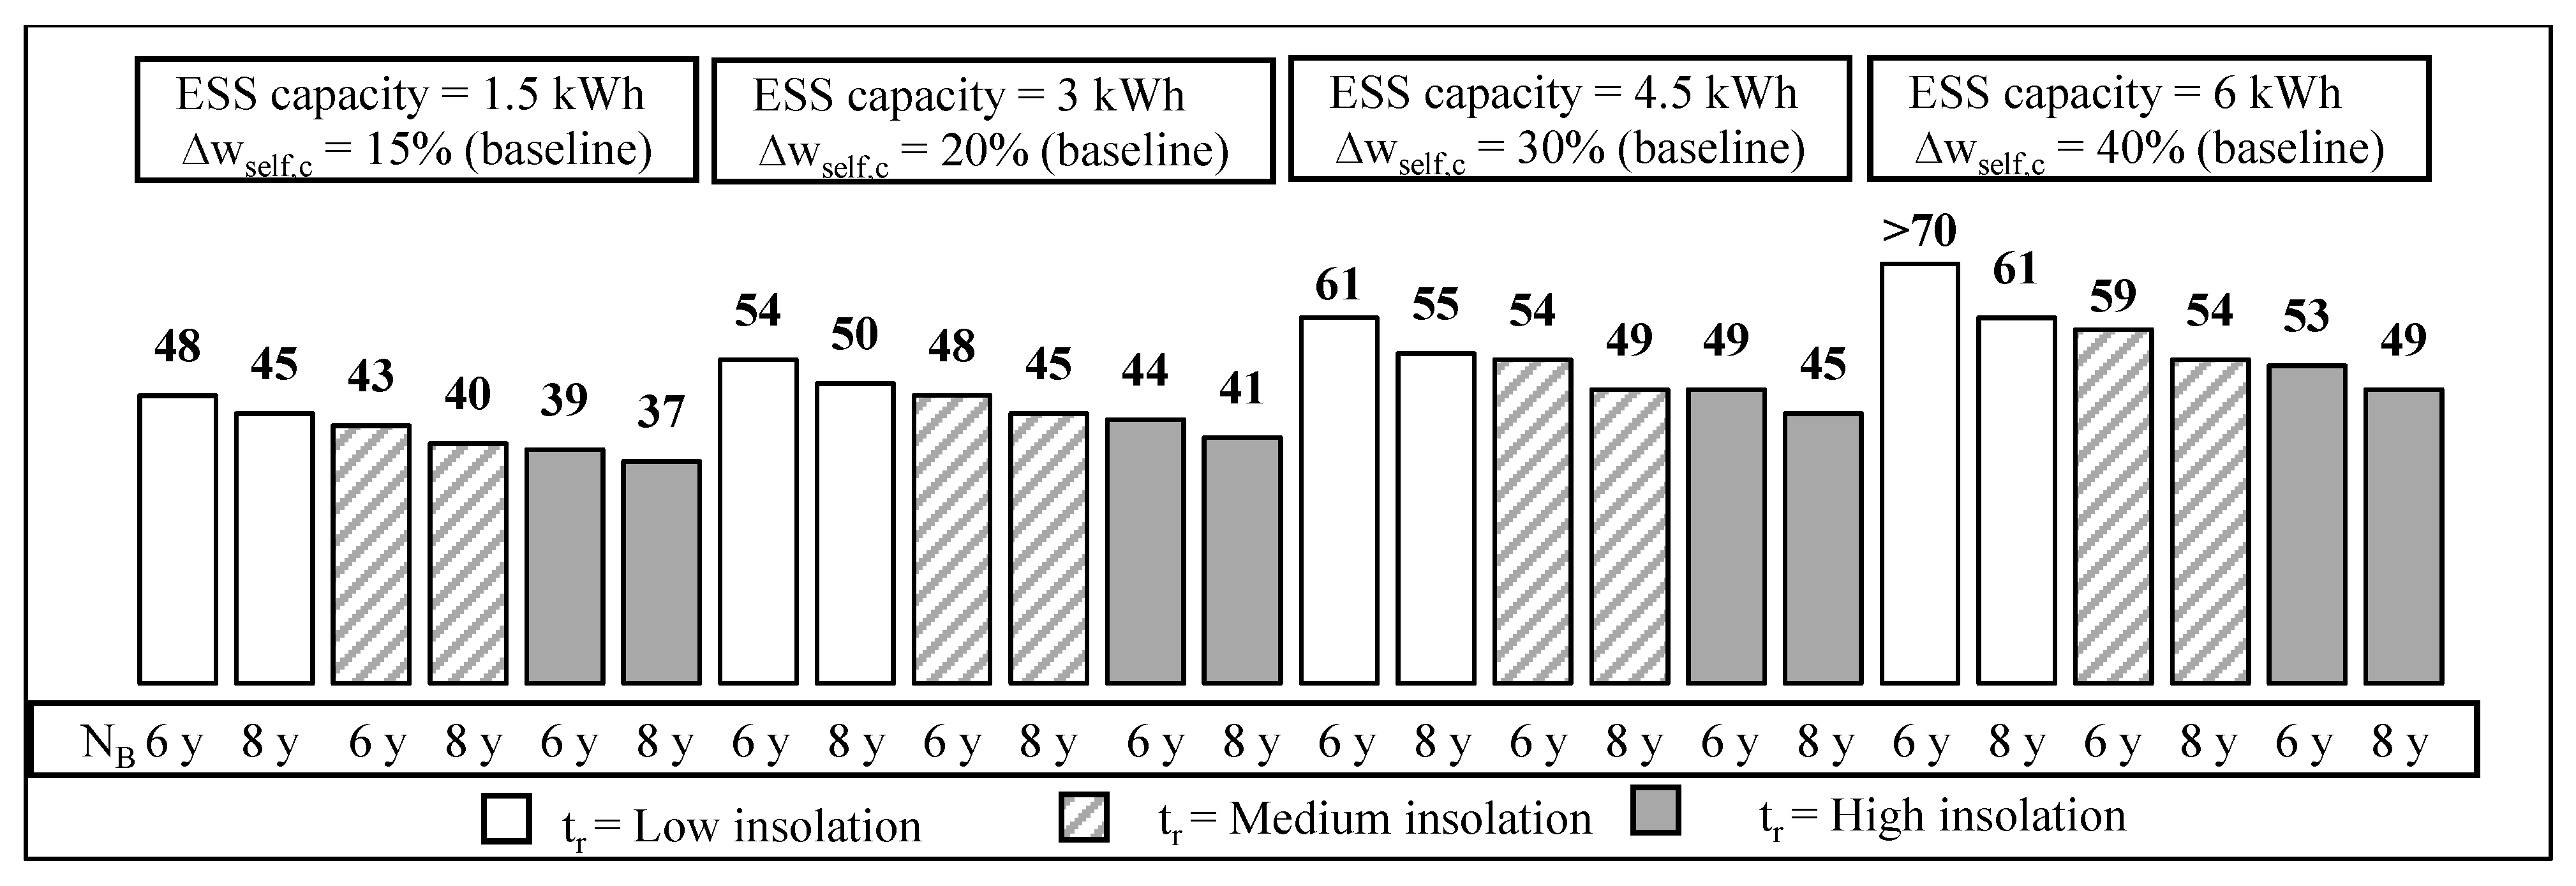
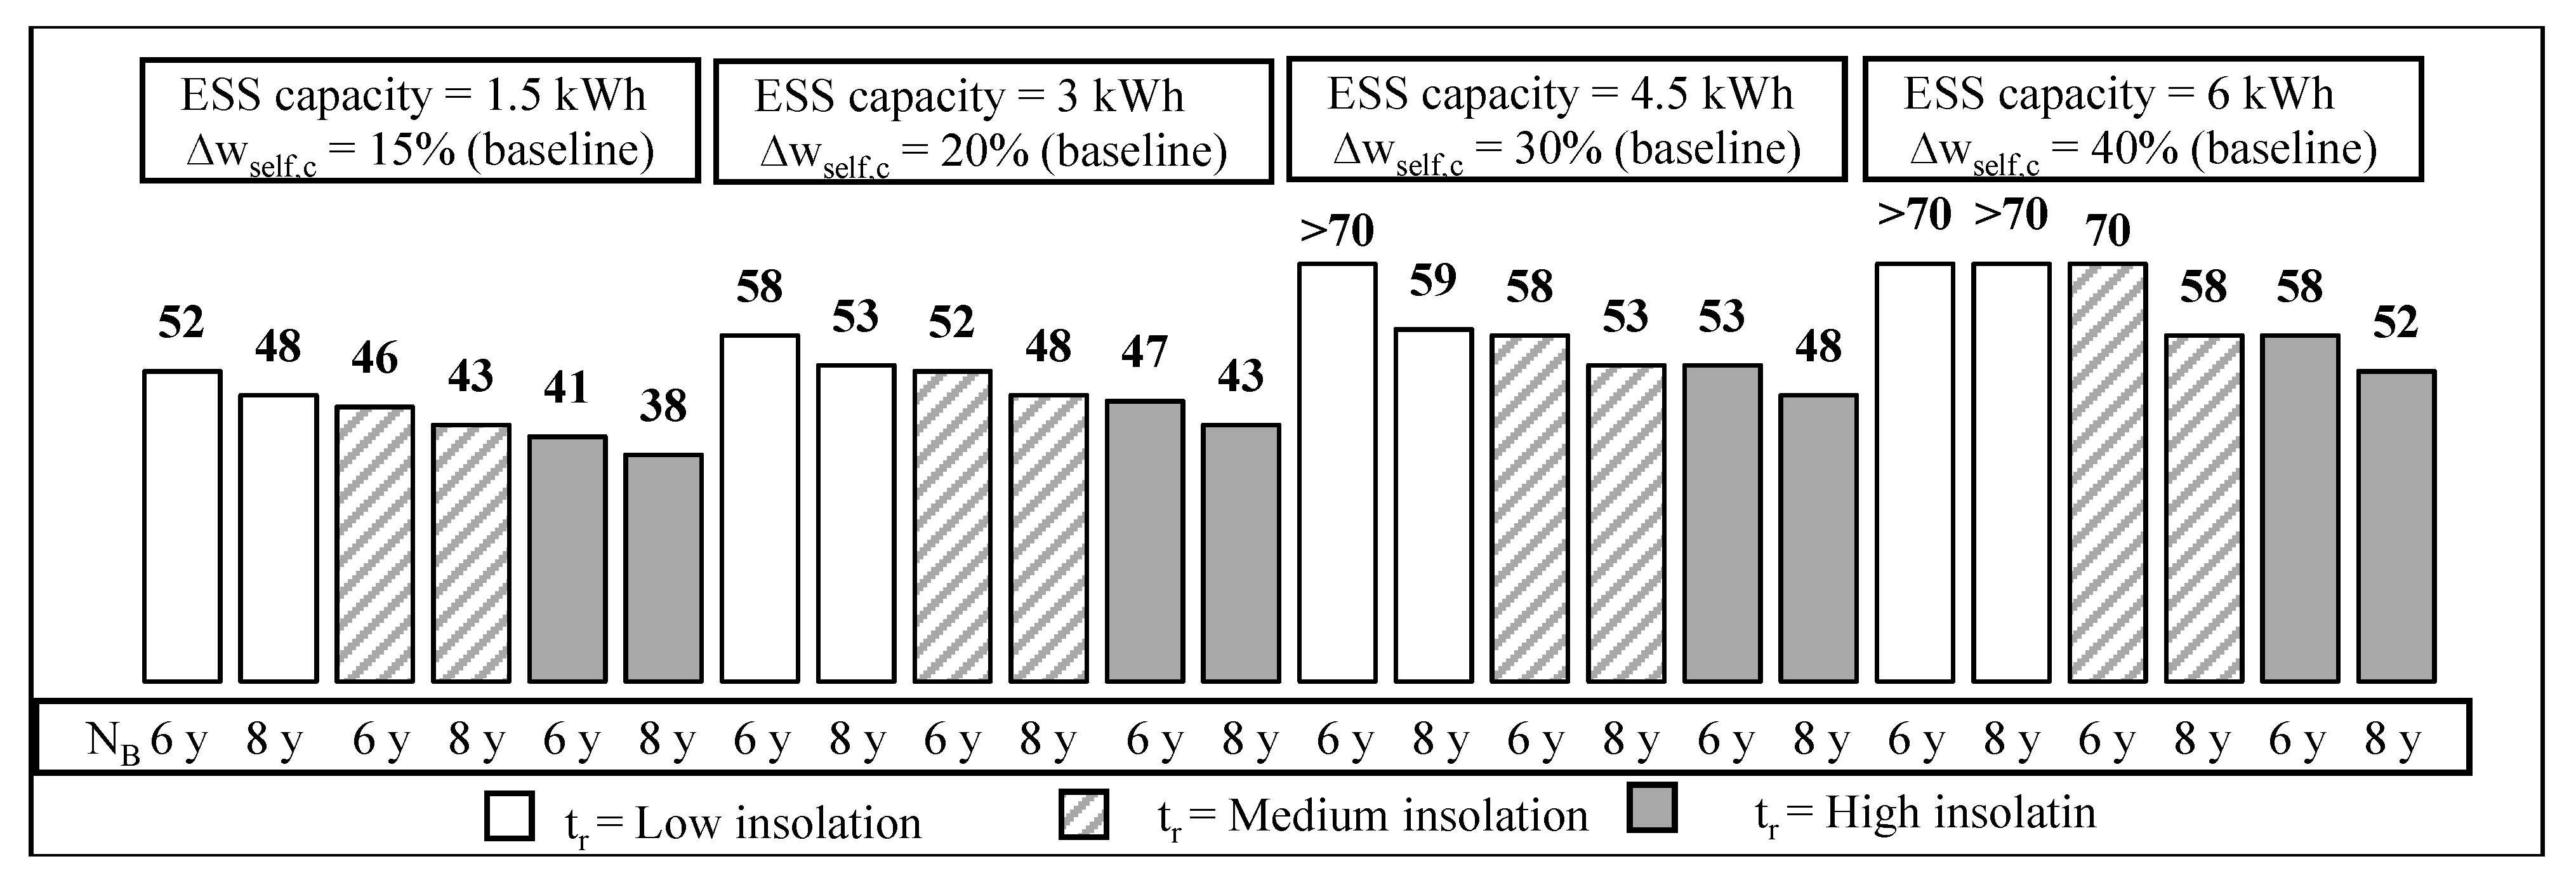
The BEP (in terms of ∆wself,c) concerning scenarios (Figure 6) and (Figure 7) assumes the following min–max values:
- 34–48% with the ratio B/S = 0.5 (the baseline value is equal to 15%).
- 38–54% with the ratio B/S = 1.0 (the baseline value is equal to 20%).
- 41–61% with the ratio B/S = 1.5 (the baseline value is equal to 30%).
- 45–>70% with the ratio B/S = 2.0 (the baseline value is equal to 40%).
Lower battery costs than the baseline scenario ones have the effect of reducing the BEP values. The difference between baseline value and percentage obtained in previous figures is almost equal to 5% (calculated as difference between 45% and 40%), 11%, 18% and 19%, when ESSs with a capacity battery of 6 kWh, 4.5 kWh, 3 kWh and 1.5 kWh, respectively, are evaluated. Consequently, for the first two sizes, there is a reduction of seven point percentages compared to the baseline scenario, while it is equal to five point percentages for the other two sizes. Only one scenario has an ∆wself,c > 70%.
5.2. Energy Storage System—Subsidies
As highlighted in Section 2, the role of subsidies is able to support the economic feasibility of ESS in residential applications.
The subsidy chosen is the one used by the Lombardy (the first region in Italy that has implemented this incentivizing scheme). It provides funds non-repayable of up to 50% of the investments costs incurred for the installation of ESS during the initial phase of the project (year zero). Alternately, the same economic value is distributed in five constant rates during the first year of the project [57]. Consequently, two alternative scenarios are proposed in this sub-section:
- scenario , in which subsidies are concentrated. In this scenario, another revenue equal to must be added in Equation (8).
- scenario , in which subsidies are distributed. In this scenario, another revenue equal must be added in Equation (8).
Also, this analysis considers forty-eight case-studies determined by combinations of the following variables:
- three levels of insolation.
- two lifetimes of the battery.
- four battery storage capacities.
- two estimations of subsidies.
The role of the increase of the self-consumption will be analyzed in BEP analysis. Also, in this step of the work, economics of ESS (Figure 8) and the financial feasibility of integrated PV-ESS (Table 5) are proposed separately.
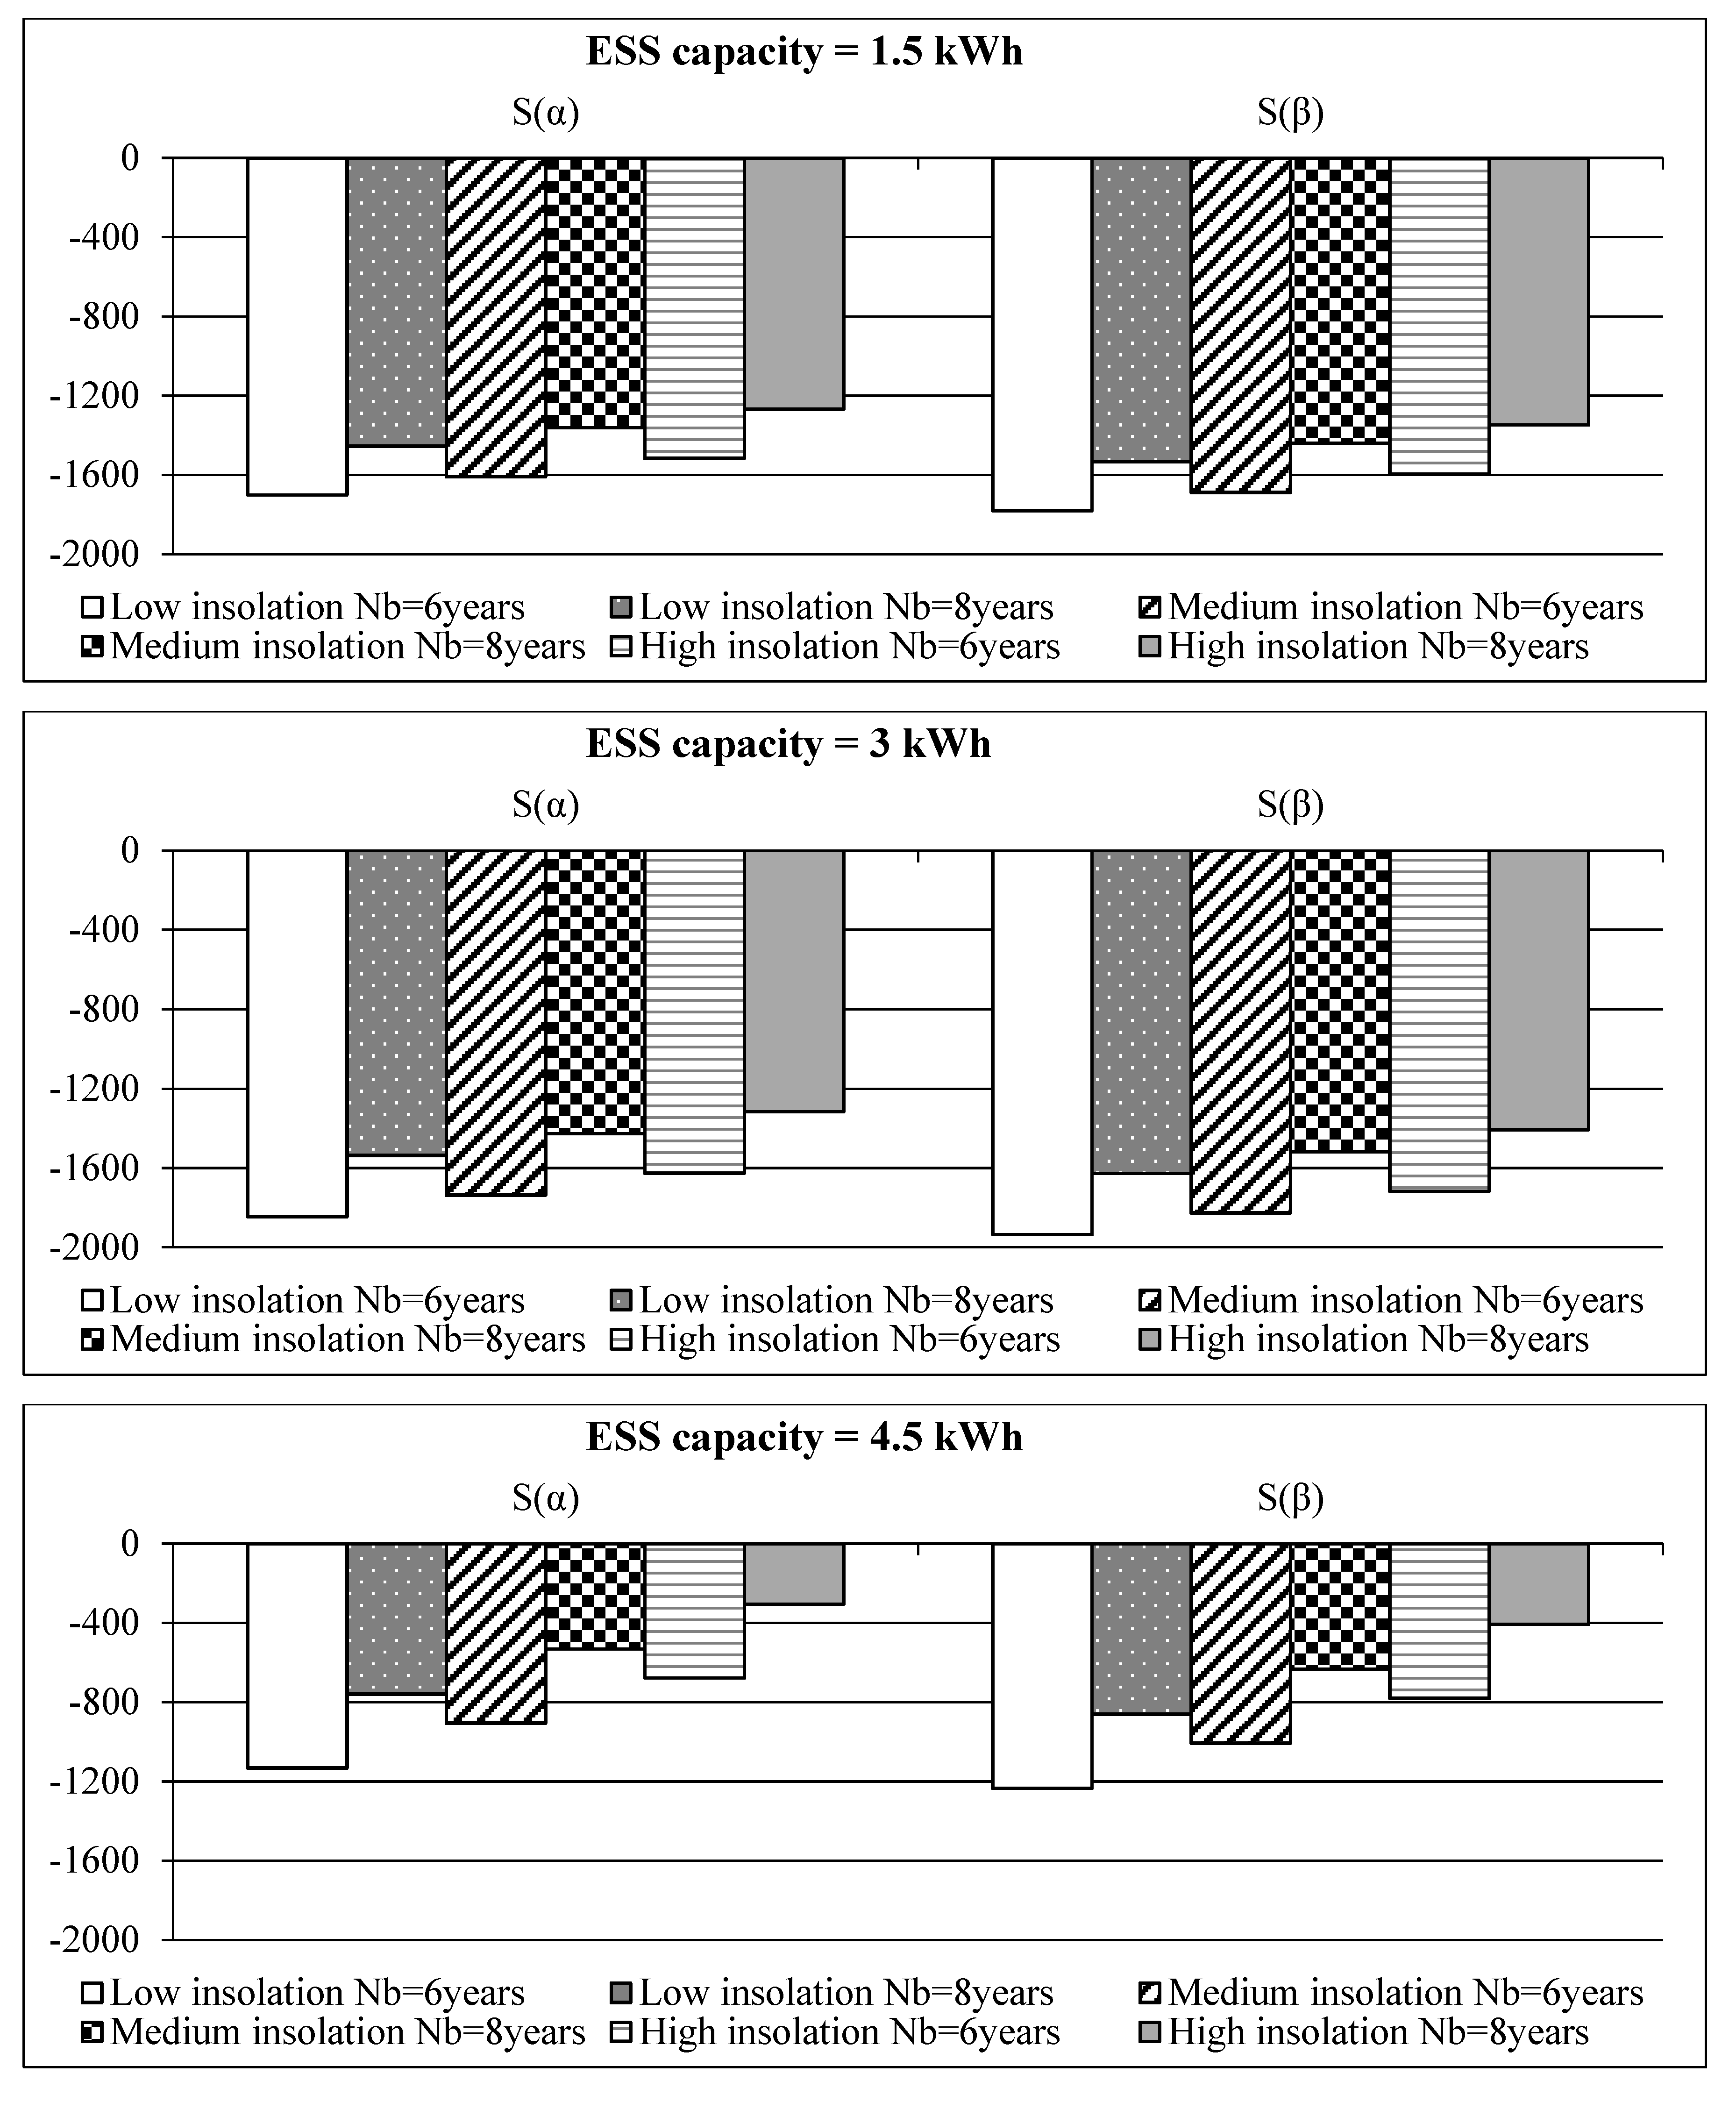
The adoption of subsidies permits to reach a significant increase of NPV than the baseline scenario. It ranges from 871 € to 1254 € for ESS storage capacity of 1.5 kWh and 6 kWh considering the subsidies provided in one rate, respectively. However, it varies from 792 € to 1140 € when the subsidies are distributed in five constant rates. The economic feasibility of ESS-PV project is verified in thirty-two case-studies (67%).
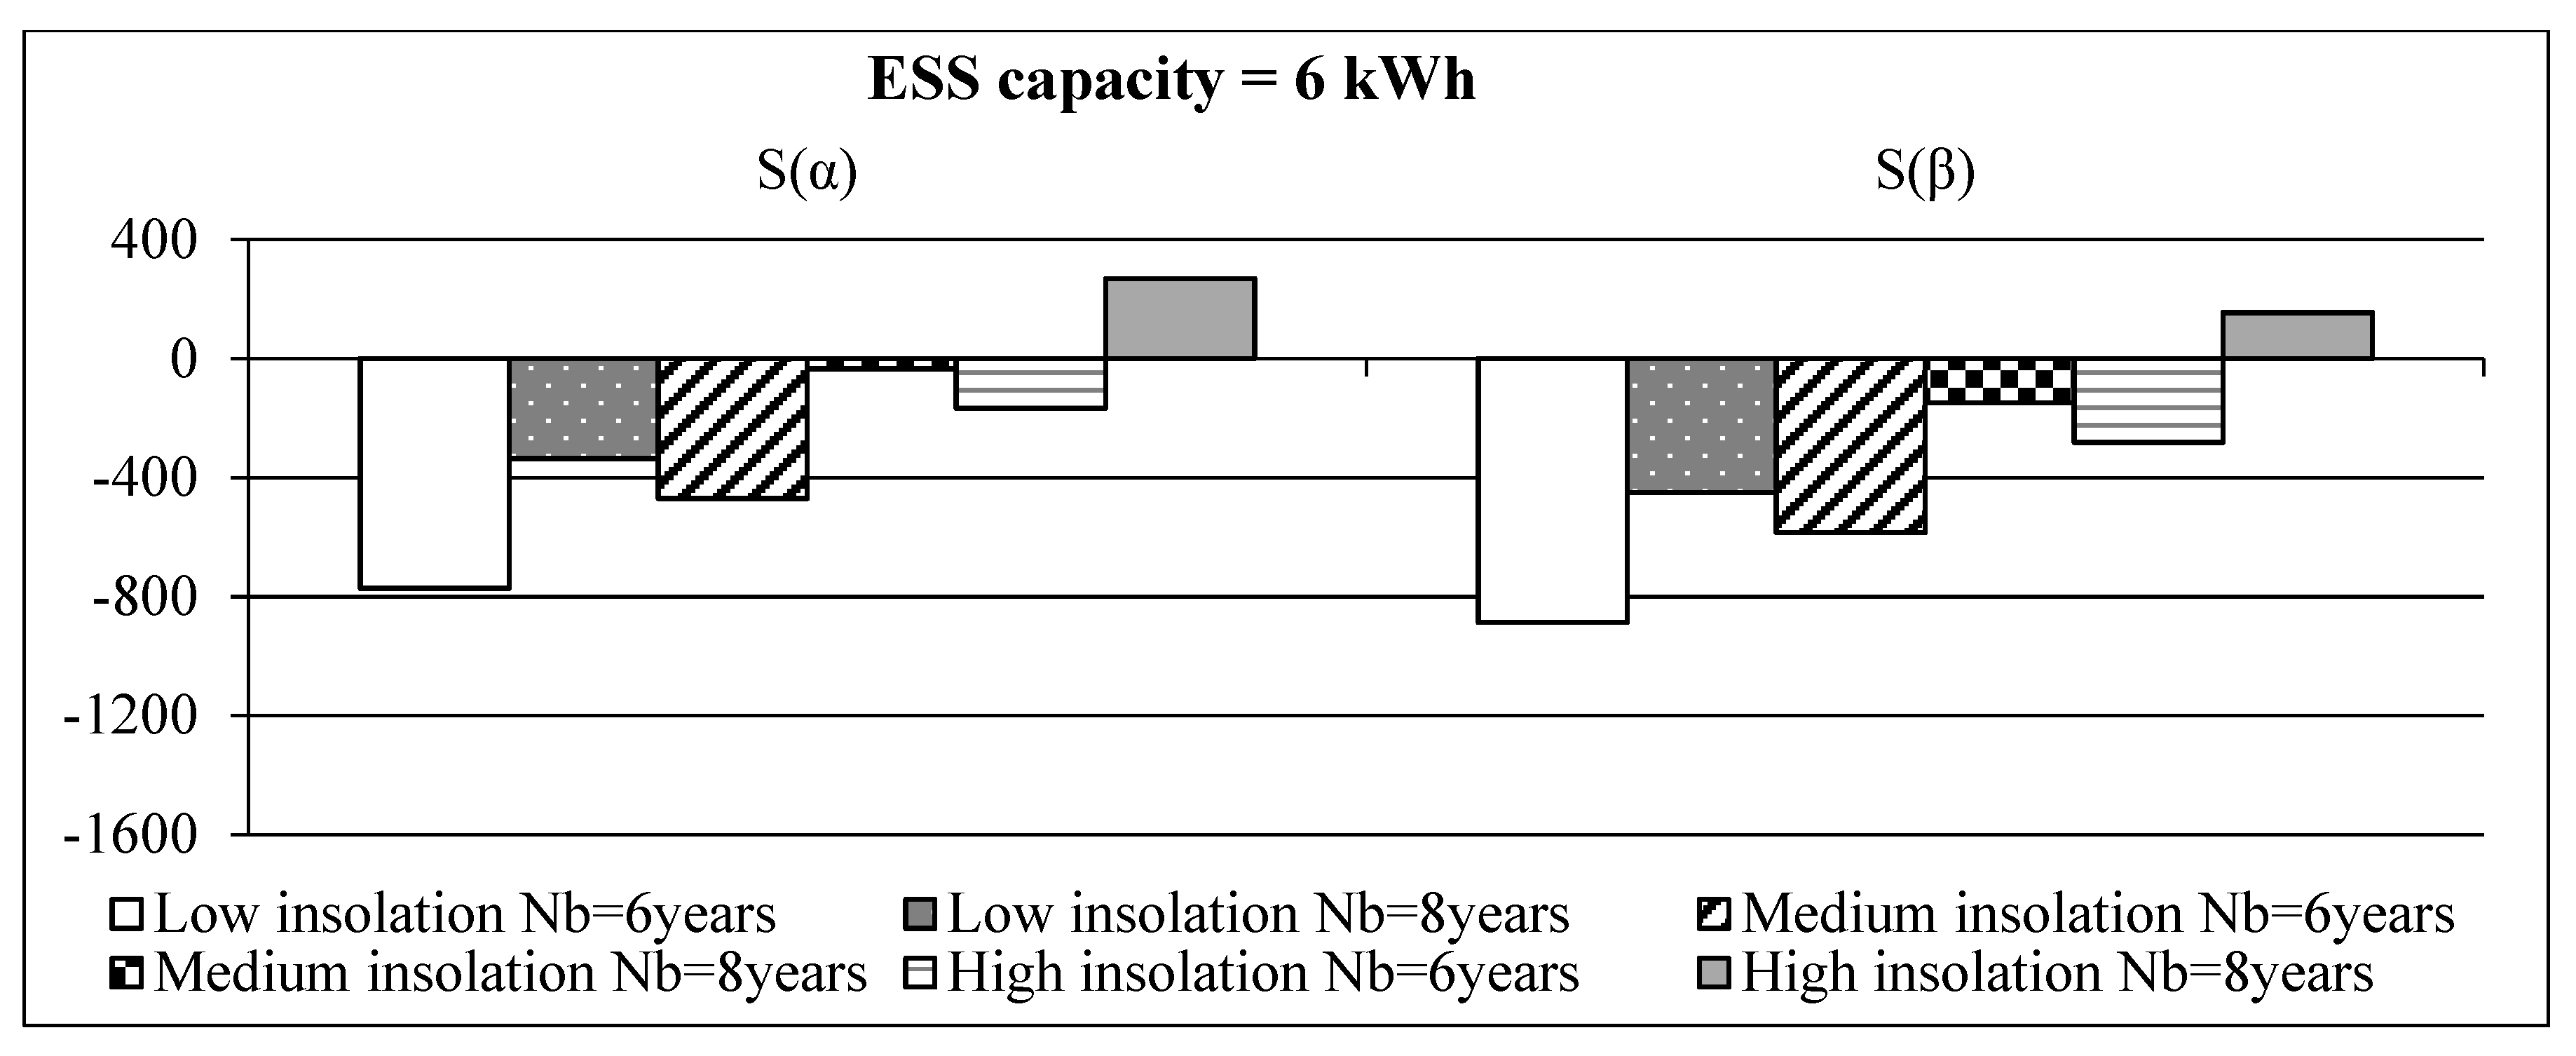
This analysis provides two case-studies in which the profitability of integrated PV-ESS project is greater than one of the PV projects. A total of 2518 € (scenario ) and 2404 € (scenario ) with an ESS storage capacity of 6 kWh and the lifetime of 8 years in territories with high level of insolation (tr = 1600 kWh/(m2·year)) are greater than 2249 € (see Figure 2). This result depends by the positive value linked to the adoption of ESS (see Figure 8).
In fact, for the first time in this work, NPV(ESS) is positive in two case-studies previously defined. Furthermore, the losses linked to this choice are low (from −34 € to −281 €) in the situations concerning scenarios and with an ESS storage capacity of 6 kWh and: (i) 6 years useful lifetime of ESS in territories with tr = 1600 kWh/(m2·year), or (ii) 8 years useful lifetime of ESS in territories with tr = 1450 kWh/(m2·year).
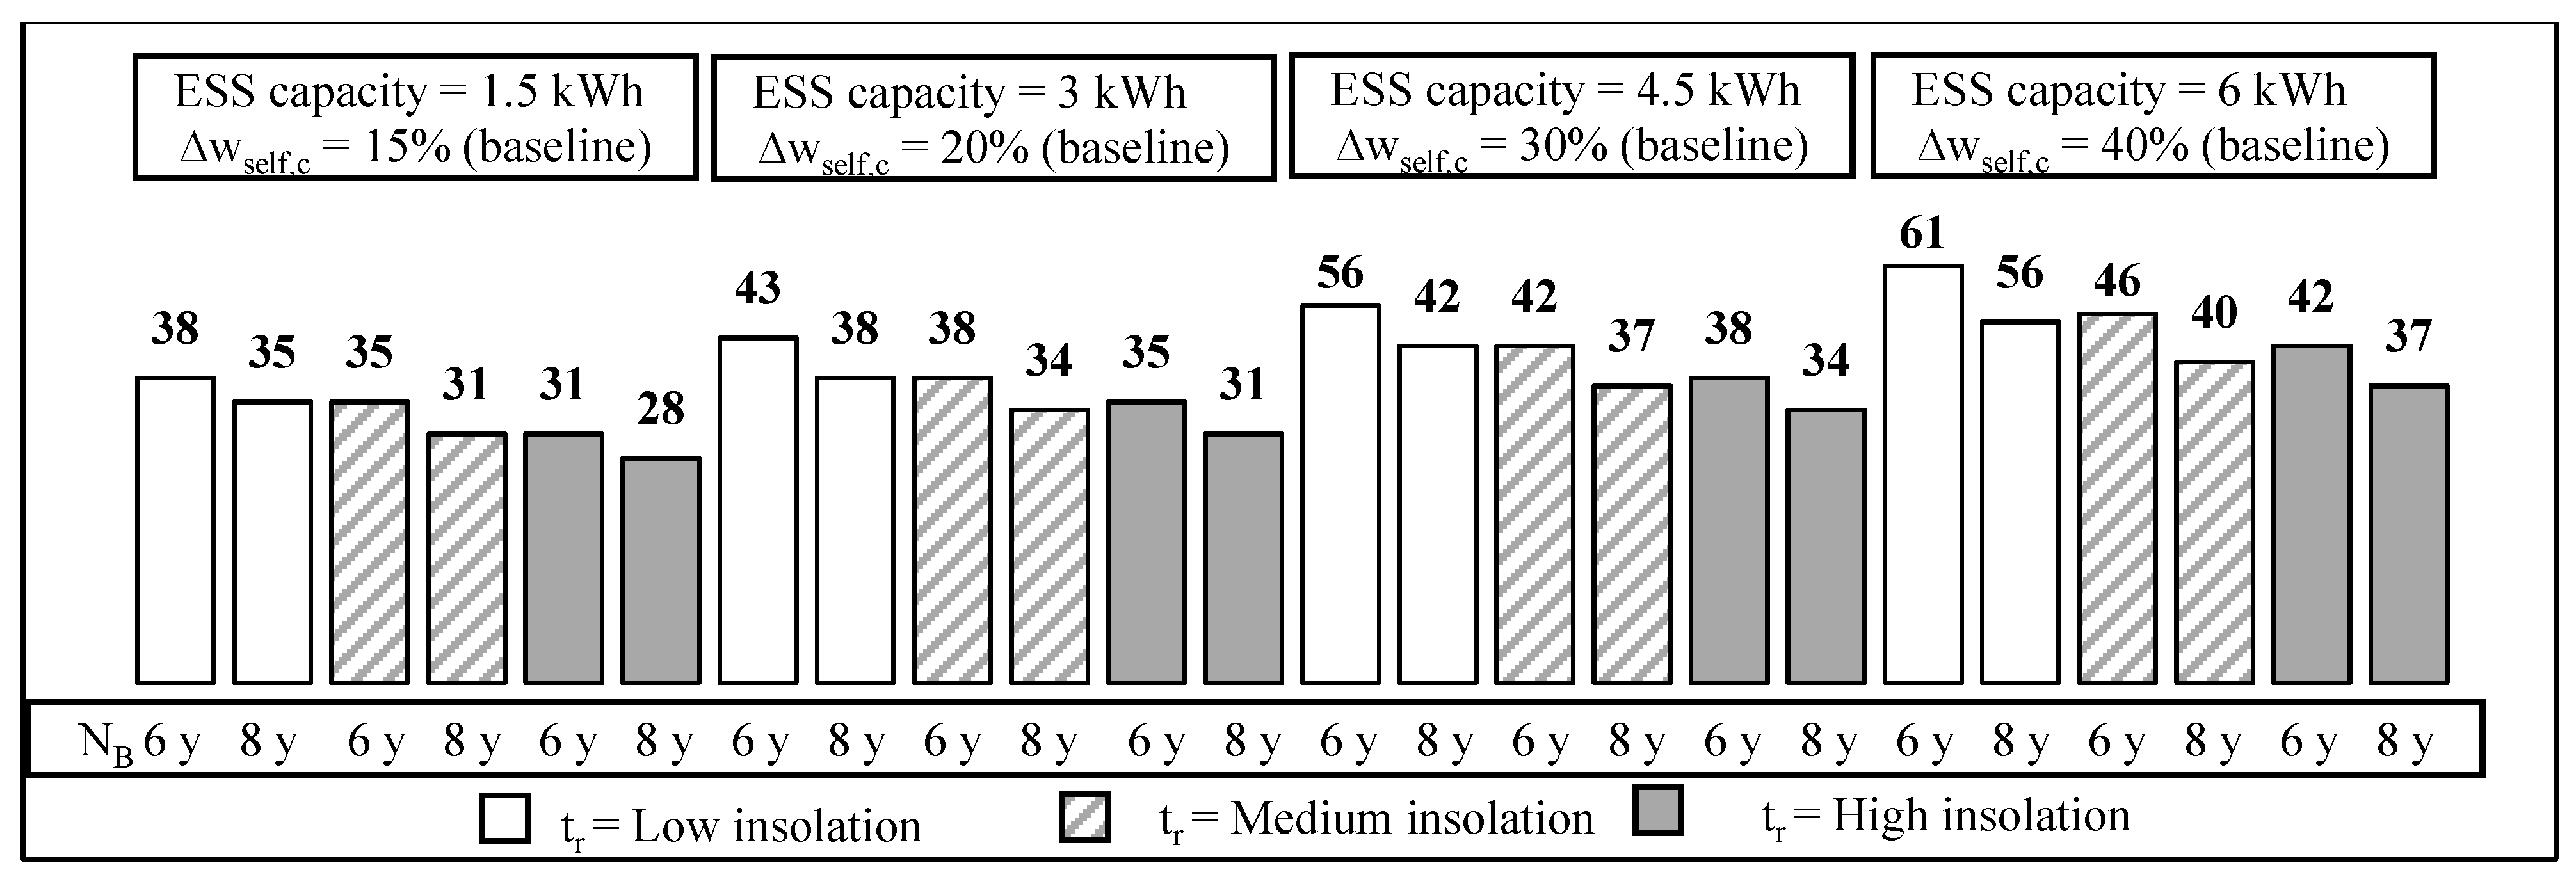
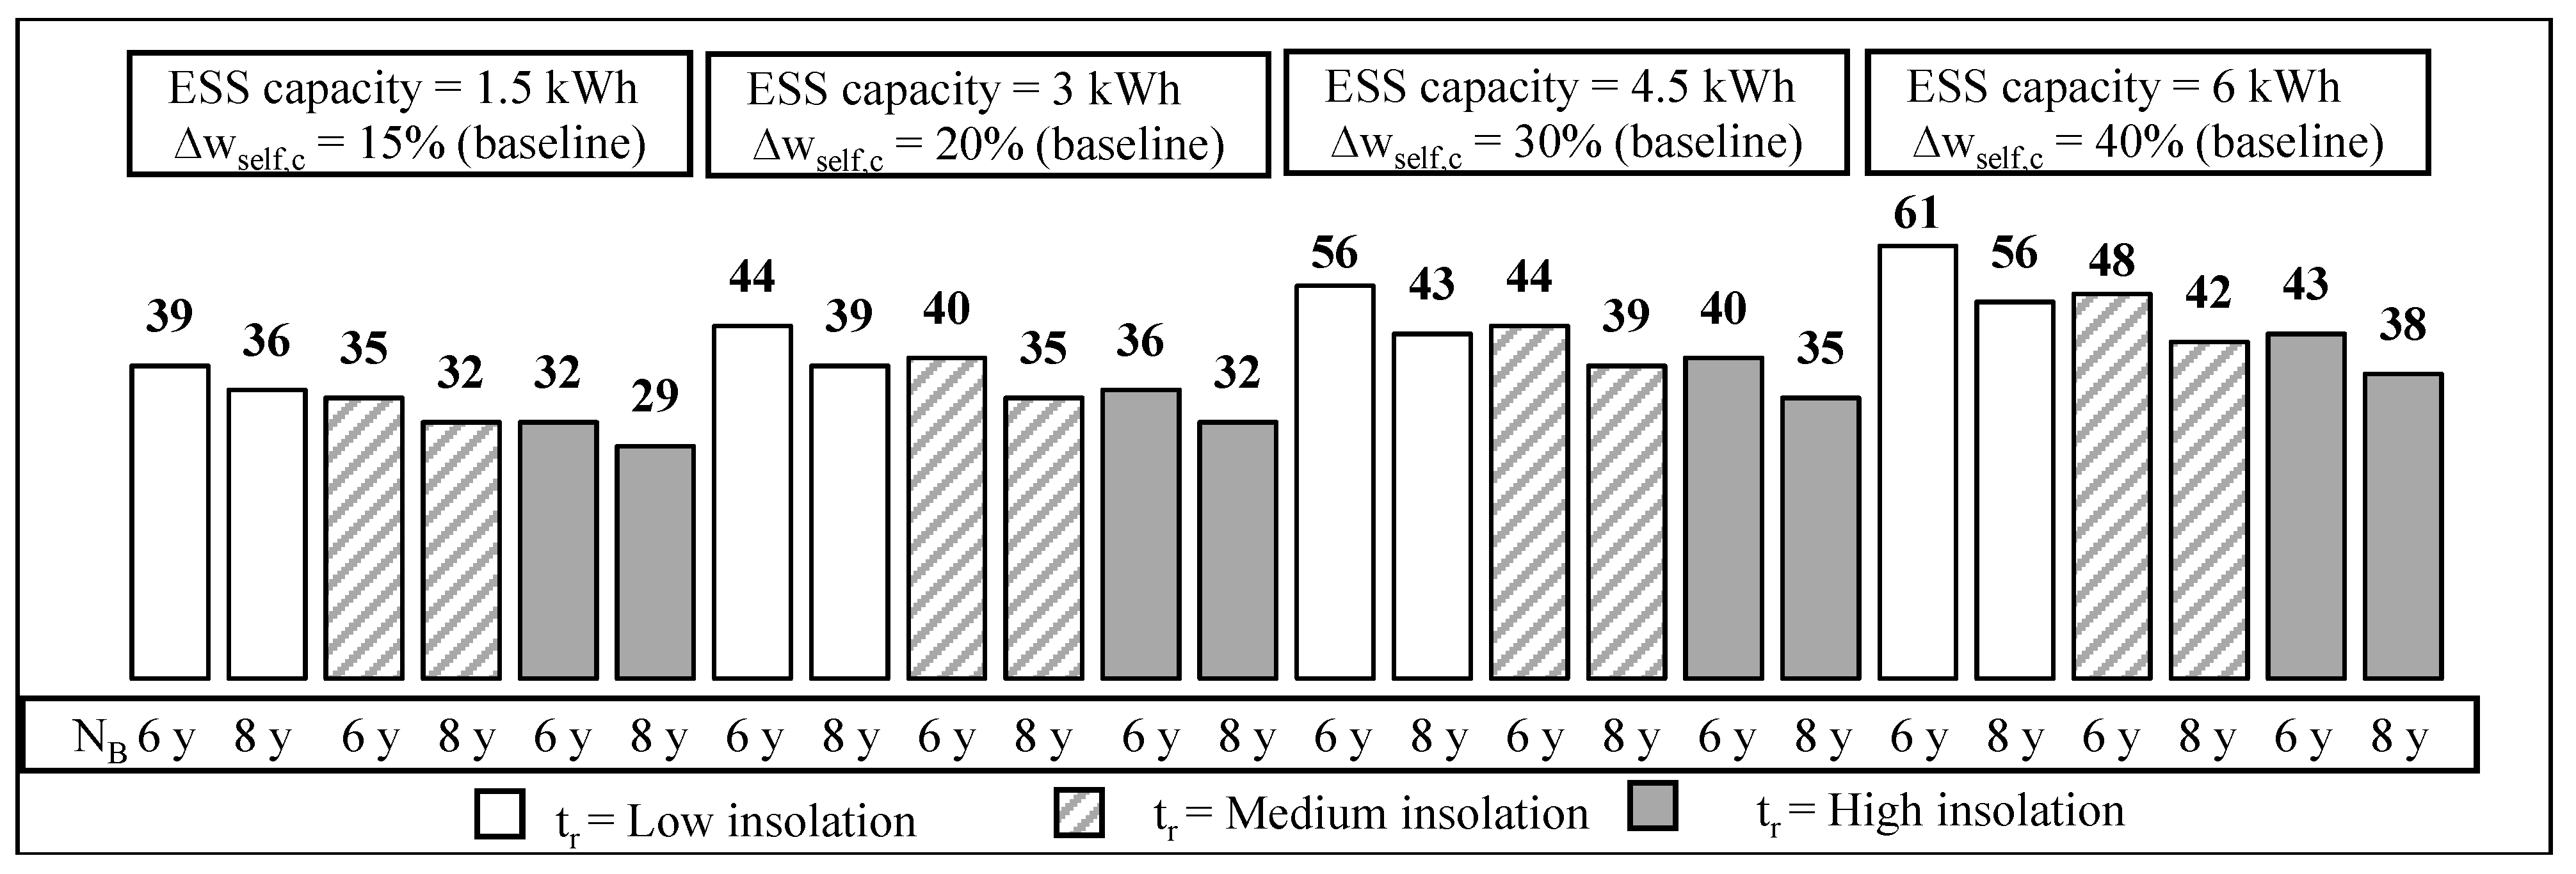
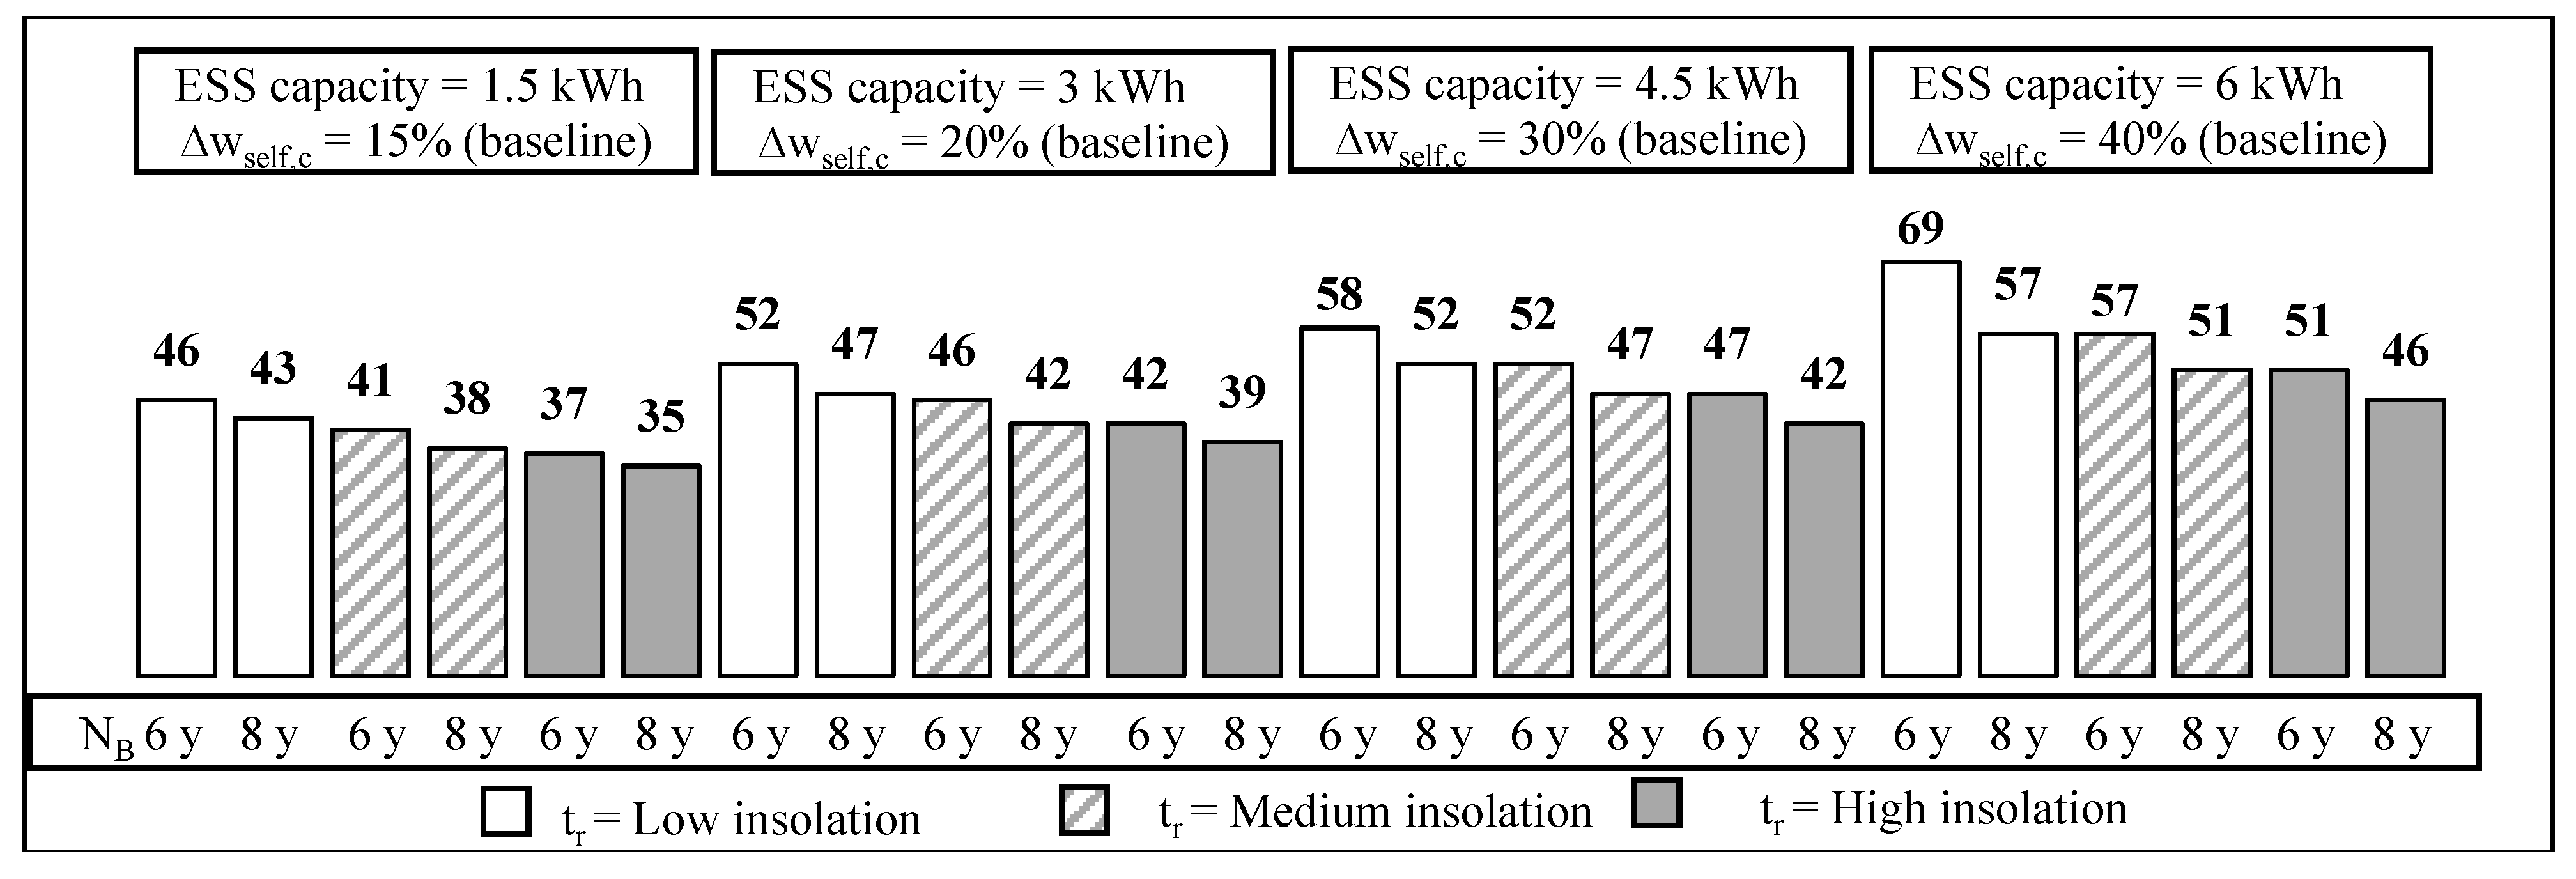
The BEP analysis can be useful to define exactly the values of increase of self-consumption (∆wself,c) that permits to reach the profitability. This analysis is conducted for scenarios (Figure 9) and (Figure 10). It assumes the following min-max values:
- 28–39% with the ratio B/S = 0.5 (the baseline value is equal to 15%).
- 31–44% with the ratio B/S = 1.0 (the baseline value is equal to 20%).
- 34–56% with the ratio B/S = 1.5 (the baseline value is equal to 30%).
- 37–61% with the ratio B/S = 2.0 (the baseline value is equal to 40%).
BEP analysis confirms the key-role of subsidies; in fact, the application of an incentive scheme permits a significant reduction of BEP values. Excluding two case-studies previously defined, in which BEP varies from 37% to 38% (lower than 40%) and consequently with an NPV(PV+ESS) > NPV(PV), the difference between the baseline value and the percentage obtained in the previous figure is almost equal to 2% (obtained with the difference between 42% and 40%), 4%, 11% and 13%, when ESSs with a capacity battery of 6 kWh, 4.5 kWh, 3 kWh and 1.5 kWh, respectively, are evaluated.
5.3. Photovoltaic System
In this sub-section variations of the critical variables concerning the PV system are proposed [40]. The following scenarios are analyzed—Figure 11:
- and , where the electricity purchase price is equal to 17 cent €/kWh and 21 cent €/kWh, respectively.
- and , where the electricity sales price is equal to 12–13 cent €/kWh and 8–9 cent €/kWh, respectively.
- and , where the specific investment cost is equal to 1800 €/kW and 1600 €/kW, respectively.
- TaxDu-br, where the specific tax deduction is equal to 36%.
The profitability of PV plants is always verified, as highlighted in Figure 2.
From one side, the greatest positive changes of NPV are generated by a reduction of 20% of investment costs and it is equal to 353 € per kW installed. From the other side, the greatest negative variation of NPV is verified if the legislator opts to set the specific tax deduction equal to 36% (in fact, the baseline scenario provides a value equal to 50%, that is a policy support to the PV market). It is equal to 238 € per kW installed. Consequently, also the increases of self-consumption present different values in financial terms and therefore the economics of ESS are modified.
This analysis considers one hundred and sixty-eight case-studies determined by combinations of the following variables:
- Three levels of insolation.
- Two lifetimes of the battery.
- Four battery storage capacities.
- Seven PV business case studies.
Figure 12 proposes the economics of ESS, and the profitability of integrated PV-battery systems is defined in Table 6.
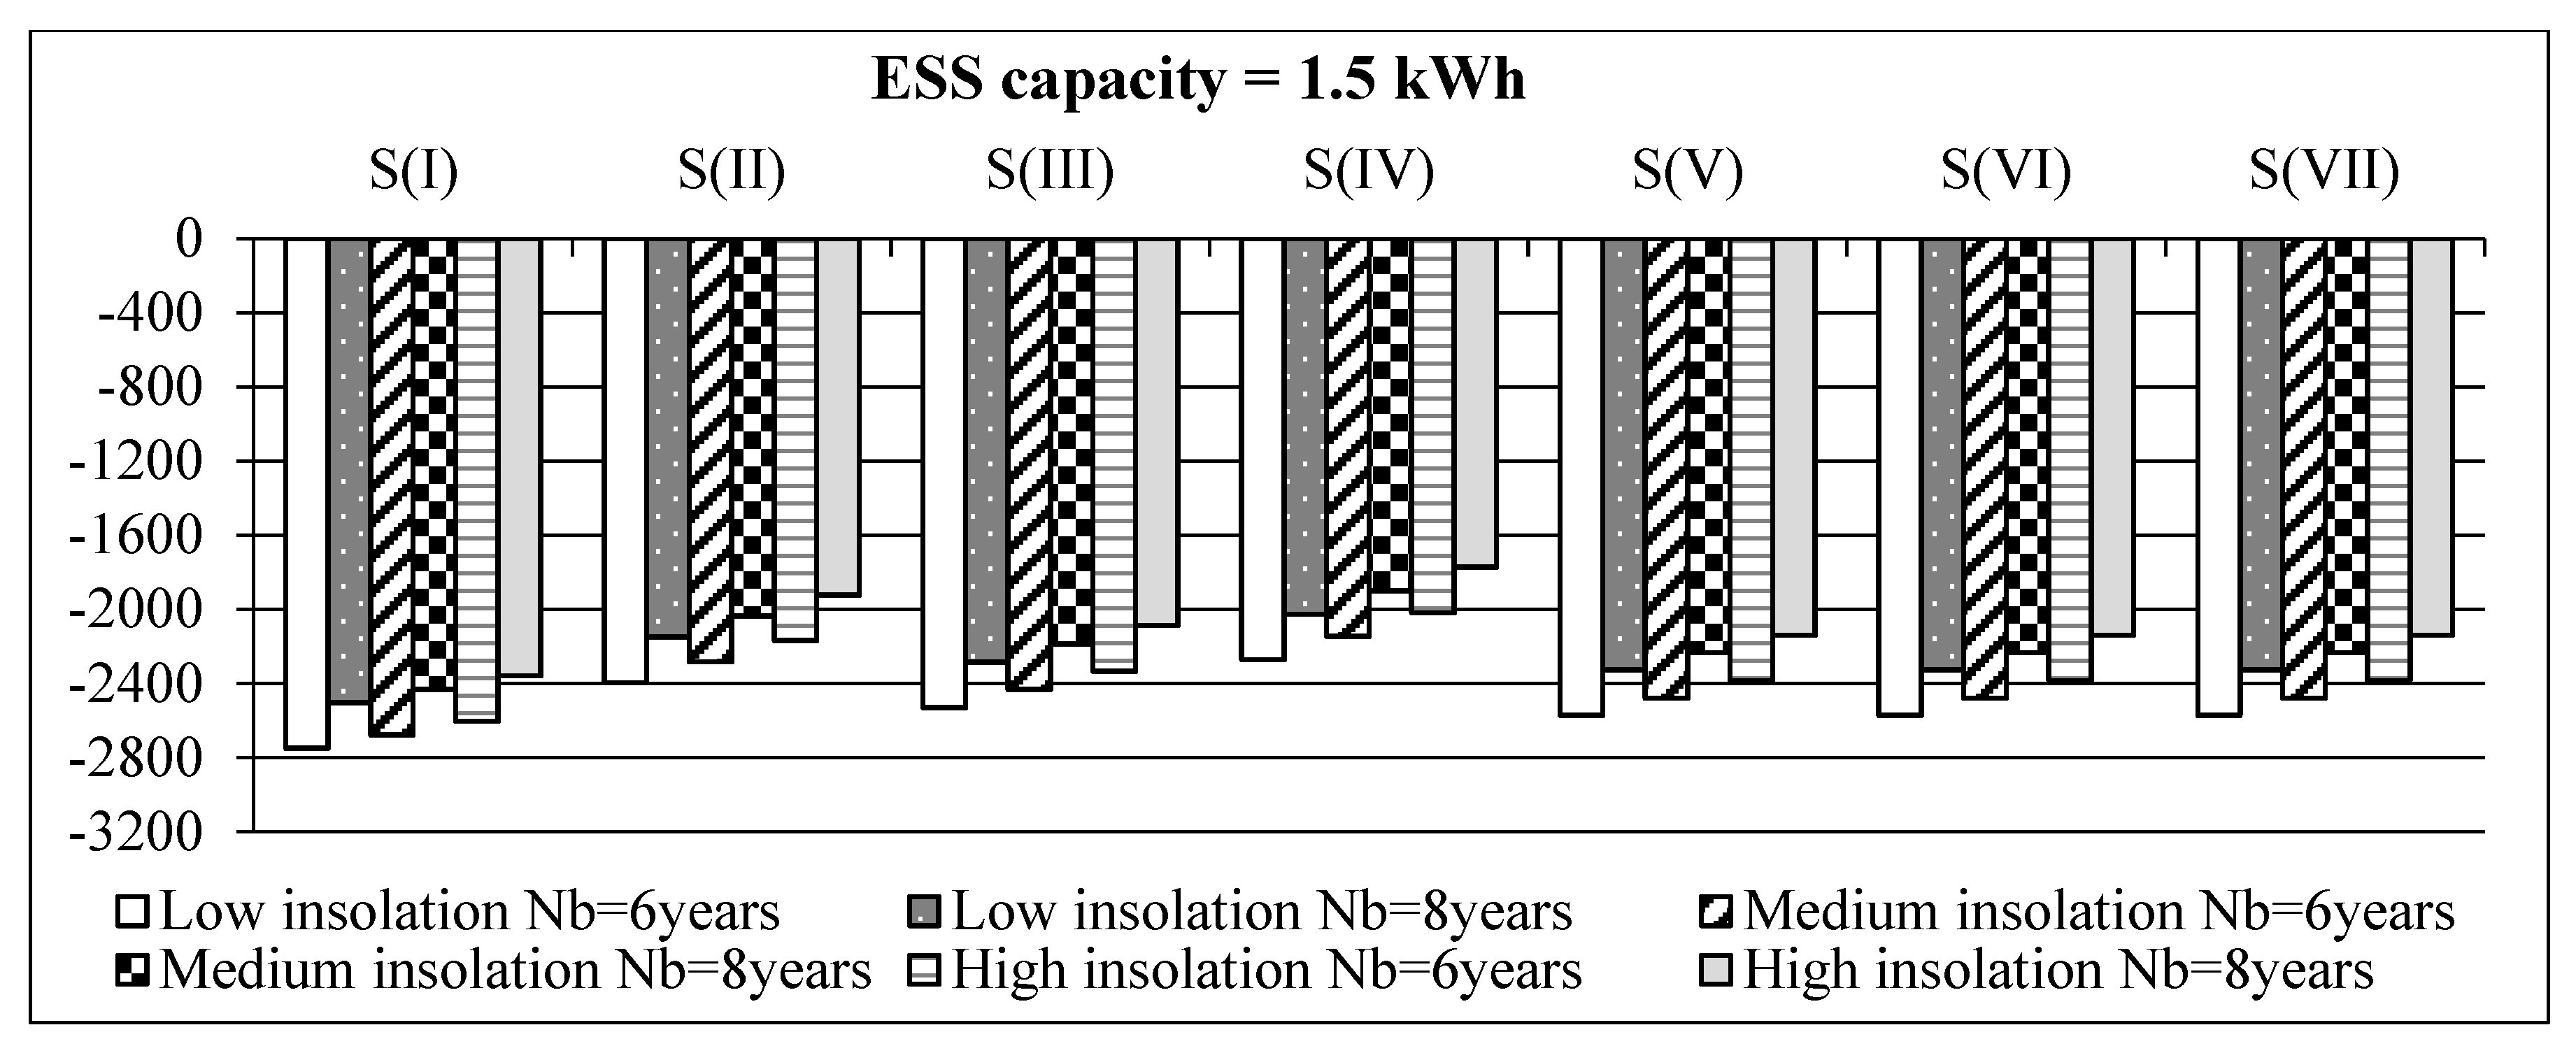
The profitability of integrated PV-ESS is verified only in sixty-one case-studies (36%). However, in these results also, the consumer will prefer to install only a PV plant. The maximum NPV(PV+ESS) is equal to 2323 € in scenario, which is lower than NPV(PV) equal to 3308 € reported in Figure 11. Furthermore, it can be seen that three scenarios (, and ) have the same variation due to mathematical model proposed in Table 2, in which there is a linear relationship among the variables examined.
The analysis of PV business case studies shows that the greatest variation is verified with scenario, if ESS capacity is equal to 1.5 kWh or 3 kWh, while for other two sizes (4.5 kWh and 6 kWh) it is linked to scenario. A defined ESS’ size able to use stored energy reaches better financial performances, when is evaluated against an increase of the energy bill cost. In fact, the application of integrated PV-battery systems allows for avoiding these costs.
The advantages of self-consumption can be obtained also through the reduction of the selling price of energy (that is lower than the electricity purchase price in the baseline scenario, see Table 2). For example, a 3-kW plant with tr = 1450 kWh/(m2·year) has an increase of NPV equal to 1329 € and 1643 € when is hypothesized a ∆wself,c = 20% in and scenario, respectively. Instead, if ∆wself,c = 40% there is an opposite situation: an increase of NPV equal to 4311 € in scenario, that is higher than 4106 € in scenario.
The BEP (in terms of ∆wself,c), concerning scenarios (Figure 13), (Figure 14), (Figure 15), (Figure 16), , and (Figure 17), assumes the following min–max values:
- 33–48% with the ratio B/S = 0.5 (the baseline value is equal to 15%).
- 37–54% with the ratio B/S = 1.0 (the baseline value is equal to 20%).
- 41–61% with the ratio B/S = 1.5 (the baseline value is equal to 30%).
- 45–>70% with the ratio B/S = 2.0 (the baseline value is equal to 40%).
The difference between the baseline value and the percentage obtained in previous figures is almost equal to 4% (calculated as difference between 44% and 40%), 10%, 17% and 18%, when ESSs with a capacity battery of 6 kWh, 4.5 kWh, 3 kWh and 1.5 kWh, respectively, are evaluated. These values are present in scenario. In fact, the increases of avoided costs in energy bills favors investments in the PV sector. Thirty-two case-studies have a value greater than 70% and consequently the profitability is never reached.
6. Discussion
Some citizens, researchers and policy-makers have criticized the subsidies given to PV sources. The development of this sector (which, among renewable resources, presents the first growth rate in recent years) and its diffusion in all countries (also if the current installed PV power is concentrated only in some territories) confirm the advantages linked to the use of solar energy.
Environmental improvements are defined by the significant reduction of GHG emissions than the use of fossil fuels and in addition, the Paris Agreement requires new actions to be implemented. The PV source plays a key-role in the transition towards a low-carbon society in the residential sector. All citizens can contribute to reach this goal, and at the same time, new business models are proposed (e.g., prosumer).
The reduction of costs has made photovoltaic power into a competitive resource. The International Energy Agency Report 2015 has defined the costs of generating electricity for several energy resources. Considering OECD countries, LCOE for solar PV residential varies from 0.09 €/kWh to 0.34 €/kWh. Instead, the range of values for natural gas and coal is equal to 0.06–0.13 €/kWh and 0.06–0.11 €/kWh, respectively. The authors have observed as the cheapest technology changes in function of several conditions. At the same time, PV source is competitive with other resources and the technological development is able to reduce its LCOE.
This study has proposed a quantitative analysis regarding the application of ESS applied to PV plants. Literature analysis proposes several works on this topic and this can be read from two points of view. The first, that ESS is a topic extremely useful to the energy sector towards the development of decentralized energy systems and smart grids. The second, that new economic analysis are useful because the development of ESS is currently not high and several works try to show which conditions are required for profitability.
The intermittent nature of the PV source is a limit, and technological solutions able to synchronize supply and demand of energy are useful. The application of ESS moves towards this direction. However, also the use of intelligent machinery and/or a greater attention of consumer to use them during high peaks of the solar production permit to reach this goal.
Some countries have adopted subsidies for ESS. This work does not examine the adequacy of this choice that can be supported by a Cost-Benefit Analysis. This work proposes a DCF analysis in order to consider only cash flows and not the economic value of externalities. The production of ESSs determine certainly the release of GHG emissions and its environmental benefit is verified when the grid is not able to absorb all the energy produced.
Results obtained in this work confirm ones reported in literature review (see Section 2). In fact, the profitability of integrated PV-ESS is verified in several case studies but their NPV is lower than one obtained by the same PV plant. In this way, consumers opt to install only PV plant because is a profitable project and at the same time can support the contrast to climate change.
Their profitability is increased when the share of self-consumption reaches higher values and the economic advantages of ESS depends by several conditions. In fact, using only the subsidized fiscal rate equal to 50% (instead of 36), the integrated system is not interesting from an economic point of view. A BEP analysis defines the exact value of increase of the share of self-consumption following the adoption of ESS to make the integrated PV-ESS system more convenient than PV one. Also, the application of new subsidies, e.g., funds non-repayable given to consumers in function of investment costs incurred, that can be proposed in one initial rate or in five constant rates can support the development of the sector, but this political choice should be justified also from a social perspective. At the same time, a reduction of investment costs and an adequate value of ESS size can increase the profitability of integrated PV-battery systems.
7. Conclusions
PV power source is a strategic player in the global electricity market. The current electricity transition is driven by increases in installed capacity of solar PV (+99 GW in 2017 with an increase of 32.7% from 2016). This work confirms that the profitability of PV plants or PV-battery systems depends strictly by the share of self-consumption.
A well-known methodology (DCF) is applied and the profitability of PV plants is verified in several scenarios. In fact, BEP analysis defines that for a 3-kW plant NPV is equal to 0 when the share of self-consumption varies from 8% to 18% in function of levels of insolation. Currently, several works in the literature use a baseline scenario in which this value is assumed equal to 30%. NPV varies from 263 to 750 € per kW installed and alternative scenarios give solidity to results obtained (NPV can be also equal to 1103 € per kW installed). These results show that the PV systems are profitable also in a market without direct subsidies, as FIT but using a subsidized fiscal deduction equal to 50% (instead of 36%).
The following step of the work is to evaluate the economic result following the application of lead-acid batteries. An integrated PV battery system is profitable in some scenarios, but its profitability is almost always lower than one of PV plant. In fact, NPV(PV+ESS) is greater than NPV(PV) only in two scenarios (in which subsidies are provided). Regarding the variables of ESS there is an increase of NPV, when the plant is installed in a territory with high levels of insolation, with a greater lifetime of batteries and with an adequate capacity of ESS.
The unprofitable result that confirms the literature review not depends only by high costs of investment, but also by uncertainty regarding the increase of energy self-consumption. For this motive, a BEP analysis tries to support this limit. This value must be at least equal to 39%, 43%, 48% and 52% with an ESS of 0.5, 1.0, 1.5 and 2.0 kWh per installed kW of PV power, respectively. In the last case, considering a baseline value in which wself,c is equal to 40% a difference of 12% is detected. Alternative scenarios confirm this trend and the results more convenient are obtained when the subsidies are applied. The minimum values (∆wself,c) obtained are equal to 28%, 31%, 34% and 37%, with an ESS of 0.5, 1.0, 1.5 and 2.0 kWh per installed kW of PV power, respectively.
PV plants is always profitable in scenarios analyzed in this work, while when is applied an ESS, only 40% of scenarios have a positive NPV. The comparison between two typologies of investment shows that only in 2 of 336 case studies examined (0.006%), integrated PV-ESS project is more profitable than PV system.
Author Contributions
Conceptualization, M.G., F.C.; Methodology, I.D.; Validation, M.G.; Formal Analysis, V.S.; Investigation, V.S.; Resources, I.D.; Data Curation, F.C.; Writing-Original Draft Preparation, I.D.; Writing, Review and Editing, F.C., I.D., M.G.; Visualization, F.C.; Supervision, M.G., F.C.; Project Administration, I.D.
Funding
This research received no external funding.
Conflicts of Interest
The authors declare no conflict of interest.
Abbreviations
| % | percentage |
| Acell | active surface |
| B | battery storage capacity |
| BEP | break-even point |
| bos | balance of system |
| Cae | administrative and electrical connection cost |
| Cb,u | specific battery cost (bos) |
| Cb-e,u | specific battery cost (energy) |
| Cb-p,u | specific battery cost (power) |
| Ceng | engineering cost |
| Ci,u | specific inverter cost |
| Cinv | total investment cost |
| Cinv,ESS | total investment cost of ESS |
| Cinv,unit | specific investment cost |
| total investment cost of ESS (high optimistic scenario) | |
| total investment cost of ESS (low optimistic scenario) | |
| specific investment cost (high optimistic scenario) | |
| specific investment cost (low optimistic scenario) | |
| Clcs | loan capital share cost |
| Clis | loan interest share cost |
| Cm,u | specific maintenance cost |
| Crb | replacement battery cost |
| DCF | discounted cash flow |
| DCI | discounted cash inflow |
| DCO | discounted cash outflow |
| dEf | decreased efficiency of a system |
| EOut | energy output of the system |
| ESS | energy storage system |
| FIT | Feed-in Tariff |
| GHG | greenhouse gas |
| GW | gigawatt |
| inf | rate of inflation |
| infel | rate of energy inflation |
| kf | optimum angle of tilt |
| LCOE | levelized cost of electricity |
| N | lifetime of a PV system |
| NB | lifetime of an ESS |
| Ndebt | period of loan |
| NTaxD | period of tax deduction |
| NPV | net present value |
| NPV(PV) | NPV of PV system |
| NPV(ESS) | NPV of storage system |
| NPV(PV+ESS) | NPV of integrated PV battery system |
| opt | optimistic |
| ƞbos | balance of system efficiency |
| ƞf | number of PV modules to be installed |
| ƞm | module efficiency |
| pc | electricity purchase price (baseline) |
| electricity purchase price (optimistic scenario) | |
| electricity purchase price (pessimistic scenario) | |
| ps | electricity sales price (baseline) |
| electricity sales price (optimistic scenario) | |
| electricity sales price (pessimistic scenario) | |
| PCass | percentage of assurance cost |
| PCi | percentage of inverter cost |
| PCm | percentage of maintenance cost |
| PCtax | percentage of taxes cost |
| Pf | nominal power of a PV module |
| pes | pessimistic |
| PV | photovoltaic |
| r | opportunity cost of capital |
| rd | interest rate on a loan (PV) |
| rd-ESS | interest rate on a loan (ESS) |
| scenario with subsidies concentrated in one rate | |
| scenario with subsidies distributed in five rates | |
| RES | renewable energy source |
| S | size of a PV system |
| SPel | sale of energy |
| t | single period |
| TaxDu-br | specific tax deduction (baseline rate) |
| TaxDu-sr | specific tax deduction (subsidized rate) |
| tr | average annual insolation |
| wself,c | percentage of energy self-consumption |
| wsold | percentage of the produced energy sold to the grid |
| ∆wself,c | increase of self-consumption |
| Vat | value added tax |
References
- Sandor, D.; Fulton, S.; Engel-Cox, J.; Peck, C.; Peterson, S. System dynamics of polysilicon for solar photovoltaics: A framework for investigating the energy security of renewable energy supply chains. Sustainability 2018, 10, 160. [Google Scholar] [CrossRef]
- Zhang, Y.; Zhao, X.; Zuo, Y.; Ren, L.; Wang, L. The development of the renewable energy power industry under feed-in tariff and renewable portfolio standard: A case study of China’s photovoltaic power industry. Sustainability 2017, 9, 532. [Google Scholar] [CrossRef]
- REN21. Renewables 2018 Global Status Report. 2018. Available online: http://www.Ren21.Net/gsr-2017/ (accessed on 28 June 2018).
- Peng, J.; Lu, L.; Yang, H. Review on life cycle assessment of energy payback and greenhouse gas emission of solar photovoltaic systems. Renew. Sustain. Energy Rev. 2013, 19, 255–274. [Google Scholar] [CrossRef]
- Mauleón, I. Photovoltaic investment roadmaps and sustainable development. J. Clean. Prod. 2017, 167, 1112–1121. [Google Scholar] [CrossRef]
- Bakhtyar, B.; Fudholi, A.; Hassan, K.; Azam, M.; Lim, C.H.; Chan, N.W.; Sopian, K. Review of co2 price in europe using feed-in tariff rates. Renew. Sustain. Energy Rev. 2017, 69, 685–691. [Google Scholar] [CrossRef]
- Yu, H.J.J. A prospective economic assessment of residential pv self-consumption with batteries and its systemic effects: The french case in 2030. Energy Policy 2018, 113, 673–687. [Google Scholar] [CrossRef]
- European Commision. Pv Status Report 2016. 2016. Available online: http://publications.Jrc.Ec.Europa.Eu/repository/bitstream/jrc103426/ldna28159enn.Pdf (accessed on 8 August 2018).
- Karneyeva, Y.; Wüstenhagen, R. Solar feed-in tariffs in a post-grid parity world: The role of risk, investor diversity and business models. Energy Policy 2017, 106, 445–456. [Google Scholar] [CrossRef]
- McKenna, E.; Pless, J.; Darby, S.J. Solar photovoltaic self-consumption in the uk residential sector: New estimates from a smart grid demonstration project. Energy Policy 2018, 118, 482–491. [Google Scholar] [CrossRef]
- Lavrijssen, S.; Carrillo Parra, A. Radical prosumer innovations in the electricity sector and the impact on prosumer regulation. Sustainability 2017, 9, 1207. [Google Scholar] [CrossRef]
- Lorenzi, B.; Acciarri, M.; Narducci, D. Conditions for beneficial coupling of thermoelectric and photovoltaic devices. J. Mater. Res. 2015, 30, 2663–2669. [Google Scholar] [CrossRef]
- Kyriakopoulos, G.L.; Arabatzis, G. Electrical energy storage systems in electricity generation: Energy policies, innovative technologies, and regulatory regimes. Renew. Sustain. Energy Rev. 2016, 56, 1044–1067. [Google Scholar] [CrossRef]
- De Oliveira e Silva, G.; Hendrick, P. Lead–acid batteries coupled with photovoltaics for increased electricity self-sufficiency in households. Appl. Energy 2016, 178, 856–867. [Google Scholar] [CrossRef]
- Diouf, B.; Pode, R. Potential of lithium-ion batteries in renewable energy. Renew. Energy 2015, 76, 375–380. [Google Scholar] [CrossRef]
- Battke, B.; Schmidt, T.S.; Grosspietsch, D.; Hoffmann, V.H. A review and probabilistic model of lifecycle costs of stationary batteries in multiple applications. Renew. Sustain. Energy Rev. 2013, 25, 240–250. [Google Scholar] [CrossRef]
- Maleki, A.; Rosen, M.A.; Pourfayaz, F. Optimal operation of a grid-connected hybrid renewable energy system for residential applications. Sustainability 2017, 9, 1314. [Google Scholar] [CrossRef]
- Katre, A.; Tozzi, A. Assessing the sustainability of decentralized renewable energy systems: A comprehensive framework with analytical methods. Sustainability 2018, 10, 1058. [Google Scholar] [CrossRef]
- Sommerfeld, J.; Buys, L.; Vine, D. Residential consumers’ experiences in the adoption and use of solar pv. Energy Policy 2017, 105, 10–16. [Google Scholar] [CrossRef]
- Vieira, F.M.; Moura, P.S.; de Almeida, A.T. Energy storage system for self-consumption of photovoltaic energy in residential zero energy buildings. Renew. Energy 2017, 103, 308–320. [Google Scholar] [CrossRef]
- Wang, Z.; Gu, C.; Li, F. Flexible operation of shared energy storage at households to facilitate pv penetration. Renew. Energy 2018, 116, 438–446. [Google Scholar] [CrossRef]
- Schopfer, S.; Tiefenbeck, V.; Staake, T. Economic assessment of photovoltaic battery systems based on household load profiles. Appl. Energy 2018, 223, 229–248. [Google Scholar] [CrossRef]
- Truong, C.N.; Naumann, M.; Karl, R.C.; Müller, M.; Jossen, A.; Hesse, H.C. Economics of residential photovoltaic battery systems in germany: The case of tesla’s powerwall. Batteries 2016, 2, 14. [Google Scholar] [CrossRef]
- Kim, H.; Jung, T.Y. Independent solar photovoltaic with energy storage systems (ess) for rural electrification in myanmar. Renew. Sustain. Energy Rev. 2018, 82, 1187–1194. [Google Scholar] [CrossRef]
- Barelli, L.; Bidini, G.; Bonucci, F.; Castellini, L.; Castellini, S.; Ottaviano, A.; Pelosi, D.; Zuccari, A. Dynamic analysis of a hybrid energy storage system (h-ess) coupled to a photovoltaic (pv) plant. Energies 2018, 11, 396. [Google Scholar] [CrossRef]
- Kang, B.; Jang, K.; Park, S.; Choi, M.-i.; Park, S. Energy storage system control algorithm by operating target power to improve energy sustainability of smart home. Sustainability 2018, 10, 236. [Google Scholar] [CrossRef]
- Ondeck, A.D.; Edgar, T.F.; Baldea, M. Impact of rooftop photovoltaics and centralized energy storage on the design and operation of a residential chp system. Appl. Energy 2018, 222, 280–299. [Google Scholar] [CrossRef]
- Waqar, A.; Wang, S.; Dawoud, S.M.; Tao, T.; Wang, Y. Optimal capacity expansion-planning of distributed generation in microgrids considering uncertainties. In Proceedings of the IEEE 5th International Conference on Electric Utility Deregulation and Restructuring and Power Technologies, Changsha, China, 26–29 November 2015; pp. 437–442. [Google Scholar]
- Wang, H.; Huang, J. Joint investment and operation of microgrid. IEEE Trans. Smart Grid 2017, 8, 833–845. [Google Scholar] [CrossRef]
- Wang, H.; Huang, J. Incentivizing energy trading for interconnected microgrids. IEEE Trans. Smart Grid 2018, 9, 2647–2657. [Google Scholar] [CrossRef]
- Laurischkat, K.; Jandt, D. Techno-economic analysis of sustainable mobility and energy solutions consisting of electric vehicles, photovoltaic systems and battery storages. J. Clean. Prod. 2018, 179, 642–661. [Google Scholar] [CrossRef]
- Mundada, A.S.; Shah, K.K.; Pearce, J.M. Levelized cost of electricity for solar photovoltaic, battery and cogen hybrid systems. Renew. Sustain. Energy Rev. 2016, 57, 692–703. [Google Scholar] [CrossRef]
- Camilo, F.M.; Castro, R.; Almeida, M.E.; Pires, V.F. Economic assessment of residential pv systems with self-consumption and storage in portugal. Sol. Energy 2017, 150, 353–362. [Google Scholar] [CrossRef]
- Luthander, R.; Widén, J.; Nilsson, D.; Palm, J. Photovoltaic self-consumption in buildings: A review. Appl. Energy 2015, 142, 80–94. [Google Scholar] [CrossRef] [Green Version]
- Nyholm, E.; Goop, J.; Odenberger, M.; Johnsson, F. Solar photovoltaic-battery systems in swedish households—Self-consumption and self-sufficiency. Appl. Energy 2016, 183, 148–159. [Google Scholar] [CrossRef]
- Kolasa, P.; Janowski, M. Study of possibilities to store energy virtually in a grid (vess) with the use of smart metering. Renew. Sustain. Energy Rev. 2017, 79, 1513–1517. [Google Scholar] [CrossRef]
- Agnew, S.; Dargusch, P. Consumer preferences for household-level battery energy storage. Renew. Sustain. Energy Rev. 2017, 75, 609–617. [Google Scholar] [CrossRef]
- Peters, J.F.; Baumann, M.; Zimmermann, B.; Braun, J.; Weil, M. The environmental impact of li-ion batteries and the role of key parameters—A review. Renew. Sustain. Energy Rev. 2017, 67, 491–506. [Google Scholar] [CrossRef]
- Lai, C.S.; McCulloch, M.D. Levelized cost of electricity for solar photovoltaic and electrical energy storage. Appl. Energy 2017, 190, 191–203. [Google Scholar] [CrossRef]
- Cucchiella, F.; D’Adamo, I.; Gastaldi, M. Photovoltaic energy systems with battery storage for residential areas: An economic analysis. J. Clean. Prod. 2016, 131, 460–474. [Google Scholar] [CrossRef]
- O’Shaughnessy, E.; Cutler, D.; Ardani, K.; Margolis, R. Solar plus: A review of the end-user economics of solar pv integration with storage and load control in residential buildings. Appl. Energy 2018, 228, 2165–2175. [Google Scholar] [CrossRef]
- O’Shaughnessy, E.; Cutler, D.; Ardani, K.; Margolis, R. Solar plus: Optimization of distributed solar pv through battery storage and dispatchable load in residential buildings. Appl. Energy 2018, 213, 11–21. [Google Scholar] [CrossRef]
- Bendato, I.; Bonfiglio, A.; Brignone, M.; Delfino, F.; Pampararo, F.; Procopio, R.; Rossi, M. Design criteria for the optimal sizing of integrated photovoltaic-storage systems. Energy 2018, 149, 505–515. [Google Scholar] [CrossRef]
- Tervo, E.; Agbim, K.; DeAngelis, F.; Hernandez, J.; Kim, H.K.; Odukomaiya, A. An economic analysis of residential photovoltaic systems with lithium ion battery storage in the united states. Renew. Sustain. Energy Rev. 2018, 94, 1057–1066. [Google Scholar] [CrossRef]
- Shaw-Williams, D.; Susilawati, C.; Walker, G. Value of residential investment in photovoltaics and batteries in networks: A techno-economic analysis. Energies 2018, 11, 1–25. [Google Scholar] [CrossRef]
- Uddin, K.; Gough, R.; Radcliffe, J.; Marco, J.; Jennings, P. Techno-economic analysis of the viability of residential photovoltaic systems using lithium-ion batteries for energy storage in the United Kingdom. Appl. Energy 2017, 206, 12–21. [Google Scholar] [CrossRef]
- Bortolini, M.; Gamberi, M.; Graziani, A. Technical and economic design of photovoltaic and battery energy storage system. Energy Convers. Manag. 2014, 86, 81–92. [Google Scholar] [CrossRef]
- Cerino Abdin, G.; Noussan, M. Electricity storage compared to net metering in residential pv applications. J. Clean. Prod. 2018, 176, 175–186. [Google Scholar] [CrossRef]
- van der Stelt, S.; AlSkaif, T.; van Sark, W. Techno-economic analysis of household and community energy storage for residential prosumers with smart appliances. Appl. Energy 2018, 209, 266–276. [Google Scholar] [CrossRef]
- Zsiborács, H.; Baranyai, N.H.; Vincze, A.; Háber, I.; Pintér, G. Economic and technical aspects of flexible storage photovoltaic systems in europe. Energies 2018, 11, 1445. [Google Scholar] [CrossRef]
- Nicholls, A.; Sharma, R.; Saha, T.K. Financial and environmental analysis of rooftop photovoltaic installations with battery storage in australia. Appl. Energy 2015, 159, 252–264. [Google Scholar] [CrossRef]
- Khalilpour, K.R.; Vassallo, A. Technoeconomic parametric analysis of pv-battery systems. Renew. Energy 2016, 97, 757–768. [Google Scholar] [CrossRef]
- Kaschub, T.; Jochem, P.; Fichtner, W. Solar energy storage in german households: Profitability, load changes and flexibility. Energy Policy 2016, 98, 520–532. [Google Scholar] [CrossRef]
- Akter, M.N.; Mahmud, M.A.; Oo, A.M.T. Comprehensive economic evaluations of a residential building with solar photovoltaic and battery energy storage systems: An australian case study. Energy Build. 2017, 138, 332–346. [Google Scholar] [CrossRef]
- Bayod-Rújula, A.A.; Burgio, A.; Leonowicz, Z.; Menniti, D.; Pinnarelli, A.; Sorrentino, N. Recent developments of photovoltaics integrated with battery storage systems and related feed-in tariff policies: A review. Int. J. Photoenergy 2017, 2017, 12. [Google Scholar] [CrossRef]
- Brusco, G.; Burgio, A.; Menniti, D.; Pinnarelli, A.; Sorrentino, N. The economic viability of a feed-in tariff scheme that solely rewards self-consumption to promote the use of integrated photovoltaic battery systems. Appl. Energy 2016, 183, 1075–1085. [Google Scholar] [CrossRef]
- Cucchiella, F.; D’Adamo, I.; Gastaldi, M. The economic feasibility of residential energy storage combined with pv panels: The role of subsidies in italy. Energies 2017, 10, 1434. [Google Scholar] [CrossRef]
- Wellmer, F.-W.; Scholz, R.W. What is the optimal and sustainable lifetime of a mine? Sustainability 2018, 10, 480. [Google Scholar] [CrossRef]
- Choi, Y.; Song, J. Sustainable development of abandoned mine areas using renewable energy systems: A case study of the photovoltaic potential assessment at the tailings dam of abandoned sangdong mine, korea. Sustainability 2016, 8, 1320. [Google Scholar] [CrossRef]
- Cucchiella, F.; D’Adamo, I.; Gastaldi, M. Economic analysis of a photovoltaic system: A resource for residential households. Energies 2017, 10, 814. [Google Scholar] [CrossRef]
- Rodrigues, S.; Chen, X.; Morgado-Dias, F. Economic analysis of photovoltaic systems for the residential market under China’s new regulation. Energy Policy 2017, 101, 467–472. [Google Scholar] [CrossRef]
- Rodrigues, S.; Faria, F.; Ivaki, A.; Cafôfo, N.; Chen, X.; Mata-Lima, H.; Morgado-Dias, F. Tesla powerwall: Analysis of its use in portugal and united states. Int. J. Power Energy Syst. 2016, 36, 37–43. [Google Scholar] [CrossRef]
- Beck, T.; Kondziella, H.; Huard, G.; Bruckner, T. Optimal operation, configuration and sizing of generation and storage technologies for residential heat pump systems in the spotlight of self-consumption of photovoltaic electricity. Appl. Energy 2017, 188, 604–619. [Google Scholar] [CrossRef]
- National Renewable Energy Laboratory. Best Research-Cell Efficiences. 2017; pp. 28–40. Available online: https://www.Nrel.Gov/pv/ (accessed on 8 August 2018).
- Wang, H.; Huang, J. Cooperative planning of renewable generations for interconnected microgrids. IEEE Trans. Smart Grid 2016, 7, 2486–2496. [Google Scholar] [CrossRef]
- Hoppmann, J.; Volland, J.; Schmidt, T.S.; Hoffmann, V.H. The economic viability of battery storage for residential solar photovoltaic systems—A review and a simulation model. Renew. Sustain. Energy Rev. 2014, 39, 1101–1118. [Google Scholar] [CrossRef]
- Khatib, T.; Ibrahim, I.A.; Mohamed, A. A review on sizing methodologies of photovoltaic array and storage battery in a standalone photovoltaic system. Energy Convers. Manag. 2016, 120, 430–448. [Google Scholar] [CrossRef]
- Ji, H.; Niu, D.; Wu, M.; Yao, D. Comprehensive benefit evaluation of the wind-pv-es and transmission hybrid power system consideration of system functionality and proportionality. Sustainability 2017, 9, 65. [Google Scholar] [CrossRef]
- Emmanuel, M.; Rayudu, R. Evolution of dispatchable photovoltaic system integration with the electric power network for smart grid applications: A review. Renew. Sustain. Energy Rev. 2017, 67, 207–224. [Google Scholar] [CrossRef]
- Kazhamiaka, F.; Jochem, P.; Keshav, S.; Rosenberg, C. On the influence of jurisdiction on the profitability of residential photovoltaic-storage systems: A multi-national case study. Energy Policy 2017, 109, 428–440. [Google Scholar] [CrossRef]
- Guerrero-Liquet, G.C.; Sánchez-Lozano, J.M.; García-Cascales, M.S.; Lamata, M.T.; Verdegay, J.L. Decision-making for risk management in sustainable renewable energy facilities: A case study in the dominican republic. Sustainability 2016, 8, 455. [Google Scholar] [CrossRef]
Figure 1.
Decision-making process—adapted from [57].
Figure 1.
Decision-making process—adapted from [57].

Figure 2.
Net Present Value (NPV) (Photovoltaic (PV)) and break-even point (BEP) for 3-kW plant in baseline scenario. NPV in € and BEP proposed in %.
Figure 2.
Net Present Value (NPV) (Photovoltaic (PV)) and break-even point (BEP) for 3-kW plant in baseline scenario. NPV in € and BEP proposed in %.

Figure 3.
NPV (energy storage system (ESS)) in baseline scenario. NPV in €.

Figure 4.
BEP for integrated PV-ESS in baseline scenario. BEP is in %.

Figure 5.
Sensitivity analysis of ESS (costs). NPV(ESS) is in €. S(X) = scenario . S(Y) = scenario .
Figure 5.
Sensitivity analysis of ESS (costs). NPV(ESS) is in €. S(X) = scenario . S(Y) = scenario .

Figure 6.
Sensitivity analysis (scenario ). BEP for integrated PV-ESS. BEP is in %.

Figure 7.
Sensitivity analysis (scenario ). BEP for integrated PV-ESS—BEP is in %.
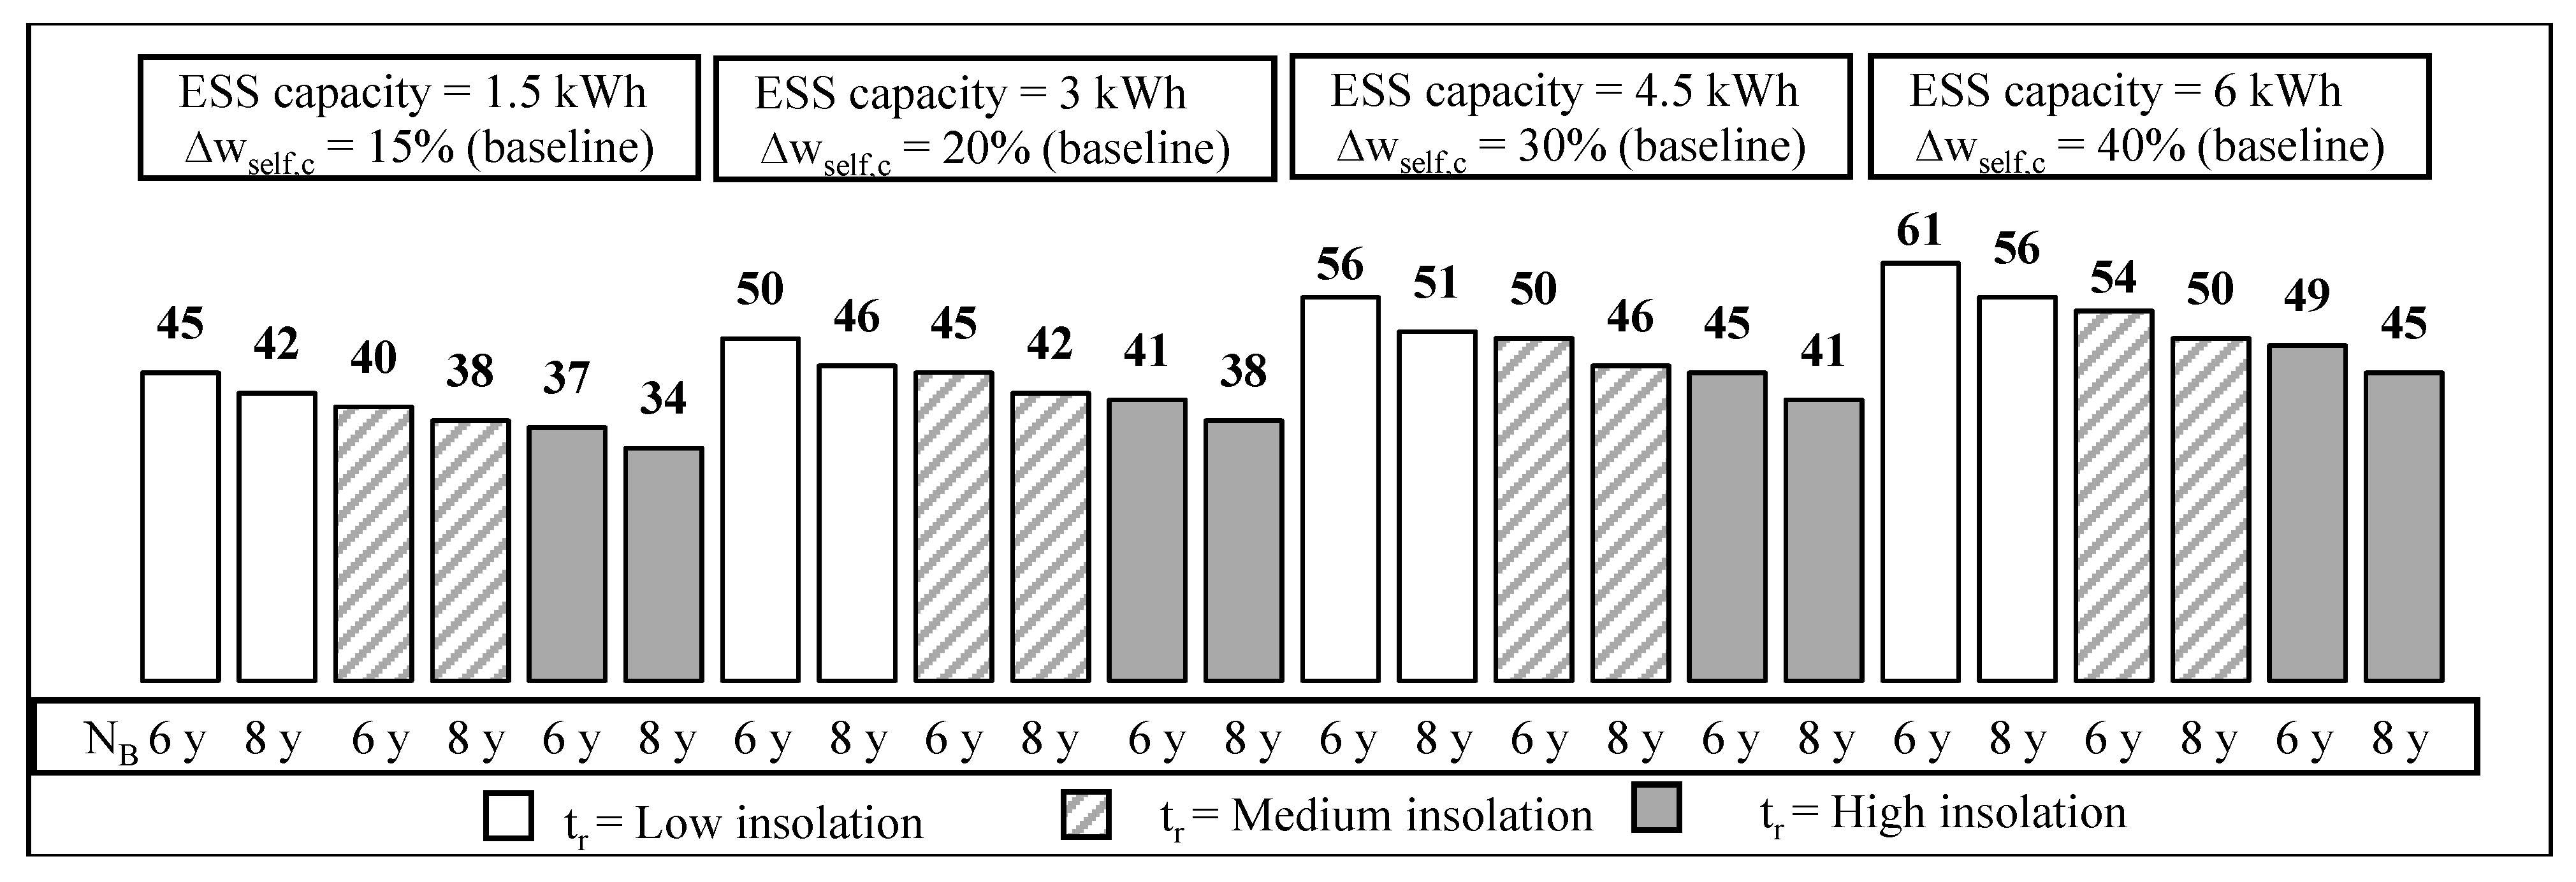
Figure 8.
Sensitivity analysis of ESS (subsidies). NPV(ESS) is in €. S(α) = scenario . S(β) = scenario .
Figure 8.
Sensitivity analysis of ESS (subsidies). NPV(ESS) is in €. S(α) = scenario . S(β) = scenario .


Figure 9.
Sensitivity analysis (scenario ). BEP for integrated PV-ESS. BEP is in %.

Figure 10.
Sensitivity analysis (scenario ). BEP for integrated PV-ESS. BEP is in %.

Figure 11.
Sensitivity analysis of PV system. NPV(PV) is in €. S(I) = scenario . S(II) = scenario . S(III) = scenario . S(IV) = scenario . S(V) = scenario . S(VI) = scenario . S(VII) = scenario .
Figure 11.
Sensitivity analysis of PV system. NPV(PV) is in €. S(I) = scenario . S(II) = scenario . S(III) = scenario . S(IV) = scenario . S(V) = scenario . S(VI) = scenario . S(VII) = scenario .
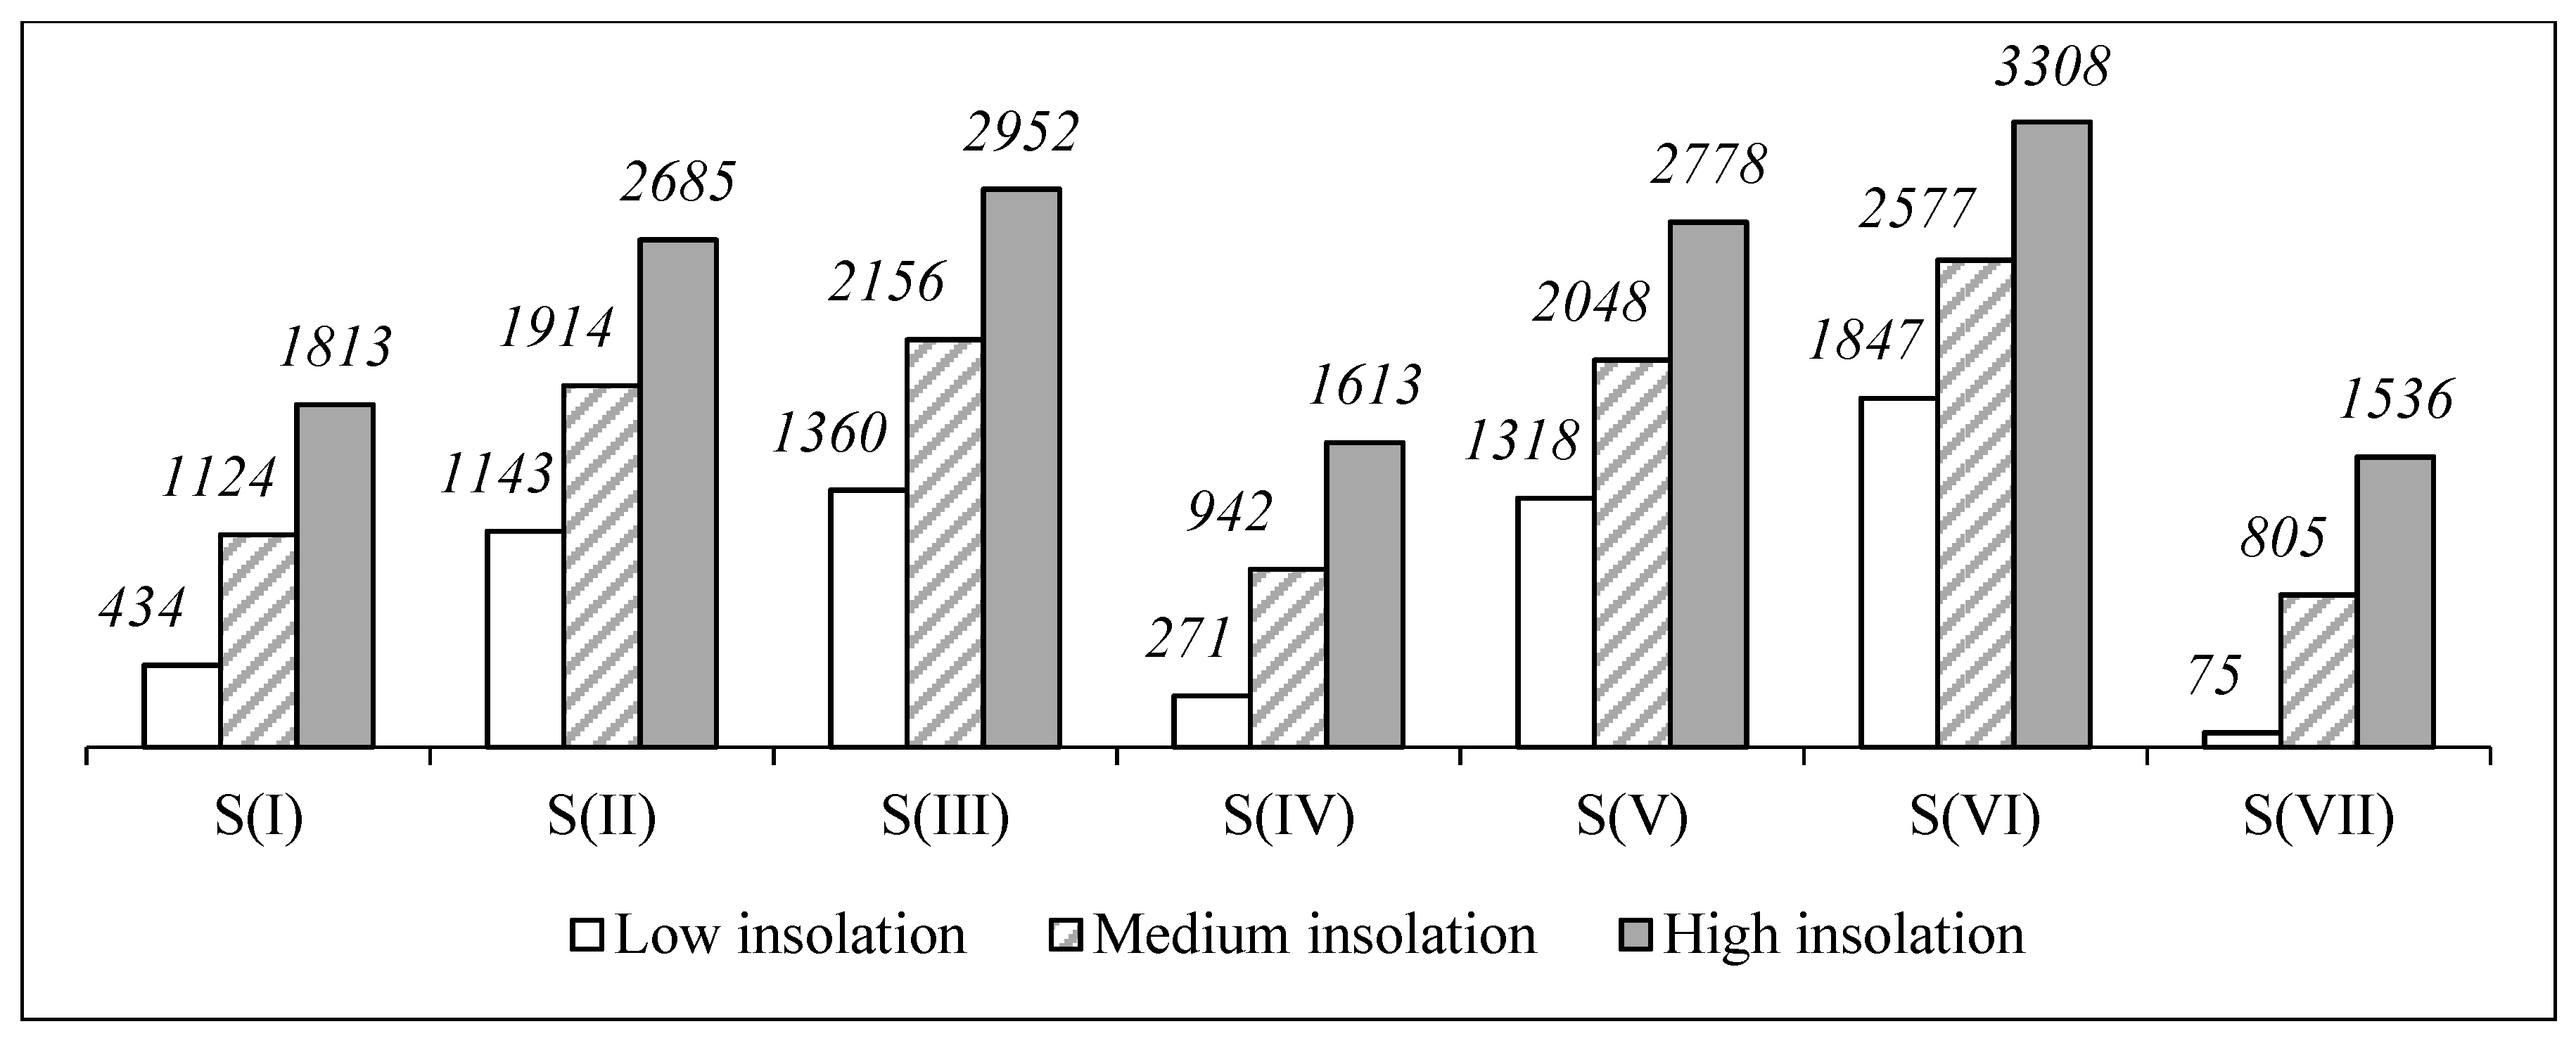
Figure 12.
Sensitivity analysis of PV system. NPV(ESS) is in €. S(I) = scenario ; S(II) = scenario ; S(III) = scenario ; S(IV) = scenario ; S(V) = scenario ; S(VI) = scenario ; S(VII) = scenario
Figure 12.
Sensitivity analysis of PV system. NPV(ESS) is in €. S(I) = scenario ; S(II) = scenario ; S(III) = scenario ; S(IV) = scenario ; S(V) = scenario ; S(VI) = scenario ; S(VII) = scenario

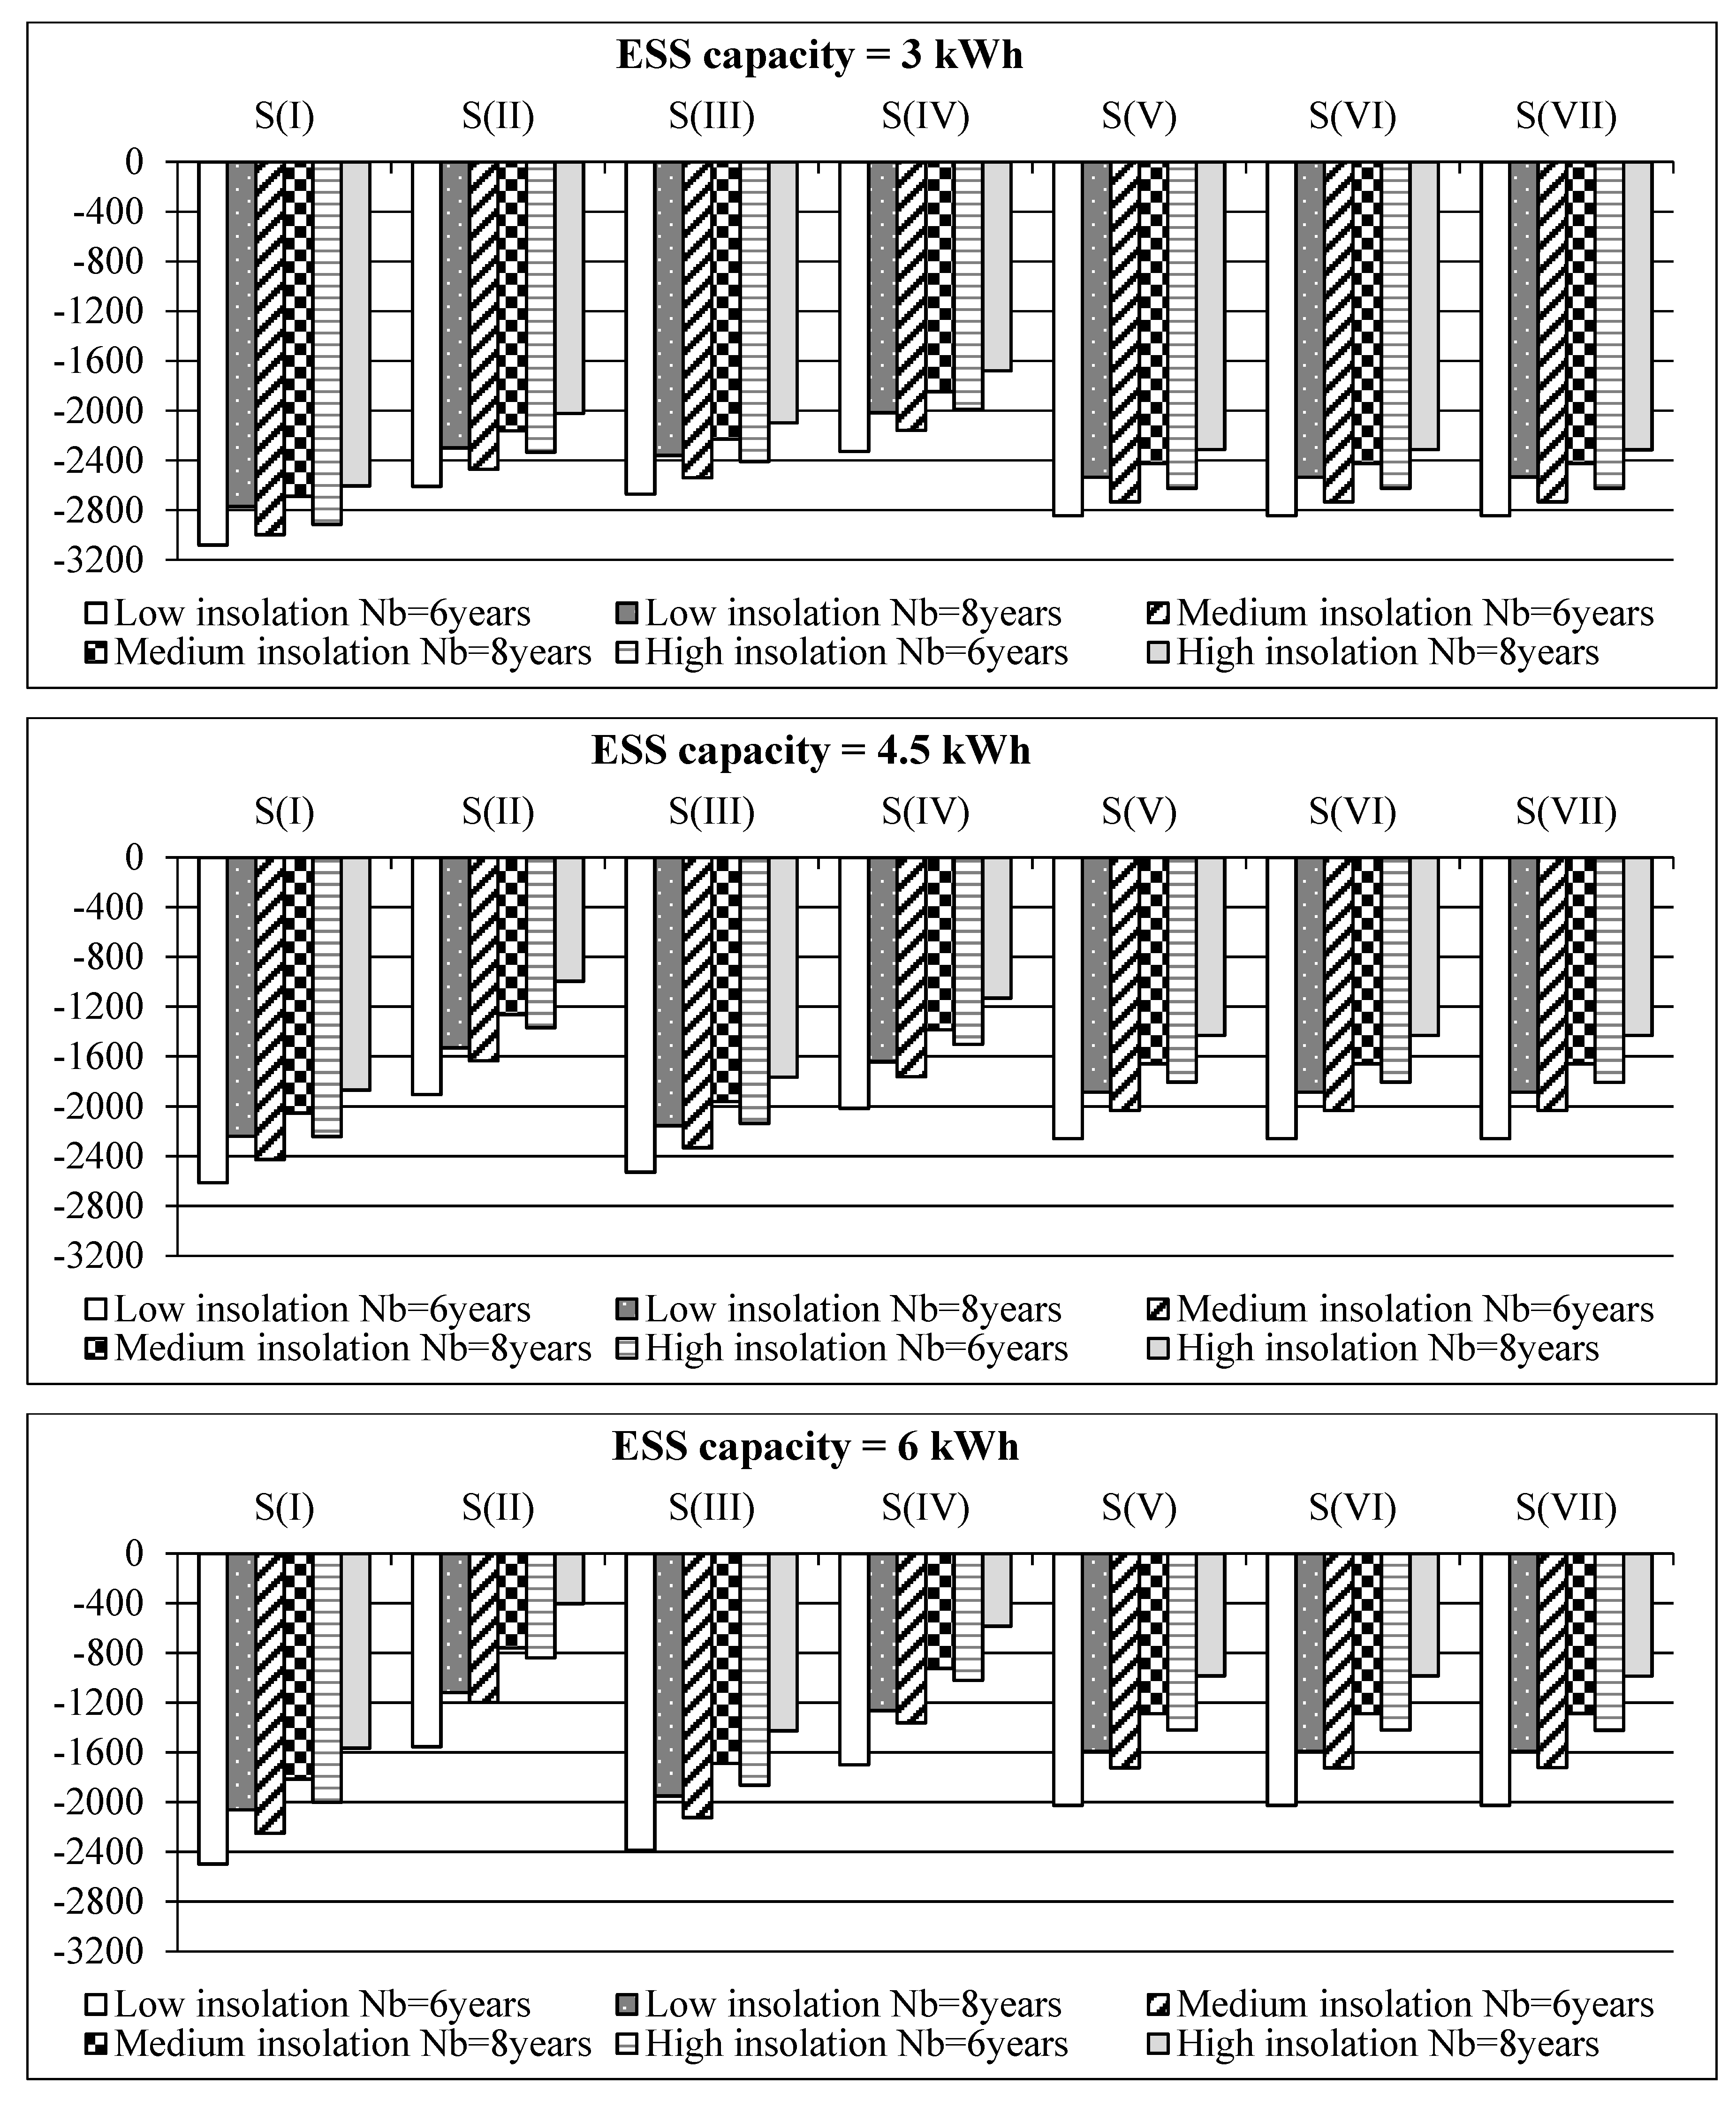
Figure 13.
Sensitivity analysis (scenario ). BEP for integrated PV-ESS. BEP is in %.

Figure 14.
Sensitivity analysis (scenario ). BEP for integrated PV-ESS. BEP is in %.
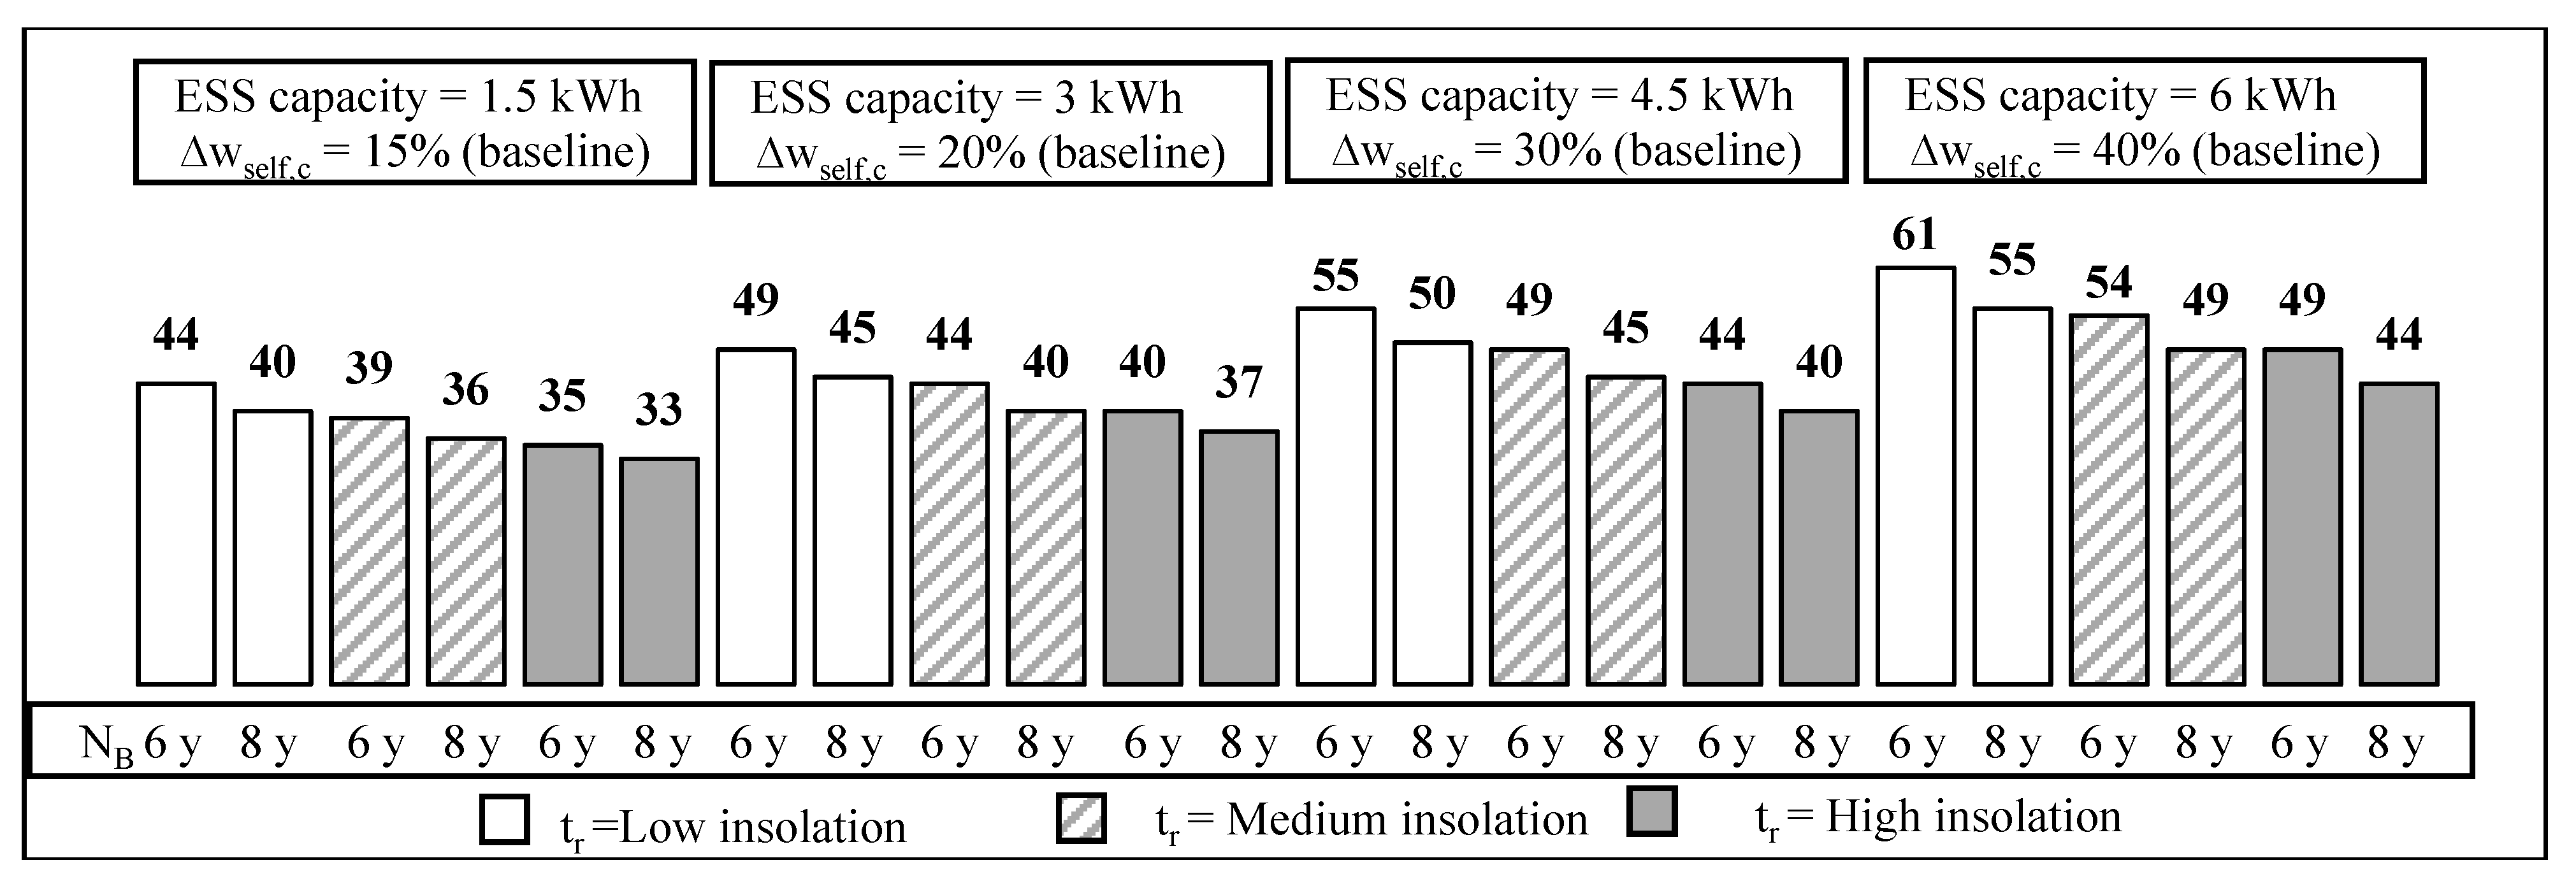
Figure 15.
Sensitivity analysis (scenario ). BEP for integrated PV-ESS. BEP is in %.
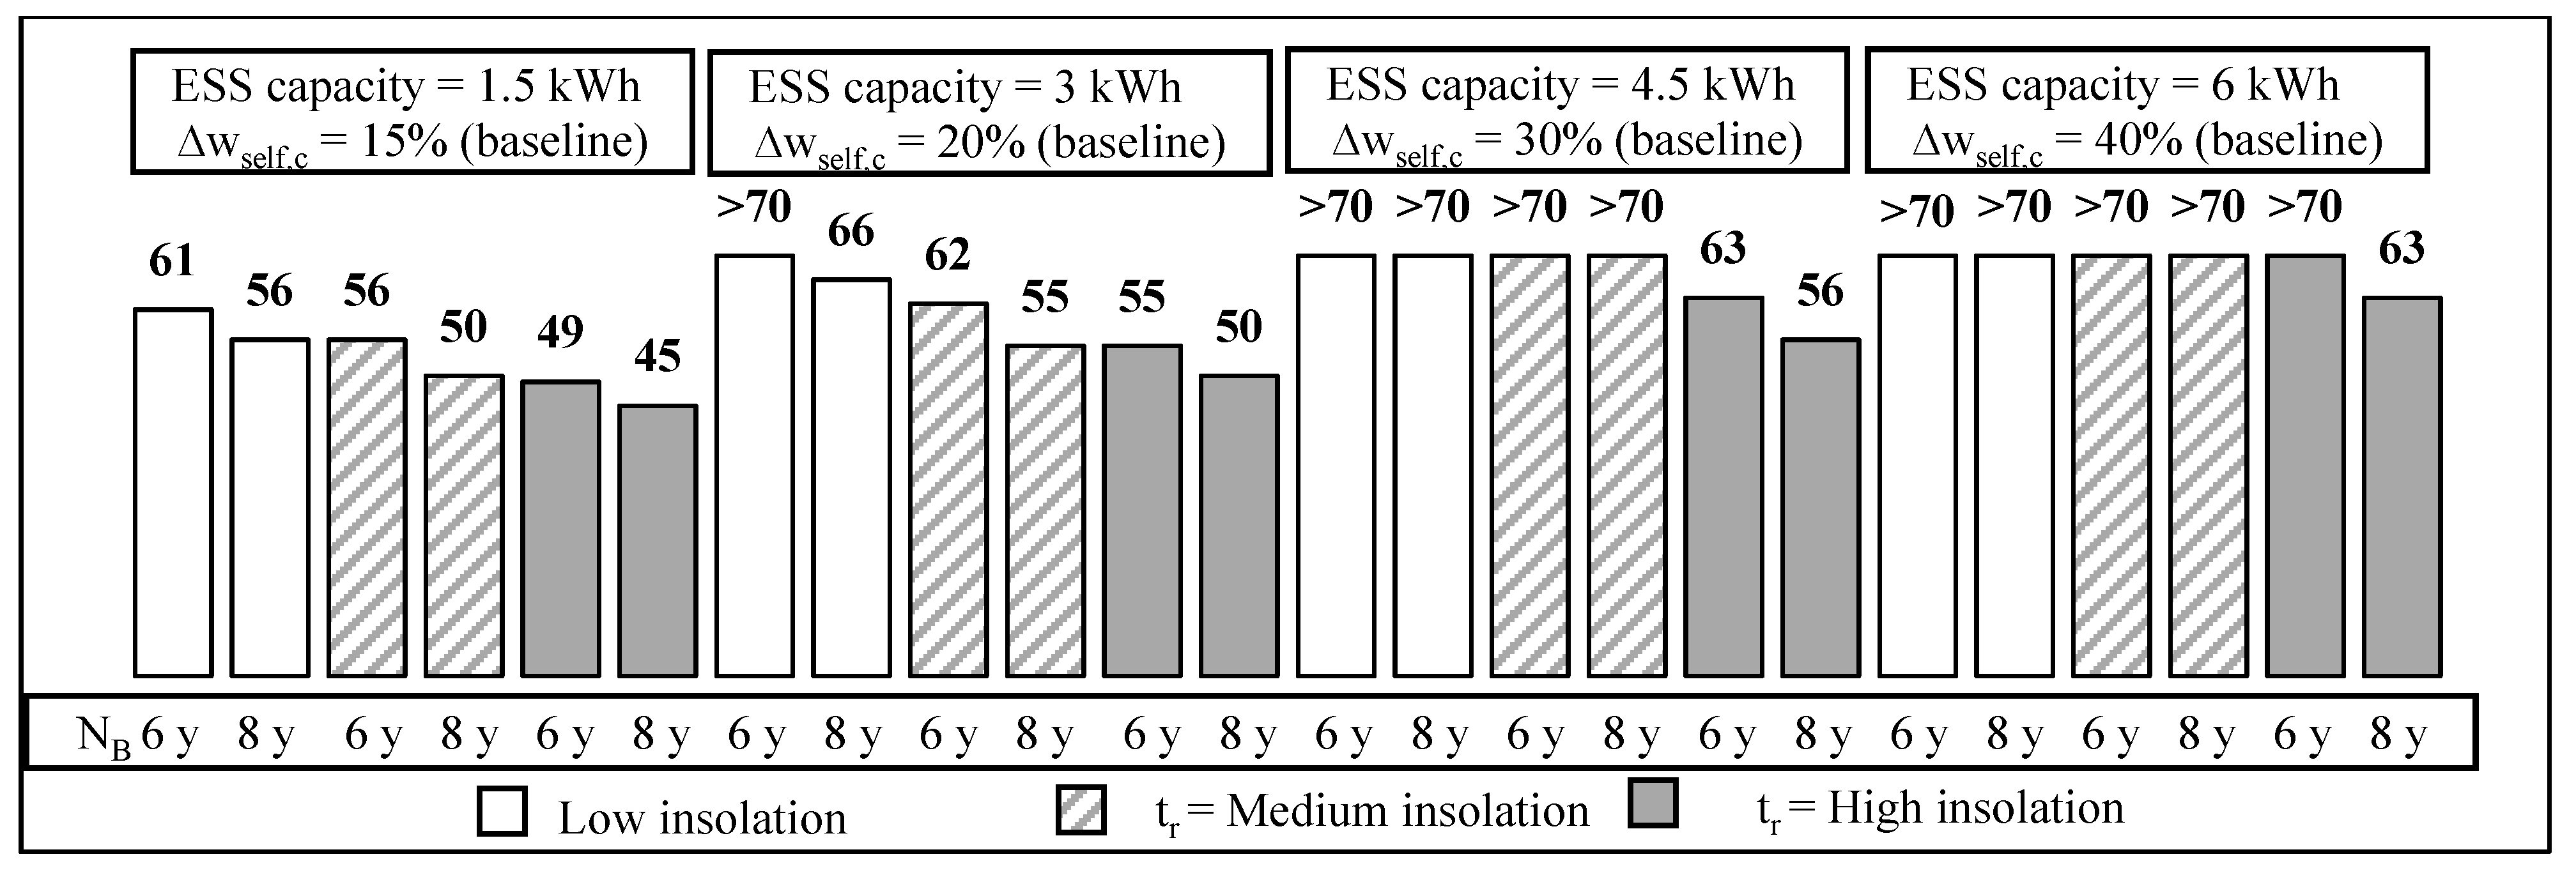
Figure 16.
Sensitivity analysis (scenario ). BEP for integrated PV-ESS. BEP is in %.

Figure 17.
Sensitivity analysis (scenarios , and ). BEP for integrated PV-ESS. BEP is in %.


Table 1.
Literature review.
| Index | Min Value | Max Value | Reference |
|---|---|---|---|
| LCOE | 0.33 €/kWh | 0.79 €/kWh | [16] |
| 0.154 $/kWh | 0.242 $/kWh | [39] | |
| 0.15 €/kWh | 0.23 €/kWh | [47] | |
| 0.05 $/kWh | 0.36 $/kWh | [32] | |
| 0.149 €/kWh | 0.338 €/kWh | [49] | |
| 0.05 $/kWh | 0.48 $/kWh | [44] | |
| 0.08 €/kWh | 0.46 €/kWh | [33] | |
| NPV | −5640 € | 1780 € | [40] |
| −1573 € | 2931 € | [22] | |
| 290 $ | 910 $ | [43] | |
| −7334 € | −6429 € | [45] | |
| 150 €/kWh | 500 €/kWh | [53] | |
| −30,000 $ | 5000 $ | [54] | |
| 447 $ | 1650 $ | [52] | |
| −20,549 € | −2227 € | [48] | |
| −12,151 € | 2982 € | [33] | |
| −317 € | 5136 € | [57] |
| Variable | Value | Variable | Value |
|---|---|---|---|
| Acell | 7 m2/kWp | function of S | |
| B | 1.5–3–4.5–6 kWh | 16% | |
| Cae | 250 € | 19 cent €/kWh | |
| Cb-e,u | 155 €/kWh | 9.8–10.9 cent €/kWh | |
| Cb-p,u | 155 €/kW | 0.4% | |
| Cb,u | 70 €/kW | 15% | |
| Ceng | 165 € | 1% | |
| Ci,u | 170 €/kW | 43.5% | |
| Cinv,unit | 2000 €/kW | function of S | |
| Cm,u | 22 €/kW | r | 5% |
| dEf | 0.7% | rd | 3% |
| inf | 2% | rd-ESS | 4% |
| infel | 1.5% | S | 3 kW |
| kf | 1.13 | tr | 1300–1450–1600 kWh/(m2·year) |
| N | 20 years | TaxDu-sr | 50% |
| NB | 6–8 years | TaxDu-br | 36% |
| Ndebt | 15 years | Vat | 10% |
| Ndebt-ESS | 5 years | 0–100% (30% baseline) | |
| NTaxD | 10 years | 0–100% (70% baseline) | |
| 85% | 15–40% (baseline) |
Table 3.
NPV(PV+ESS) in baseline scenario. NPV is in €.
| tr = 1300 kWh/(m2·year) | tr = 1450 kWh/(m2·year) | tr = 1600 kWh/(m2·year) | ||||
|---|---|---|---|---|---|---|
| NB | 6 Years | 8 Years | 6 Years | 8 Years | 6 Years | 8 Years |
| ∆wself,c | ESS capacity = 1.5 kWh | |||||
| 10% | −1934 | −1688 | −1128 | −882 | −322 | −76 |
| 15% baseline | −1784 | −1538 | −960 | −714 | −137 | 109 |
| 20% | −1633 | −1387 | −792 | −546 | 48 | 294 |
| ∆wself,c | ESS capacity = 3 kWh | |||||
| 15% | −2207 | −1897 | −1383 | −1073 | −560 | −250 |
| 20% baseline | −2056 | −1746 | −1215 | −905 | −375 | −65 |
| 25% | −1552 | −1242 | −652 | −342 | 247 | 557 |
| ∆wself,c | ESS capacity = 4.5 kWh | |||||
| 25% | −1975 | −1602 | −1075 | −702 | −177 | 197 |
| 30% baseline | −1470 | −1097 | −512 | −139 | 445 | 818 |
| 35% | −1143 | −770 | −147 | 226 | 848 | 1221 |
| ∆wself,c | ESS capacity = 6 kWh | |||||
| 35% | −1566 | −1130 | −570 | −134 | 425 | 861 |
| 40% baseline | −1238 | −802 | −205 | 231 | 828 | 1264 |
| 45% | −911 | −475 | 161 | 597 | 1231 | 1667 |
| NPV(PV) | 788 | 1519 | 2249 | |||
NPV(PV+ESS) >0 is denoted in italic. NPV(PV+ESS) > NPV(PV) is underlined and denoted in italic.
Table 4.
Sensitivity analysis of ESS (costs). NPV(PV+ESS) is in €.
| tr = 1300 kWh/(m2·year) | tr = 1450 kWh/(m2·year) | tr = 1600 kWh/(m2·year) | ||||
|---|---|---|---|---|---|---|
| NB | 6 Years | 8 Years | 6 Years | NB | 6 Years | 8 Years |
| ESS capacity = 1.5 kWh (∆wself,c = 15%) | ||||||
| −1574 | −1353 | −750 | −529 | 73 | 294 | |
| −1365 | −1168 | −541 | −344 | 282 | 479 | |
| ESS capacity = 3 kWh (∆wself,c = 20%) | ||||||
| −1804 | −1525 | −963 | −684 | −123 | 156 | |
| −1552 | −1304 | −711 | −463 | 129 | 377 | |
| ESS capacity = 4.5 kWh (∆wself,c = 30%) | ||||||
| −1176 | −840 | −218 | 118 | 739 | 1075 | |
| −882 | −583 | 76 | 375 | 1033 | 1332 | |
| ESS capacity = 6 kWh (∆wself,c = 40%) | ||||||
| −901 | −509 | 132 | 524 | 1165 | 1557 | |
| −565 | −216 | 468 | 817 | 1501 | 1850 | |
| NPV(PV) | 788 | 1519 | 2249 | |||
NPV(PV+ESS) > 0 is denoted in italic. NPV(PV+ESS) > NPV(PV) is underlined and denoted in italic.
Table 5.
Sensitivity analysis of ESS (subsidies). NPV(PV+ESS) is in €.
| tr = 1300 kWh/(m2·year) | tr = 1450 kWh/(m2·year) | tr = 1600 kWh/(m2·year) | ||||
|---|---|---|---|---|---|---|
| NB | 6 Years | 8 Years | 6 Years | NB | 6 Years | 8 Years |
| ESS capacity = 1.5 kWh (∆wself,c = 15%) | ||||||
| −914 | −667 | −90 | 157 | 733 | 980 | |
| −993 | −746 | −169 | 78 | 654 | 901 | |
| ESS capacity = 3 kWh (∆wself,c = 20%) | ||||||
| −1058 | −748 | −217 | 93 | 623 | 933 | |
| −1148 | −839 | −307 | 2 | 533 | 842 | |
| ESS capacity = 4.5 kWh (∆wself,c = 30%) | ||||||
| −344 | 29 | 614 | 987 | 1571 | 1944 | |
| −446 | −73 | 512 | 885 | 1469 | 1842 | |
| ESS capacity = 6 kWh (∆wself,c = 40%) | ||||||
| 16 | 452 | 1049 | 1485 | 2082 | 2518 | |
| −98 | 338 | 935 | 1371 | 1968 | 2404 | |
| NPV(PV) | 788 | 1519 | 2249 | |||
NPV(PV+ESS) > 0 is denoted in italic. NPV(PV+ESS) > NPV(PV) is underlined and denoted in italic.
Table 6.
Sensitivity analysis of PV system. NPV(PV+ESS) is in €.
| tr = 1300 kWh/(m2·year) | tr = 1450 kWh/(m2·year) | tr = 1600 kWh/(m2·year) | ||||
|---|---|---|---|---|---|---|
| NB | 6 Years | 8 Years | 6 Years | NB | 6 Years | 8 Years |
| ESS capacity = 1.5 kWh | ||||||
| −2315 | −2069 | −1553 | −1307 | −791 | −545 | |
| −1252 | −1006 | −368 | −122 | 518 | 764 | |
| −1170 | −924 | −276 | −30 | 619 | 865 | |
| −2001 | −1755 | −1203 | −957 | −405 | −159 | |
| −1254 | −1008 | −431 | −185 | 393 | 639 | |
| −725 | −479 | 99 | 345 | 923 | 1169 | |
| −2497 | −2251 | −1674 | −1428 | −850 | −604 | |
| ESS capacity = 3 kWh | ||||||
| −2646 | −2336 | −1874 | −1564 | −1101 | −791 | |
| −1466 | −1156 | −557 | −247 | 352 | 662 | |
| −1310 | −1000 | −383 | −73 | 544 | 854 | |
| −2056 | −1746 | −1215 | −905 | −375 | −65 | |
| −1527 | −1217 | −686 | −376 | 155 | 465 | |
| −998 | −688 | −157 | 153 | 685 | 995 | |
| −2769 | −2459 | −1929 | −1619 | −1088 | −778 | |
| ESS capacity = 4.5 kWh | ||||||
| −2178 | −1805 | −1302 | −929 | −427 | −54 | |
| −761 | −388 | 278 | 651 | 1316 | 1689 | |
| −1168 | −795 | −176 | 197 | 816 | 1189 | |
| −1743 | −1370 | −817 | −444 | 109 | 482 | |
| −940 | −567 | 17 | 390 | 974 | 1347 | |
| −411 | −38 | 546 | 919 | 1504 | 1877 | |
| −2183 | −1810 | −1226 | −853 | −269 | 104 | |
| ESS capacity = 6 kWh | ||||||
| −2064 | −1628 | −1127 | −691 | −189 | 247 | |
| −411 | 25 | 717 | 1153 | 1845 | 2281 | |
| −1026 | −590 | 32 | 468 | 1089 | 1525 | |
| −1429 | −993 | −419 | 17 | 592 | 1028 | |
| −708 | −272 | 324 | 760 | 1357 | 1793 | |
| −179 | 257 | 853 | 1289 | 1887 | 2323 | |
| −1951 | −1515 | −918 | −482 | 114 | 550 | |
NPV(PV+ESS) > 0 is denoted in italic. NPV(PV+ESS) > NPV(P V) is underlined and denoted in italic.
© 2018 by the authors. Licensee MDPI, Basel, Switzerland. This article is an open access article distributed under the terms and conditions of the Creative Commons Attribution (CC BY) license (http://creativecommons.org/licenses/by/4.0/).
Share and Cite
MDPI and ACS Style
Cucchiella, F.; D’Adamo, I.; Gastaldi, M.; Stornelli, V. Solar Photovoltaic Panels Combined with Energy Storage in a Residential Building: An Economic Analysis. Sustainability 2018, 10, 3117. https://doi.org/10.3390/su10093117
AMA Style
Cucchiella F, D’Adamo I, Gastaldi M, Stornelli V. Solar Photovoltaic Panels Combined with Energy Storage in a Residential Building: An Economic Analysis. Sustainability. 2018; 10(9):3117. https://doi.org/10.3390/su10093117
Chicago/Turabian StyleCucchiella, Federica, Idiano D’Adamo, Massimo Gastaldi, and Vincenzo Stornelli. 2018. "Solar Photovoltaic Panels Combined with Energy Storage in a Residential Building: An Economic Analysis" Sustainability 10, no. 9: 3117. https://doi.org/10.3390/su10093117
Note that from the first issue of 2016, this journal uses article numbers instead of page numbers. See further details here.