Article

Spatial Distributions, Pollution Assessment, and Qualified Source Apportionment of Soil Heavy Metals in a Typical Mineral Mining City in China

College of Resources & Environment, Huazhong Agricultural University, Wuhan 430070, China
*
Author to whom correspondence should be addressed.
Sustainability 2018, 10(9), 3115; https://doi.org/10.3390/su10093115
Submission received: 23 July 2018 / Revised: 20 August 2018 / Accepted: 24 August 2018 / Published: 31 August 2018
(This article belongs to the Section Environmental Sustainability and Applications)

Abstract

:
Daye is a city in China known for its rich mineral resources, with a history of metal mining and smelting that dates back more than 3000 years. To analyze the spatial distribution patterns, ecological risk, and sources of heavy metals (Cd, Co, Cr, Cu, Mn, Ni, Pb, and Zn) in soils, 213 topsoil samples were collected in the main urban area of Daye in September 2016. The mean concentrations of Cd, Cu, Pb, and Zn were higher than the corresponding background values, with the mean concentration of Cd being almost seven times its background value. Spatially, the high concentrations of Cd, Mn, Pb, and Zn were mainly concentrated in the southeastern part of the region due to nonferrous metal mining and smelting. However, the high concentrations of Co and Cu were concentrated in the central part of the study area, resulted from copper mining and smelting. The data of the geoaccumulation index showed that the contamination levels ranged from no pollution (Co, Cr, Mn, and Ni) to heavy contamination (Cd, Cu, and Pb). Ecological risk assessment showed that Cd posed a high, serious, and even severe ecological risk in 53.78% of the area of Daye. According to the results of the principal component analysis, mineral exploitation and smelting involving a variety of minerals (ES_M), mining exploitation, and smelting of copper ore (ES_C), and natural sources are the three main sources of heavy metals in these soils. Furthermore, the absolute principal component scores showed that 69.21% and 23.17% of the heavy metal concentrations were ascribed to ES_M and ES_C, respectively.

1. Introduction

With the increases in intense urbanization, industrialization, and human population, soil heavy metal pollution has been significant over the past several decades because of the toxicity and undegradability of these pollutants [1,2,3,4]. Many studies have shown that the accumulation of heavy metals in the soil degrades the quality of farmland, food crops, and humans’ living environment and threatens human health via the food chain or dermal contact [5,6].
In China, there are 171 varieties of mineral resources, and the proven reserves of mineral resources in China constitute 12% of the total mineral resources in the world [7]. Existing studies have shown that heavy metal soil pollution is related to mining activities, including mining, smelting, and transportation. For example, Liang et al. reported that 26.05% of the heavy metals in soil were a result of mining activities in a typical coal mining city, Lianyuan, in the Hunan province of China [8]. Wang et al. reported that 65.7% of soil samples taken near a tungsten mine in the Dayu County of Jiangxi province, China, were polluted with heavy metals [9]. Xu et al. investigated paddy soils from lead-zinc mining areas in the Guangdong province, China [10]. Their results indicated that the paddy soils were heavily contaminated with Cd, Pb, and Zn in amounts that exceeded the corresponding soil quality standard values and background values.
The city of Daye in the Hubei province, China, is known for its mining activities, with rich mineral resources and a history of metal mining and smelting of more than 3000 years. There are 65 kinds of minerals exploited in Daye, with 273 deposits and 42 kinds of mineral deposits in the reserves. In previous studies, some soil heavy metals, such as Cd, Pb, and Zn, were investigated and assessed in a small part of Daye, and serious contamination with Cd was found [11,12]. Meanwhile, some studies investigated and assessed the heavy metals pollution in agricultural soils of Daye indicated that As, Cd, Cu, and Zn were indicators of anthropic pollution [13,14]. Then, the high concentrations of those heavy metals in farmland soil lead to pollution risks of crops and foods [15,16]. However, the mines and related smelters in Daye are in close proximity to residential, commercial, and agricultural areas. Additionally, the existing studies paid more attention to farmland soil around Daye city, or the soil in a small area around a mining area. Thus, a comprehensive pollution assessment of the mining areas in Daye is urgently needed.
Furthermore, in the existing studies about regional soil heavy metals, pollution assessment, risk assessment, spatial distribution analysis, and source apportionment analysis of heavy metals were carried out based on surface soil samples. The spatial distributions generated by spatial prediction methods (e.g., various Kriging methods) reveal the spatial characteristics or patterns of soil heavy metals. However, the pollution assessment, risk assessment, and source apportionment of heavy metals performed in most of these studies were based on soil sample data rather than on the spatial distributions of heavy metals. That is, the objects of pollution assessment, risk assessment, and source apportionment were only the soil samples, and all calculations were based on the heavy metals concentrations of those soil samples. This will lead to a unilateral understanding of the regional soil pollution only in the area where the soil samples are located. Thus, it is difficult to fully understand and assess the severity of heavy metal pollution in the soils of this region. Moreover, it is impossible to quantify the contributions of each identified source to the pollution in each location of the study area.
Based on the facts discussed above, the primary objectives of this study were to (1) determine the spatial distributions of soil heavy metal concentrations, (2) assess the heavy metal contamination in soil based on the above spatial maps, and (3) quantify the source apportionment of regional soil heavy metal concentrations, and express the contributions of each identified source at each location in the study area. The results of this study can help local governments understand, control, and manage regional heavy metal soil pollution.

2. Materials and Methods

2.1. Study Area and Data

The city of Daye (latitude 29°40′–30°15′ N, longitude 114°31′–115°20′ E) is located in the southeastern area of the Hubei province along the south bank of the middle reaches of the Yangtze River. Due to its rich mineral resources, there are still numerous mines (coal, copper, iron, and gold) and smelting factories around Daye. To assess the soil heavy metal pollution, a total of 213 topsoil samples were collected in the main urban area of Daye during September 2016. The sampling points were randomly distributed in the study area based on a regular grid of 0.7 × 0.7 km, and each grid had at least one sampling point. The topsoil (0–20 cm) was collected by mixing 5 sub-samples obtained in different directions using a stainless steel hand spade. The spatial site of each sampling point was recorded using a hand-held positioning system (GPS). All soil samples were air-dried at room temperature, then passed through a 0.15 mm nylon sieve. These fine fractions were digested using a ternary mixture of concentrated acids consisting of 6ml HCO4, 5 mL HF, and 3 mL HNO3 [17]. The concentrations of eight heavy metal elements (Cd, Co, Cr, Cu, Mn, Ni, Pb, and Zn) were measured using inductively coupled plasma mass spectrometry (ICP-MS). Quality assurance and quality control for metals in soils sample were carried out by the 20% analysis (in duplicate) of randomly chosen samples and was found to be within the accepted standard reference materials (GSS-3), which were obtained from the Center of National Standard Reference Material of China. The results were considered acceptable when the coefficients of variation were within 5%. All soil samples were analyzed at the Key Laboratory of Arable Land Conservation (middle and lower reaches of the Yangtze River), Chinese Ministry of Agriculture, Wuhan city. Land cover data were obtained by visual interpretation of contemporaneous Google remote sensing data. As shown in Figure 1, the mines are distributed throughout the southern and northern portions of the mountain forest area; some mineral smelters are distributed on the edge of the urban area; the factories, including those for mechanical and electrical manufacturing, textiles, clothing, electronics, new materials, and food and beverages, are located in the northern portion of the study area. The spatial distributions of soil sampling points and land cover are shown in Figure 1.

2.2. Data Analysis and Spatial Distribution Maps

Standard statistical analysis was carried out to describe the soil heavy metal concentrations using Excel software (Version 14, Microsoft, Inc., Redmond, Washington, DC, USA). Then, Pearson correlation analysis based on sampling points was used as an indicator of the relationships between different heavy metals in soils using IBM SPSS Statistics software (Version 19.0, Armonk, NY, USA). Ordinary Kriging (OK) interpolation was performed on the concentrations of soil heavy metals using ArcGIS software (Version 10.2, ESRI, Inc., Redlands, CA, USA). The standard sample-based cross-validation technique was implemented to assess the spatial interpolation accuracy. Based on the leave one-out cross validation technique, two accuracy indicators were computed from the pairs of “estimated-observed” soil heavy metal concentrations at the sampling points: The Pearson correlation coefficient (r) and the mean absolute error (MAE). The r and MAE were used to measure the strength of the linear relation and mean absolute deviation between the estimated and the observed soil heavy metal concentrations, respectively. For an accurate spatial interpolation, r should be close to 1, and the MAE should be as small as possible. In addition, to remove any quantitative differences among the various heavy metals in the soils, an error rate (ER) was defined as the ratio of the MAE over the mean value of the heavy metals.

2.3. Methods for the Assessment of Pollution and Potential Ecological Risk

The geoaccumulation index ( I g e o ) was used to assess metal contamination levels because I g e o is the most popular index for pollution evaluation based on single heavy metals in soils [18]; I g e o is defined as follows [19]:
I g e o   = log 2 ( C n / 1.5 B n )
where C n and B n are the concentration of heavy metal, n, in the soil and the geochemical background concentration of the corresponding heavy metal, n, respectively, in the Hubei province. Unlike calculations in previous studies, I g e o was calculated based on the spatial distribution of various heavy metals instead of the concentrations in soil samples. That is, I g e o was determined for each heavy metal at each location, and the overall picture of heavy metal pollution in the study area can be obtained in the present study. Based on the I g e o value for each heavy metal, the heavy metal pollution was classified into 7 categories: I g e o 0 (practically uncontaminated), 0 < I g e o 1 (uncontaminated to moderately contaminated), 1 < I g e o 2 (moderately contaminated), 2 < I g e o 3 (moderately to heavily contaminated), 3 < I g e o 4 (heavily contaminated), 4 < I g e o 5 (heavily to extremely contaminated), and I g e o > 5 (extremely contaminated).
The potential ecological risk index (RI) was used to quantitatively express the potential ecological risk posed by a variety of toxic heavy metals. The RI is calculated by the following formulas [20,21]:
RI = i = 1   n E i = i = 1 n T i × C f i = i = 1 n T i × C i C 0
where E i is the potential ecological risk factor for a given heavy metal, i, T i is the toxic coefficient of a heavy metal, i, C i is the concentration of the heavy metal, and C 0 is the background value of the corresponding heavy metal in the Hubei province. Based on previously published research, the toxic coefficients of Cd, Co, Cr, Cu, Mn, Ni, Pb, and Zn are 30, 5, 2, 5, 1, 5, 5, and 1, respectively [22]. Based on E i or the RI, the potential ecological hazard posed by heavy metals was classified into 5 grades (see Table 1). The calculations introduced in this section were completed using Excel software (Version 14, Microsoft Inc., Redmond, Washington, DC, USA).

2.4. Principal Component Analysis (Pca) and Absolute Principal Component Scores (APCS)

PCA/APCS is an effective multivariate factor analysis model for the identification of pollution sources. It was first applied to estimate sources of particulate matter in Boston by Thurston and Spengler [23]. The PCA/APCS receptor model can quantitatively determine not only the load of each pollutant attributed to each source, but also the average contribution of each source to each pollutant and to the pollution in each sample. Currently, the model is mainly used in research on air pollution and water pollution [24,25,26,27]. In this study, PCA was performed on the spatial distributions of heavy metal accumulation in soils for source identification using factor extraction with eigenvalues > 1 after varimax rotation. Then, APCS were used to estimate the source contributions to each heavy metal in the following steps:
Step 1: The first step of determining APCS is the normalization of all heavy metal accumulation values as Z i k using the following equation:
Z i k   = ( A i k A i ¯ ) / σ i
where A i k is the accumulation of the heavy metal, i, at the location, k, and A i ¯ and σ i are its mean value and standard deviation, respectively;
Step 2: By introducing an artificial sample, with accumulations equal to zero for all heavy metals, the true zero for each factor score is calculated:
( Z 0   ) i = ( 0 C i ) σ i = C i σ i
Step 3: The factor scores of those normalized heavy metal accumulation values are obtained by the PCA method. The APCS of each heavy metal at each location are obtained by subtracting the factor scores for this artificial sample from the factor scores of each location; and
Step 4: The source contributions are derived by regression using the following equation:
A i = ( b 0   ) i + p = 1 n A P C S p × b p i
where A i is the accumulation of the heavy metal, i, ( b 0 ) i is the constant term of multiple regression for the heavy metal, i, b p i is the coefficient of multiple regression of the source, p, for the heavy metal, i, and A P C S p is the scaled value of the rotated factor, p, for the considered location. A P C S p × b p i is the contribution of the source, p, to A i . The mean of the product, A P C S p × b p i , at all locations represents the average contribution of the sources. The calculations introduced in this section were completed using SPSS software (Version 19.0 for Windows, IBM Inc., Armonk, NY, USA) and Excel software (Version 14, Microsoft Inc., Redmond, WA, USA).

3. Results and Discussion

3.1. Descriptive Statistics and Spatial Distributions of Soil Heavy Metals

Based on the available samples, the statistical characteristics of the heavy metal concentrations in the Daye region are presented in Table 2. As shown in Table 2, the percentage of sampling points where the concentration exceeds the background (PbB) was greater than 50% for Cd, Cu, Pb, and Zn, indicating serious Cd, Cu, Pb, and Zn pollution in the study area. On the other hand, although the mean concentrations of Co and Mn were less than their background values, their PbB values exceeded 30%, indicating that part of the study area was polluted by these two heavy metals.
The heavy metals in soils were also studied in different mines in China. As shown in Table 3, the concentration distribution patterns of Cd in this study were similar to the values found in the Nandan County, which is located in the north of the Guangxi province as a mining town [29]. However, the mean concentration of Cd was much lower than those reported from some large lead-zinc mining areas, such as the lead-zinc mine in Qixiashang of Nanjing city with a mean of 17.56 mg/kg [30], and the lead-zinc mine with a mean of 15.56 mg/kg in the Lanping county, Yunnan province, China [31]. Compared to soil from other mining areas, the mean value of Cu in Daye soils was markedly three to six times higher than the values reported in other urban soils [8,31,32,33,34]. However, the mean value of Cu was still lower than the value in soils of the mining area in Nanjing city [30,35]. The measured mean values of Mn, Pb, and Zn were extremely higher in the soils of lead-zinc or Mn mining areas than the values presented in this study. For example, the mean concentrations of Mn, Pb, and Zn were 14015.31 mg/kg, 2232.16 mg/kg, and 5201.86 mg/kg, respectively, in the soils of the lead-zinc mine of Nanjing city [35]. The mean values of Pb and Zn were 1093.03 mg/kg and 867.08 mg/kg, respectively, in the soils of a lead-zinc mine in the Guangdong province [10]. The mean concentrations of Mn, Pb, and Zn were 8853.21 mg/kg, 1211.29 mg/kg, and 685.36 mg/kg, respectively, in a Mn mine in Xiangtan city, Hunan province [36]. According to the comparisons above, the mean concentration of Cu in soils was higher than most of the other mining areas in China. However, the concentrations of Cd, Mn, Pb, and Zn were lower than other mining areas, especially lead-zinc mines, in China. Thus, the concentrations of heavy metals in soils may be closely related to the local mineral type.
The Pearson’s correlation coefficients between the concentrations of heavy metals in soils based on sampling points are summarized in Table 4. The concentration of Cd, Mn, Pb, and Zn showed a high significant positive relationship with each other, which may suggest a common origin. The correlation coefficient between Cu and Co is 0.62, indicating a common source. Additionally, the correlation coefficient between Cu and Co is 0.51, also suggesting a common origin. Furthermore, although there are some other significant positive relationships, such as Cr and Cd, Mn and Cr, Zn and Co, and so on, the correlation coefficients between them are not high. Thus, the results of the correlation analysis based on the sampling points cannot clearly indicate the sources of pollution.
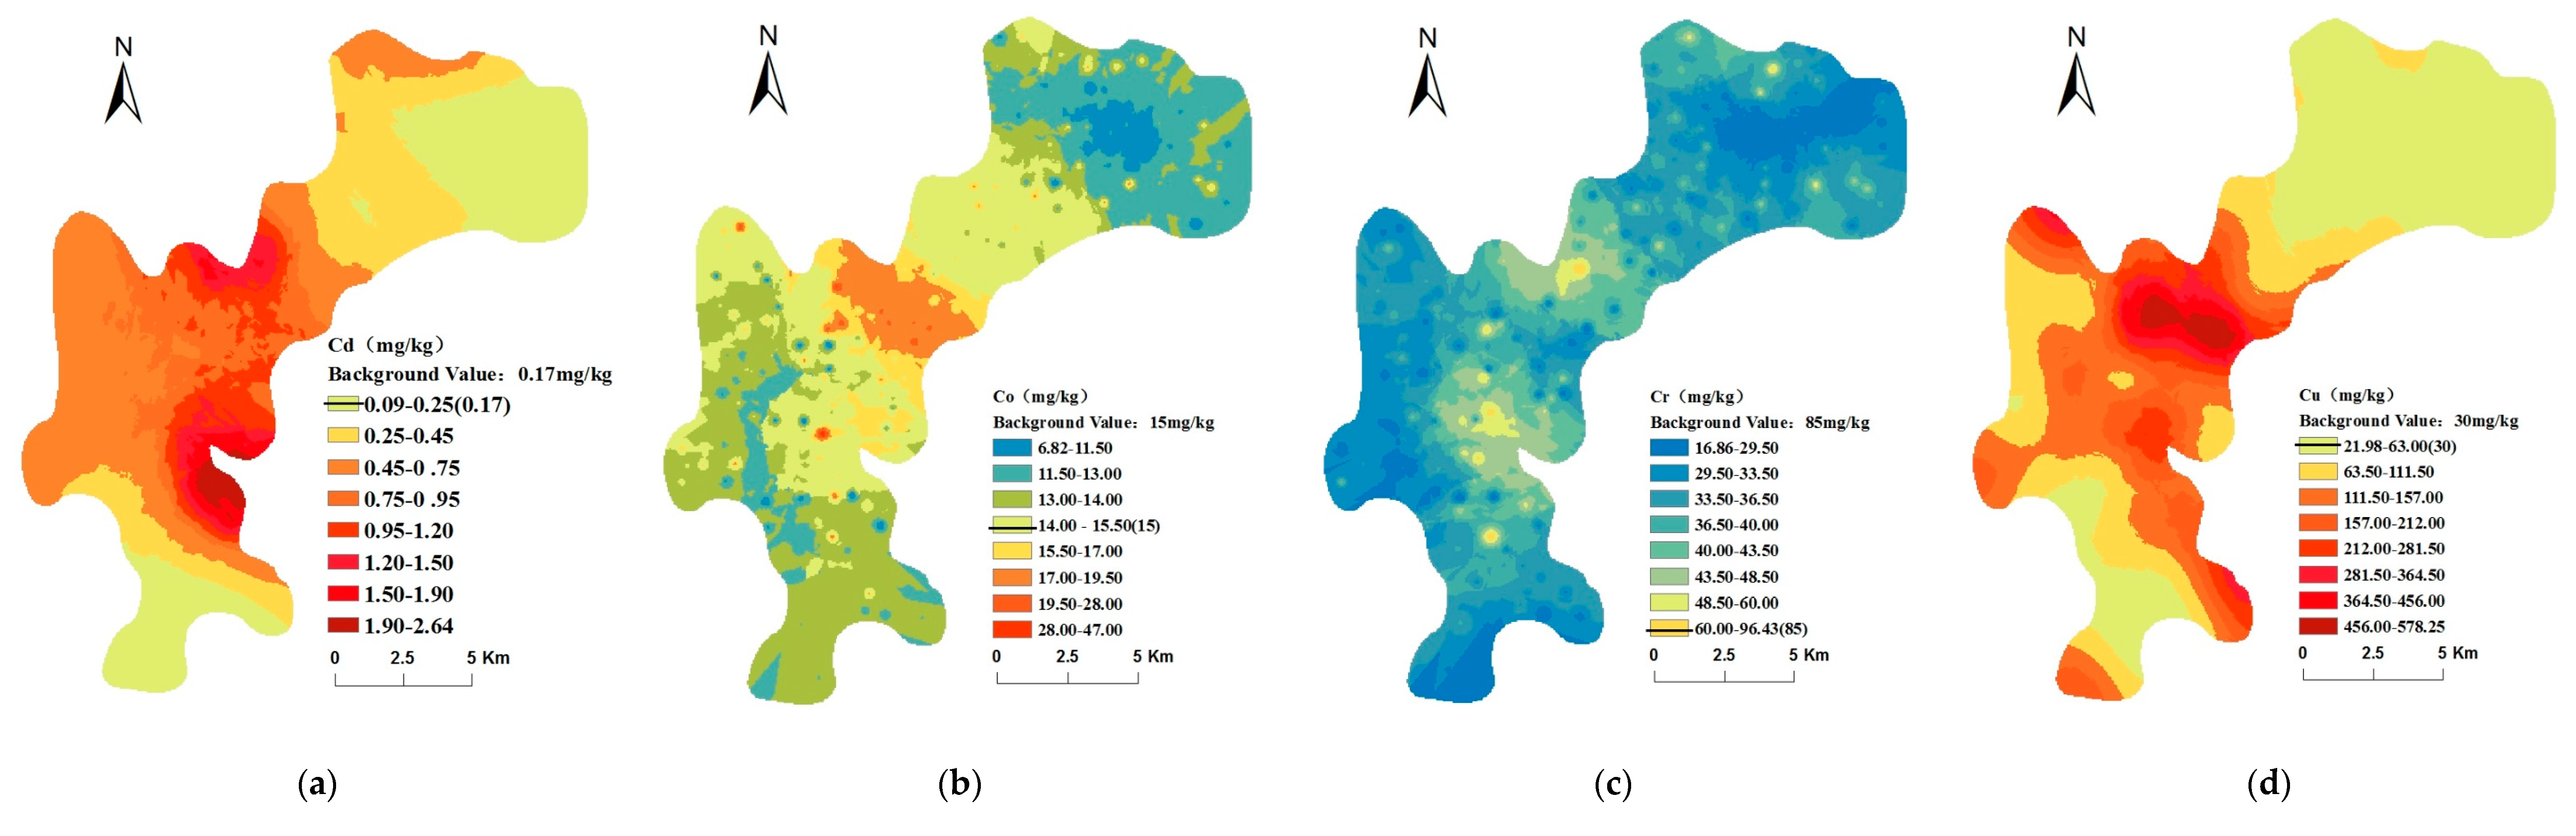
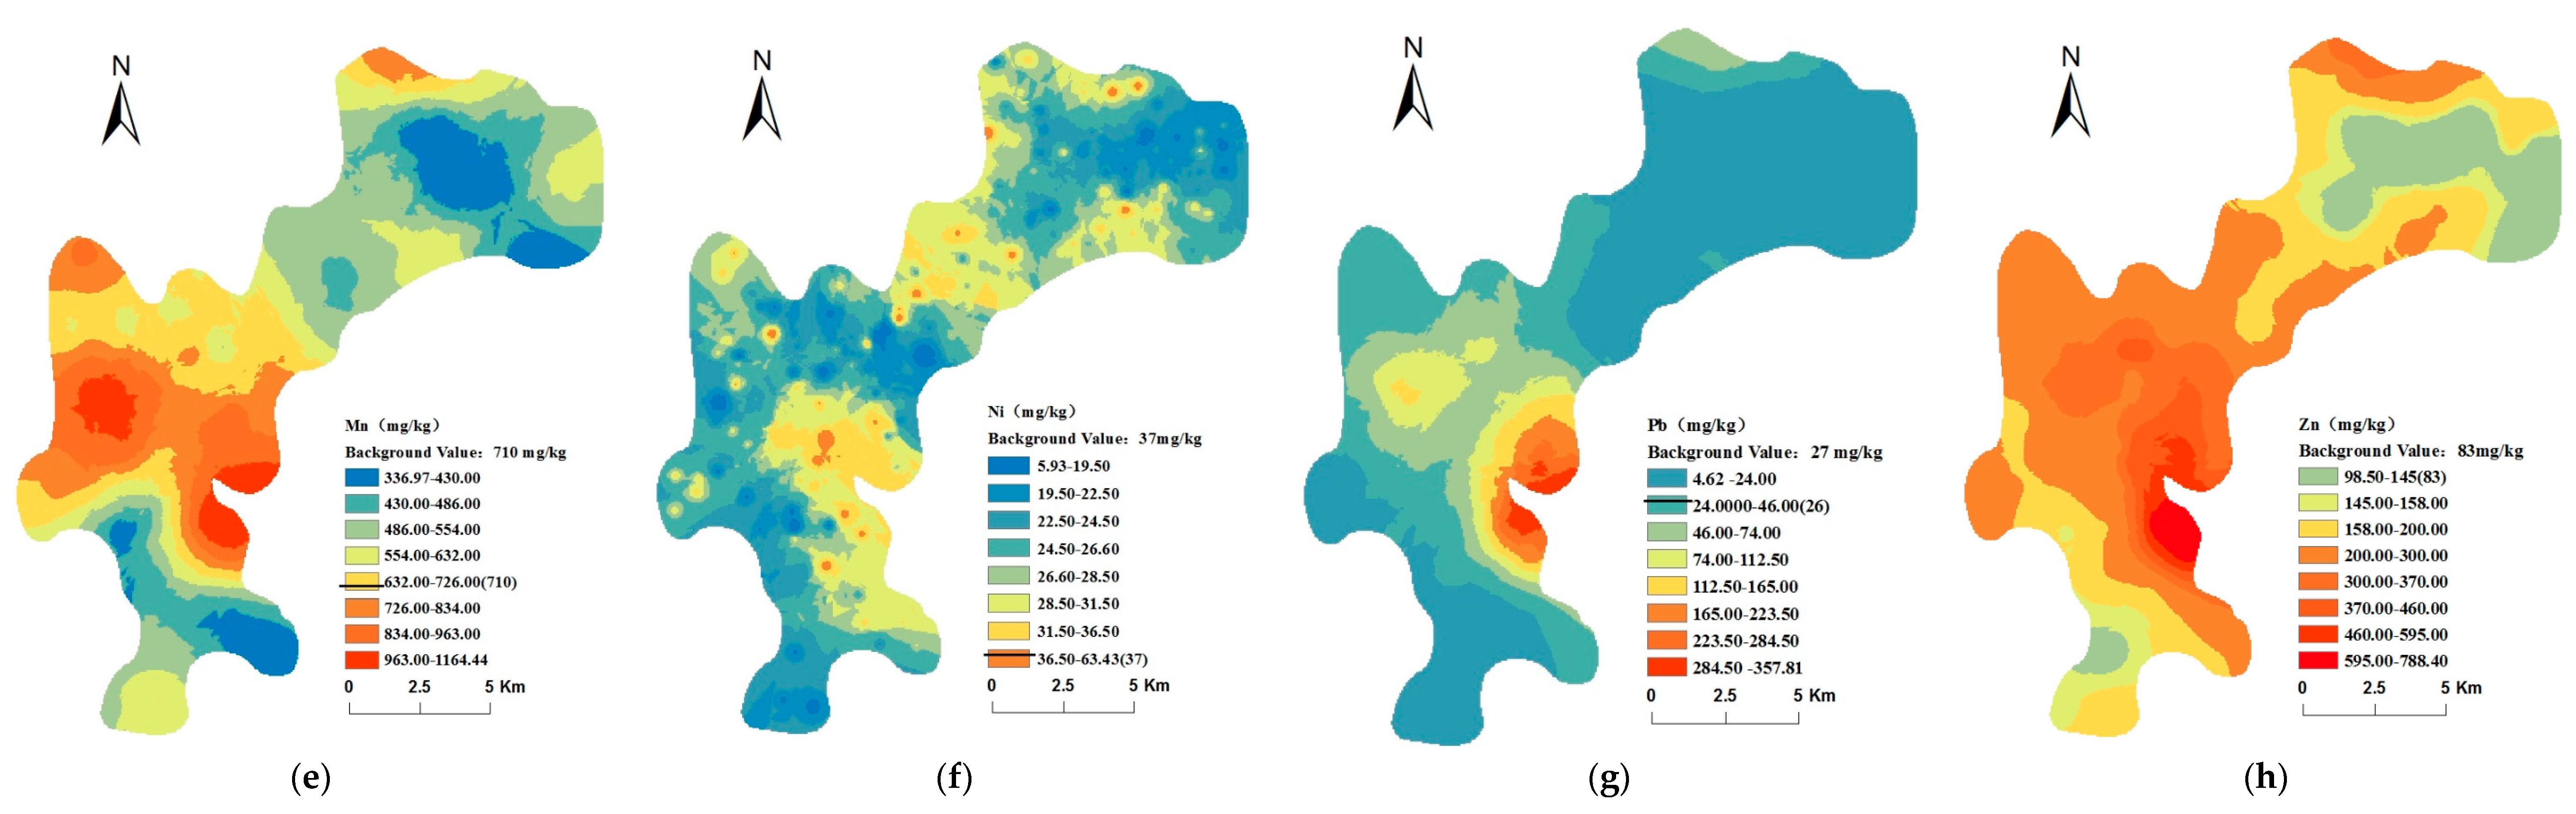
The spatial distributions of the Cd, Co, Cr, Cu, Mn, Ni, Pb, and Zn concentrations in the study area are presented in Figure 2. To intuitively understand the severity of the heavy metal pollution levels in the soil of the Daye region, in the maps of Figure 2, the yellow, blue, and red colors represent heavy metal concentrations that are close to, lower than, and higher than their background values, respectively. As shown in 
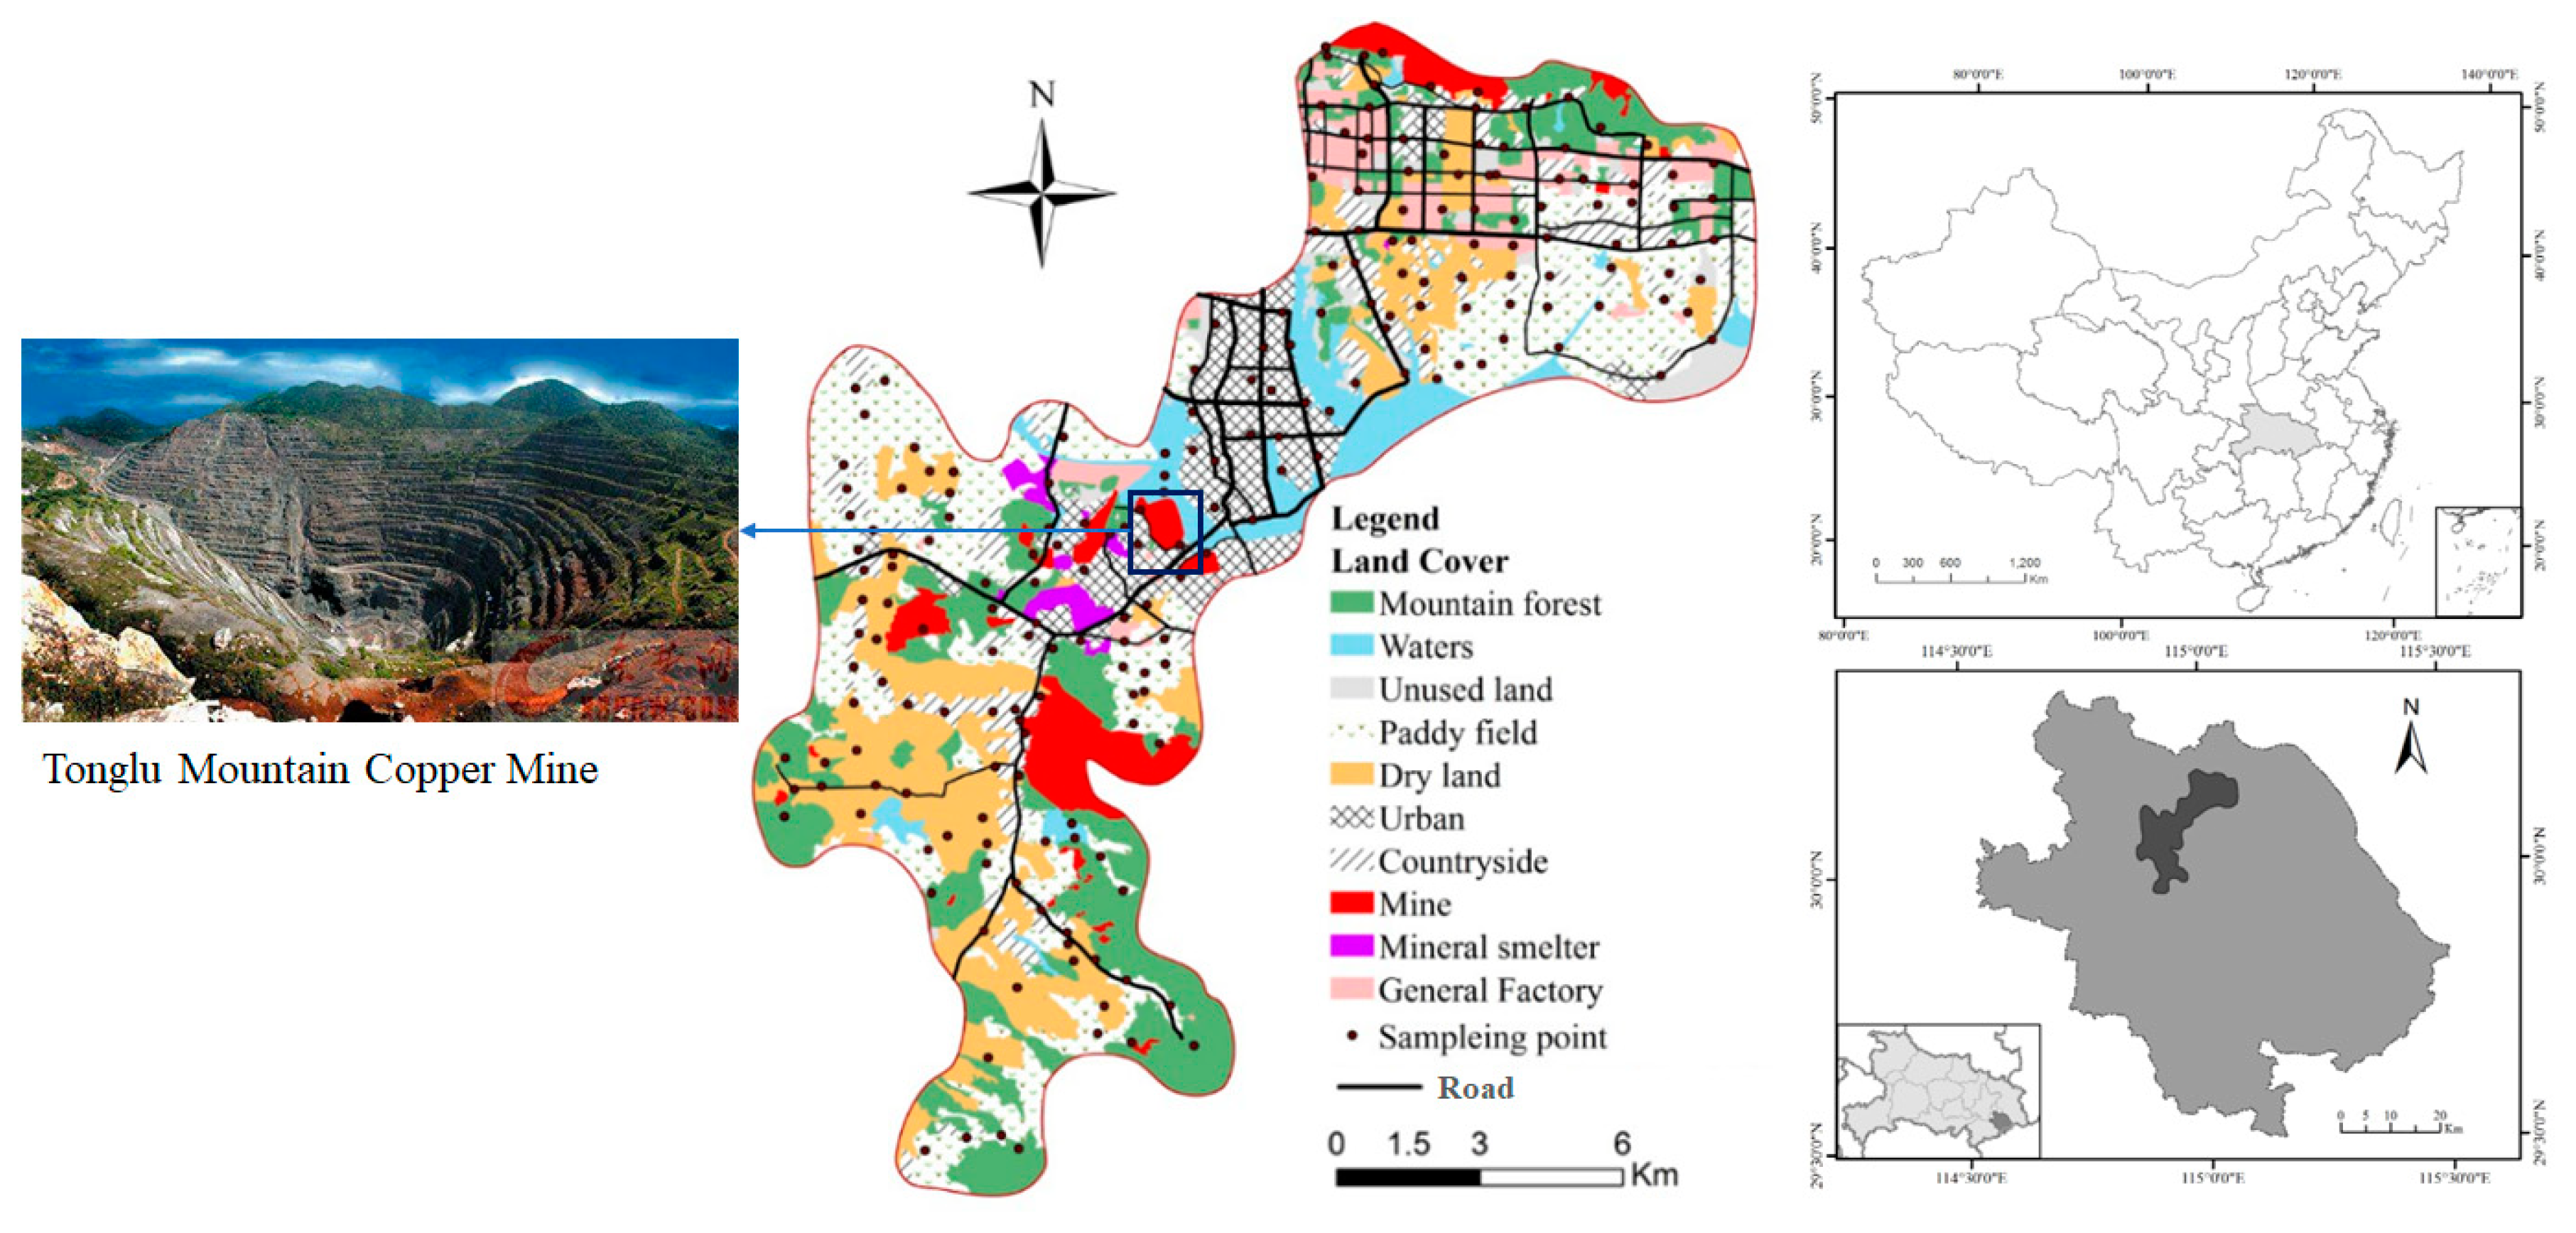
Figure 2, the maps of the Cd, Cu, Pb, and Zn distributions are almost entirely covered with red and yellow colors, indicating that the concentrations of these four heavy metals were higher than their background values over almost the entire study region. Regarding the Cr and Ni maps, most of the study region was covered in blue, indicating that only a small part of the region was polluted with Cr and Ni. Based on the Co and Mn maps, it was concluded that nearly half of the study region was polluted with these elements. Furthermore, the spatial distribution patterns of all heavy metals were characterized by decreasing concentrations from the central and southeastern parts toward the southern and northern parts. These concentrations peaked in the central and southeastern part, which may be related to the mining and smelting operations in that region (see Figure 1).
Table 5 summarizes the cross-validation results for the spatial distributions of heavy metal concentrations obtained by OK interpolation. These results show that the r and ER values of the eight heavy metal concentrations ranged from 0.75 to 0.99 (p < 0.01) and from 4.75% to 18.42%, respectively, indicating high spatial interpolation accuracy (note the high r and low ER values). Hence, the spatial interpolation results were valuable for subsequent analyses.

3.2. Pollution and Ecological Risk Assessment

Obviously, the spatial I g e o distribution pattern of each heavy metal is similar to the spatial pattern of the corresponding heavy metal distribution in soils, as shown in Figure 2. Therefore, it is not necessary to present the I g e o 
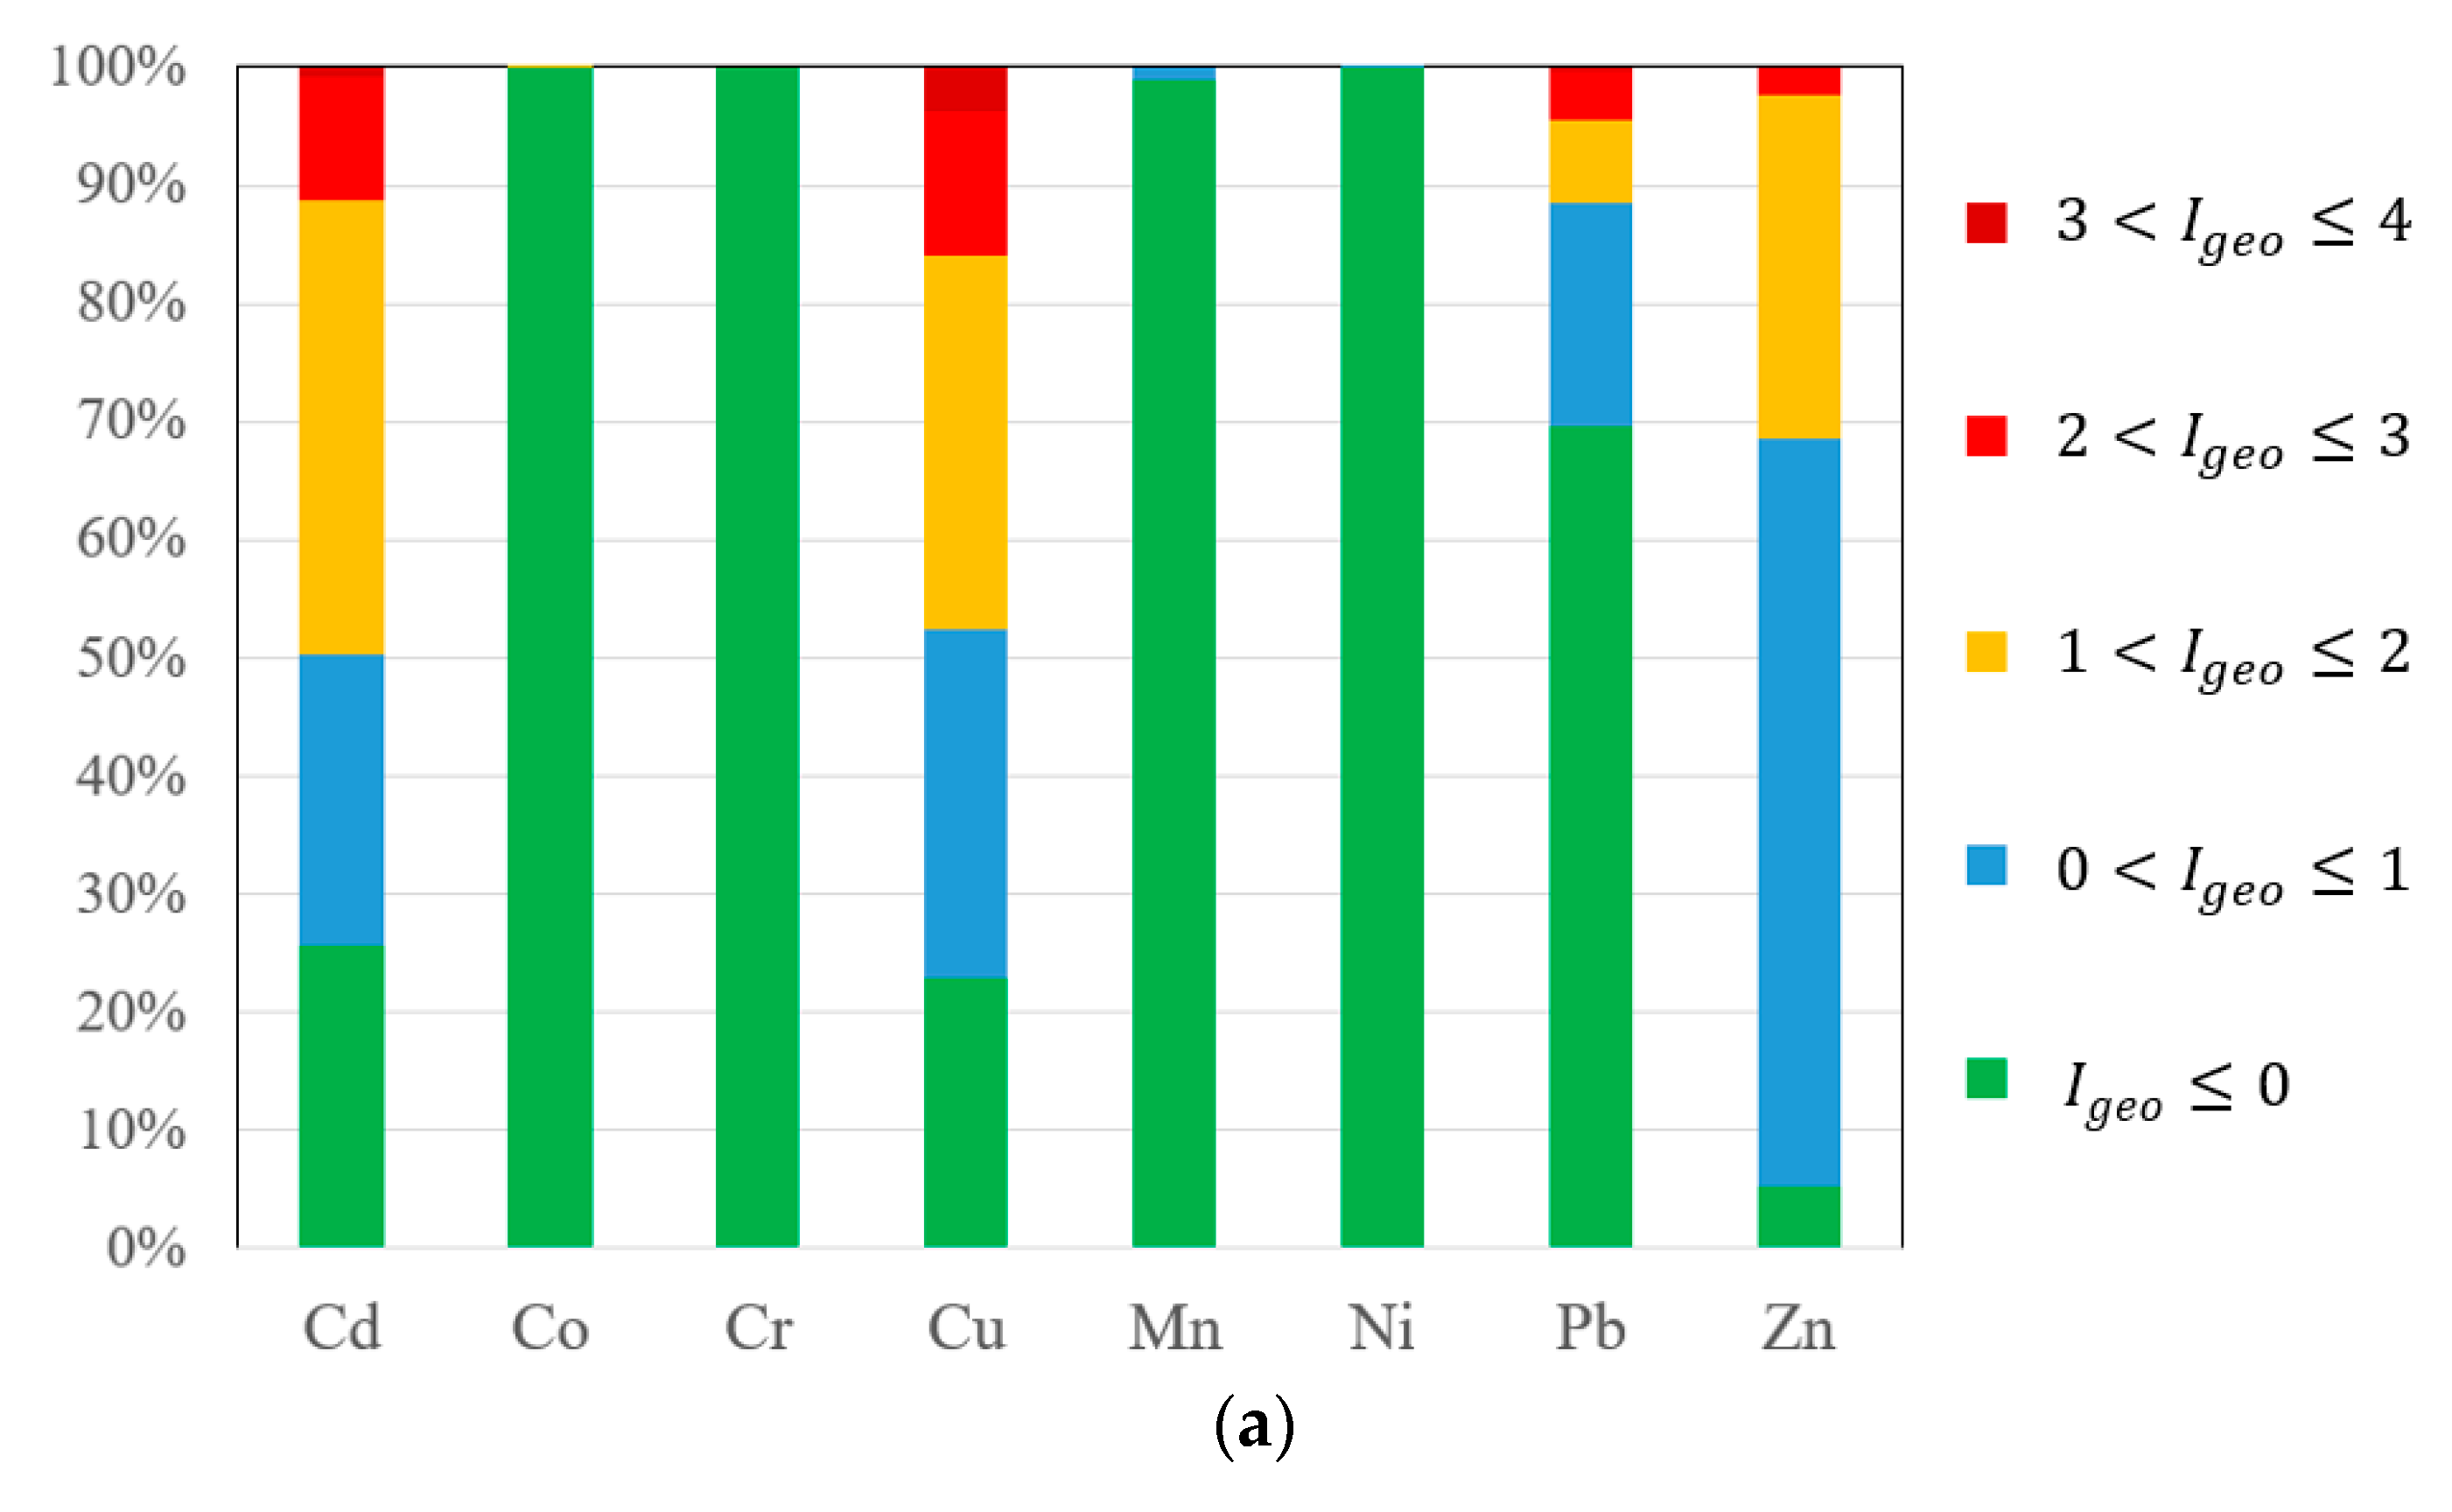
for each heavy metal spatial distribution here. According to the quantitative I g e o results for the eight heavy metals (
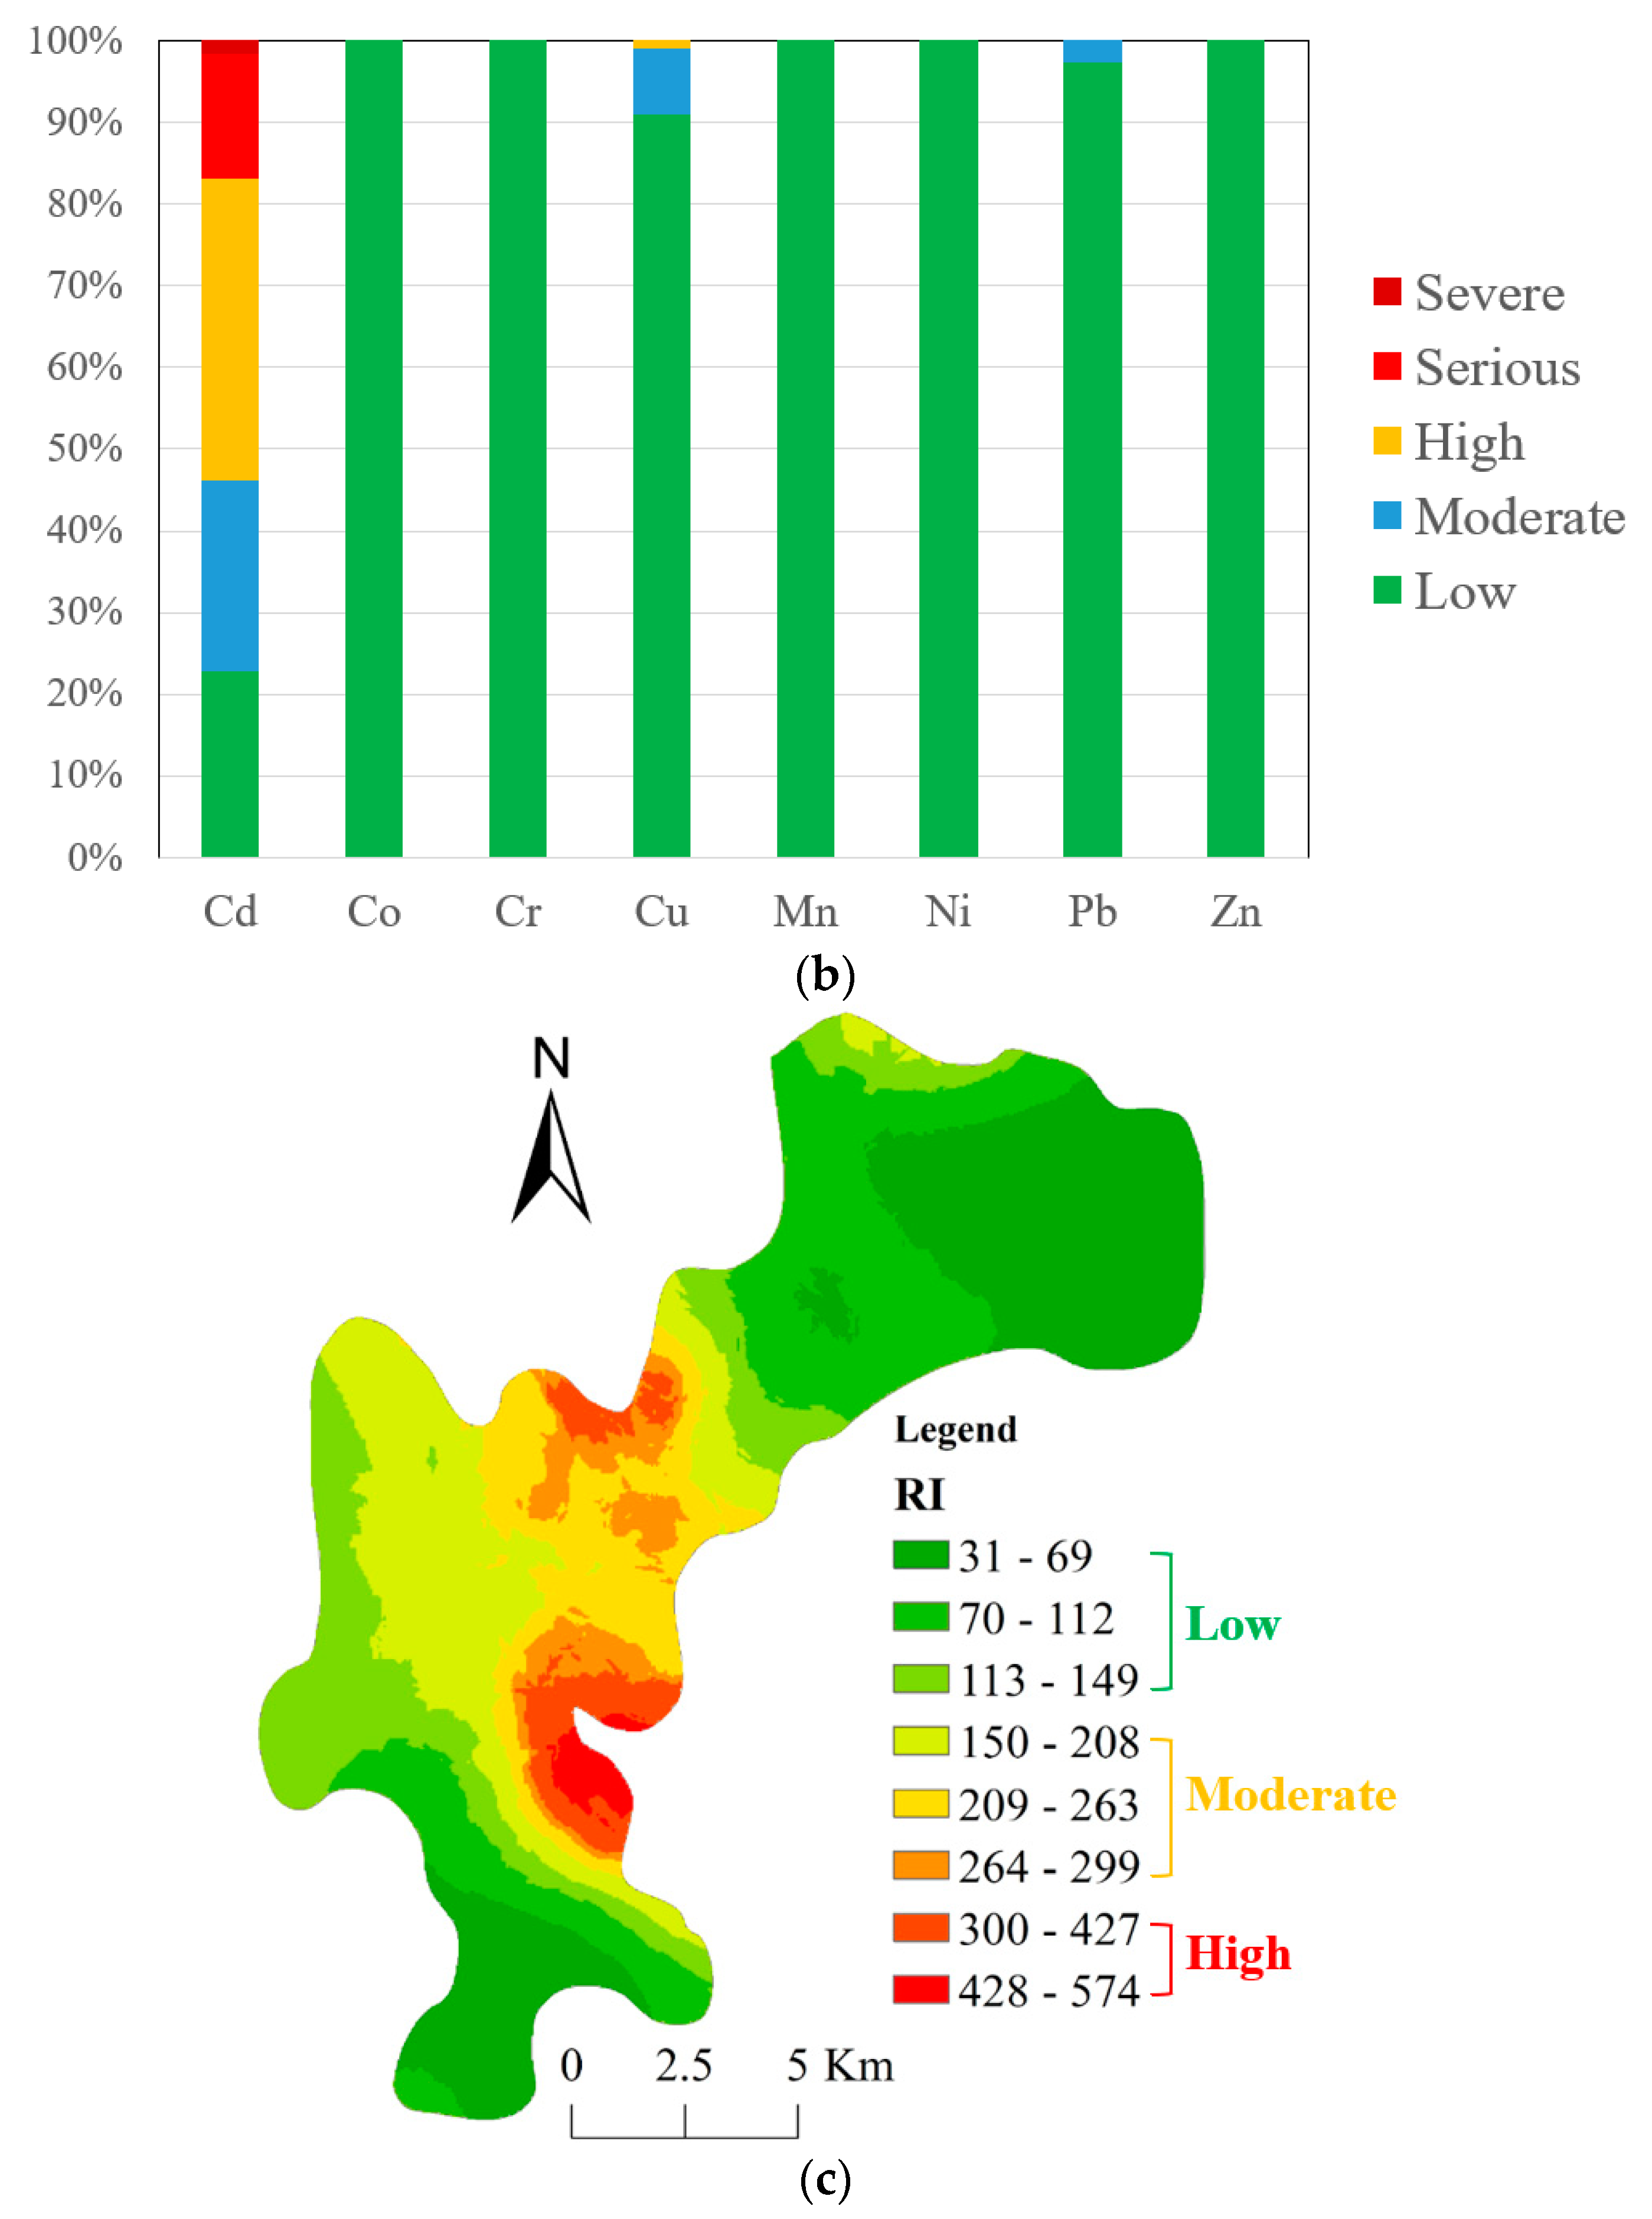
Figure 3), 74.23%, 77.16%, 30.46%, and 94.62% of the study area was contaminated by Cd, Cu, Pb, and Zn, respectively, at various pollution levels. Approximately 0.90%, 3.82%, and 0.44% of the study area was heavily contaminated by Cd, Cu, and Pb, respectively. Additionally, approximately 38.40%, 31.72%, 6.86%, and 29.09% of the study area was moderately contaminated by Cd, Cu, Pb, and Zn, respectively. These findings demonstrate that the soils of the study area were partially seriously polluted by some heavy metals (e.g., Cd, Cu, Pb, and Zn).
As shown in Figure 3b, Cd posed a moderate, high, serious, and severe potential ecological risk in approximately 23.30%, 36.80%, 15.39%, and 1.59% of the study area, respectively, whereas almost all of the study area was free from ecological risk posed by other heavy metals, especially Co, Cr, Mn, Ni, and Zn. Thus, it can be concluded that the potential ecological hazard due to heavy metals in Daye soils was mostly derived from the accumulation of Cd. As presented in Figure 3c, the RI values exceeded 150 throughout the central part of the study area. The spatial distribution pattern of the RI was similar to the pattern of Cd, indicating that the potential ecological hazard due to soil heavy metals was mainly related to Cd in Daye City.

3.3. Source Identification and Apportionment By PCA/APCS

The PCA results obtained by applying varimax rotation to the concentrations of heavy metals in the soil are shown in Table 6. Three principal components (PCs) with eigenvalues higher than 1 (before and after rotation) were extracted; PCA led to a reduction in the initial dimension of the dataset to three components that explain 87.21% of the data variation. The first PC (PC1) explains 38.98% of the total variance and with high loadings for Cd, Mn, Zn, and Pb. As shown in Figure 2, the hot spots of Cd, Mn, Zn, and Pb were all located in the southeastern part of the study area, where many mines and smelters of gold, silver, copper, iron, molybdenum, and sulfur, among other minerals, are located. Thus, PC1 can be considered a source of mineral exploitation and smelting involving a variety of minerals (ES_M). The second PC (PC2), dominated by Co and Cu and moderately by Cd, accounts for 25.74% of the total variance. As shown in Figure 2, the concentrations of Co and Cu have similar spatial distribution patterns characterized by an increasing accumulation from the north and south to the center of the study area. The only hot spot is located in the central part of the study area, where the oldest in-use copper mine (Tonglu Mountain Copper Mine) in China, with related tailings and smelters, is located. Cobalt (Co) resources are mostly associated with copper deposits. Thus, PC2 is mainly related to the mining exploitation and smelting of copper ore (ES_C). The third PC (PC3) is strongly correlated with Cr and Ni. The concentrations of Cr and Ni were lower than or approximately equal to their background values in Hubei soil, indicating that these elements mainly originate from natural sources.
Next, the APCS receptor model was applied to the three extracted components to quantify the contributions of the sources to each spatial grid. SPSS software was used to develop suitable programs and outputs for carrying out the apportionment procedure. The results of the statistical analysis are presented in Table 7. The high values of R2 for all heavy metals demonstrate that the source apportionment results meet the modeling requirements. 
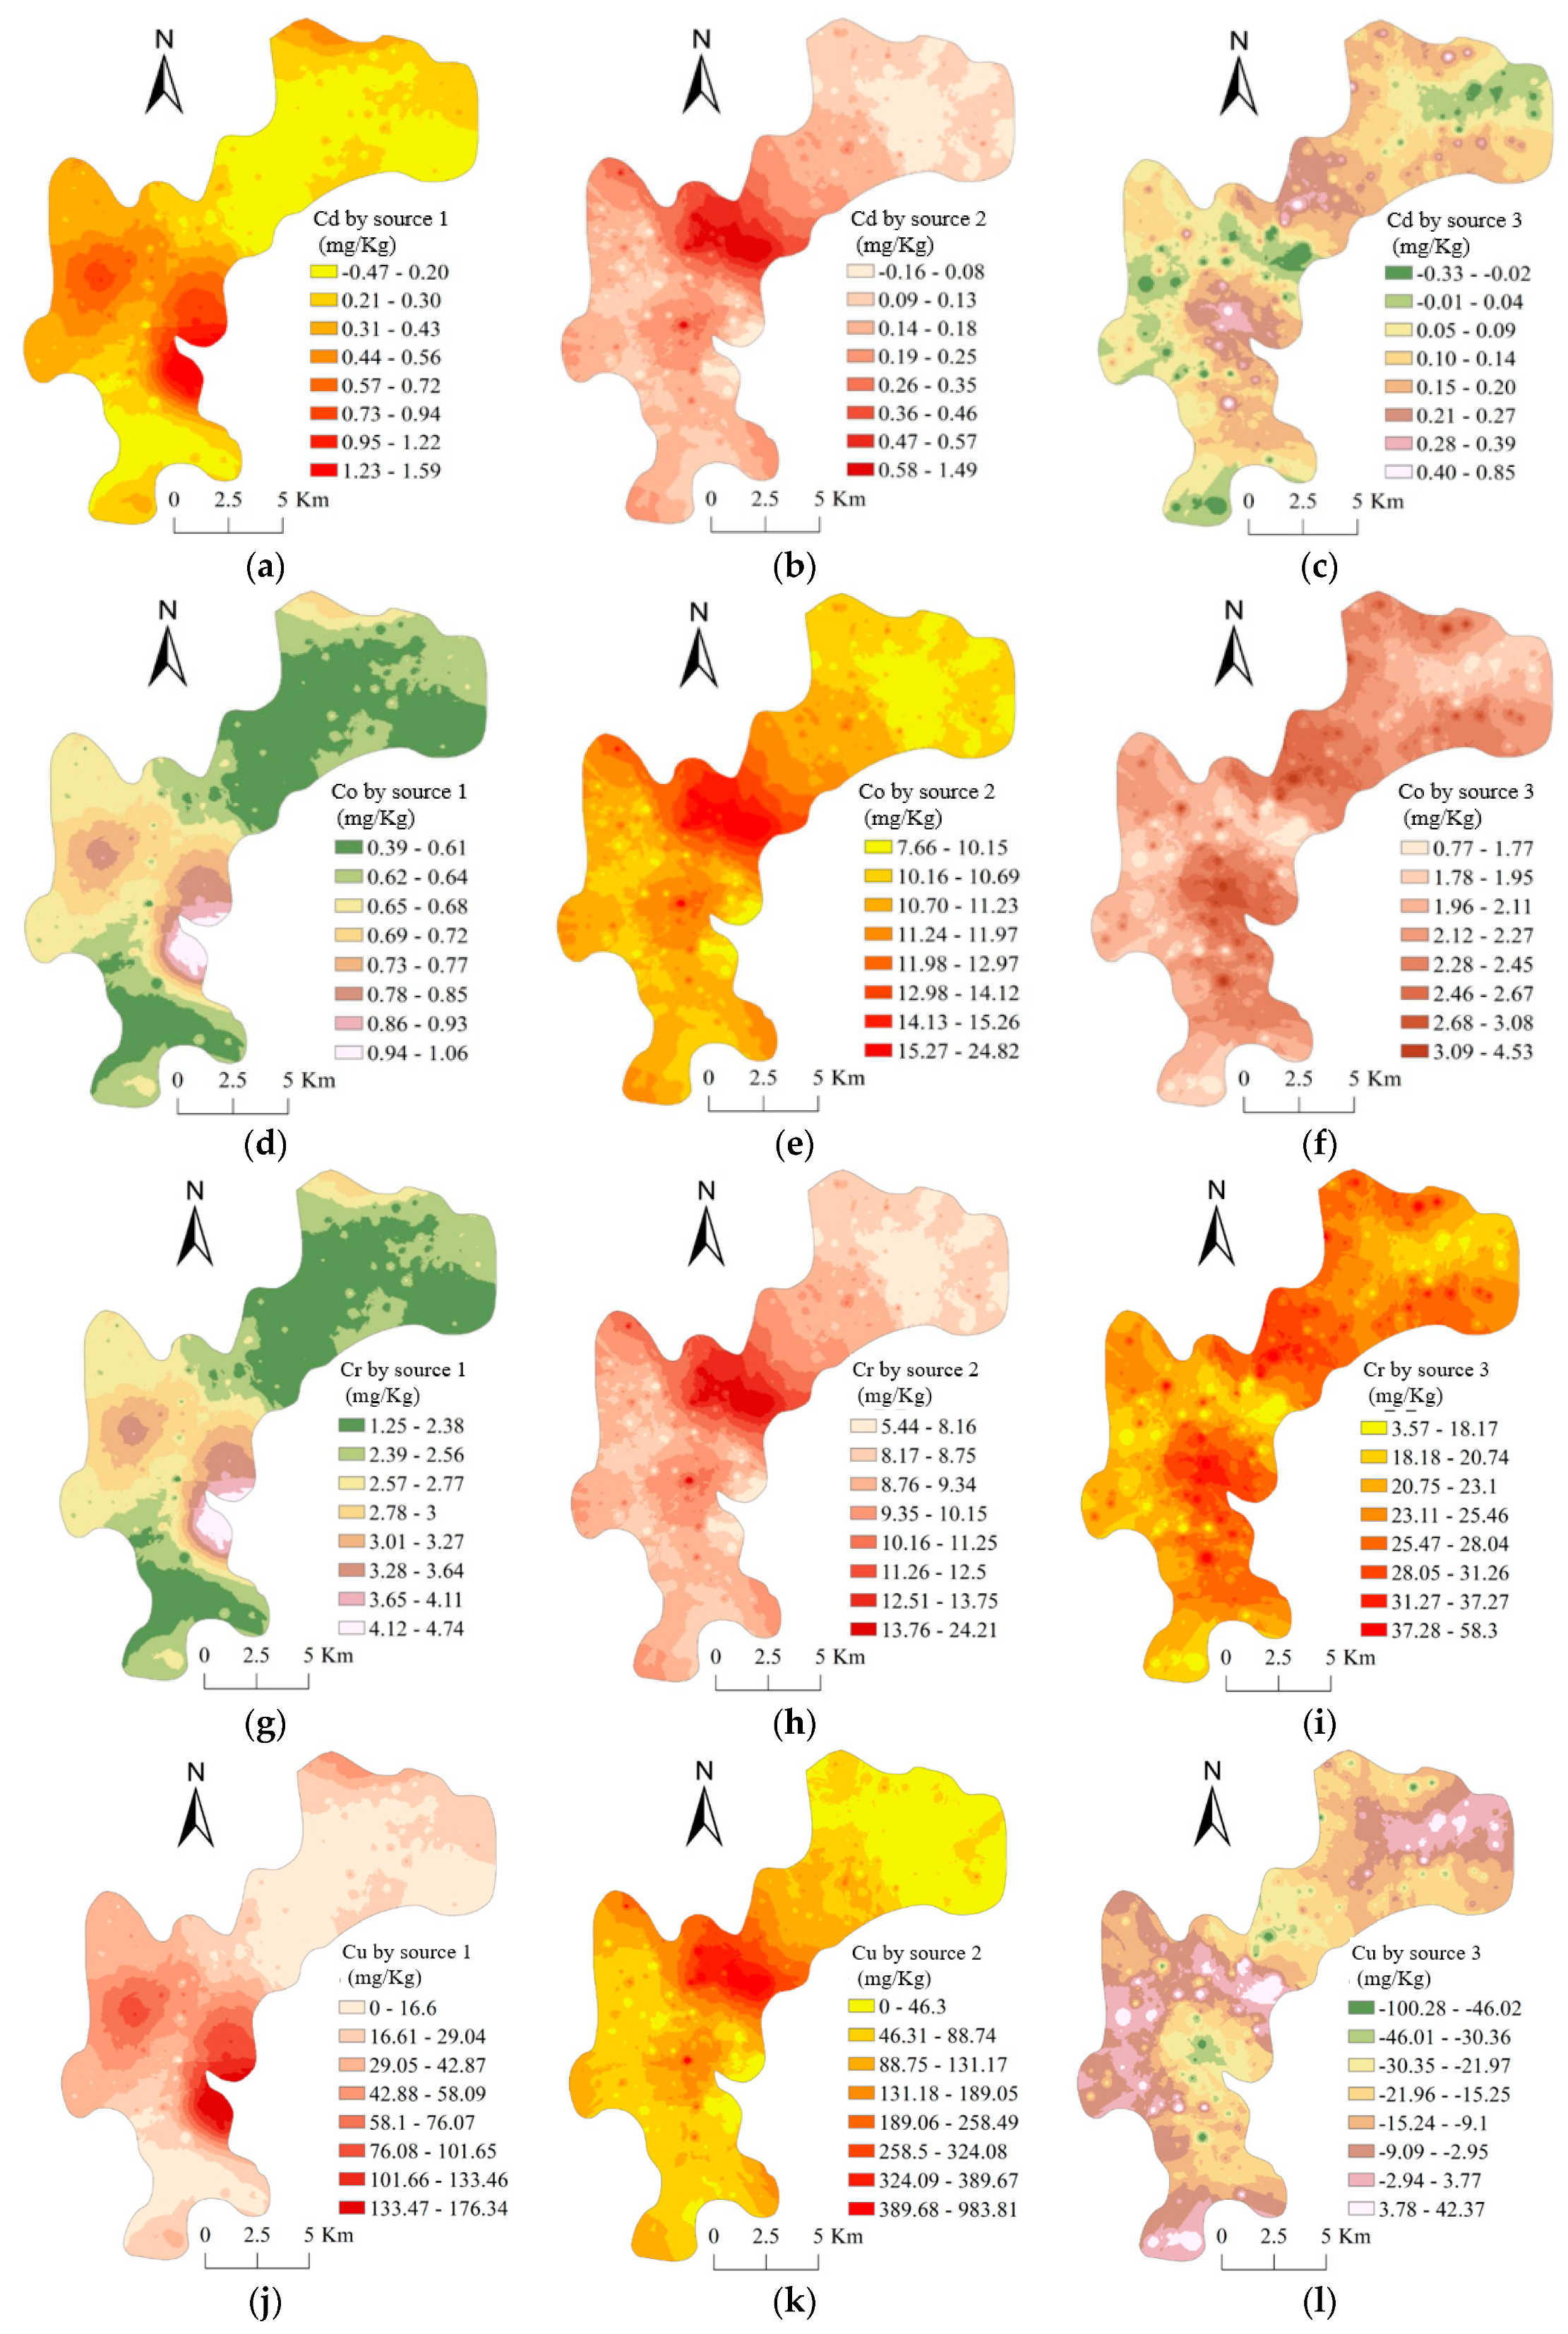
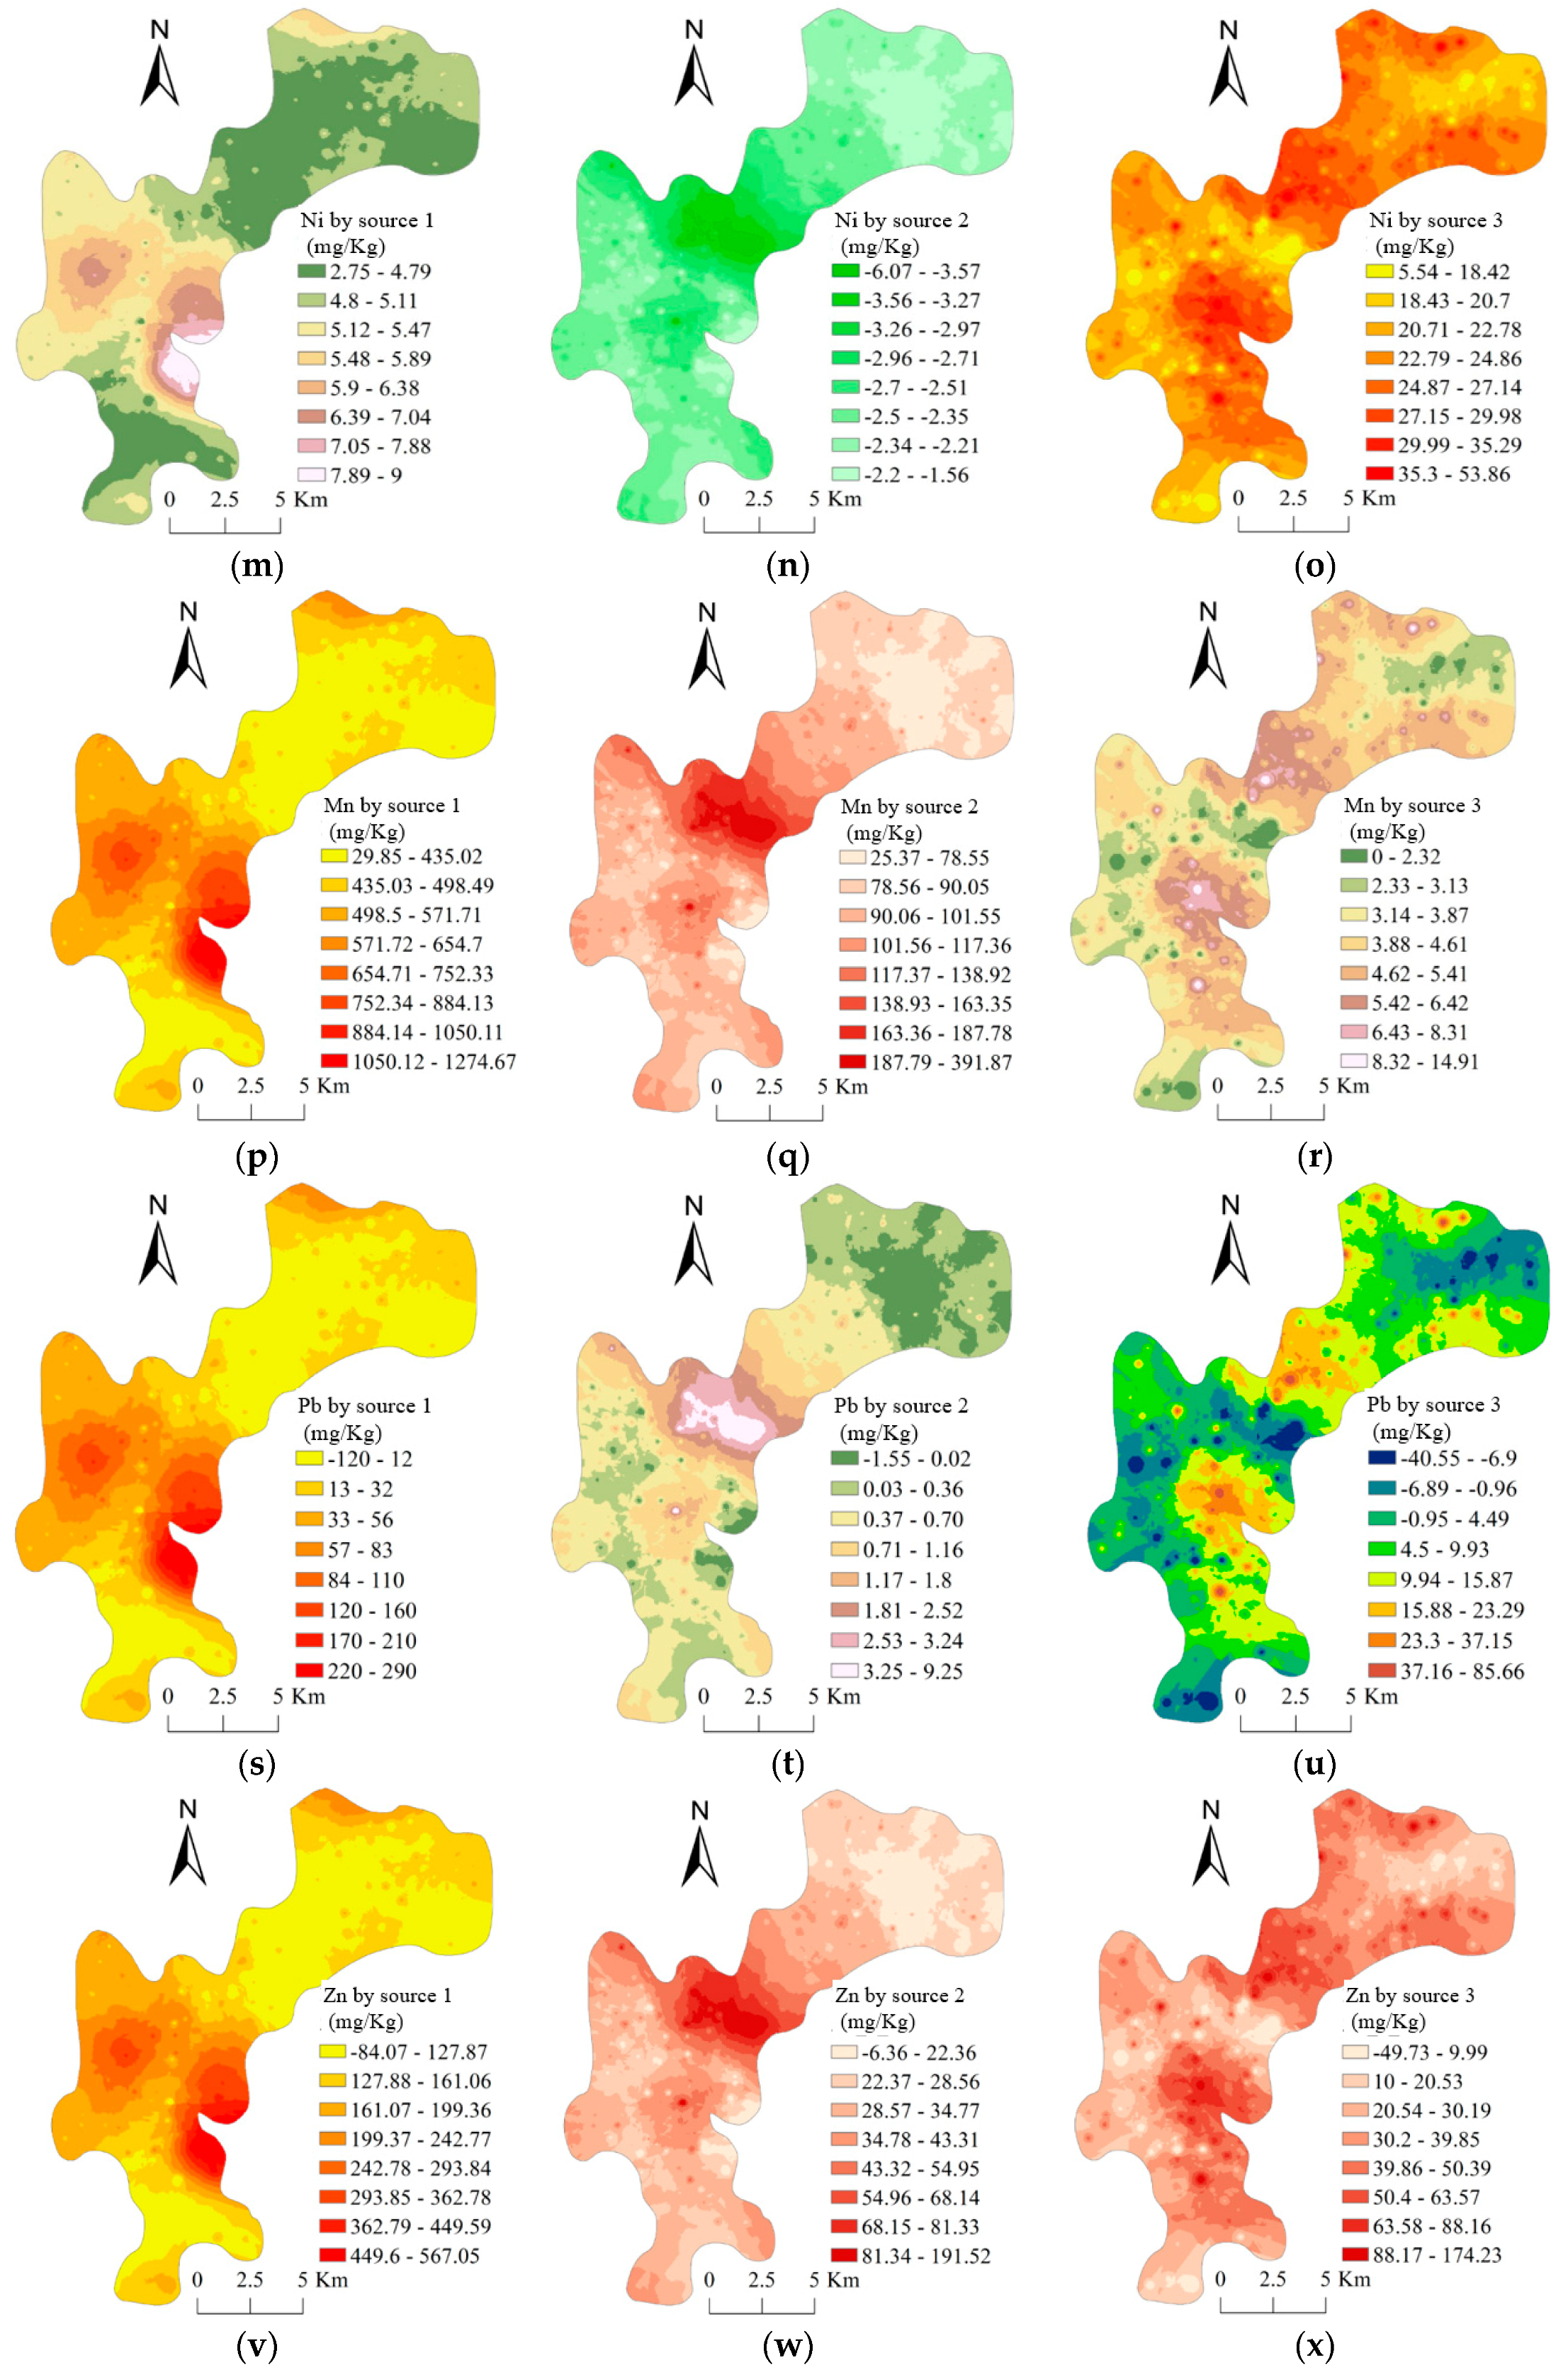
Figure 4 shows the spatial distributions of various heavy metal concentrations that resulted from the three major sources. Notably, in the results of the source apportionment based on APCS, the source contribution estimates are not constrained to be non-negative [26,37,38]. Thus, the negative values in the results of the APCS source apportionment, including the negative values in Figure 4, indicate relatively small contributions. Furthermore, the contributions from non-specified sources (the forth to eighth components in Table 6) were negligible because the estimated values of b 0 in Equation (5) were usually very small. Based on the percentage of individual heavy metals apportioned to each source (Table 7), the fraction of the contribution of each source to the total heavy metal concentration in soils was estimated (see the last line in Table 7).
According to the results in Table 7 and Figure 4, in Daye City, ES_M accounted for an average of 51.97%, 82.69%, 70.95%, and 69.83% of Cd, Mn, Pb, and Zn, respectively. The high contributions made by the ES_M source were located in the western and southeastern parts of the study area, where various kinds of mines and smelters are distributed. The ES_M source contributed 69.21% of the total soil heavy metals in the study area. Therefore, ES_M is the largest source of soil heavy metal pollution in Daye. On the other hand, ES_C accounted for an average of 79.65% and 83.4% of the Co and Cu, respectively. The hotspots of the contributions by ES_C are located in the western and central parts of the study area, which have a long history of copper mining and related smelting enterprises. This again indicates that the second greatest source of heavy metal pollution was directly related to the mining and smelting of copper.
Meanwhile, as is shown in Figure 4, the high contributions for all heavy metals by source 1 and source 2 were located in or around the mines and smelters (also refer to the spatial distributions of land cover in Figure 1). It is worth noting that there are the same spatial distribution patterns of contribution maps for all heavy metals from the same source. For example, Figure 4a,d,g,j,m,p,s,v shows spatial distributions of the various heavy metals’ concentrations contributed by ES_M. Those maps clearly point out three locations of ES_M sources (the north, west, and southeast parts of the study area) and four kinds of heavy metals mainly contributed by the ES_M source (Cd, Mn, Pb, and Zn). Similarly, Figure 4b,e,h,k,n,q,t,w indicates that ES_C is located in the center of the study area, and it is mainly responsible for the accumulations of Cu and Co. In addition, as is shown in Figure 4j, ES_M also contributed Cu to the soil. In addition, a part of Cd, Mn, and Zn in the soils were contributed by ES_C, as shown in Figure 4b,q,w; thus, the contribution maps of the identified sources of heavy metals might be a powerful tool to analyze the land covers that contaminate surrounding soils.

4. Conclusions

The present study identified the pollutant characteristics and sources of heavy metals in soils of Daye, China. It was based on a spatial distribution analysis, pollution assessment, and PCA/APCS methods. There are two main conclusions:
(1) The soils in Daye are seriously polluted by the heavy metals, Cd, Cu, Pb, and Zn. The mean concentrations of Cd, Cu, Pb, and Zn were higher than the corresponding background values, with the mean concentration of Cd being almost seven times more than the background value. The results of the correlation analysis showed that Cd, Mn, Pb, and Zn have a high significant positive relationship with each other. In addition, the correlation between Cu and Co was highly significant and positive. The I g e o results showed that the contamination levels ranged from no pollution (Co, Cr, Mn, and Ni) to moderate contamination (Cd, Cu, Pb, and Zn) and heavy contamination (Cd, Cu, and Pb). More than 90% of the study area was polluted by at least one kind of heavy metal, and the accumulation of Cd posed the most potential ecological risk among all kinds of heavy metals; and
(2) There were three main factors influencing the concentrations of soil heavy metals: ES_M, ES_C, and natural sources. Among these sources, ES_M was foremost, explaining 57.21% of the total variance. The APCS showed that 69.21% and 23.17% of the heavy metal concentrations were ascribed to ES_M and ES_C, respectively. Those sources were significantly related to the mines and smelters scattered in the study area.
Based on this study, we suggest a few steps to be taken to solve this serious polluted soil issue: (1) Soil remediation is urgently needed in Dye; (2) mines and smelters in the studied area should be controlled strictly to prevent further pollution of heavy metals in the soils; (3) the concentration of heavy metal in local agricultural products should be strictly detected before entering the market; and (4) local residents should avoid direct contact with soils in heavily polluted area as far as possible.

Author Contributions

Formal analysis, X.Y.; Investigation, Y.L.; Methodology, Y.Y.; Validation, X.T.; Visualization, X.Y.; Writing—original draft, L.H.; Writing—review & editing, L.H. and Y.Y.

Funding

This research was funded by the National Science Foundation of China (Grant No. 41671217, 41601280, and 41877001), and a project supported by the Fundamental Research Funds for the Central Universities (Grant No. 2662017PY038).

Conflicts of Interest

The authors declare no conflicts of interest.

References

  1. Guo, G.H.; Wu, F.C.; Xie, F.Z.; Zhang, R.Q. Spatial distribution and pollution assessment of heavy metals in urban soils from southwest China. J. Environ. Sci. 2012, 24, 410–418. [Google Scholar] [CrossRef] [Green Version]
  2. Chen, T.B.; Zheng, Y.M.; Lei, M.; Huang, Z.C.; Wu, H.T.; Chen, H.; Fan, K.K.; Yu, K.; Wu, X.; Tian, Q.Z. Assessment of heavy metal pollution in surface soils of urban parks in Beijing, China. Chemosphere 2005, 60, 542–551. [Google Scholar] [CrossRef] [PubMed]
  3. Wang, Q.Y.; Zhang, J.B.; Zhao, B.Z.; Xin, X.L.; Zhang, C.Z.; Zhang, H.L. The influence of long-term fertilization on cadmium (Cd) accumulation in soil and its uptake by crops. Environ. Sci. Pollut. Res. 2014, 21, 10377–10385. [Google Scholar] [CrossRef] [PubMed]
  4. Xiao, R.; Wang, S.; Li, R.; Wang, J.J.; Zhang, Z. Soil heavy metal contamination and health risks associated with artisanal gold mining in Tongguan, Shanxi, China. Ecotoxicol. Environ. Saf. 2017, 141, 17–24. [Google Scholar] [CrossRef] [PubMed]
  5. Dong, J.; Yang, Q.W.; Sun, L.N.; Zeng, Q.; Liu, S.J.; Pan, J.; Liu, X.L. Assessing the concentration and potential dietary risk of heavy metals in vegetables at a Pb/Zn mine site, China. Environ. Earth Sci. 2011, 64, 1317–1321. [Google Scholar] [CrossRef]
  6. Zhang, X.W.; Yang, L.S.; Li, Y.H.; Li, H.R.; Wang, W.Y.; Ye, B.X. Impacts of lead/zinc mining and smelting on the environment and human health in China. Environ. Monit. Assess. 2012, 184, 2261–2273. [Google Scholar] [CrossRef] [PubMed]
  7. Hu, R.Z.; Liu, J.M.; Zhai, M.G. Mineral Resources Science in China: A Roadmap to 2050; Science Press: Beijing, China, 2009. [Google Scholar]
  8. Liang, J.; Feng, C.; Zeng, G.; Gao, X.; Zhong, M.; Li, X.; Li, X.; He, X.; Fang, Y. Spatial distribution and source identification of heavy metals in surface soils in a typical coal mine city, Lianyuan, China. Environ. Pollut. 2017, 225, 681–690. [Google Scholar] [CrossRef] [PubMed]
  9. Wang, F.; Huang, Y.; Wang, X.; Gao, Z.; Yu, F.; Xu, F.; Bao, Q.; Hu, Y.; Qiao, M.; Jin, S.; et al. Ecological risk assessment of heavy metals in surrounding soils of tungsten ores: Comparison of different evaluation methods. Environ. Chem. 2015, 34, 225–233. (In Chinese) [Google Scholar]
  10. Xu, D.M.; Yan, B.; Chen, T.; Lei, C.; Lin, H.Z.; Xiao, X.M. Contaminant characteristics and environmental risk assessment of heavy metals in the paddy soils from lead (Pb)-zinc (Zn) mining areas in Guangdong Province, South China. Environ. Sci. Pollut. Res. 2017, 24, 24387–24399. [Google Scholar] [CrossRef] [PubMed]
  11. Chen, H.; Ouyang, J.; Ma, Z. Status quo of and countermeasures for Cd contamination of farmland in the vicinity of Daye smeltery. Soils 2003, 82, 76–79. (In Chinese) [Google Scholar]
  12. Song, Q.; Qi, S.; Zhang, B.; Chen, W.; Xia, L.; Wang, X.; Zhang, X.; Zhang, J. Distribution characteristics and pollution assessment of heavy metals in the soil around Tonglu mountain area in Daye. Environ. Chem. 2011, 30, 1672–1673. (In Chinese) [Google Scholar]
  13. Du, P.; Xie, Y.; Wang, S.; Zhao, H.; Zhang, Z.; Wu, B.; Li, F. Potential sources of and ecological risks from heavy metals in agricultural soils, Daye City, China. Environ. Sci. Pollut. Res. 2015, 22, 3498–3507. [Google Scholar] [CrossRef] [PubMed]
  14. Du, P.; Zhao, H.; Wang, S.; Zhang, Z.; Li, H.; Han, C.; Wu, B.; Li, F. Spatial distribution and assessment of Cadmium pollution in farmland soils, Daye City. Soils 2015, 45, 1028–1035. (In Chinese) [Google Scholar]
  15. Sun, Q.; Yin, C.; Deng, J.; Xiong, Q. Investigation on the heavy metal contamination of farmland soil and brassica campestris nearby mining areas in Daye City, China areas in Daye City, China. J. Agro-Environ. Sci. 2012, 31, 85–91. (In Chinese) [Google Scholar]
  16. Yang, J.; Ma, S.; Li, W. Heavy metal pollution of food and its influence on the health risk of the local population in Daye mining area. Environ. Sci. Technol. 2017, 40, 249–255. (In Chinese) [Google Scholar]
  17. Yang, Y.; Zhang, C.T.; Zhang, R.X. BME prediction of continuous geographical properties using auxiliary variables. Stoch. Environ. Res. Risk Assess. 2016, 30, 9–26. [Google Scholar] [CrossRef]
  18. Men, C.; Liu, R.; Xu, F.; Wang, Q.; Guo, L.; Shen, Z. Pollution characteristics, risk assessment, and source apportionment of heavy metals in road dust in Beijing, China. Sci. Total Environ. 2018, 612, 138–147. [Google Scholar] [CrossRef] [PubMed]
  19. Pathak, A.K.; Kumar, R.; Kumar, P.; Yadav, S. Sources apportionment and spatiotemporal changes in metal pollution in surface and sub-surface soils of a mixed type industrial area in India. J. Geochem. Explor. 2015, 159, 169–177. [Google Scholar] [CrossRef]
  20. Kusin, F.M.; Rahman, M.S.; Madzin, Z.; Jusop, S.; Mohamat-Yusuff, F.; Ariffin, M.; Ms, Z. The occurrence and potential ecological risk assessment of bauxite mine-impacted water and sediments in Kuantan, Pahang, Malaysia. Environ. Sci. Pollut. Res. 2016, 24, 1–16. [Google Scholar] [CrossRef] [PubMed]
  21. Mamat, Z.; Haximu, S.; Zhang, Z.Y.; Aji, R. An ecological risk assessment of heavy metal contamination in the surface sediments of Bosten Lake, northwest China. Environ. Sci. Pollut. Res. 2016, 23, 7255–7265. [Google Scholar] [CrossRef] [PubMed]
  22. Xu, Z.Q.; Ni, J.; Tuo, X.G.; Zhang, C.J. Calculation of heavy metals’ toxicity coefficient in the evaluation of potential ecological risk index. China Environ. Sci. Technol. 2008, 31, 112–115. (In Chinese) [Google Scholar]
  23. Thurston, G.D.; Spengler, J.D. A quantitative assessment of source contributions to inhalable particulate matter pollution in metropolitan Boston. Atmos. Environ. 1985, 19, 9–25. [Google Scholar] [CrossRef]
  24. Song, Y.; Xie, S.; Zhang, Y.; Zeng, L.; Salmon, L.G.; Zheng, M. Source apportionment of PM2.5 in Beijing using principal component analysis/absolute principal component scores and UNMIX. Sci. Total Environ. 2006, 327, 278–286. [Google Scholar] [CrossRef] [PubMed]
  25. Jain, S.; Sharma, S.K.; Choudhary, N.; Masiwal, R.; Saxena, M.; Sharma, A.; Mandal, T.K.; Gupta, A.; Gupta, N.C.; Sharma, C. Chemical characteristics and source apportionment of PM2.5 using PCA/APCS, UNMIX, and PMF at an urban site of Delhi, India. Environ. Sci. Pollut. Res. 2017, 24, 14637–14656. [Google Scholar] [CrossRef] [PubMed]
  26. Guo, H.; Wang, T.; Louie, P.K.K. Source apportionment of ambient non-methane hydrocarbons in Hong Kong: Application of a principal component analysis/absolute principal component scores (PCA/APCS) receptor model. Environ. Pollut. 2004, 129, 489–498. [Google Scholar] [CrossRef] [PubMed]
  27. Meng, L.; Zuo, R.; Wang, J.; Yang, J.; Teng, Y.; Zhai, Y.; Shi, R. Quantitative source apportionment of groundwater pollution based on PCA-APCS-MLR. China Environ. Sci. 2017, 37, 3773–3786. [Google Scholar]
  28. China National Environmental Monitoring Center (CNEMC). The Background Centrations of Soil Elements of China; China Environmental Science Press: Beijing, China, 1990. [Google Scholar]
  29. Tian, M.L.; Zhong, X.M.; Zhagn, Y.X.; Yu, Y.Y.; Pang, R.; Zhou, L.; Song, B. Concentrations and health risk assessments of heavy metal contents in soil and rice of mine contaminated areas. Environ. Sci. 2018, 39, 2919–2926. (In Chinese) [Google Scholar]
  30. Chu, B.B.; Luo, L.Q. Evaluation of heavy metal pollution in soils from nanjing qixiashang lead-zinc mines. Rock Miner. Anal. 2010, 29, 5–846. (In Chinese) [Google Scholar]
  31. Zhou, Y.; Chen, Q.; Deng, S.P.; Wan, J.Z.; Zhang, S.T.; Long, T.; Li, Q.; Lin, Y.S.; Wu, Y.J. Principal component analysis and ecological risk assessment of heavy metals in farmland soils around a Pb-Zn mine in southwestern china. Environ. Sci. 2018, 39, 2884–2893. (In Chinese) [Google Scholar]
  32. Chen, C.H.; Ni, S.J.; He, B.B.; Zhang, C.J. Heavy metals contamination of soils of in Dexing mine, Jiangxi province, China. Earth Environ. 2007, 35, 134–141. (In Chinese) [Google Scholar]
  33. Lu, S.J.; Wang, Y.Y.; He, L.H. Heavy metal pollution and ecological risk assessment of the paddy soils around a Pb-Zn mine in Huize country. Ecol. Environ. Sci. 2014, 23, 1832–1838. (In Chinese) [Google Scholar]
  34. Liu, D.L.; Wang, K.F.; Yang, Q.H.; Zhu, Q. Assessment and correlation analysis of heavy metals pollution in northeastern Guangdong Ag-Sb deposit. J. Northwest For. Univ. 2015, 30, 65–70. (In Chinese) [Google Scholar]
  35. Li, J.K.; Zhang, D.; Zhou, P.; Liu, Q.L. Assessment of Heavy Metal Pollution in Soil and Its Bioaccumulation by Dominant Plants in a Lead-Zinc Mining Area, Nanjing. Environ. Sci. 2018, 39, 3845–3853. (In Chinese) [Google Scholar]
  36. Xie, R.X.; Tian, D.L.; Fang, X. Assessment of Pollution of Heavy Metals on the Slag Wasteland of Xiangtan Manganese Mine. J. Cent. South. For. Univ. 2005, 25, 38–41. (In Chinese) [Google Scholar]
  37. Harrison, R.M.; Smith, D.J.T.; Luhana, L. Source apportionment of atmospheric polycyclic aromatic hydrocarbons collected from an urban location in Birmingham, U.K. Environ. Sci. Technol. 1996, 30, 825–832. [Google Scholar] [CrossRef]
  38. Miller, S.L.; Anderson, M.J.; Daly, E.P.; Milford, J.B. Source apportionment of exposures to volatile organic compounds. I. Evaluation of receptor models using simulated exposure data. Atmos. Environ. 2002, 36, 3629–3641. [Google Scholar] [CrossRef]
Figure 1. Map of soil sampling sites and land cover in main urban area of Daye.
Sustainability 10 03115 g001
Figure 2. Spatial distribution maps of (a) Cd, (b) Co, (c) Cr, (d) Cu, (e) Mn, (f) Ni, (g) Pb, and (h) Zn in the study area (the lines in the legends represent the corresponding background values of heavy metals in soils).
Sustainability 10 03115 g002aSustainability 10 03115 g002b
Figure 3. (a) Geoaccumulation index ( I g e o ) of each heavy metal in regional soils, (b) levels of E i , and (c) the spatial distribution and levels of the RI.
Sustainability 10 03115 g003aSustainability 10 03115 g003b
Figure 4. Contribution maps of the major sources of soil heavy metals: (a) Cd by source 1; (b) Cd by source 2; (c) Cd by source 3; (d) Co by source 1; (e) Co by source 2; (f) Co by source 3; (g) Cr by source 1; (h) Cr by source 2; (i) Cr by source 3; (j) Cu by source 1; (k) Cu by source 2; (l) Cu by source 3; (m) Ni by source 1; (n) Ni by source 2; (o) Ni by source 3; (p) Mn by source 1; (q) Mn by source 2; (r) Mn by source 3; (s) Pb by source 1; (t) Pb by source 2; (u) Pb by source 3; (v) Zn by source 1; (w) Zn by source 2; and (x) Zn by source 3. Source 1: ES_M; Source 2: ES_C; Source 3: Natural sources.
Sustainability 10 03115 g004aSustainability 10 03115 g004b
Table 1. Criteria of the potential ecological risk hazard for E i or the ecological risk index (RI).
Values   of   E i   GradesValues of the RIGrades
E i   < 40Low   RI < 150 Low
  40 E i < 80 Moderate   150 RI < 300 Moderate
  80 E i < 160 High   300 RI < 600 High
  160 E i < 320 Serious   RI 600 Serious
  E i 320 Severe//
Table 2. Descriptive statistics of the heavy metals in the soils of the study area (mg/kg).
Heavy MetalMinMaxMeanMedianSDCVBGVPbB
Cd0.0334.631.140.473.132.750.1776.06%
Co5.1376.8914.6513.796.000.4115.4030.52%
Cr8.62117.0235.5433.9614.600.4186.000.94%
Cu9.372056.64175.4565.69330.181.8830.7085.45%
Mn115.642173.26672.26572.71358.200.53712.0033.80%
Ni3.8283.2828.1426.6510.830.3837.3013.15%
Pb0.103906.67102.7728.25335.593.2726.7052.20%
Zn48.912578.65256.73191.00234.180.9183.6098.12%
SD: Standard deviation; CV: Coefficient of variation; BGV: Background values at the provincial level from the report, “The Background Concentrations of Soil Elements of China” [28]. PbB: Percentage of sampling points above the BGV.
Table 3. Heavy metal concentrations in soils from different mines in China (mg/kg).
AreaMine TypeReferenceCdCoCrCuMnNiPbZn
Daye, Hubei provinceA variety of nonferrous metals 1.1414.6535.54175.45672.2628.14102.77256.73
Nandan, Guangxi provinceLead-ZincTian et al. 20181.77//57.5 108312
Qixiashang of NanjingLead-ZincChu et al. 201017.56/90.0201.83 3128.872873.49
lanping county, Yunnan provinceLead-ZincZhou et al. 201815.56/33.426.1/14.3419.4933.4
Dexing, Jiangxi provinceCopper, coalChen et al. 20070.275 /73.00 60.00 //51.00 112.00
Huize Country, Yunnan provinceLead-ZincLu et al. 20142.30 /95.60 23.50 //218.60 337.80
Meizhou, Guangdong provinceAg-SbLiu et al. 20151.11/178.8235.34 /92.85/130.84
Lianyuan, Hunan provincecoalJie et al. 20170.59/93.0333.26552.5/37.82107.24
Nanjing provinceLead-ZincLi et al. 201845.71 /92.92 216.46 14,015.3/2232.16 5201.86
Guangdong provinceLead-ZincXu et al. 20177.04/30.9157.80 358.7720.251093.03867.08
Xiangtan, Hunan provinceManganeseXie et al. 200513.15 95.80 8853.2191.331211.29685.36
/: Not available.
Table 4. Pearson’s correlation matrix for the heavy metals in soils based on sampling points.
CdCoCrCuMnNiPbZn
Cd1
Co0.041
Cr0.17 *0.18 *1
Cu0.28 **0.62 **0.2 **1
Mn0.43 **0.32 **0.2 **0.32 **1
Ni0.15 *0.26 **0.51 **0.060.24 **1
Pb0.86 **–0.060.090.14 *0.52 **0.131
Zn0.8 **0.19 **0.25 **0.4 **0.65 **0.3 **0.9 **1
** p < 0.01 (2-tailed), * p < 0.05 (2-tailed).
Table 5. Results of cross-validation using the spatial interpolation method.
ElementCdCoCrCuMnNiPbZn
r0.75 *0.98 *0.98 *0.89 *0.83 *0.99 *0.86 *0.85 *
MAE (mg/kg)0.210.672.1428.38102.621.2913.0332.62
ER (%)18.424.576.0216.1815.264.5812.6812.71
* Correlation is significant at the 0.01 level; MAE: Mean absolute error; ER: Error rate.
Table 6. Principal component analysis (PCA) results for the heavy metal concentrations (mg/kg) in the study area.
ComponentInitial EigenvaluesExtraction Sums of Squared LoadingsRotation Sums of Squared Loadings
Total% of VarianceCumulative %Total% of VarianceCumulative %Total% of VarianceCumulative %
14.5857.2157.214.5857.2157.213.1238.9838.98
21.2515.6872.891.2515.6872.892.0625.7464.72
31.1514.3287.211.1514.3287.211.8022.5087.21
40.334.0991.31
50.303.7295.02
60.222.8097.82
70.111.4299.24
80.060.77100.00
MetalComponent MatrixRotated Component MatrixComponent Scores Matrix
PC1PC2PC3PC1PC2PC3PC1PC2PC3
Cd0.950.02−0.040.740.470.360.180.100.05
Co0.650.540.400.130.890.24−0.190.530.06
Cr0.70−0.200.570.210.400.81−0.170.130.50
Cu0.630.670.080.300.87−0.07−0.040.52−0.21
Mn0.78−0.04−0.440.870.200.040.37−0.08−0.18
Ni0.50−0.630.480.21−0.080.91−0.08−0.200.63
Pb0.81−0.25−0.410.930.060.210.40−0.20−0.06
Zn0.92−0.11−0.240.870.290.290.30−0.04−0.01
Note: Factor loading values > 0.50 are in bold.
Table 7. Estimated average source contributions (%) of heavy metals.
Heavy MetalES_MES_CNatural SourcesR2
Cd51.9728.4519.580.94
Co4.6979.6515.670.99
Cr7.3125.8966.800.99
Cu45.9983.40−29.390.94
Mn82.6916.630.710.99
Ni19.89−9.5689.670.99
Pb70.952.3326.730.94
Zn69.8314.8615.310.98
Total69.2123.177.62
ES_M: Mineral exploitation and smelting involving a variety of minerals; ES_C: Mining exploitation and smelting of copper ore.

