Article

Identifying the Relationship between Soil Properties and Rice Growth for Improving Consolidated Land in the Yangtze River Delta, China

1
School of Environment Science and Spatial Informatics, China University of Mining and Technology, Xuzhou 221043, China
2
Low Carbon Energy Institute, China University of Mining and Technology, Xuzhou 221008, China
3
AMAP, INRA, CNRS, IRD, Cirad, University of Montpellier, Boulevard de la Lironde, CEDEX 5, 34398 Montpellier, France
*
Authors to whom correspondence should be addressed.
Sustainability 2018, 10(9), 3072; https://doi.org/10.3390/su10093072
Submission received: 1 August 2018 / Revised: 26 August 2018 / Accepted: 27 August 2018 / Published: 29 August 2018

Abstract

:
China has widely implemented land consolidation, which was expected to increase the amount of cultivated land and enhance grain yields. Key components of land consolidation include filling mall waterbodies and leveling land, both of which have strong impacts on the environment in the Yangtze River Delta. The impacts of land consolidation on soil ecology and agricultural production are not yet clear. Here, we conducted a field survey of soil properties and rice growth to detect the effects of land consolidation in the first growing season. The normalized difference vegetation index (NDVI) was used to analyze the remote sensing data. We found significant differences in the soil properties under different types of land leveling, with a general NDVI pattern of: control > borrowed topsoil area > filled waterbodies area > topsoil cutting area. We found significant heterogeneity in rice NDVI after land consolidation. The NDVI of rice had extremely significant positive correlations with soil organic matter and available zinc. The spatial variation in soil properties caused by land consolidation was a dominant factor leading to the heterogeneity of rice NDVI. Fertilizing soil and strengthening field management should be adopted to provide more ecological services while increasing quantity.

1. Introduction

Land consolidation is a valuable tool for land-use management in many countries, such as for example China and Iran in Asia [1,2], Poland and Spain in Europe [3,4], and others [5,6]. China’s land consolidation programs started in 2000, and were initially intended to increase cultivated land area and grain-yield capacity [7,8]. Chinese has invested about 300,000 million CNY in land consolidation in the past 10 years [1], accumulating 30 million hectares of consolidated farmland, and making substantial contributions to farmland protection and grain security [1,9,10]. As a result of a growing population and limited farmland in China, land consolidation has overemphasized the increase of farmland quantity and grain yield capacity for a long time [8,11], resulting in managers paying little attention to the negative effects of land consolidation. As the economy improves in China, more attention has turned to ecological security and environmental protection [1,12,13]. Land consolidation may now emphasize not only farmland quantity and grain yield, but also ecosystem services [12,13]. Farmland not only produces grain, it also serves as a multifunctional provider of ecological services, such as water conservation, air purification, and rural tourism. Therefore, land consolidation in the future should consider environmental sustainability [5,14]. Land consolidation is a complex process [15] that can optimize agricultural production [16,17,18] and maintain rural landscapes [19], but it can also disrupt the previous farmland ecology [20]. In particular, land leveling inevitably interferes with soil nutrient cycling and soil microbial environments [20,21], and the filling of small waterbodies and cutting of the topsoil can influence crop growth.
Previous studies have focused on the large-scale impacts of land consolidation [10,22,23], such as the increase in efficiency of the land and water resources [7], the changes in the agricultural landscape structure [4,19], the improvement of land-tenure transfers [24], and the promotion of rural sustainability [2,25,26]. However, current studies have started to focus on the environmental effects of land consolidation [27]. On a national scale, some scholars have started to examine the socioeconomic effects of land consolidation [10,11,28], and called for strengthening ecological rehabilitation as a part of land consolidation [27,29,30,31]. The impacts of land consolidation on the agricultural landscape are also being examined at the level of individual projects [19,32], with suggestions for how to reduce soil erosion and improve farmland microclimates [33,34].
Land consolidation has had adverse effects on soil properties in the short-term [20,21,30], as shown by changes in the normalized difference vegetation index (NDVI), which is a measure that is used to monitor farmland changes and identify high-value farmland [35]. Land leveling generally causes a spatial imbalance of soil physicochemical properties [29,31], although the imbalance gradually decreases over time [20,36]. Sometimes, land consolidation increases the heterogeneity of soil nutrients and causes spatial variation in soil pH, salinity, and the nutrients N, P, and K [21,27], which negatively affects farmland quality and thus the farmland ecosystem.
In China, the initial driver of land consolidation was to add new arable land and improve grain yield capacity for food security [7,8,9,23]. After 2011, the focus shifted toward comprehensive land consolidation for integrate rural and urban development [10,25]. National priorities now include increasing new farmland [8], investment efficiency [25,28], productivity potential [4,6,37], rural revitalization [10], and institutional design [23,38,39]. Few studies have focused on the micro-environmental effects of land remediation on soils. Nor have studies performed spatial correlations between land consolidation and soil health. For example, knowledge is lacking about the spatial variations of soil nutrients caused by different land-leveling patterns, which is particularly important for managing farmlands and growing crops after land consolidation.
Recently, land consolidation has been fully carried out in Yangtze River Delta, which is China’s most developed economic area. As a result of its extensive natural system of waterbodies and resulting land fragmentation [40], the development of modern agriculture has been severely restricted [4,16,40,41]. Furthermore, the lack of soil resources requires that a large amount of soil be introduced (so-called “borrowed soil”) when land is leveled, small waterbodies are filled, or topsoil is cut, all of which cause huge disturbances to the soil environment. We used remote sensing techniques and field investigations to monitor rice growth and soil properties in areas subjected to the following common land-consolidation treatments: (1) filled waterbodies; (2) topsoil cutting; and (3) borrowed topsoil. We also monitored a control area in the first growing season after land consolidation. The aim of this study is to explore the effects of land consolidation on rice growth and soil fertility in order to understand how to improve ecological management after land consolidation.

2. Materials and Methods
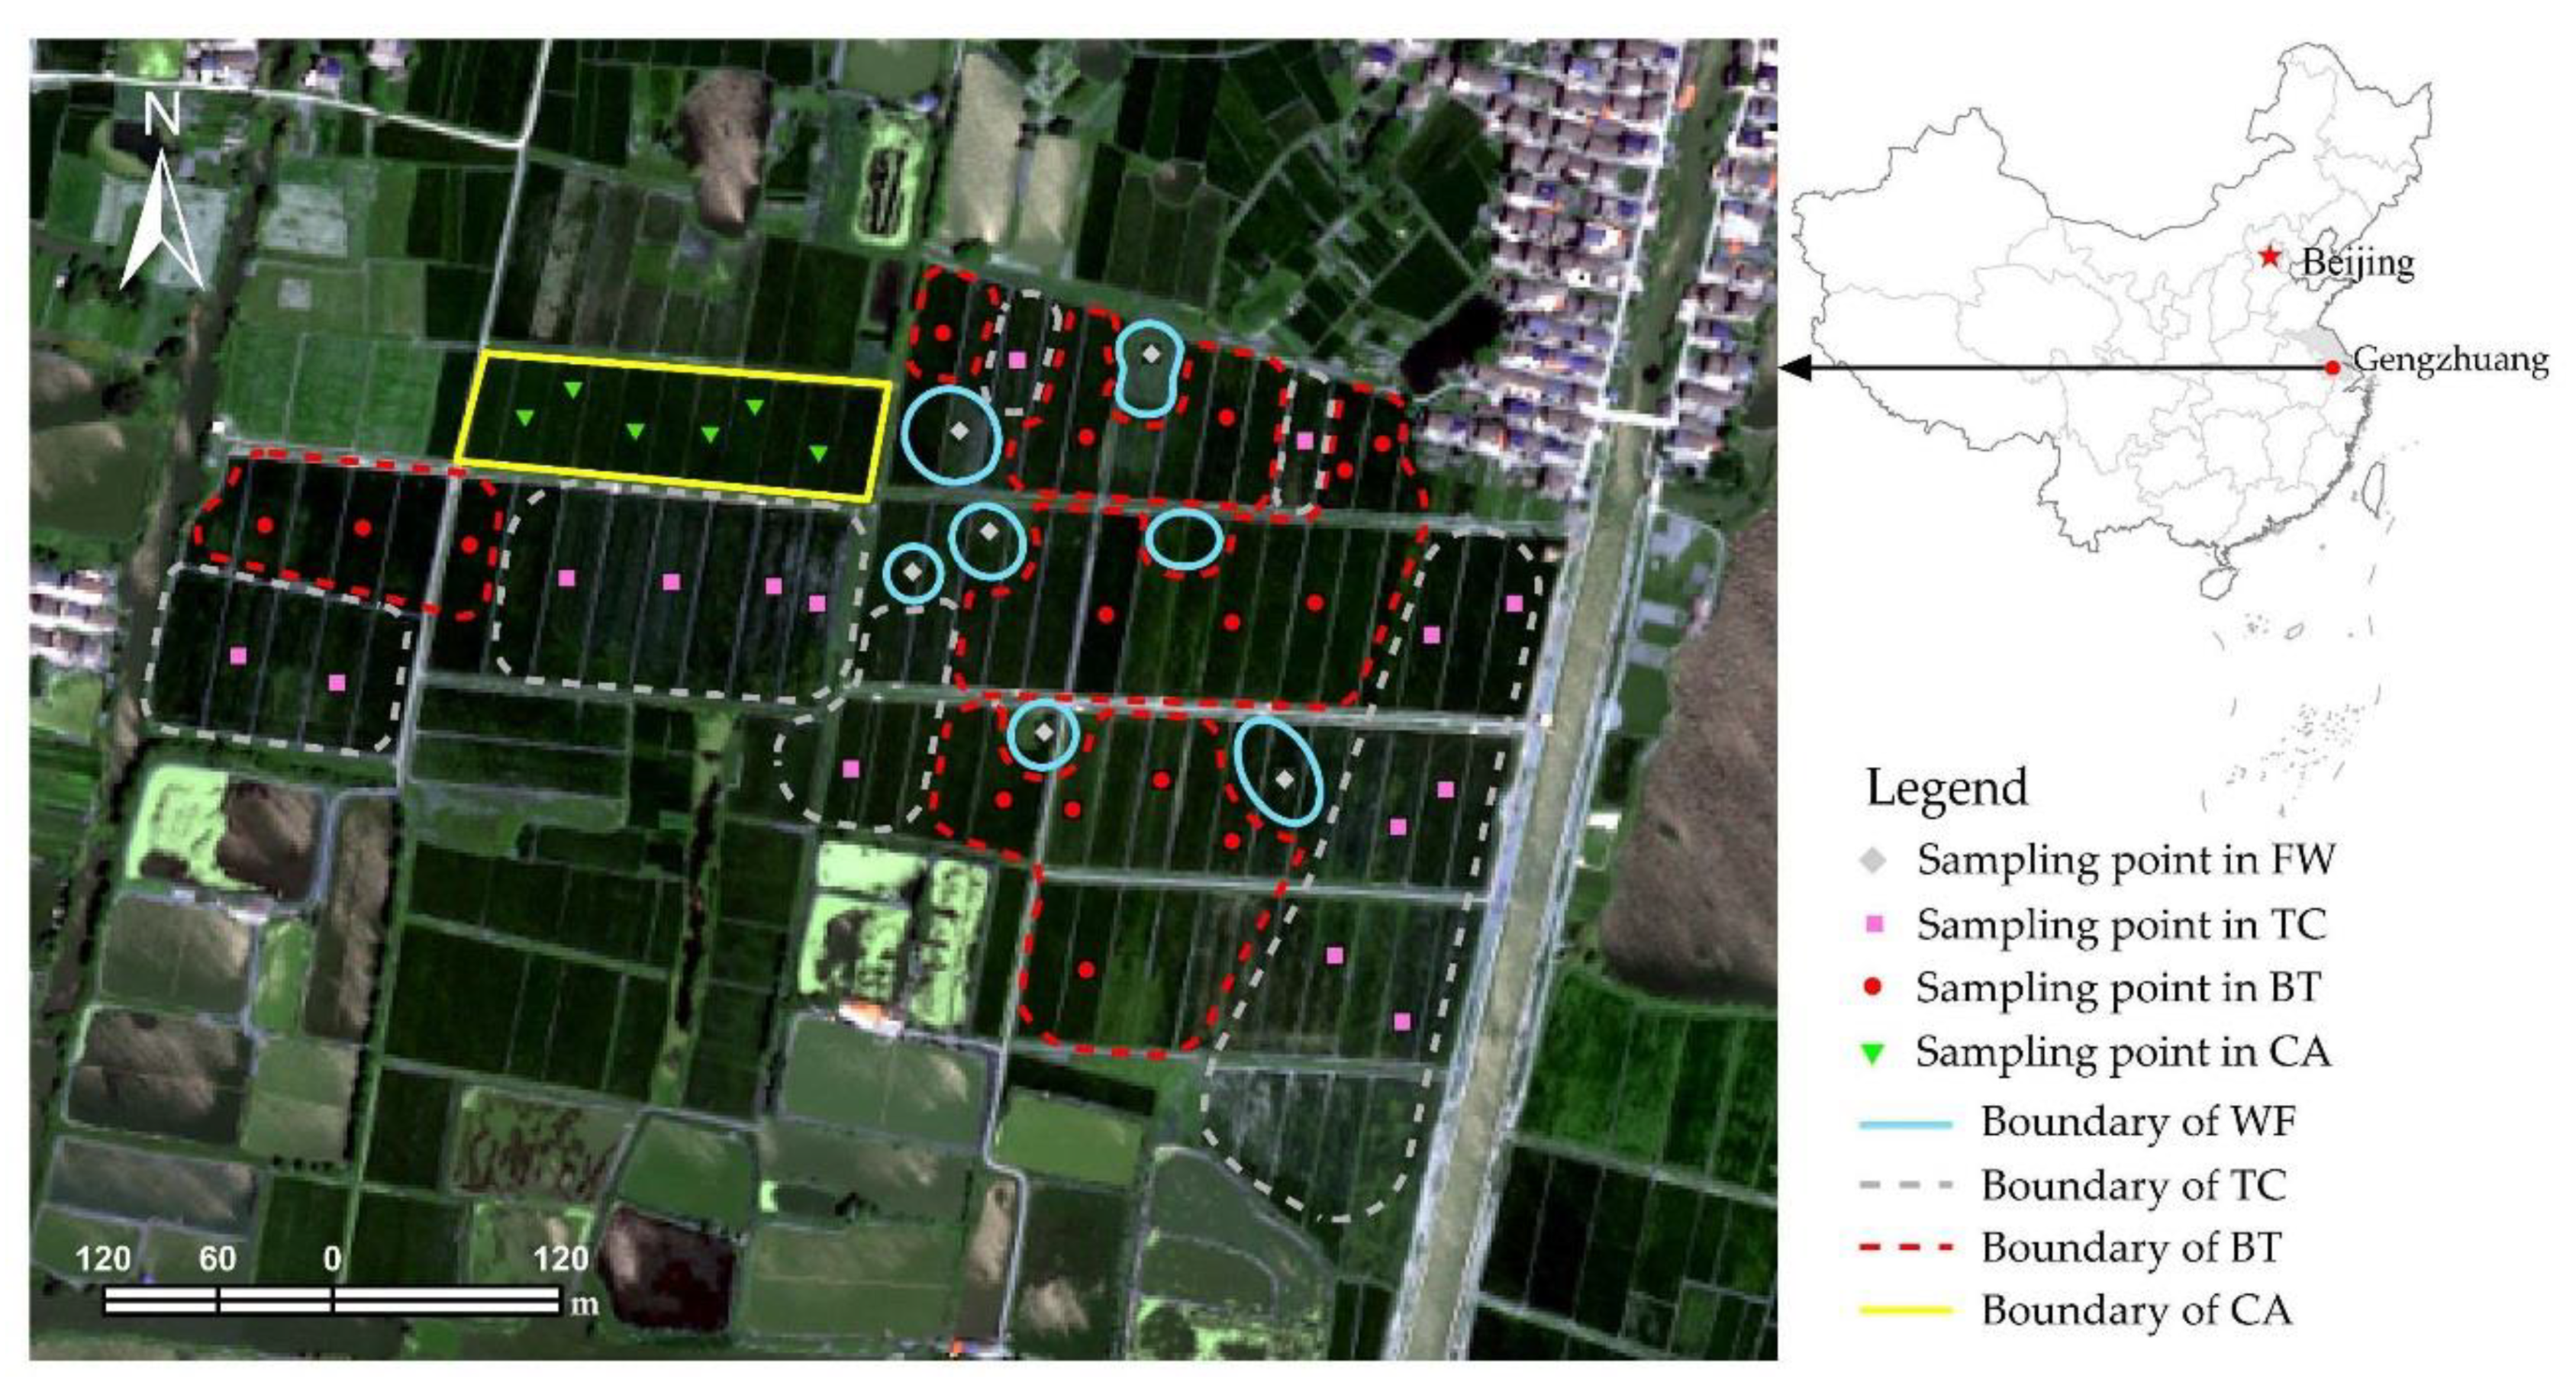
2.1. The Study Area

Gengzhuang Village in Zhixi Town, Changzhou City was selected to study the disturbances of land consolidation on soil properties and rice growth (Figure 1). It located between 31°34′–31°35′ E and 119°19′–119°21′ N. It has a subtropical monsoon climate with annual precipitation of 1063.5 mm, a long frost-free period, and an average annual temperature of 15.3 °C. The rivers and ponds are densely covered, which is typical of Yangtze River Delta. This study area is raining season in summer, with two crops each year, which is mainly a rice–wheat rotation. Between January–May 2017, land leveling and a water conservancy project were completed, and then farmed by big plantation owners, with unified management.

2.2. Soil Sampling and Analysis

Soil sampling was collected on 1 September 2017, about four months after the land was leveled. The boundaries of each treatment area (filled waterbodies (FW), borrowed topsoil (BT), topsoil-cutting (TC), and a control area (CA)) were determined using engineering maps, remote sensing images, and field investigations. We collected six samples of FW, 15 samples of TC, 16 samples of BT, and six samples of CA (Figure 1). Soil samples—five pooled samples selected randomly from each plot [42] of (0–20 cm depth)—were collected for each of the four soil treatment categories. Coordinates were taken with a handheld Global Positioning System (GPS) (Qmini A5/A7, Hi-target, Shenzhen, China).
Soil samples were dried at room temperature for about one week, and then sieved through a 0.25-mm sieve for physicochemical analysis [42]. We chose to test soil properties that are known to affect rice growth, such as soil texture, pH, soil organic matter (SOM) content, total N (TN) [43], available P (AP), available K (AK) [44], available Zn (AZn), and available Si (ASi). Soil texture was measured using a particle size analyzer (BT-9300Z, Baxter, Dandong, China). Soil pH was measured by the potentiometric method (water:soil ratio of 1:2.5) [42]. SOM was determined using the potassium dichromate oxidation outer heating method [45]. TN was determined using the semi-micro Kjeldahl method [46]. Soil AP was determined using the hydrochloric acid ammonium chloride method [47]. Soil AK was determined by caries by ammonium acetate extraction-flame photometry [46] (FP640, Jingke, Shanghai, China). Soil AZn was determined using diethylene triamine pentacetate acid (DTPA) extraction atomic absorption spectrophotometry [48] (TAS-990, PGENERAL, Beijing, China). Soil ASi was determined using the citric acid buffered leaching silicon molybdenum blue colorimetric method [46].

2.3. Interpretation and Processing of Remote Sensing Data

Three GeoEye images (Earth Eye Satellite, Inc., Dulles, VA, USA) were purchased for 31 December 2016, 6 April 2017, and 23 August 2017, respectively representing before, during, and after land consolidation (Figure 2). The spatial resolution is 1.65 m [49]. We trimmed the three-phase images, and processed them with the conventional methods (geometric correction, atmospheric correction, radiation correction, and other pretreatment) [49,50]. Remote sensing is widely used in agricultural monitoring [43,51,52,53,54,55,56,57,58,59]. The selected measure, NDVI, is sensitive to surface cover, and thus reflects the growth status and coverage of rice [52,53,54,59,60,61]. We used ENVI 5.0 software to process the GeoEye images, and combined engineering drawings of the field areas to extract the NDVI value of each field. NDVI is the difference between the values of the near-infrared and visible-infrared bands divided by the sum of the two bands and its ratio range is [−1, 1] [61]. The formula is as follows:
NDVI = ( D N N I R D N R ) ( D N N I R + D N R )
Spatial clustering analysis can identify the characteristics of rice growth. Spatial clustering analysis was based on NDVI values [60]. We calculated the Local Moran’s I index associated with the NDVI values of each pixel [62,63,64,65,66] using the following formula:
I i = n ( X i X ¯ ) i = 1 n ( X i X ¯ ) 2 j i n W i j ( X j X ¯ )
In Equation (2), X i and X j are the NDVI values of the i and j pixels, respectively. X ¯ is the average of all of the fields’ NDVI values, n is the total number of pixels, and W i j is the spatial weight between the i and j of the pixel. An I i > 0 indicates that the picture element has neighboring pixels containing NDVI values that are equally high or equally low, and thus, the picture element belongs to a high-value or low-value cluster. If I i is <0, it indicates that the picture element has neighboring pixels containing different NDVI values, and thus the picture element is an abnormal value. By setting the confidence interval to 95%, all of the pixels can be distinguished from statistically significant high–high (HH) clusters, low–low (LL) clusters, which are outliers whose high values are mainly surrounded by low–high (HL) outliers, and high–low (LH) outliers whose low values are mainly surrounded by high values. As one example, if a treatment area had a low value in the LL cluster of a high–low outlier (LH) region that was surrounded by high values that were significantly lower than the values of the other treatment types, it would indicate that this treatment area was less conducive to crop growth.
The NDVI value of rice was affected by many factors. Stepwise regression analysis can continuously enter each factor into the regression equation and screen out the key factors. The mathematical model of stepwise regression is:
y = a 0 + a 1 x 1 + a 2 x 2 + + a n x n + B
In Equation (3), “ a ” is the unknown parameter in the model, and “ B ” is the random error.
Statistical analyses of experimental data were performed using SPSS 20.0 (IBM, New York, NY, USA) for the Tukey–Kramer method on the NDVI values and soil properties to determine whether different land-consolidation treatments differed significantly from the control. Correlation analysis was used to determine the relationship between NDVI values and each property in the soil, and line regression analysis was used to determine the relationship between NDVI values and SOM, AZn. Mapping was done using ArcGIS 10.2 (ESRI, San Diego, CA, USA) and Origin 9.0 (Origin Lab, Northampton, MA, USA) software.

3. Results

3.1. Short-Term Interference of Land Consolidation on Soil Properties

In addition to AP, the soil texture, pH, SOM, TN, AK, AZn, and ASi in land-leveling treatments differed significantly from CA (Table 1). Soil clay and silt content in land-consolidation treatments was higher than in CA, and soil viscosity was also higher in the land-consolidation treatments. Land leveling had little effect on the soil surface pH in TC and BT, but in FW, the pH was significantly lower (p < 0.05). In the land-leveling treatments, the content of SOM, TN, AK, and AZn were generally lower, with the following trend by treatment type (highest to lowest): CA > BT > FW > TC. The difference in ASi content was opposite; the ASi content in TC was 327.35 mg kg−1, which was significantly higher than all of the other treatments. Land consolidation had little effect on AP, with no significant change. In summary, land leveling had a significant influence on soil physicochemical properties, and the impact of BT was smaller than that of FW or TC.

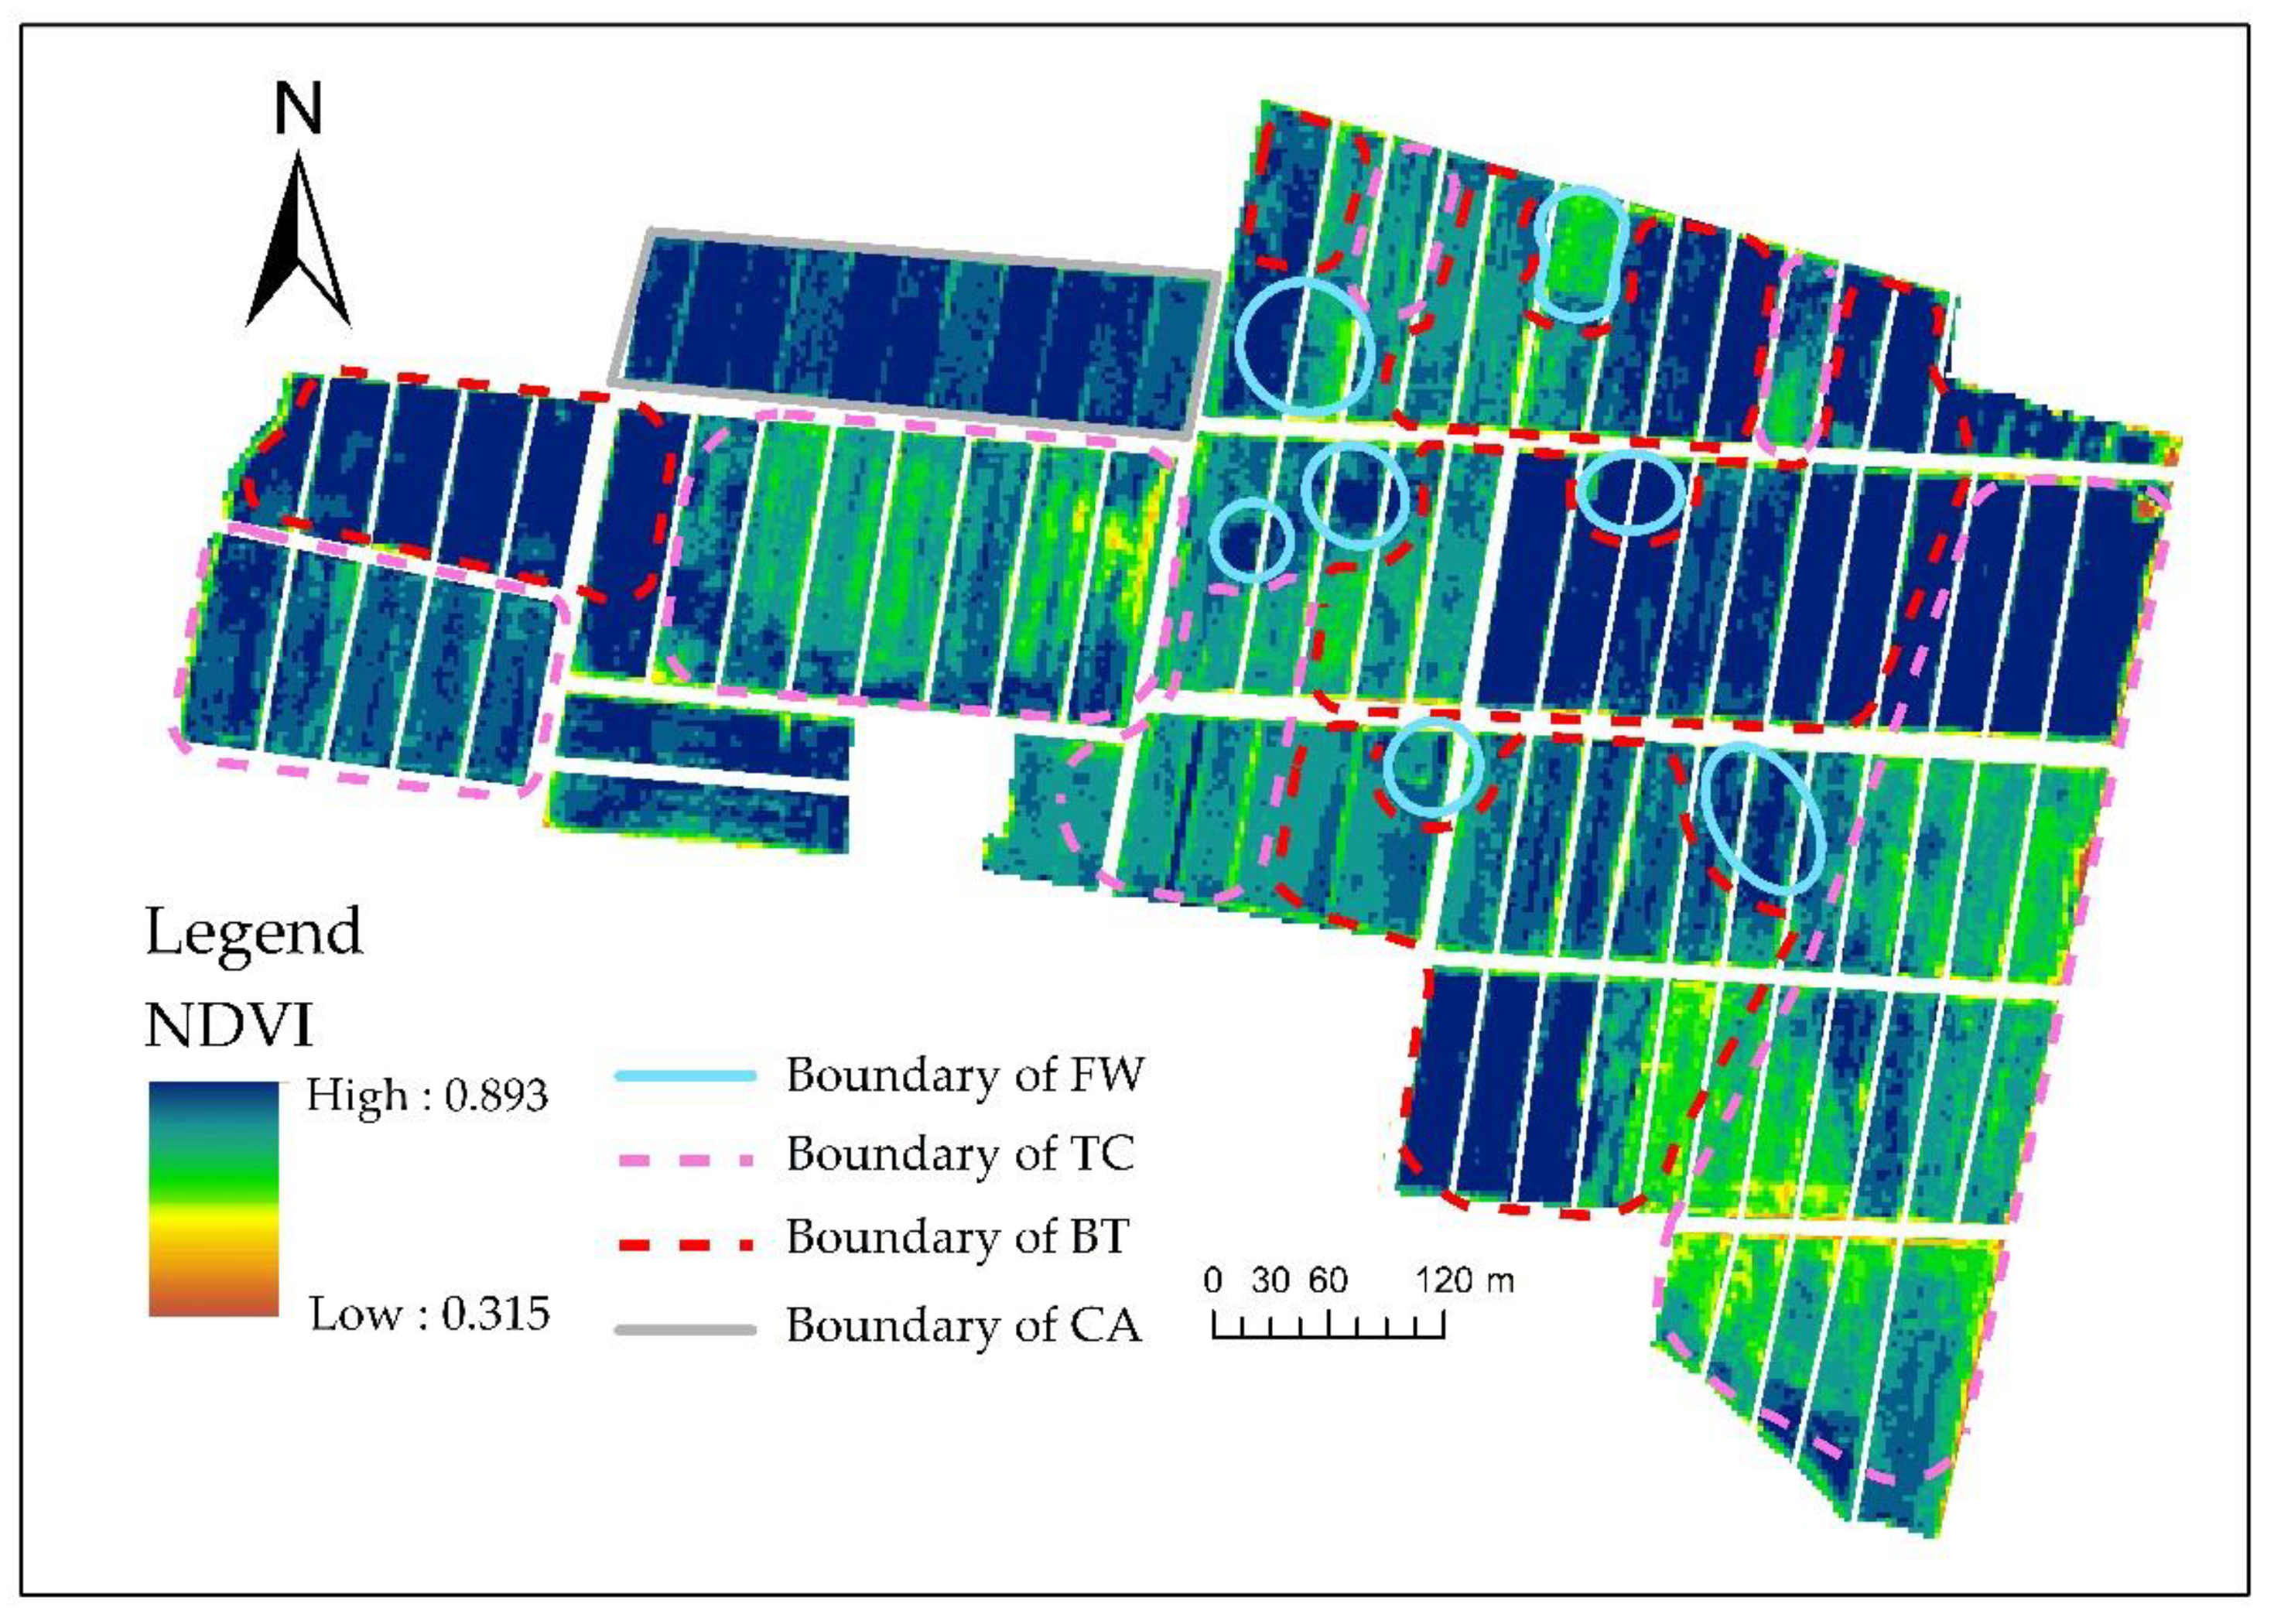
3.2. Spatial Difference of Rice Growth in Different Land Leveling Areas

There was a significant difference in the growth potential of rice between CA and the two types of FW and TC (p < 0.05) (Table 2). Among the treatments, the average value of NDVI in CA was the highest, and the average NDVI value in TC was 10.67% smaller. The growth of rice in CA was the highest and uniform, and it was consistent with the results of the field survey (Figure 3), suggesting that all of the land-consolidation treatments caused changes in soil properties that negatively impacted rice growth.
The spatial clustering of NDVI values in the study area is shown in Figure 4. In general, there were five types of clusters: not significant, LL cluster, HH cluster, LH outlier, and HL outlier. Most of the NDVI values fell in the not-significant area. There were also large areas of LL clusters in the study area, mainly in TC and FW. The HH cluster areas were mostly in BT with better rice growth, which was consistent with the results of the field observations.

3.3. Relationship between Soil Properties and Rice Growth

After land consolidation, farmland was planted by big plantation owners with unified management. The difference in the rice growth was mainly attributed to the change of soil nutrients caused by land leveling. The NDVI values of all of the plots had a significant positive correlation with SOM, TN, AK, and AZn (Table 3). There was a significant negative correlation between ASi content and NDVI values. No significant correlation was found between NDVI values and soil clay, pH, or AP (p > 0.05). In this study, SOM, AZn, TN, and AK, which were significantly correlated with NDVI, were selected. Stepwise regression analysis was used to establish a stepwise regression equation. At p < 0.05, only SOM and AZn entered the equation, and the organic matter entered first. This indicates that SOM and AZn were the keys factors affecting rice growth.
There was a significant positive correlation between soil properties and the NDVI values of rice growth in different leveling types, with R2 being the largest in CA (Figure 5). In terms of individual indicators, the correlations among SOM, AZn, and NDVI were significant (Figure 5), but the correlations among SOM, AZn, and NDVI were significantly different in different leveling types. For example, the correlation coefficients between SOM and NDVI were 0.465 and 0.796 in FW and CA. Although this aspect showed that the disturbances had caused the heterogeneous growth of rice after land consolidation, SOM positively affected rice growth. Our results also showed that the soil physicochemical properties in FW showed an overall decrease trend; soil properties and soil stability had been strongly disturbed. As a result, the correlation between soil properties and NDVI was reduced. AZn was also an important factor positively affecting rice growth, whereas there was a significant negative correlation between ASi and NDVI (p < 0.05). Rice depends on silicon to grow, and silicon can promote photosynthesis in rice growth. Due to the high content of ASi in the study area, which exceeds the suitable concentration range for rice growth, the correlation coefficient was only 0.238. From the field investigations, the NDVI value not only reflected rice growth, it also reflected the distribution of soil nutrients after land leveling. In summary, NDVI may be a convenient replacement for field investigations to monitor soil quality after large-scale land consolidation.

4. Discussion

4.1. Variability of Soil Properties under Different Land-Leveling Patterns

Land consolidation is an important tool for promoting sustainable use [10,24], but deep turning, excavation, and landfilling during the land consolidation process inevitably break the original soil configuration and change the vertical or horizontal distribution of soil nutrients [20,33,67]. In the next 10 years, China will carry out large-scale land consolidation. The state requires that 53.33 million hectares of high-standard permanent basic farmland be completed by 2020, and 80.0 million hectares of high-standard permanent basic farmland be completed by 2030. However, a slight change in the soil may cause major changes in the global environment [29,68,69]. In particular, large-scale land consolidation in China is bound to have an impact on the soil carbon and nitrogen cycle. When farmland is leveled, construction units generally adopt a program of soil balance within a small area to reduce the transportation costs. This program may increase the probability of borrowed topsoil and topsoil cutting.
As a complex project, land consolidation has caused large disturbances to soil properties. The variation properties of soil traits were different due to the different construction methods and different types land leveling. During land consolidation, a large number of deep soils are turned over to the surface, and water bodies that are filled are often filled with mud first, making it difficult for borrowed soil to be compacted. It is common for soils to experience subsidence after land consolidation. Land consolidation has caused the disturbances to soil physicochemical properties in FW, TC, and BT from Table 1. The pH content in FW was 5.75 to 5.98, which was significantly lower than the other three types (p < 0.05). We speculate that the main reason for the serious soil acidification was that the slurry sludge was derived from the silt of the river. The acidification of river bottom mud is a serious issue in the Yangtze River Delta, and high groundwater levels can easily cause acid regurgitation. This feature was very similar to the results of previous studies [70,71]. The thickness of the surface soil in FW and TC was generally thin, and the texture of the soil was heavy. This can easily form a barrier layer that negatively affects crop growth. The ASi mainly exists in the silicic acid solution of soil. After land consolidation, the topsoil is fully mixed with the underlying soil, and the viscosity of the new cultivation layer increased, so it can absorb more silicic acid. We suspect this absorption was the reason that FW, TC, and BT were all higher in ASi than in the CA.
Soil nutrients are influenced by both human and natural factors. It is generally considered that with the increase in land-leveling practices, SOM, N, P, and K will decrease at first, and then increase, so fertility will decline, but only in the short-term [28,31,72]. The field investigations in this study also found that land leveling had significant negative effects on soil properties and crop growth in the short term, which is consistent with previous research results [20,30,67]. This study found that the changes of AP were not significant, which differs from the results of Brey et al. [20]. Under conditions of consistent field management, AP are mainly controlled by the soil parent material [68]. Land leveling mainly disturbs the surface of the soil, and thus rarely affects the conditions of the parent materials or resulting AP. We found no significant changes in AP among our treatments. The significant decreases observed in previous studies were attributed the loss of AP to inconsistent fertilization and field management [2,67].

4.2. Factors Influencing of the Ndvi Value of Rice Growth

The surface layer of the soil contains abundant organic matter and nutrients. From the stepwise regression results in Table 3, SOM and AZn were the controlling factors for the NDVI value of rice growth. In this study, the NDVI value of CA was the largest, and the topsoil was considered a highly developed mature soil layer. In addition, with the same time of rain and heat in Yangtze River Delta, it is more suitable for rice planting and rice growth than most parts of China [73]. The NDVI values of rice in TC and BT decreased, and the variation among values became larger. There was clear spatial variation in the NDVI metrological characteristics of rice growth within the land consolidation project, and the NDVI value BT was significantly higher than that in TC (p < 0.05). The spatial cluster analysis showed that the LL cluster was mainly TC and FW, which was probably a result of different land-leveling types. When farmland is leveled, the method of cutting high and filling low is generally used to flatten the surface of the farmland. The surface matured soil of TC was borrowed to BT, and the surface soil in BT is fertile. However, the NDVI of the FWs was lower, and there was an LL cluster; this was significantly different from CA, because the FWs were filled with mud and then borrowed topsoil of TC, which cannot be compacted. After the summer rainfall, uneven settlement occurred in the loose soil layer, which disturbed the borrowed soil, and resulted in the variation of soil nutrients in the cultivated horizon. As a result, rice growth in the FWs was not only poor, it was also uneven. In the short term, land consolidation disturbed the nutrient status of the surface soil and thus negatively affected rice growth [2,44]. Previous studies have shown that soil physicochemical properties can have extremely significant effects in the short term after land consolidation [21,74], which include the severe compaction of soil, increased viscosity, decreased fertility, and decreased plant growth. Moreover, these adverse effects mainly occurred in the first growing season after land consolidation [30,31], when the soil layer was disturbed, especially the surface layer, and the topsoil physicochemical properties changed [20,30]. It is generally accepted that soils are affected by mechanical mixing in the short term, because the quality decreases [6,28]. This is similar to the results of TC and BT in this study.

4.3. Mitigating the Disturbance of Land Leveling to Soil

Ecological civilization has become the mainstream of development in China [22,75]. Land consolidation should change from adding the quantity of cultivated land and gain yield capacity to ecological rehabilitation, which focuses on the multifunctional ecological services of farmland [1,13]. This study revealed that land consolidation seriously disturbs the soil environment in the short term. This is consistent with the conclusions of previous studies [2,28]. The original soil configuration can be destroyed by land leveling, and the nutrient losses that occur when the topsoil is impacted are serious [21]. The current leveling method is unscientific; the regulations for land consolidation in China stipulate that first, the topsoil layer should be peeled off and set aside before leveling so that after the area is leveled, it can be backfilled with the same topsoil. However, rarely is the regulation strictly implemented. To minimize construction time and transportation costs, it is more common to cut directly high and fill low, resulting in a thinner topsoil and the loss of soil nutrients. Soil protection is neglected during leveling, and a large amount of topsoil is lost, causing soil quality declines in the short term. Our study suggests that it will be particularly important for FW and TC to implement land-leveling practices that strictly comply with the regulations in the future. For FW, it should be considered that there will be subsidence after the first irrigation, and that the thickness of borrowed soil should be thickened as needed according to the situation. For TC, the topsoil should first be removed (0–25 cm), the site shall be uniformly leveled by taking the high fill and low, and then, the original mature surface soil shall be backfilled. If necessary, the raw humus shall be used to cover the soil once more [2]. These measures are conducive to the internal balance of the topsoil and the equalization of yield capability.
National regulations in land consolidation are not comprehensive, and only specify requirements for soil thickness after land consolidation without requiring the maintenance of soil properties or quality. This work shows that there is value in regulations taking into account the value of multifunctional ecological services [13]. Land consolidation generally promotes the change of regional farmland ecological environment, but there is still a certain degree of quality improvement after land consolidation compared with high-quality farmland [30]. Follow-up management should include ecological control, scientific fertilization, and the application of green manure and humus fertilizer. Further, ecological management should be combined with the local soil, climate characteristics [14], and crop growth needs to formulate the best fertilization plan and usage. According to the actual conditions of different leveling areas, a long-term mechanism would be established to achieve a win–win situation for agricultural sustainable development and ecological protection [2,9].

5. Conclusions

As a powerful tool for land-use management, land consolidation plays a positive role in increasing the quantity of farmland, enhancing farmland infrastructure, and improving grain yield capacity. However, land consolidation has also strongly disturbed soil environment in the short term. It has also not yet received sufficient attention in China. This study was conducted in the land consolidation project of Gengzhuang Village in Yangtze River Delta. Remote sensing and field investigations were used to monitor the effects of land consolidation on soil properties and rice growth. The work yielded the following conclusions:
(1) Land consolidation can seriously disturb soil nutrients in the short term. Land leveling significantly decreased SOM, TN, AK, and AZn in the short term, whereas ASi increased significantly. Soil nutrients differed among the different land-leveling types, which are generally represented as CA > BT > FW > TC.
(2) There was a significant difference in the growth status of rice in the first growing season under different land-leveling types, which are shown as CA > BT > FW > TC. The mean value of the NDVI of FW was 0.763 ± 0.03, TC was 0.747 ± 0.06, BT was 0.808 ± 0.05, and CA was 0.834 ± 0.02. NDVI low–low clusters areas were concentrated in TC and FW.
(3) The NDVI value of rice growth was significantly positively correlated with SOM and AZn, and the correlation coefficients were 0.831 and 0.810, respectively. The spatial variation of SOM and AZn caused by land leveling were the main factors leading to rice NDVI heterogeneity.
(4) NDVI values could replace field soil investigations and facilitate the large-scale monitoring of soil quality after land consolidation. Using remote sensing found that there was a strong disturbance after land consolidation in TC and FW. Follow-up management should give priority attention, such as through fertilizing soil and strengthening field management, which could help the soil retrieve its original state after a period of time. Remote sensing has the appropriate tools to identify the defective area of crop growth on a large scale, and provide a quick and convenient mean for the planning and construction of land consolidation, which can optimize land management.

Author Contributions

X.L., F.C., Y.M., J.M. and Z.L. performed all the experiments and drafted the manuscript. All authors participated in the design of this study and analysis of results. F.C. and Y.Y. conceived and coordinated this study.

Funding

This research was funded by the Key Projects in the National Science & Technology Pillar Program during the Twelfth Five-year Plan Period (2015BAD06B02).

Acknowledgments

The authors would like to thank Land consolidation Centre of Jiangsu Province for the support during the research. The authors would also like to thank LetPub English Service for providing linguistic assistance during the preparation of this manuscript.

Conflicts of Interest

The authors declare no conflict of interest. The funders had no role in the design of the study; in the collection, analyses, or interpretation of data; in the writing of the manuscript, and in the decision to publish the results.

References

  1. Jiang, G.; Wang, X.; Yun, W.; Zhang, R. A new system will lead to an optimal path of land consolidation spatial management in China. Land Use Policy 2015, 42, 27–37. [Google Scholar]
  2. Sharifi, A.; Gorji, M.; Asadi, H.; Pourbabaee, A.A. Land leveling and changes in soil properties in paddy fields of Guilan province, Iran. Paddy Water Environ. 2014, 12, 139–145. [Google Scholar] [CrossRef]
  3. Wójcik-Leń, J.; Sobolewska-Mikulska, K.; Sajnóg, N.; Leń, P. The idea of rational management of problematic agricultural areas in the course of land consolidation. Land Use Policy 2018, 78, 36–45. [Google Scholar] [CrossRef]
  4. Miranda, D.; Crecente, R.; Alvarez, M.F. Land consolidation in inland rural Galicia, N.W. Spain, since 1950: An example of the formulation and use of questions, criteria and indicators for evaluation of rural development policies. Land Use Policy 2006, 23, 511–520. [Google Scholar] [CrossRef]
  5. FAO. The Design of Land Consolidation Pilot Projects in Central and Eastern Europe. Available online: http://www.fao.org/3/a-Y4954E.pdf (accessed on 8 August 2018).
  6. Bahnas, O.B.M.Y. Effect of precision land leveling on faba bean response to compost application in sandy soils. Misr. J. Agric. Eng. 2010, 2, 465–481. [Google Scholar]
  7. Wu, Z.; Liu, M.; Davis, J. Land consolidation and productivity in Chinese household crop production. China Econ. Rev. 2005, 16, 28–49. [Google Scholar] [CrossRef]
  8. Wei, S.; Pijanowski, B.C. The effects of China’s cultivated land balance program on potential land productivity at a national scale. Appl. Geogr. 2014, 46, 158–170. [Google Scholar]
  9. Du, X.; Zhang, X.; Jin, X. Assessing the effectiveness of land consolidation for improving agricultural productivity in China. Land Use Policy 2018, 70, 360–367. [Google Scholar] [CrossRef]
  10. Long, H. Land consolidation: An indispensable way of spatial restructuring in rural China. J. Geogr. Sci. 2014, 24, 211–225. [Google Scholar] [CrossRef]
  11. Jin, X.; Shao, Y.; Zhang, Z.; Resler, L.M.; Campbell, J.B.; Chen, G.; Zhou, Y. The evaluation of land consolidation policy in improving agricultural productivity in China. Sci. Rep. 2017, 7, 2792. [Google Scholar] [CrossRef] [PubMed]
  12. Zhang, Z.; Zhao, W.; Gu, X. Changes resulting from a land consolidation project (LCP) and its resource-environment effects: A case study in Tianmen City of Hubei Province, China. Land Use Policy 2014, 40, 74–82. [Google Scholar] [CrossRef]
  13. Wang, J.; Yan, S.; Guo, Y.; Li, J.; Sun, G. The effects of land consolidation on the ecological connectivity based on ecosystem service value: A case study of Da’an land consolidation project in Jilin province. J. Geogr. Sci. 2015, 25, 603–616. [Google Scholar] [CrossRef]
  14. Diacono, M.; Persiani, A.; Fiore, A.; Montemurro, F.; Canali, S. Agro-ecology for potential adaptation of horticultural systems to climate change: Agronomic and energetic performance evaluation. Agronomy 2017, 7, 35. [Google Scholar] [CrossRef]
  15. Dijk, T.V. Complications for traditional land consolidation in Central Europe. Geoforum 2007, 38, 505–511. [Google Scholar] [CrossRef]
  16. Nguyen, T.; Cheng, E.; Findlay, C. Land fragmentation and farm productivity in China in the 1990s. China Econ. Rev. 1996, 7, 169–180. [Google Scholar] [CrossRef]
  17. Wójcik-Leń, J.; Leń, P.; Sobolewska-Mikulska, K. The proposed algorithm for identifying agricultural problem areas for the needs of their reasonable management under land consolidation works. Comput. Electron. Agric. 2018, 152, 333–339. [Google Scholar] [CrossRef]
  18. Zeng, S.; Zhu, F.; Chen, F.; Yu, M.; Zhang, S.; Yang, Y. Assessing the impacts of land consolidation on agricultural technical efficiency of producers: A Survey from Jiangsu Province, China. Sustainability 2018, 10, 2490. [Google Scholar] [CrossRef]
  19. Bonfanti, P.; Fregonese, A.; Sigura, M. Landscape analysis in areas affected by land consolidation. Landsc. Urban Plann. 1997, 37, 91–98. [Google Scholar] [CrossRef]
  20. Brye, K.R.; Slaton, N.A.; Norman, R.J. Soil Physical and biological properties as affected by land leveling in a clayey aquert. Soil Sci. Soc. Am. J. 2006, 70, 631–642. [Google Scholar] [CrossRef]
  21. Sharma, P.; Singh, P.; Prasad, R.; Tiwari, A.K.; Yadav, R.P. Land leveling effects on soil properties and crop productivity. Indian J. Soil Conserv. 2010, 173–177. [Google Scholar]
  22. Yun, W.; Zhu, D.; Tang, H. Reshaping and innovation of China land consolidation strategy. Trans. Chin. Soc. Agric. Eng. 2016, 32, 1–8. [Google Scholar]
  23. Rahman, S.; Rahman, M. Impact of land fragmentation and resource ownership on productivity and efficiency: the case of rice producers in Bangladesh. Land Use Policy 2009, 26, 95–103. [Google Scholar] [CrossRef]
  24. Chen, F.; Yu, M.; Zhu, F. Rethinking rural transformation caused by comprehensive land consolidation: insight from program of whole village restructuring in Jiangsu Province, China. Sustainability 2018, 6, 2029. [Google Scholar] [CrossRef]
  25. Jones, R.; Tonts, M. Rural restructuring and social sustainability: Some reflections on the Western Australian Wheatbelt. Aust. Geogr. 1995, 26, 133–140. [Google Scholar] [CrossRef]
  26. Leń, P. An algorithm for selecting groups of factors for prioritization of land consolidation in rural areas. Comput. Electron. Agric. 2018, 144, 216–221. [Google Scholar] [CrossRef]
  27. Jin, X.; Ding, N.; Zhang, Z.; Zhou, Y.; Yang, X. Inter-provincial allocation of land consolidation fund and effects of land consolidation in China. Trans. Chin. Soc. Agric. Eng. 2012, 28, 1–9. [Google Scholar]
  28. He, X.Y.; Su, Y.R.; Liang, Y.M.; Chen, X.B.; Zhu, H.H.; Wang, K.L. Land reclamation and short-term cultivation change soil microbial communities and bacterial metabolic profiles. J. Sci. Food Agric. 2012, 92, 1103–1111. [Google Scholar] [CrossRef] [PubMed]
  29. Akala, V.A.; Lal, R. Potential of mine land reclamation for soil organic carbon sequestration in Ohio. Land Degrad. Dev. 2015, 11, 289–297. [Google Scholar] [CrossRef]
  30. Brye, K.R.; Chen, P.; Purcell, L.C.; Mozaffari, M.; Norman, R.J. First-year soybean growth and production as affected by soil properties following land leveling. Plant Soil 2004, 263, 323–334. [Google Scholar] [CrossRef]
  31. Zhou, J.; Qin, X.; Liu, L.; Hu, Y. A potential evaluation model for land consolidation in fragmental regions. Ecol. Indic. 2017, 74, 230–240. [Google Scholar] [CrossRef]
  32. Bronstert, A.; Vollmer, S.; Ihringer, J. A review of the impact of land consolidation on runoff production and flooding in Germany. Phys. Chem. Earth 1995, 20, 321–329. [Google Scholar] [CrossRef]
  33. Gagnon, P.; Chrétien, F.; Thériault, G. Land leveling impact on surface runoff and soil losses: Estimation with coupled deterministic/stochastic models for a Québec agricultural field. J. Hydrol. 2017, 544, 488–499. [Google Scholar] [CrossRef]
  34. Hazeu, G.; Milenov, P.; Pedroli, B.; Samoungi, V.; Van Eupen, M.; Vassilev, V. High Nature Value farmland identification from satellite imagery, a comparison of two methodological approaches. Int. J. Appl. Earth Obs. Geoinf. 2014, 30, 98–112. [Google Scholar] [CrossRef]
  35. Ren, J.; Chen, Z.; Zhou, Q.; Tang, H. Regional yield estimation for winter wheat with MODIS-NDVI data in Shandong, China. Int. J. Appl. Earth Obs. Geoinf. 2008, 10, 403–413. [Google Scholar] [CrossRef]
  36. Tan, S.; Heerink, N.; Kuyvenhoven, A.; Qu, F. Impact of land fragmentation on rice producers’ technical efficiency in South-East China. J. Life Sci. 2010, 57, 117–123. [Google Scholar] [CrossRef]
  37. Yan, J.; Xia, F.; Bao, H.X.H. Strategic planning framework for land consolidation in China: A top-level design based on SWOT analysis. Habitat Int. 2015, 48, 46–54. [Google Scholar] [CrossRef] [Green Version]
  38. Liu, Y.; Lu, S.; Chen, Y. Spatio-temporal change of urban–rural equalized development patterns in China and its driving factors. J. Rural Stud. 2013, 32, 320–330. [Google Scholar] [CrossRef]
  39. Liang, C.; Jiang, P.; Wei, C.; Li, M.; Wang, L.; Yuan, G.; Yuzhe, P.; Nan, X.; Duan, Y.; Huang, Q. Farmland protection policies and rapid urbanization in China: A case study for Changzhou City. Land Use Policy 2015, 48, 552–566. [Google Scholar] [CrossRef]
  40. Niroula, G.S.; Thapa, G.B. Impacts and causes of land fragmentation, and lessons learned from land consolidation in South Asia. Land Use Policy 2005, 22, 358–372. [Google Scholar] [CrossRef]
  41. Muzangwa, L.; Mnkeni, P.N.S.; Chiduza, C. assessment of conservation agriculture practices by smallholder farmers in the Eastern Cape province of South Africa. Agronomy 2017, 7, 46. [Google Scholar] [CrossRef]
  42. Chen, F.; Zhang, W.; Ma, J.; Yang, Y.; Zhang, S.; Chen, R. Experimental study on the effects of underground CO2 leakage on soil microbial consortia. Int. J. Greenh. Gas Contr. 2017, 63, 241–248. [Google Scholar] [CrossRef]
  43. Nguyen, H.T.; Lee, B.W. Assessment of rice leaf growth and nitrogen status by hyperspectral canopy reflectance and partial least square regression. Eur. J. Agron. 2006, 24, 349–356. [Google Scholar] [CrossRef]
  44. Asai, H.; Samson, B.K.; Stephan, H.M.; Songyikhangsuthor, K.; Homma, K.; Kiyono, Y.; Inoue, Y.; Shiraiwa, T.; Horie, T. Biochar amendment techniques for upland rice production in Northern Laos: 1. Soil physical properties, leaf SPAD and grain yield. Field Crops Res. 2009, 111, 81–84. [Google Scholar] [CrossRef]
  45. Walkley, A.J.; Black, I.A. An examination of the degtjareff method for determining soil organic matter, and a proposed modification of the chromic acid titration method. Soil Sci. 1934, 37, 29–38. [Google Scholar] [CrossRef]
  46. Schoeneberger, P.J. Field Book for Describing and Sampling Soils, 1st ed.; Usda Natural Resources Conservation Service: Lincoln, UK, 1998.
  47. Ma, J.; Zhang, W.; Zhang, S.; Zhu, Q.; Feng, Q.; Chen, F. Short-term effects of CO2 leakage on the soil bacterial community in a simulated gas leakage scenario. Peer J. 2017, 5, e4024. [Google Scholar] [CrossRef] [PubMed]
  48. Luo, Z.; Ma, J.; Chen, F.; Li, X.; Zhang, S. Effects of Pb Smelting on the Soil Bacterial Community near a Secondary Lead Plant. Int. J. Environ. Res. Public Health 2018, 15, 1030. [Google Scholar] [CrossRef] [PubMed]
  49. Aguilar, M.A.; Saldaña, M.M.; Aguilar, F.J. GeoEye-1 and WorldView-2 pan-sharpened imagery for object-based classification in urban environments. Int. J. Remote Sens. 2013, 34, 2583–2606. [Google Scholar] [CrossRef]
  50. Crespi, M.; Colosimo, G.; Vendictis, L.D.; Fratarcangeli, F.; Pieralice, F. GeoEye-1: Analysis of Radiometric and Geometric Capability. In Proceedings of the International Conference on Personal Satellite Services, Rome, Italy, 4–5 February 2010; pp. 354–369. [Google Scholar]
  51. Tewes, A.; Schellberg, J. Towards remote estimation of radiation use efficiency in maize using uav-based low-cost camera imagery. Agronomy 2018, 8, 16. [Google Scholar] [CrossRef]
  52. Lunetta, R.S.; Knight, J.F.; Ediriwickrema, J.; Lyon, J.G.; Worthy, L.D. Land-cover change detection using multi-temporal MODIS NDVI data. Remote Sens. Environ. 2006, 105, 142–154. [Google Scholar] [CrossRef]
  53. Pettorelli, N.; Vik, J.; Mysterud, A.; Gaillard, J.; Tucker, C.; Stenseth, N. Using the satellite-derived NDVI to assess ecological responses to environmental change. Trend Ecol. Evol. 2005, 20, 503–510. [Google Scholar] [CrossRef] [PubMed]
  54. Egido, A.; Caparrini, M.; Ruffini, G.; Paloscia, S.; Santi, E.; Guerriero, L.; Pierdicca, N.; Floury, N. Global navigation satellite systems reflectometry as a remote sensing tool for agriculture. Remote Sens. 2012, 4, 2356–2372. [Google Scholar] [CrossRef]
  55. Ge, Y.; Thomasson, J.A.; Sui, R. Remote sensing of soil properties in precision agriculture: A review. Front. Earth Sci. 2011, 5, 229–238. [Google Scholar] [CrossRef]
  56. Bastiaanssen, W.G.M.; Molden, D.J.; Makin, I.W. Remote sensing for irrigated agriculture: Examples from research and possible applications. Agric. Water Manag. 2000, 46, 137–155. [Google Scholar] [CrossRef]
  57. Zheng, Y.; Han, J.; Huang, Y.; Fassnacht, S.R.; Xie, S.; Lv, E.; Chen, M. Vegetation response to climate conditions based on NDVI simulations using stepwise cluster analysis for the Three-River Headwaters region of China. Ecol. Indic. 2018, 92, 18–29. [Google Scholar] [CrossRef]
  58. Svensgaard, J.; Roitsch, T.; Christensen, S. Development of a Mobile Multispectral Imaging Platform for Precise Field Phenotyping. Agronomy 2014, 4, 322–336. [Google Scholar] [CrossRef] [Green Version]
  59. Prasad, A.K.; Chai, L.; Singh, R.P.; Kafatos, M. Crop yield estimation model for Iowa using remote sensing and surface parameters. Int. Appl. Earth Obs. Geoinf. 2006, 8, 26–33. [Google Scholar] [CrossRef]
  60. Fu, W.J.; Jiang, P.K.; Zhou, G.M.; Zhao, K.L. Using Moran’s I and GIS to study the spatial pattern of forest litter carbon density in a subtropical region of southeastern China. Biogeosciences 2014, 11, 2401–2409. [Google Scholar] [CrossRef] [Green Version]
  61. Zhang, C.; Luo, L.; Xu, W.; Ledwith, V. Use of local Moran’s I and GIS to identify pollution hotspots of Pb in urban soils of Galway, Ireland. Sci. Total Environ. 2008, 398, 212–221. [Google Scholar] [CrossRef] [PubMed]
  62. Yang, Z.; Sliuzas, R.; Cai, J.; Ottens, H.F.L. Exploring spatial evolution of economic clusters: A case study of Beijing. Int. J. Appl. Earth Obs. Geoinf. 2012, 19, 252–265. [Google Scholar] [CrossRef]
  63. Xinli, K.E.; Deng, X. A partitioned GeoCA based on dual-constraint spatial cluster and its effect on the accuracy of simulating result. J. Remote Sens. 2011, 15, 512–523. [Google Scholar]
  64. Yang, H.L.; Peng, J.H.; Xia, B.R.; Zhang, D.X. Remote sensing classification using fuzzy c-means clustering with spatial constraints based on markov random field. Eur. J. Remote Sens. 2013, 46, 305–316. [Google Scholar]
  65. Thilakarathna, M.S.; Raizada, M.N. Challenges in using precision agriculture to optimize symbiotic nitrogen fixation in legumes: progress, limitations, and future improvements needed in diagnostic testing. Agronomy 2018, 8, 78. [Google Scholar] [CrossRef]
  66. Tang, Y.; Li, X.; Shen, W.; Duan, Z. Effect of the slow-release nitrogen fertilizer oxamide on ammonia volatilization and nitrogen use efficiency in paddy soil. Agronomy 2018, 8, 53. [Google Scholar] [CrossRef]
  67. Brye, K.R.; Slaton, N.A.; Mozaffari, M.; Savin, M.C.; Norman, R.J.; Miller, D.M. Short-Term effects of land leveling on soil chemical properties and their relationships with microbial biomass. Soil Sci. Soc. Am. J. 2004, 68, 924–934. [Google Scholar] [CrossRef]
  68. Sharma, L.K.; Bali, S.K.; Zaeen, A.A. A case study of potential reasons of increased soil phosphorus levels in the Northeast United States. Agronomy 2017, 7, 85. [Google Scholar] [CrossRef]
  69. Yu, Q.; Yu, G.; Zeng, Q. The influence of land consolidation on biomass and ecological environment. Res. J. Appl. Sci. Eng. Technol. 2014, 7, 3656–3662. [Google Scholar] [CrossRef]
  70. Wang, F.; Miao, L.; Lu, W. Sand creep as a factor in land subsidence during groundwater level recovery in the southern Yangtze River delta, China. Bull. Eng. Geol. Environ. 2013, 72, 273–283. [Google Scholar] [CrossRef]
  71. Ying, W.; Lachun, W.; Dong, W. Bearing capacity and regularity of development of water resources and water environment of Yangtze River Delta and measures for sustainable development. Water Resour. Protect. 2003, 6, 34–40. [Google Scholar]
  72. Parfitt, J.M.B.; Timm, L.C.; Reichardt, K.; Pinto, L.F.S.; Pauletto, E.A.; Castilhos, D.D. Chemical and biological attributes of a lowland soil affected by land leveling. Pesquisa Agropecuária Brasileira 2013, 48, 1489–1497. [Google Scholar] [CrossRef] [Green Version]
  73. Lehndorff, E.; Roth, P.J.; Cao, Z.H.; Amelung, W. Black carbon accrual during 2000 years of paddy-rice and non-paddy cropping in the Yangtze River Delta, China. Glob. Chang. Biol. 2014, 20, 1968–1978. [Google Scholar] [CrossRef] [PubMed]
  74. Parfitt, J.M.B.; Timm, L.C.; Reichardt, K.; Pauletto, E.A. Impacts of land leveling on lowland soil physical properties. Revista Brasileira De Ciência Do Solo 2014, 38, 315–326. [Google Scholar] [CrossRef] [Green Version]
  75. Pow, C. Building a harmonious society through greening: ecological civilization and aesthetic governmentality in China. Ann. Assoc. Am. Geogr. 2018, 108, 864–883. [Google Scholar] [CrossRef]
Figure 1. Location of the study area and soil sampling locations.
Sustainability 10 03072 g001
Figure 2. Three remote-sensing images represent (a) before; (b) during; and (c) after land consolidation treatments.
Sustainability 10 03072 g002
Figure 3. Spatial variability of normalized difference vegetation index (NDVI) of rice growth in areas subjected to land consolidation.
Sustainability 10 03072 g003
Figure 4. NDVI spatial clustering of the plot in different land consolidation treatments.
Sustainability 10 03072 g004
Figure 5. The correlation between NDVI and (a) soil organic matter (SOM), and (b) available Zn (AZn).
Sustainability 10 03072 g005
Table 1. Descriptive statistics of soil parameters in different land-leveling areas.
Soil PropertiesFWTCBTCA
Sand (%)62.47 ± 5.10ab56.26 ± 5.97a57.33 ± 4.50a65.86 ± 2.94b
Silt (%)32.79 ± 4.53ab38.47 ± 4.88b37.31 ± 4.00b29.71 ± 2.81a
Clay (%)4.09 ± 1.09ab5.50 ± 1.07c4.88 ± 0.90bc3.39 ± 0.39a
pH5.86 ± 0.09a6.32 ± 0.25b6.37 ± 0.32b6.38 ± 0.12b
SOM (g kg−1)15.95 ± 3.36a13.68 ± 4.97a20.40 ± 5.90ab24.77 ± 4.94b
TN (g kg−1)2.34 ± 0.53a2.29 ± 0.60a3.34 ± 0.87b3.85 ± 0.39b
AP (mg kg−1)16.25 ± 7.67a14.34 ± 9.79a17.64 ± 9.05a12.13 ± 7.19a
AK (mg kg−1)96.60 ± 12.80a94.98 ± 15.67a104.21 ± 10.58b108.18 ± 6.22b
AZn (mg kg−1)8.70 ± 0.43ab8.06 ± 1.25a9.75 ± 0.99b11.60 ± 0.66c
ASi (mg kg−1)265.90 ± 35.60ab327.35 ± 44.93c303.60 ± 47.09bc213.33 ± 13.20a
Note: Data are mean ± standard deviation. Values in the same with the same letter (s) are not significantly different using the Tukey–Kramer method at p < 0.05 between different treatments. Within each row, the difference is not significant when there is a letter with the same mark, and the difference is significant when there are different mark letters. SOM, soil organic matter; TN, total N; AP, available P; AK, available K; AZn, available zinc; ASi, available Si; FW: filled waterbodies; TC: topsoil cutting; BT: borrowed topsoil; CA: control area.
Table 2. Descriptive statistics of the normalized difference vegetation index (NDVI) in different land-leveling areas.
Leveling TypeFWTCBTCA
Mean value of NDVI0.763 ± 0.03a0.747 ± 0.06a0.808 ± 0.05ab0.834 ± 0.02b
Note: Data are mean ± standard deviation. Values in the same with the same letter (s) are not significantly different using the Tukey–Kramer method at p < 0.05 between different treatments. Within each row, the difference is not significant when there is a letter with the same mark, and the difference is significant when there are different mark letters.
Table 3. Relationship between soil properties and NDVI of the 43 soil samples.
VariablerpVariablerp
Clay0.1510.333AK0.580<0.001 ***
pH0.1020.513AZn0.810<0.001 ***
SOM0.831<0.001 ***ASi0.4870.001 ***
TN0.731<0.001 ***SOM + AZn a0.864<0.001 ***
AP0.3750.008 ***
Note: r mean correlation coefficient, p mean Significant; *** mean extremely significant difference at 1% level. SOM, soil organic matter; TN, total N; AP, available P; AK, available K; AZn, available zinc; ASi, available Si. a: Stepwise regression equation for SOM and AZn, y = 0.004x1 + 0.16x2 + 0.561, x1 and x2 represent factors SOM and AZn.

