Blue and Green Water Footprint Assessment for China—A Multi-Region Input–Output Approach


1
Key Laboratory of Integrated Regulation and Resource Development on Shallow Lakes, Ministry of Education, College of Environment, Hohai University, Nanjing 210098, China
2
Institutes of Science and Development, Chinese Academy of Sciences, Beijing 100190, China
3
School of Public Policy and Management, University of Chinese Academy of Sciences, Beijing 100049, China
4
water@leeds, School of Civil Engineering, University of Leeds, Leeds LS2 9JT, UK
5
School of Environmental Science and Engineering, Southern University of Science and Technology, Shenzhen 518055, China
*
Authors to whom correspondence should be addressed.
Sustainability 2018, 10(8), 2822; https://doi.org/10.3390/su10082822
Submission received: 30 June 2018
/
Revised: 27 July 2018
/
Accepted: 1 August 2018
/
Published: 9 August 2018
(This article belongs to the Special Issue Water Footprint in Supply Chain Management)
Abstract
:Research on blue and green water footprints (WF) for China has typically been carried out based on bottom-up and top-down approach using a single-region input–output table. However, this research typically lacks detail on the sectoral interrelationships which exist between China and its trading partners in other countries/regions of the world. Here, a multi-region input–output approach using the WIOD database was applied to quantify the blue and green WF for China in 2009. The quantification was conducted from both production (WFP) and consumption (WFC) perspectives. The results show that the total WFP for China in 2009 was 1152.2 km3, second only to India. At 1070.9 km3, China had the largest WFC volume in the world. The internal WF was 953.5 km3, taking the substantial share for both the WFC and WFP. Overall, China’s trade resulted in a net export of 53.5 km3 virtual water. In contrast, the agricultural sector resulted in a net import of 70.6 km3 virtual water to China, with United States, Brazil, and Canada acting as major suppliers. This study suggests that quantifying the WF of China at global level through a MRIO framework is a necessary step towards achieving sustainability for China’s water management.
1. Introduction
According to the World Economic Forum, water crises carry with them the greatest impacts and one of the highest risks of a range of identified global environmental, economic, societal, and technological threats [1]. China, the worlds’ most populous country, faces a water crisis characterized by per capita water resource substantially below the global average level [2]. In addition, water use predictions for China show an increasing trend in the future [3]. Recent research has placed China’s water issues in the global context through use of the water footprint (WF) indicator [4,5]. The WF of a country is defined as the total volume of freshwater used to produce the goods and services consumed by people in that country [6]. There are three components of the WF: blue, green, and grey. The blue WF refers to the consumption of blue water (surface and groundwater) resources in the supply chain. The green WF refers to the consumption of green water (soil water) resources, relating to agriculture, and the grey WF refers to the amount of fresh water required to assimilate pollutants to meet specific water quality standards [7]. Given that the concept of grey WF itself is still in dispute, it was excluded from our study. For one thing, the results of grey WF will vary substantially based on different water quality standards and data sources of natural concentration [8]. For another, assessments of grey WF have overwhelmingly been focused on nitrogen-related pollutants (including the data sources from WIOD) despite other pollutants being known to exist in polluted waterbodies, which may therefore underestimate the grey WF [9]. For the reasons above, many studies excluded grey water in quantification of WF [10,11,12]. Both the blue and green WF are indicators of water quantity, whereas the grey WF is an indicator of water quality. Currently, studies on blue and green WF have been carried out at different spatial scales ranging from global scale [13], through river basin [14,15] and regional scales [16,17], to national [18,19,20,21] and urban scales [22,23].
WF quantification may be carried out from two perspectives: the production perspective and the consumption perspective. Initial assessments of WF from the production perspective only considered local water supply. Later, the production perspective was developed to include domestic WF and WF for export (also referred to as virtual water export) [13]. The WF for export was highlighted because governments tend to only focus on local water management and neglect water embodied in exported goods and services [24]. The consumption perspective includes domestic WF and imported WF. From the consumption perspective, whether a product or service originates from domestic or external production i.e., imported goods and services, it is attributed to the final consumption of local consumers.
The WF may be quantified through so-called bottom-up and top-down approaches. The bottom-up approach is often used to study WF of specific agricultural products, such as primary crop or animal products [25]. Based on the detailed process data, the bottom-up approach is one of the most popular approaches in water footprint studies for its simplicity and relatively good data availability [26]. This approach is generally unsuitable for industrial products which typically rely on multiple inputs and manufacturing steps which may originate in different regions/countries and industrial sectors, and is thus more complex. The top-down approach provides a more comprehensive assessment of water use by covering all economic activities in the industrial supply chain. It refers to an approach of decomposition from the highest to the lowest level within sub-system boundaries i.e., industrial sectors, countries, or river basins [27]. The top-down approach based on input–output analysis can measure WF across all economic sectors in different regions, overcoming the “truncation error” brought about by use of the bottom-up approach [28]. However, it should be mentioned that the top-down approach relies on inter-sectoral monetary transactions and more importantly on highly aggregated sectoral water use data, compared to the more detailed bottom-up approach, which relies on the physical/quantitative amounts rather than on monetary amounts.
As a country experiencing severe water stress and with good levels of economic and trade data availability, China is often chosen as a case for WF studies. Current studies on WF in China can be roughly divided into three categories: the first category is the inclusion of China in the study of global-scale WF. For example, Hoekstra and Mekonnen [13] highlighted China’s large share on total water footprint when quantifying global WF using a bottom-up approach. The second category is based on China as a single research area; tending to focus on agricultural products thus adopting the bottom-up approach. Zhao et al. [29] and Zhuo et al. [30], applied the bottom-up approach to calculating China’s WF in exploration of the factors affecting agricultural production. There are also plenty of studies using the bottom-up approach to quantify WF at regional/river basin level within China [31,32,33,34]. The final category is the adoption of the top-down approach with a single-region input–output (SRIO) table to quantify the water footprint for defined economic sectors when choosing China as a single research area. Zhao et al. [14] calculated China’s WF using the SRIO method, and verified that China was a net virtual water exporter when considering all economic sectors. Yang et al. [13] adopted SRIO based WF analysis to quantify WF of China between 1997–2007, and further investigated the factors of China’s growing water use. Wang et al. [35] provided detailed information on China’s WF changes under the influence of policy development using SRIO based analysis. However, using the SRIO method to define China as a single region fails to reflect its important trading relations with other regions/countries. The multi-region input–output (MRIO) approach can thus overcome this problem, however few studies have used MRIO to quantify China’s WF and the interrelationships with other geographical areas.
The net virtual water import helps water scarce regions to save their water resources [36,37]. In order to achieve national water saving towards virtual water trade, it is important to know if China is a net virtual water importer or exporter, in the meantime, identify the key countries/regions and sectors that having intensive trade with China. Plenty of studies applied the bottom-up approach and found China is a net virtual water importer of agricultural products [29,30,31,32,33,34], which can be traced back to year 1961 [38]. In 2001, China became the largest virtual water importer of agricultural products in the world, then the volume of virtual water import doubled to 71 km3 in 2007 [39]. Although it seems that China’s water resource is saved due to import of agricultural products, the SRIO accounting showed that China has been experiencing water loss for being a net virtual water exporting country of all economic sectors during the period 2000–2012 [19,40]. However, the results from SRIO method can raise questions, because the SRIO method assumes the technical coefficients of imported products are the same with that of domestic products. In reality, imports come from different countries/regions with different production technology and therefore technical coefficients. The MRIO method can overcome the above challenge by distinguishing countries/regions and corresponding production technology. Seldom have studies applied the MRIO method to examine China’s virtual water trade with other countries/region. A notable exception is from Lenzen et al. [41], who employed a global MRIO database, named Eora, to quantify the global virtual water trade in the year 2000, and found China was the third largest net virtual water exporter in the world, next to Thailand and Pakistan. Since the above study focused on global virtual water network, detailed information related to China’s virtual water trade with key countries/regions and sectors are absent. In addition, an update of research year is needed.
This study therefore utilizes MRIO analysis to assess the blue and green WF of China from both the production and consumption perspectives. The aim is to put China’s water use pattern into a global context through linking China’s virtual water trade with other countries in sectoral details. From production perspective, we investigate how the water use in China virtually flows to fulfill domestic final demand and export to other countries/regions through the supply chain. From consumption perspective, we can examine how the consumption of China drive the domestic water use and virtual water import. The combination of both production and consumption perspectives will provide a holistic view for China’s virtual water trade with other countries/regions, check if China is a net virtual water exporter considering all economic sectors, and identify the key countries/regions and sectors that having intensive trade with China. The global MRIO table World Input–Output Database (WIOD) including the economic interrelationship between 40 countries/regions and 35 economic sectors was used to quantify the WF of China. A comparison between the results from both production and consumption perspectives was then conducted.
2. Methodology and Data
2.1. Methodology
This study applies the MRIO framework to calculate the blue and green WF based on data from the WIOD [42]. We used the Water Embodied in Trade (WET) method to quantify the blue and green WF. The basic assumption of WET tables is as follows:
For an economy of region , the total output (in vector form) is produced for intermediate consumption and final consumption. The intermediate consumption includes domestic purchase and the sum of international purchase from different regions (export from region to ) . Likewise, there are domestic purchases and international purchases for final consumption. Hence, the total output is given by summing over intermediate and final consumption.
In a WET framework, the assumption is that bilateral trade between regions are all directed toward final consumption [43]. It means in Equation (1) there is no international purchase of intermediate consumption, and the international purchase of intermediate consumption is assigned to the international purchase of final consumption. This means is replaced by , where represents the international purchase of final consumption under the WET framework. Then the formulation of WET can be shown as
To solve for any arbitrary final consumption, the technical coefficient was introduced which represents the intermediate inputs of each sector per unit of their output. In Equation (2), let where represents technical coefficients of domestic intermediate inputs
Equation (3) can be solved as
Equation (4) may be expanded to show the economic interrelationship among regions, and the matrix form of WET for regions is shown below.
Full details may be obtained in Feng et al. [26] and Zhao et al. [44]. Herein, we utilized a simplified WET method to analyze China’s blue and green WF from the production and consumption perspectives.
The simplified WET framework can be expressed as
where is the total output of China in vector form; is the technical coefficient of China in the form of a matrix presenting the intermediate input value of each sector through output processes; is the vector form of domestic final consumption; and is China’s export volume to satisfy the final consumptive demand of other regions .
Under the WET framework, the blue and green IWF can be expressed as
where is the internal water footprint of China; and is the direct blue and green water intensity of China in diagonal matrix form representing direct blue and green water consumption per unit of output. is the Leontief inverse matrix, where is the identity matrix; is the technical coefficient matrix; and is the diagonal matrix for total final demand of China.
The blue and green VWE can be expressed as
in which is the virtual water export of China; and is the export from China to satisfy the consumptive demand of region in diagonal matrix form.
The blue and green VWI can thus be expressed as
in which VWI is the virtual water import of China and is equal to the sum of exports from other regions to China. is the direct blue and green water intensity of region in the form of a diagonal matrix; is the technical coefficient matrix of the region ; and is the export from region to China in diagonal matrix form.
Combining the IWF and VWE, the production related blue and green WF of China can be calculated
Adding the IWF to VWI results in the consumption-related blue and green WF
2.2. Data
The MRIO table and blue and green water use data were collected from the WIOD [45]. The WIOD covers 40 countries/regions and 35 economic sectors for each country/region between 1995 and 2009 (sector details see Table 1). The water use data was derived from the multi-year average [45], we selected data from 2009 to acquire the latest available blue and green WF information. Because of data limitations Chinese Taipei is listed separately from Mainland China (China for short), and other countries/regions not shown are classified as rest of world (ROW). Data for 35 economic sectors are classified according to the International Standard Industrial Classification Revision 3 (ISIC Rev. 3); detailed sectoral information can be found in Table 1. Serrano et al. [16] obtained blue, green, and grey water use data from WIOD and applied an EE-MRIO model to examine environmental flows in the EU27 block of countries. However, no researcher has utilized MRIO tables from WIOD to assess water use in China. This approach helps to link economic activities in economic sectors with impacts on water resources; it also helps to distinguish between production and consumption based quantification.
3. Results
3.1. China’s Blue and Green Water Footprint from the Production Perspective
Globally, the total WF (blue and green water) from the production perspective (WFP) was 10,026.8 km3 in 2009. China had the second largest blue and green WFP with a volume of 1152.2 km3, second only to India (1170.3 km3). WFP can be sub-divided into internal water footprint (IWF) and virtual water exports (VWE). The blue WFP of China was 299.3 km3 with IWF contributing 248.9 km3 (83.2%) and VWE contributing 50.4 km3 (16.8%). The green WFP for China was 807.6 km3, of which IWF contributed 704.6 km3 (87.2%) and VWE was 102.9 km3 (12.7%). Overall, domestic demand was the main driving force for China’s blue and green WFP.
As major importers of goods and services, developed countries were the main driving force behind China’s production and resulting water use. The United States topped this list with a blue water import volume of 13.7 km3, followed by Japan (6.2 km3), Germany (3.7 km3), Korea (3.1 km3), India (2.3 km3), Canada (2.1 km3), United Kingdom (2.0 km3), Australia (1.8 km3), Russia (1.8 km3), and France (1.7 km3) (see Figure 1 for details). The countries with the highest green VWI from China were consistent with those of blue VWI, albeit with a slightly different order. The United States was the largest green water importer (26.0 km3), with Japan ranked second (14.8 km3). Other countries ranked sequentially amongst the top 10 were Germany (6.9 km3), Korea (5.5 km3), Russia (5.4 km3), Canada (4.8 km3), United Kingdom (4.3 km3), India (4.3 km3), Australia (3.7 km3), and France (3.4 km3). Amongst the top 10 combined blue and green VWI nations, developed countries contributed 103.6 km3 outflow from China.
In terms of sectoral distribution, blue and green WF related to agricultural production (Agriculture, Hunting, Forestry, and Fishing) occupied a large proportion (19%) of blue water WFP, which may be sub-divided into blue IWF (58.1 km3) and blue VWE (1.7 km3) (Table 1). The agricultural sector also had the largest share of green WFP 327.5 km3 (40.6%) of which IWF contributed 318.4 km3 (97.2%) and VWE 9.1 km3 (2.8%). In addition, the Food, Beverages, and Tobacco and Construction sectors were key contributing sectors for blue and green WFP. These two sectors were responsible for a total of 31.8% of blue WFP and 30.1% of green WFP. Detailed sectoral breakdowns by country are shown in Figure 1.
Looking at sectoral allocation of blue and green total VWE, the Textiles and Textile Products and Electrical and Optical Equipment sectors were major contributors to blue and green VWE of China, accounting for 41.1% and 43.3%, respectively. This is attributed to China’s export pattern and the mode of water use for production [4].
3.2. China’s Blue and Green Water Footprint from the Consumption Perspective
In 2009, the global blue and green water footprint from the consumption perspective (WFC) was 8728.1 km3. Amongst the countries/regions considered, China had the largest combined blue and green WFC of 1070.9 km3 (12.3%) of the global total. The WFC consists of internal water footprint (IWF) and virtual water import (VWI). China’s blue WFC was 277.0 km3, of which 248.9 km3 (89.8%) was blue IWF, and 27.8 km3 (10.2%) was blue VWI. For green WFC, China’s total was 793.9 km3 with IWF contributing 81.0% and VWI 19.0% as imports of goods and services from other countries in order to fulfill domestic demand. Although domestic demand was largely satisfied through internal production, imports provided a substantial amount of blue and green water (100.4 km3), which was roughly equal to the total blue and green WF of Turkey (102.4 km3).
The countries/regions mainly exporting blue and green water to China tended to be developed countries, such as United States, Canada, Australia, and Japan. China imported the largest amount of blue VWI from United States 4.0 km3 (14.4%), followed by Brazil (1.8 km3), India (1.3 km3), Russia (1.0 km3), Canada (0.9 km3), Australia (0.6 km3), Japan (0.5 km3), Chinese Taipei (0.4 km3), Sweden (0.2 km3), and Indonesia (0.2 km3). For green VWI, China imported the largest amount from Brazil (19.2%) and United States (16.5%), followed by Canada (6.6 km3), Russia (6.4 km3), Indonesia (6.0 km3), Australia (5.4 km3), India (3.3 km3), France (0.4 km3), Korea (0.3 km3), and Chinese Taipei (0.3 km3). It is worth noting that some countries/regions were found to be both significant exporters and importers of blue and green water to/from China, such as United States, Canada, Australia, India, and Korea. This is mainly because trade conducted between these countries/regions and China was more intense than with other countries, thus contained more blue and green water embodied in traded commodities.
The agricultural sector took the largest share for both blue and green WFC. For blue WFC, this sector consumed 64.1 km3 (23.1%) of China’s total blue WFC, consisting of 58.1 km3 of IWF and 6.0 km3 of VWI. For green WFC, the agricultural sector accounted for 393.7 km3 (78.3%) with 318.4 km3 provided by IWF and 75.4 km3 provided by VWI. The Food, Beverages, and Tobacco sector was another main sector for China’s blue and green WFC, accounting for 13.6% of blue WFC and 22.1% of green WFC.
The sectoral distribution of the main countries/regions exporting virtual water to China was different. In terms of green VWI, China mainly imported water via the agricultural sector from Brazil (30.2 km3), United States (24.7 km3), Canada (5.4 km3), Russia (5.2 km3), Australia (4.2 km3), and India (2.4 km3). Green VWI imports from France, Indonesia, Chinese Taipei, and Korea were mainly through the Food, Beverages, and Tobacco sector. Concerning blue VWI, virtual water flowed from United States, Australia, India, and Brazil into China via the agricultural sector. The Mining and Quarrying sector also took a large share with blue VWI flowing from Brazil (0.5 km3), Russia (0.3 km3), and Canada (0.2 km3) to China. Blue VWI from Japan and Chinese Taipei was mainly via the Chemicals and Chemical Products and Electrical and Optical Equipment sectors. Sweden is noteworthy for being different from other countries in that it had a relatively scattered sectoral distribution, with the Pulp, Paper, Paper, Printing, and Publishing; Electricity, Gas, and Water Supply; and Renting of M&Eq and Other Business Activities sectors contributing the most (see Figure 1 for details).
3.3. Net Blue and Green Virtual Water Flows of China
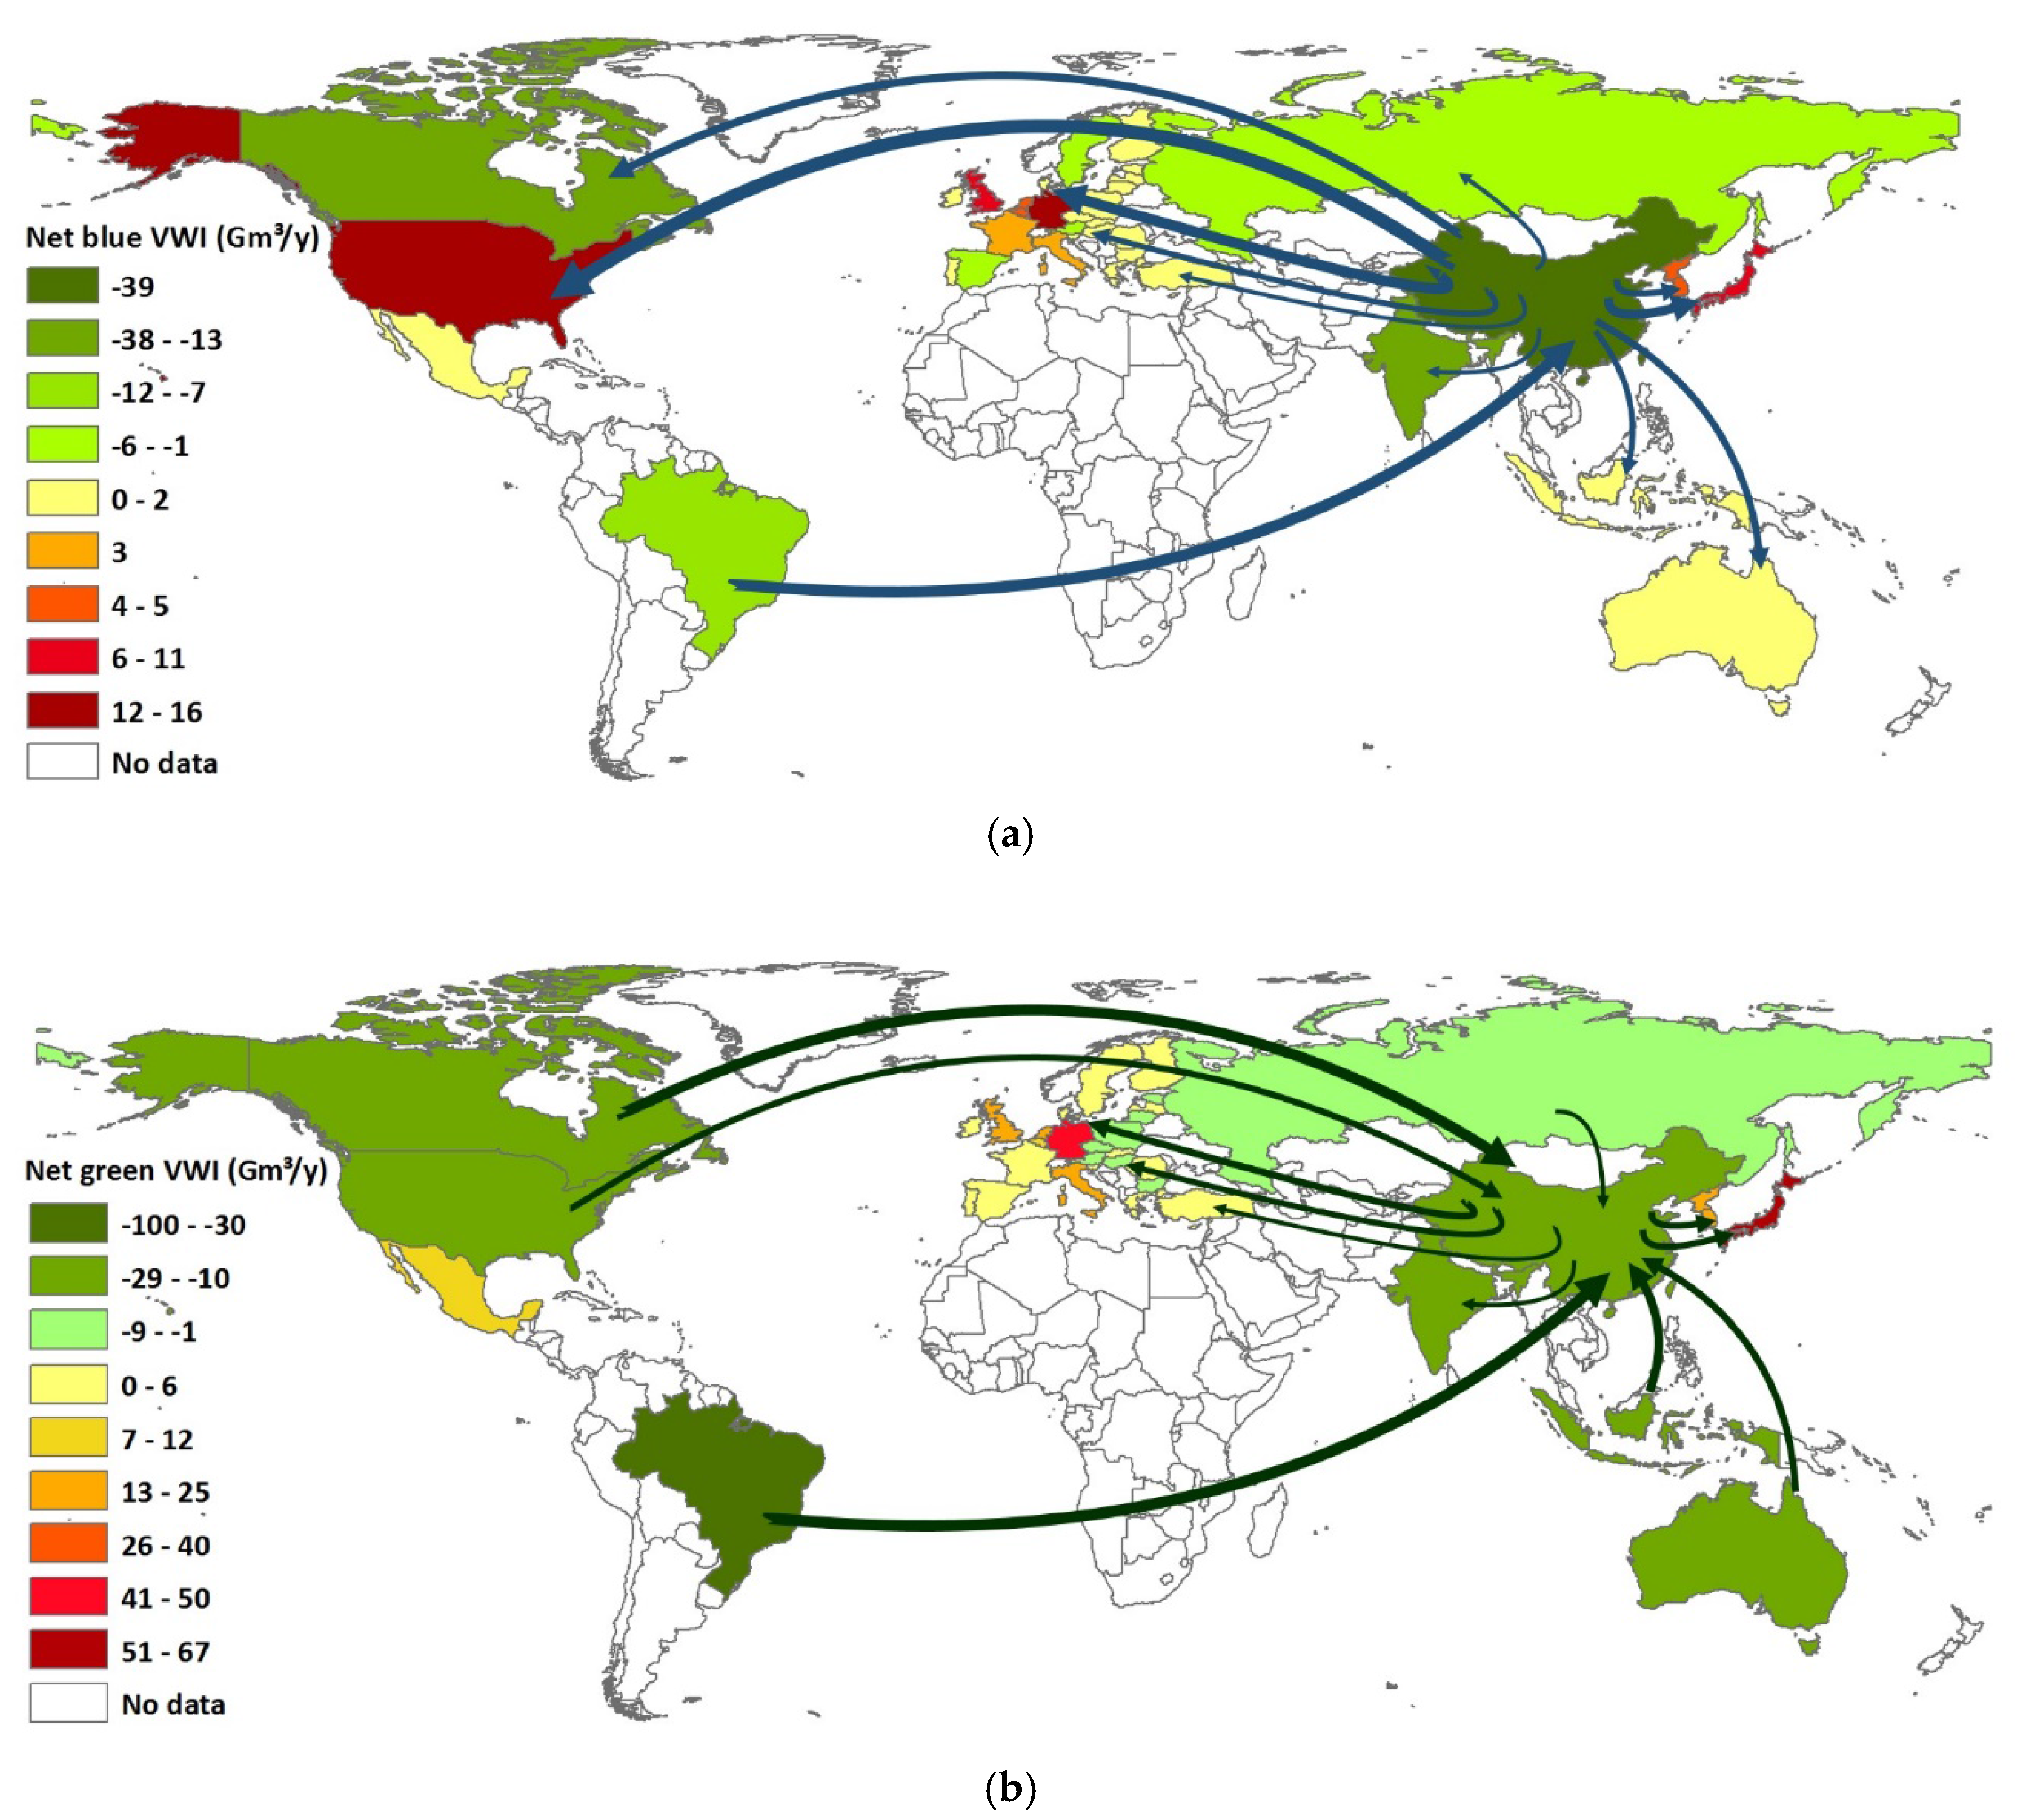
Overall, China’s blue and green virtual water trade had a net export status. VWE (153.3 km3) exceeded VWI (99.8 km3) thus creating a net outflow of 53.5 km3. For blue water, trade had a net export effect with VWE exceeding VWI by 38.8 km3. The top five destinations of China’s net blue water flows were United States (13.7 km3), Japan (6.2 km3), Germany (3.7 km3), Korea (5.5 km3), and India (5.4 km3). The net green VWE for China was 53.3 km3 with Japan (14.7 km3), Germany (6.8 km3), Korea (5.1 km3), United Kingdom (4.3 km3), and France (3.0 km3) being the main destinations (Figure 2). The main net blue and green water flows can be seen in Figure 3. The majority of blue water exports was to developed countries such as United States, Japan, Germany, Korea, United Kingdom, Australia, and France. A large volume of green water was also exported to developed countries such as United States, Japan, Germany, Korea, Canada, United Kingdom, Australia, and France. The agricultural sector was the most demanding sector for water with net 70.6 km3 blue and green VWI, comprising 4.3 km3 (11%) of blue VWI, and 66.3 km3 (89%) green VWI. The global distribution of net virtual water via the agricultural sector was consistent with virtual water flows. United States (3.0 km3), Brazil (0.9 km3), Indonesia (0.7 km3), Australia (0.4 km3), and Russia (0.1 km3) were the main blue water exporters to China’s agricultural sector. Brazil (30.1 km3), United States (23.2 km3), Canada (5.2 km3), Russia (4.6 km3), and Australia (4.1 km3) were the top five green water suppliers to the agricultural sector.
4. Discussion
In this paper, we utilized the MRIO approach to assess China’s blue and green WF under the influence of global trade. In contrast to single-region input–output approaches or bottom-up approaches, the MRIO approach may be applied to facilitate analysis of both internal and external WF with detailed industrial and manufacturing sectoral information. As a result, the MRIO approach can assign consumer responsibility for blue and green water consumption to specific sectors in different countries/regions having trade links with China. Hence, our study analyzed China’s water issues from a global perspective, without which attempts at local water management are likely fail since trade patterns and linkages are essentially invisible [16]. Our approach presents opportunity for greater consumer awareness and governmental/corporate responsibility at global level, and the setting of globally agreed standards for the protection of the environment and legal liabilities including economic and social exploitation based on virtual water flows. Quantifying blue and green WF with the MRIO framework is the first step towards incorporating China’s water management into a global perspective, thus allowing WF and virtual water trade to be taken into consideration when formulating international trade and associated tariffs.
As the country with the largest population in the world, China has played an important role in global network of virtual water trade. In terms of major trade partners of China, different patterns have been found for the countries/regions and sectors from importing and exporting side. Regarding the virtual water import of China, it is noted that Brazil, the United States, and Canada were the largest blue and green virtual water suppliers to China with the total volume of 33.55 km3, 31.22 km3, and 7.5 km3 virtual water flows to China in 2009, respectively. This is because China imported large amounts of agricultural products from these countries due to large food demand from its people. While looking at China’s virtual water export, China exported most of its virtual water (blue and green) to the United States, Japan, Korea, Germany, and the United Kingdom, which are mainly developed countries. This virtual water was mainly exported via the manufacturing sectors, such as Textiles and Textile Products; Electrical and Optical Equipment; and Food, Beverages, and Tobacco. Overall, China’s export overtook its import, making China a net virtual exporter to Japan, Germany, Korea, United Kingdom, France, etc. which are mostly developed countries. Virtual water exporting generates water loss and exerts additional water stress to China. Clearly, the characteristics of virtual water trade between China and its trade partners is a reflection of China’s global trade pattern, and such pattern will not be simply changed for the sake of water saving. So a realistic way to reduce virtual water exporting of China is to improve the industrial water use efficiency towards the above mentioned large exporting sectors. To achieve this goal, incentive mechanisms are required to promote water-saving technologies for manufacturing industry [44].
The agricultural sector was found to contribute most to China’s WFC and WFP. The sectoral distribution results also showed this sector contributed most (80.7%) to China’s blue and green VWI. Although China was a net total virtual water importing country in 2009, its agricultural sector was a net virtual water exporter. These results are consistent with the findings of Zhao et al. [14]; in addition our results show that the top 10 blue and green virtual water exporting countries/regions to China did so mainly through the agricultural sector. From Figure 1, it can be seen that United States was the largest blue water exporter, contributing 3.3 km3 blue water to China through its agricultural sector, with Brazil ranked second (1.0 km3). In terms of green water, Brazil contributed most to China’s green VWI with 30.2 km3 (95.0%) flowing into China’s agricultural sector, United States ranked second with 24.7 km3, and Canada was third with of 5.4 km3. Overall, United States, Brazil, and Canada exported the most blue and green water to China’s agricultural sector. This finding is consistent with previous studies, which applied the bottom-up methodology to quantify the WF of agricultural products [13,46,47]. For example, through a WF analysis of specific agricultural products Dalin et al. [47] found that large amounts of soybean were imported from United States, Brazil, and Canada making these countries major VWI suppliers to China. Although China’s agricultural policy is based on self-sufficiency, double-digit economic and population growth means it is increasingly dependent on external agricultural inputs [46]. The volume of virtual water import of agricultural products has increased 200% from 2001 to 2007 [40]. Specifically, the large increase of virtual water import was mainly because of the increased import of soybean, which has been almost relaxed of all importing restriction in 2000 [48]. It is also found that 93% of food related virtual water imports from China in 2005 are associated with soy-based commodities [49]. With increasing internal demand for agricultural products, including more water intensive products, the net virtual water export status of China could be reversed in the near future. Hence, water and food security of China should be further analyzed in the context of global trade and rising consumer affluence.
This study is subject to several limitations. First, the MRIO approach is used for the quantification. So the general limitations and assumptions in MRIO also apply to our quantification. Detailed information of such limitations can refer to Wiedmann [50], and overcoming these limitations is beyond the scope of this study. Second, sectoral aggregation of MRIO tables from WIOD data influences the accuracy of quantification [38]. For WIOD data, detailed agricultural sectors were aggregated as a single sector, i.e., Agriculture, Hunting, Forestry, and Fishing. Specific crop and animal products which contribute most to green and blue water demand need further examination. In addition, the WIOD data only cover 39 countries/regions, which are mainly OECD and EU countries. This makes the interrelationships of China with its trade partners incomplete. Choosing another global MRIO model with a more detailed country list and sectoral information of agriculture (for example, GTAP) can overcome this problem. Third, the study is static for only assessing the WF for one single year. The evolution of China’s WF and virtual water trade from 2009 to the present remains unknown. Overcoming limitations of data collection and static analysis can lead to a more accurate quantification and a more reliable recommendation.
5. Conclusions
In this paper, we have quantified blue and green WF of China from both production and consumption perspectives using a MRIO framework. The advantage of MRIO is that it also allows detailed analysis from a range of primary, secondary and tertiary sectors, allowing for the complex supply chain interactions existing within and between them. The results of the production based account illustrate the impact of international trade on China’s water use, and provide detailed sectoral information of blue and green virtual water exports. The results from the consumption based account attribute water use to 35 sectors and 40 countries/regions are in accordance with previous WF studies for China. In particular, the large demand for agricultural products has resulted in large VWI. Our study also provides a global perspective, with detailed sectoral information of 39 other countries/regions for assessing China’s water consumption. With blue and green WF quantified, virtual water flows between China and the world are clear, thus providing data support for the sustainable use of water resources in China. Such an approach opens up the possibility of dialogue in international trade negotiations with potential to improve global water security. Further studies could also be focused on grey WF in China to assess water pollutant mitigation or other environmental impacts brought about by international trade and pollution outsourcing. Finally, the MRIO approach can be further developed with more detailed regional information and explicit information for the range of agricultural products.
Author Contributions
S.H. carried out the analysis, wrote the paper, produced figures and tables. Y.L. (Yu Liu) collected and analyzed the data, provided the funding support, and revised the paper. X.Z. came up with the original idea, did the quantification, and revised the paper. M.R.T. revised the paper and polished the English writing. Y.L. (Yiping Li) revised the paper. All authors read and approved the submission.
Funding
This research received no external funding.
Acknowledgments
This research was funded by The National Key Research and Development Program of China (grant no.2016YFA0602500), the Fundamental Research Funds for the Central Universities (grant no. 2016B13814) and the Fund of Hohai University for Undergraduate on Innovation and Entrepreneurship Training Program (2018102941096).
Conflicts of Interest
The authors declare no conflict of interest.
References
- World Economic Formum. GLOBAL Risks 2015. Available online: http://reports.weforum.org/global-risks-2015/ (accessed on 18 June 2018).
- National Data Bureau of Statistics of China. Available online: http://data.stats.gov.cn/easyquery.htm?cn=C01 (accessed on 25 June 2018).
- Udimal, T.B.; Zhuang, J.C.; Emmanuel Caesar, A.; Samuel, M.O. China’s water situation; the supply of water and the pattern of its usage. Int. J. Sustain. Dev. 2017, 6, 491–500. [Google Scholar] [CrossRef]
- Ridoutt, B.G.; Pfister, S. A revised approach to water footprinting to make transparent the impacts of consumption and production on global freshwater scarcity. Glob. Environ. Chang. 2010, 20, 113–120. [Google Scholar] [CrossRef]
- Munksgaard, J.; Wier, M.; Lenzen, M.; Dey, C. Using Input-Output Analysis to Measure the environmental pressure of consumption at different spatial levels. J. Ind. Ecol. 2005, 9, 169–185. [Google Scholar] [CrossRef]
- Hoekstra, A.Y.; Hung, P.Q. Virtual water trade: A quantification of virtual water flows between nations in relation to international crop trade. In Value of Water Research Report Series No. 11; UNESCO-IHE: Delft, The Netherlands, 2002. [Google Scholar]
- Chenoweth, J.; Hadjikakou, M.; Zoumides, C. Quantifying the human impact on water resources: A critical review of the water footprint concept. Hydrol. Earth Syst. Sci. 2014, 18, 2325–2342. [Google Scholar] [CrossRef] [Green Version]
- Mekonnen, M.M.; Hoekstra, A.Y. Global Gray Water Footprint and Water Pollution Levels Related to Anthropogenic Nitrogen Loads to Fresh Water. Environ. Sci. Technol. 2015, 49, 12860–12868. [Google Scholar] [CrossRef] [PubMed]
- Liu, W.; Antonelli, M.; Liu, X.; Yang, H. Towards improvement of grey water footprint assessment: With an illustration for global maize cultivation. J. Clean. Prod. 2017, 147, 1–9. [Google Scholar] [CrossRef]
- Zhuo, L.; Mekonnen, M.M.; Hoekstra, A.Y. The effect of inter-annual variability of consumption, production, trade and climate on crop-related green and blue water footprints and inter-regional virtual water trade: A study for China (1978–2008). Water Res. 2016, 94, 73–85. [Google Scholar] [CrossRef] [PubMed]
- Bosire, C.K.; Lannerstad, M.; Leeuw, J.D.; Krol, M.S.; Ogutu, J.O.; Ochungo, P.A.; Hoekstra, A.Y. Urban consumption of meat and milk and its green and blue water footprints—Patterns in the 1980s and 2000s for Nairobi, Kenya. Sci. Total Environ. 2017, 579, 786–796. [Google Scholar] [CrossRef] [PubMed]
- Civit, B.; Piastrellini, R.; Curadelli, S.; Arena, A.P. The water consumed in the production of grapes for vinification (Vitis vinifera). Mapping the blue and green water footprint. Ecol. Indic. 2018, 85, 236–243. [Google Scholar] [CrossRef]
- Hoekstra, A.Y.; Mekonnen, M.M. The water footprint of humanity. Proc. Natl. Acad. Sci. USA 2012, 109, 3232–3237. [Google Scholar] [CrossRef] [PubMed] [Green Version]
- Zhao, X.; Yang, H.; Yang, Z.; Chen, B.; Qin, Y. Applying the input-output method to account for WF and VWT in Haihe River Basin in China. Environ. Sci. Technol. 2010, 44, 9150–9156. [Google Scholar] [CrossRef] [PubMed]
- Pellicer-Martínez, F.; Martínez-Paz, J.M. Probabilistic evaluation of the water footprint of a river basin: Accounting method and case study in the Segura River Basin, Spain. Sci. Total Environ. 2018, 627, 28–38. [Google Scholar] [CrossRef] [PubMed]
- Serrano, A.; Guan, D.; Duarte, R.; Paavola, J. Virtual Water Flows in the EU27: A Consumption-based Approach. J. Ind. Ecol. 2016, 20, 547–558. [Google Scholar] [CrossRef] [Green Version]
- Gobin, A.; Kersebaum, K.C.; Eitzinger, J.; Trnka, M.; Hlavinka, P.; Takáč, J.; Kroes, J.; Ventrella, D.; Marta, A.D.; Deelstra, J.; et al. Variability in the water footprint of arable crop production across European regions. Water 2017, 9, 93. [Google Scholar] [CrossRef]
- Yang, Z.; Liu, H.; Xu, X.; Yang, T. Applying the Water Footprint and dynamic Structural Decomposition Analysis on the growing water use in China during 1997–2007. Ecol. Indic. 2016, 60, 634–643. [Google Scholar] [CrossRef]
- Zhao, X.; Chen, B.; Yang, Z.F. National water footprint in an input–output framework—A case study of China 2002. Ecol. Model. 2009, 220, 245–253. [Google Scholar] [CrossRef]
- Chouchane, H.; Krol, M.S.; Hoekstra, A.Y. Virtual water trade patterns in relation to environmental and socioeconomic factors: A case study for Tunisia. Sci. Total Environ. 2018, 613, 287–297. [Google Scholar] [CrossRef] [PubMed]
- Zoumides, C.; Bruggeman, A.; Hadjikakou, M.; Zachariadis, T. Policy-relevant indicators for semi-arid nations: The water footprint of crop production and supply utilization of Cyprus. Ecol. Indic. 2014, 43, 205–214. [Google Scholar] [CrossRef]
- Zhang, F.; Zhan, J.Y.; Li, Z.H.; Jia, S.Q.; Chen, S.J. Impacts of urban transformation on water footprint and sustainable energy in Shanghai, China. J. Clean. Prod. 2018, 190, 847–853. [Google Scholar] [CrossRef]
- Vanham, D.; Mak, T.N.; Gawlik, B.M. Urban food consumption and associated water resources: The example of Dutch cities. Sci. Total Environ. 2016, 565, 232–239. [Google Scholar] [CrossRef] [PubMed]
- Shi, J.; Liu, J.; Pinter, L. Recent evolution of China’s virtual water trade: Analysis of selected crops and considerations for policy. Hydrol. Earth Syst. Sci. 2014, 18, 1349–1357. [Google Scholar] [CrossRef] [Green Version]
- Hanasaki, N.; Kanae, S.; Oki, T. An integrated model for the assessment of global water resources-Part 2: Applications and assessments. Hydrol. Earth Syst. Sci. 2008, 12, 1027–1037. [Google Scholar] [CrossRef]
- Feng, K.; Chapagain, A.; Suh, S.; Pfister, S.; Hubacek, K. Comparison of bottom-up and top-down approaches to calculating the water footprints of nations. Econ. Syst. Res. 2011, 23, 371–385. [Google Scholar] [CrossRef]
- Yang, H.; Pfister, S.; Bhaduri, A. Accounting for a scarce resource: Virtual water and water footprint in the global water system. Curr. Opin. Environ. Sustain. 2013, 5, 599–606. [Google Scholar] [CrossRef]
- Malik, A.; McBain, D.; Wiedmann, T.O.; Lenzen, M.; Murray, J. Advancements in Input-Output Models and Indicators for Consumption-Based Accounting. J. Ind. Ecol. 2018, 1–18. [Google Scholar] [CrossRef]
- Zhao, C.; Chen, B.; Hayat, T.; Alsaedi, A.; Bashir, A. Driving force analysis of water footprint change based on extended STIRPAT model: Evidence from the Chinese agricultural sector. Ecol. Indic. 2014, 47, 43–49. [Google Scholar] [CrossRef]
- Zhuo, L.; Mekonnen, M.M.; Hoekstra, A.Y. Consumptive water footprint and virtual water trade scenarios for China—With a focus on crop production, consumption and trade. Environ. Int. 2016, 94, 211–223. [Google Scholar] [CrossRef] [PubMed]
- Zhuo, L.; Mekonnen, M.M.; Hoekstra, A.Y.; Wada, Y. Inter- and intra-annual variation of water footprint of crops and blue water scarcity in the Yellow River basin (1961–2009). Adv. Water Resour. 2016, 87, 29–41. [Google Scholar] [CrossRef]
- Cao, X.; Wu, M.; Shu, R.; Zhuo, L.; Chen, D.; Shao, G.; Guo, X.; Wang, W.; Tang, S. Water footprint assessment for crop production based on field measurements: A case study of irrigated paddy rice in East China. Sci. Total Environ. 2018, 610–611, 84–93. [Google Scholar]
- Zhang, Y.; Huang, K.; Ridoutt, B.G.; Yu, Y. Comparing volumetric and impact-oriented water footprint indicators: Case study of agricultural production in Lake Dianchi Basin, China. Ecol. Indic. 2018, 87, 14–21. [Google Scholar] [CrossRef]
- Wang, X.; Li, X.; Fischer, G.; Sun, L.; Tan, M.; Xin, L.; Liang, Z. Impact of the changing area sown to winter wheat on crop water footprint in the North China Plain. Ecol. Indic. 2015, 57, 100–109. [Google Scholar] [CrossRef] [Green Version]
- Wang, X.M.; Huang, K.; Yu, Y.J.; Hu, T.T.; Xu, Y.J. An input–output structural decomposition analysis of changes in sectoral water footprint in China. Ecol. Indic. 2016, 69, 26–34. [Google Scholar] [CrossRef]
- Oki, T.; Kanae, S. Virtual water trade and world water resources. Water Sci. Technol. 2004, 49, 203–209. [Google Scholar] [CrossRef] [PubMed]
- Chapagain, A.; Hoekstra, A.; Savenije, H. Water saving through international trade of agricultural products. Hydrol. Earth Syst. Sci. 2006, 10, 455–468. [Google Scholar] [CrossRef] [Green Version]
- Liu, J.; Zehnder, A.J.B.; Yang, H. Historical Trends in China’s Virtual Water Trade. Water Int. 2007, 32, 78–90. [Google Scholar] [CrossRef]
- Chen, W.; Wu, S.; Lei, Y.; Li, S. Virtual water export and import in china’s foreign trade: A quantification using input-output tables of China from 2000 to 2012. Resour. Conserv. Recyl. 2018, 132, 278–290. [Google Scholar] [CrossRef]
- Dalin, C.; Konar, M.; Hanasaki, N.; Rinaldo, A.; Rodriguez-Iturbe, I. Evolution of the global virtual water trade network. Proc. Natl. Acad. Sci. USA 2012, 109, 5989–5994. [Google Scholar] [CrossRef] [PubMed] [Green Version]
- Lenzen, M.; Moran, D.; Bhaduri, A.; Kanemoto, K.; Bekchanov, M.; Geschke, A.; Foran, B. International trade of scarce water. Ecol. Econ. 2013, 94, 78–85. [Google Scholar] [CrossRef]
- Timmer, M.P.; Dietzenbacher, E.; Los, B.; Stehrer, R.; de Vries, G.J. An illustrated user guide to the world input–output database: The case of global automotive production. Rev. Int. Econ. 2015, 23, 575–605. [Google Scholar] [CrossRef]
- Peters, G.P.; Hertwich, E.G. CO2 embodied in international trade with implications for global climate policy. Environ. Sci. Technol. 2008, 42, 1401–1407. [Google Scholar] [CrossRef] [PubMed]
- Zhao, X.; Liu, J.; Liu, Q.; Tillotson, M.R.; Guan, D.; Hubacek, K. Physical and virtual water transfers for regional water stress alleviation in China. Proc. Natl. Acad. Sci. USA 2015, 112, 1031–1035. [Google Scholar] [CrossRef] [PubMed] [Green Version]
- Genty, A. Final Database of Environmental Satellite Accounts: Technical Report on Their Compilation. WIOD Deliverable 4.6, Documentation. 2012. Available online: www.wiod.org/publications/source_docs/Environmental_Sources.pdf (accessed on 17 April 2018).
- Liu, J.G.; Yang, H. Spatially explicit assessment of global consumptive water uses in cropland: Green and blue water. J. Hydrol. 2010, 384, 187–197. [Google Scholar] [CrossRef]
- Dalin, C.; Hanasaki, N.; Qiu, H.G.; Mauzerall, D.L.; Rodriguez-Iturbe, I. Water resources transfers through Chinese interprovincial and foreign food trade. Proc. Natl. Acad. Sci. USA 2014, 111, 9774–9779. [Google Scholar] [CrossRef] [PubMed] [Green Version]
- Carter, C.A.; Rozelle, S. Will China’s agricultural trade reflect its comparative advantage? In China’s Food and Agriculture: Issues for the 21st Century; Gale, F., Ed.; U.S. Department of Agriculture: Washington, DC, USA, 2001; pp. 27–30. [Google Scholar]
- Dalin, C.; Suweis, S.; Konar, M.; Hanasaki, N.; Rodriguez-Iturbe, I. Modeling past and future structure of the global virtual water trade network. Geogr. Res. Lett. 2012, 39, L24402. [Google Scholar] [CrossRef]
- Wiedmann, T. A review of recent multi-region input–output models used for consumption-based emission and resource accounting. Ecol. Econ. 2009, 69, 211–222. [Google Scholar] [CrossRef]
Figure 1.
Comparison of sectoral allocation of top 10 green/blue virtual water importing and exporting countries to/from China (km3) in 2009.
Figure 1.
Comparison of sectoral allocation of top 10 green/blue virtual water importing and exporting countries to/from China (km3) in 2009.
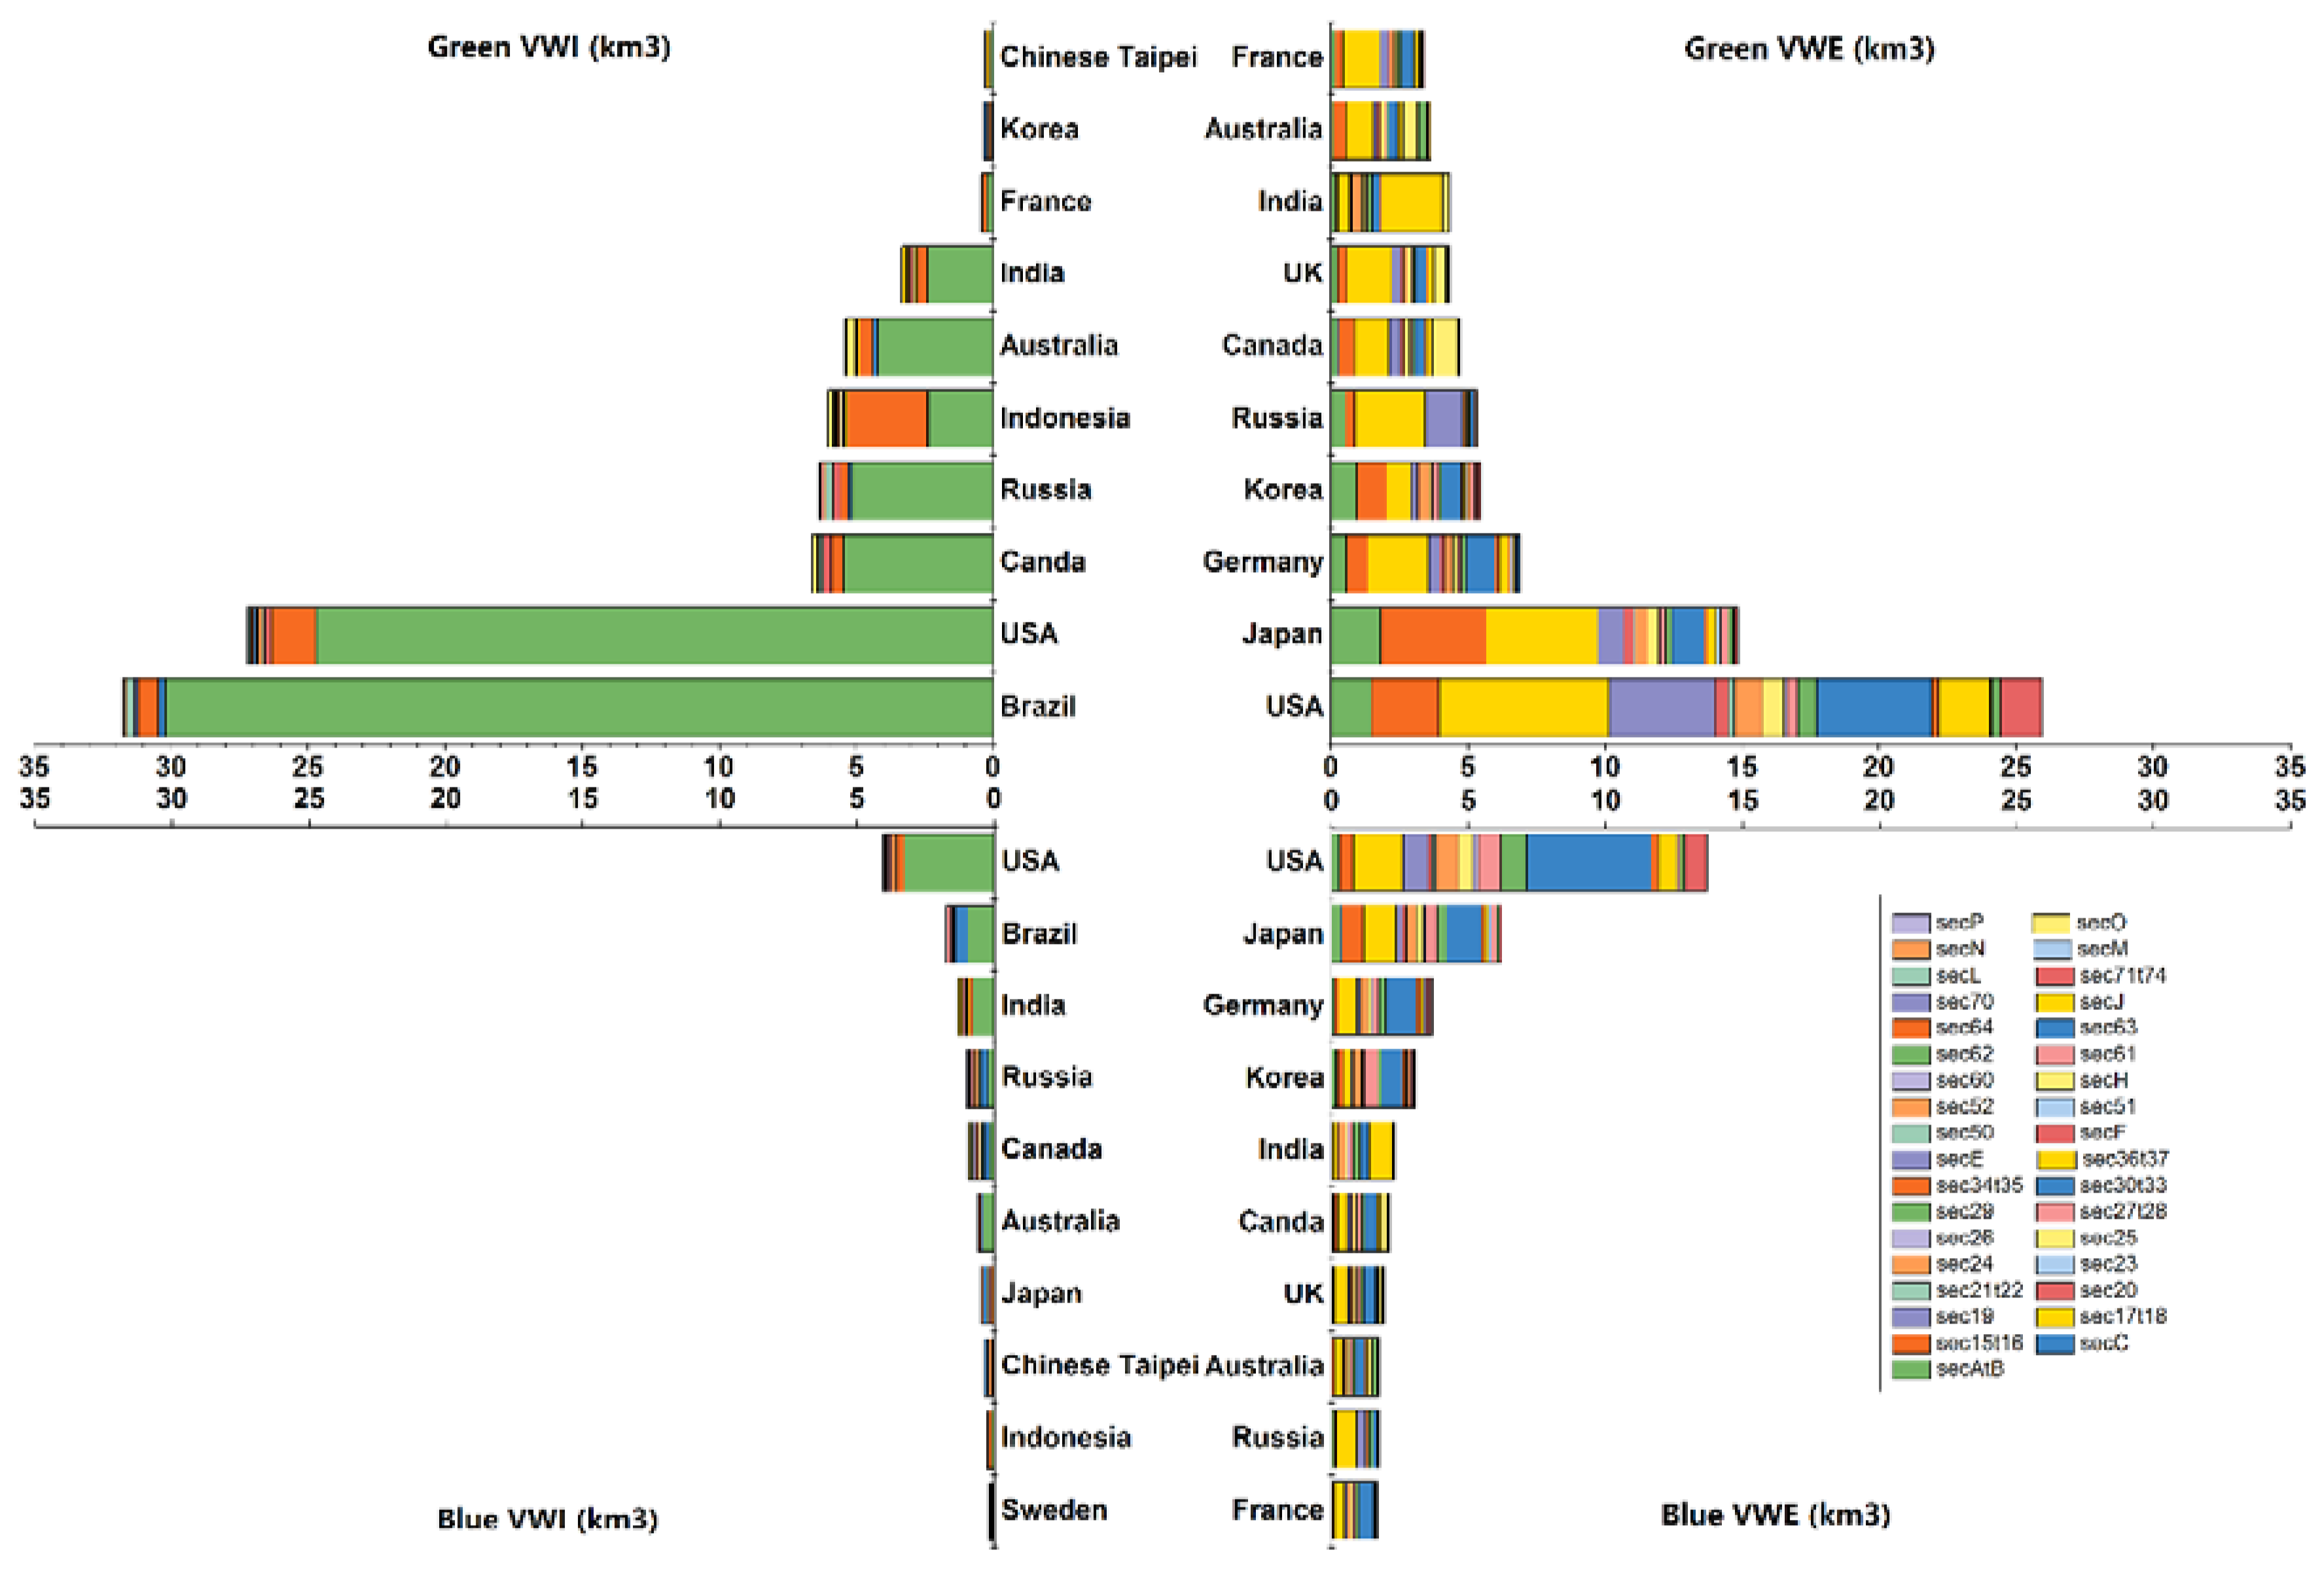
Figure 2.
Destinations for net green/blue virtual water exports of China in 2009 (km3).
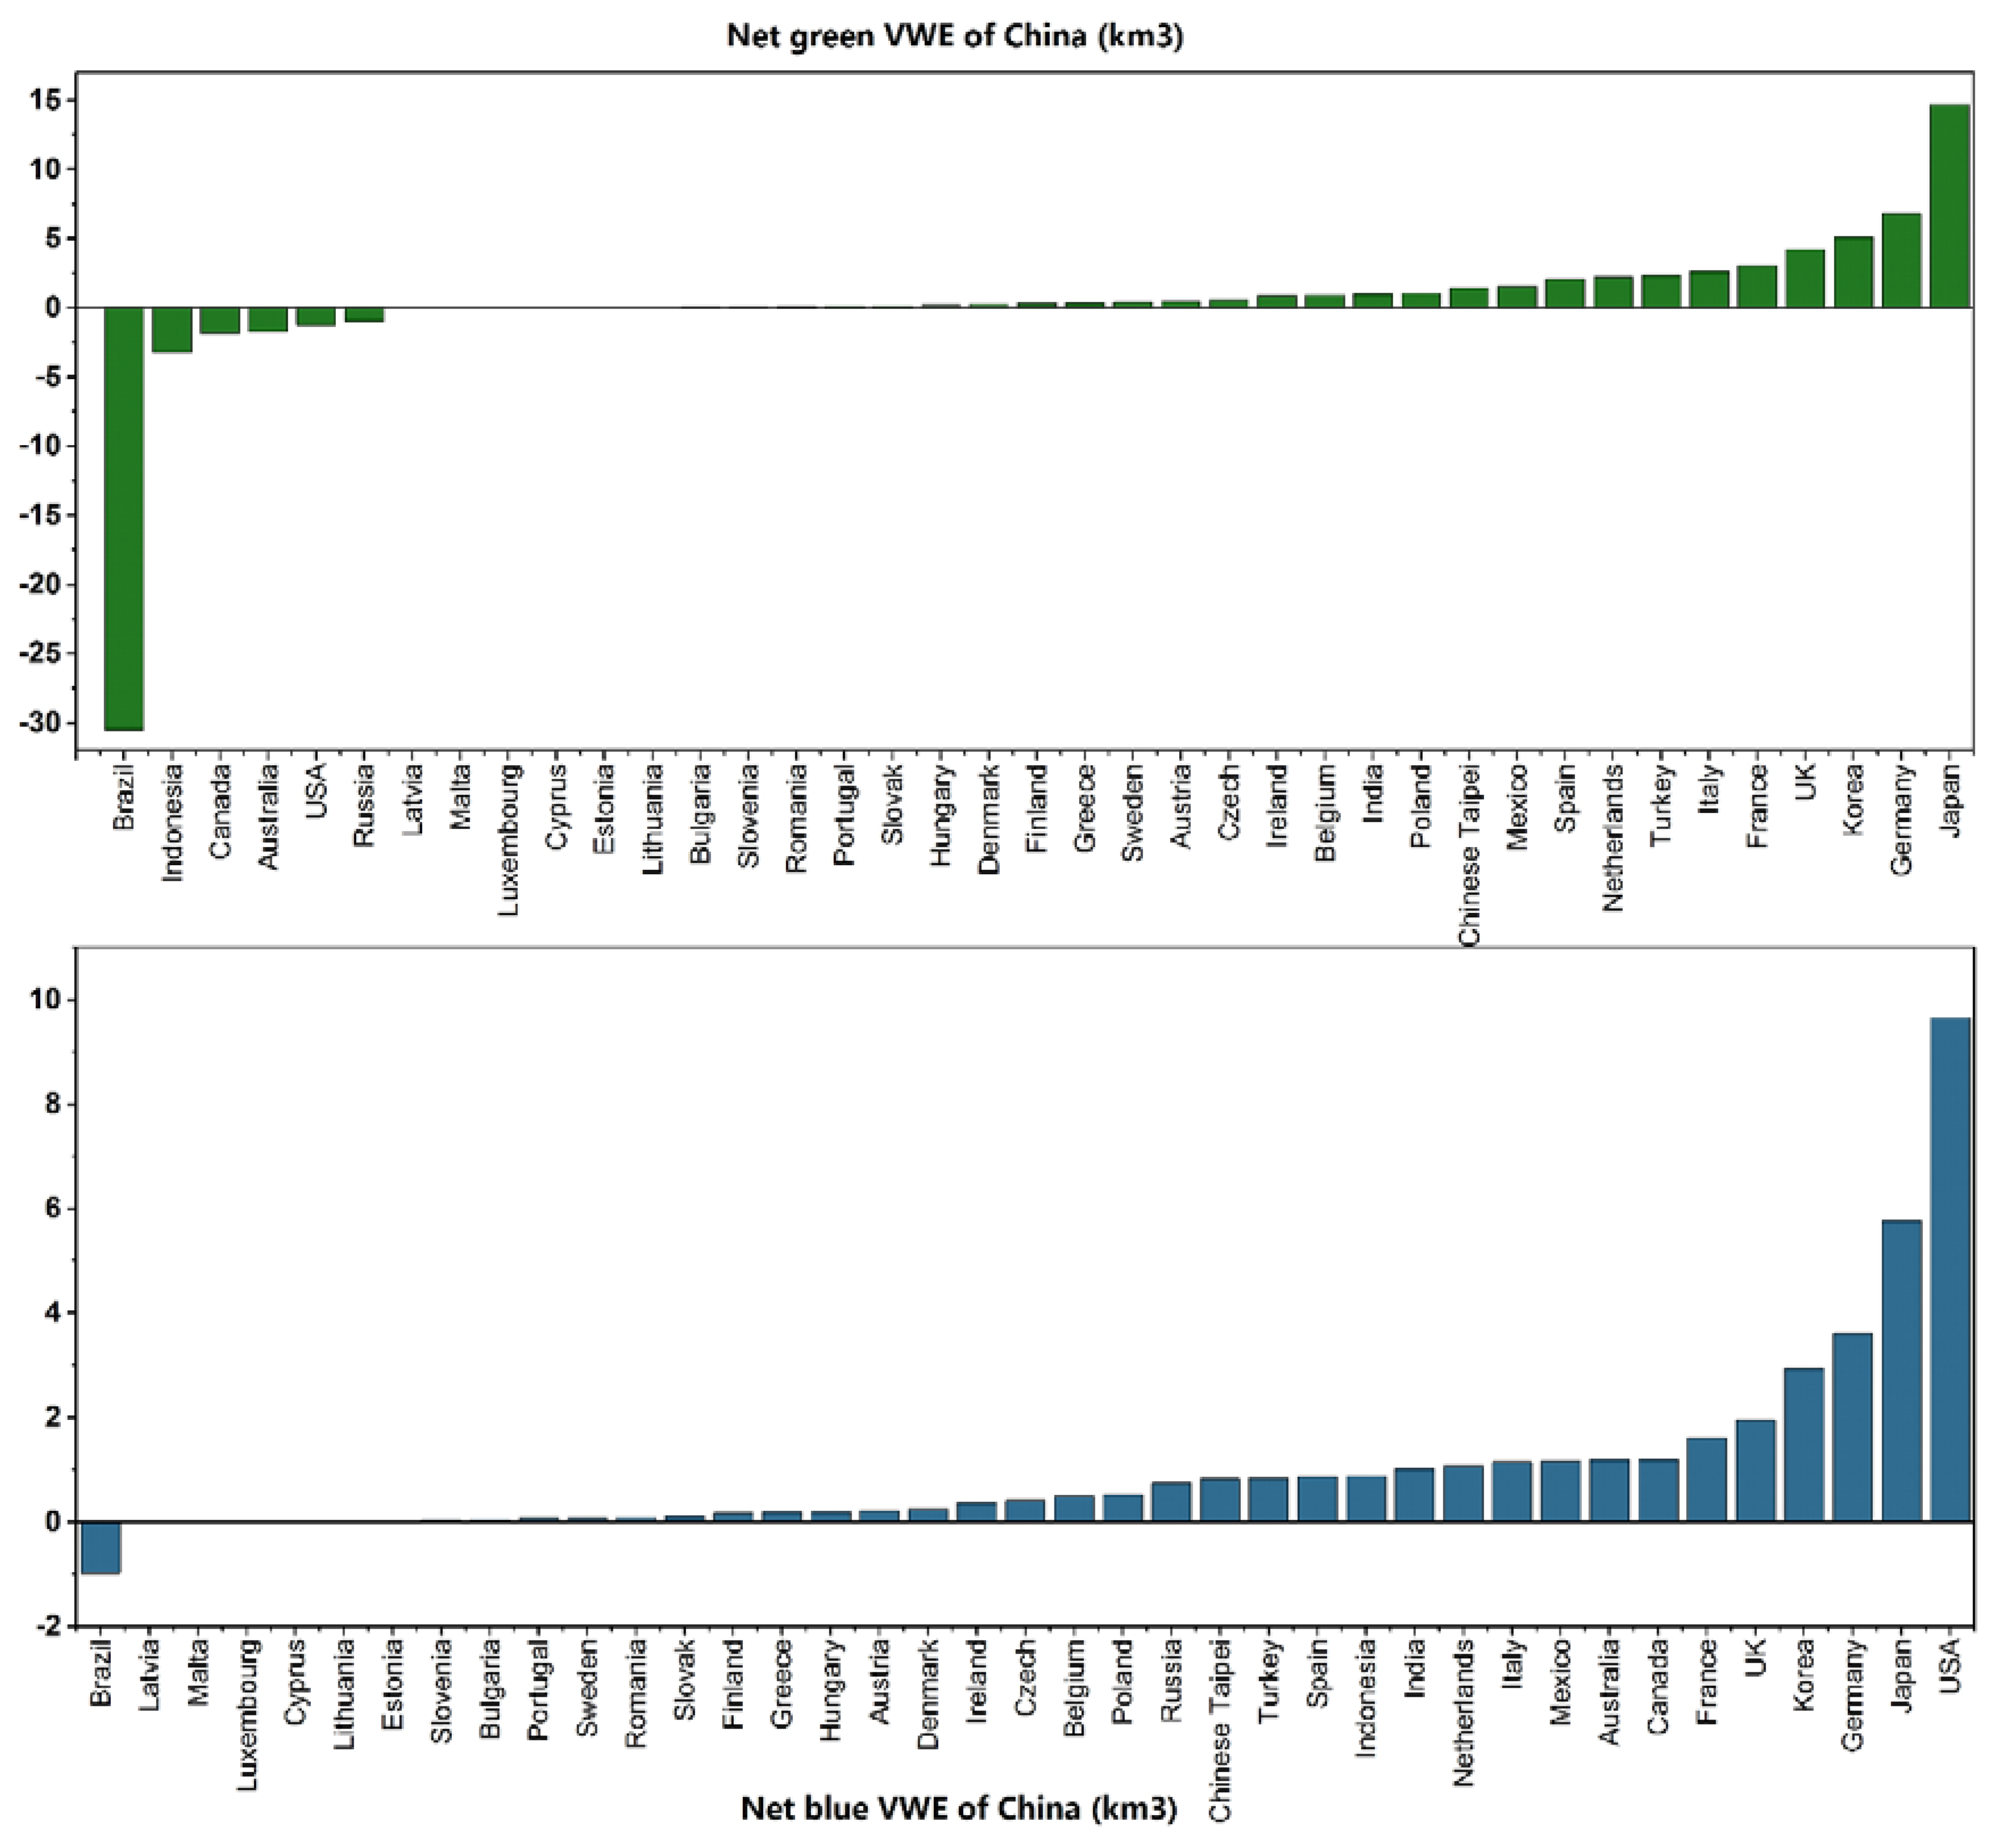
Figure 3.
Net virtual water imports of 40 countries/regions and net virtual water flow directions for China in 2009 (km3) The color of each country/region represents its total net blue or green virtual water import value and the direction of each arrow represents net blue or green virtual water import value between China and other countries/regions. If the value is positive, the arrow should flow towards China, whereas, if the value is negative, the arrow should flow towards other countries/regions. (a) net blue water import; (b) net green water import.

Table 1.
Sectoral allocation of China’s blue and green water footprint in 2009.
| Sector Abbreviation | Sector Full Name | IWF Unit: km3 | VWI Unit: km3 | VWE Unit: km3 | WFP Unit: km3 | WFC Unit: km3 |
|---|---|---|---|---|---|---|
| secAtB | Agriculture, Hunting, Forestry, and Fishing | 376.5 | 81.3 | 10.8 | 387.3 | 457.8 |
| secC | Mining and Quarrying | 0.6 | 1.7 | 0.4 | 1.0 | 2.3 |
| sec15t16 | Food, Beverages, and Tobacco | 204.1 | 8.0 | 14.6 | 218.7 | 212.1 |
| sec17t18 | Textiles and Textile Products | 24.9 | 0.5 | 38.0 | 62.9 | 25.4 |
| sec19 | Leather, Leather and Footwear | 12.4 | 0.3 | 11.5 | 23.9 | 12.7 |
| sec20 | Wood and Products of Wood and Cork | 1.0 | 1.1 | 2.1 | 3.1 | 2.1 |
| sec21t22 | Pulp, Paper, Paper, Printing, and Publishing | 0.4 | 1.2 | 0.8 | 1.2 | 1.6 |
| sec23 | Coke, Refined Petroleum, and Nuclear Fuel | 0.2 | 0.0 | 0.1 | 0.3 | 0.2 |
| sec24 | Chemicals and Chemical Products | 3.8 | 1.5 | 8.0 | 11.8 | 5.3 |
| sec25 | Rubber and Plastics | 1.4 | 0.2 | 4.3 | 5.7 | 1.6 |
| sec26 | Other Non-Metallic Mineral | 0.3 | 0.1 | 1.2 | 1.5 | 0.4 |
| sec27t28 | Basic Metals and Fabricated Metal | 3.2 | 1.0 | 5.1 | 8.3 | 4.2 |
| sec29 | Machinery, Nec | 16.5 | 0.5 | 5.5 | 22.0 | 17.0 |
| sec30t33 | Electrical and Optical Equipment | 13.0 | 1.0 | 25.3 | 38.3 | 14.0 |
| sec34t35 | Transport Equipment | 16.2 | 0.3 | 2.4 | 18.6 | 16.5 |
| sec36t37 | Manufacturing, Nec; Recycling | 1.8 | 0.3 | 8.6 | 10.4 | 2.1 |
| secE | Electricity, Gas and Water Supply | 10.6 | 0.1 | 0.4 | 11.0 | 10.7 |
| secF | Construction | 126.5 | 0.0 | 0.4 | 126.9 | 126.5 |
| sec50 | Sale, Maintenance and Repair of Motor Vehicles and Motorcycles; Retail Sale of Fuel | 0.0 | 0.0 | 0.0 | 0.0 | 0.0 |
| sec51 | Wholesale Trade and Commission Trade, Except of Motor Vehicles and Motorcycles | 9.3 | 0.1 | 0.9 | 10.2 | 9.4 |
| sec52 | Retail Trade, Except of Motor Vehicles and Motorcycles; Repair of Household Goods | 1.9 | 0.0 | 0.4 | 2.3 | 1.9 |
| secH | Hotels and Restaurants | 34.7 | 0.9 | 3.9 | 38.6 | 35.6 |
| sec60 | Inland Transport | 1.8 | 0.2 | 0.4 | 2.2 | 2.0 |
| sec61 | Water Transport | 0.4 | 0.0 | 1.0 | 1.4 | 0.4 |
| sec62 | Air Transport | 0.2 | 0.0 | 1.5 | 1.7 | 0.2 |
| sec63 | Other Supporting and Auxiliary Transport Activities; Activities of Travel Agencies | 2.3 | 0.0 | 0.5 | 2.8 | 2.3 |
| sec64 | Post and Telecommunications | 3.2 | 0.0 | 0.3 | 3.5 | 3.2 |
| secJ | Financial Intermediation | 2.7 | 0.0 | 0.0 | 2.7 | 2.7 |
| sec70 | Real Estate Activities | 4.4 | 0.0 | 0.0 | 4.4 | 4.4 |
| sec71t74 | Renting of M&Eq and Other Business Activities | 5.4 | 0.2 | 3.6 | 9.0 | 5.6 |
| secL | Public Admin and Defence; Compulsory Social Security | 24.6 | 0.1 | 0.0 | 24.6 | 24.7 |
| secM | Education | 17.3 | 0.0 | 0.0 | 17.3 | 17.3 |
| secN | Health and Social Work | 21.3 | 0.0 | 0.1 | 21.4 | 21.3 |
| secO | Other Community, Social, and Personal Services | 10.5 | 0.1 | 0.9 | 11.4 | 10.6 |
| secP | Private Households with Employed Persons | 0.0 | 0.0 | 0.0 | 0.0 | 0.0 |
| sum | 953.4 | 100.7 | 153.0 | 1106.4 | 1054.1 |
© 2018 by the authors. Licensee MDPI, Basel, Switzerland. This article is an open access article distributed under the terms and conditions of the Creative Commons Attribution (CC BY) license (http://creativecommons.org/licenses/by/4.0/).
Share and Cite
MDPI and ACS Style
Hou, S.; Liu, Y.; Zhao, X.; Tillotson, M.R.; Guo, W.; Li, Y. Blue and Green Water Footprint Assessment for China—A Multi-Region Input–Output Approach. Sustainability 2018, 10, 2822. https://doi.org/10.3390/su10082822
AMA Style
Hou S, Liu Y, Zhao X, Tillotson MR, Guo W, Li Y. Blue and Green Water Footprint Assessment for China—A Multi-Region Input–Output Approach. Sustainability. 2018; 10(8):2822. https://doi.org/10.3390/su10082822
Chicago/Turabian StyleHou, Siyu, Yu Liu, Xu Zhao, Martin R. Tillotson, Wei Guo, and Yiping Li. 2018. "Blue and Green Water Footprint Assessment for China—A Multi-Region Input–Output Approach" Sustainability 10, no. 8: 2822. https://doi.org/10.3390/su10082822
Note that from the first issue of 2016, this journal uses article numbers instead of page numbers. See further details here.