Measuring Country Sustainability Performance Using Ensembles of Neuro-Fuzzy Technique
by
 , , ,
, , ,
Mehrbakhsh Nilashi
1,* ,
,
Fausto Cavallaro
2,*,
Abbas Mardani
3,
Edmundas Kazimieras Zavadskas
4 ,
,
Sarminah Samad
5 and
Othman Ibrahim
1 1
Faculty of Computing, Universiti Teknologi Malaysia (UTM), Skudai 81310, Malaysia
2
Department of Economics, University of Molise, Via De Sanctis, 86100 Campobasso, Italy
3
Department of Business Administration, Azman Hashim International Business School, Universiti Teknologi Malaysia (UTM), Skudai 81310, Malaysia
4
Institute of Sustainable Construction Vilnius Gediminas Technical University Sauletekio al. 11, Vilnius LT-210223, Lithuania
5
CBA Research Centre, Department of Business Administration, Collage of Business and Administration, Princess Nourah Bint Abdulrahman University, Riyadh 11671, Saudi Arabia
*
Authors to whom correspondence should be addressed.
Sustainability 2018, 10(8), 2707; https://doi.org/10.3390/su10082707
Submission received: 21 June 2018
/
Revised: 30 July 2018
/
Accepted: 30 July 2018
/
Published: 1 August 2018
(This article belongs to the Collection Advanced Methodologies for Sustainability Assessment: Theory and Practice)
Abstract
:Global warming is one of the most important challenges nowadays. Sustainability practices and technologies have been proven to significantly reduce the amount of energy consumed and incur economic savings. Sustainability assessment tools and methods have been developed to support decision makers in evaluating the developments in sustainable technology. Several sustainability assessment tools and methods have been developed by fuzzy logic and neural network machine learning techniques. However, a combination of neural network and fuzzy logic, neuro-fuzzy, and the ensemble learning of this technique has been rarely explored when developing sustainability assessment methods. In addition, most of the methods developed in the literature solely rely on fuzzy logic. The main shortcoming of solely using the fuzzy logic rule-based technique is that it cannot automatically learn from the data. This problem of fuzzy logic has been solved by the use of neural networks in many real-world problems. The combination of these two techniques will take the advantages of both to precisely predict the output of a system. In addition, combining the outputs of several predictors can result in an improved accuracy in complex systems. This study accordingly aims to propose an accurate method for measuring countries’ sustainability performance using a set of real-world data of the sustainability indicators. The adaptive neuro-fuzzy inference system (ANFIS) technique was used for discovering the fuzzy rules from data from 128 countries, and ensemble learning was used for measuring the countries’ sustainability performance. The proposed method aims to provide the country rankings in term of sustainability. The results of this research show that the method has potential to be effectively implemented as a decision-making tool for measuring countries’ sustainability performance.
1. Introduction
Sustainability is defined the use of resources to “meets the needs of the present without compromising the ability of future generations to meet their own needs” [1]. Environmental and societal sustainability have become important issues nowadays. Sustainable development has attracted increasing attention from organizations in different scopes [2,3]. Sustainability assessment tools have been developed to support the decision makers in evaluating sustainable technology developments, and are nowadays a distinct and important realm of research. According to Devuyst, et al. [4] cited by Tan et al. [5], sustainability assessment is defined as “... a tool that can help decision makers and policy makers decide which actions they should or should not take in an attempt to make society more sustainable”. The sustainability development has been based on three major focus areas: the economy, society, and the environment [6,7]. These dimensions have been more important for sustainability, and the majority of research studies have been conducted on these dimensions.
Machine learning techniques have been successful in developing the decision support systems [8] and prediction learning tools [9]. Sustainability assessment tools commonly rely on the indexes and indicators that are more suitable for the evaluation of the sustainability in various domains. Accordingly, based on these indexes and indicators, several research studies have been conducted to develop sophisticated methods for sustainability assessment. Arushanyan et al. [10] developed a methodological framework for the qualitative sustainability assessment of future scenarios with transformative changes. Their framework suggested qualitative assessment with a consumption perspective and a life cycle approach. Houshyar et al. [11] used a combination of geographic information system (GIS), analytical hierarchy process (AHP), and fuzzy for the assessment of the sustainability of silage corn production in Fars province. Cavallaro [12] used Takagi–Sugeno fuzzy inference in developing a synthetic index for the sustainability assessment of production of the biomass for energy purposes. Zhao and Li [13] proposed a hybrid framework for the evaluation of the Strong Smart Grid (SSG) performance using AHP and technique for order of preference by similarity to ideal solution (TOPSIS). Phillis et al. [14] developed SAFE (sustainability assessment by fuzzy evaluation), which is a measuring scheme of sustainability as well as a decision support tool for policymaking that uses the fuzzy rule-based system to measure the overall sustainability of a country. This decision support tool is based on basic indicators of sustainability. The SAFE model is mainly based on two broad components: human sustainability (HUMS) and ecological sustainability (ECOS). Tan, Shuai, Jiao, and Shen [5] proposed an approach using an adaptive neuro-fuzzy inference system (ANFIS) technique for assessing countries’ sustainability levels. Their method was based on the dimensions and indications that have been used in SAFE, which was developed by Phillis and Andriantiatsaholiniaina [15] and Phillis, Grigoroudis, and Kouikoglou [14]. Our method is also developed based on these two dimensions of sustainability, and includes their basic indicators in each dimension.
From the literature, it was found that there has been no implementation of the ensemble learning of the ANFIS technique in developing the sustainability assessment tools. It has been shown that solely using a single inductive learning method cannot achieve a generalization performance in all of the possible prediction tasks [16]. In addition, the accuracy of using supervised learning methods more depends on the nature of the problem investigated and observed data. Despite this consideration, ensemble learning has proved to have an excellent performance in many prediction tasks of real-world applications [17]. In the ensemble learning paradigm, several predictors are combined to construct the learning models [18]. Therefore, this will result in improved prediction accuracy in the problem under investigation. Specifically, the generalization performance of the ensemble learning has been proved to be much better than a single individual ensemble member. In fact, these improvements in performance and accuracy are because of the combination of accurate predictors, whose errors are complementary. In this research, multiple components of the ANFIS learner are trained for measuring countries’ levels of sustainability assessment. Accordingly, integration by an average approach was applied for final ensemble decision [19]. As a straightforward approach, the final decision by integration by the average approach is obtained from the sum of the results generated by each ANFIS model divided by the number of ANFIS models used for the prediction task.
Accordingly, in this research, attempts shall be made to develop a new method using ensembles of the ANFIS technique for measuring the sustainability performance of countries. It is believed that the combination of these techniques will help improve the prediction accuracy of previous methods in assessing the sustainability performance.
2. Sustainability and Fuzzy Neural Networks
In recent years, the concept of sustainability has broadly been acknowledged as an interesting topic for numerous disciplines. Accordingly, several techniques, models, and approaches have been developed and extended for the assessment of sustainability performance. Previous studies have categorized these techniques into five different groups including: data environment analysis, systems dynamics, fuzzy sets theories, comprehensive evaluation, and ecological footprint [5]. Among these groups, fuzzy sets theory has widely been used for the assessment of various applications of sustainable development. There are some advantages of integrating the neural networks with fuzzy sets theory, including its relative ease of use, its capability to approximate any function regardless of its linearity, and its applicability for complex/abstract problems.
The ANFIS technique for fuzzy rules induction and fuzzy membership function was introduced by Jang [20], and it has been a robust supervised machine learning technique for prediction tasks. This technique is a specific kind of neuro-fuzzy system that takes the advantages of fuzzy logic [21] and neural networks to automatically learn from the data. There are many studies that have examined the ANFIS and neural network techniques. Some of these studies are introduced as follows. The ANFIS approach has extensively been used in different application areas of energy and sustainability. Tan, Shuai, Jiao, and Shen [5] used the ANFIS technique for assessing the sustainability of 128 countries. The outcomes of this paper indicated that ANFIS is an efficient technique for evaluating the sustainability performance of countries. Halkijevic et al. [22] proposed a new model, quasi-strong sustainability, and used the ANFIS model for the assessment of water supply sustainability. The findings of this paper showed that the combination of fuzzy logic and neural networks was an appropriate approach for the assessment of water supply sustainability. Cavallaro [23] used the neural network for a load application prediction of a small electric grid. The outcomes of this paper demonstrated that the proposed model was effective and had better performance compared with the traditional statistical approaches. Ruben et al. [24] presented a conceptual model for assessing the performance of the sustainable systems of automotive manufacturing firms by using the ANFIS method. The outcomes of this paper showed that the presented performance model has the ability to assess lean performance in the manufacturing firms. Tan, Shuai, Jiao, and Shen [5] introduced the ANFIS method for the assessment of urban sustainability in 185 cities in China. The outcomes of this paper indicated that the ANFIS method is suitable for evaluating urban sustainability. Pousinho et al. [25] introduced a novel hybrid model to estimate short-term wind power. The results of this paper showed that the proposed model enhanced forecasting accuracy and outperformed the other models. Altin and Sefa [26] proposed a new model for the implementation of dSPACE by using the ANFIS model based on grid interactive voltage source inverter. The outcomes of this paper indicated that the presented inverter is faster to respond to the reference variations and lower steady-state error than a PI controller. Shamshirband et al. [27] applied the ANFIS model to achieve the maximal net in a wind farm. The finding of this paper showed that the proposed optimization strategy was effective. Osório et al. [28] proposed a novel hybrid methodology for predicting the short-term electricity market price by using the ANFIS model, mutual information (MI), wavelet transform (WT), and evolutionary particle swarm optimization (EPSO). The results of this paper found that uncertainty related to market prices has decreased. Liu et al. [29] proposed two novel wind speed prediction approaches based on Fast ensemble empirical mode decomposition (FEEMD)-multi layer perceptron (MLP) and FEEMD-ANFIS. The results of this paper showed that the proposed hybrid method was suitable for the prediction of wind speed. Mohammadi et al. [30] applied the ANFIS model to forecast the daily global solar radiation; the finding of this paper showed that the ANFIS technique was suitable for predicting the daily horizontal global solar radiation. Al-Ghandoor et al. [31] applied the ANFIS technique for predicting the transport energy demand by the use of socio-economic and transport-related indicators. Zahedi et al. [32] designed a new intelligent controller based on the ANFIS technique to maximize the output power of wind turbines. The findings of this article demonstrated that the proposed model was effective for wind power turbines. Nikolić et al. [33] applied the ANFIS technique for predicting the wake wind speed. Nikolić et al. [34] also used the ANFIS technique for enhancing the performance of the wind turbines. Naji et al. [35] later designed and adapted the ANFIS technique to estimate the energy consumption of buildings based on some parameters, including line insulation, K-value, and material thickness. The results of this paper showed that the ANFIS results are more accurate than the results of the artificial neural network (ANN) and genetic programming (GP) techniques. Petković et al. [36] constructed the ANFIS model to evaluate the investment risk of a wind power project. The findings of this paper demonstrated that the ANFIS model can provide better performance compared to the regression of the net present value based on the coefficient of determination (R2). Shamshirband et al. [37] applied the ANFIS model to calculate and predict the monthly wind power density. The outcomes of this study showed that all of the values of wind power prediction were between the acceptable range of −10% to 10%. They found that the ANFIS model had an excellent performance for the prediction of wind power density. Mellit and Kalogirou [38] implemented the ANFIS model for modeling the photovoltaic power supply (PVPS). The findings of this paper indicated that the ANFIS model performed better than the ANN approach. Yang et al. [39] used the ANFIS model for measuring the wind data as one of the key input data for wind farm design and planning. The findings of this paper proved that the ANFIS results were effective. Fernandez-Jimenez et al. [40] used ANFIS, autoregressive integrated moving average (ARIMA), and ANN for the estimation of the grid-connected photovoltaic plant. The findings of this paper showed that the presented forecasting system would be useful for the owners or managers of photovoltaic plants that are connected to offering forecast values of the hourly electrical energy production and electricity networks.
3. ANFIS
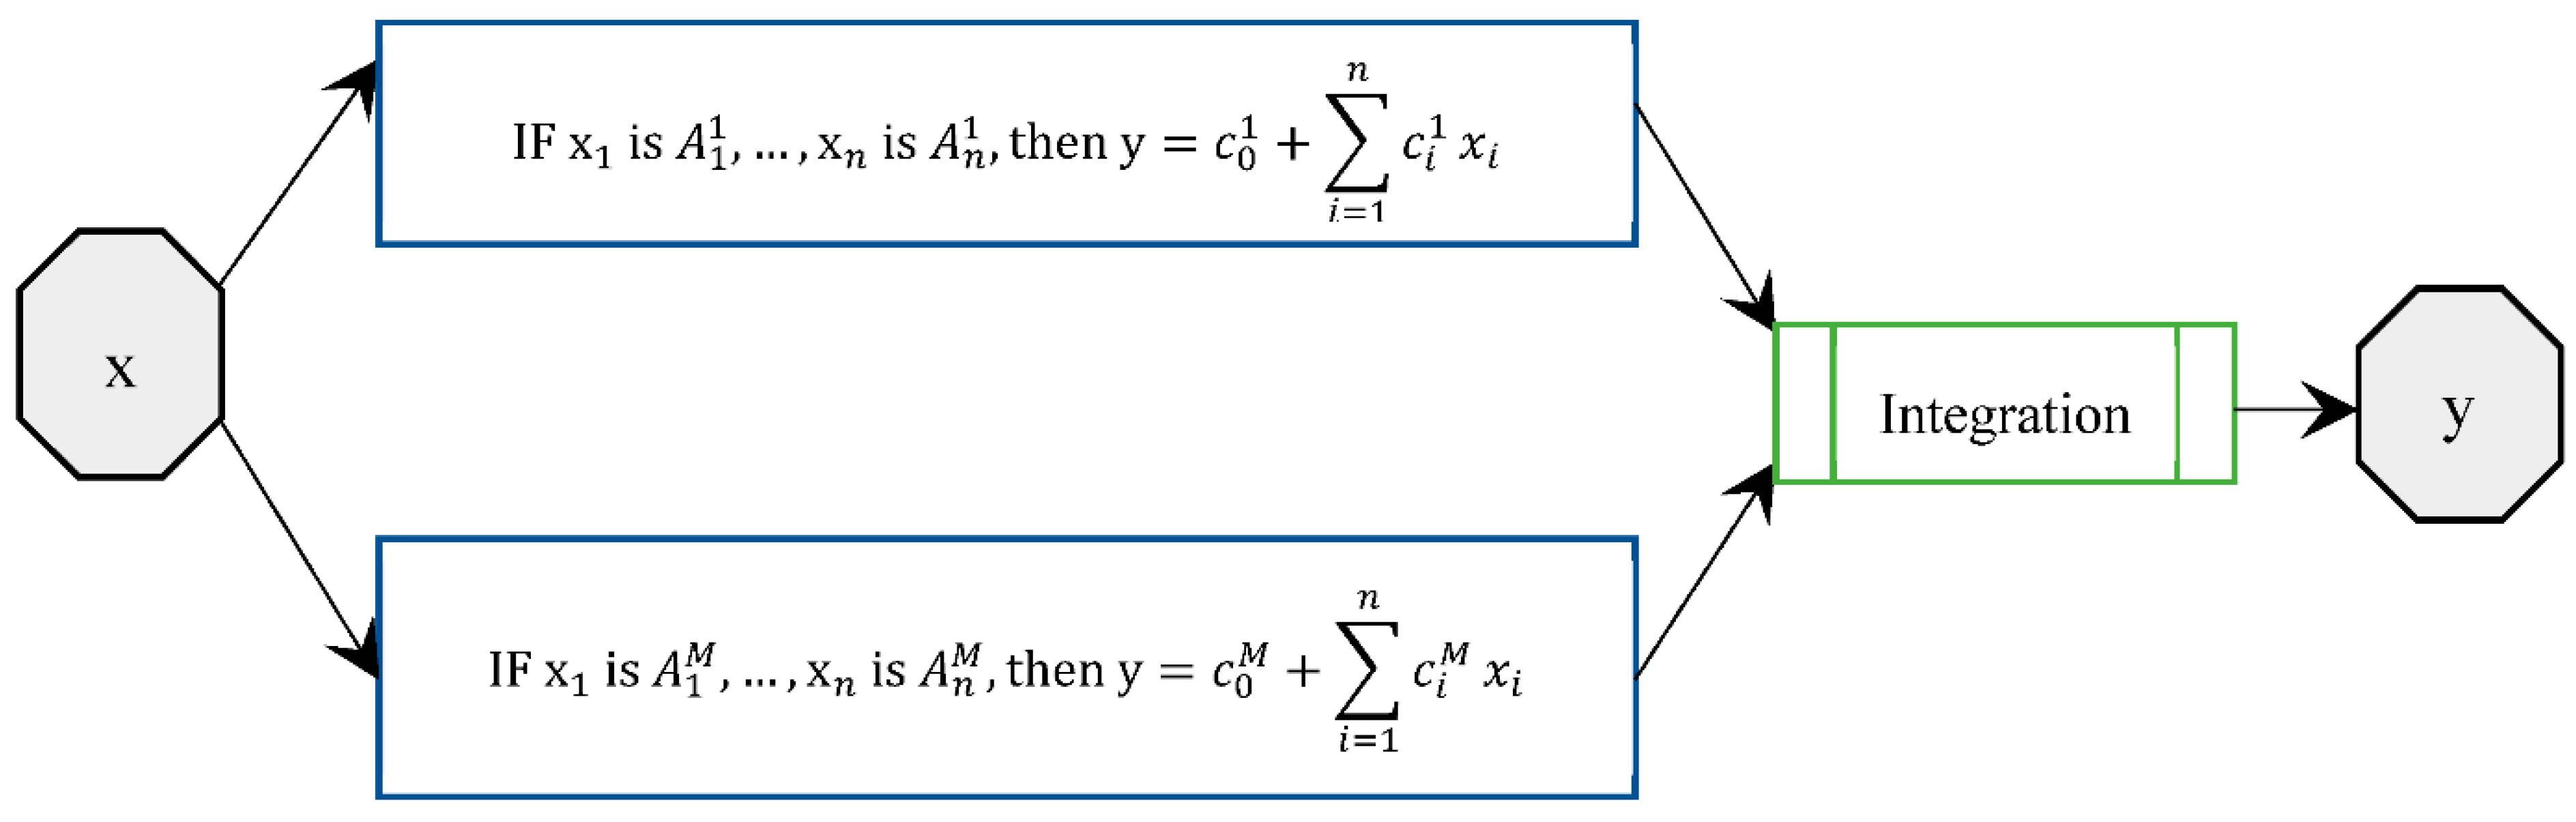
The ANFIS model that was proposed by Jang [20] has been a robust supervised machine learning techniques for prediction tasks [41]. According to Zadeh [21], this technique is a specific kind of neuro-fuzzy system that takes the advantages of fuzzy logic and the neural network to automatically learn from data [42]. The ANFIS model is functionally equivalent to a Takagi–Sugeno fuzzy inference systems (FIS) [43,44]. Takagi–Sugeno FIS is also called Sugeno FIS Chen [45]. It is a special kind of FIS. Its fuzzy rules are different from the common fuzzy rules. Usually, the premise conditions of fuzzy rules and the consequent conclusions of fuzzy rules are fuzzy linguistic values [46]. They are shown as follows:
where Ai (i = 1, 2, ⋯, n) are the input fuzzy linguistic values, and B is the output fuzzy linguistic value. However, in Sugeno FIS, the fuzzy rules are shown as follows:
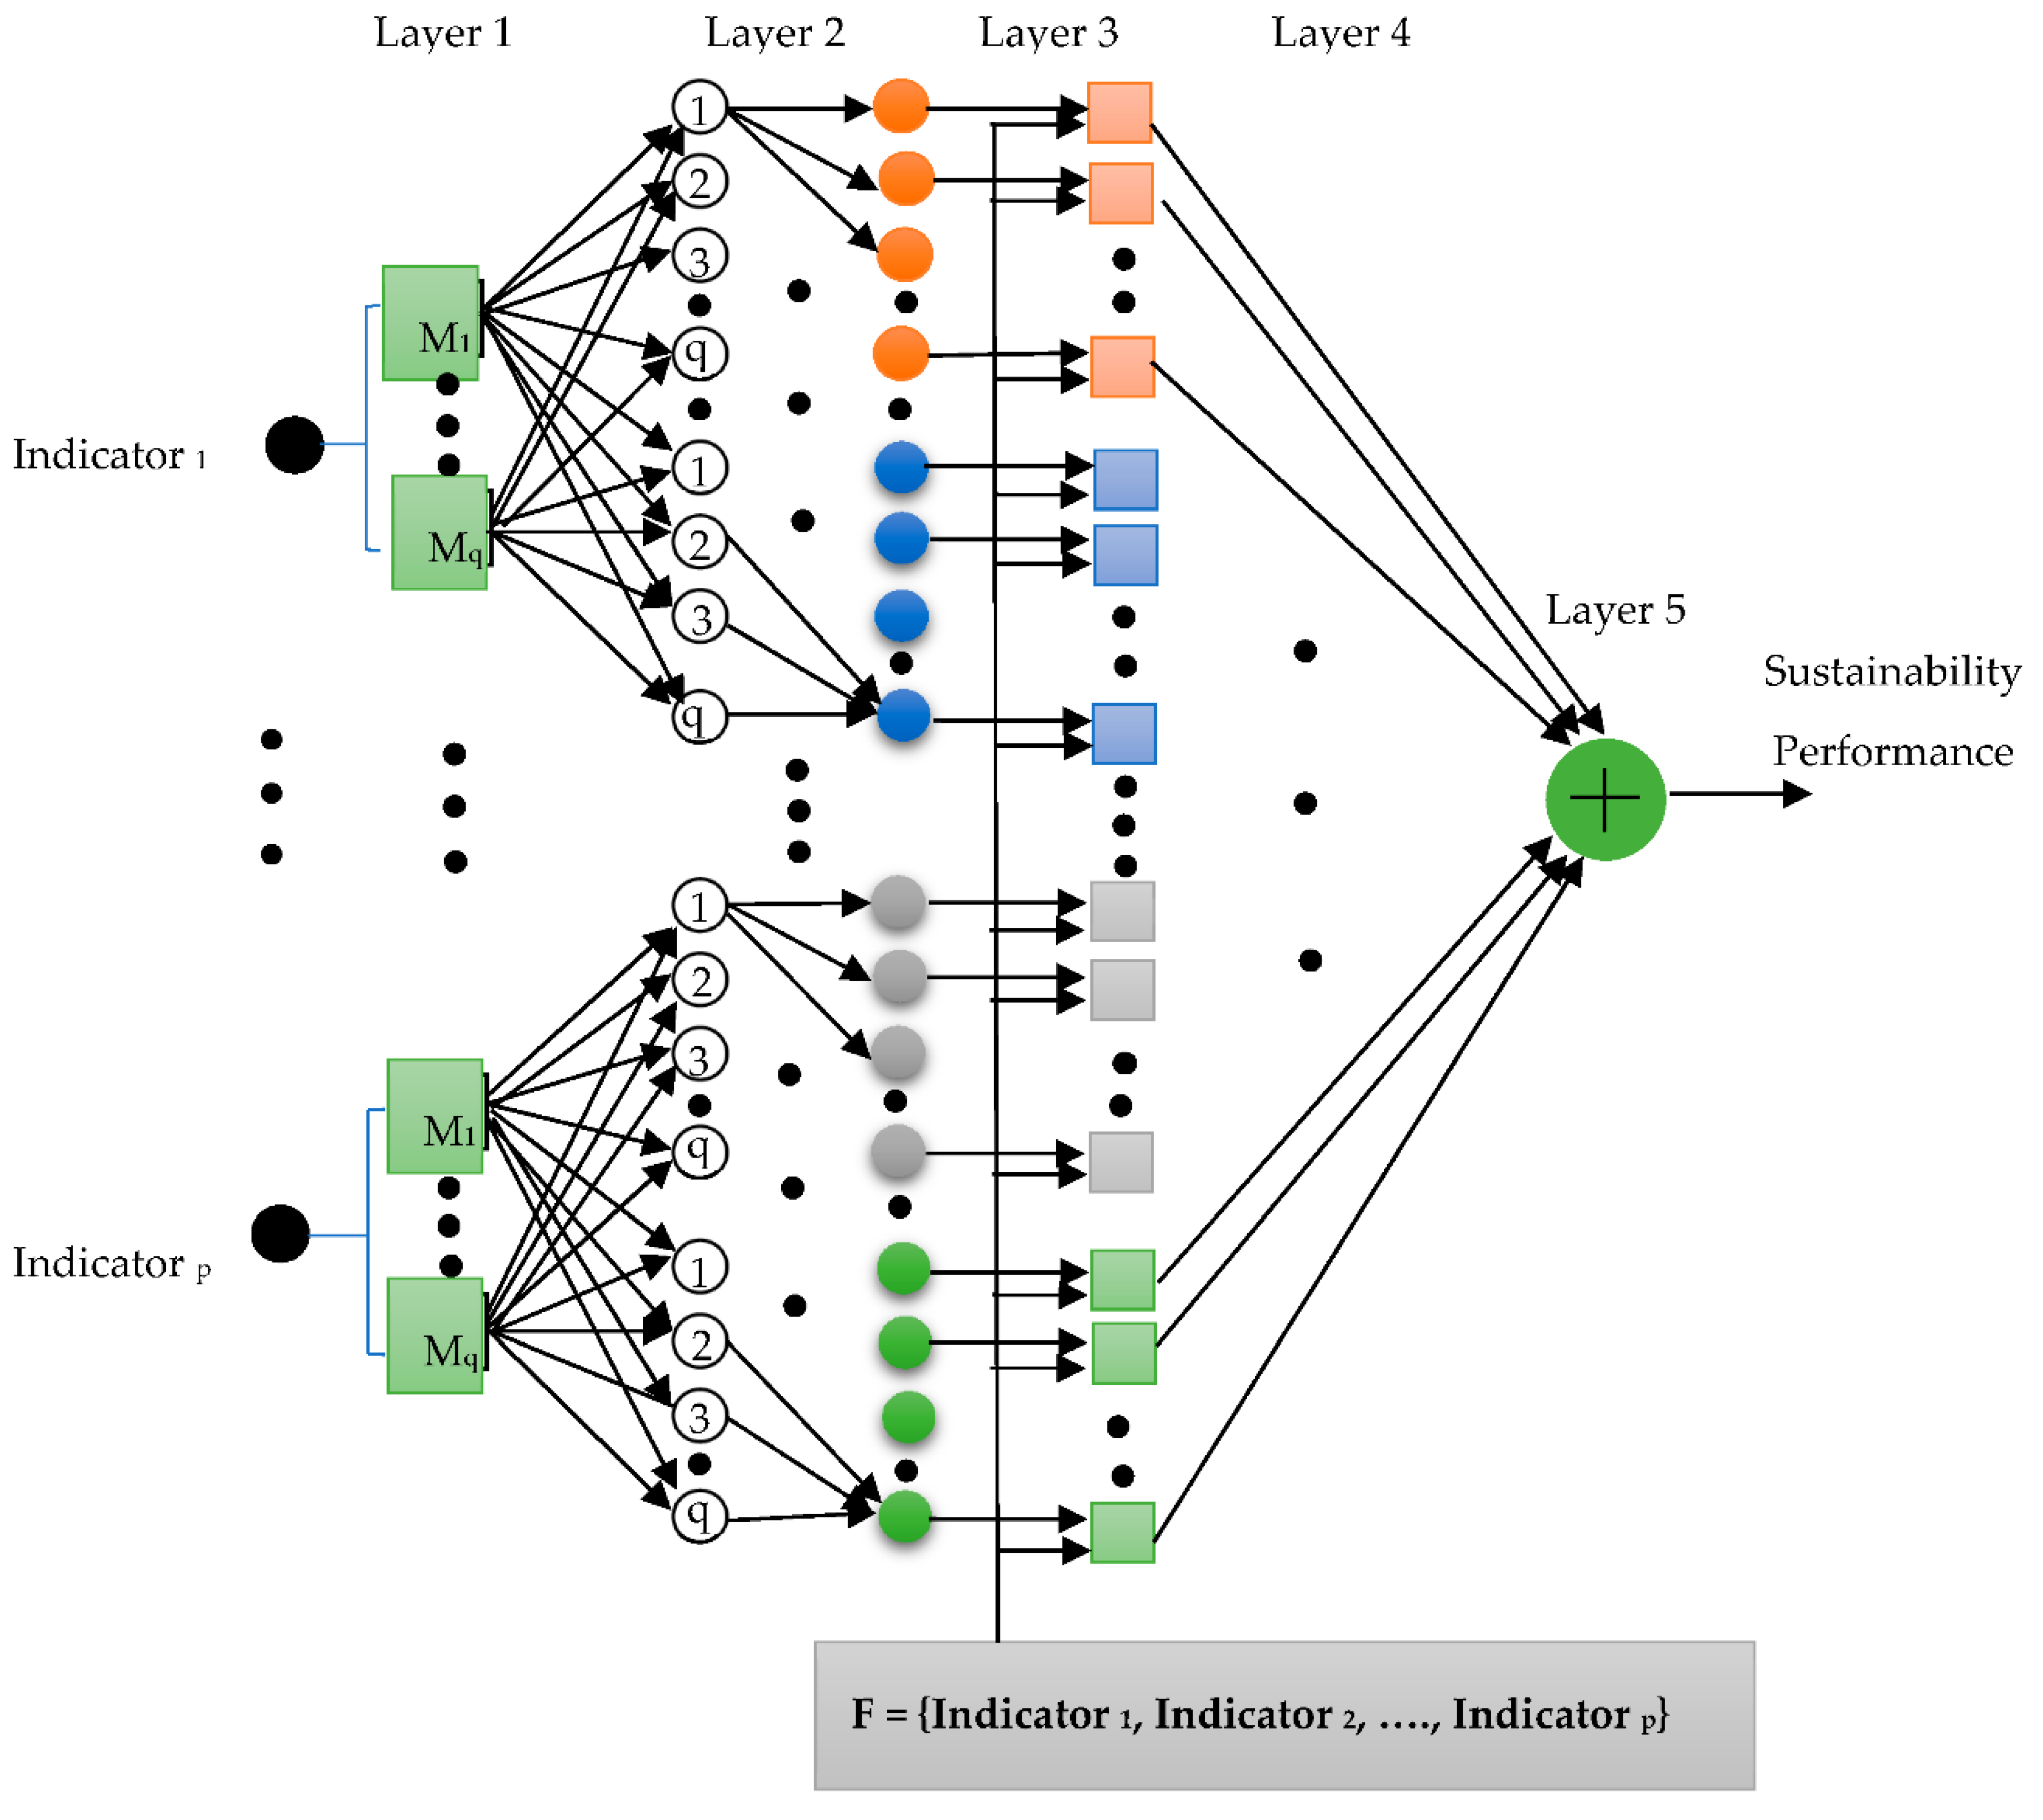
where Ai (i = 1, 2, ⋯, n) are the input fuzzy linguistic values, and ci are the parameters of certain values. Sugeno FIS is shown in Figure 1. In this study, a five-layer ANFIS model [47] is used for sustainability performance prediction (see Figure 2). In Layer 1, the membership grades of a linguistic label are generated. In Layer 2, the firing strength of each rule is generated. In Layer 3, normalized firing strength is calculated. In Layer 4, the parameter function on Layer 3 output is computed. Finally, in Layer 5, the overall output as the summation of all of the incoming signals is calculated.
In this research, ensembles of predictors are used for assessing countries’ sustainability performance. It has been shown that solely using a single inductive learning method cannot achieve a generalization performance in all of the possible classification tasks [16]. In addition, the accuracy of using supervised learning methods more depends on the nature of the problem investigated and observed data. Despite this consideration, ensemble learning has proved to have an excellent performance in many of the prediction tasks of practical applications [17,18].
It has been shown that the generalization performance of the ensemble learning is much better than a single individual ensemble member [20]. In fact, these improvements in performance and accuracy are because of the combination of accurate predictors, whose errors are complementary. The final ensemble decision can be reached by combining the individual predictions of the ensemble members. To do so, different approaches, for example, average prediction, majority voting, and non-linear decision functions can be used. It should be noted that in general, there is no strong evidence supporting that more complex combination approaches can perform better.
In this research, multiple components of the ANFIS learner are trained for measuring the sustainability performance of countries. Accordingly, for each ANFIS model, the prediction accuracy is calculated for output, and then integration by an average approach was applied for the final ensemble decision [19]. As a straightforward approach, the final decision using the integration by average approach is obtained from the sum of the results generated by each ANFIS model divided by the number of ANFIS models used for the prediction task. The proposed ensemble structure is depicted in Figure 3. From this figure, it can be found that the ensembles of the ANFIS technique are used to predict the sustainability performance. In each ANFIS model, the SAFE data is used for training the ANFIS models by a specific membership function, and the performance of the prediction is calculated. Then, the final performance is obtained by integrating the performance of the individual predictors.
4. ANFIS Ensemble Evaluation
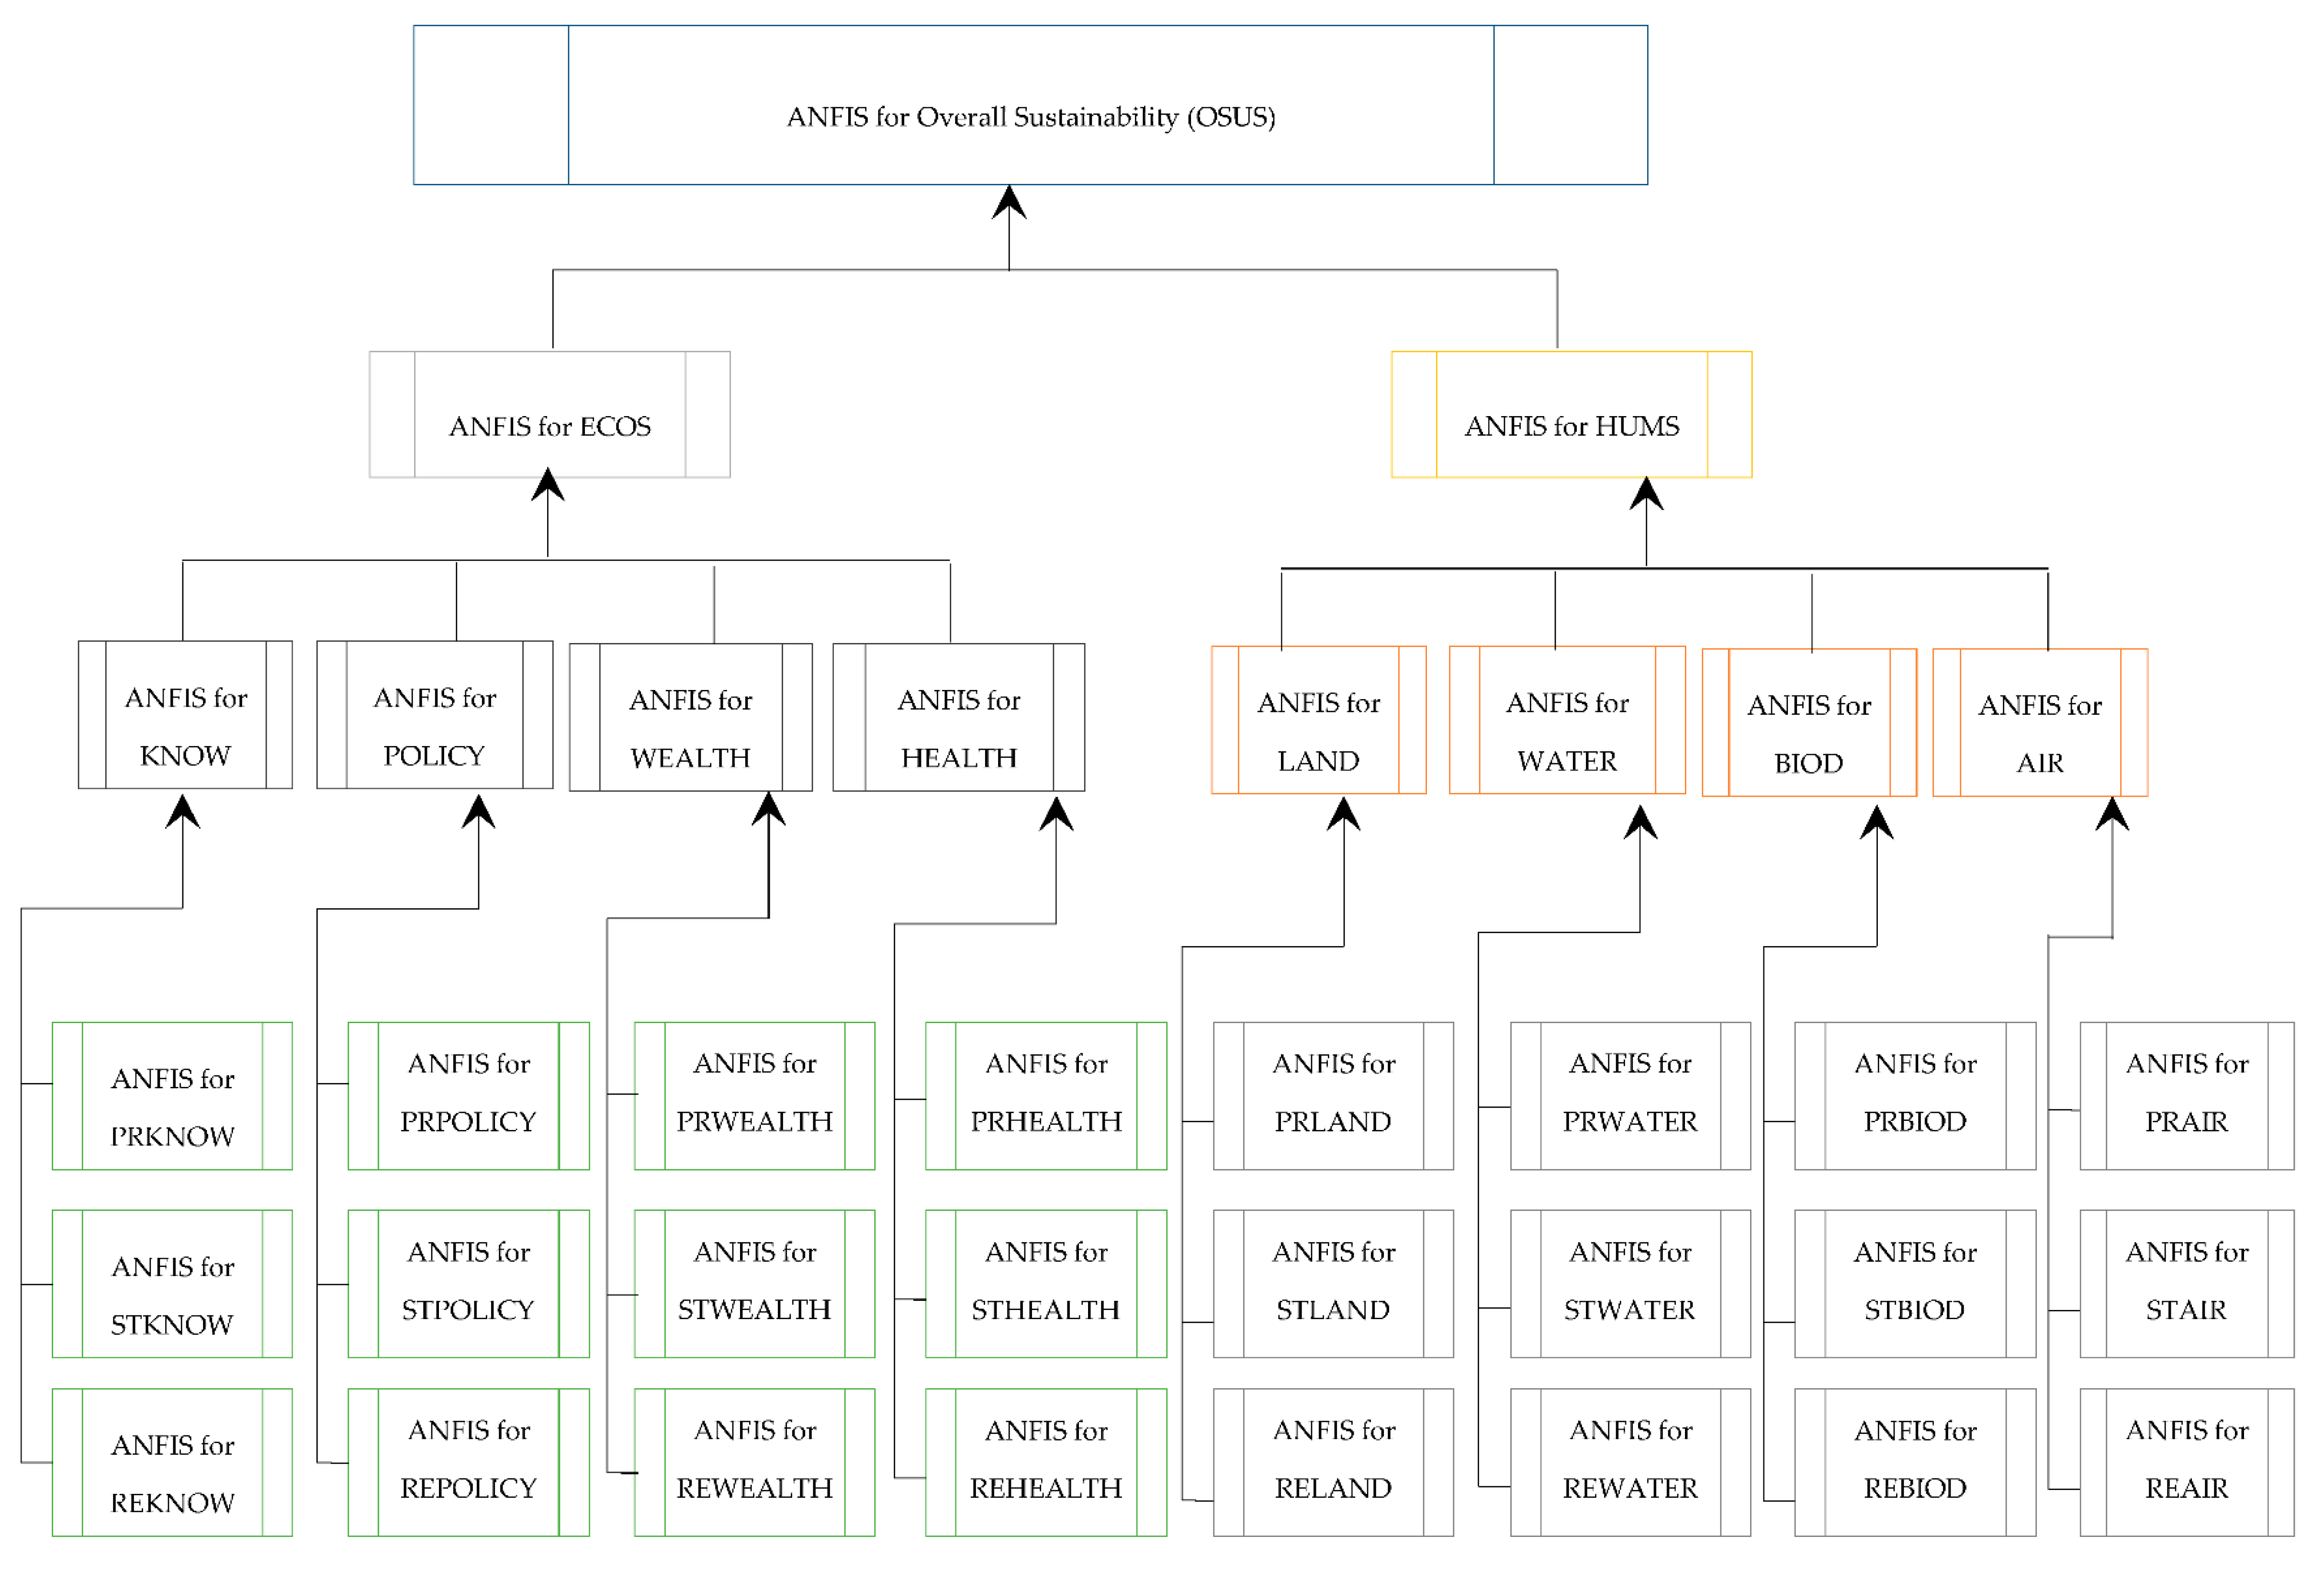
The aim of this study is to measure the countries’ sustainability performance using a set of input indicators in the SAFE dataset. To do so, the ANFIS technique was used to discover the relationship between the inputs and output parameters (Y = f(X1, X2, …, Xn)) in the SAFE dataset for the accurate prediction of the countries’ sustainability performance. For the SAFE dataset, X1, X2, …, Xn stand for the input parameters of the dataset, and Y stands for the output parameter. In our research, the countries’ sustainability performance is measured using four levels of ANFIS ensemble models.
As can be seen in Figure 4, in the first level, a country sustainability performance is measured. In the second level, ANFIS ensemble models are developed for ECOS and HUMS to measure the overall sustainability performance (OSUS). In the third level, the ANFIS ensemble models are developed to measure the ECOS and HUMS sustainability of each country. Each of these dimensions has its own indicators, which are used as inputs for the ANFIS models of ECOS and HUMS. The ECOS dimension includes four criteria: biodiversity (BIOD), land integrity (LAND), air quality (AIR), and water quality (WATER). The HUMS dimension also includes health (HEALTH), education (KNOW), economic welfare (WEALTH), and political aspects (POLICY). Each of these criteria is also categorized into tertiary indicators in the fourth level, which are defined as STATE (ST), RESPONSE (RE), and PRESSURE (PR). The components and basic indicators of the SAFE model are presented in Table A1 of Appendix A. For the tertiary indicators, a total of 75 indicators are used as inputs for the ANFIS ensembles of the fourth level. Hence, the main relationships in Figure 4 can be defined as follows.
YOSUS = f(ECOS, HUMS)
YECOS = f(BIOD, LAND, AIR, WATER)
YHUMS = f(HEALTH, KNOW, WEALTH, POLICY)
YHEALTH = f(ST(HEALTH), RE(HEALTH), PR(HEALTH))
YKNOW = f(ST(KNOW), RE(KNOW), PR(KNOW))
YWEALTH = f(ST(WEALTH), RE(WEALTH), PR(WEALTH))
YPOLICY = f(ST(POLICY), RE(POLICY), PR(POLICY))
YBIOD = f(ST(BIOD), RE(BIOD), PR(BIOD))
YLAND = f(ST(LAND), RE(LAND), PR(LAND))
YAIR = f(ST(AIR), RE(AIR), PR(AIR))
YWATER = f(ST(WATER), RE(WATER), PR(WATER))
To evaluate the prediction models constructed by the ANFIS technique, a 4-GHz processor PC with a Windows 7 operation system was used. First, 20% of the data was initially considered for the test set, 20% of the data was considered for the checking set, and 60% of the data was considered for the training set. In each model, different types of membership functions (MFs) were designed and considered for fuzzification tasks. The types of MFs that were considered were: Triangular, Generalized Bell-Shaped, Gaussian, and Π-Shaped. In Figure 5, the four MFs are shown for ECOS and HUMS. As can be seen from this figure, three linguistic variables (low, moderate and high) are used as MFs degrees for each feature. Hence, ANFIS ensemble models are developed using four types of MFs with these linguistic variables.
For each ANFIS ensemble, integration by average approach was then applied for the final decision. To evaluate the results and measure the accuracy of the method, the root mean square error (RMSE) and coefficient of determination ( were used. RMSE and the adjusted coefficient of determination ( are presented in Equations (14) and (15):
where is the number of observations, is the predicted value, is the actual output, is the actual mean value, is the predicted mean value, and is the number of independent variables.
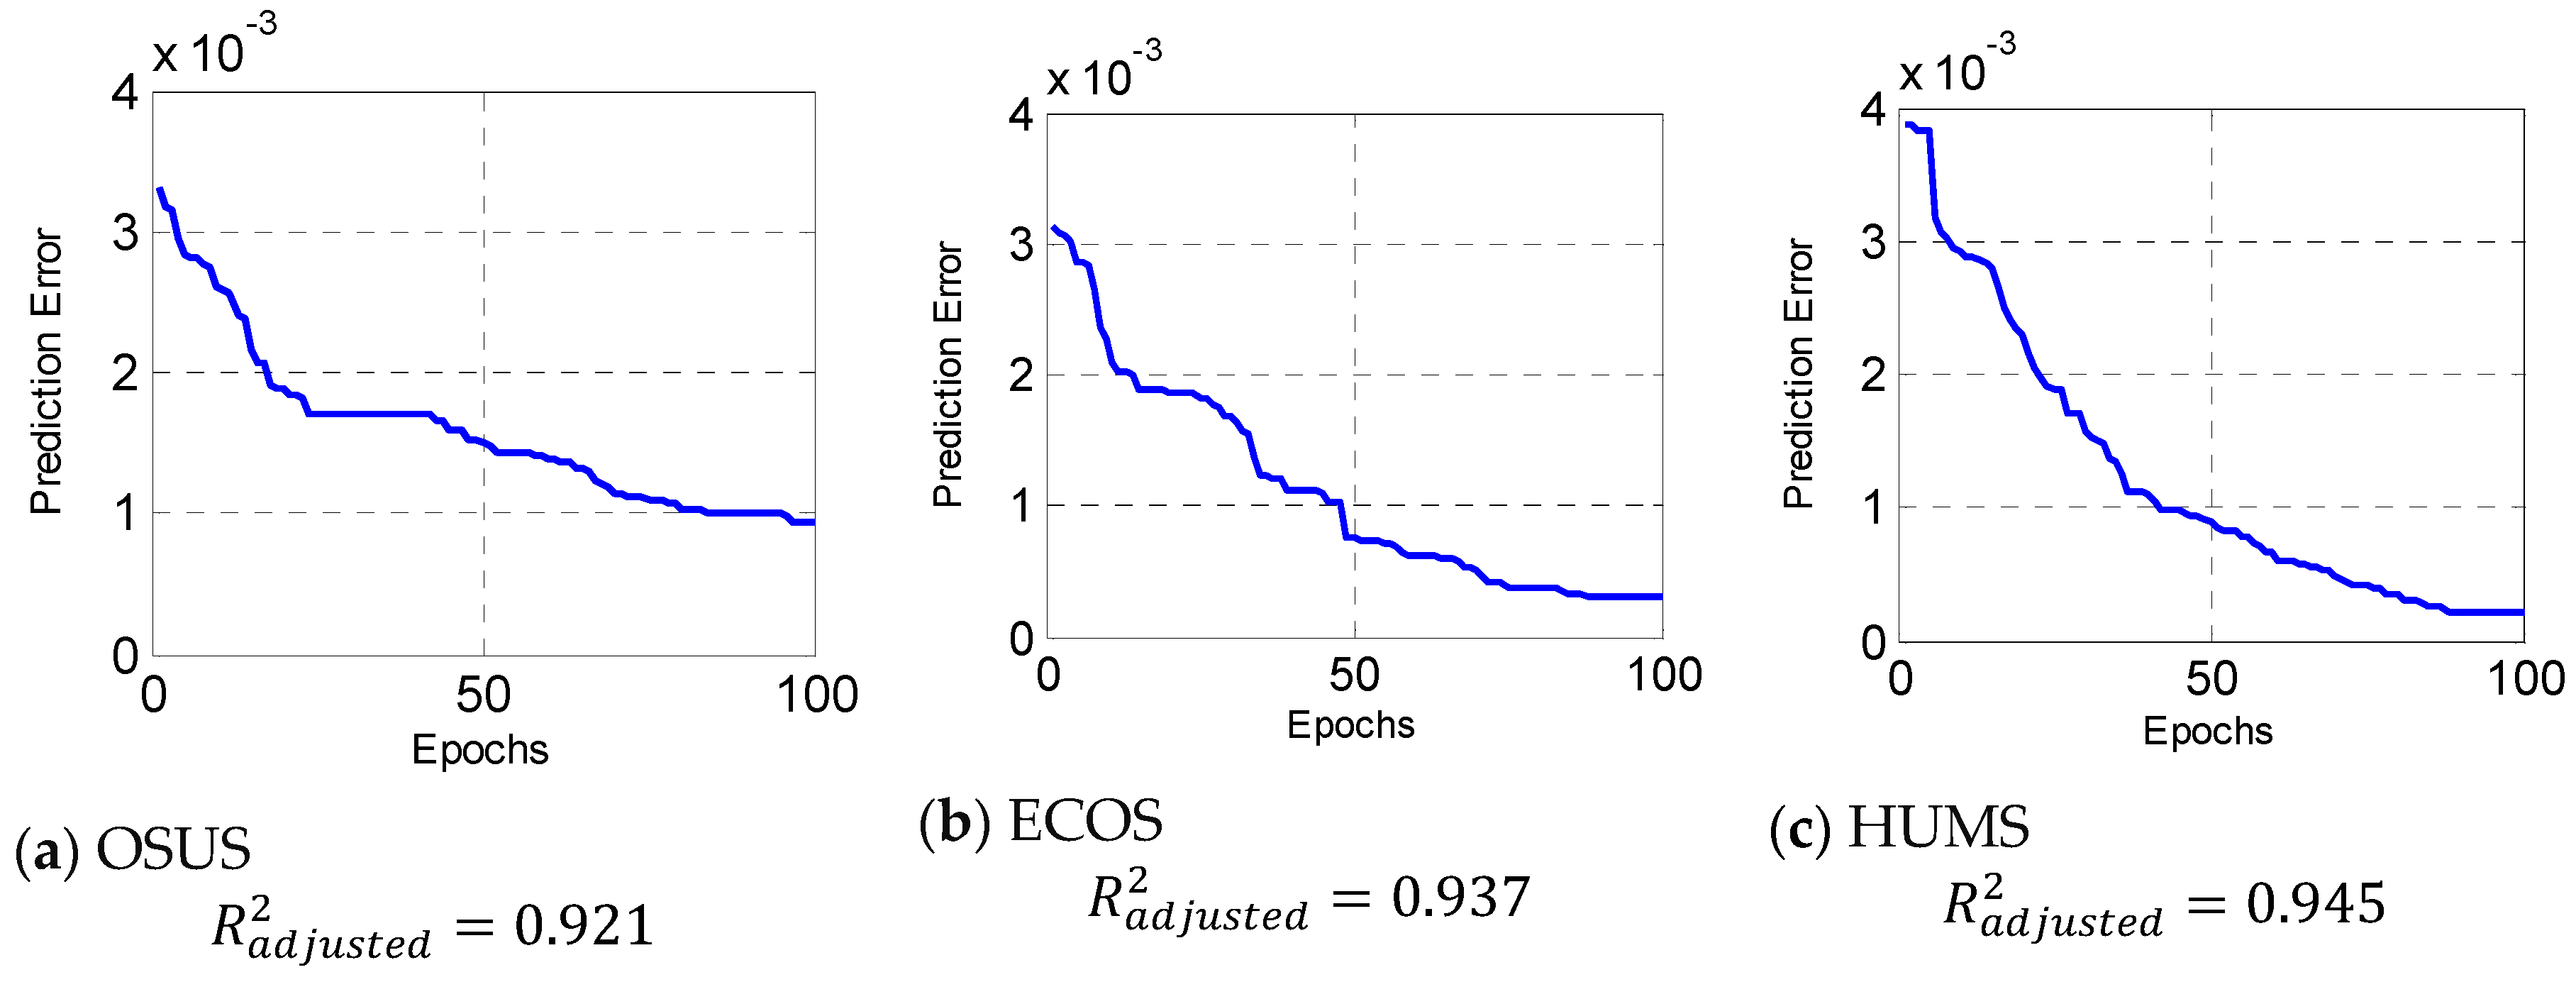
In the following figures, the training errors of the ANFIS models are presented. From Figure 6, it can be seen that the ANFIS technique has accurately predicted the output of the models. The errors of prediction for OSUS, ECOS and HUMS are less than 0.001 with , , and , respectively.
Combining both the input MFs with the rules discovered by the ANFIS model, the visualization was better performed for the relationship between the inputs and output in a three-dimensional curve. Figure 7a illustrates the interdependency of overall sustainability and human and ecological sustainability through a control surface obtained from the combination of membership functions, fuzzy rules, and trained models in ANFIS for the SAFE dataset. In fact, this figure represents the mapping from each of two parameters of the dataset to the overall sustainability performance. In addition, Figure 7b measures the overall sustainability using generated fuzzy rules by ANFIS and Gaussian MFs. This figure shows that when the human and ecological sustainability are respectively 0.998 and 0.855, the overall sustainability that can be achieved is about 0.926. It should be noted that based on these input values for human and ecological sustainability, the overall sustainability achieved by SAFE [14] was 0.927. The difference between the two predictions was about 0.001, and this indicates that the error of prediction by the ANFIS model is very minor.
Our method also is compared with the other prediction machine learning techniques on the SAFE dataset. These techniques are: neural network (NN) [48], support vector regression (SVR) [49], and multiple linear regression (MLR). After performing these techniques, the RMSE of their prediction is calculated and presented in the results. These techniques were applied on the same dataset without incorporating ensemble learning. The radial basis function (RBF) kernel was used and the kernel elements (C and ) were selected by the use of exhaustive search and 10-fold cross-validation [49]. Specifically, the exponentially growing sequences of C from 2−15 to 210 and from 2−10 to 29 are selected to find the optimal values. For NN, feedforward back-propagation with a single output is used for the prediction task. The model used in this research has three layers. For training NN, there are different back-propagation techniques, which are conjugate gradient resilient back-propagation [50], back-propagation [51], and Levenberg [52]. In this research, the back-propagation training algorithm is used to train the NN technique. The result is presented in Table 1. It can be seen from the result that the method that uses ensemble learning (ANFIS-Ensembles) is more accurate compared with the other methods, which use solely prediction techniques. This table further demonstrates that the ANFIS ensemble, which uses a combination of Triangular, Gaussian and Π-Shaped MFs, works better than combination of other MFs in measuring the overall sustainability performance.
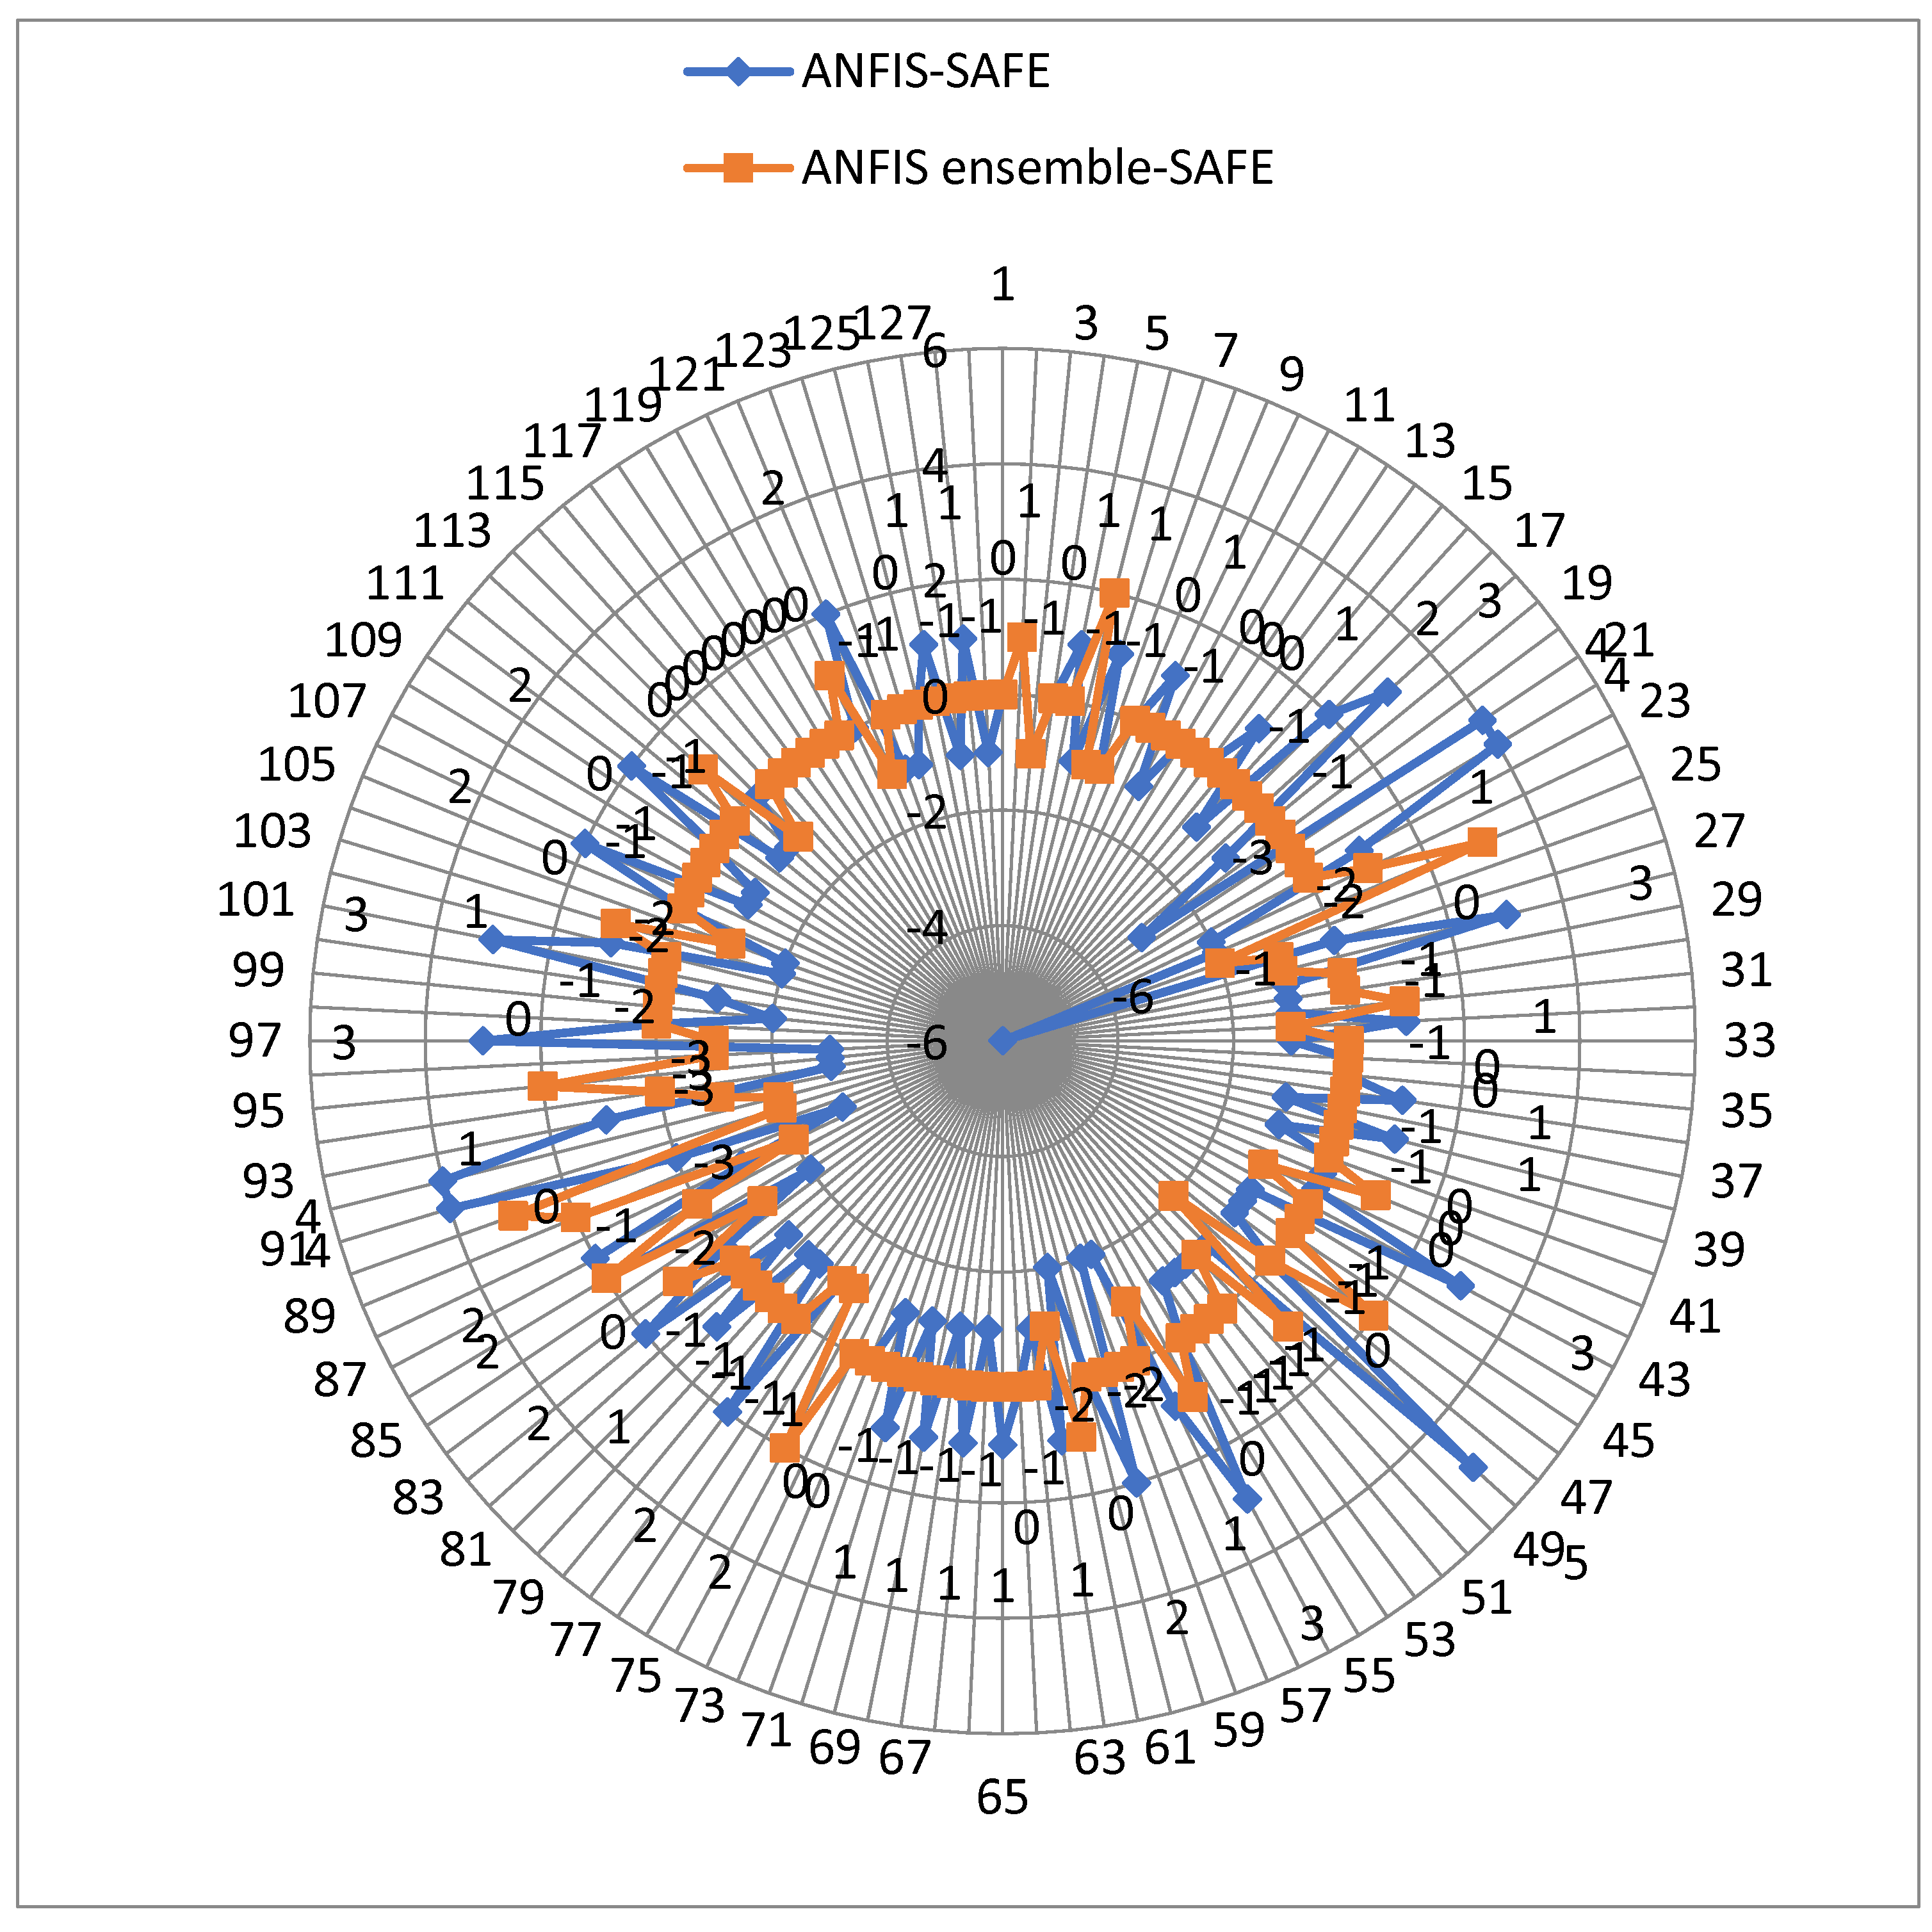
In Table A2 presented in Appendix B, the ranks of 128 countries’ sustainability performance by SAFE, ANFIS, and ANFIS ensembles are presented. In addition, in this table, the ranking difference between ANFIS-Ensemble and SAFE is also presented. For this result, the combination of Gaussian, Triangular, and Π-Shaped MFs were considered for ANFIS ensemble learning, as this combination provided better estimation accuracy compared to the other MFs. From Figure 8, it can also be seen that there are minor differences between the ANFIS ensemble and the SAFE model in ranking the countries’ sustainability performance. The largest difference for the ANFIS ensemble is the value of 3 for Estonia and Gambia. Compared with the ANFIS model, the analysis also demonstrates that, since our method uses the ensemble learning, it can better rank the countries’ sustainability performance.
5. Discussion and Recommendations
The advantage of the proposed method is the automatic generation of decision rules for sustainability assessment from the real-world data for input and output parameters without human intervention. In addition, the ANFIS ensembles could effectively estimate the sustainability performance, which is a very complex problem with non-linear relationships between its variables (Hjorth and Bagheri [53]; Tan, Shuai, Jiao and Shen [5]). Overall, in the ANFIS ensemble learning paradigm, it was found that the collection of different MFs for prediction models results in improved accuracy in measuring countries’ sustainability performance. This was because of the combination of accurate predictors whose errors are complementary.
The proposed method is also flexible enough to accept a large number of input and output indicators to be used for estimating the sustainability performance. However, in this situation, as the rule number and computation time of the method will be increased, the ANFIS model may not be able to appropriately construct the prediction models of sustainability. Note that as the ANFIS technique may perform the prediction in large offline training time for large datasets, which restricts the use of this technique in real time applications, the incremental version of the ANFIS model can be more suitable and efficient for the assessment of sustainability performance. The incremental updates will allow the system to incrementally update the membership functions, which can in general reduce the computation time of constructing the models of sustainability performance in the ANFIS model. Accordingly, this can be a limitation of ANFIS-based methods that should be taken into account in future studies.
In addition, it was observed that in the previous methods based on rule-based techniques, discovering fuzzy rules and defining the membership functions are performed with human intervention. However, this can be a time-consuming process. Accordingly, it is suggested that in future studies, some other machine learning techniques (e.g., decision tree-based techniques) be employed to automatically induce the rule to be used in the rule-based system. Hence, the combination of decision trees and fuzzy rule-based techniques can be also evaluated for sustainability performance problems. In addition, as the rule discovery of a fuzzy rule-based system is one of the important stages of prediction, the use of decision trees can be helpful for automatic rule discovery to be used in a rule-based system.
Furthermore, for large datasets with huge indicators, clustering techniques can be used as an unsupervised classification method to cluster the data of datasets into similar groups. Accordingly, it is suggested that the data be clustered in similar groups before it can be used for training in ANFIS models. This will improve the readability and handling of the data. In addition, for big datasets, the clustering of data will improve the complexity issue of data processing. Furthermore, the data that was used for training the ANFIS models cannot be considered as a large dataset. The number of tuples in the datasets is relatively small, and the efficiency of method should be tested on large datasets to show whether the method is capable of processing the data and giving the results in real time. As a dimensionality reduction technique, the clustering techniques need to be incorporated into the sustainability assessment methods to reflect its broad appeal and usefulness as one of the steps in exploratory real-world data analysis.
6. Conclusions and Future Work
In this paper, a new method was proposed to measure the countries’ sustainability performance. The method was developed using ensembles of neuro-fuzzy technique. Different combinations of membership functions (Triangular, Generalized Bell-Shaped, Gaussian, and Π-Shaped) were used for the ANFIS ensemble method. In the ANFIS models, centroid of area (COA) was used for the defuzzification task to measure the countries’ sustainability performance. To evaluate the method, the SAFE dataset was used to measure the accuracy of all of the prediction models using root mean square error (RMSE). The accuracy of the proposed method was compared with neural network (NN), multiple linear regression (MLR), and support vector regression (SVR). Our analysis on the SAFE dataset demonstrated that the proposed method—which uses Gaussian, Triangular, and Π-Shaped membership functions—is more accurate in relation to the other combinations. Specifically, the ANFIS ensemble method, which uses Gaussian, Triangular, and Π-Shaped membership functions, provides the lowest RMSE value (0.00038). The data analysis further demonstrated that the ANFIS ensembles outperform the other prediction methods—NN, MLR, and SVR—in measuring the countries’ sustainability performance. Compared to the method that solely relies on the ANFIS technique, the data analysis also demonstrates that the method that uses ensemble learning can better rank the countries’ sustainability performance.
In this study, a non-incremental ANFIS model has been implemented for measuring the countries’ sustainability performance. In addition, the method developed by the ANFIS technique does not support the incremental learning, and it requires recomputing all of the training data in constructing the prediction models. Accordingly, in order to improve the computation time of measuring the countries’ sustainability performance, it is suggested to develop this method to incrementally update the trained models when new information is available, which can be more efficient regarding memory requirements.
In future studies, more attention should be paid to the ensemble learning techniques in developing the systems for sustainability performance assessment to exploit all of their potential and usefulness. Future research can extend the method presented in this study for incremental learning. The proposed method also can be further evaluated on large datasets, which include other indicators of sustainability to show their effectiveness for accuracy and computation time. In addition, future research can combine other machine learning techniques (e.g., clustering techniques) with the ANFIS technique for the assessment of sustainability performance.
Author Contributions
Conceptualization, M.N.; Project administration, A.M.; Supervision, F.C., E.K.Z. and S.S.; Validation, M.N. and O.I.; Writing—original draft, M.N. and A.M.
Acknowledgments
The authors would like to thank the Research Management Center (RMC) at Universiti Teknologi Malaysia (UTM) and Ministry of Higher Education (Malaysia) for supporting and funding this research under the Fundamental Research Grant Scheme (FRGS) (Vote No. FRGS/1/2017/SS08/UTM/02/5).
Conflicts of Interest
The authors declare no conflict of interest.
Appendix A

Table A1.
Components and basic indicators of the SAFE model [54].
Table A1.
Components and basic indicators of the SAFE model [54].
| Component | Basic Indicator |
|---|---|
| PR(LAND) | “Municipal waste (kg per capita per year)” |
| PR(LAND) | “Nuclear waste (tons per capita per year)” |
| PR(LAND) | “Hazardous waste (tons per capita per year)” |
| PR(LAND) | “Population growth rate (percent)” |
| PR(LAND) | “Pesticide consumption (kg per hectare)” |
| PR(LAND) | “Fertilizer consumption (kg per hectare)” |
| ST(LAND) | “Desertification of land (percent of dryland area)” |
| ST(LAND) | “Forest area (percent of what existed in 2000)” |
| RE(LAND) | “Forest change (annual rate)” |
| RE(LAND) | “Protected area (percent of total land area)” |
| RE(LAND) | “Glass recycling (percent of apparent consumption)” |
| RE(LAND) | “Paper recycling” |
| PR(WATER) | “Pesticide consumption (kg per hectare)” |
| PR(WATER) | “Fertilizer consumption (kg per hectare)” |
| PR(WATER) | “Water withdrawals (percent of internal resources)” |
| ST(WATER) | “Organic water pollutant (BOD) emissions (kg per capita per day)d1” |
| ST(WATER) | “Phosphorous concentration (mg per liter of water)” |
| ST(WATER) | “Metals concentration (micro-Siemens per centimeter)” |
| RE(WATER) | “Public wastewater treatment plants (percent of population connected)” |
| PR(BIOD) | “Threatened mammals (percentage)” |
| PR(BIOD) | “Threatened birds (percentage)” |
| PR(BIOD) | “Threatened plants (percentage)” |
| PR(BIOD) | “Threatened fishes (percentage)” |
| PR(BIOD) | “Threatened amphibians (percentage)” |
| PR(BIOD) | “Threatened reptiles (percentage)” |
| ST(BIOD) | “Desertification of land (percent of dryland area)” |
| ST(BIOD) | “Forest area (percent of what existed in 2000)” |
| RE(BIOD) | “Forest change (annual rate)” |
| RE(BIOD) | “Protected area (percent of total land area)” |
| PR(AIR) | “Ozone depleting substances (metric tons per capita)” |
| PR(AIR) | “Greenhouse gas emissions (tons of CO2 equivalent per capita)” |
| ST(AIR) | “Mortality from poor air quality (deaths per 100,000 population)” |
| ST(AIR) | “Urban NO2 concentration (g/m3 of air)” |
| ST(AIR) | “Urban SO2 concentration (g/m3 of air)” |
| ST(AIR) | “Urban TSP (total suspended particulates) concentration (g/m3 of air)” |
| RE(AIR) | “Renewable energy production (percent of total primary energy supply)” |
| PR(POLICY) | “Military spending (percent of gross domestic product (GDP)d2)” |
| PR(POLICY) | “Refugees per capita (country of origin)” |
| PR(POLICY) | “Poverty (percent of population below national poverty line)” |
| ST(POLICY) | “Political rights (values in [1,7])d3” |
| ST(POLICY) | “Civil liberties (values in [1,7])d3” |
| ST(POLICY) | “Gini indexd4” |
| ST(POLICY) | “Corruption Perceptions Index (values in [0,10])d5” |
| RE(POLICY) | “Environmental laws and enforcement (values in [0,1])d6” |
| RE(POLICY) | “Tax revenue (percent of GDP)” |
| PR(WEALTH) | “GDP implicit deflator (annual percent growth rate)” |
| PR(WEALTH) | “Imports (percent of GDP)” |
| PR(WEALTH) | “Unemployment (percent of total labor force)” |
| PR(WEALTH) | “Unemployment gender gap (percent)” |
| ST(WEALTH) | “Poverty (percent of population below national poverty line)” |
| ST(WEALTH) | “Central government debt (percent of GDP)” |
| ST(WEALTH) | “Gross National Income (GNI) per capita PPPd7” |
| RE(WEALTH) | “Exports (percent of GDP)” |
| RE(WEALTH) | “Foreign direct investment (percent of GDP)” |
| RE(WEALTH) | “Mortality from poor air quality (deaths per 100,000 population)” |
| RE(WEALTH) | “Infant mortality rate (deaths per thousand)” |
| RE(WEALTH) | “Maternal mortality rate (deaths per 100,000 live births)” |
| RE(WEALTH) | “HIV/AIDS prevalence rate (percent of population aged 15–49)” |
| RE(WEALTH) | “Tuberculosis prevalence rate (per 100,000 population)” |
| RE(WEALTH) | “Malaria cases (per thousand people)” |
| ST(HEALTH) | “Life expectancy (years)” |
| ST(HEALTH) | “Immunization against measles (percent of population)” |
| ST(HEALTH) | “Immunization against diphtheria-tetanus-pertussis (DTB) (percent of population)d8” |
| ST(HEALTH) | “Daily per capita calorie supply” |
| RE(HEALTH) | “Number of doctors (per thousand people)” |
| RE(HEALTH) | “Hospital beds (per thousand people)” |
| RE(HEALTH) | “Public health expenditure (percent of GDP)” |
| RE(HEALTH) | “Access to improved water sources (percent of population)” |
| RE(HEALTH) | “Access to improved sanitation (percent of population)” |
| PR(KNOW) | “Primary education ratio of students to teaching staff” |
| PR(KNOW) | “Secondary education ratio of students to teaching staff” |
| PR(KNOW) | “Tertiary education ratio of students to teaching staff” |
| ST(KNOW) | “Male expected years of schooling” |
| ST(KNOW) | “Female expected years of schooling” |
| ST(KNOW) | “Primary net school enrollment (percent of children)” |
| ST(KNOW) | “Secondary net school enrollment (percent of children)” |
| ST(KNOW) | “Literacy rate (percent of population)” |
| ST(KNOW) | “Knowledge Economy Index (KEI; values in [0,10])d9” |
| RE(KNOW) | “Public expenditure on research and development (percent of GDP)” |
| RE(KNOW) | “Public expenditure on education (percent of GDP)” |
| RE(KNOW) | “Personal computers (per thousand people)” |
| RE(KNOW) | “Internet users (per hundred people)” |
| RE(KNOW) | “Expenditure on information and communication (percent of GDP)” |
Appendix B
Table A2.
Countries sustainability performance ranking by SAFE, ANFIS, and ANFIS ensemble. UK: United Kingdom, USA: United States.
Table A2.
Countries sustainability performance ranking by SAFE, ANFIS, and ANFIS ensemble. UK: United Kingdom, USA: United States.
| Country | SAFE | ANFIS | ANFIS Ensemble | Difference (ANFIS Ensemble and SAFE) |
|---|---|---|---|---|
| Germany | 1 | 1 | 1 | 0 |
| Switzerland | 2 | 3 | 3 | 1 |
| Sweden | 3 | 2 | 2 | −1 |
| Norway | 4 | 4 | 4 | 0 |
| Finland | 5 | 6 | 5 | 0 |
| Denmark | 6 | 5 | 8 | 2 |
| Austria | 7 | 8 | 6 | −1 |
| Netherlands | 8 | 7 | 7 | −1 |
| Belgium | 9 | 9 | 9 | 0 |
| France | 10 | 11 | 10 | 0 |
| New Zealand | 11 | 10 | 11 | 0 |
| UK | 12 | 12 | 12 | 0 |
| Canada | 13 | 13 | 13 | 0 |
| Australia | 14 | 14 | 14 | 0 |
| Lithuania | 15 | 16 | 15 | 0 |
| Czech Rep. | 16 | 15 | 16 | 0 |
| Italy | 17 | 19 | 17 | 0 |
| Latvia | 18 | 21 | 18 | 0 |
| Slovenia | 19 | 18 | 19 | 0 |
| Slovakia | 20 | 17 | 20 | 0 |
| Spain | 21 | 25 | 21 | 0 |
| Ireland | 22 | 26 | 22 | 0 |
| Poland | 23 | 24 | 23 | 0 |
| Portugal | 24 | 22 | 25 | 1 |
| Estonia | 25 | 23 | 28 | 3 |
| Uruguay | 26 | 20 | 24 | −2 |
| Belarus | 27 | 27 | 26 | −1 |
| Japan | 28 | 31 | 27 | −1 |
| Croatia | 29 | 28 | 29 | 0 |
| Romania | 30 | 29 | 30 | 0 |
| Greece | 31 | 30 | 32 | 1 |
| USA | 32 | 33 | 31 | −1 |
| Hungary | 33 | 32 | 33 | 0 |
| Argentina | 34 | 34 | 34 | 0 |
| Brazil | 35 | 35 | 35 | 0 |
| Bulgaria | 36 | 37 | 36 | 0 |
| Turkey | 37 | 36 | 37 | 0 |
| Former Yugoslav Republic of Macedonia (FYR) Maced. | 38 | 39 | 38 | 0 |
| Ukraine | 39 | 38 | 39 | 0 |
| Kazakhstan | 40 | 40 | 40 | 0 |
| Russia | 41 | 41 | 42 | 1 |
| Georgia | 42 | 42 | 41 | −1 |
| Panama | 43 | 46 | 43 | 0 |
| Albania | 44 | 43 | 44 | 0 |
| Chile | 45 | 44 | 45 | 0 |
| Ecuador | 46 | 45 | 48 | 2 |
| Morocco | 47 | 47 | 47 | 0 |
| South Korea | 48 | 53 | 46 | −2 |
| Israel | 49 | 48 | 50 | 1 |
| Nicaragua | 50 | 49 | 49 | −1 |
| Venezuela | 51 | 50 | 51 | 0 |
| Armenia | 52 | 51 | 52 | 0 |
| Paraguay | 53 | 52 | 53 | 0 |
| Kyrgyzstan | 54 | 54 | 54 | 0 |
| Tunisia | 55 | 58 | 56 | 1 |
| Bolivia | 56 | 57 | 55 | −1 |
| Malaysia | 57 | 55 | 57 | 0 |
| El Salvador | 58 | 56 | 58 | 0 |
| Kuwait | 59 | 61 | 59 | 0 |
| Mexico | 60 | 60 | 60 | 0 |
| Peru | 61 | 59 | 62 | 1 |
| China | 62 | 63 | 61 | −1 |
| Tajikistan | 63 | 62 | 63 | 0 |
| Thailand | 64 | 64 | 64 | 0 |
| Indonesia | 65 | 66 | 65 | 0 |
| Moldova | 66 | 65 | 66 | 0 |
| Honduras | 67 | 68 | 67 | 0 |
| Azerbaijan | 68 | 67 | 68 | 0 |
| Ghana | 69 | 70 | 69 | 0 |
| Zimbabwe | 70 | 69 | 70 | 0 |
| Botswana | 71 | 72 | 71 | 0 |
| Guatemala | 72 | 71 | 72 | 0 |
| Syria | 73 | 73 | 73 | 0 |
| Philippines | 74 | 74 | 74 | 0 |
| Mongolia | 75 | 77 | 77 | 2 |
| Jordan | 76 | 75 | 75 | −1 |
| Namibia | 77 | 76 | 76 | −1 |
| United Arab Emirates | 78 | 80 | 78 | 0 |
| Saudi Arabia | 79 | 78 | 79 | 0 |
| Uzbekistan | 80 | 79 | 80 | 0 |
| Vietnam | 81 | 82 | 81 | 0 |
| Gabon | 82 | 81 | 82 | 0 |
| Algeria | 83 | 85 | 83 | 0 |
| Kenya | 84 | 84 | 85 | 1 |
| South Africa | 85 | 83 | 84 | −1 |
| Malawi | 86 | 88 | 88 | 2 |
| Sri Lanka | 87 | 89 | 87 | 0 |
| Zambia | 88 | 87 | 86 | −2 |
| Nepal | 89 | 86 | 91 | 2 |
| Gambia | 90 | 90 | 93 | 3 |
| Rwanda | 91 | 95 | 89 | −2 |
| Egypt | 92 | 96 | 90 | −2 |
| Lebanon | 93 | 94 | 92 | −1 |
| Senegal | 94 | 91 | 94 | 0 |
| Congo | 95 | 92 | 97 | 2 |
| Mozambique | 96 | 93 | 95 | −1 |
| Guinea Bissau | 97 | 100 | 96 | −1 |
| Burkina Faso | 98 | 98 | 98 | 0 |
| Cote d’Ivoire | 99 | 97 | 99 | 0 |
| Guinea | 100 | 99 | 100 | 0 |
| Angola | 101 | 104 | 101 | 0 |
| Chad | 102 | 103 | 102 | 0 |
| Iran | 103 | 101 | 104 | 1 |
| Tanzania | 104 | 102 | 103 | −1 |
| Colombia | 105 | 105 | 105 | 0 |
| DR Congo | 106 | 108 | 106 | 0 |
| Burundi | 107 | 106 | 107 | 0 |
| Uganda | 108 | 107 | 108 | 0 |
| Sierra Leone | 109 | 109 | 109 | 0 |
| Nigeria | 110 | 112 | 110 | 0 |
| Togo | 111 | 110 | 111 | 0 |
| Laos | 112 | 111 | 113 | 1 |
| Cameroon | 113 | 113 | 112 | −1 |
| Madagascar | 114 | 114 | 114 | 0 |
| Oman | 115 | 115 | 115 | 0 |
| India | 116 | 116 | 116 | 0 |
| Cambodia | 117 | 117 | 117 | 0 |
| Papua NG | 118 | 118 | 118 | 0 |
| Ethiopia | 119 | 119 | 119 | 0 |
| Benin | 120 | 120 | 121 | 1 |
| Centr. Afr. R | 121 | 123 | 120 | −1 |
| Mali | 122 | 121 | 122 | 0 |
| Bangladesh | 123 | 122 | 123 | 0 |
| Niger | 124 | 124 | 124 | 0 |
| Pakistan | 125 | 126 | 125 | 0 |
| Yemen | 126 | 125 | 126 | 0 |
| Sudan | 127 | 128 | 127 | 0 |
| Mauritania | 128 | 127 | 128 | 0 |
References
- Brundtland Commission. Development, World Commission on Environment and Our Common Future; Oxford University Press: Oxford, UK, 1987. [Google Scholar]
- Myronidis, D.; Ioannou, K.; Sapountzis, M.; Fotakis, D. Development of a sustainable plan to combat erosion for an island of the Mediterranean region. Fresenius Environ. Bull. 2010, 19, 1694–1702. [Google Scholar]
- Widya-Hasuti, A.; Mardani, A.; Streimikiene, D.; Sharifara, A.; Cavallaro, F. The Role of Process Innovation between Firm-Specific Capabilities and Sustainable Innovation in SMEs: Empirical Evidence from Indonesia. Sustainability 2018, 10, 2244. [Google Scholar] [CrossRef]
- Devuyst, D.; Hens, L.; De Lannoy, W. How Green Is the City?: Sustainability Assessment and the Management of Urban Environments; Columbia University Press: New York, NY, USA, 2001. [Google Scholar]
- Tan, Y.; Shuai, C.; Jiao, L.; Shen, L. An adaptive neuro-fuzzy inference system (ANFIS) approach for measuring country sustainability performance. Environ. Impact Assess. Rev. 2017, 65, 29–40. [Google Scholar] [CrossRef]
- Giddings, B.; Hopwood, B.; O’brien, G. Environment, economy and society: Fitting them together into sustainable development. Sustain. Dev. 2002, 10, 187–196. [Google Scholar] [CrossRef]
- Hediger, W. Sustainable development and social welfare. Ecol. Econ. 2000, 32, 481–492. [Google Scholar] [CrossRef]
- Konstantinos, I.; Georgios, T.; Garyfallos, A.; Zacharoula, A.; Eleni, Z. A Spatial Decision Support System Framework for the Evaluation of Biomass Energy Production Locations: Case Study in the Regional Unit of Drama, Greece. Sustainability 2018, 10, 531. [Google Scholar]
- Ioannou, K.; Birbilis, D.; Lefakis, P. A method for predicting the possibility of ring shake appearance on standing chestnut trees (Castanea sativa MIL L.). J. Environ. Prot. Ecol. 2011, 12, 295–304. [Google Scholar]
- Arushanyan, Y.; Ekener, E.; Moberg, Å. Sustainability assessment framework for scenarios–SAFS. Environ. Impact Assess. Rev. 2017, 63, 23–34. [Google Scholar] [CrossRef]
- Houshyar, E.; SheikhDavoodi, M.J.; Almassi, M.; Bahrami, H.; Azadi, H.; Omidi, M.; Sayyad, G.; Witlox, F. Silage corn production in conventional and conservation tillage systems. Part I: Sustainability analysis using combination of GIS/AHP and multi-fuzzy modeling. Ecol. Indic. 2014, 39, 102–114. [Google Scholar] [CrossRef]
- Cavallaro, F. A Takagi-Sugeno Fuzzy Inference System for developing a sustainability index of biomass. Sustainability 2015, 7, 12359–12371. [Google Scholar] [CrossRef]
- Zhao, H.; Li, N. Performance evaluation for sustainability of strong smart grid by using stochastic AHP and fuzzy TOPSIS methods. Sustainability 2016, 8, 129. [Google Scholar] [CrossRef]
- Phillis, Y.A.; Grigoroudis, E.; Kouikoglou, V.S. Sustainability ranking and improvement of countries. Ecol. Econ. 2011, 70, 542–553. [Google Scholar] [CrossRef]
- Phillis, Y.A.; Andriantiatsaholiniaina, L.A. Sustainability: An ill-defined concept and its assessment using fuzzy logic. Ecol. Econ. 2001, 37, 435–456. [Google Scholar] [CrossRef]
- Woods, K.; Kegelmeyer, W.P.; Bowyer, K. Combination of multiple classifiers using local accuracy estimates. IEEE Trans. Pattern Anal. Mach. Intell. 1997, 19, 405–410. [Google Scholar] [CrossRef]
- Hansen, L.K.; Salamon, P. Neural network ensembles. IEEE Trans. Pattern Anal. Mach. Intell. 1990, 12, 993–1001. [Google Scholar] [CrossRef] [Green Version]
- Kuncheva, L.I. Combining Pattern Classifiers: Methods and Algorithms; John Wiley & Sons: Hoboken, NJ, USA, 2004. [Google Scholar]
- Soto, J.; Melin, P.; Castillo, O. A new approach for time series prediction using ensembles of ANFIS models with interval type-2 and type-1 fuzzy integrators. In Proceedings of the 2013 IEEE Conference on Computational Intelligence for Financial Engineering & Economics (CIFEr), Singapore, 16–19 April 2013; pp. 68–73. [Google Scholar]
- Jang, J.-S. ANFIS: Adaptive-network-based fuzzy inference system. IEEE Trans. Syst. Man Cybern. 1993, 23, 665–685. [Google Scholar] [CrossRef]
- Zadeh, L.A. Fuzzy sets. Inf. Control 1965, 8, 338–353. [Google Scholar] [CrossRef] [Green Version]
- Halkijevic, I.; Vukovic, Z.; Vouk, D. Indicators and a Neuro-Fuzzy Based Model for the Evaluation of Water Supply Sustainability. Water Resour. Manag. 2017, 31, 3683–3698. [Google Scholar] [CrossRef]
- Cavallaro, F. Electric load analysis using an artificial neural network. Int. J. Energy Res. 2005, 29, 377–392. [Google Scholar] [CrossRef]
- Ruben, R.B.; Asokan, P.; Vinodh, S. Performance evaluation of lean sustainable systems using adaptive neuro fuzzy inference system: A case study. Int. J. Sustain. Eng. 2017, 10, 158–175. [Google Scholar] [CrossRef]
- Pousinho, H.M.I.; Mendes, V.M.F.; Catalão, J.P.S. A hybrid PSO–ANFIS approach for short-term wind power prediction in Portugal. Energy Convers. Manag. 2011, 52, 397–402. [Google Scholar] [CrossRef] [Green Version]
- Altin, N.; Sefa, İ. dSPACE based adaptive neuro-fuzzy controller of grid interactive inverter. Energy Convers. Manag. 2012, 56, 130–139. [Google Scholar] [CrossRef]
- Shamshirband, S.; Petković, D.; Ćojbašić, Ž.; Nikolić, V.; Anuar, N.B.; Mohd Shuib, N.L.; Mat Kiah, M.L.; Akib, S. Adaptive neuro-fuzzy optimization of wind farm project net profit. Energy Convers. Manag. 2014, 80, 229–237. [Google Scholar] [CrossRef]
- Osório, G.J.; Matias, J.C.O.; Catalão, J.P.S. Electricity prices forecasting by a hybrid evolutionary-adaptive methodology. Energy Convers. Manag. 2014, 80, 363–373. [Google Scholar] [CrossRef]
- Liu, H.; Tian, H.-Q.; Li, Y.-F. Comparison of new hybrid FEEMD-MLP, FEEMD-ANFIS, Wavelet Packet-MLP and Wavelet Packet-ANFIS for wind speed predictions. Energy Convers. Manag. 2015, 89, 1–11. [Google Scholar] [CrossRef]
- Mohammadi, K.; Shamshirband, S.; Tong, C.W.; Alam, K.A.; Petković, D. Potential of adaptive neuro-fuzzy system for prediction of daily global solar radiation by day of the year. Energy Convers. Manag. 2015, 93, 406–413. [Google Scholar] [CrossRef]
- Al-Ghandoor, A.; Samhouri, M.; Al-Hinti, I.; Jaber, J.; Al-Rawashdeh, M. Projection of future transport energy demand of Jordan using adaptive neuro-fuzzy technique. Energy 2012, 38, 128–135. [Google Scholar] [CrossRef]
- Zahedi, G.; Azizi, S.; Bahadori, A.; Elkamel, A.; Wan Alwi, S.R. Electricity demand estimation using an adaptive neuro-fuzzy network: A case study from the Ontario province—Canada. Energy 2013, 49, 323–328. [Google Scholar] [CrossRef]
- Nikolić, V.; Shamshirband, S.; Petković, D.; Mohammadi, K.; Ćojbašić, Ž.; Altameem, T.A.; Gani, A. Wind wake influence estimation on energy production of wind farm by adaptive neuro-fuzzy methodology. Energy 2015, 80, 361–372. [Google Scholar] [CrossRef]
- Nikolić, V.; Petković, D.; Shamshirband, S.; Ćojbašić, Ž. Adaptive neuro-fuzzy estimation of diffuser effects on wind turbine performance. Energy 2015, 89, 324–333. [Google Scholar] [CrossRef]
- Naji, S.; Shamshirband, S.; Basser, H.; Keivani, A.; Alengaram, U.J.; Jumaat, M.Z.; Petković, D. Application of adaptive neuro-fuzzy methodology for estimating building energy consumption. Renew. Sustain. Energy Rev. 2016, 53, 1520–1528. [Google Scholar] [CrossRef]
- Petković, D.; Shamshirband, S.; Kamsin, A.; Lee, M.; Anicic, O.; Nikolić, V. Survey of the most influential parameters on the wind farm net present value (NPV) by adaptive neuro-fuzzy approach. Renew. Sustain. Energy Rev. 2016, 57, 1270–1278. [Google Scholar] [CrossRef]
- Shamshirband, S.; Keivani, A.; Mohammadi, K.; Lee, M.; Hamid, S.H.A.; Petkovic, D. Assessing the proficiency of adaptive neuro-fuzzy system to estimate wind power density: Case study of Aligoodarz, Iran. Renew. Sustain. Energy Rev. 2016, 59, 429–435. [Google Scholar] [CrossRef]
- Mellit, A.; Kalogirou, S.A. ANFIS-based modelling for photovoltaic power supply system: A case study. Renew. Energy 2011, 36, 250–258. [Google Scholar] [CrossRef]
- Yang, Z.; Liu, Y.; Li, C. Interpolation of missing wind data based on ANFIS. Renew. Energy 2011, 36, 993–998. [Google Scholar] [CrossRef]
- Fernandez-Jimenez, L.A.; Muñoz-Jimenez, A.; Falces, A.; Mendoza-Villena, M.; Garcia-Garrido, E.; Lara-Santillan, P.M.; Zorzano-Alba, E.; Zorzano-Santamaria, P.J. Short-term power forecasting system for photovoltaic plants. Renew. Energy 2012, 44, 311–317. [Google Scholar] [CrossRef]
- Nilashi, M.; Ibrahim, O.; Ahani, A. Accuracy improvement for predicting Parkinson’s disease progression. Sci. Rep. 2016, 6, 34181. [Google Scholar] [CrossRef] [PubMed]
- Nilashi, M.; bin Ibrahim, O.; Ithnin, N. Hybrid recommendation approaches for multi-criteria collaborative filtering. Expert Syst. Appl. 2014, 41, 3879–3900. [Google Scholar] [CrossRef]
- Jang, J.-S.R.; Sun, C.-T.; Mizutani, E. Neuro-Fuzzy and Soft Computing—A Computational Approach to Learning and Machine Intelligence, 1997.
- Nilashi, M.; bin Ibrahim, O.; Ithnin, N.; Sarmin, N.H. A multi-criteria collaborative filtering recommender system for the tourism domain using Expectation Maximization (EM) and PCA–ANFIS. Electron. Commer. Res. Appl. 2015, 14, 542–562. [Google Scholar] [CrossRef]
- Chen, R.-Y. RFM-based eco-efficiency analysis using Takagi–Sugeno fuzzy and AHP approach. Environ. Impact Assess. Rev. 2009, 29, 157–164. [Google Scholar] [CrossRef]
- Ahmadi, H.; Gholamzadeh, M.; Shahmoradi, L.; Nilashi, M.; Rashvand, P. Diseases Diagnosis Using Fuzzy Logic Methods: A Systematic and Meta-Analysis Review. Comput. Methods Programs Biomed. 2018, 161, 145–172. [Google Scholar] [CrossRef] [PubMed]
- Nilashi, M.; Dalvi-Esfahani, M.; Ibrahim, O.; Bagherifard, K.; Mardani, A.; Zakuan, N. A soft computing method for the prediction of energy performance of residential buildings. Measurement 2017, 109, 268–280. [Google Scholar] [CrossRef]
- Ahani, A.; Rahim, N.Z.A.; Nilashi, M. Forecasting social CRM adoption in SMEs: A combined SEM-neural network method. Comput. Hum. Behav. 2017, 75, 560–578. [Google Scholar] [CrossRef]
- Nilashi, M.; Bagherifard, K.; Rahmani, M.; Rafe, V. A recommender system for tourism industry using cluster ensemble and prediction machine learning techniques. Comput. Ind. Eng. 2017, 109, 357–368. [Google Scholar] [CrossRef]
- Nilashi, M.; Ibrahim, O.; Ahmadi, H.; Shahmoradi, L.; Farahmand, M. A hybrid intelligent system for the prediction of Parkinson’s Disease progression using machine learning techniques. Biocybern. Biomed. Eng. 2018, 38, 1–15. [Google Scholar] [CrossRef]
- Saini, L.M. Peak load forecasting using Bayesian regularization, Resilient and adaptive backpropagation learning based artificial neural networks. Electr. Power Syst. Res. 2008, 78, 1302–1310. [Google Scholar] [CrossRef]
- Wang, C.-H.; Kao, C.-H.; Lee, W.-H. A new interactive model for improving the learning performance of back propagation neural network. Autom. Constr. 2007, 16, 745–758. [Google Scholar] [CrossRef]
- Hjorth, P.; Bagheri, A. Navigating towards sustainable development: A system dynamics approach. Futures 2006, 38, 74–92. [Google Scholar] [CrossRef]
- Grigoroudis, E.; Kouikoglou, V.S.; Phillis, Y.A. SAFE 2013: Sustainability of countries updated. Ecol. Indic. 2014, 38, 61–66. [Google Scholar] [CrossRef]
Figure 1.
Block diagram for the Takagi–Sugeno fuzzy inference system (Sugeno FIS).
Figure 2.
Sustainability performance by an adaptive neuro-fuzzy inference system (ANFIS) model.
Figure 3.
Sustainability performance by the ANFIS model.
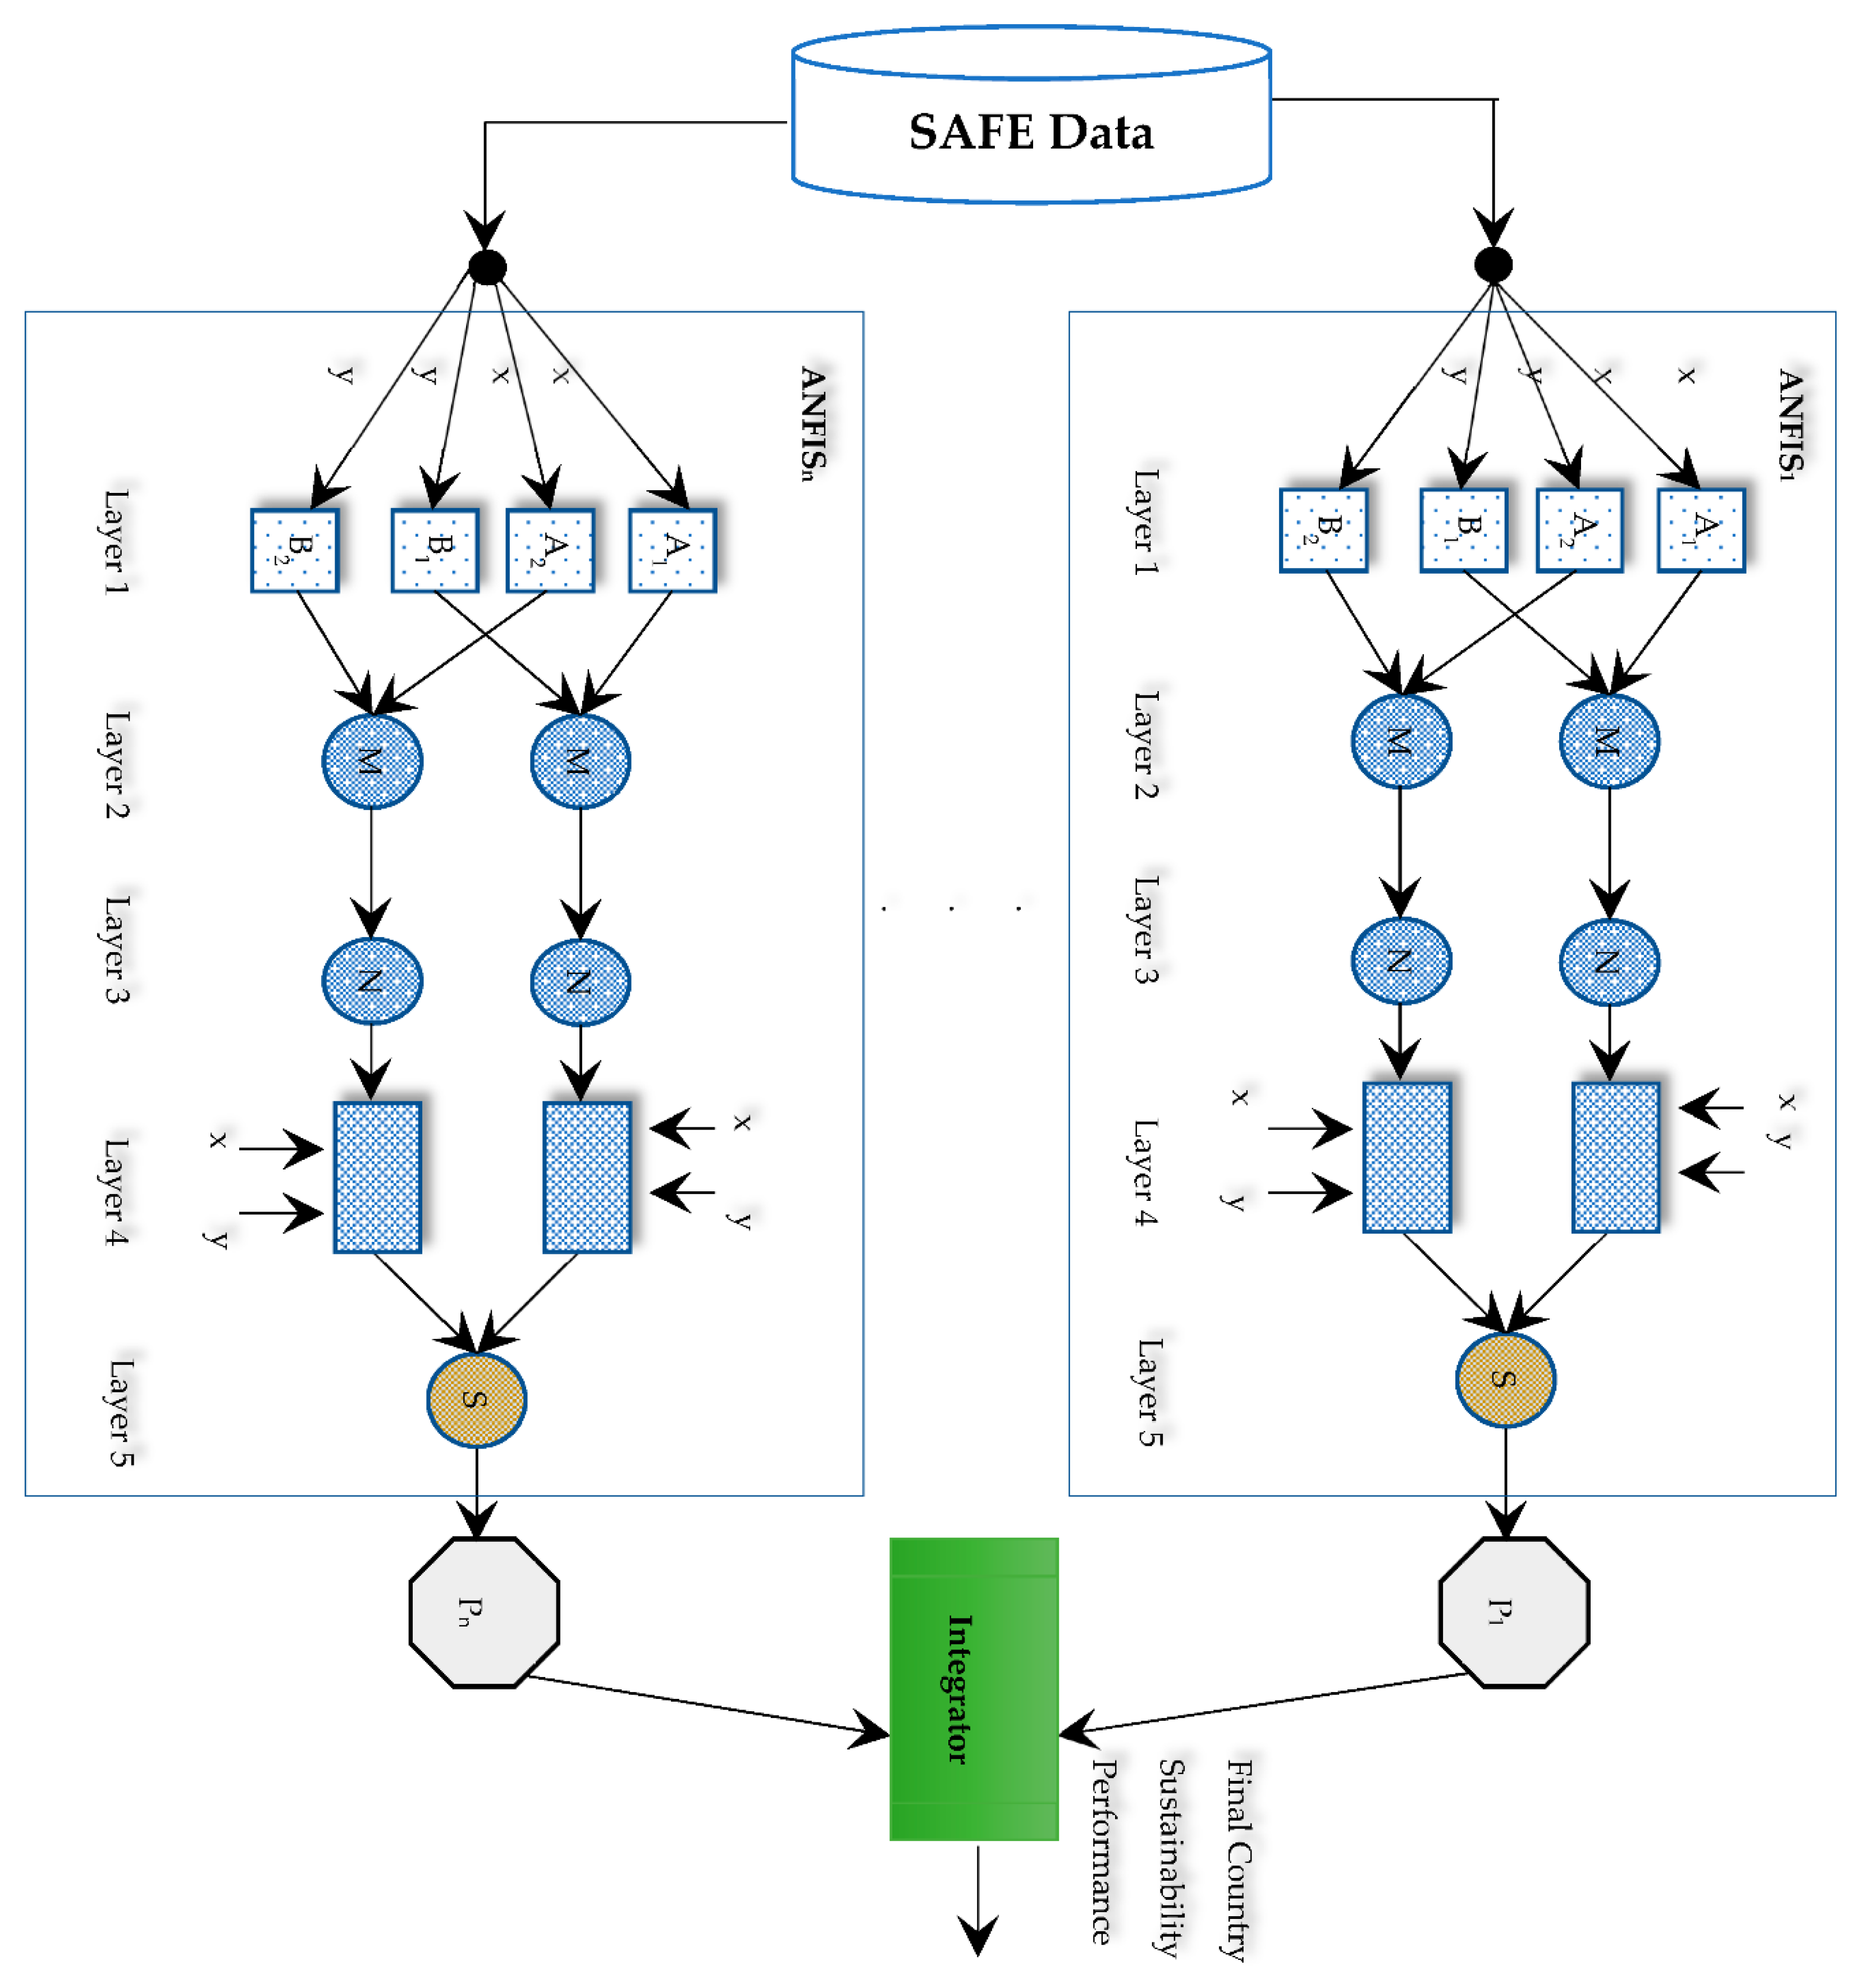
Figure 4.
Assessment framework for countries’ sustainability performance. AIR: air quality, BIOD: biodiversity, ECOS: ecological sustainability, HEALTH: health, HUMS: human sustainability, KNOW: education, LAND: land integrity, POLICY: political aspects, PR: pressure, RE: response, ST: state, WATER: water quality, WEALTH: economic welfare.
Figure 5.
Gaussian membership functions (MFs) for ECOS and HUMS.

Figure 6.
Errors of ANFIS prediction in 100 epochs for overall sustainability performance (OSUS), ECOS, and HUMS.
Figure 6.
Errors of ANFIS prediction in 100 epochs for overall sustainability performance (OSUS), ECOS, and HUMS.
Figure 7.
The results of the ANFIS model for measuring overall sustainability performance.
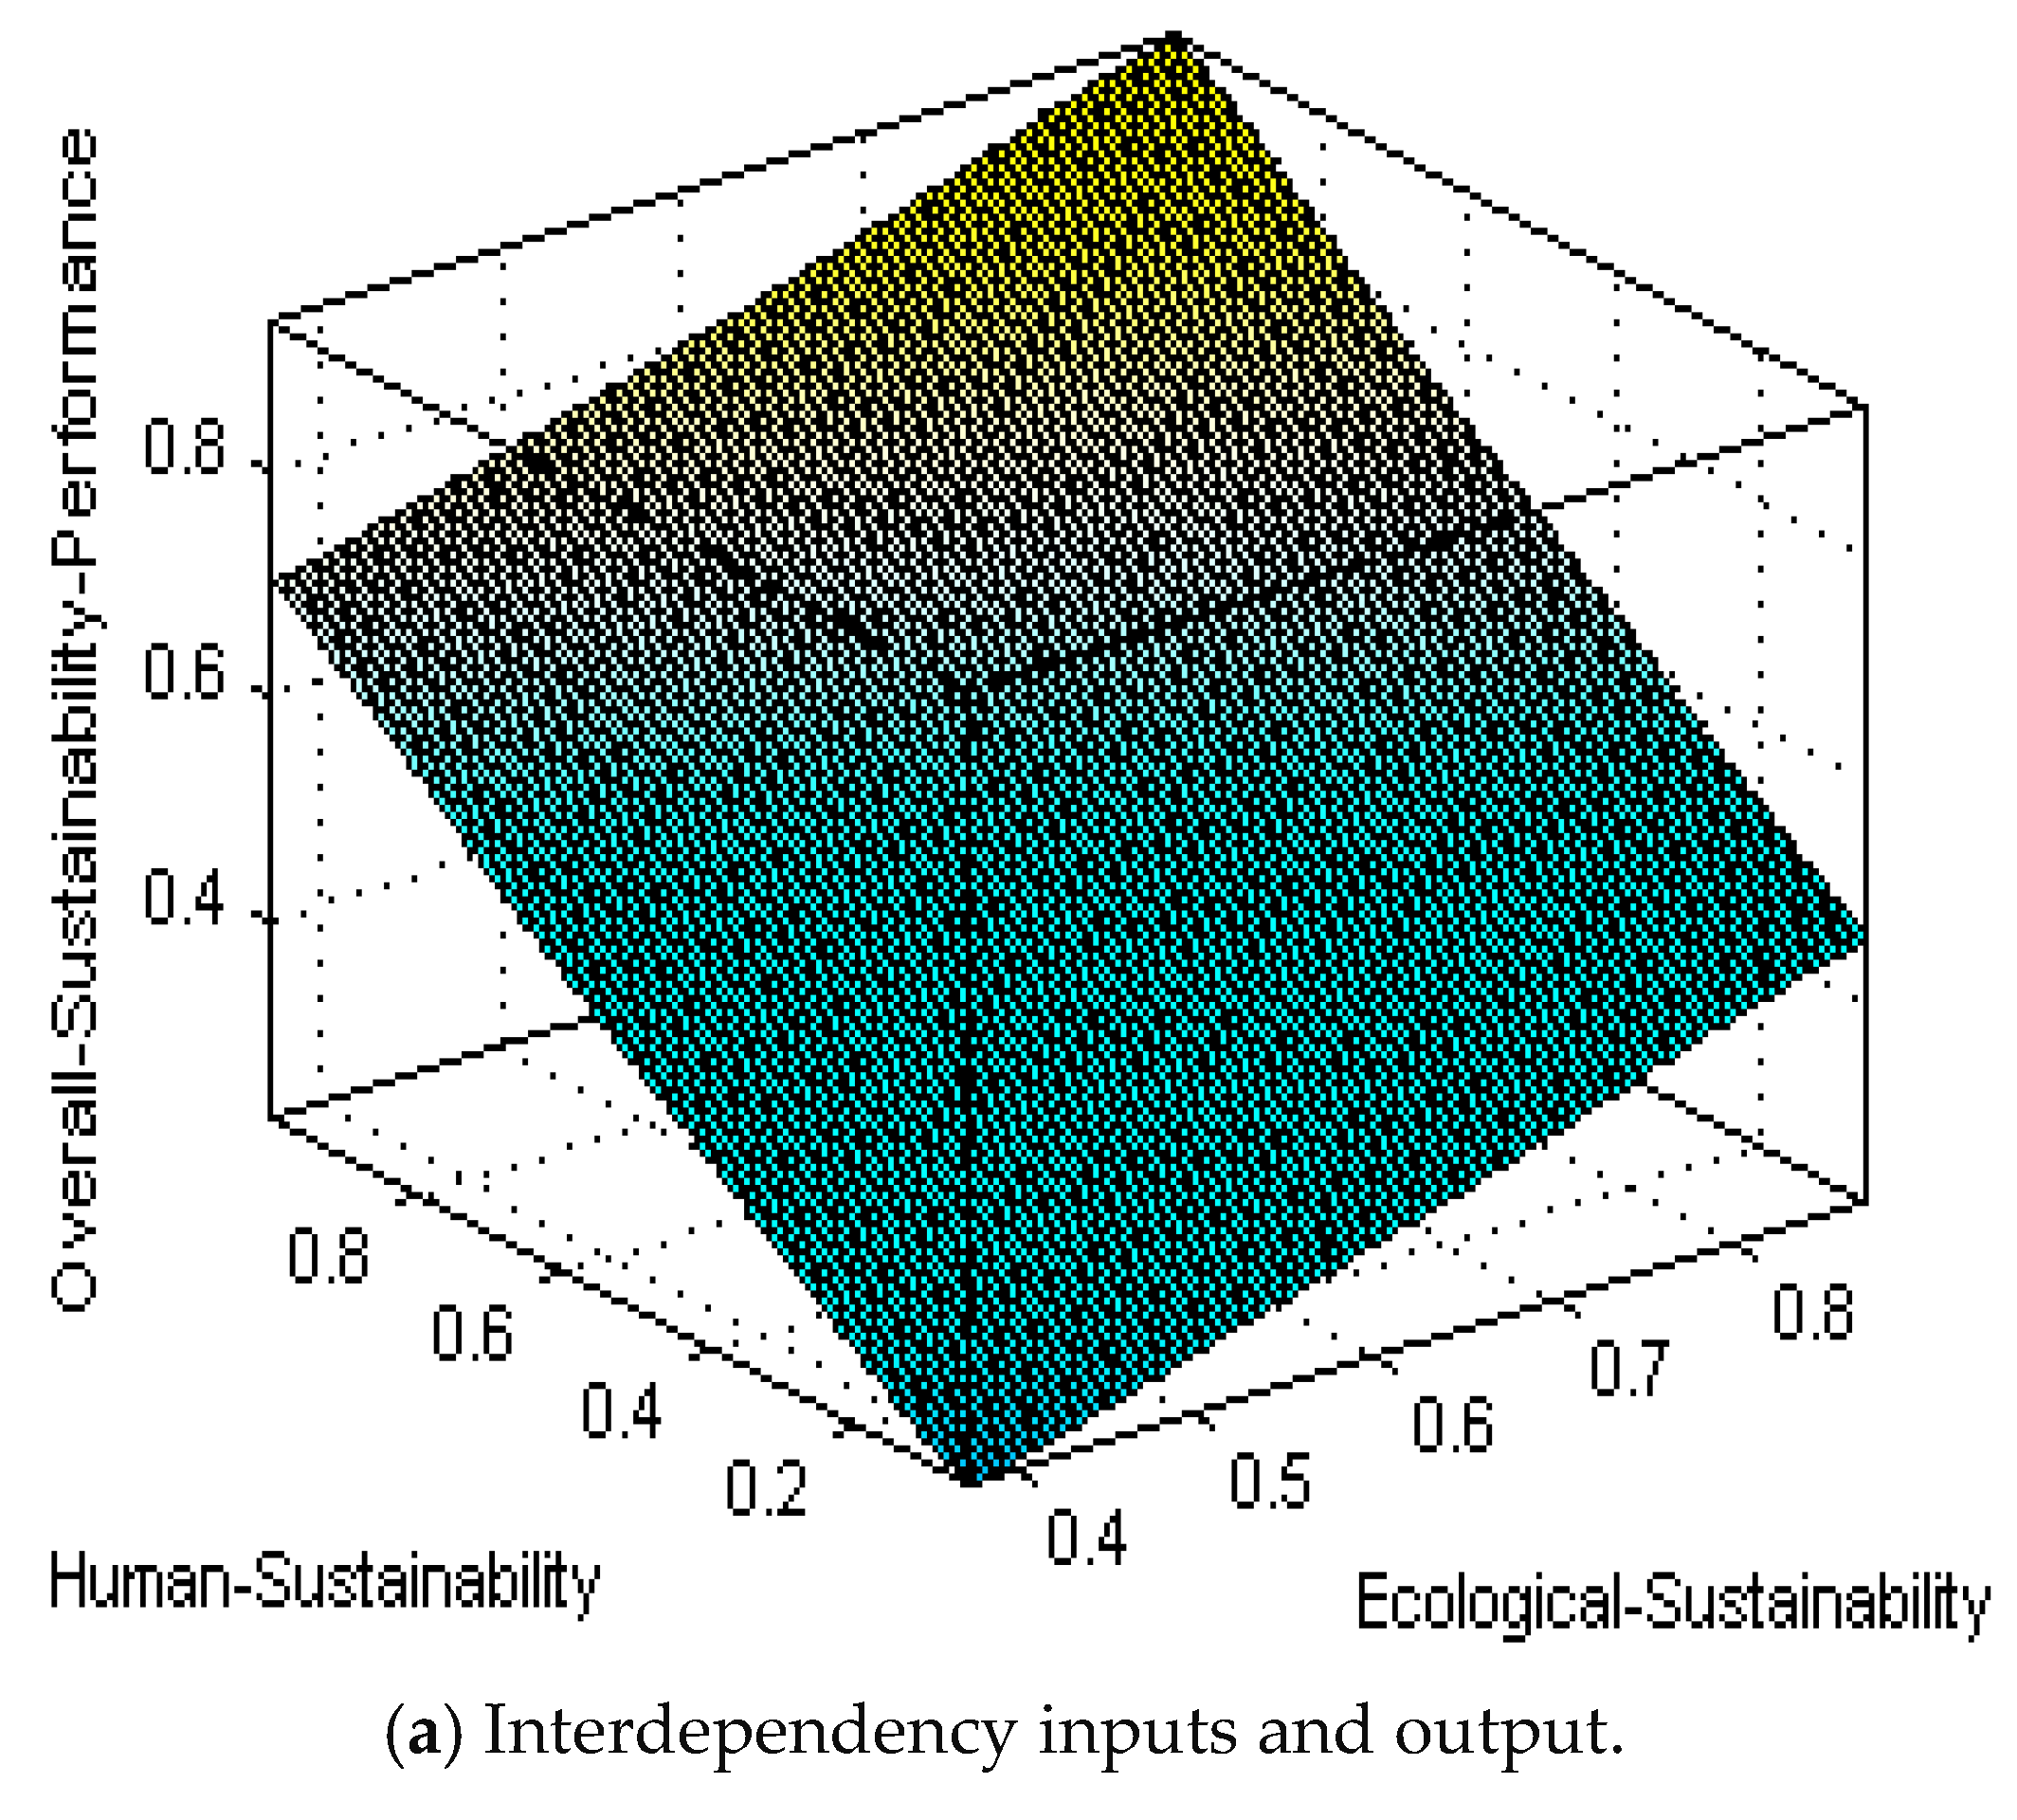
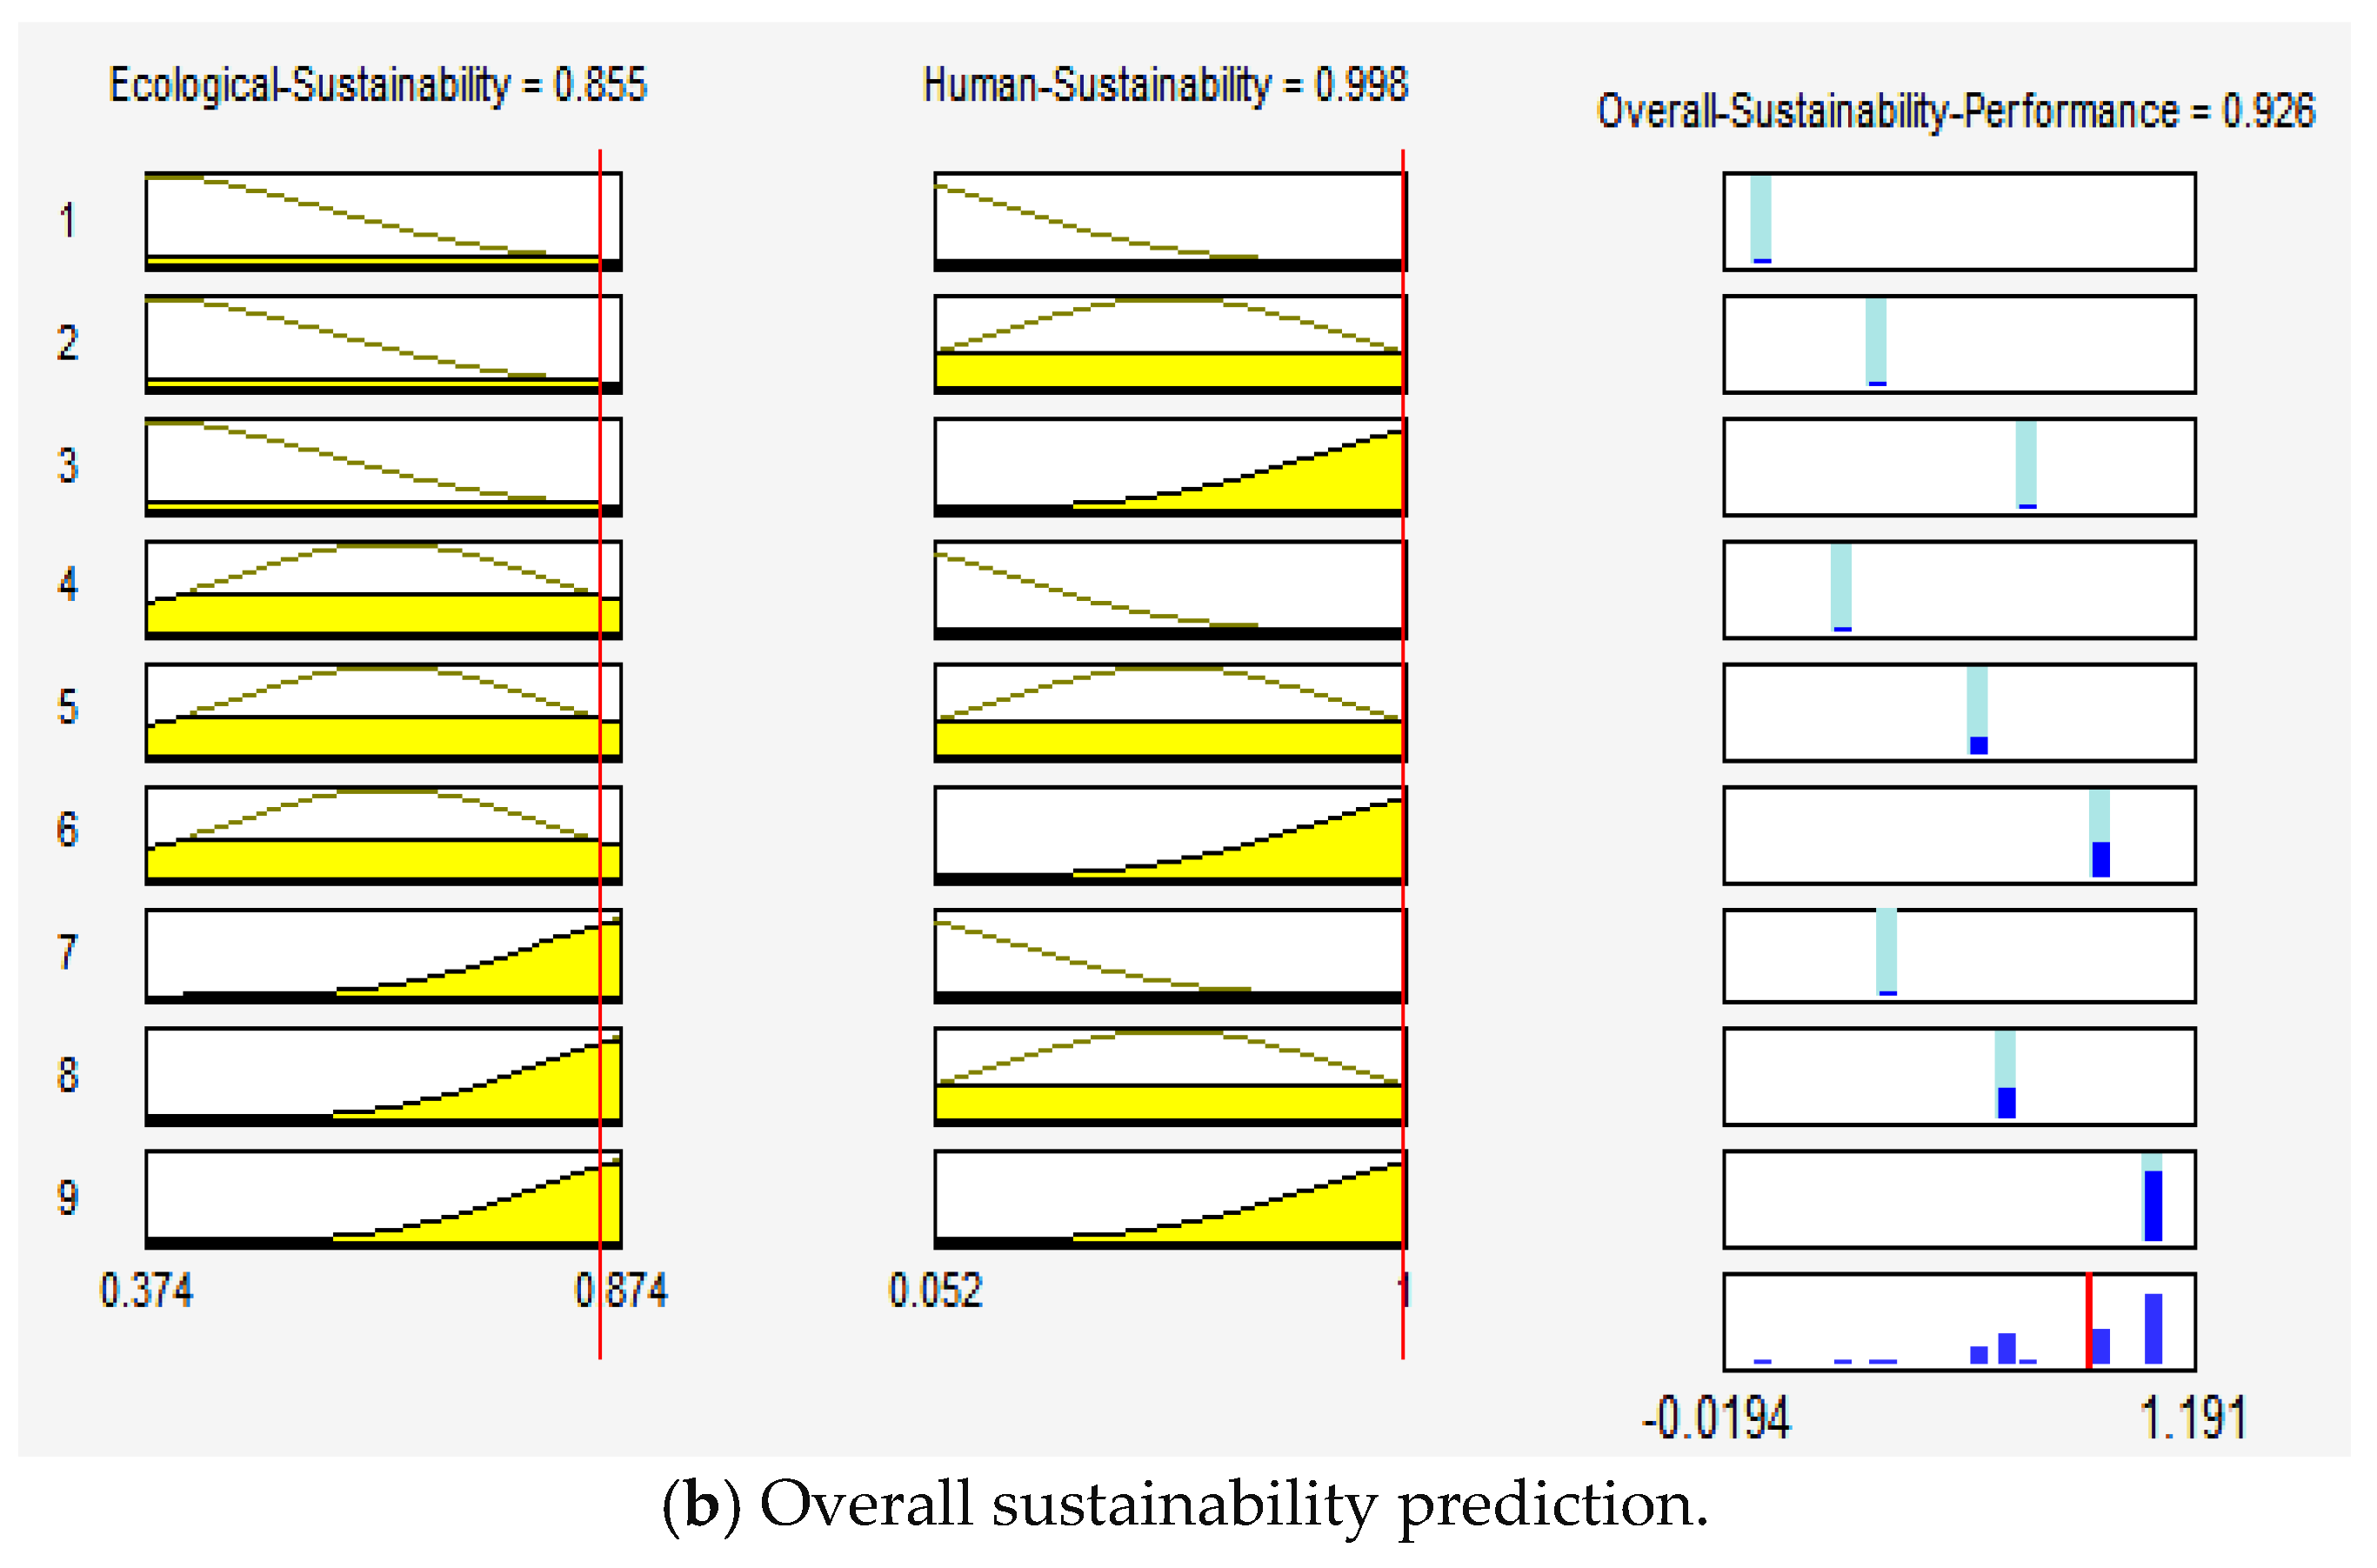
Figure 8.
Ranking difference of the ANFIS-sustainability assessment by fuzzy evaluation (SAFE) and the ANFIS ensemble-SAFE in estimating the sustainability performance of 128 countries.
Figure 8.
Ranking difference of the ANFIS-sustainability assessment by fuzzy evaluation (SAFE) and the ANFIS ensemble-SAFE in estimating the sustainability performance of 128 countries.
Table 1.
Root mean square error (RMSE) of different methods. MLR: multiple linear regression, NN: neural network, SVR: support vector regression.
Table 1.
Root mean square error (RMSE) of different methods. MLR: multiple linear regression, NN: neural network, SVR: support vector regression.
| Method | Membership Function | RMSE |
|---|---|---|
| ANFIS-Ensemble | Triangular, Generalized Bell-Shaped, Gaussian, and Π-Shaped | 0.00086 |
| ANFIS-Ensemble | Gaussian, Π-Shaped, and Generalized Bell-Shaped | 0.00065 |
| ANFIS-Ensemble | Gaussian, Triangular, and Generalized Bell-Shaped | 0.00059 |
| ANFIS-Ensemble | Gaussian, Triangular, and Π-Shaped | 0.00038 |
| NN | - | 0.02649 |
| SVR | - | 0.00916 |
| MLR | - | 0.03438 |
© 2018 by the authors. Licensee MDPI, Basel, Switzerland. This article is an open access article distributed under the terms and conditions of the Creative Commons Attribution (CC BY) license (http://creativecommons.org/licenses/by/4.0/).
Share and Cite
MDPI and ACS Style
Nilashi, M.; Cavallaro, F.; Mardani, A.; Zavadskas, E.K.; Samad, S.; Ibrahim, O. Measuring Country Sustainability Performance Using Ensembles of Neuro-Fuzzy Technique. Sustainability 2018, 10, 2707. https://doi.org/10.3390/su10082707
AMA Style
Nilashi M, Cavallaro F, Mardani A, Zavadskas EK, Samad S, Ibrahim O. Measuring Country Sustainability Performance Using Ensembles of Neuro-Fuzzy Technique. Sustainability. 2018; 10(8):2707. https://doi.org/10.3390/su10082707
Chicago/Turabian StyleNilashi, Mehrbakhsh, Fausto Cavallaro, Abbas Mardani, Edmundas Kazimieras Zavadskas, Sarminah Samad, and Othman Ibrahim. 2018. "Measuring Country Sustainability Performance Using Ensembles of Neuro-Fuzzy Technique" Sustainability 10, no. 8: 2707. https://doi.org/10.3390/su10082707
Note that from the first issue of 2016, this journal uses article numbers instead of page numbers. See further details here.