Comparative Analysis of Urban Heat Island Intensities in Chinese, Russian, and DPRK Regions across the Transnational Urban Agglomeration of the Tumen River in Northeast Asia


Abstract
:1. Introduction
2. Study Area and Data
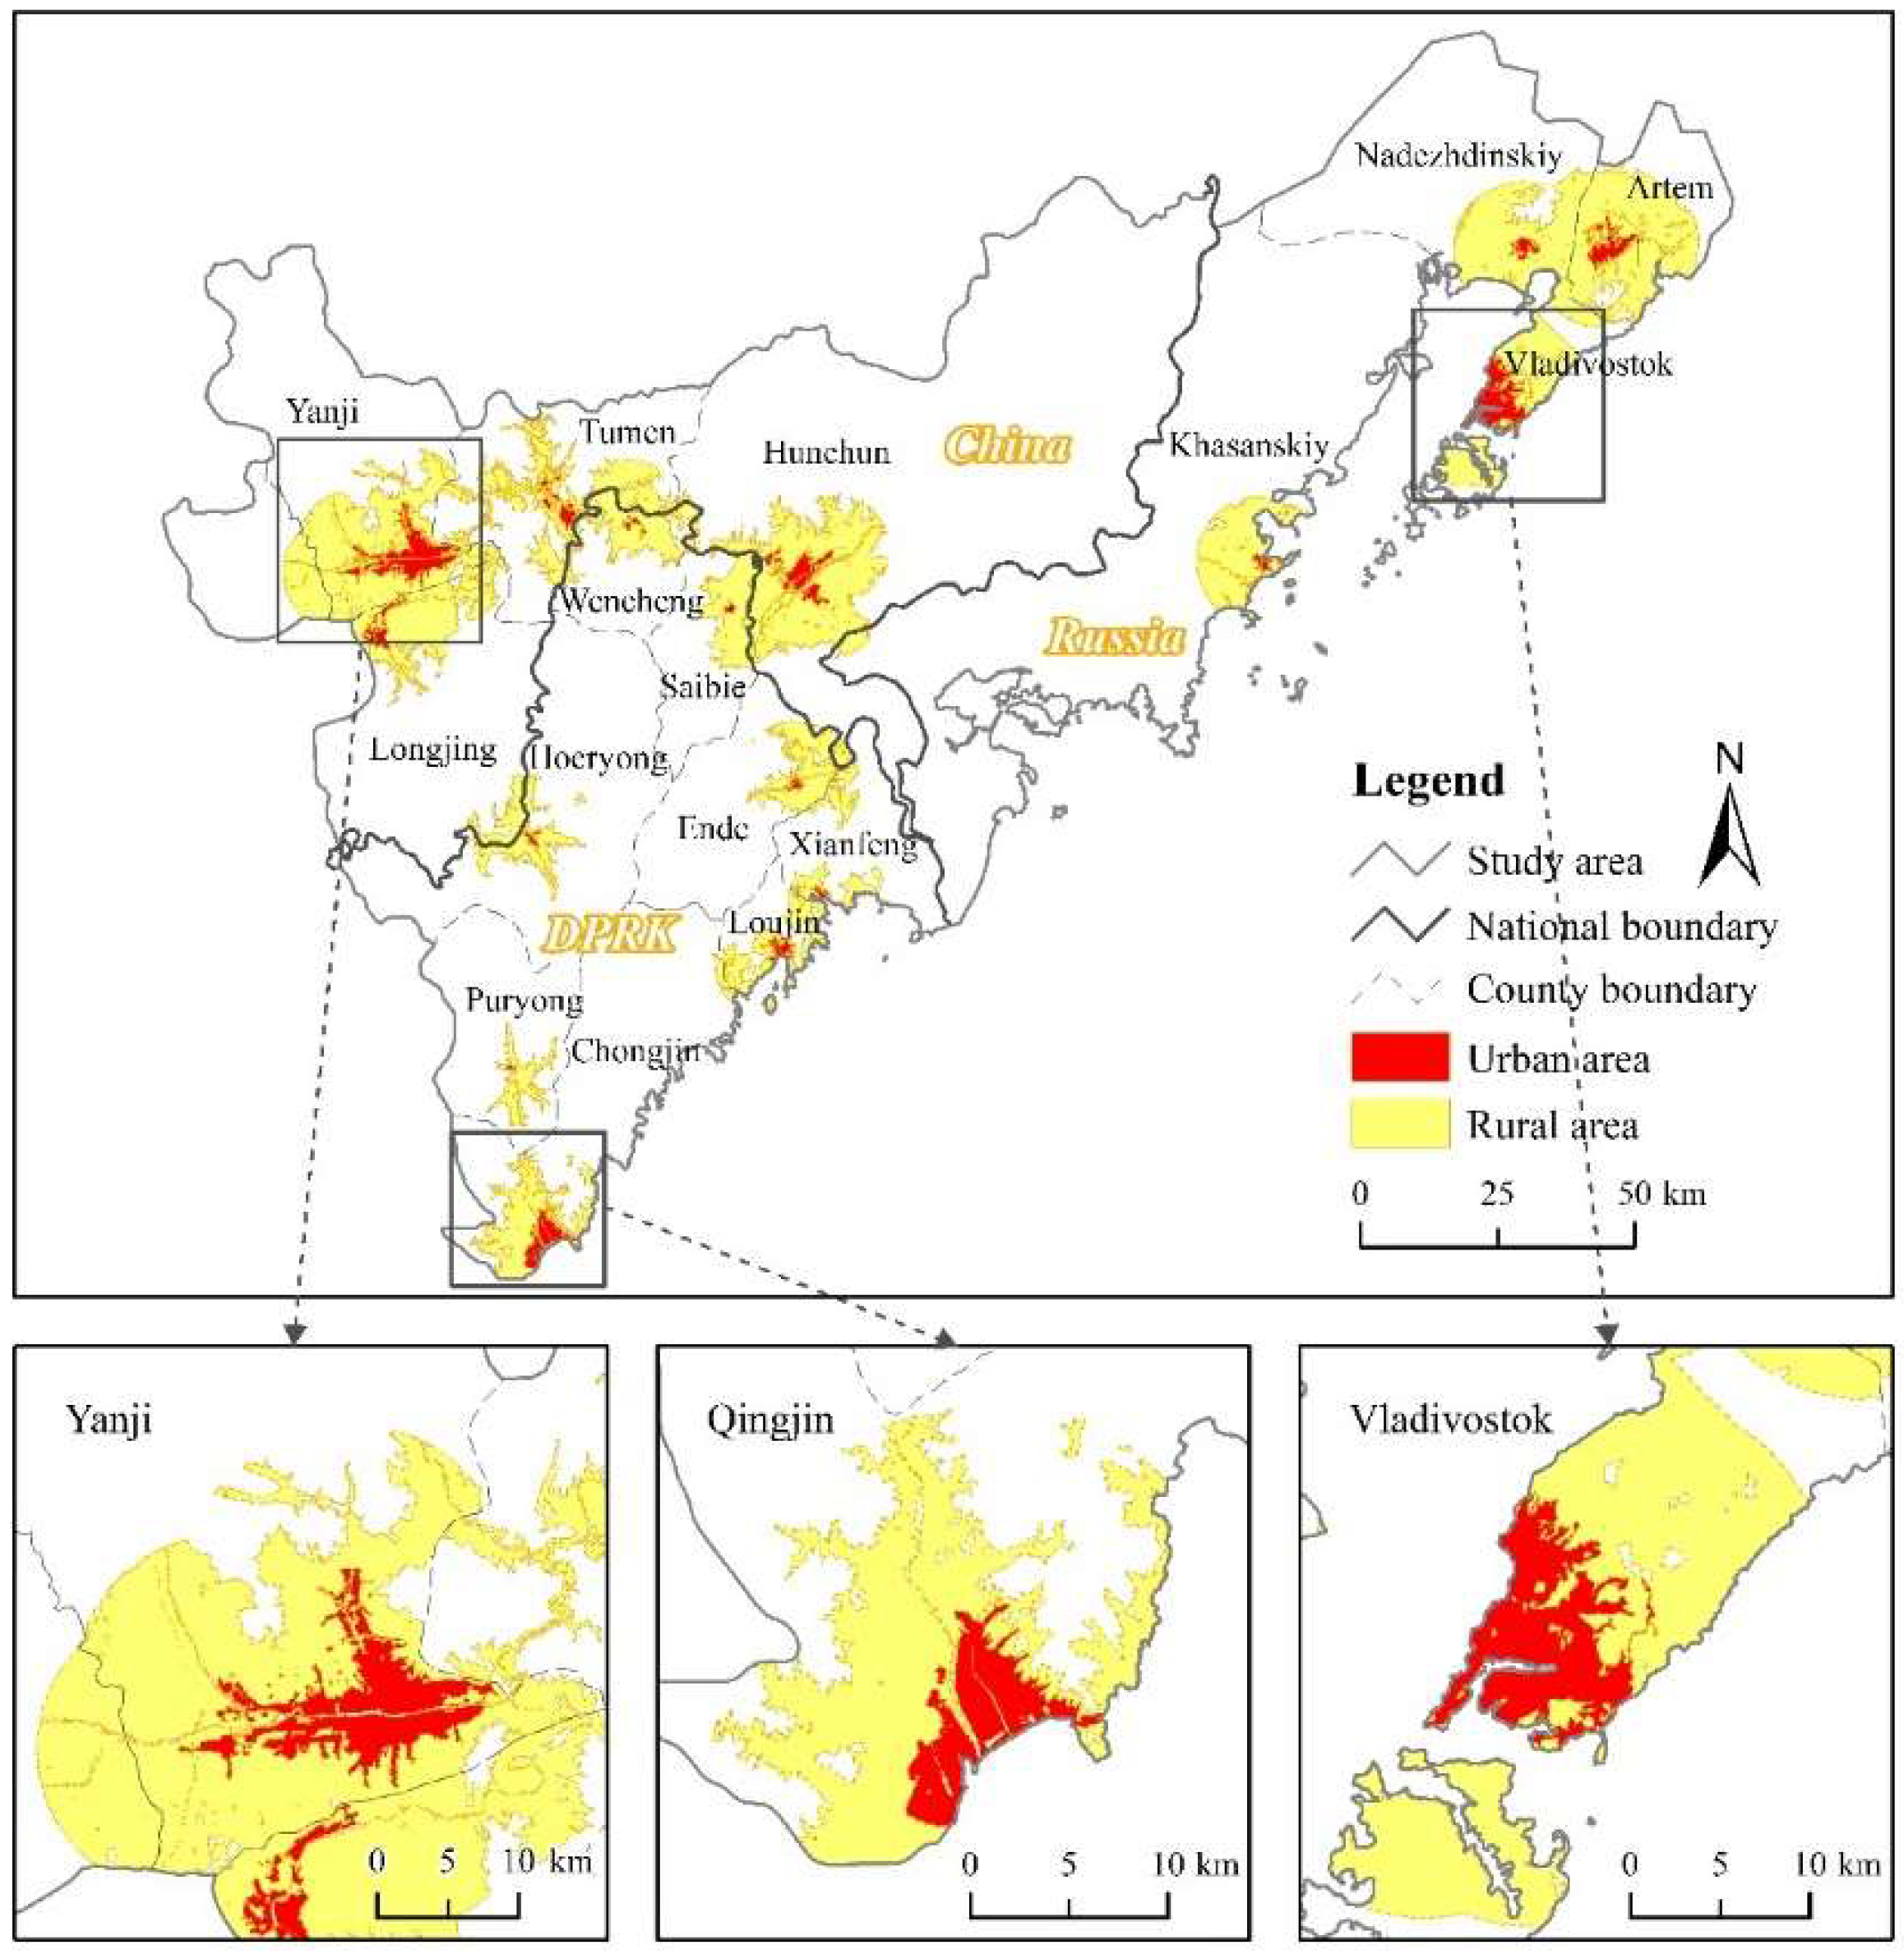
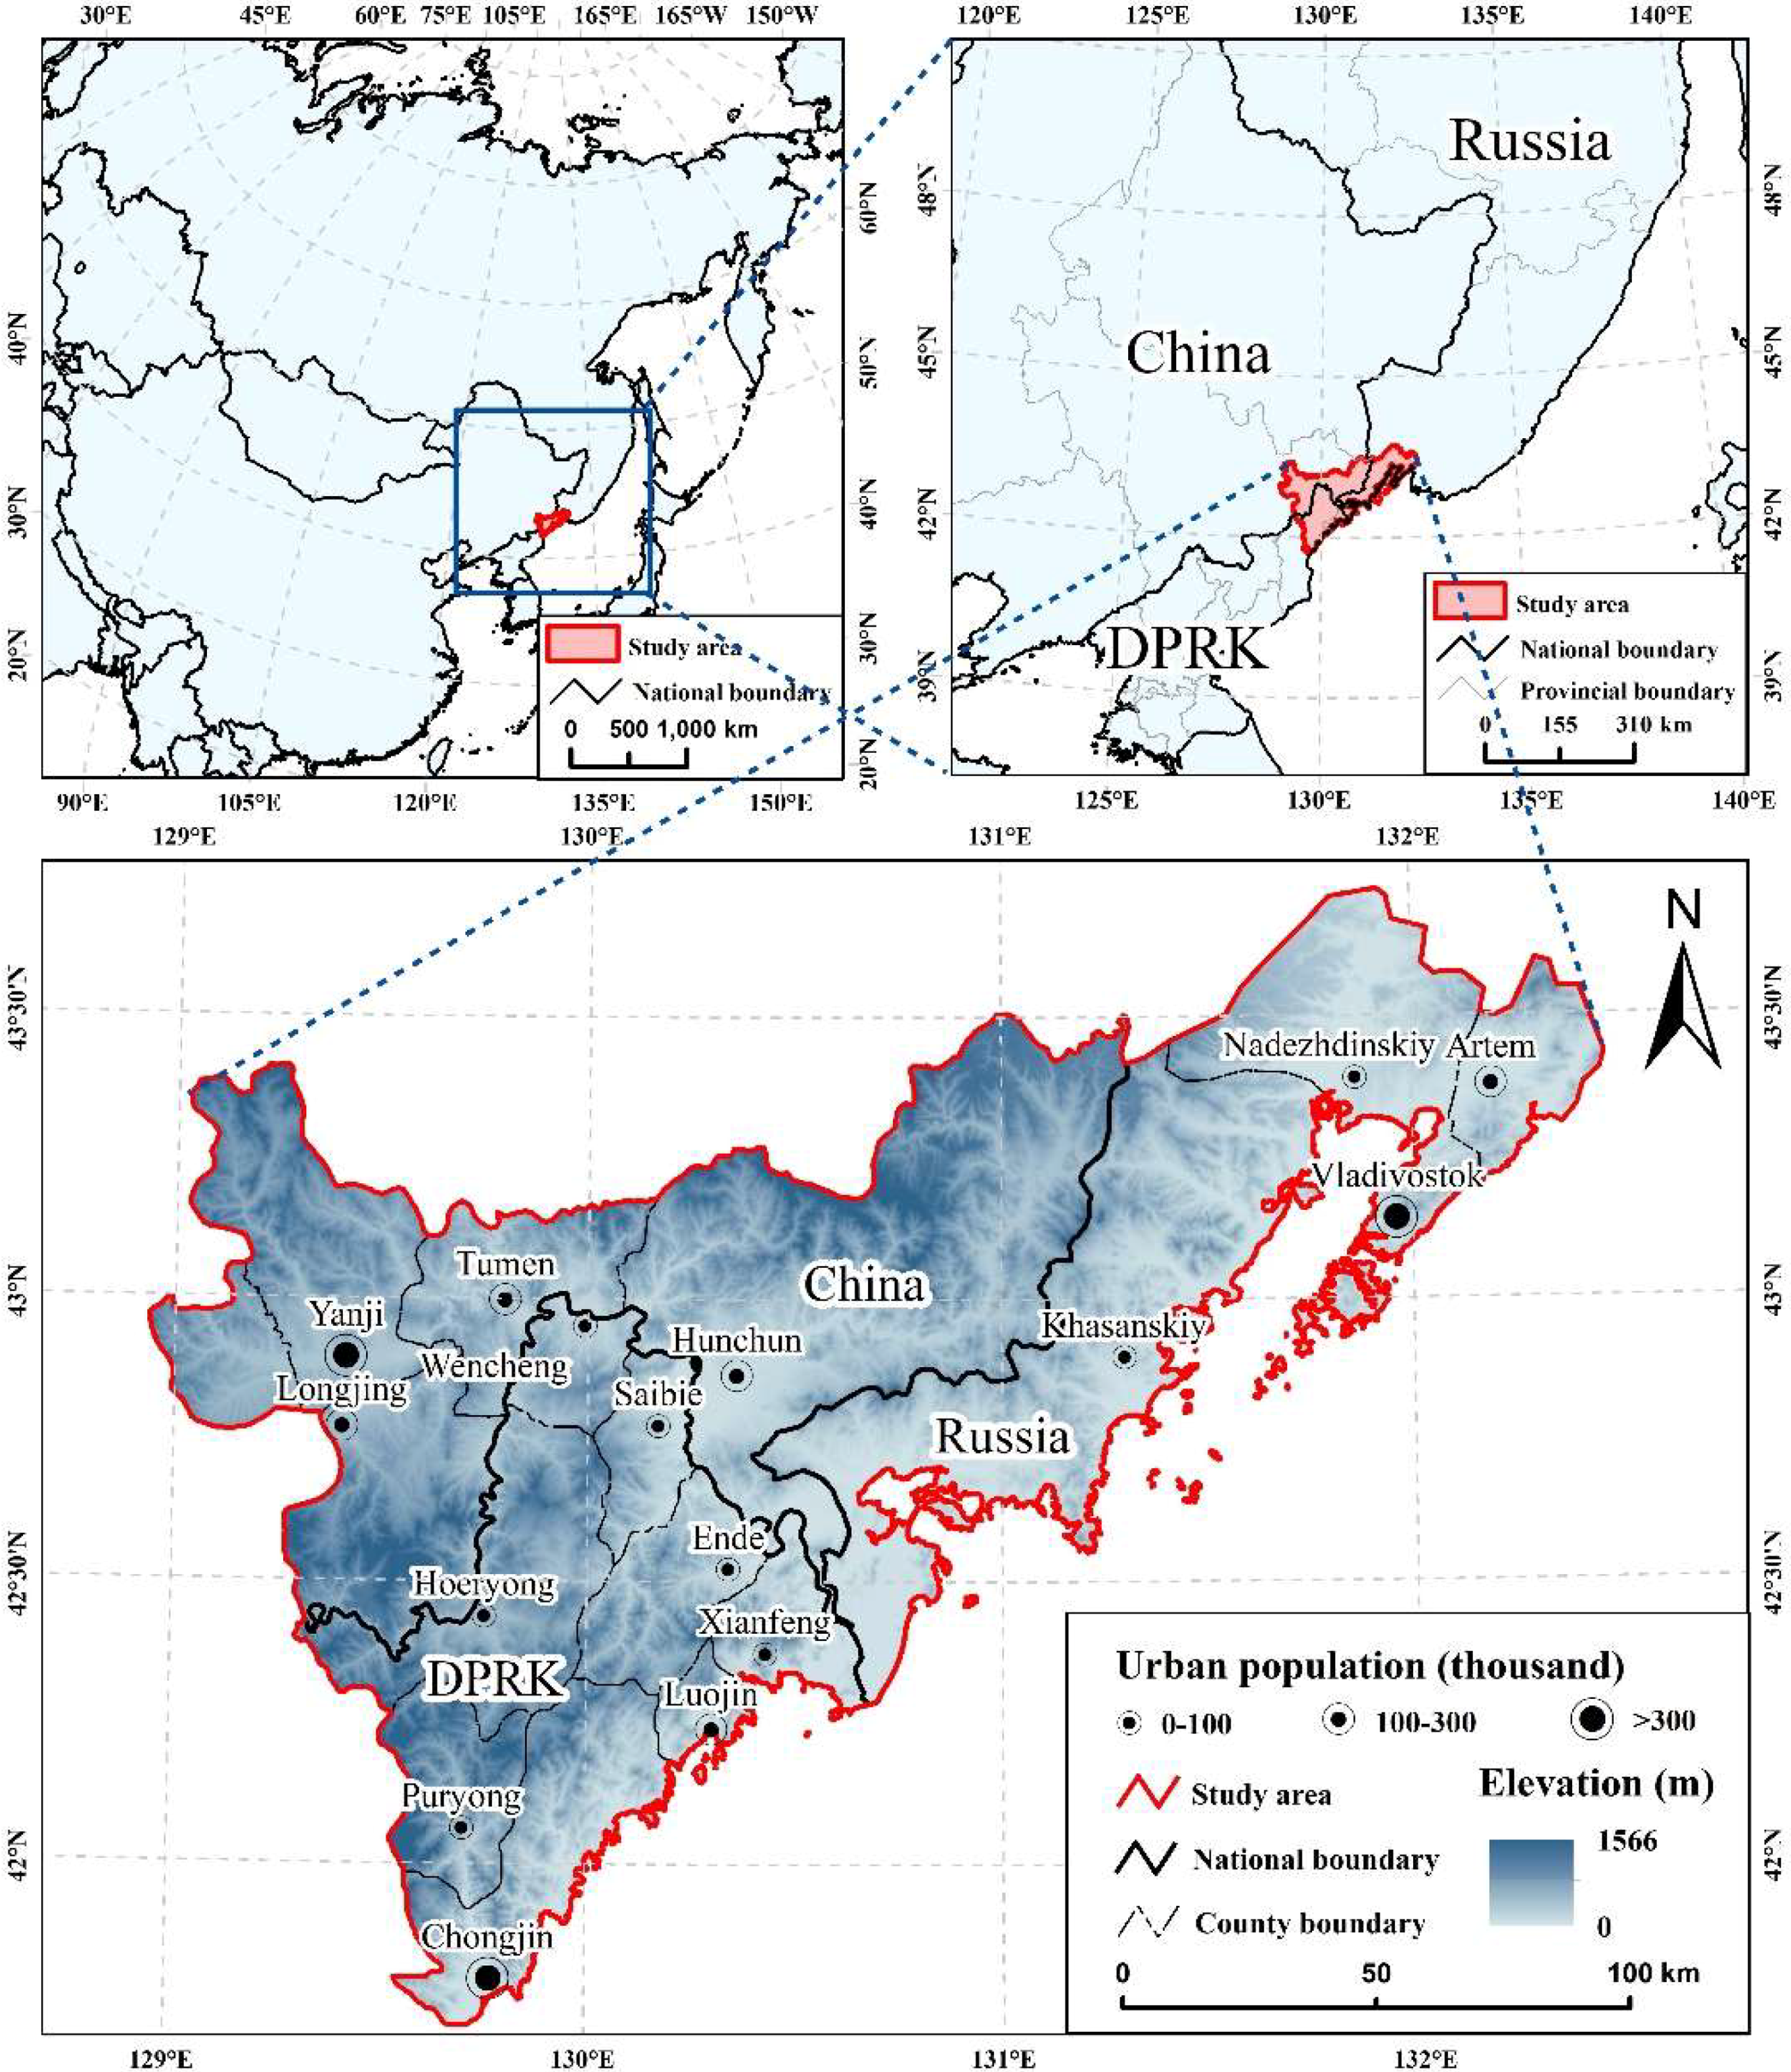
2.1. Overview of the Study Area
2.2. Data
3. Methodologies
4. Results
4.1. Spatial Pattern of UHII in 2016
4.2. Spatial Pattern of UHII in Chinese, DPRK and Russian Regions in 2016
4.3. Factors Affecting UHII
5. Discussions
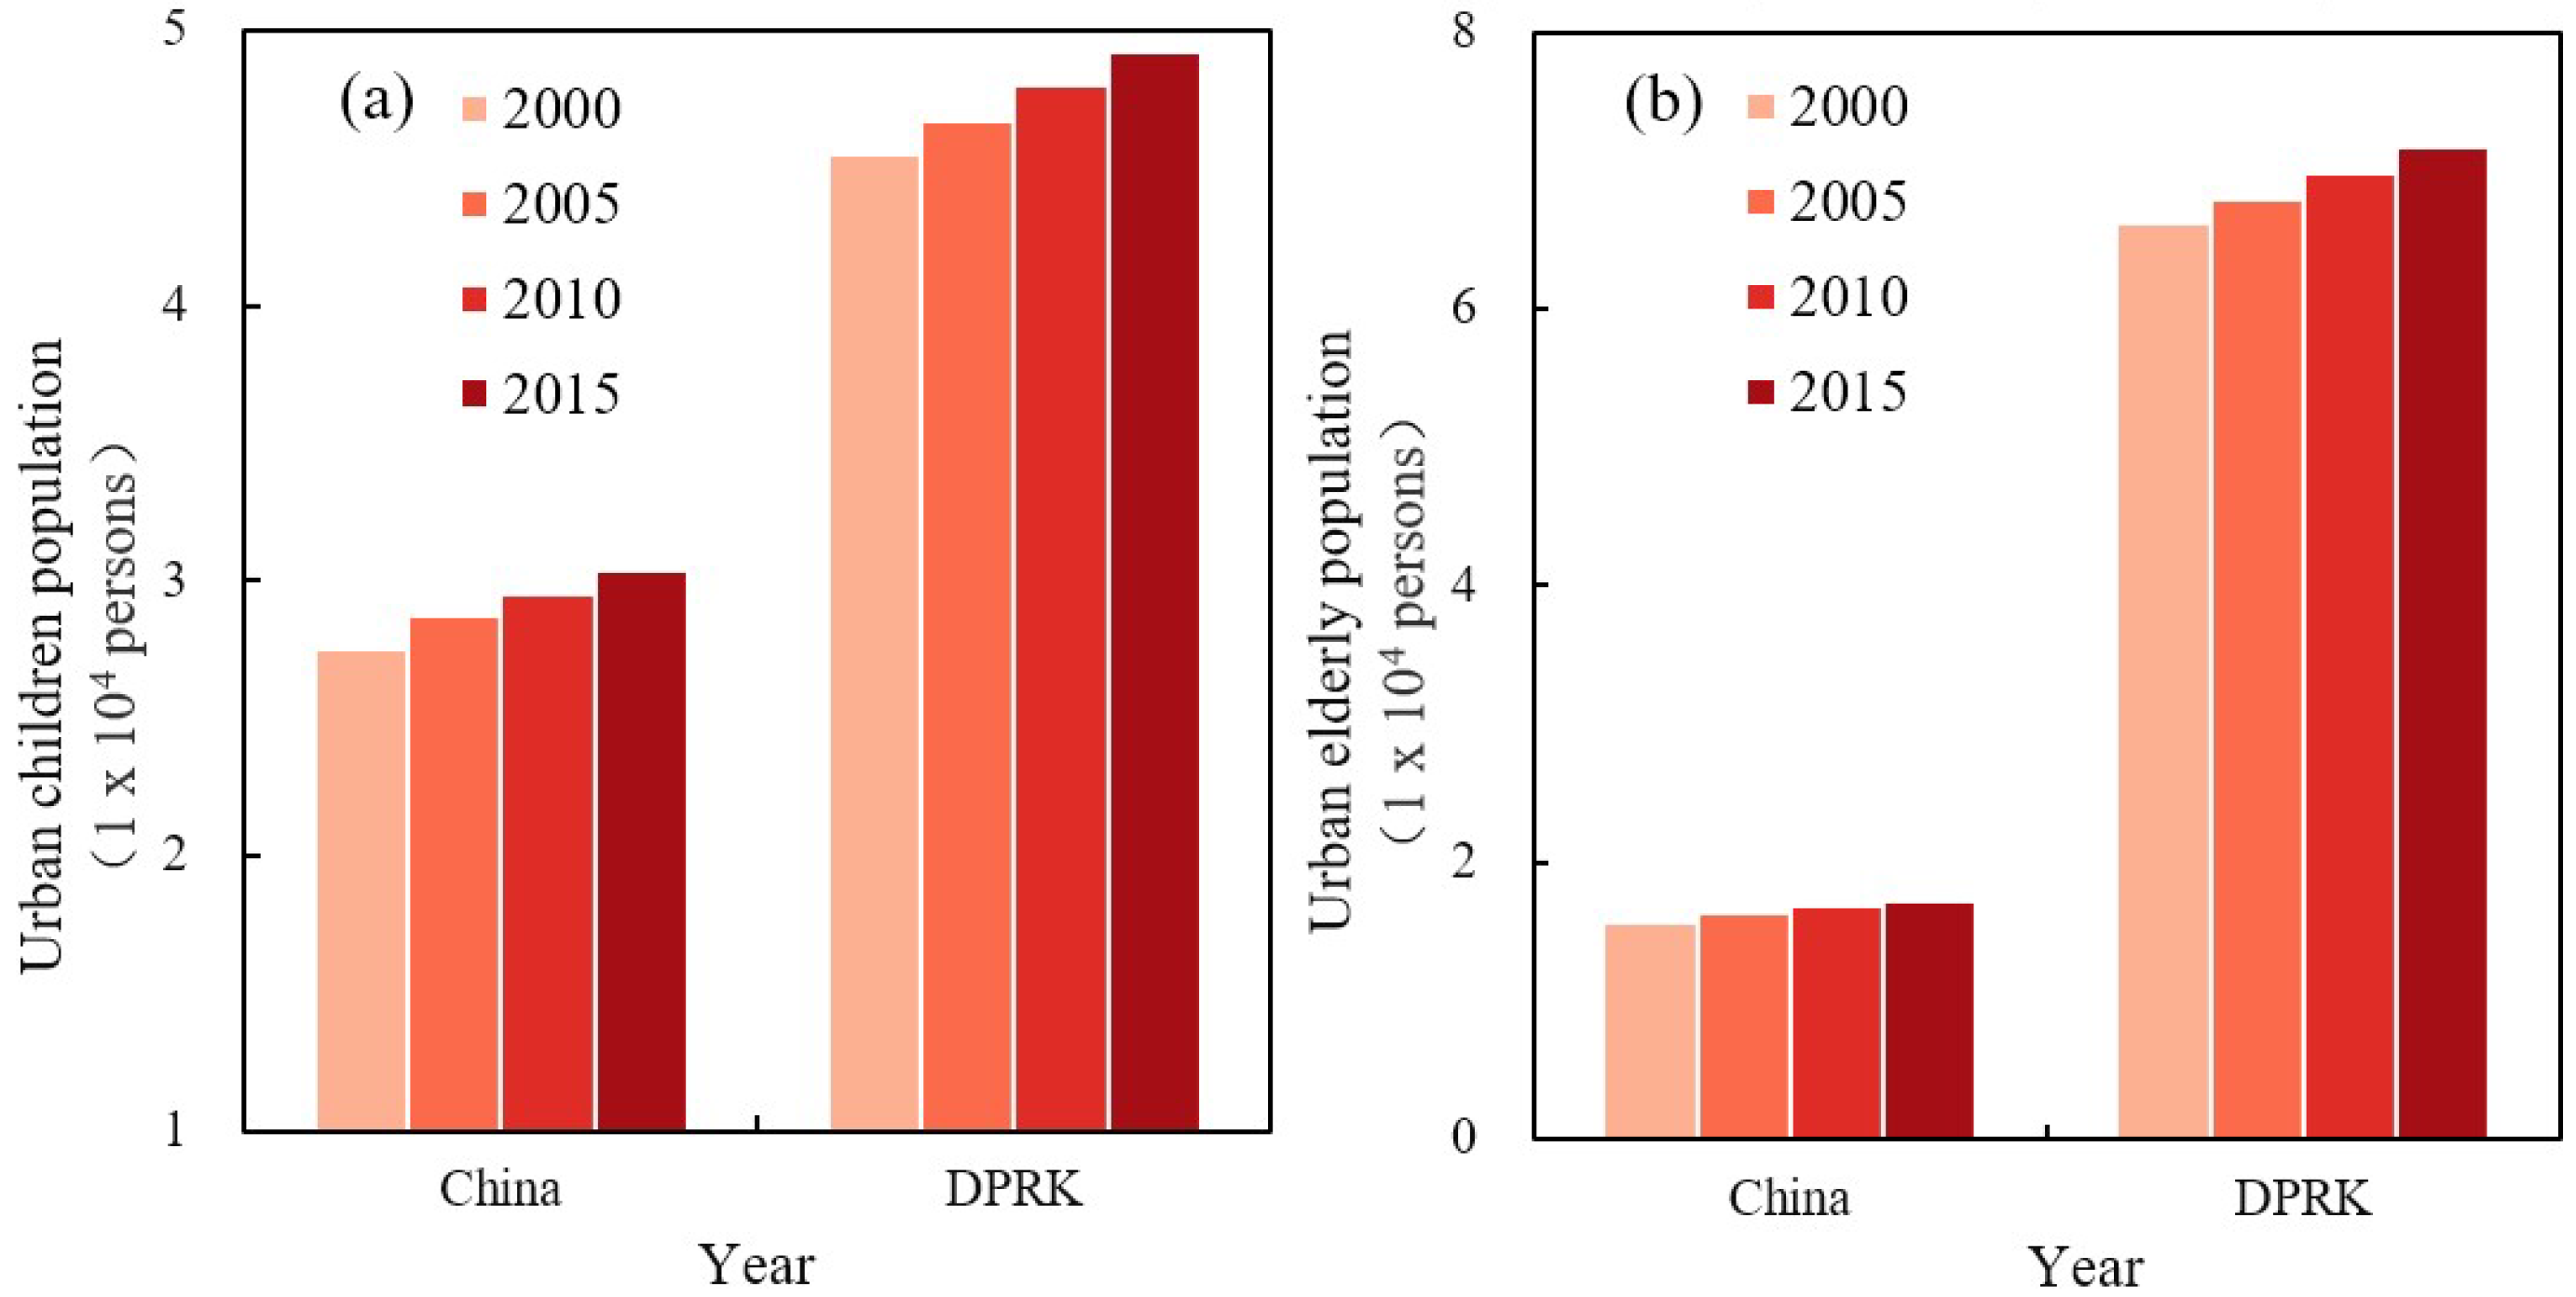
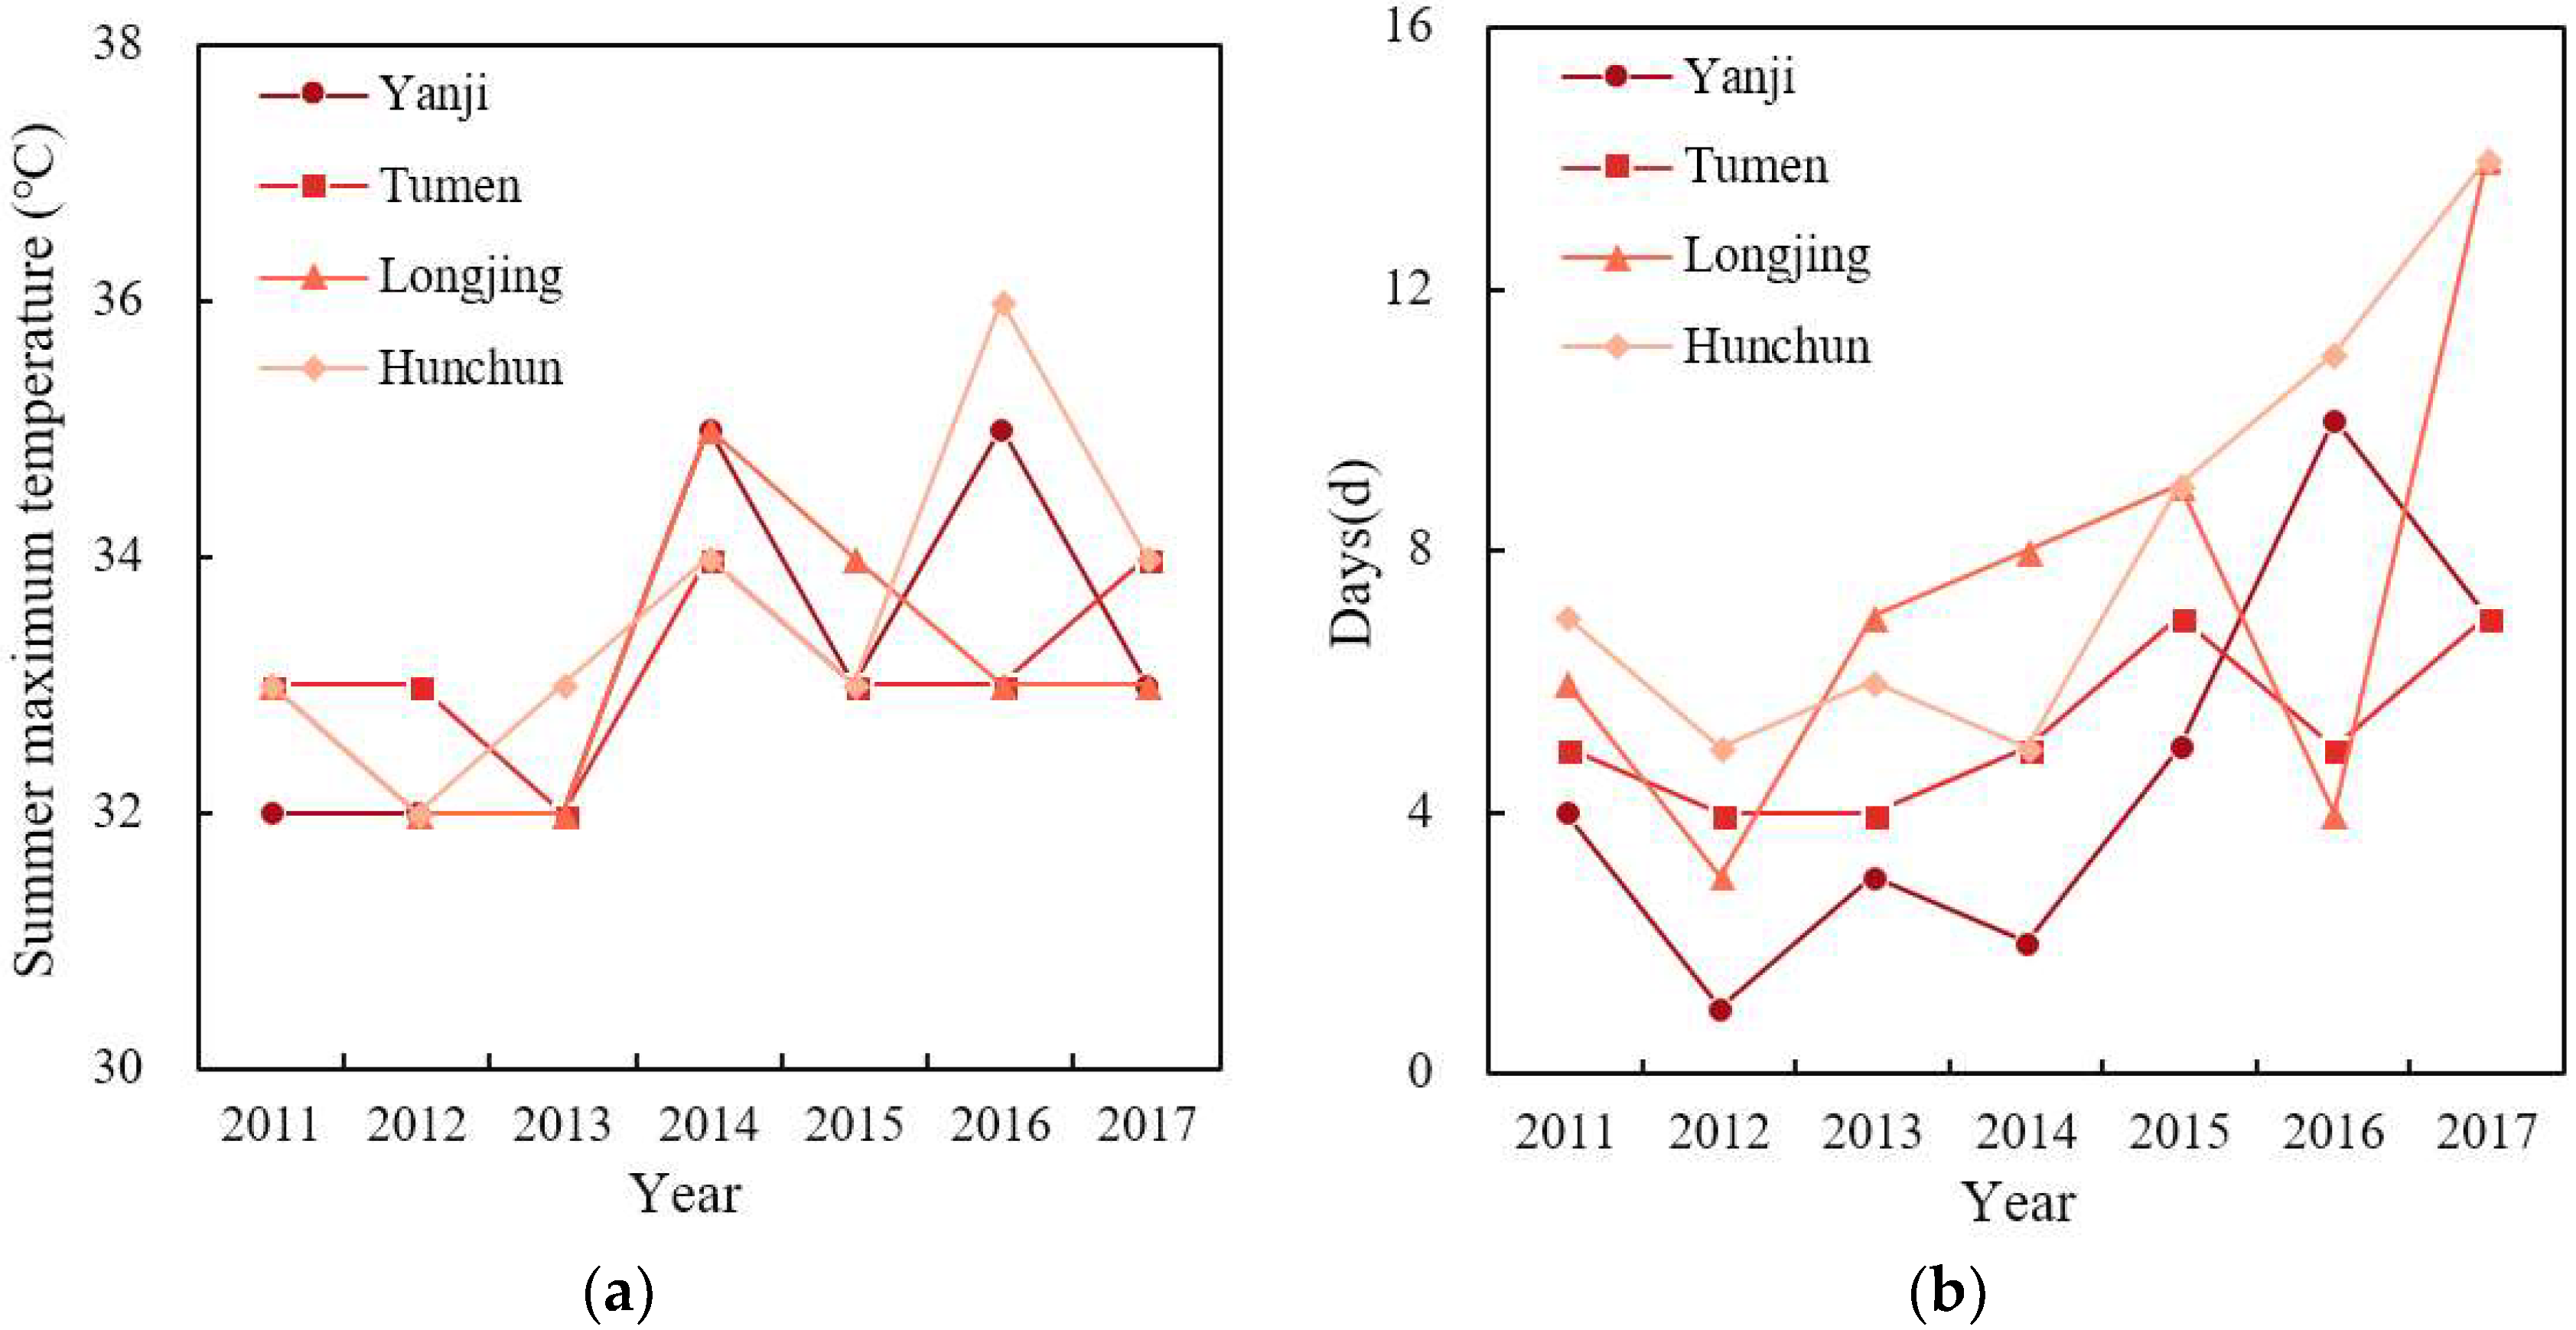
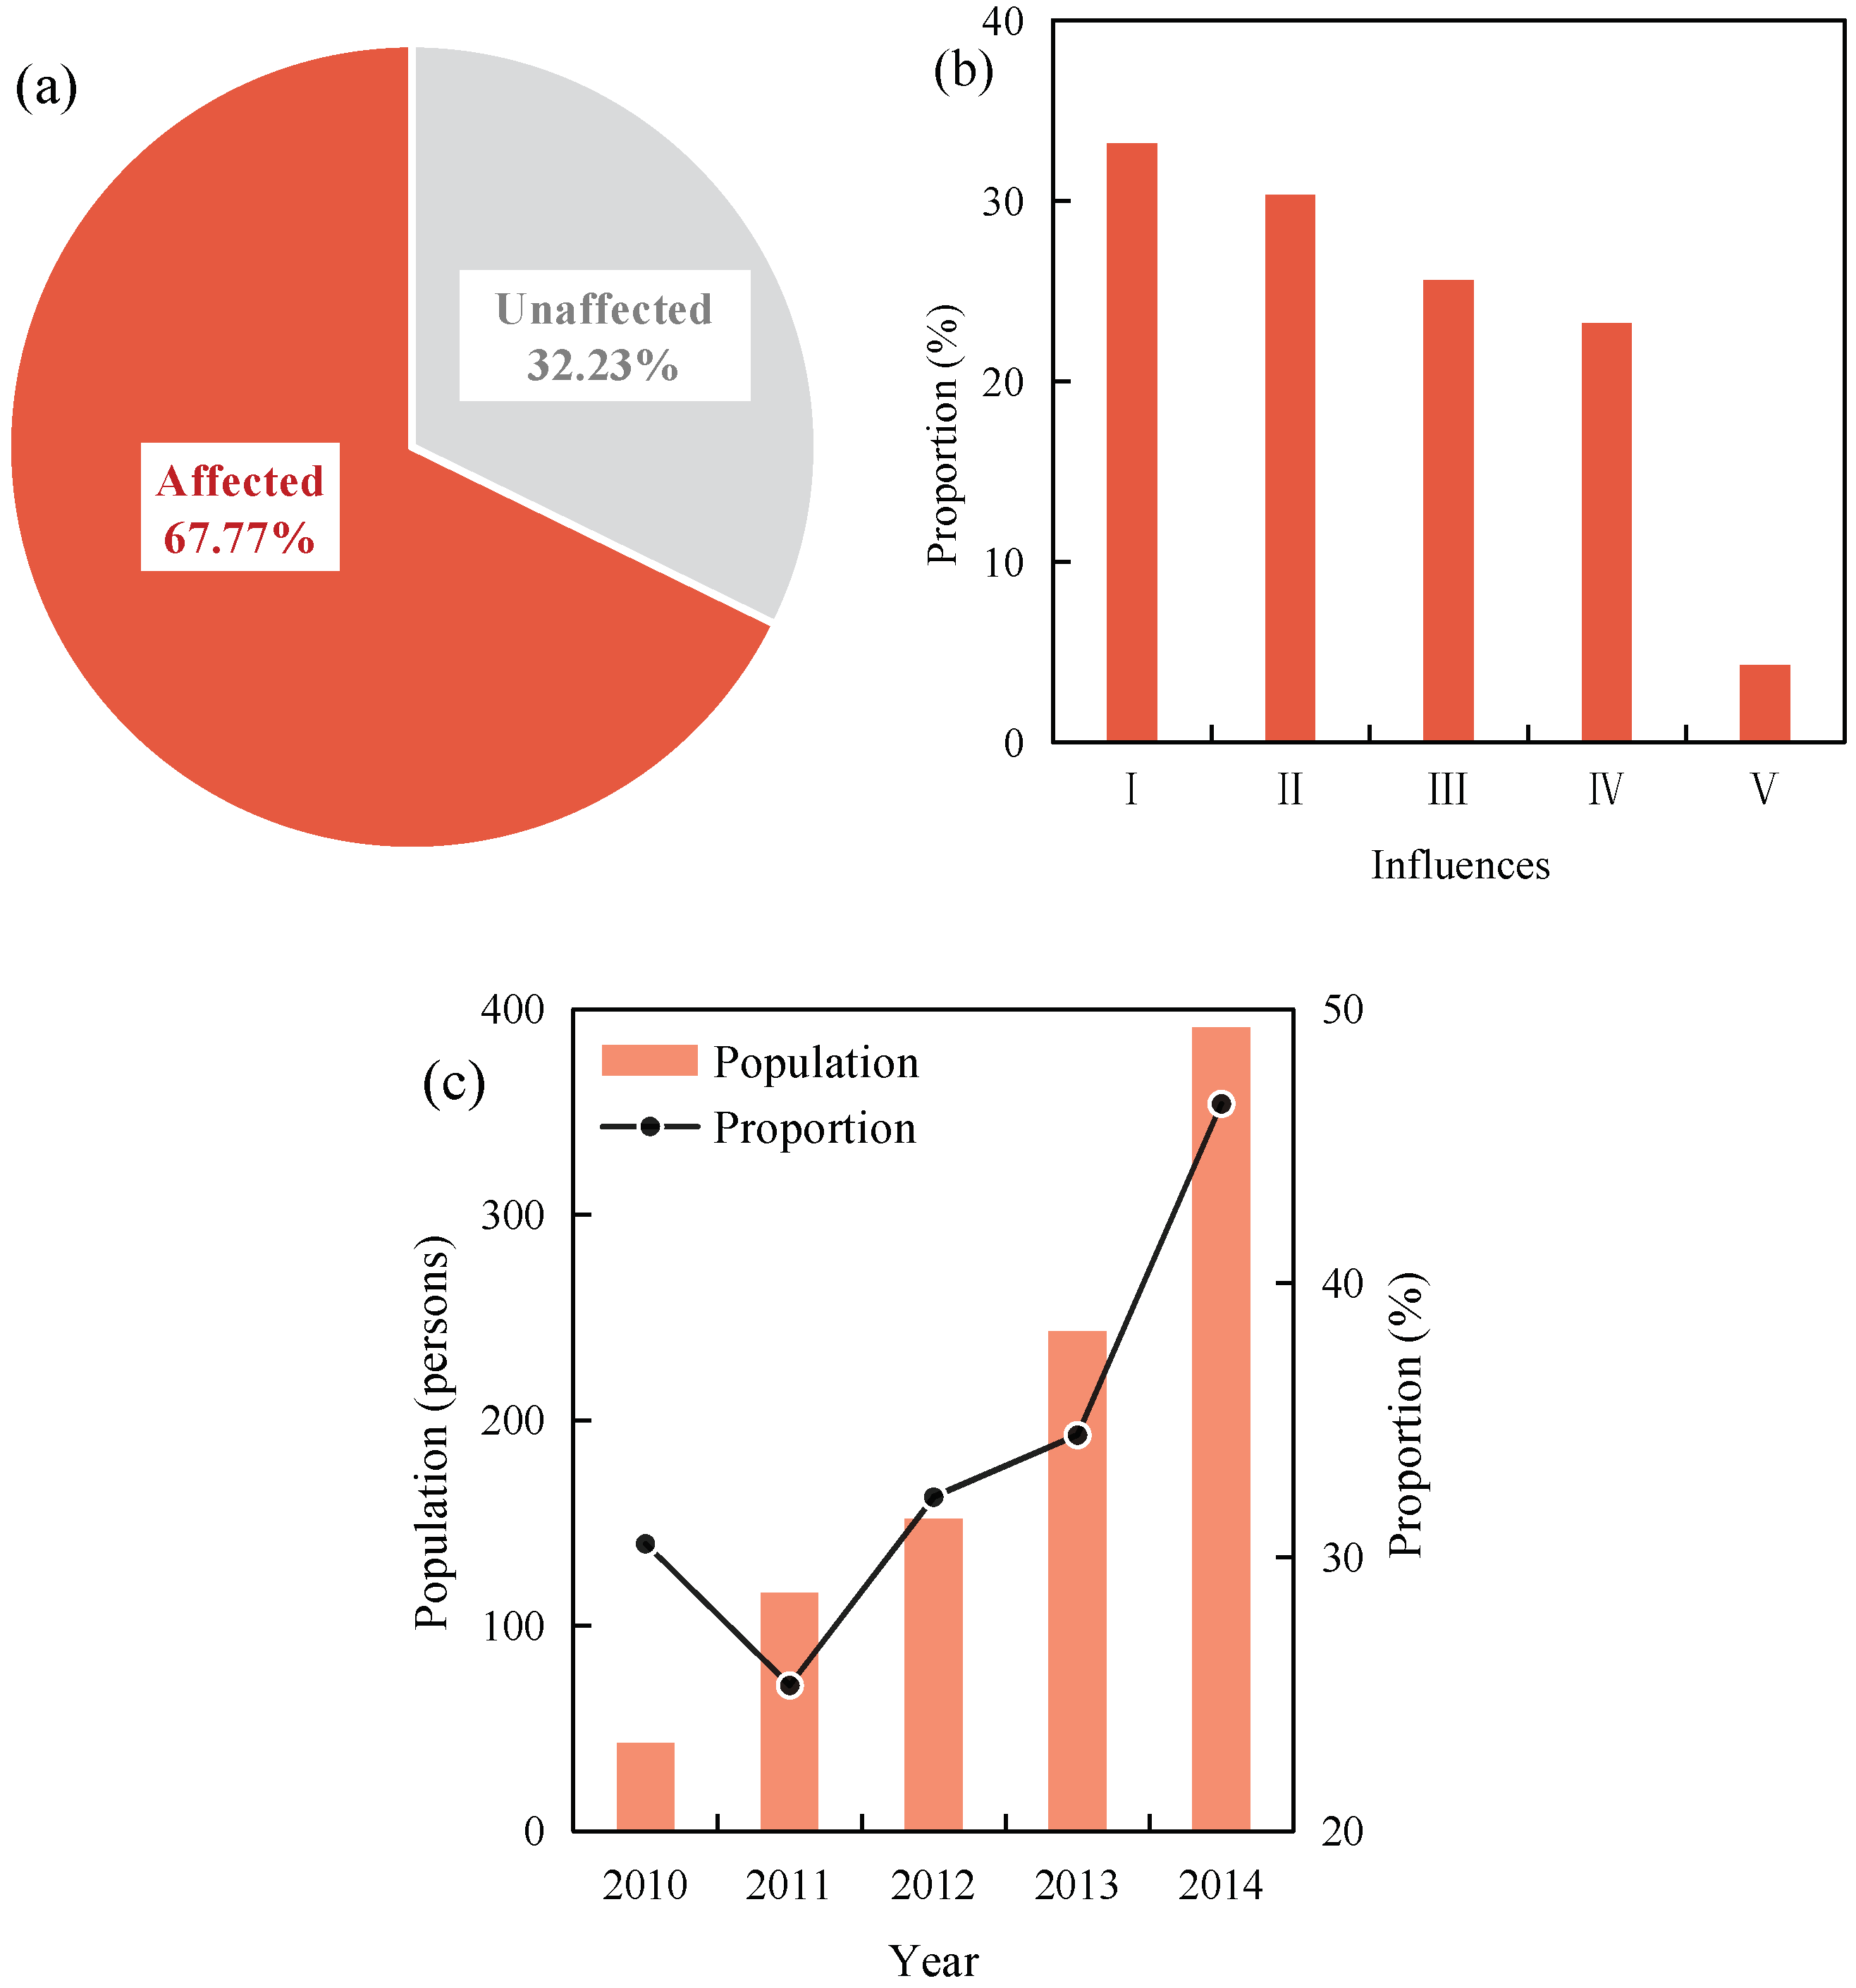
5.1. Impact of Urban Heat Island Effects on Residents’ Health
5.2. Future Perspectives
6. Conclusions
Author Contributions
Funding
Acknowledgments
Conflicts of Interest
Appendix A
| Text A1. The extraction of urban land. |


| Satellite | Sensor | Path/Row | Date |
|---|---|---|---|
| Landsat 8 | OLI | 114/30 | 12 October 2016 |
| 114/31 | 12 October 2016 | ||
| 115/30 | 28 May 2016 | ||
| 115/31 | 28 May 2016 |
| Region | City | Urban Pixels * | Rural Pixels * |
|---|---|---|---|
| China | Yanji | 91,698 | 454,056 |
| Longjing | 19,281 | 416,903 | |
| Tumen | 15,901 | 292,133 | |
| Hunchun | 44,600 | 530,119 | |
| Russia | Artem | 35,466 | 450,528 |
| Nadezhdinskiy | 12,297 | 350,451 | |
| Vladivostok | 75,401 | 281,511 | |
| Khasanskiy | 6648 | 255,153 | |
| DPRK | Chongjin | 37,334 | 198,724 |
| Puryong | 1174 | 64,693 | |
| Luojin | 12,007 | 120,927 | |
| Ende | 4555 | 136,380 | |
| Hoeryong | 3866 | 96,158 | |
| Saibie | 2673 | 139,296 | |
| Xianfeng | 3506 | 90,023 | |
| Wencheng | 4225 | 148,747 |
| Variables | Day | Night | ||||||
|---|---|---|---|---|---|---|---|---|
| Spring | Summer | Autumn | Winter | Spring | Summer | Autumn | ||
| Day | Summer | 0.67 ** | ||||||
| Autumn | 0.61 ** | 0.91 ** | ||||||
| Winter | 0.03 | −0.01 | −0.05 | |||||
| Night | Spring | −0.34 | 0.14 | 0.14 | 0.46 * | |||
| Summer | −0.22 | 0.25 | 0.18 | 0.40 | 0.82 ** | |||
| Autumn | −0.36 | 0.14 | 0.15 | 0.38 | 0.92 ** | 0.69 ** | ||
| Winter | −0.33 | −0.02 | 0.09 | 0.38 | 0.79 ** | 0.60 ** | 0.88 ** | |
| Variables | ∆NDVI | ∆WSA | DEM | Distance from the Ocean | Urban Land Area | Urban Population | Urban Population Density | Urban Nighttime Light Intensity | |
|---|---|---|---|---|---|---|---|---|---|
| Day | Spring | −0.45 * | 0.32 | 0.30 | 0.06 | 0.28 | 0.28 | −0.15 | 0.30 |
| Summer | −0.66 ** | 0.24 | 0.12 | 0.08 | 0.80 ** | 0.84 ** | −0.11 | 0.67 ** | |
| Autumn | −0.50 * | 0.10 | 0.22 | 0.13 | 0.70 ** | 0.72 ** | −0.12 | 0.53 * | |
| Winter | −0.01 | 0.07 | 0.07 | −0.18 | 0.08 | −0.03 | 0.02 | 0.36 | |
| Annual | −0.55 * | 0.20 | 0.18 | 0.06 | 0.63 ** | 0.63 ** | −0.20 | 0.55 * | |
| Night | Spring | −0.13 | 0.06 | −0.14 | −0.19 | 0.31 | 0.27 | −0.01 | 0.41 |
| Summer | −0.70 ** | 0.60 ** | −0.12 | −0.08 | 0.28 | 0.35 | 0.10 | 0.34 | |
| Autumn | −0.44 | 0.21 | −0.37 | −0.44 | 0.29 | 0.29 | 0.01 | 0.33 | |
| Winter | 0.13 | 0.03 | −0.34 | −0.44 | 0.04 | 0.03 | 0.01 | 0.06 | |
| Annual | −0.30 | 0.15 | −0.14 | −0.26 | 0.20 | 0.21 | 0.07 | 0.30 | |
References
- Oke, T.R. The energetic basis of the urban heat island. Q. J. R. Meteorol. Soc. 1982, 108, 1–24. [Google Scholar] [CrossRef]
- Streutker, D.R. Satellite-measured growth of the urban heat island of Houston, Texas. Remote Sens. Environ. 2003, 85, 282–289. [Google Scholar] [CrossRef]
- Wu, J. Urban sustainability: An inevitable goal of landscape research. Landsc. Ecol. 2010, 25, 1–4. [Google Scholar] [CrossRef]
- Huang, W.; Li, J.; Guo, Q.; Mansaray, L.; Li, X.; Huang, J. A Satellite-Derived Climatological Analysis of Urban Heat Island over Shanghai during 2000–2013. Remote Sens. 2017, 9, 641. [Google Scholar] [CrossRef]
- Kim, S.O. National Center for Agro-Meteorology, Seoul National University, Seoul, Republic of Korea, Mapping Monthly Temperature Normals Across North Korea at a Landscape Scale. Korean J. Agric. For. Meteorol. 2011, 13. [Google Scholar] [CrossRef]
- Unger, J. Intra-urban relationship between surface geometry and urban heat island: Review and new approach. Clim. Res. 2004, 27, 253–264. [Google Scholar] [CrossRef]
- Clinton, N.; Gong, P. MODIS detected surface urban heat islands and sinks: Global locations and controls. Remote Sens. Environ. 2013, 134, 294–304. [Google Scholar] [CrossRef]
- Grimm, N.B.; Faeth, S.H.; Golubiewski, N.E.; Redman, C.L.; Wu, J.; Bai, X.; Briggs, J.M. Global change and the ecology of cities. Science 2008, 319, 756–760. [Google Scholar] [CrossRef] [PubMed]
- Zheng, X.J.; Sun, P.; Zhu, W.H.; Xu, Z.; Fu, J.; Man, W.D.; Li, H.L.; Zhang, J.; Qin, L. Landscape dynamics and driving forces of wetlands in the Tumen River Basin of China over the past 50 years. Landsc. Ecol. Eng. 2017, 13, 1–14. [Google Scholar] [CrossRef]
- Shi, B.; Gao, L.; Liu, C.; Wang, B.J. Observation and analysis of the urban heat island effect on soil in Nanjing, China. Environ. Earth Sci. 2012, 67, 215–229. [Google Scholar] [CrossRef]
- Krehbiel, C.P.; Zhang, X.; Henebry, G.M. Impacts of thermal time on land surface phenology in urban areas. Remote Sens. 2017, 9, 499. [Google Scholar] [CrossRef]
- Krehbiel, C.P.; Jackson, T.; Henebry, G.M. Web-Enabled Landsat Data time series for monitoring urban heat island impacts on land surface phenology. IEEE J. Sel. Top. Appl. Earth Obs. Remote Sens. 2016, 9, 2043–2050. [Google Scholar] [CrossRef]
- Knapp, S. Changes in the Functional Composition of a Central European Urban Flora over Three Centuries. Perspectives in Plant Ecology. Evol. Syst. 2010, 12, 235–244. [Google Scholar]
- Kuznetsova, I.N.; Nakhaev, M.I.; Shalygina, I.Y.; Lezina, E.A. Meteorological prerequisites of formation of severe winter time air pollution episodes in Moscow. Russ. Meteorol. Hydrol. 2008, 33, 167–174. [Google Scholar] [CrossRef]
- Ginzburg, A.S.; Vinogradova, A.A.; Fedorova, E.I.; Nikitich, E.V.; Karpov, A.V. Content of oxygen in the atmosphere over large cities and respiratory problems. Izv. Atmos. Ocean. Phys. 2014, 50, 782–792. [Google Scholar] [CrossRef]
- Wong, K.V.; Paddon, A.; Jimenez, A. Review of world urban heat islands: Many linked to increased mortality. J. Energy Resour. Technol. 2013, 135, 82–90. [Google Scholar] [CrossRef]
- Fang, C. The Strategy and Pattern of International Economic Cooperation in Tumen River Area of China under the Background of “the Belt and Road”. Northeast Asia Econ. Res. 2017, 1, 5–14. [Google Scholar]
- Lim, S.W.; Suthiwartnarueput, K.; Abareshi, A.; Lee, T.W.; Duval, Y. Key Factors in Developing Transit Trade Corridors in Northeast Asia. J. Korea Trade 2017, 21. [Google Scholar] [CrossRef]
- Lee, N.J. Northeast Asian Economic Cooperation and the Korean Peninsula Economy: The Impact of the Changjitu Development Plan. Korea J. 2011, 51, 130–163. [Google Scholar]
- Mikhailov, R.V. Russian Mission in Asia. “Berdyaev Readings” in Vladivostok. Polis. Political Stud. 2015, 23–28. [Google Scholar] [CrossRef]
- Gao, F.; Dai, X.; Li, B. Possible driving factors of urbanization and urban heat island in Northeast Plain of China. Clim. Environ. Res. 2012, 17, 353–364. [Google Scholar]
- Holmer, B.; Eliasson, I. Urban-rural vapour pressure differences and their role in the development of urban heat islands. Int. J. Climatol. 2015, 19, 989–1009. [Google Scholar] [CrossRef]
- Jan, E.; David, F.; Ulf, B.; Anne, V.; Rashitm, H.; Alexanderv, K. Trends and uncertainties in Siberian indicators of 20th century warming. Glob. Chang. Biol. 2010, 16, 386–398. [Google Scholar]
- Zhang, Y.; Bai, Z.; Liu, W. Assessing the surface urban heat island effect in Xining, China. In Geo-Informatics in Resource Management and Sustainable Ecosystem; Springer: Berlin/Heidelberg, Germany, 2013; pp. 264–273. [Google Scholar]
- Hu, L.; Brunsell, N.A. The impact of temporal aggregation of land surface temperature data for surface urban heat island (SUHI) monitoring. Remote Sens. Environ. 2013, 134, 162–174. [Google Scholar] [CrossRef]
- Liu, W.; Feddema, J.; Hu, L.; Zung, A.; Brunsell, N. Seasonal and Diurnal Characteristics of Land Surface Temperature and Major Explanatory Factors in Harris County, Texas. Sustainability 2017, 9, 2324. [Google Scholar] [CrossRef]
- Krehbiel, C.P.; Henebry, G.M. A comparison of multiple datasets for monitoring thermal time in urban areas over the U.S. Upper Midwest. Remote Sens. 2016, 8, 297. [Google Scholar] [CrossRef]
- Zhao, L.; Lee, X.; Smith, R.; Oleson, K. Strong contributions of local background climate to urban heat islands. Nature 2014, 511, 216–219. [Google Scholar] [CrossRef] [PubMed]
- Wan, Z. New refinements and validation of the MODIS land-surface temperature/emissivity products. Remote Sens. Environ. 2008, 112, 59–74. [Google Scholar] [CrossRef]
- Wan, Z. New refinements and validation of the collection-6 MODIS land-surface temperature/emissivity product. Remote Sens. Environ. 2014, 140, 36–45. [Google Scholar] [CrossRef]
- Peng, S.; Piao, S.; Ciais, P.; Friedlingstein, P.; Ottle, C.; Bréon, F.M.; Nan, H.; Zhou, L.; Myneni, R.B. Surface urban heat island across 419 global big cities. Environ. Sci. Technol. 2012, 46, 696–703. [Google Scholar] [CrossRef] [PubMed]
- Meng, Q.; Zhang, L.; Sun, Z.; Meng, F.; Wang, L.; Sun, Y. Characterizing spatial and temporal trends of surface urban heat island effect in an urban main built-up area: A 12-year case study in Beijing, China. Remote Sens. Environ. 2018, 204, 826–837. [Google Scholar] [CrossRef]
- Miles, V.; Esau, I. Seasonal and Spatial Characteristics of Urban Heat Islands (UHIs) in Northern West Siberian Cities. Remote Sens. 2017, 9, 989. [Google Scholar] [CrossRef]
- Gao, W.; Zhu, C.; Wang, Y. Analysis on Characteristic of Hydrology and Meteorology for Tumenjiang Basin. Jilin Water Resour. 2000, 12, 22–24. [Google Scholar]
- Wan, Z. Collection-5 MODIS Land Surface Temperature Products Users’ Guide; ICESS, University of California: Santa Barbara, CA, USA, 2007. [Google Scholar]
- Tao, H.; Nan, Y.; Liu, Z.F. Spatiotemporal Patterns of Forest in the Transnational Area of Changbai Mountain from 1977 to 2015: A Comparative Analysis of the Chinese and DPRK Sub-Regions. Sustainability 2017, 9, 1054. [Google Scholar] [CrossRef]
- Liu, Z.; He, C.; Zhou, Y.; Wu, J. How much of the world’s land has been urbanized, really? A hierarchical framework for avoiding confusion. Landsc. Ecol. 2014, 29, 763–771. [Google Scholar] [CrossRef]
- Zhou, D.; Zhang, L.; Hao, L.; Sun, G.; Liu, Y.; Zhu, C. Spatiotemporal trends of urban heat island effect along the urban development intensity gradient in China. Sci. Total Environ. 2016, 544, 617–626. [Google Scholar] [CrossRef] [PubMed]
- Zhou, D.; Zhao, S.; Liu, S.; Zhang, L.; Zhu, C. Surface urban heat island in China’s 32 major cities: Spatial patterns and drivers. Remote Sens. Environ. 2014, 152, 51–61. [Google Scholar] [CrossRef]
- Zipper, S.C.; Schatz, J.; Singh, A.; Kucharik, C.J.; Townsend, P.A.; Loheide, S.P., II. Urban heat island impacts on plant phenology: Intra-urban variability and response to land cover. Environ. Res. Lett. 2016, 11. [Google Scholar] [CrossRef]
- Jenerette, G.D.; Harlan, S.L.; Brazel, A.; Jones, N.; Larsen, L.; Stefanov, W.L. Regional relationships between surface temperature, vegetation, and human settlement in a rapidly urbanizing ecosystem. Landsc. Ecol. 2007, 22, 353–365. [Google Scholar] [CrossRef]
- Arnfield, A.J. Two decades of urban climate research: A review of turbulence, exchanges of energy and water, and the urban heat island. Int. J. Climatol. 2003, 23, 1–26. [Google Scholar] [CrossRef]
- Zhang, Y.; Odeh, I.O.; Han, C. Bi-temporal characterization of land surface temperature in relation to impervious surface area, NDVI and NDBI, using a sub-pixel image analysis. Int. J. Appl. Earth Obs. Geoinf. 2009, 11, 256–264. [Google Scholar] [CrossRef]
- Imhoff, M.L.; Zhang, P.; Wolfe, R.E.; Bounoua, L. Remote sensing of the urban heat island effect across biomes in the continental USA. Remote Sens. Environ. 2010, 114, 504–513. [Google Scholar] [CrossRef] [Green Version]
- Kuang, W.; Liu, Y.; Dou, Y.; Chi, W.; Chen, G.; Gao, C.; Yang, T.; Liu, J.; Zhang, R. What are hot and what are not in an urban landscape: Quantifying and explaining the land surface temperature pattern in Beijing, China. Landsc. Ecol. 2015, 30, 357–373. [Google Scholar] [CrossRef]
- Imhoff, M.L.; Lawrence, W.T.; Elvidge, C.D.; Paul, T.; Levine, E.; Privalsky, M.V. Using nighttime DMSP/OLS images of city lights to estimate the impact of urban land use on soil resources in the United States. Remote Sens. Environ. 1997, 59, 105–117. [Google Scholar] [CrossRef]
- Lo, C.; Quattrochi, D.A. Land-use and land-cover change, urban heat island phenomenon, and health implications: A remote sensing approach. Photogramm. Eng. Remote Sens. 2003, 69, 1053–1063. [Google Scholar] [CrossRef]
- Mannino, D.M.; Homa, D.M.; Pertowski, C.A.; Ashizawa, A.; Nixon, L.L.; Johnson, C.A.; Kang, D.S. Surveillance for asthma—United States, 1960–1995. Morb. Mortal. Wkly. Rep. Surveill. Summ. 1998, 47, 1–27. [Google Scholar]
- Cutter, S.L.; Finch, C. Temporal and spatial changes in social vulnerability to natural hazards. Proc. Natl. Acad. Sci. USA 2008, 105, 2301–2306. [Google Scholar] [CrossRef] [PubMed] [Green Version]
- Claus, R.; Dianne, P.; Kate, B.; Shiraz, N.; Stephanie, G.; Monica, C. The Role of Maps in Neighborhood-level Heat Vulnerability Assessment for the City of Toronto. Am. Cartogr. 2010, 37, 31–44. [Google Scholar]
- Patz, J.A.; Campbell-Lendrum, D.; Holloway, T.; Foley, J.A. Impact of regional climate change on human health. Nature 2005, 438, 310–317. [Google Scholar] [CrossRef] [PubMed]
- Uejio, C.K.; Wilhelmi, O.V.; Golden, J.S.; Mills, D.M.; Gulino, S.P.; Samenow, J.P. Intra-urban societal vulnerability to extreme heat: The role of heat exposure and the built environment, socioeconomics, and neighborhood stability. Health Place 2011, 17, 498–507. [Google Scholar] [CrossRef] [PubMed]
- Johnson, D.P.; Stanforth, A.; Lulla, V.; Luber, G. Developing an applied extreme heat vulnerability index utilizing socioeconomic and environmental data. Appl. Geogr. 2012, 35, 23–31. [Google Scholar] [CrossRef]
- Shiklomanov, N.I.; Streletskiy, D.A.; Swales, T.B.; Kokorev, V.A. Climate Change and Stability of Urban Infrastructure in Russian Permafrost Regions: Prognostic Assessment based on GCM Climate Projections. Geogr. Rev. 2017, 107, 125–142. [Google Scholar] [CrossRef]
- Li, X.; Li, W.; Middel, A.; Harlan, S.L.; Brazel, A.J.; Turner, B.L., II. Remote sensing of the surface urban heat island and land architecture in Phoenix, Arizona: Combined effects of land composition and configuration and cadastral–demographic–economic factors. Remote Sens. Environ. 2016, 174, 233–243. [Google Scholar] [CrossRef] [Green Version]
- Liu, Z.; He, C.; Wu, J. General Spatiotemporal Patterns of Urbanization: An Examination of 16 World Cities. Sustainability 2016, 8, 41. [Google Scholar] [CrossRef]

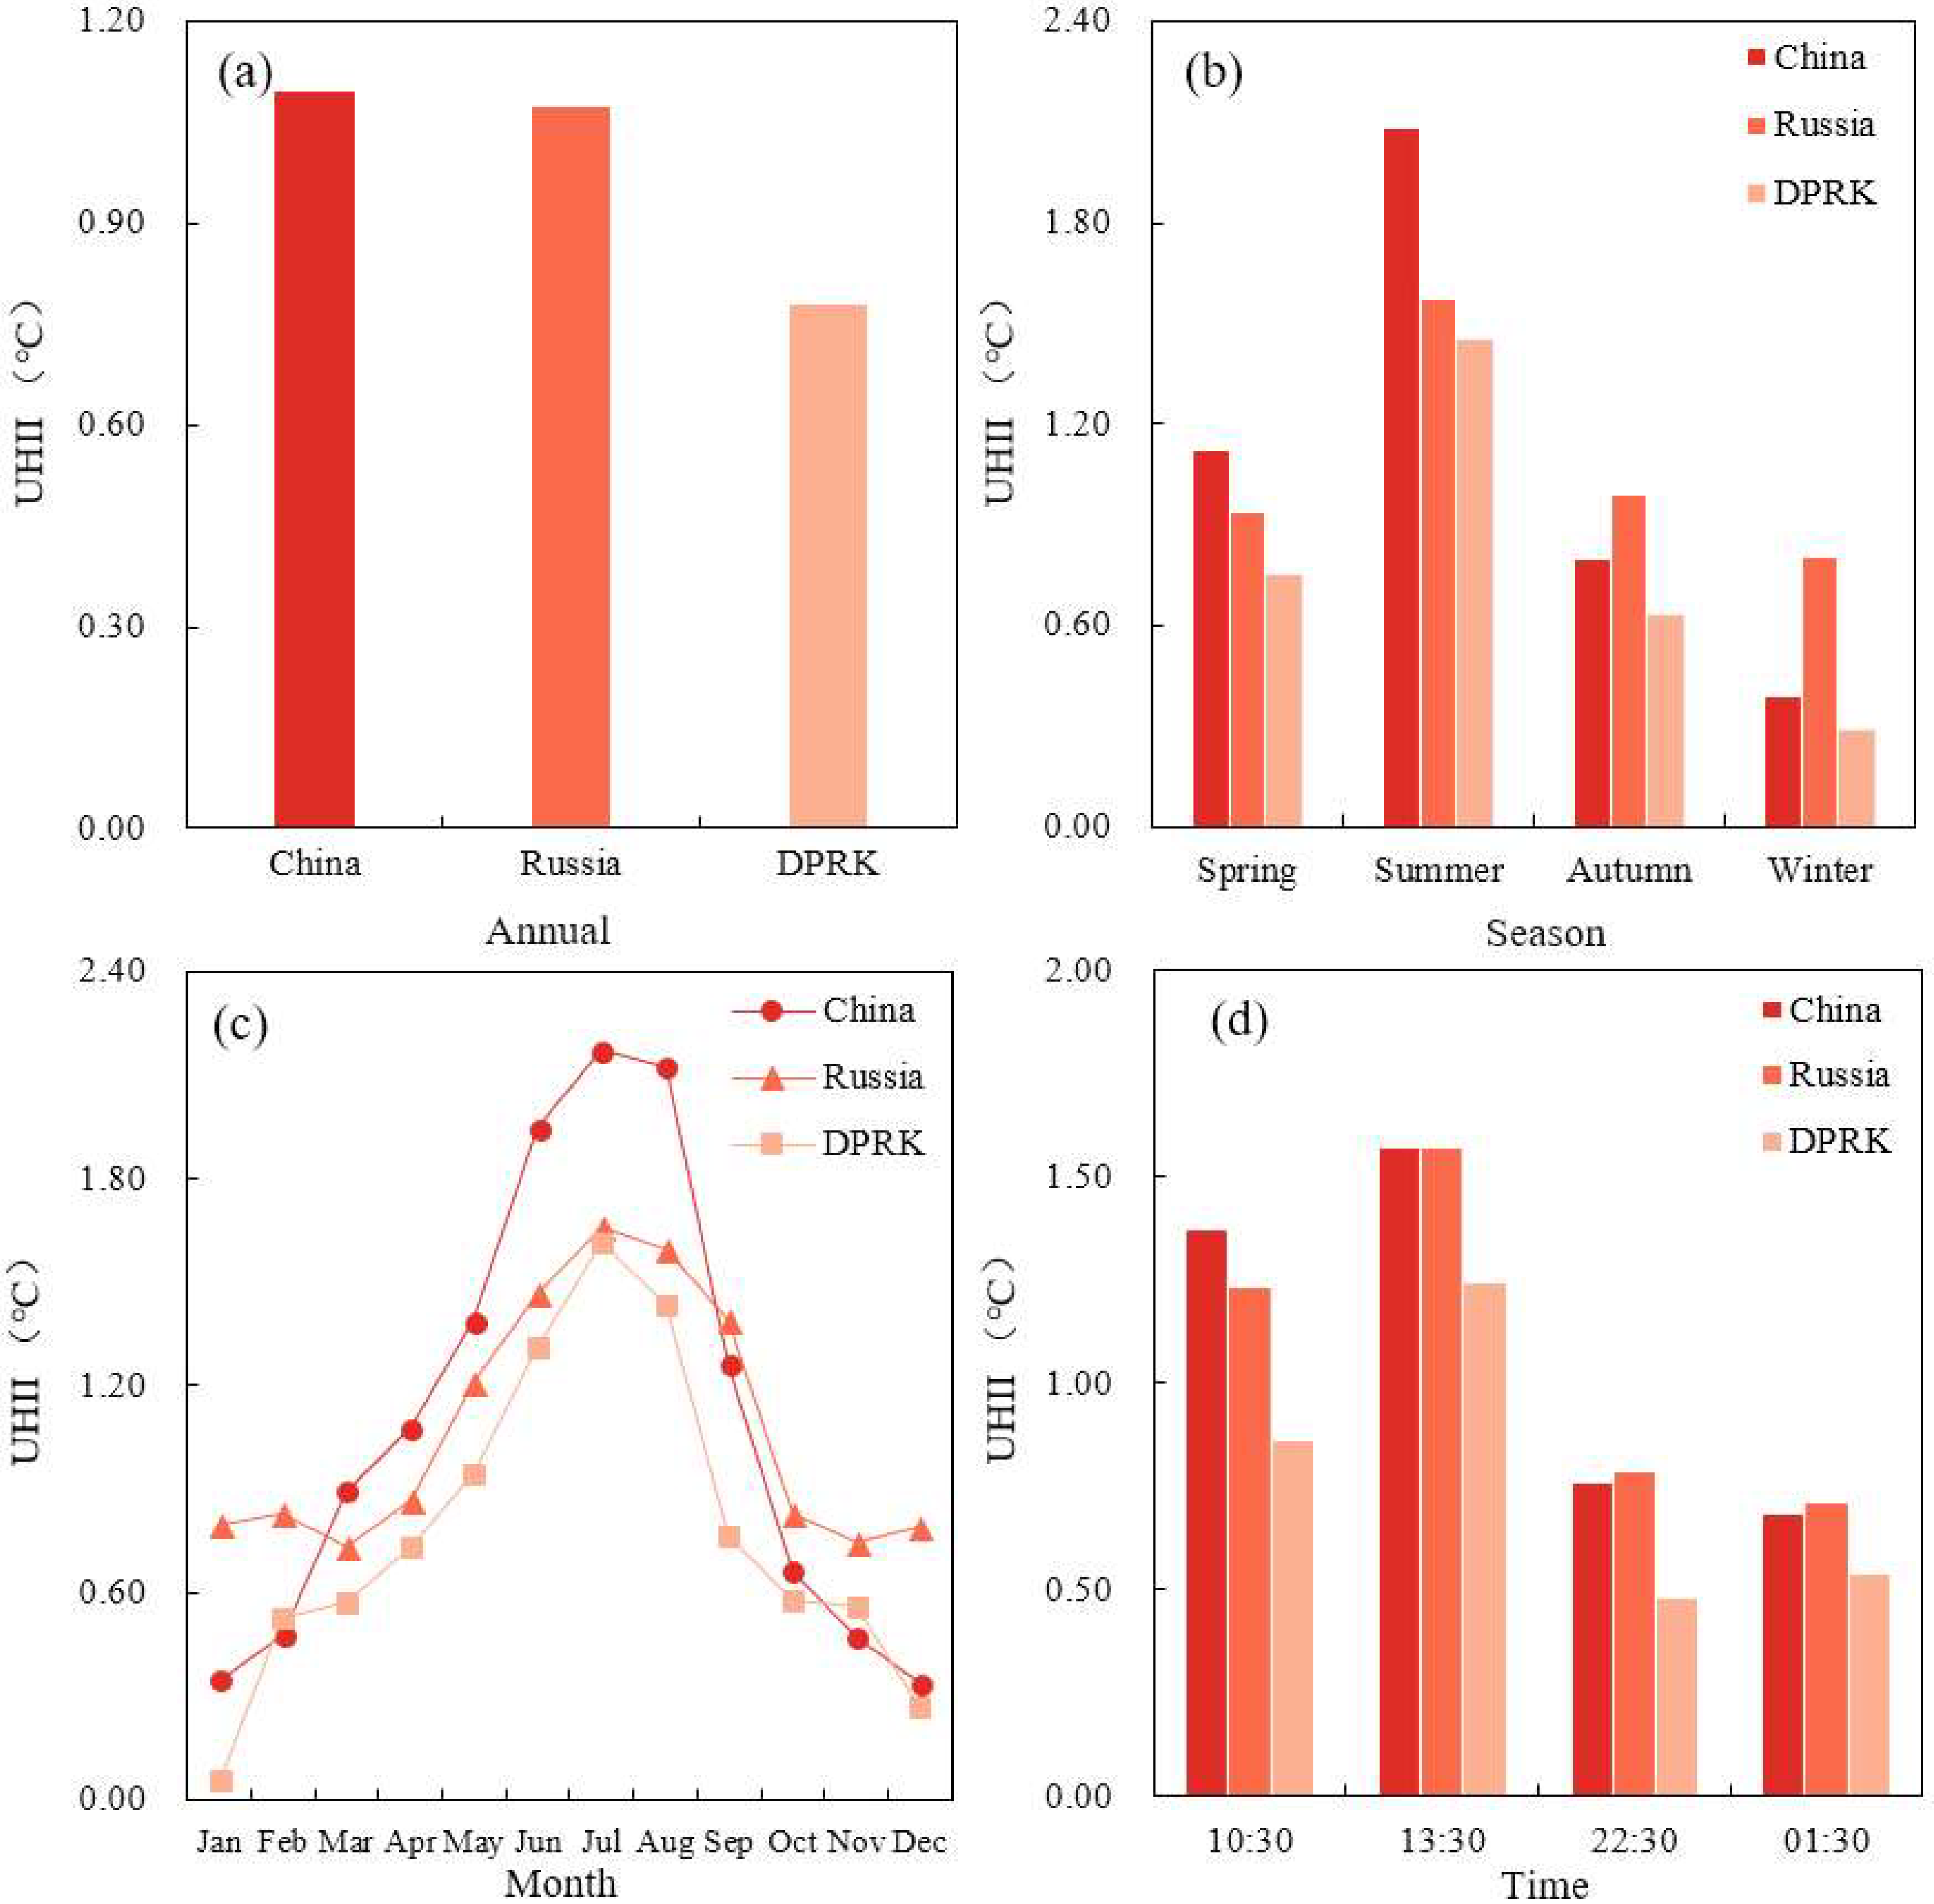

| Range | Spring (°C) | Summer (°C) | Autumn (°C) | Winter (°C) | Annual (°C) |
|---|---|---|---|---|---|
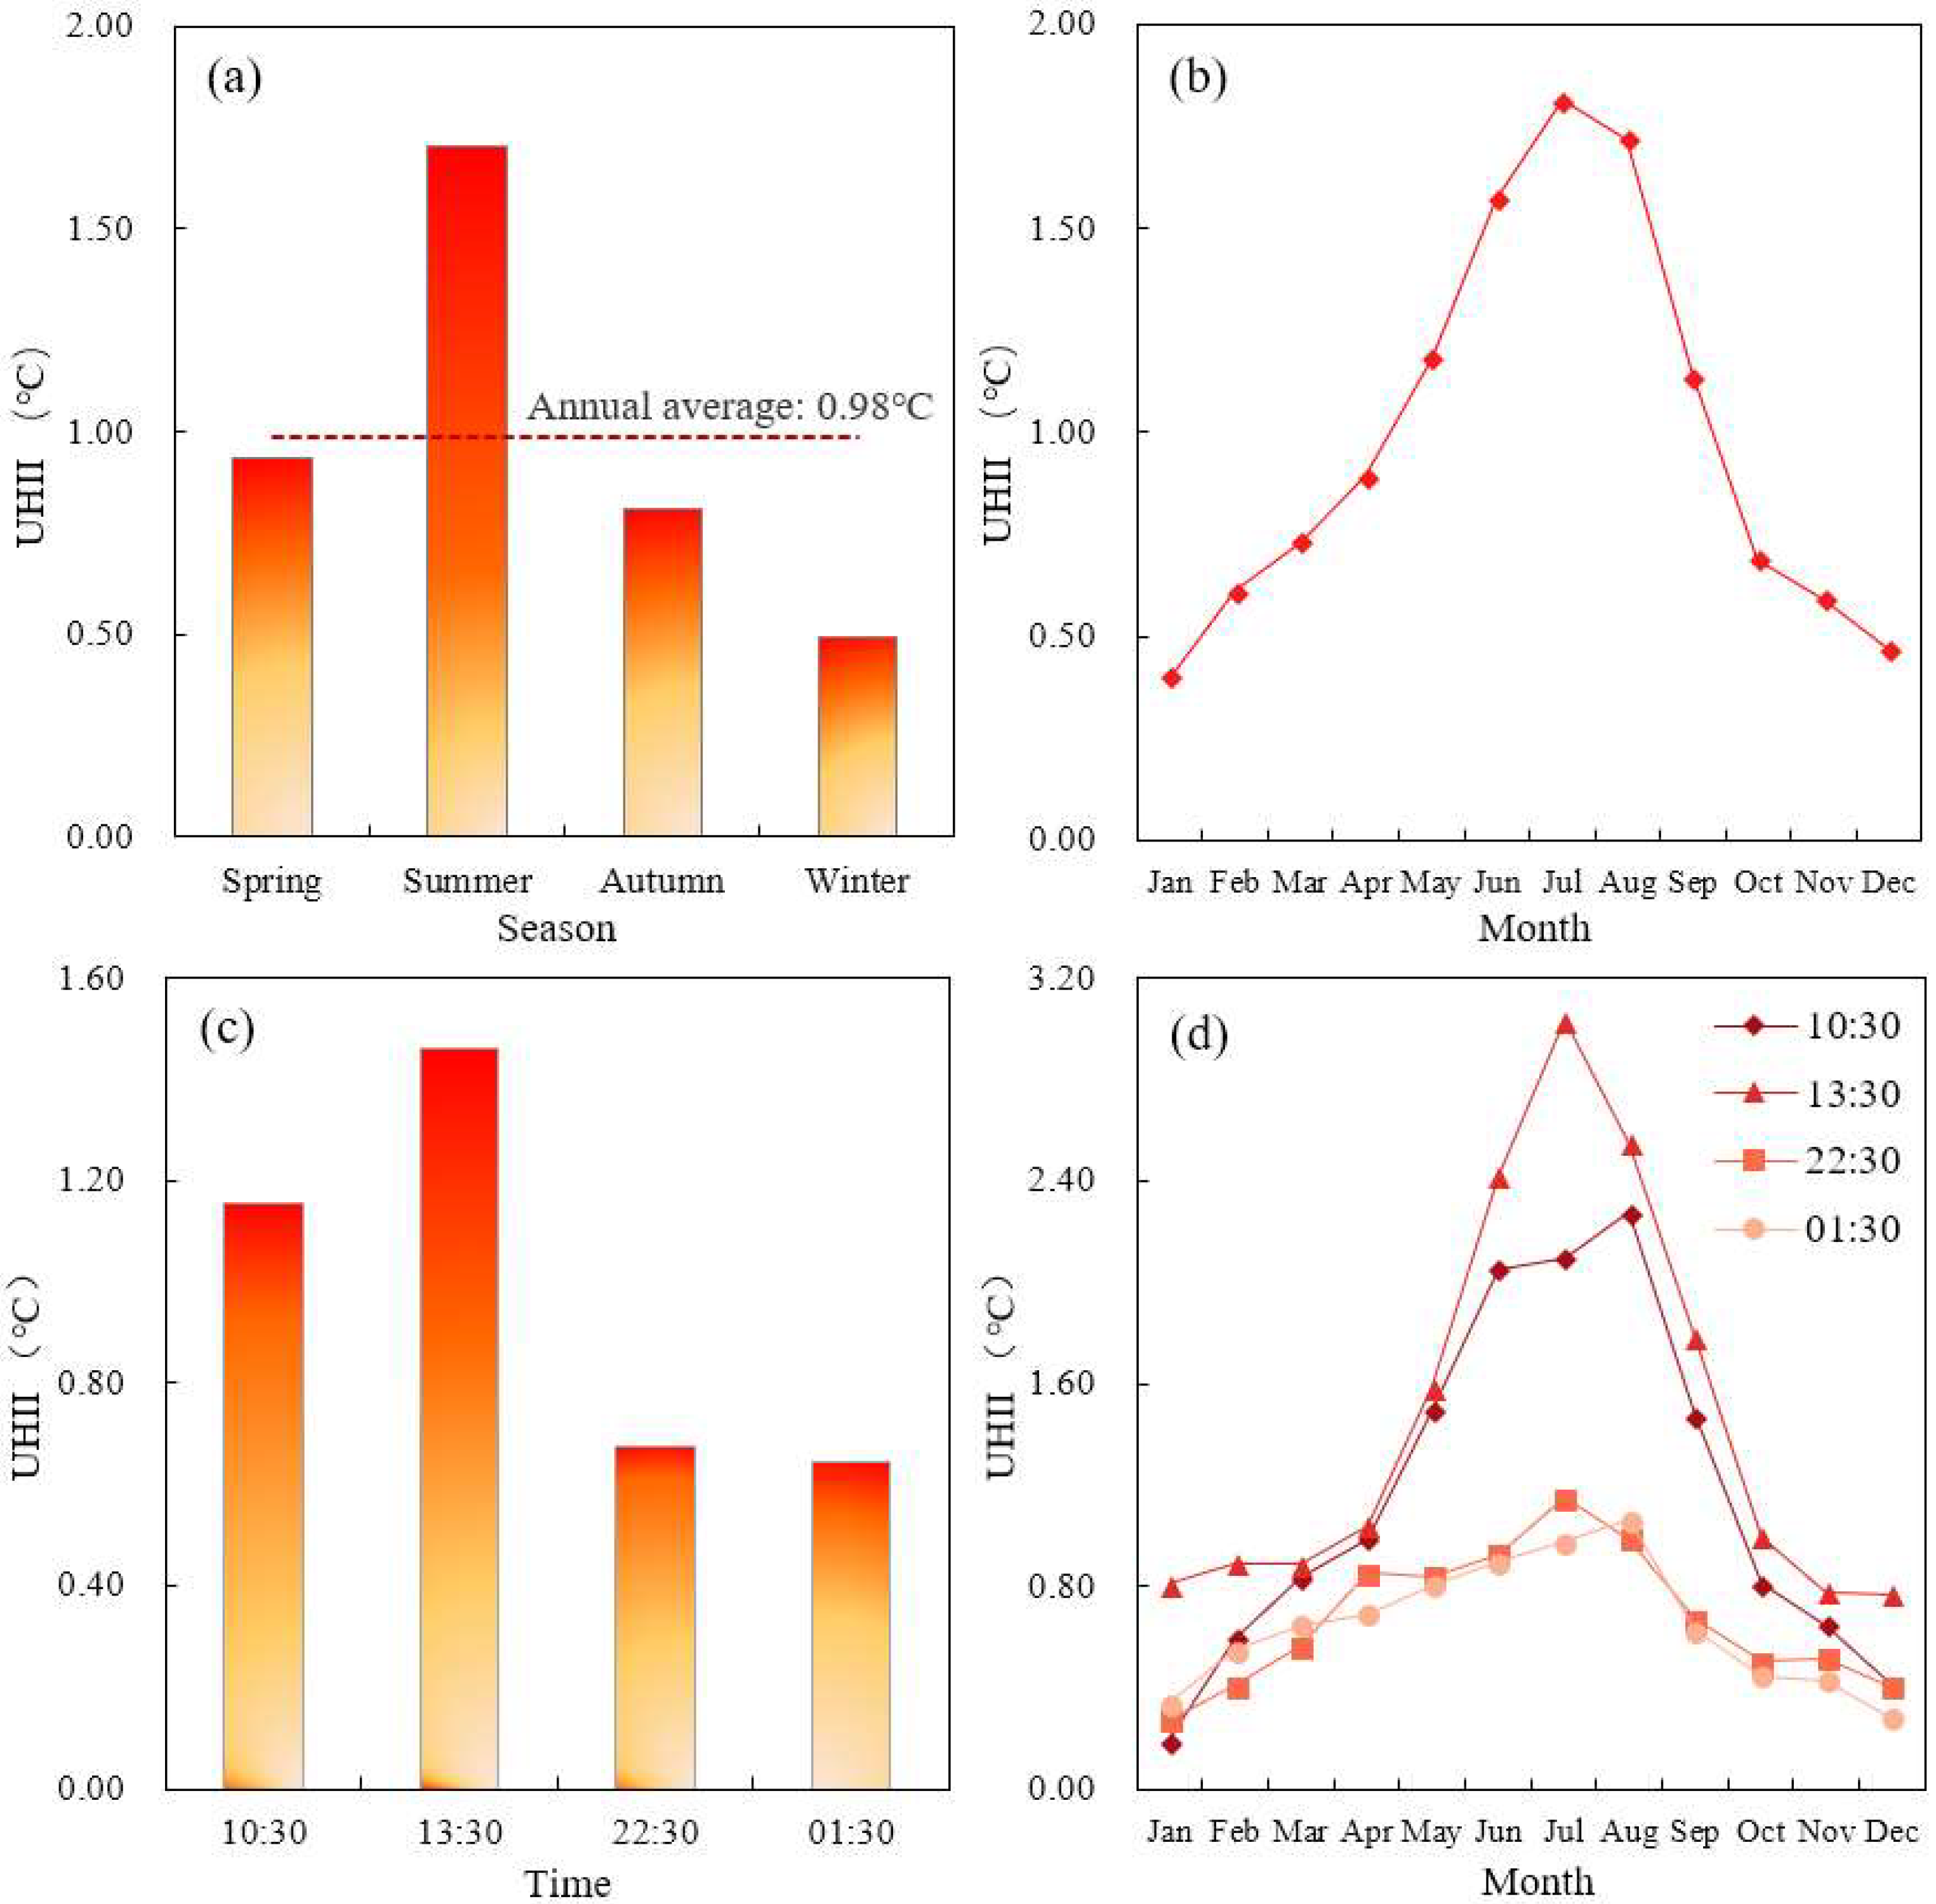
| The entire region | 0.94 | 1.70 | 0.81 | 0.49 | 0.98 |
| China | 1.12 | 2.08 | 0.80 | 0.39 | 1.10 |
| Russia | 0.94 | 1.57 | 0.99 | 0.81 | 1.08 |
| DPRK | 0.75 | 1.45 | 0.63 | 0.29 | 0.78 |
| Range | January (°C) | February (°C) | March (°C) | April (°C) | May (°C) | June (°C) | July (°C) | August (°C) | September (°C) | October (°C) | November (°C) | December (°C) |
|---|---|---|---|---|---|---|---|---|---|---|---|---|
| The entire region | 0.40 | 0.61 | 0.73 | 0.89 | 1.18 | 1.57 | 1.81 | 1.72 | 1.14 | 0.69 | 0.59 | 0.47 |
| China | 0.35 | 0.48 | 0.90 | 1.08 | 1.39 | 1.95 | 2.17 | 2.12 | 1.26 | 0.66 | 0.47 | 0.34 |
| Russia | 0.80 | 0.83 | 0.73 | 0.87 | 1.21 | 1.46 | 1.66 | 1.59 | 1.39 | 0.83 | 0.75 | 0.79 |
| DPRK | 0.06 | 0.53 | 0.57 | 0.74 | 0.95 | 1.31 | 1.61 | 1.44 | 0.76 | 0.58 | 0.56 | 0.27 |
| Range | 10:30 (°C) | 13:30 (°C) | 22:30 (°C) | 1:30 (°C) |
|---|---|---|---|---|
| The entire region | 1.16 | 1.46 | 0.68 | 0.65 |
| China | 1.37 | 1.57 | 0.76 | 0.69 |
| Russia | 1.23 | 1.57 | 0.78 | 0.71 |
| DPRK | 0.86 | 1.24 | 0.48 | 0.54 |
| Variables | Day | Night | ||||||
|---|---|---|---|---|---|---|---|---|
| Spring | Summer | Autumn | Winter | Spring | Summer | Autumn | ||
| Day | Summer | 0.83 ** | ||||||
| Autumn | 0.73 ** | 0.86 ** | ||||||
| Winter | 0.14 | 0.24 | 0.39 | |||||
| Night | Spring | −0.34 | 0.10 | 0.24 | 0.49 * | |||
| Summer | −0.25 | 0.17 | 0.16 | 0.61 ** | 0.82 ** | |||
| Autumn | −0.64 ** | −0.25 | −0.03 | 0.32 | 0.87 ** | 0.61 ** | ||
| Winter | −0.57 * | −0.27 | 0.03 | 0.34 | 0.81 ** | 0.50 * | 0.94 ** | |
| Variables | ∆NDVI | ∆WSA | DEM | Distance from the Ocean | Urban Land Area | Urban Population | Urban Population Density | Urban Nighttime Light Intensity | |
|---|---|---|---|---|---|---|---|---|---|
| Day | Spring | −0.35 | 0.33 | 0.26 | 0.11 | 0.42 | 0.38 | −0.05 | 0.45 * |
| Summer | −0.57 * | 0.35 | 0.07 | 0.06 | 0.76 ** | 0.76 ** | 0.04 | 0.67 ** | |
| Autumn | −0.50 * | 0.09 | 0.06 | −0.04 | 0.76 ** | 0.77 ** | −0.06 | 0.82 ** | |
| Winter | −0.18 | 0.04 | −0.01 | −0.26 | 0.38 | 0.29 | 0.03 | 0.60 ** | |
| Annual | −0.51 * | 0.29 | 0.14 | 0.01 | 0.69 ** | 0.67 ** | −0.01 | 0.73 ** | |
| Night | Spring | −0.10 | 0.13 | −0.11 | −0.04 | 0.44 * | 0.48 * | 0.02 | 0.38 |
| Summer | −0.70 ** | 0.51 * | 0.12 | 0.21 | 0.50 * | 0.52 * | 0.18 | 0.29 | |
| Autumn | −0.28 | 0.17 | −0.33 | −0.27 | 0.17 | 0.22 | −0.06 | 0.19 | |
| Winter | 0.14 | 0.08 | −0.35 | −0.30 | 0.08 | 0.11 | −0.06 | 0.22 | |
| Annual | −0.27 | 0.02 | −0.23 | −0.16 | 0.28 | 0.31 | 0.01 | 0.28 | |
© 2018 by the authors. Licensee MDPI, Basel, Switzerland. This article is an open access article distributed under the terms and conditions of the Creative Commons Attribution (CC BY) license (http://creativecommons.org/licenses/by/4.0/).
Share and Cite
Li, B.; Liu, Z.; Nan, Y.; Li, S.; Yang, Y. Comparative Analysis of Urban Heat Island Intensities in Chinese, Russian, and DPRK Regions across the Transnational Urban Agglomeration of the Tumen River in Northeast Asia. Sustainability 2018, 10, 2637. https://doi.org/10.3390/su10082637
Li B, Liu Z, Nan Y, Li S, Yang Y. Comparative Analysis of Urban Heat Island Intensities in Chinese, Russian, and DPRK Regions across the Transnational Urban Agglomeration of the Tumen River in Northeast Asia. Sustainability. 2018; 10(8):2637. https://doi.org/10.3390/su10082637
Chicago/Turabian StyleLi, Bing, Zhifeng Liu, Ying Nan, Shengnan Li, and Yanmin Yang. 2018. "Comparative Analysis of Urban Heat Island Intensities in Chinese, Russian, and DPRK Regions across the Transnational Urban Agglomeration of the Tumen River in Northeast Asia" Sustainability 10, no. 8: 2637. https://doi.org/10.3390/su10082637