Properties of Fired Bricks Incorporating TFT-LCD Waste Glass Powder with Reservoir Sediments

Department of Civil Engineering & Geomatics, Cheng Shiu University, No. 840, Chengcing Rd., Niaosong District, Kaohsiung 83347, Taiwan
Sustainability 2018, 10(7), 2503; https://doi.org/10.3390/su10072503
Submission received: 14 June 2018
/
Revised: 16 July 2018
/
Accepted: 16 July 2018
/
Published: 17 July 2018
(This article belongs to the Special Issue Sustainability in Civil Engineering: from Sustainable Materials to Sustainable Cities)
Abstract
:In view of increasing concerns over nonrenewable resource depletion and waste management, this study aimed to apply the Taguchi optimization technique to determine the process conditions for producing bricks by incorporating thin-film transition liquid crystal display (TFT-LCD) waste glass powder with reservoir sediments. An orthogonal array L16(45) was adopted, which consisted of five controllable four-level factors (i.e., cullet content, drying method, preheat time, sintering temperature, and error). Moreover, the analysis of variance method was used to explore the effects of the experimental factors on the density, water absorption, shrinkage ratio, loss on ignition, porosity, and compressive strength of the fired bricks. The microstructures of the fired specimens were investigated by scanning electron microscopy. Then, large-scale production techniques for fired bricks containing recycled TFT-LCD glass cullet and reservoir sediments were developed in a commercially available tunnel kiln. The test results showed that the structure of the fired specimen was loose at a sintering temperature ranging from 900 to 950 °C. However, the fired specimen showed a significant densification at the sintering temperature of 1050 °C. In addition, the Taguchi method was found to be a feasible approach for optimizing the process condition of bricks using recycled TFT-LCD glass cullet and reservoir sediments and it significantly reduced the number of tests. Further, the characteristics of fired bricks developed in the tunnel kiln were in compliance with Chinese National Standards class Ι building bricks criteria.
1. Introduction
Bricks are mainly made by burning clay at high temperatures [1]. The main raw materials of clay bricks are natural resources such as clay or shale, but with the concept of sustainable development and the rising awareness of environmental protection, the exploitation or acquisition of these raw materials has become increasingly difficult in Taiwan. On the other hand, the amount of waste generated by various industries is increasing, and its management has become a difficult problem that modern society must face [2]. In particular, the sustainability of cities is currently a topic of great concern [3,4]. As sustainable development becomes more and more important, research related to the sustainability of civil construction has increased significantly [5,6]. Therefore, there have been many related studies concerning the development of alternative sources of clay bricks [7,8,9,10,11,12,13,14,15,16,17,18,19,20,21,22,23,24,25,26,27,28,29,30]. These alternative materials include surplus soil from construction projects, reservoir sediments, water purification sludge, slag, inorganic sludge, stone waste, fly ash, palm oil fuel ash, incinerator ash and waste glass, sugarcane bagasse ash, etc. Among them, many studies report the use of glass as a brick fluxing agent.
Harrison [9] added cullet to two types of clay, one as a buff clay and the other as a red clay, with percentages of substitution of 0%, 5%, and 10% to explore its feasibility for brickmaking and to evaluate the actual mass production process. The results of laboratory-scale trial firing showed that at the same sintering temperature, the water absorption of the brick decreased with the increase of the amount of cullet, while the compressive strength of the brick increased with the addition of cullet. In addition, regardless of the type of clay, the color of the brick became darker as the added amount of cullet increased. Smith [11] also used cullet to blend in clay, with substitution percentages of 0%, 5%, and 10%, to assess the feasibility of the actual mass production process. The results of the firing indicated that at the same sintering temperature, the water absorption rate of bricks after immersion in cold water for 24 h decreased with the increase of the amount of cullet, while the compressive strength of bricks increased with the increase of the amount of cullet. However, in the experimental group, the water absorption and compressive strength of the brick blended with 5% cullet were similar to those of the 10%, and there was no significant difference. Moreover, regardless of the sintering temperature of 950 or 970 °C, the bricks presented a pristine appearance, and the color difference between the control group and the experimental group was not significant.
Rahman et al. [12] investigated the performance of bricks using fly ash and palm oil fuel ash instead of cement. Their test results revealed that according to the Malaysian standard MS76:1972, both fly-ash-incorporated and palm-oil-fuel-ash-incorporated bricks satisfied Class 1 and Class 2 load-bearing brick requirements, as well as ASTM’s water absorption requirements C55-11. Muntohar and Rahman [14] presented an experimental study on the development of shellcrete masonry blocks made of palm kernel oil. Their test results revealed that blocks with greater palm kernel oil content tended to have a lower density and absorbed water easily. Ean et al. [15] investigated the compressive strength and failure mode of sediment bricks. The experimental variables included prewetted unit bricks, mortar type, and slenderness ratio of prisms. The test results showed that the exhibited compressive strength of the prewetted sediment brick masonry was 20% higher than that of the dry sediment masonry. In particular, the use of cement–lime mortar resulted in a decrease in compressive strength compared with cement mortar. However, the sediment brick masonry with the cement–lime mortar had a higher compressive strength in comparison with cement mortar masonry. It is worth noting that in terms of production technology, the industry has gradually emphasized clean production or development of noncombustion processes to reduce energy consumption. According to Kirby’s results [16], the energy used to produce cullet/clay bricks (natural gas) was 38.9% less than that of clinker/clay bricks.
In the thin-film transition liquid crystal display (TFT-LCD) manufacturing industry, Taiwan is the leading country. According to statistics from the Department of Waste Management under the Taiwan Environmental Protection Administration (EPA) in July 2008, the amount of used TFT-LCD glass produced in Taiwan had grown very rapidly. Therefore, it is necessary to actively promote new recycling applications of TFT-LCD waste glass in Taiwan. Basically, TFT-LCD waste glass can be divided into three major types: waste glass, waste coated glass, and waste black glass. Among them, waste glass is an uncoated glass that has not been injected with liquid crystals and can be sent to a recycling organization for recycling and reuse. Waste coated glass is a glass plate with a color filter or a transparent conductive layer or alignment film. Waste black glass is a kind of coated glass with a polarizer attached. The main source of waste glass is the edge material, which is scrap or defective products produced during the manufacture of liquid crystal panels. However, the current research on incorporating TFT-LCD waste glass with reservoir sediments to produce bricks is extremely rare.
In general, the factors affecting the performance of fired bricks include raw material composition and firing conditions [1,7,8,9,10,11,12,27]. In a factorial design, as the design parameters or parameter levels increase, not only do the time and cost of the experiment increase significantly, but the experimental conditions become more complicated. In contrast, the Taguchi method only tests pairs of combinations instead of having to test all possible combinations [31,32,33,34]. This is mainly due to the fact that Taguchi’s orthogonal arrays are highly fractional orthogonal designs [31]. In particular, these designs can use only the minimum number of experiments to estimate the main effects, thereby saving time and resources [31,32,33,34]. As a result, the Taguchi method can effectively improve the quality of products and has the advantages of economy, operability, and robustness.
In view of the above considerations, the present study aimed at conducting an investigation of the development of bricks by incorporating TFT-LCD waste glass with reservoir sediments. The experiments were designed using an orthogonal array technique in an L16 array with five controllable four-level factors. Moreover, large-scale production techniques for producing clay bricks containing recycled TFT-LCD glass cullet were developed in a commercially available tunnel kiln.
2. Experimental Details
2.1. Materials and Test Items
In this study, the main materials used included ground TFT-LCD glass and reservoir sediments. The TFT-LCD waste glass was used as an additive, and it was blended with reservoir sediments to burn building bricks. The ground TFT-LCD glass was collected from a panel factory in Taichung, Central Taiwan. The reservoir sediments were collected from the Wushoh Reservoir located in Central Taiwan. Each raw material sample was collected first and mineral composition, physical property, and chemical composition tests were performed to confirm that the composition and basic properties were in line with the raw material requirements for burning high-quality clay bricks. For reservoir sediments, X-ray powder diffraction analysis was used. The intensity of the spectral analysis was used to compare the maps of the standard samples, and the mineralogical composition was quantitatively analyzed according to the standard mineralogy algorithm based on the material chemical composition. The physical property analysis of raw materials included specific gravity, moisture content, particle size analysis, and plasticity (liquid limit, plastic limit, and plasticity index). The chemical analysis of raw materials was based on the quantitative analysis of X-ray fluorescence. The result of any test was the average of three specimens to ensure the reliability of the results.
2.2. Experimental Program
The Taguchi method was adopted to design the experimental protocol. Cullet content, drying method, preheat time, sintering temperature, and error were selected as the process parameters. The fifth factor was for error calculation. The levels of these parameters are given in Table 1. In addition, Table 1 also shows that density, water absorption, shrinkage ratio, loss on ignition, porosity, and compressive strength of the resulting brick were used as the performance parameters for this research. Moreover, an orthogonal array L16(45) was adopted, which consisted of five controllable four-level factors (Table 2). The last column of the orthogonal array was left empty for the error detection of experiments. The effect of the composition and firing conditions on the performances of the resulting bricks was evaluated using a laboratory-scale device. Further, the range analysis and analysis of variance (ANOVA) were the mathematical statistics used to explore the effects of the experimental factors on the performances of the produced bricks, and to optimize the selected parameters.
2.3. Laboratory-Scale Firing Test
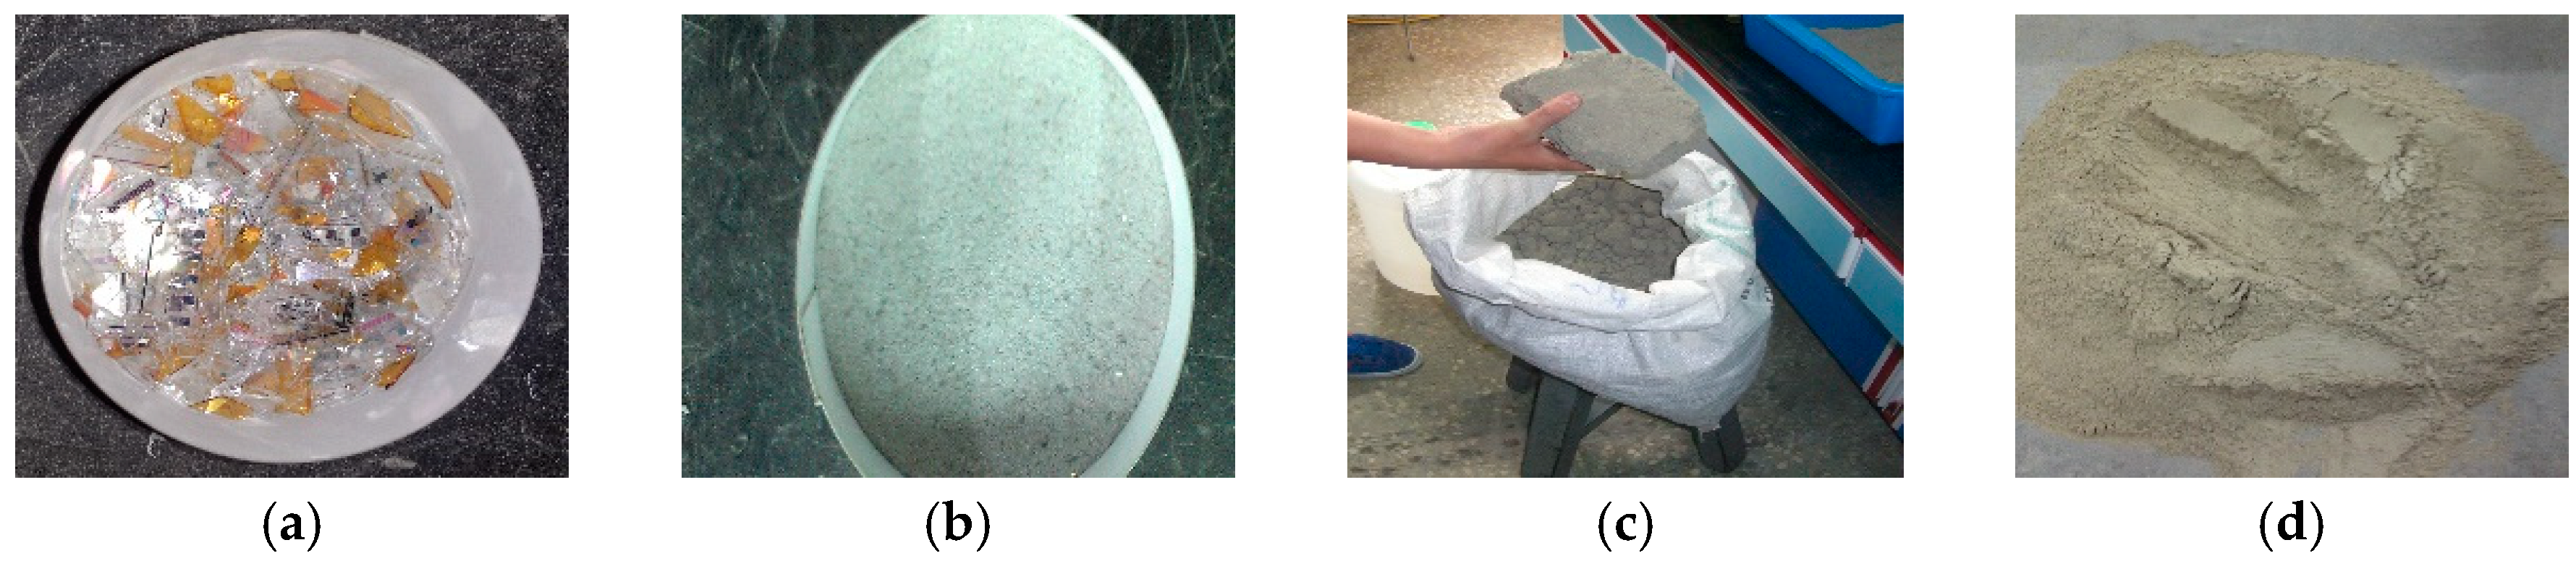
In order to avoid the phenomenon of certain ingredients of raw materials being too concentrated and causing unreasonable results, samples of the raw materials needed to be subjected to aging treatment. To facilitate the brick-making process and achieve better firing results, the TFT-LCD waste glass and reservoir sediments were first crushed, and then refinement processes such as crushing and ball milling were applied to ensure homogenization of the raw materials (Figure 1).
The resulting fine powder was thoroughly mixed according to the design ratio in Table 2 to ensure uniformity, as shown in Figure 2a. Then, an appropriate amount of water (about 18% by weight of the mixture) was added to the mixture, as shown in Figure 2b. It is important to moisten each clay particle surface to increase clay plasticity. In addition, through the rubbing process, the air in the mixture was squeezed out, and in the course of the process, the uneven masses were combined and kneaded again to obtain a smooth and well-proportioned embryo, as shown in Figure 2c. After soil training, the plastic mixture was placed into a test brick model with a length of 50 mm, a width of 50 mm, and a height of 50 mm. Then, a small universal compressive tester was used to apply an appropriate pressure to press the plastic mixture in each brick mold to form a brick embryo. There was a total of 16 groups of brick embryos (G1–G16) with three trials in each group. It must be noted that the shaped brick embryo must possess sufficient tensile strength to maintain its shape.
After the formation of a “green” brick embryo, the moisture content will cause the brick embryo to shrink during the drying process, which has a great influence on the quality of the finished product. Therefore, the brick embryo must be dried. According to the design of the orthogonal table in Table 1, the brick embryos were subjected to four different drying methods (DMs) (DM1: natural drying for 2 days (dry at room temperature); DM2: natural drying for 1 day (dry at room temperature); DM3: oven drying for 1 day (operating temperature 100 °C); and DM4: oven drying for 1 day (operating temperature 50 °C)).
Table 3 shows the moisture contents of the 16 groups of brick embryos after treatment with the different drying methods. From the table, it can be seen that the moisture contents of brick embryos after “natural drying for 1 day” were the largest, ranging from approximately 14.2% to 14.9%, and were followed by the moisture contents of brick embryos after “natural drying for 2 days”, ranging between approximately 10.3% and 11.6%. The moisture contents of brick embryos dried at “50 °C for 1 day” were about 1.1–3.3%. The moisture contents of the brick embryos that were “dried at 100 °C for 1 day” were the smallest, with moisture content 0%.
After the brick embryos were dried, they were placed in an alumina crucible and put in a programmable high-temperature electric furnace. Then, the temperature of the furnace was increased from room temperature to 500 °C. The preheating time is shown in Table 1. The preheating process can not only make the brick embryos have certain strength, but also can avoid the bursting phenomenon during the firing process. Once the brick embryos had completed the preheating process, they were immediately placed in another high-temperature electric furnace that had been set at the sintering temperature for the firing operation. The sintering temperature used is shown in Table 1, and the sintering time was kept constant. When the brick embryos had finished the firing process, they were slowly cooled (in-furnace cooling). When the temperature of the bricks fell to room temperature, their physical and mechanical properties were measured.
2.4. Test Methods and Data Analysis
As previously described, the characteristics of the resulting bricks were evaluated in terms of six performance parameters (brick density, water absorption, shrinkage ratio, loss on ignition, porosity, and compressive strength). The density of the sintered bricks was determined by the Archimedes principle. The water absorption was tested according to the Chinese National Standards (CNS) 1127 specification [35]. To explore the volume change of the brick embryos, the sizes of the embryos before and after sintering were measured. The shrinkage ratio was defined as the ratio of the volume of the fired embryo to the volume of the unfired embryo. The mass loss of the dried brick embryo after firing was defined as the loss on ignition and was expressed as a percentage of the total initial mass. In terms of brick compressive strength test, the test method was based on the ASTM C67 standard test [36].
To evaluate the impact of each selected factor on the performance characteristics being studied, the signal-to-noise ratio (S/N ratio) of each control factor can be utilized, which is calculated by the mean squared deviation (MSD) [31,37]. Overall, there are three common categories of performance characteristics, that is, the-smaller-the-better, the-larger-the-better, and the-nominal-the-better. To obtain optimal process conditions for producing bricks, the performance characteristics of density, water absorption, shrinkage ratio, loss on ignition, and porosity were considered to be as the-smaller-the-better, while the performance characteristic of compressive strength was taken as the-larger-the-better. If the S/N ratio (η) is expressed in decibels (dB), it can be defined by a logarithm based on the MSD around the target value, as shown below [37]:
where n is the number of repetitions or observations and yi is the observed data.
Moreover, analysis of variance (ANOVA) was used to detect the optimization of the observed performance characteristics. This was achieved by dividing the total variability of the S/N ratio into the contribution of each process parameter and error [38].
3. Results and Discussion
3.1. Physical Properties and Chemical Composition Analysis of Raw Materials
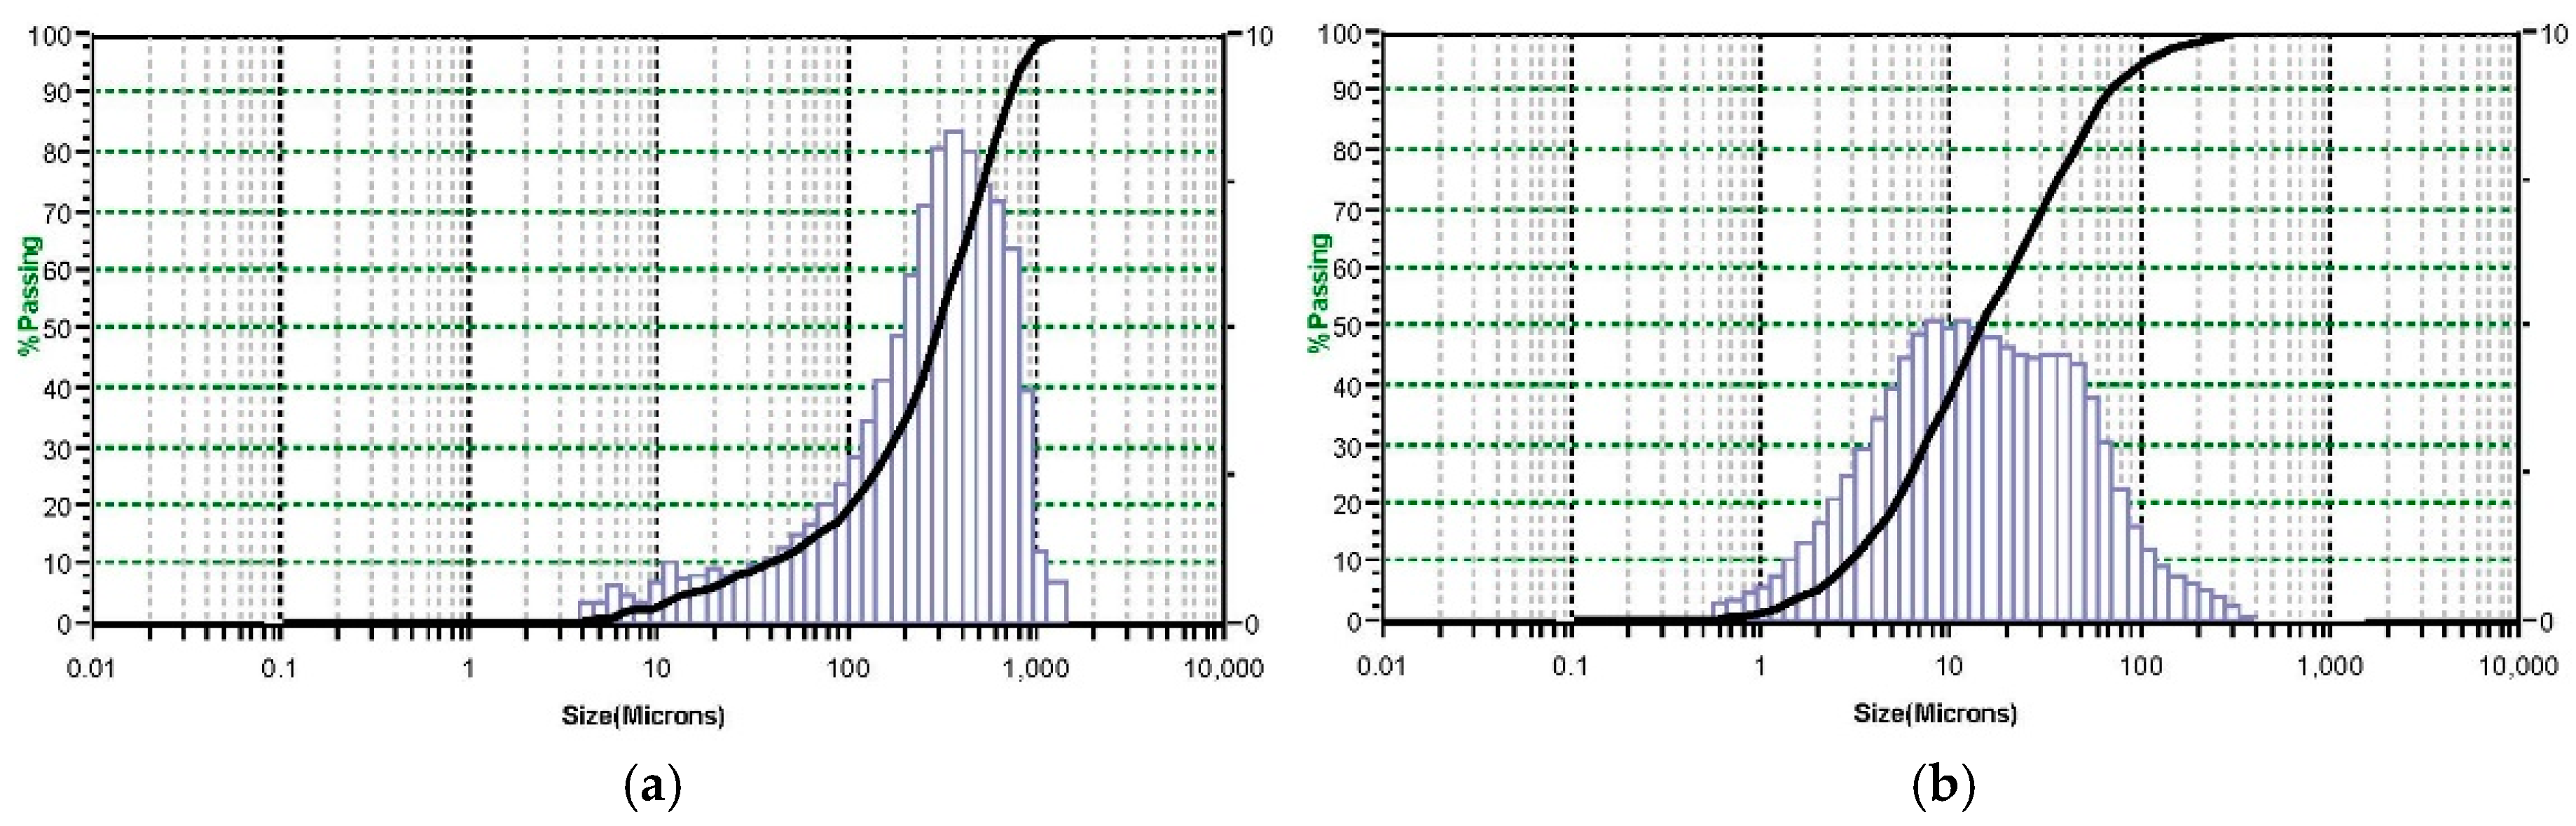
In general, making high-strength bricks requires that the particle size of the powdery materials be less than 150 μm [39]. The particle size distribution characteristics for the grinding cullet and reservoir sediments are shown in Figure 3. According to Figure 3, the diameter of the milled glass was larger, and its average particle diameter was 357 μm, which means that the glass should be ground again to facilitate batching or firing. The particle size of the reservoir sediments was fine, and the average particle size was 30.34 μm. From this, although the glass had been ground and refined, its particle size was still large. In order to make the ingredients even and make high-strength bricks, the glass was sieved with a No. 100 sieve (<150 μm), and the glass passed through the sieves was used as a test material.
Basically, the plasticity of raw materials has a great influence on the production of brick embryos. In general, the plasticity index (PI) of raw materials should be between 12 and 16. Table 4 shows that the plasticity of the glass was poor (no plasticity); the plasticity of the reservoir sediments (PI = 14) is better, and can meet the requirements for the production of brick embryos. For the specific gravity analysis of raw materials, the specific gravity of the reservoir sediments was about 2.49, which was similar to the specific gravity of the general soil, while the specific gravity of the glass was relatively small—about 2.3.
The chemical compositions of sediments and glass are shown in Table 5. The loss on ignition (LOI) at 450 °C for reservoir sediments was 3.9%; glass had almost no ignition loss (0.04%), indicating that the organic content of the raw material was low. As can be seen from Table 5, the main chemical components of these two materials are approximately SiO2 and Al2O3, which account for 82% and 91% of the components, respectively. In addition, the main difference between the two is that the Al2O3 content of the reservoir sediments (23.8%) was higher, and the SiO2 content of the glass (85.4%) was significantly higher.
3.2. Density
The experimental results and the corresponding S/N are shown in Table 6. The effect of each parameter used can be separated at different levels because the experimental design was orthogonal. Taking the cullet content as an example, the mean S/N ratio at levels 1, 2, 3, and 4 were calculated by averaging the S/N ratios of experiments G1–G4, G5–G8, G9–G12, and G13–G16, respectively. Similarly, the average S/N ratio for each level of other parameters can be obtained. The influence of each selected factor on the performance characteristic investigated is described in detail below.
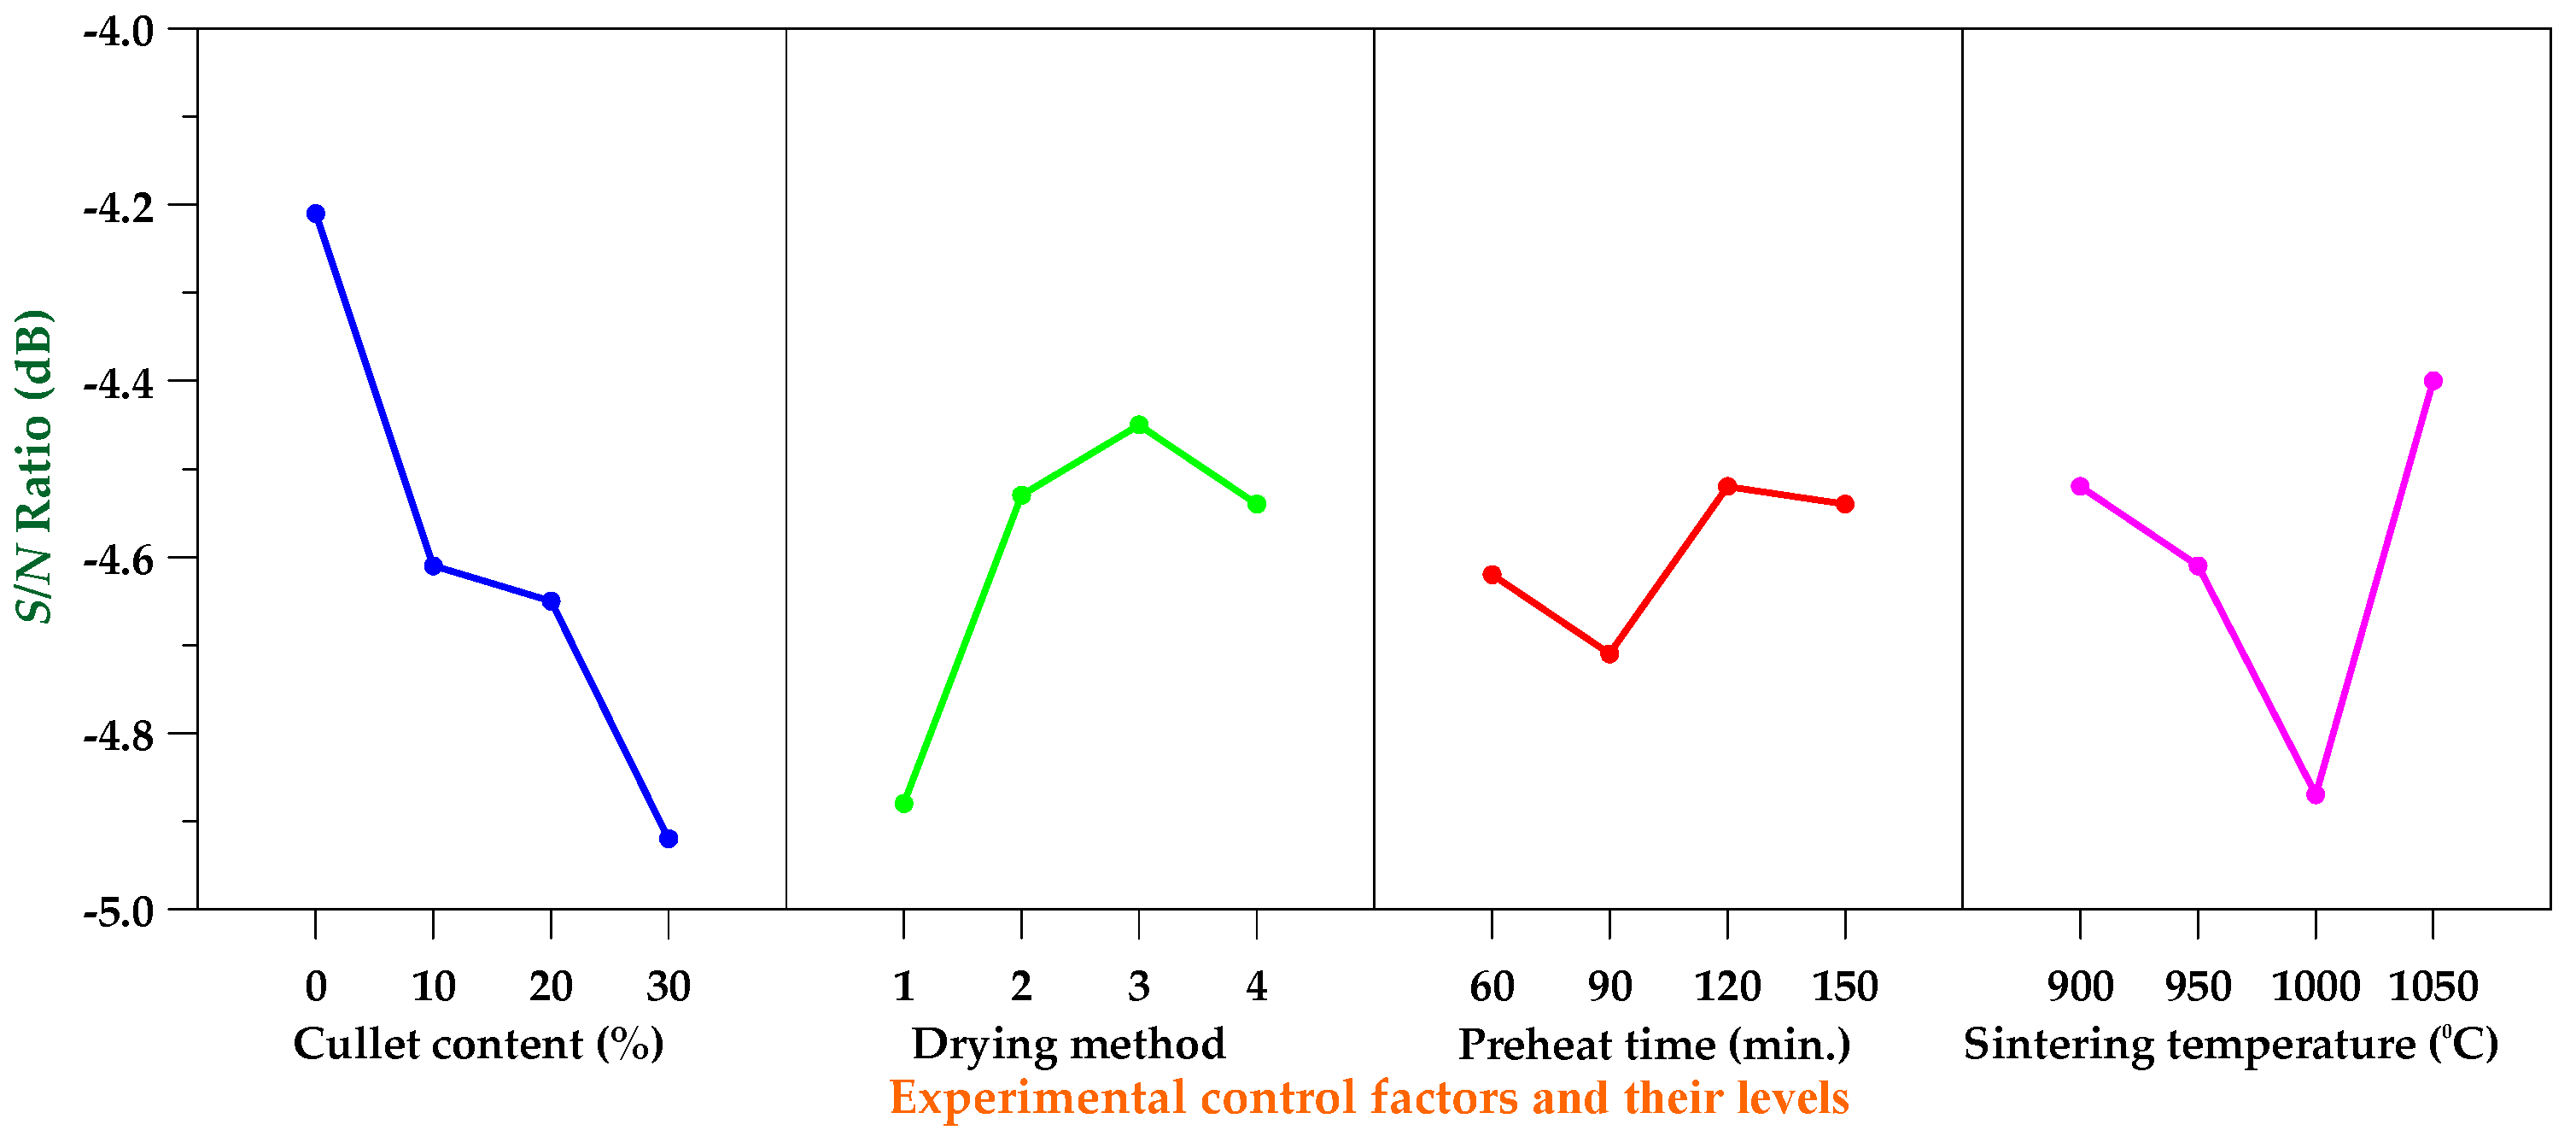
As can be seen from Table 6, the density of the produced bricks ranged from 1.57 to 1.84 g/cm3. Among them, the lowest value of density was 1.57 g/cm3. In addition, Table 7 shows the mean S/N ratio at each level of the parameters for density, and Figure 4 shows the S/N response graph for density. Basically, the larger the S/N ratio, the smaller the variance of density around the desired value. Therefore, as can be seen from Table 7 and Figure 4, the cullet content was the most important factor affecting the responses, and the maximum value of response was at the lowest level of the cullet content. That is to say, the larger the amount of the added TFT-LCD waste glass powder, the higher the density of the resulting bricks. This is due to the waste glass particles fusing with the clay bodies, which contributed to the densification of the brick [40]. On the other hand, the results of the ANOVA of density are given in Table 8. Moreover, Table 8 also provides the F values for a 95% confidence level and the contribution percentage of each parameter. According to Table 8, the main parameters were cullet content (40.97%), preheat time (20.73%), and sintering temperature (17.21%). In summary, based on the results of the S/N ratio and ANOVA analyses, the optimal combination of parameters and their levels for achieving minimum density is A1B3C3D4, i.e., cullet content at level 1, drying method at level 3, preheat time at level 3, and sintering temperature at level 4.
3.3. Water Absorption
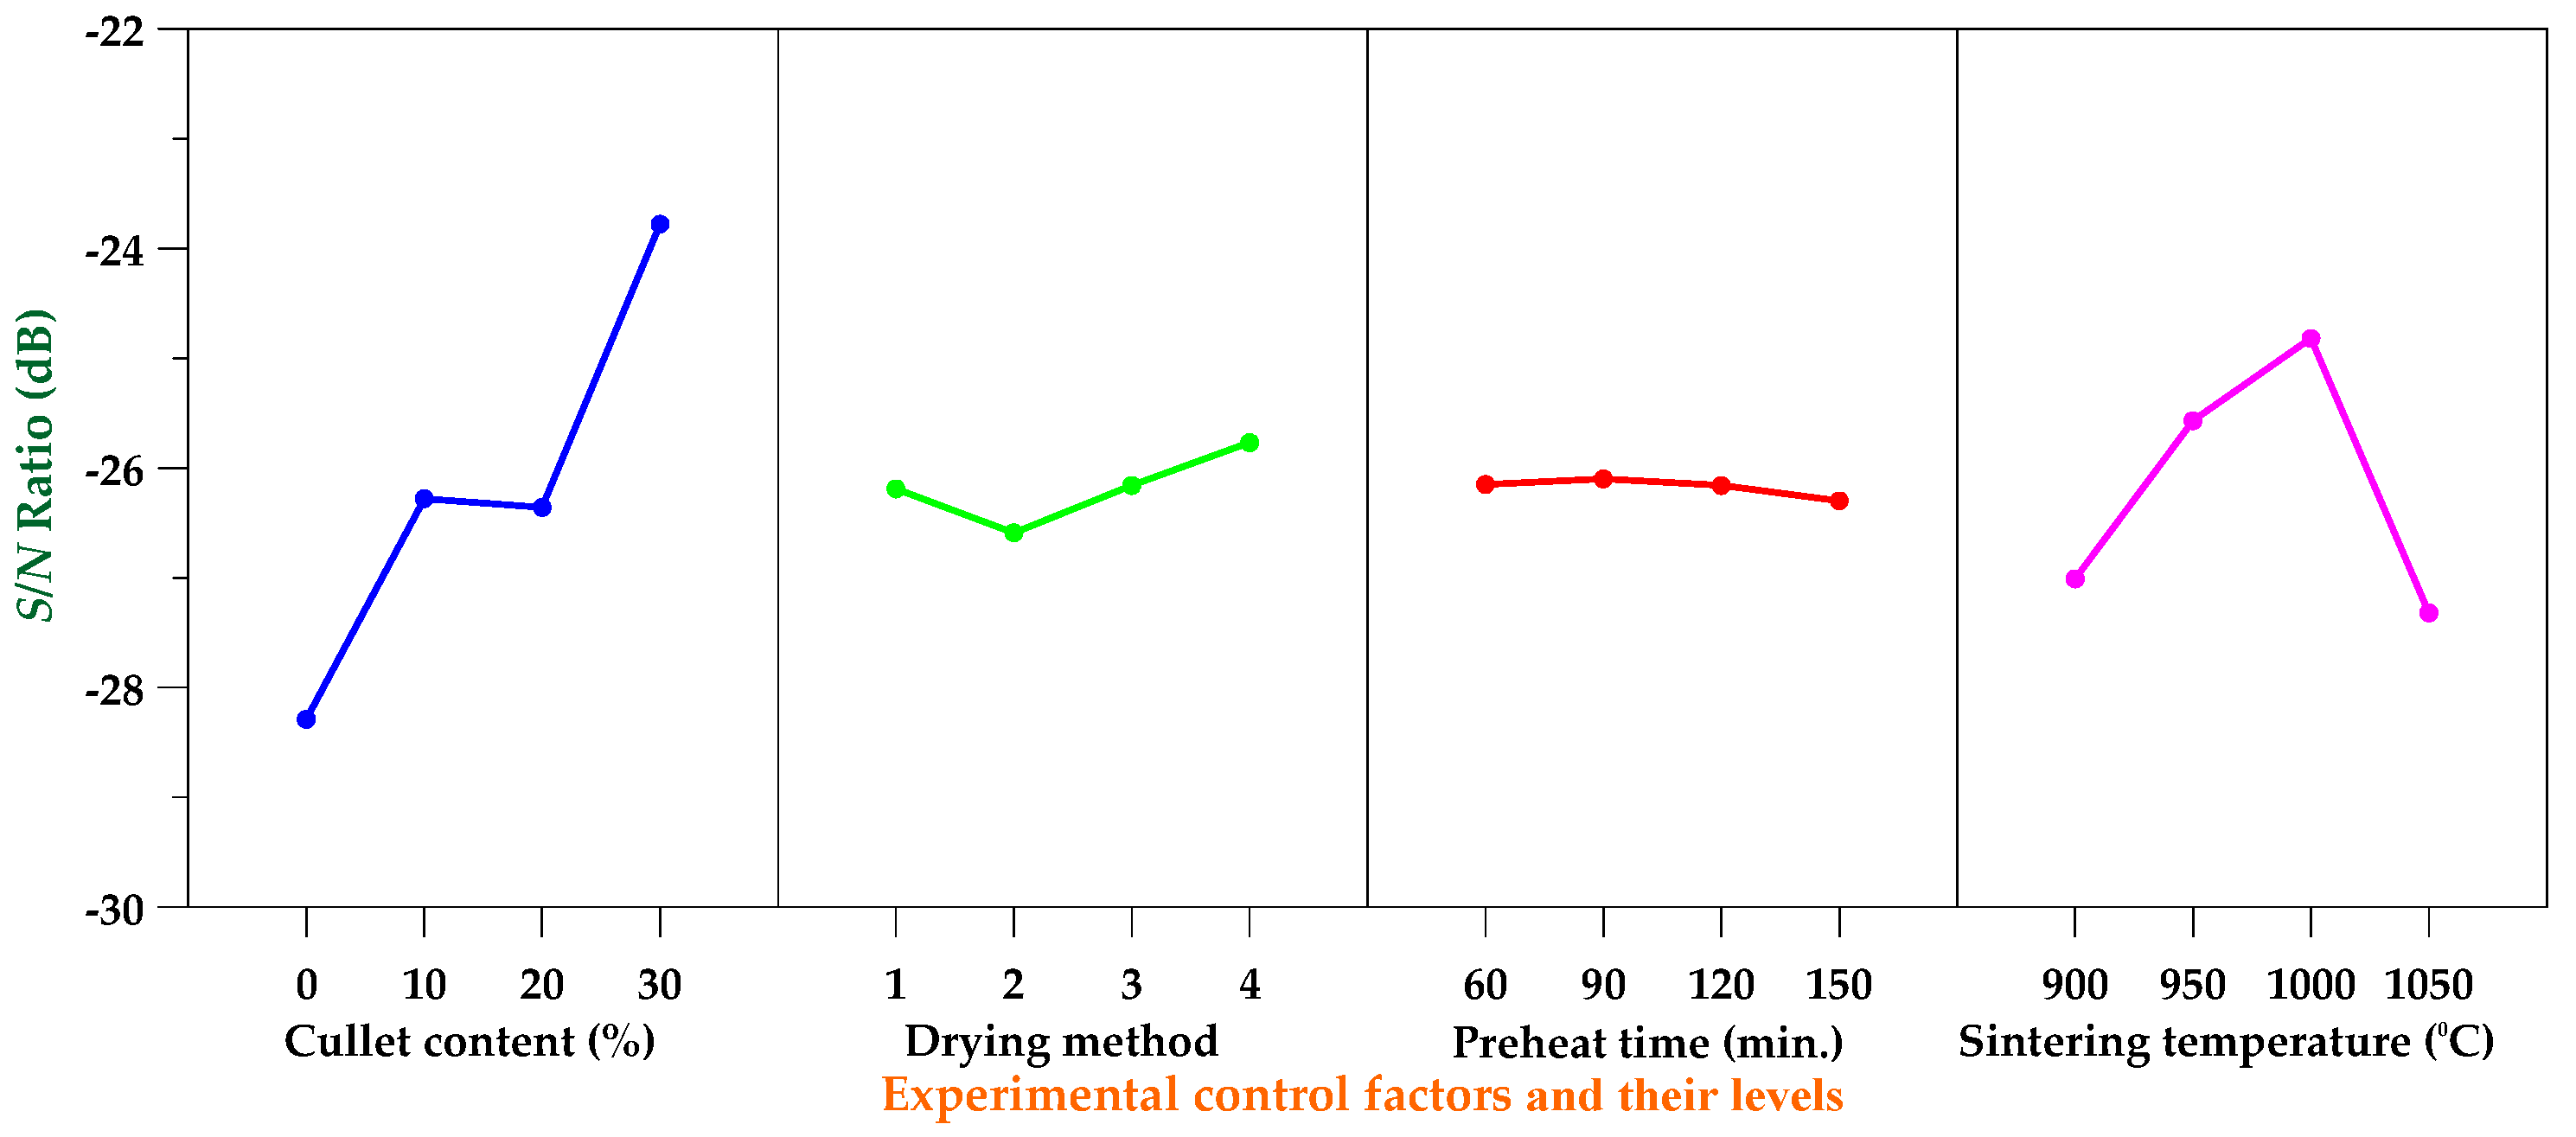
It can be seen from Table 6 that the water absorption of the produced bricks ranged between 12.5% and 30.3%. According to CNS 382 [41], the water absorption of building bricks requires that first-class bricks have water absorption of 15% or less for 24 h, and second-class bricks must have a water absorption of 19% or less for 24 h. The lowest value of water absorption was around 12.5%. The mean S/N ratios at each level of the parameters for water absorption are shown in Table 9. In addition, Figure 5 shows the S/N response graph for water absorption. As can be seen from Table 9 and Figure 5, the cullet content was the most critical factor affecting water absorption, and the maximum value of response was at the highest level of cullet content. Further, the larger the amount of the added TFT-LCD waste glass powder, the lower the water absorption of the resulting bricks. The reason for this is that increasing the cullet content promoted the formation of the liquid phase of glass, which contributed to the densification of the bricks, thereby reducing the water absorption [40]. The results of the ANOVA of water absorption are given in Table 10. As can be clearly seen from Table 10, the cullet content was the most significant factor that contributed to the total water absorption of the brick. Besides this, the sintering temperature was also an important factor affecting the water absorption of the bricks. This is because a higher sintering temperature ensures the completion of the crystallization process and closes the open pores in the sinter. According to Table 10, the parameters in order of importance were cullet content (58.57%), sintering temperature (23.93%), drying method (1.77%), and preheat time (0.61%). Therefore, based on the results of the S/N ratio and ANOVA analyses, the optimal combination of parameters and their levels for achieving minimum water absorption is A4B4C2D3.
3.4. Shrinkage Ratio
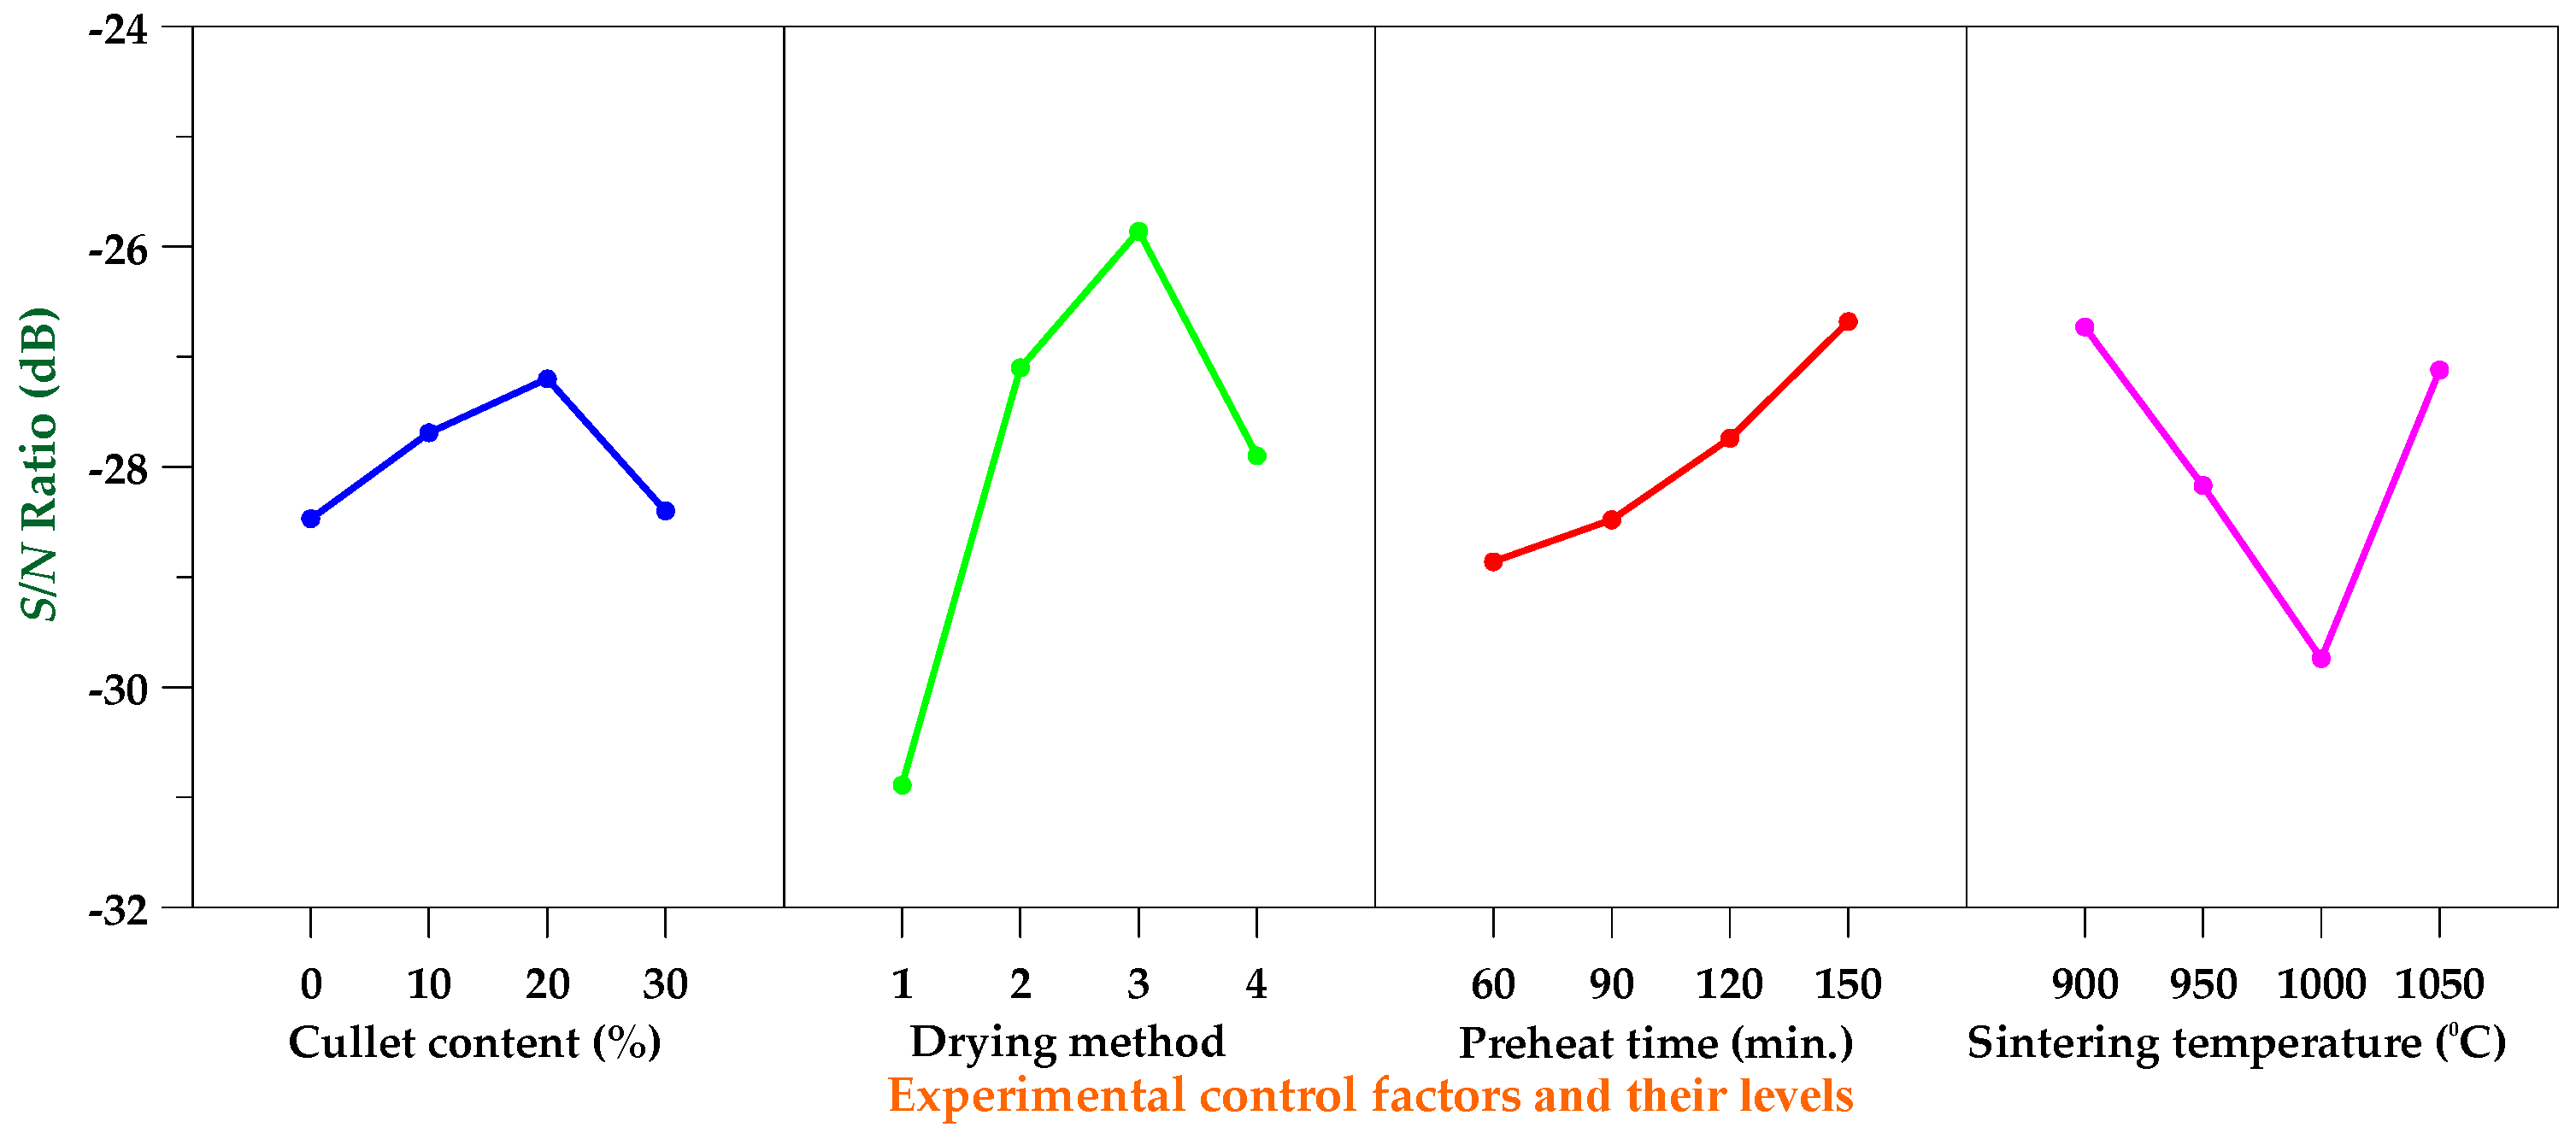
As can be seen from Table 6, the shrinkage ratio of the produced bricks ranged between 12.5% and 47.6%. Besides this, the mean S/N ratios at each level of the parameters for the shrinkage ratio are shown in Table 11, and the S/N response graph for shrinkage ratio is shown in Figure 6. As can be seen from Table 11 and Figure 6, the drying method was the most important factor affecting shrinkage, and the maximum value of response was drying method 3. On the other hand, the results of the ANOVA of shrinkage ratio are given in Table 12. According to the analysis results of Table 12, the main parameters were drying method (48.44%), preheat time (27.63%), and sintering temperature (16.55%). Based on the results of the S/N ratio and ANOVA analyses, the optimal combination of parameters and their levels for achieving minimum shrinkage ratio is A3B3C4D1.
3.5. Loss on Ignition
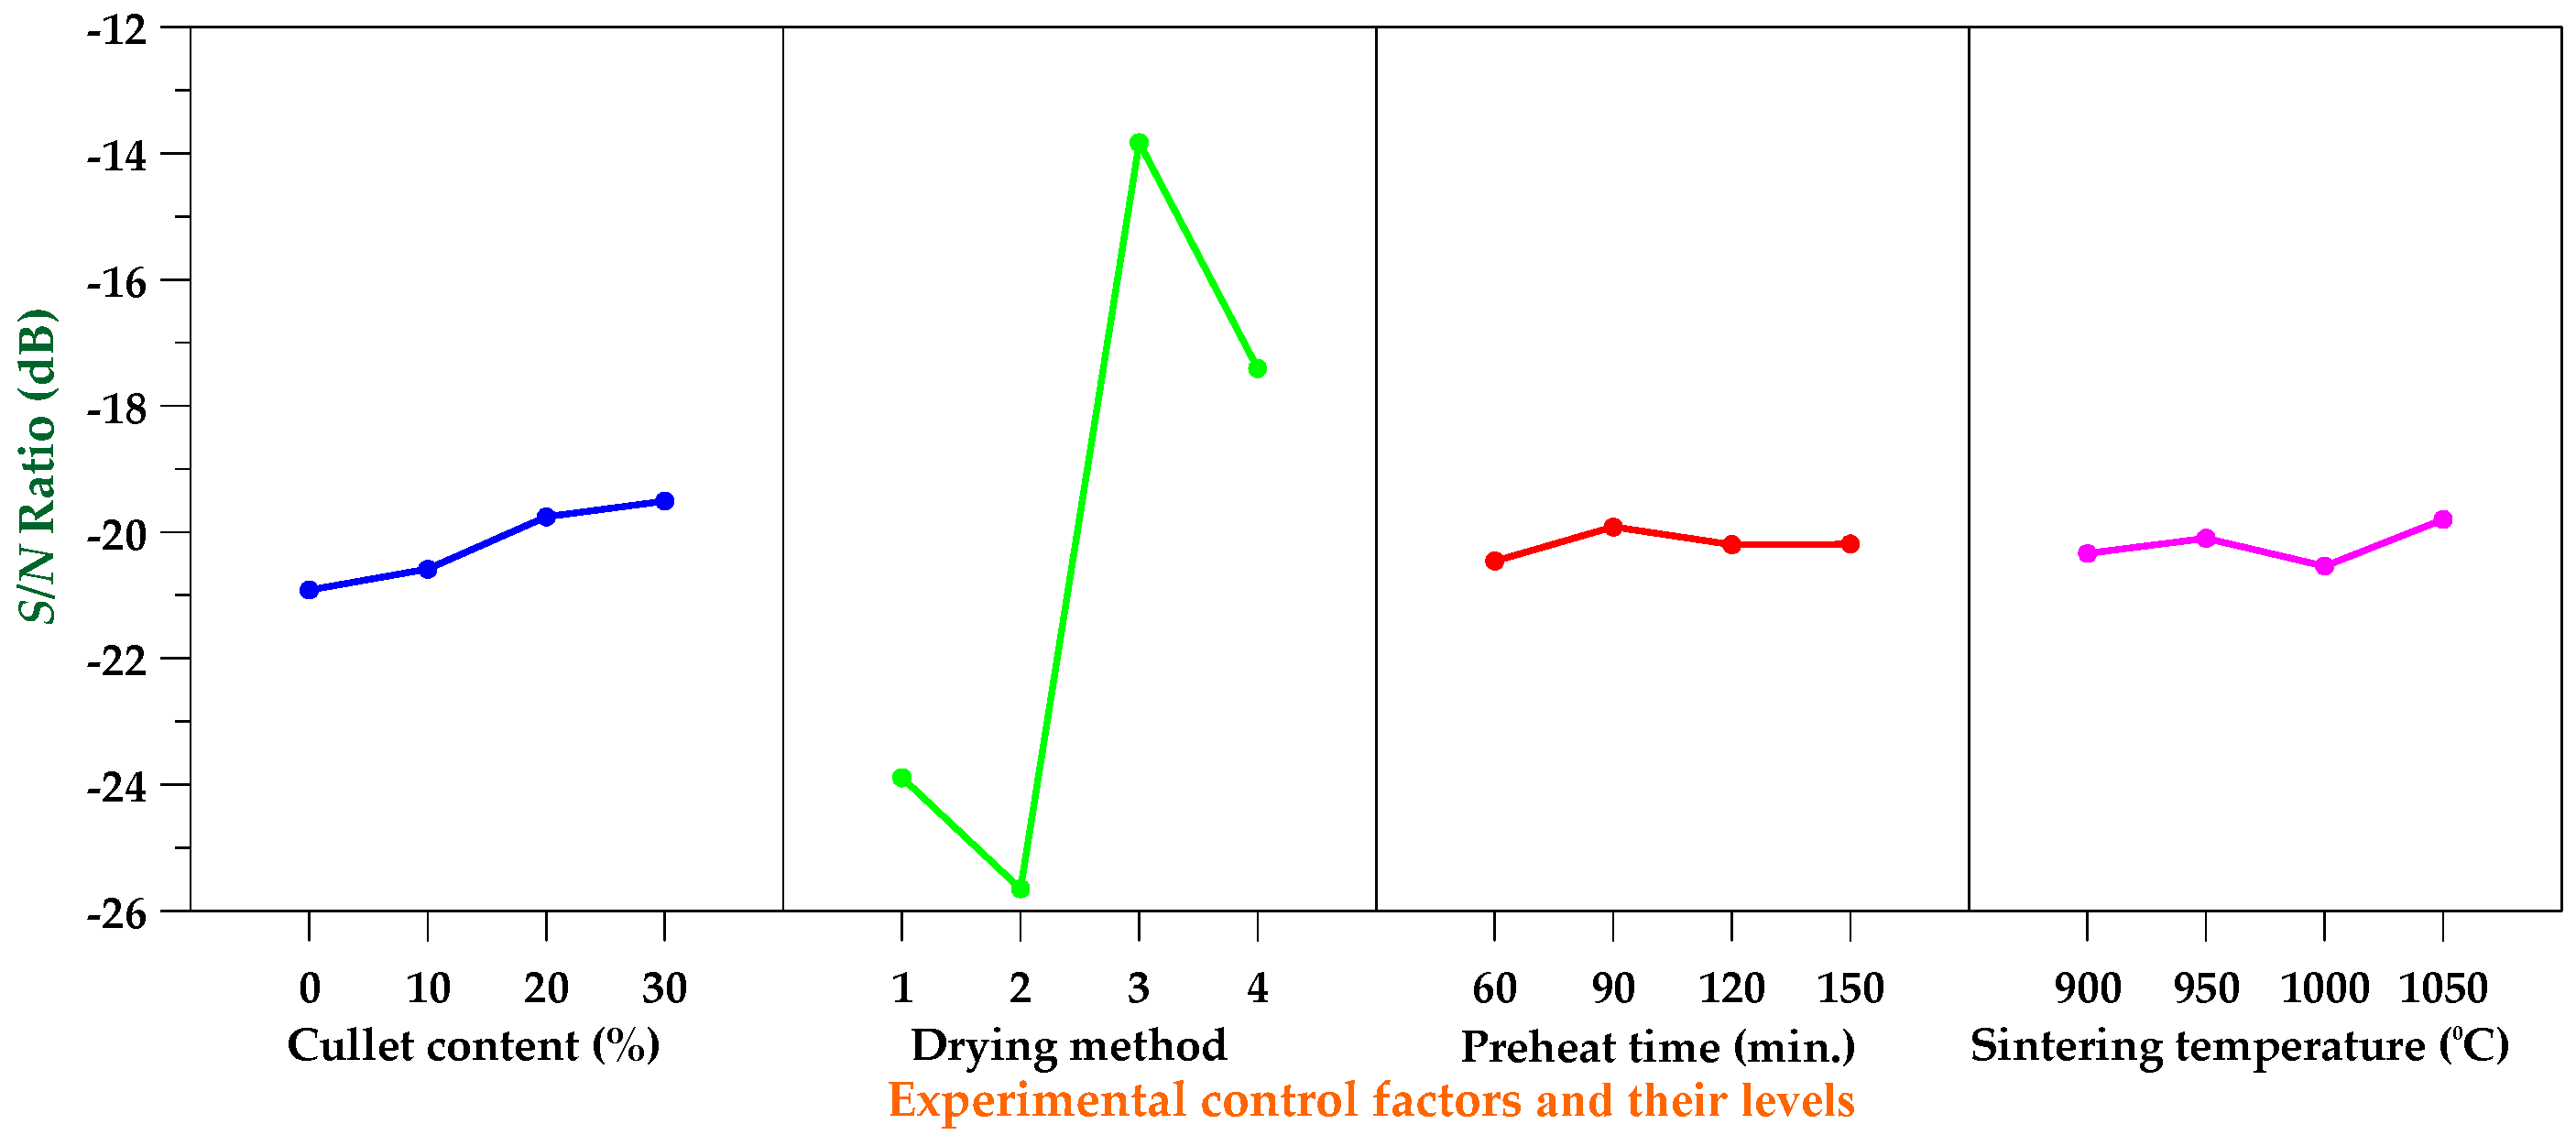
The loss on ignition of the produced bricks ranged between 4.1% and 20.6%, as shown in Table 6. Further, the mean S/N ratios for each level of the parameters for loss on ignition are shown in Table 13, and the S/N response graph for loss on ignition is shown in Figure 7. As can be seen from Table 13, the drying method was the most significant factor in controlling ignition loss. The results of the ANOVA for loss on ignition are shown in Table 14. According to the analysis results of Table 14, the parameters in order of importance were drying method (97.79%), cullet content (1.28%), preheat time (0.76%), and sintering temperature (0.18%). Based on the results of the S/N ratio and ANOVA analyses, the optimal combination of parameters and their levels for achieving minimum loss on ignition is A4B3C2D4.
3.6. Porosity
From Table 6, it is clear that the porosity of the produced bricks ranged between 20.1% and 42.7%. Moreover, Table 15 shows the mean S/N ratio for each level of the parameters for porosity, and Figure 8 shows the S/N response graph for porosity. From Table 15, it can be seen that the cullet content was the most significant factor in controlling porosity. The reason for this is that increasing the cullet content promoted the formation of the liquid phase of glass, which contributed to reducing the voids and pore volume in the brick [40]. The results of the ANOVA for porosity are given in Table 16. The parameters in order of importance were cullet content (53.16%), sintering temperature (26.57%), drying method (2.48%), and preheat time (1.23%). Based on the results of the S/N ratio and ANOVA analyses, the optimal combination of parameters and their levels for achieving minimum porosity is A4B4C1D3.
3.7. Compressive Strength
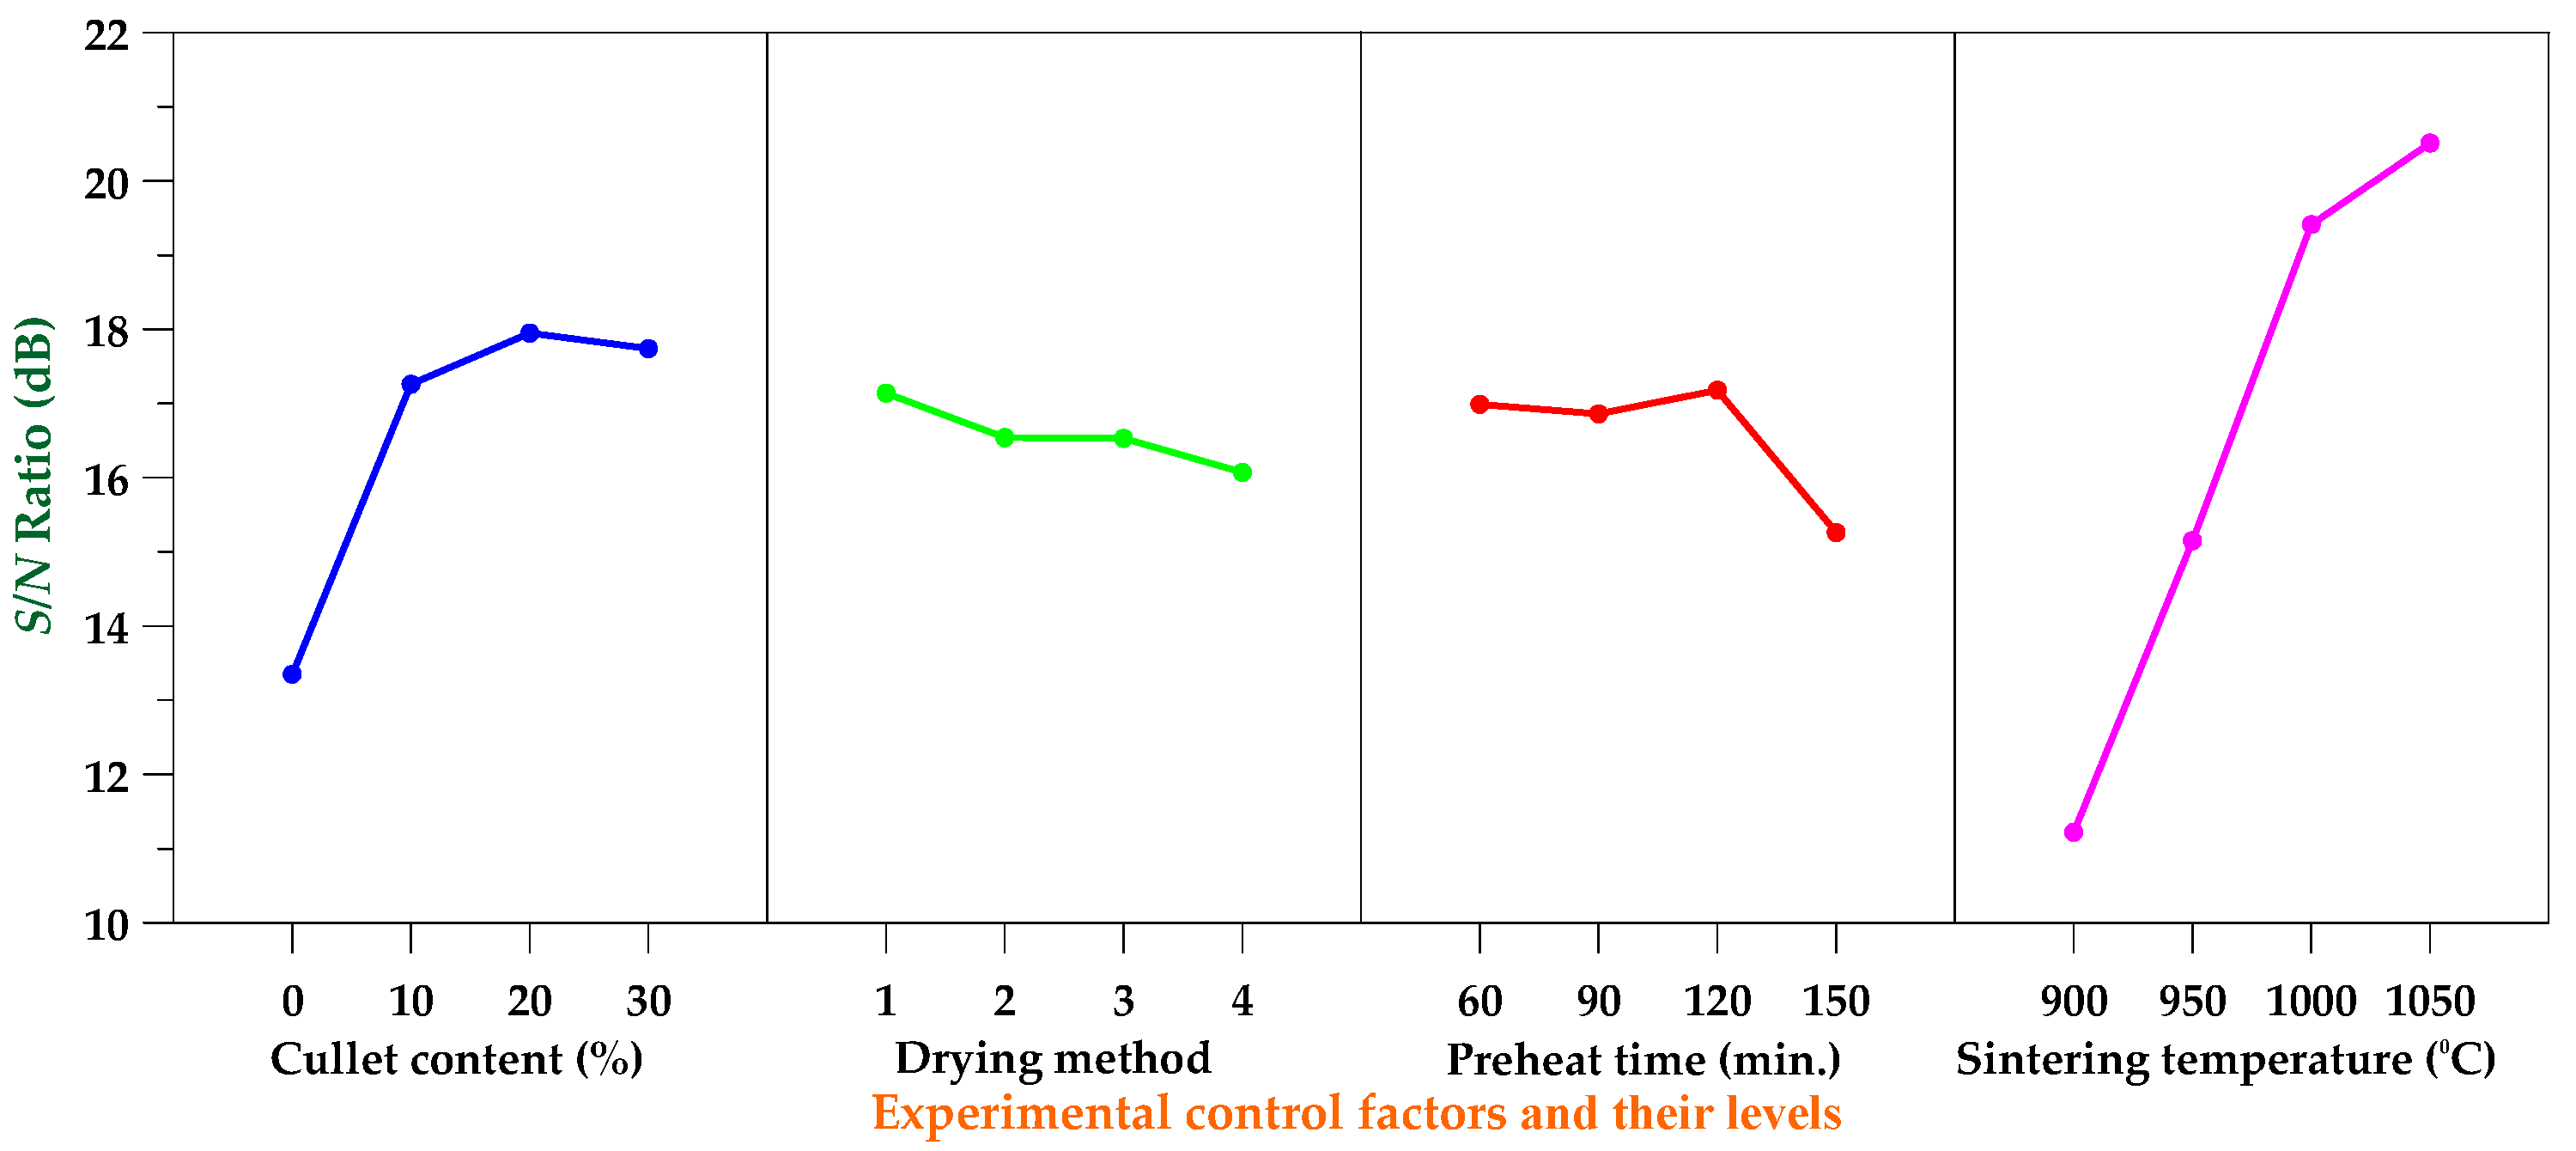
From Table 6, it is clear that the compressive strength of the produced bricks ranged between 3.31 and 14.7 MPa. Moreover, Table 17 shows the mean S/N ratio for each level of the parameters for compressive strength, and Figure 9 shows the S/N response graph for compressive strength. From Table 17, it can be seen that the sintering temperature was the most significant factor in controlling compressive strength. Tay et al. [42] pointed out that the clays used to make bricks are low in refractoriness, and vitrification occurs at approximately 1100 °C. The resulting viscous bodies reduce porosity and form bonds between the particles, resulting in better strength and hardness of the bricks. The aforementioned phenomenon is generally referred to as porcelainizing. After the brick was porcelainized, it turned from red to grayish black with a glassy phase. From Table 17 and Figure 9, it can be seen that as the sintering temperature increased, the bond between the particles became larger, the pores in the sintered body were reduced, and the compactness was improved, so that the compressive strength of the brick increased. In other words, as the roasting temperature of the brick increased, the compressive strength of the resulting brick increased. In addition, the greater the amount of TFT-LCD waste glass powder, the greater the compressive strength of the brick. The reason for this is that increasing the cullet content can reduce the porosity of bricks by closing the internal pores with a glassy phase [40]. The results of the ANOVA for compressive strength are given in Table 18. The parameters in order of importance were sintering temperature (71.28%), cullet content (17.98%), and preheat time (6.19%). As a result, according to the results of the S/N ratio and ANOVA analyses, the optimal combination of parameters and their levels for achieving maximum compressive strength is A3B1C3D4.
3.8. Microscopic Analysis of Bricks
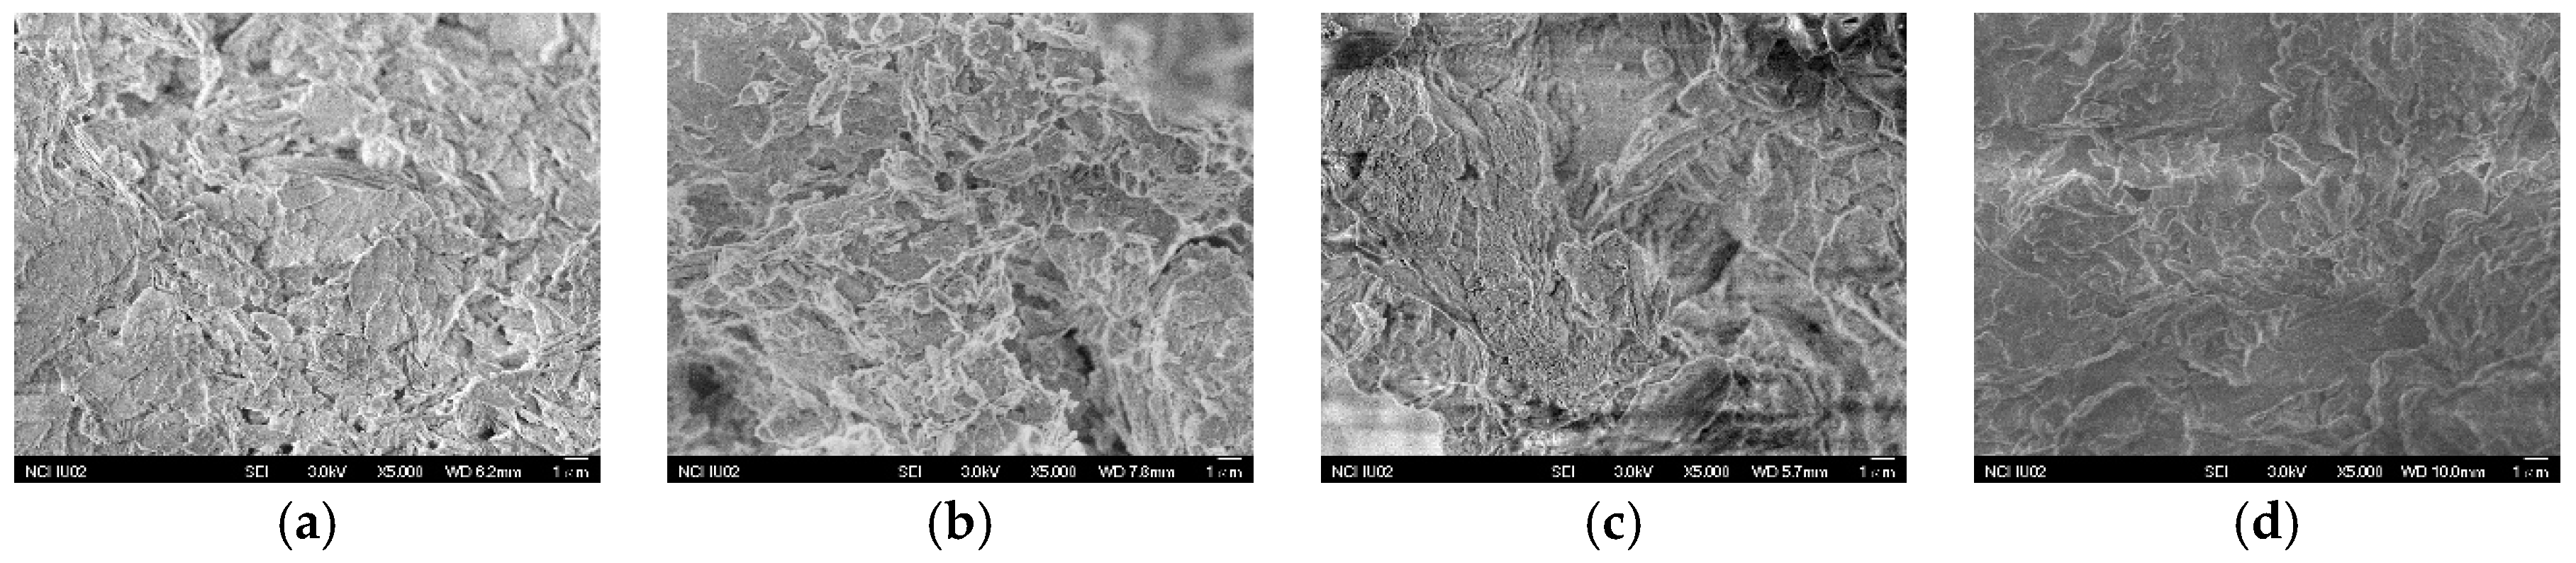
Scanning electron microscopy (SEM) was employed to determine the morphology and microstructure of the bricks and capture high-resolution digital images. The comparison of SEM images of sintered specimens with pure reservoir sediments (experimental numbers G1–G4) is shown in Figure 10. From Figure 10a,b, it can be seen that when the sintering temperature was between 900 and 950 °C, due to the fact that the temperature required for densification had not yet been reached, the bonding between some powders was not satisfactory. Therefore, the brick specimen was highly porous. In contrast, as can be seen from Figure 10c, when the sintering temperature was increased to 1000 °C, the powder was provided with a higher neck growth power, resulting in faster interparticle adhesion and distance reduction, and the inside of the brick specimen also showed densification. Further, when the sintering temperature was increased to 1050 °C, the high temperature promoted diffusion between the particles of the specimen, resulting in a sufficient viscous amorphous glass phase, which could fill the pores between the original particles and gradually cut off the connection between the pores, as shown in Figure 10d. The fusing together of the clay particles in fired bricks resulted in pore closure, which ultimately led to a reduction in porosity.
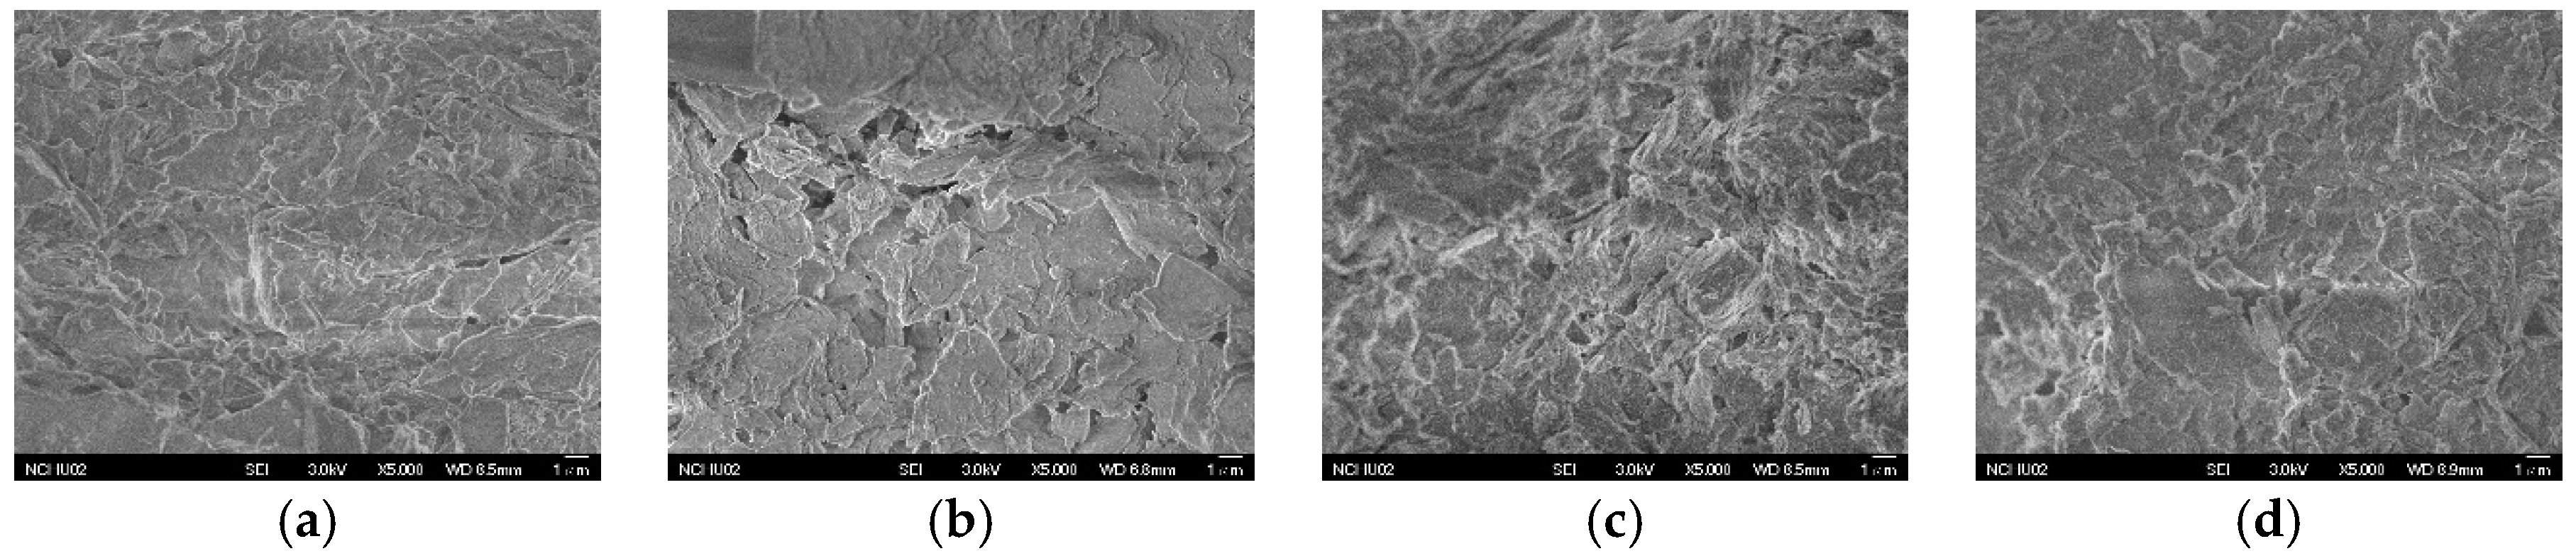
On the other hand, comparing the SEM images of the specimens with the same waste glass content (experimental numbers G9–G12), it can be seen that the internal compactness of the sintered specimen also had a close relationship with the sintering temperature, as shown in Figure 11. It is clear from Figure 11 that the glassy phase was evenly distributed in the clay body. At 900 °C, the temperature did not reach the sintering point and the interparticle bonding was poor. After sintering at a high temperature (1050 °C), the pores between particles were filled due to diffusion and viscous flow, and bonds were formed between the particles in the sintered brick, which could increase the degree of densification and further increase the compressive strength of the brick.
3.9. Performance of Fired Bricks in Tunnel Kiln
After laboratory-scale brick firing, the best combination was selected based on the pore structure, physical properties, and mechanical properties of the bricks, and a commercial tunnel kiln was used to burn the bricks. The brick-fired tunnel kiln was mainly composed of three parts: preheating, firing, and cooling. It was a continuous moving ware kiln where the clay products to be fired were passed on trolleys through a long horizontal tunnel. The tunnel kiln was 2 m high and 2.2 m wide, with a total length of 130 m. The main focus was on mass production technologies such as raw material processing, brick embryo manufacturing, and firing parameter adjustment (such as sintering temperature, trolley speed, and kiln atmosphere). In addition, the quality of the fired bricks was examined to verify the feasibility of mass production of bricks by incorporating TFT-LCD waste glass powder with reservoir sediments.
Regarding the performance requirements of bricks in building construction, more attention is paid to their compressive strength and water absorption. Taking CNS 382 for first-class bricks as an example, the compressive strength should be greater than 14.7 MPa and the water absorption should be less than 15% [41]. According to Table 9 and Table 10, the optimal combination of the lowest obtainable water absorption is estimated to be A4B4C2D3, and according to Table 17 and Table 18, the optimal combination of the maximum compressive strength is estimated to be A3B1C3D4. In view of this, an experimental combination of fired bricks in the tunnel kiln was proposed. The process conditions are shown in Table 19. Among them, P1 is the optimal combination for producing bricks with the lowest water absorption rate, and P2 is the optimal combination for producing bricks with the highest compressive strength.
The test results of the fired bricks in the tunnel kiln are shown in Table 20. From Table 20, it can be seen that the water absorption and compressive strength of the two finished bricks met the requirements of CNS 382 [41]. Among them, experiment number P1 can obtain a lower water absorption rate (12.9%); experiment number P2 can obtain a higher compressive strength (48.2 MPa) and a larger rupture modulus (0.68 MPa). In addition, the density of the two finished bricks was similar—about 2.2 g/cm3. Compared with the results of the laboratory-scale test, the fired bricks in the tunnel kiln had a higher density and a smaller water absorption. Basically, the cost of bricks for a brick kiln factory includes clay fees, personnel operation and management fees, fuel fees, and transportation fees. However, the use of TFT-LCD waste glass and reservoir sediments to manufacture bricks does not require material fees, and waste disposal fees (government subsidies) are available. Therefore, at least 40% of the cost of each brick can be reduced. This not only solves the problem of disposal of a large amount of TFT-LCD waste glass and reservoir sediments, but also creates a new turning point for the transformation of the brickmaking industry.
4. Conclusions
In the current study, the common composition of clay bricks was partially replaced by 10%, 20%, and 30% of recycled TFT-LCD waste glass. Based on the above results and discussion, the following conclusions were drawn:
- Increasing content of TFT-LCD waste glass decreased the water absorption and increased the compressive strength of the fired bricks.
- The sintering temperature was the most significant factor in controlling the compressive strength of the fired bricks.
- The water absorption and compressive strength of the fired bricks in the tunnel kiln were in line with the requirements of CNS 382 for first-class bricks.
- The use of TFT-LCD waste glass and reservoir sediments to manufacture bricks will entail a cost reduction for the bricks because government subsidies will be available in Taiwan. Therefore, the cost per brick can be reduced by at least 40%.
Funding
This research received no external funding.
Acknowledgments
The author expresses his gratitude and sincere appreciation to the Ministry of Science and Technology, Taiwan, for financing this research work.
Conflicts of Interest
The author declares no conflict of interest.
References
- Somayaji, S. Civil Engineering Materials; Prentice Hall: Upper Siddle River, NJ, USA, 2001. [Google Scholar]
- Letelier, V.; Ortega, J.M.; Muñoz, P.; Tarela, E.; Moriconi, G. Influence of waste brick powder in the mechanical properties of recycled aggregate concrete. Sustainability 2018, 10, 1037. [Google Scholar] [CrossRef]
- Švajlenka, J.; Kozlovská, M. Houses based on wood as an ecological and sustainable housing alternative—Case study. Sustainability 2018, 10, 1502. [Google Scholar] [CrossRef]
- Wu, F.; Li, L.H.; Han, S.Y. Social sustainability and redevelopment of urban villages in China: A case study of Guangzhou. Sustainability 2018, 10, 2116. [Google Scholar] [CrossRef]
- Zavadskas, E.K.; Antucheviciene, J.; Vilutiene, T.; Adeli, H. Sustainable decision-making in civil engineering, construction and building technology. Sustainability 2018, 10, 14. [Google Scholar] [CrossRef]
- Alnahhal, M.F.; Alengaram, U.J.; Jumaat, M.Z.; Alqedra, M.A.; Mo, K.H.; Sumesh, M. Evaluation of industrial by-products as sustainable pozzolanic materials in recycled aggregate concrete. Sustainability 2017, 9, 767. [Google Scholar] [CrossRef]
- Fernandes, F.M.; Lourenço, P.B.; Castro, F.M. Ancient clay bricks: Manufacture and properties. In Materials, Technologies and Practice in Historic Heritage Structures; Springer Science & Business Media: Berlin, Germany, 2010; pp. 29–48. [Google Scholar]
- Shakir, A.A.; Mohammed, A.A. Manufacturing of bricks in the past, in the present and in the future: A state of the art review. Int. J. Adv. Appl. Sci. 2013, 2, 145–156. [Google Scholar] [CrossRef]
- Harrison, T.W. Full Scale Operational Trials Involving the Use of Recycled Glass Additions to Clay Bricks Fired through a Tunnel Kiln; The Waste & Resources Action Programme: Banbury, UK, 2005; ISBN 1-84405-219-2. [Google Scholar]
- Smith, A.S. To Demonstrate Commercial Viability of Incorporating Ground Glass in Bricks With Reduced Emissions and Energy Savings; WRAP R&D Report GLA2-018; WRAP: Banbury, UK, 2004; ISBN 1-84405-101-3. [Google Scholar]
- Smith, A.S. Glass Addition Trials: York Handmade Bricks Co Ltd.; The Waste & Resources Action Programme: Banbury, UK, 2005; ISBN 1-84405-203-6. [Google Scholar]
- Rahman, M.E.; Ong, P.J.; Nabinejad, O.; Islam, S.; Khandoker, N.A.N.; Pakrashi, V.; Shorowordi, K.M. Utilization of blended waste materials in bricks. Technologies 2018, 6, 20. [Google Scholar] [CrossRef]
- Rahman, M.E.; Boon, A.; Muntohar, A.S.; Tanim, M.N.H.; Pakrashi, V. Performance of bricks incorporating palm oil fuel ash. J. Clean. Prod. 2014, 78, 195–201. [Google Scholar] [CrossRef]
- Muntohar, A.S.; Rahman, M.E. Lightweight masonry block from oil palm kernel shell. Constr. Build. Mater. 2014, 54, 477–484. [Google Scholar] [CrossRef]
- Ean, L.W.; Marlinda, A.M.; Bashar, S.M.; Tang, C.W.; Muhammad, T.T. Experimental study on compressive strength of sediment brick masonry. AIP Conf. Proc. 2018, 1930, 020017. [Google Scholar] [CrossRef]
- Kirby, R. Potential Energy Savings from the Use of Recycled Glass in Brick Manufacturing; Center for Environmental Economic Development: Arcata, CA, USA, 2006. [Google Scholar]
- British Standards Institute. PAS 102. Specification for Processed Glass for Selected Secondary End Markets; British Standards Institute: London, UK, 2004; ISBN 0-580-42588-1. [Google Scholar]
- Bernd, W.; Carl, F.S. Utilization of sewage sludge ash in the brick and tile industry. Water Sci. Technol. 1997, 36, 251–258. [Google Scholar]
- Nagaharu, O.; Shiro, T. Full scale application of manufacturing bricks from sewage. Wat. Sci. Technol. 1997, 36, 243–250. [Google Scholar]
- Leshina, V.A.; Pivnev, A.L. Ceramic wall material using glass waste. Glass Ceram. 2002, 59, 356–358. [Google Scholar] [CrossRef]
- Safiuddin, M.; Jumaat, M.Z.; Salam, M.A.; Islam, M.S.; Hashim, R. Utilization of solid wastes in construction materials. Int. J. Phys. Sci. 2010, 5, 1952–1963. [Google Scholar]
- Demir, I. Reuse of waste glass in building brick production. Waste Manag. Res. 2009, 27, 572–577. [Google Scholar] [CrossRef] [PubMed]
- Algin, H.M.; Turgut, P. Cotton and limestone powder wastes as brick material. Constr. Build. Mater. 2008, 22, 1074–1080. [Google Scholar] [CrossRef]
- Chidiac, S.E.; Federico, L.M. Effects of waste glass additions on the properties and durability of fired clay brick. Can. J. Civil Eng. 2007, 34, 1458–1466. [Google Scholar] [CrossRef]
- Dondi, M.; Guarini, G.; Raimondo, M.; Zanelli, C. Recycling of PC and TV glass in clay bricks and roof tiles. Waste Manag. 2009, 29, 1945–1951. [Google Scholar] [CrossRef] [PubMed] [Green Version]
- Lin, K.L. The effect of heating temperature of thin film transistor-liquid crystal display (TFT-LCD) optical waste glass as a partial substitute partial for clay in eco-brick. J. Clean. Prod. 2007, 15, 1755–1759. [Google Scholar] [CrossRef]
- Dalkılıçn, N.; Nabikoğlu, A. Traditional manufacturing of clay brick used in the historical buildings of Diyarbakir (Turkey). Front. Arch. Res. 2017, 6, 346–359. [Google Scholar] [CrossRef]
- Hegazy, B.E.D.E.; Fouad, H.A.; Hassanain, A.M. Incorporation of water sludge, silica fume, and rice husk ash in brick making. Adv. Environ. Res. 2012, 1, 83–96. [Google Scholar] [CrossRef]
- Loryuenyong, V.; Panyachai, T.; Kaewsimork, K.; Siritai, C. Effects of recycled glass substitution on the physical and mechanical properties of clay bricks. Waste Manag. 2009, 29, 2717–2721. [Google Scholar] [CrossRef] [PubMed]
- Salim, R.W.; Ndambuki, J.M.; Adedokun, D.A. Improving the bearing strength of sandy loam soil compressed earth block bricks using sugercane bagasse ash. Sustainability 2014, 6, 3686–3696. [Google Scholar] [CrossRef]
- Taguchi, G. Introduction to Quality Engineering: Designing Quality into Products and Processes; Asian Productivity Organization: Tokyo, Japan, 1987. [Google Scholar]
- Roy, R.K. A Primer on the Taguchi Method; Van Nostrand Reinhold: New York, NY, USA, 1990. [Google Scholar]
- Roy, R.K. Design of Experiments Using the Taguchi Approach; John Wiley & Sons Inc.: New York, NY, USA, 2001. [Google Scholar]
- Taguchi, G.; Chowdhury, S.; Wu, Y. Taguchi’s Quality Engineering Handbook; John Wiley & Sons Inc.: New York, NY, USA, 2005. [Google Scholar]
- CNS 1127. Method of Test for General Type of Bricks for Buildings; Bureau of Standards, Metrology & Inspection, M.O.E.A., R.O.C.: Taipei, Taiwan, 1959. [Google Scholar]
- ASTM C67/C67M-18. Standard Test Methods for Sampling and Testing Brick and Structural Clay Tile; ASTM International: West Conshohocken, PA, USA, 2018. [Google Scholar]
- Neville, A.M. Properties of Concrete; Longman: Harlow, Essex, UK, 1994. [Google Scholar]
- Chen, H.J.; Chang, S.N.; Tang, C.W. Application of the Taguchi Method for Optimizing the Process Parameters of Producing Lightweight Aggregates by Incorporating Tile Grinding Sludge with Reservoir Sediments. Materials 2017, 10, 1294. [Google Scholar] [CrossRef] [PubMed]
- Ardeshir, A.; Farnood Ahmadi, P. A synopsis about production of brick from lightweight and waste material—A review. Mat. Civil. Eng. 2016, 1, 143–163. [Google Scholar]
- Peña, P.P.; Lozano, M.A.G.; Pulido, A.R.; Castro, R.H.L.; Jurado, Z.V.Q.; Medina, J.C.P.; Vázquez, M.E.P.; Torres, A.V. Effect of crushed glass cullet sizes on physical and mechanical properties of red clay bricks. Adv. Mater. Sci. Eng. 2016. [Google Scholar] [CrossRef]
- CNS 382. Bricks for Buildings; Bureau of Standards, Metrology & Inspection, M.O.E.A., R.O.C.: Taipei, Taiwan, 1978. [Google Scholar]
- Tay, J.H.; Goh, A.T.C. Engineering properties of incinerator reside. J. Environ. Eng. 1991, 117, 224–235. [Google Scholar] [CrossRef]
Figure 1.
Raw materials. (a) Original thin-film transition liquid crystal display (TFT-LCD) waste glass; (b) Refined TFT-LCD glass powder; (c) Original reservoir sediments; (d) Refined reservoir sediments.
Figure 1.
Raw materials. (a) Original thin-film transition liquid crystal display (TFT-LCD) waste glass; (b) Refined TFT-LCD glass powder; (c) Original reservoir sediments; (d) Refined reservoir sediments.
Figure 2.
Raw material mix. (a) Dry mix; (b) Water mixing; (c) Well-proportioned embryo.
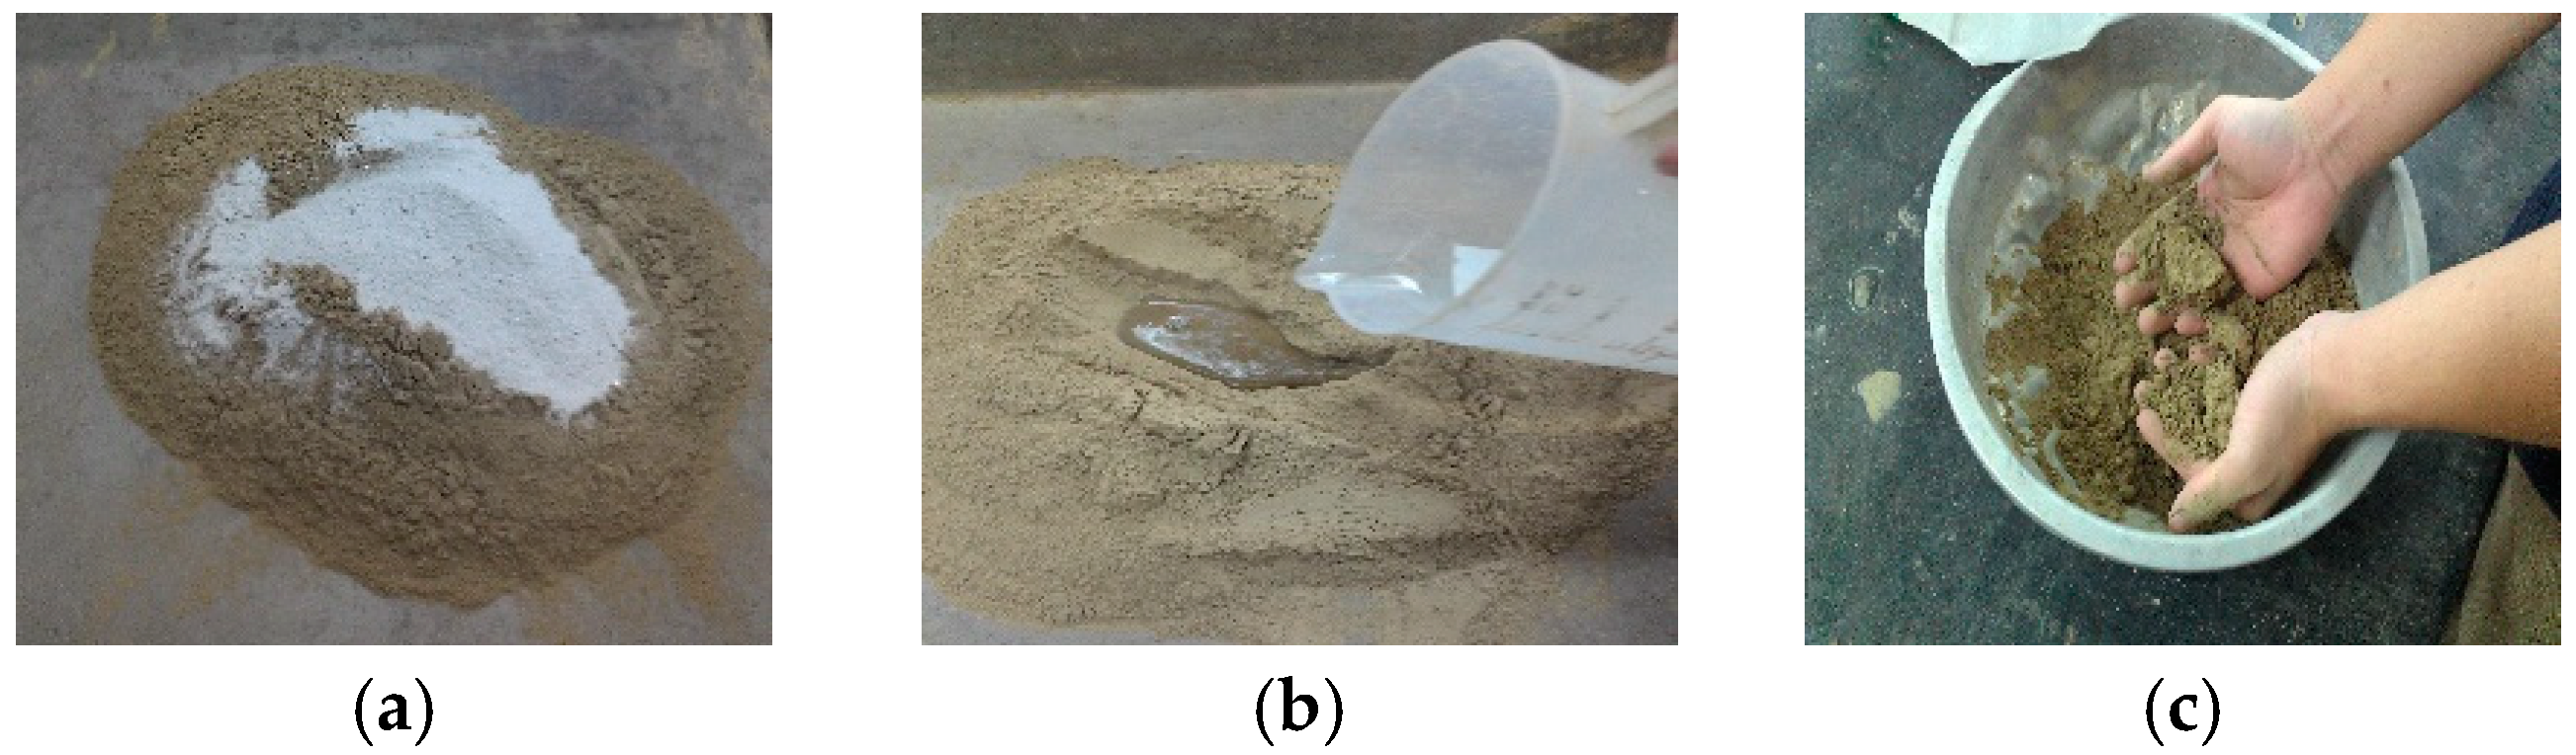
Figure 3.
Grain size distributions of TFT-LCD waste glass and reservoir sediments. (a) Refined TFT-LCD glass powder; (b) Refined reservoir sediment.
Figure 3.
Grain size distributions of TFT-LCD waste glass and reservoir sediments. (a) Refined TFT-LCD glass powder; (b) Refined reservoir sediment.

Figure 4.
S/N response graph for density.
Figure 5.
S/N response graph for water absorption.

Figure 6.
S/N response graph for shrinkage ratio.
Figure 7.
S/N response graph for loss on ignition.
Figure 8.
S/N response graph for porosity.
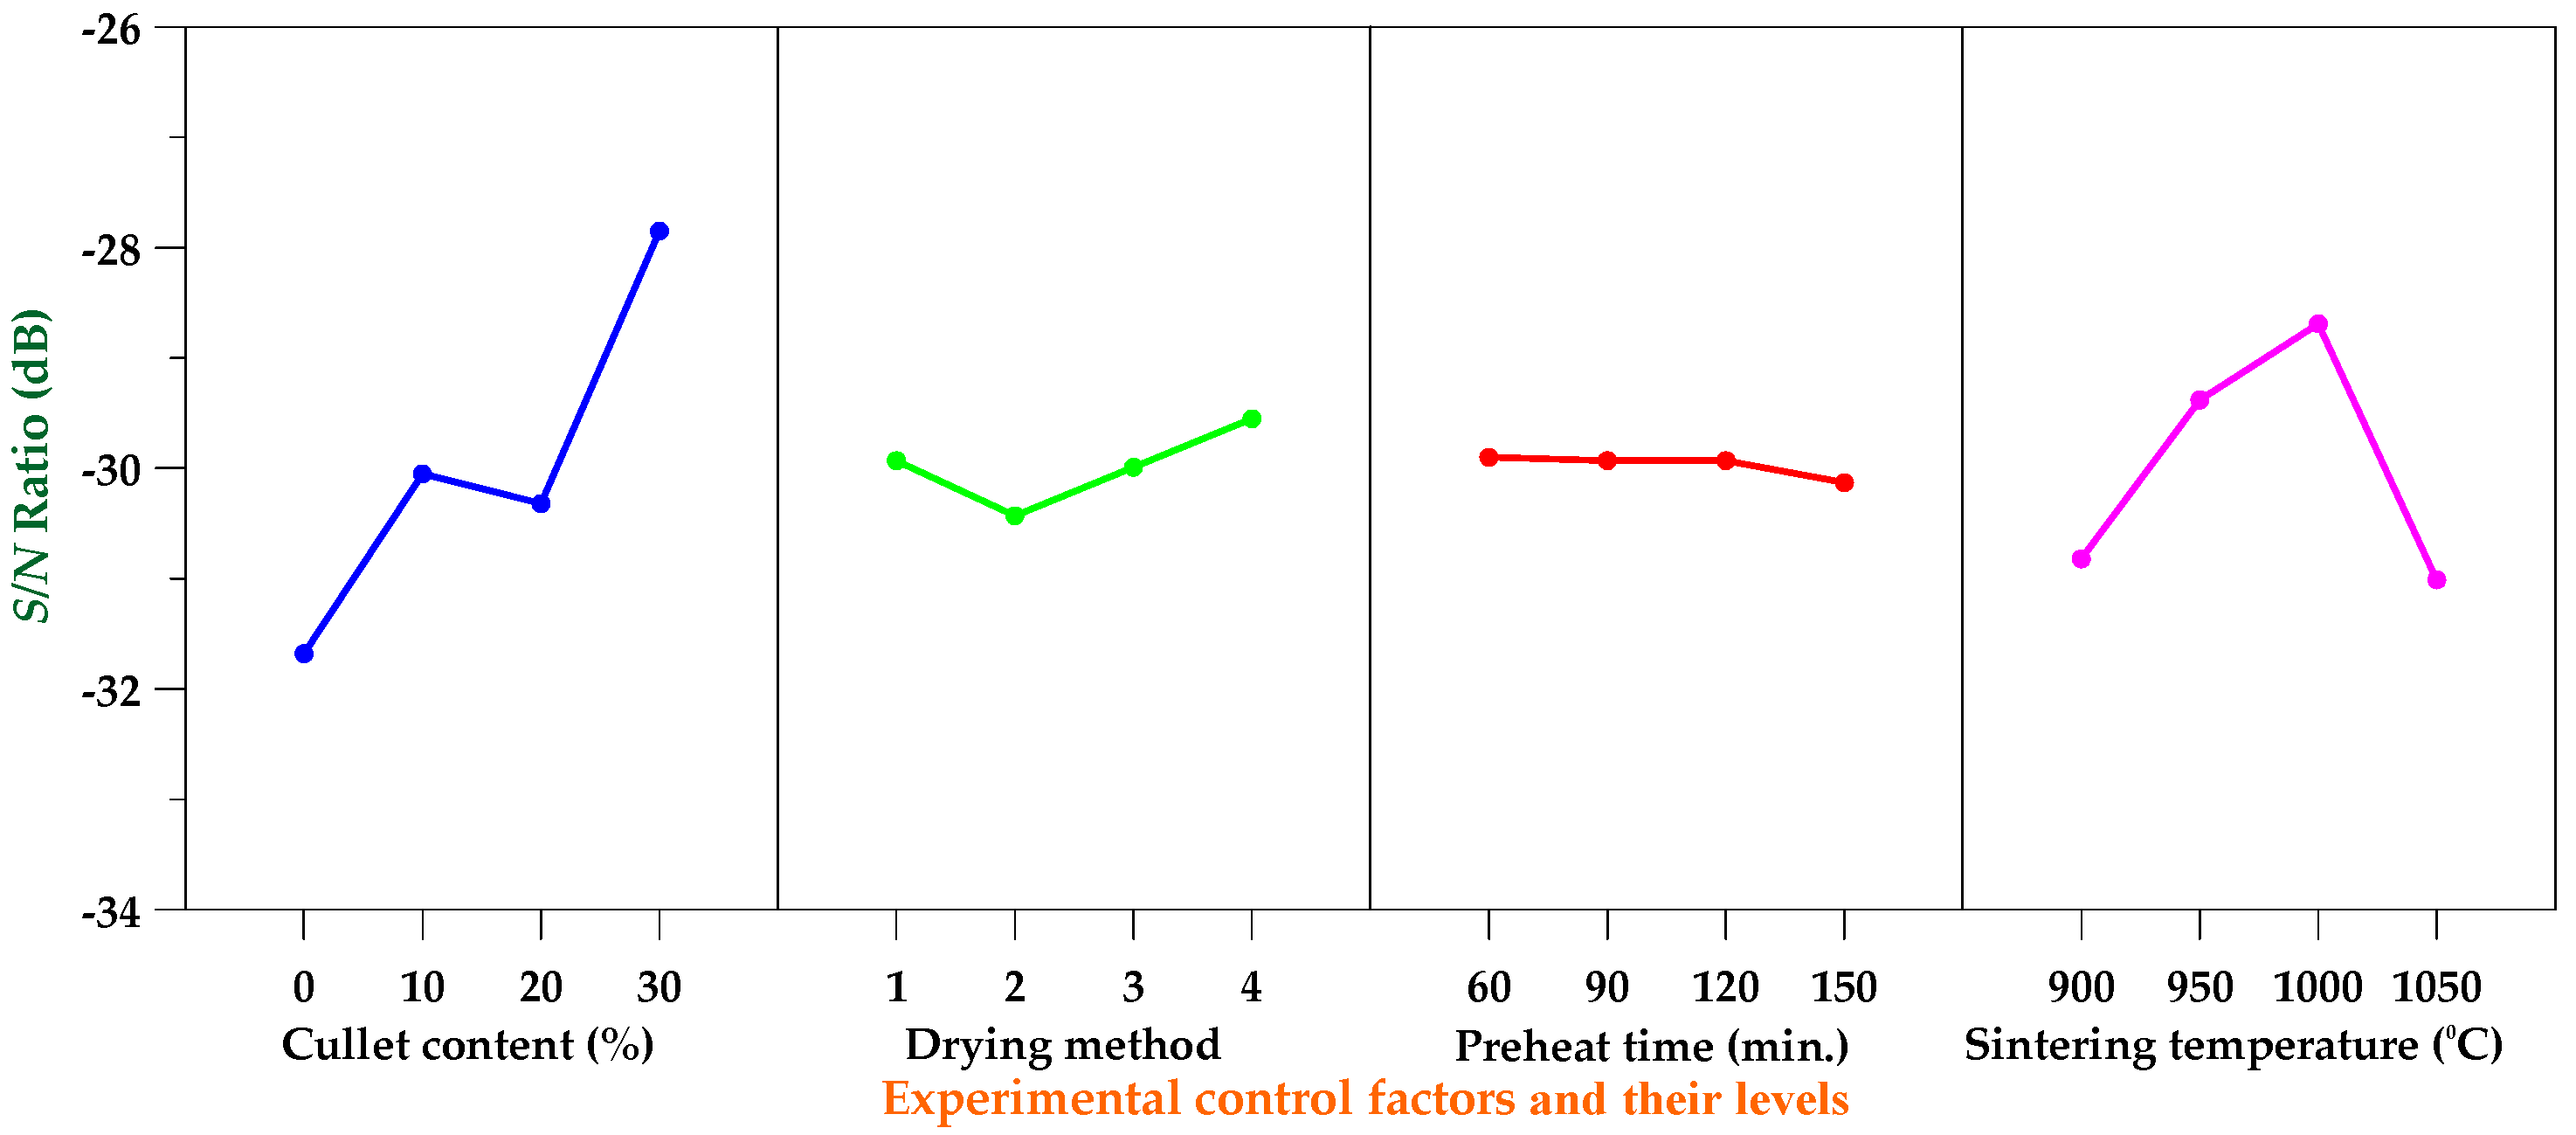
Figure 9.
S/N response graph for compressive strength.

Figure 10.
Comparison of SEM images of sintered specimens with pure reservoir sediments (magnified 5000 times). (a) G1 (sintering temperature 900 °C); (b) G2 (sintering temperature 950 °C); (c) G3 (sintering temperature 1000 °C); and (d) G4 (sintering temperature 1050 °C).
Figure 10.
Comparison of SEM images of sintered specimens with pure reservoir sediments (magnified 5000 times). (a) G1 (sintering temperature 900 °C); (b) G2 (sintering temperature 950 °C); (c) G3 (sintering temperature 1000 °C); and (d) G4 (sintering temperature 1050 °C).
Figure 11.
Comparison of SEM images of sintered specimens with glass and reservoir sediments (magnified 5000 times). (a) G9 (sintering temperature 1050 °C); (b) G10 (sintering temperature 1000 °C); (c) G11 (sintering temperature 950 °C); and (d) G12 (sintering temperature 900 °C).
Figure 11.
Comparison of SEM images of sintered specimens with glass and reservoir sediments (magnified 5000 times). (a) G9 (sintering temperature 1050 °C); (b) G10 (sintering temperature 1000 °C); (c) G11 (sintering temperature 950 °C); and (d) G12 (sintering temperature 900 °C).

Table 1.
Process parameters and design levels.
| Parameter (Experimental Control Factor) | Levels of Parameter | Performance Parameter | |||
|---|---|---|---|---|---|
| 1 | 2 | 3 | 4 | ||
| Cullet Content, A (%) | 0 | 10 | 20 | 30 | Density (g/cm3) Water Absorption (%) Shrinkage Ratio (%) Loss on Ignition (%) Porosity (%) Compressive Strength (MPa) |
| Drying Method (DM), B | DM1 | DM2 | DM3 | DM4 | |
| Preheat Time, C (min) | 60 | 90 | 120 | 150 | |
| Sintering Temperature, D (°C) | 900 | 950 | 1000 | 1050 | |
| Error, E | - | - | - | - | |
Table 2.
Orthogonal array for L16(45).
| Experiment Number | Parameter (Level) | ||||
|---|---|---|---|---|---|
| A | B | C | D | E | |
| G1 | 0 (1) * | DM1 (1) | 60 (1) | 900 (1) | |
| G2 | 0 (1) | DM2 (2) | 90 (2) | 950 (2) | |
| G3 | 0 (1) | DM3 (3) | 120 (3) | 1000 (3) | |
| G4 | 0 (1) | DM4 (4) | 150 (4) | 1050 (4) | |
| G5 | 10 (2) | DM1 (1) | 90 (2) | 1000 (3) | |
| G6 | 10 (2) | DM2 (2) | 60 (1) | 1050 (4) | |
| G7 | 10 (2) | DM3 (3) | 150 (4) | 900 (1) | |
| G8 | 10 (2) | DM4 (4) | 120 (3) | 950 (2) | |
| G9 | 20 (3) | DM1 (1) | 120 (3) | 1050 (4) | |
| G10 | 20 (3) | DM2 (2) | 150 (4) | 1000 (3) | |
| G11 | 20 (3) | DM3 (3) | 60 (1) | 950 (2) | |
| G12 | 20 (3) | DM4 (4) | 90 (2) | 900 (1) | |
| G13 | 30 (4) | DM1 (1) | 150 (4) | 950 (2) | |
| G14 | 30 (4) | DM2 (2) | 120 (3) | 900 (1) | |
| G15 | 30 (4) | DM3 (3) | 90 (2) | 1050 (4) | |
| G16 | 30 (4) | DM4 (4) | 60 (1) | 1000 (3) | |
Note: * The numbers in parentheses indicate the level of the factor.
Table 3.
Moisture contents of brick embryos.
| Experiment Number | Drying Method | Moisture Content of Green Brick Embryos (%) | Moisture Content of Dry Brick Embryos (%) |
|---|---|---|---|
| G1 | DM1 | 18.0 | 11.6 |
| G5 | 18.0 | 11.1 | |
| G9 | 18.0 | 10.3 | |
| G13 | 18.0 | 10.4 | |
| G2 | DM2 | 18.0 | 14.9 |
| G6 | 18.0 | 14.8 | |
| G10 | 18.0 | 14.2 | |
| G14 | 18.0 | 14.3 | |
| G3 | DM3 | 18.0 | 0.0 |
| G7 | 18.0 | 0.0 | |
| G11 | 18.0 | 0.0 | |
| G15 | 18.0 | 0.0 | |
| G4 | DM4 | 18.0 | 1.1 |
| G8 | 18.0 | 1.6 | |
| G12 | 18.0 | 2.4 | |
| G16 | 18.0 | 3.3 |
Table 4.
Analytical results of physical properties of raw materials.
| Sample Type | Specific Gravity | Plasticity Index (PI) | Average Particle Size (μm) | Maximum Particle Size (μm) | Minimum Particle Size (μm) |
|---|---|---|---|---|---|
| Reservoir Sediments | 2.49 | 14 | 30.34 | 418.6 | 0.688 |
| TFT-LCD Waste Glass | 2.3 | N.P. | 357 | 1408 | 4.62 |
Table 5.
Chemical composition of sludge and reservoir sediments.
| Sample | Chemical Compositions (wt %) | |||||||||
|---|---|---|---|---|---|---|---|---|---|---|
| SiO2 | Al2O3 | Fe2O3 | CaO | MgO | K2O | Na2O | OS | LOI | Total | |
| Reservoir Sediments | 58.4 | 23.8 | 5.9 | 3.6 | 2.6 | 4.2 | 1.5 | - | 3.9 | 100 |
| TFT-LCD Waste Glass | 85.4 | 5.6 | 0.2 | - | 2.5 | - | 6.3 | - | 0.04 | 100 |
Note: LOI = loss on ignition; OS = organic substance content.
Table 6.
Experimental results and S/N ratio.
| Experiment Number | Experimental Results | S/N Ratio (dB) | ||||||||||
|---|---|---|---|---|---|---|---|---|---|---|---|---|
| ρ (g/cm3) | Wa (%) | Sr (%) | LOI (%) | VV (%) | fc’ (MPa) | ρ | Wa | Sr | LOI | VV | fc’ | |
| G1 | 1.67 | 29.0 | 34.4 | 17.4 | 42.7 | 3.31 | −4.45 | −29.25 | −30.73 | −24.81 | −32.61 | 10.40 |
| G2 | 1.60 | 27.4 | 22.9 | 20.6 | 40.5 | 4.03 | −4.08 | −28.76 | −27.20 | −26.28 | −32.15 | 12.11 |
| G3 | 1.66 | 18.9 | 28.3 | 5.6 | 28.4 | 6.93 | −4.40 | −25.53 | −29.04 | −14.96 | −29.07 | 16.81 |
| G4 | 1.57 | 30.3 | 22.2 | 7.6 | 44.1 | 5.05 | −3.92 | −29.63 | −26.93 | −17.62 | −32.89 | 14.07 |
| G5 | 1.84 | 18.5 | 47.6 | 16.3 | 28.6 | 9.50 | −5.30 | −25.34 | −33.55 | −24.24 | −29.13 | 19.55 |
| G6 | 1.68 | 21.0 | 25.1 | 19.9 | 32.2 | 12.09 | −4.51 | −26.44 | −27.99 | −25.98 | −30.16 | 21.65 |
| G7 | 1.61 | 25.0 | 12.5 | 5.4 | 38.6 | 3.34 | −4.14 | −27.96 | −21.94 | −14.65 | −31.73 | 10.47 |
| G8 | 1.68 | 18.6 | 23.1 | 7.5 | 28.8 | 7.38 | −4.51 | −25.39 | −27.27 | −17.50 | −29.19 | 17.36 |
| G9 | 1.67 | 25.8 | 24.9 | 14.7 | 39.5 | 14.11 | −4.45 | −28.23 | −27.92 | −23.35 | −31.93 | 22.99 |
| G10 | 1.74 | 19.2 | 21.1 | 18.5 | 31.1 | 11.05 | −4.81 | −25.67 | −26.49 | −25.34 | −29.86 | 20.87 |
| G11 | 1.69 | 20.4 | 22.0 | 4.7 | 32.0 | 5.95 | −4.56 | −26.19 | −26.85 | −13.44 | −30.10 | 15.49 |
| G12 | 1.73 | 18.5 | 23.8 | 7.0 | 29.5 | 4.19 | −4.76 | −25.34 | −27.53 | −16.90 | −29.40 | 12.44 |
| G13 | 1.84 | 12.5 | 37.0 | 14.4 | 20.1 | 6.05 | −5.30 | −21.94 | −31.36 | −23.17 | −26.06 | 15.64 |
| G14 | 1.72 | 18.8 | 21.7 | 17.8 | 30.0 | 3.78 | −4.71 | −25.48 | −26.73 | −25.01 | −29.54 | 11.55 |
| G15 | 1.72 | 17.7 | 19.1 | 4.1 | 28.4 | 14.70 | −4.71 | −24.96 | −25.62 | −12.26 | −29.07 | 23.35 |
| G16 | 1.77 | 13.7 | 31.2 | 7.6 | 21.7 | 10.49 | −4.96 | −22.73 | −29.88 | −17.62 | −26.73 | 20.42 |
Note: ρ = density; Wa = water absorption; Sr = shrinkage ratio; LOI = loss on ignition; VV = porosity; and fc’ = compressive strength.
Table 7.
S/N response table for density.
| Parameter | Mean S/N Ratio (η, Unit: dB) | Delta (Max η − Min η) | Rank | |||
|---|---|---|---|---|---|---|
| Level 1 | Level 2 | Level 3 | Level 4 | |||
| Cullet Content, A (%) | −4.21 | −4.61 | −4.65 | −4.92 | 0.71 | 1 |
| Drying Method, B | −4.88 | −4.53 | −4.45 | −4.54 | 0.43 | 3 |
| Preheat Time, C (min) | −4.62 | −4.71 | −4.52 | −4.54 | 0.19 | 5 |
| Sintering Temperature, D (°C) | −4.52 | −4.61 | −4.87 | −4.40 | 0.47 | 2 |
| Error, E | −4.62 | −4.41 | −4.74 | −4.62 | 0.33 | 4 |
Table 8.
Analysis of variance and F test for density.
| Parameter | Sum of Square (SSZ) | Degree of Freedom | Variance (MSZ) | F Value (FZ) | F0.05;3,3 | Percentage Contribution (PZ) | Note |
|---|---|---|---|---|---|---|---|
| Cullet Content, A (%) | 1.01 | 3 | 0.34 | 10.88 | 9.28 | 40.97 | Significant |
| Drying Method, B | 0.43 | 3 | 0.14 | 4.61 | 9.28 | 14.96 | |
| Preheat Time, C (min) | 0.09 | 3 | 0.03 | 1.00 | 9.28 | 20.73 | |
| Sintering Temperature, D (°C) | 0.48 | 3 | 0.16 | 5.15 | 9.28 | 17.21 | |
| Error, E | 0.23 | 3 | 0.08 | 2.48 | 9.28 | 6.13 | |
| All Other | 0.09 | 3 | 0.03 | ||||
| Total | 2.24 | 15 | 0.75 | 100 |
Table 9.
S/N response table for water absorption.
| Parameter | Mean S/N Ratio (η, Unit: dB) | Delta (Max η − Min η) | Rank | |||
|---|---|---|---|---|---|---|
| Level 1 | Level 2 | Level 3 | Level 4 | |||
| Cullet Content, A (%) | −28.29 | −26.28 | −26.36 | −23.78 | 4.51 | 1 |
| Drying Method, B | −26.19 | −26.59 | −26.16 | −25.77 | 0.82 | 4 |
| Preheat Time, C (min) | −26.15 | −26.10 | −26.16 | −26.30 | 0.20 | 5 |
| Sintering Temperature, D (°C) | −27.01 | −25.57 | −24.82 | −27.32 | 2.50 | 2 |
| Error, E | −26.32 | −26.92 | −24.81 | −26.66 | 2.11 | 3 |
Table 10.
Analysis of variance and F test for water absorption.
| Parameter | Sum of Square (SSZ) | Degree of Freedom | Variance (MSZ) | F Value (FZ) | F0.05;3,3 | Percentage Contribution (PZ) | Note |
|---|---|---|---|---|---|---|---|
| Cullet Content, A (%) | 41.05 | 3 | 13.68 | 481.07 | 9.28 | 58.57 | Significant |
| Drying Method, B | 1.32 | 3 | 0.44 | 15.51 | 9.28 | 1.77 | |
| Preheat Time, C (min) | 0.09 | 3 | 0.03 | 1.00 | 9.28 | 0.61 | |
| Sintering Temperature, D (°C) | 16.82 | 3 | 5.61 | 197.13 | 9.28 | 23.93 | Significant |
| Error, E | 10.66 | 3 | 3.55 | 124.94 | 9.28 | 15.12 | Sub-significant |
| All Other | 0.09 | 3 | 0.03 | ||||
| Total | 69.94 | 15 | 23.31 | 100.00 |
Table 11.
S/N response table for shrinkage ratio.
| Parameter | Mean S/N Ratio (η, Unit: dB) | Delta (Max η − Min η) | Rank | |||
|---|---|---|---|---|---|---|
| Level 1 | Level 2 | Level 3 | Level 4 | |||
| Cullet Content, A (%) | −28.47 | −27.69 | −27.20 | −28.40 | 1.27 | 5 |
| Drying Method, B | −30.89 | −27.10 | −25.86 | −27.90 | 5.03 | 1 |
| Preheat Time, C (min) | −28.86 | −28.48 | −27.74 | −26.68 | 2.18 | 4 |
| Sintering Temperature, D (°C) | −26.73 | −28.17 | −29.74 | −27.12 | 3.01 | 2 |
| Error, E | −27.53 | −26.74 | −28.98 | −28.51 | 2.24 | 3 |
Table 12.
Analysis of variance and F test for shrinkage ratio.
| Parameter | Sum of Square (SSZ) | Degree of Freedom | Variance (MSZ) | F Value (FZ) | F0.05;3,3 | Percentage Contribution (PZ) | Note |
|---|---|---|---|---|---|---|---|
| Cullet Content, A (%) | 4.44 | 3 | 1.48 | 1.00 | 9.28 | 0.00 | |
| Drying Method, B | 54.99 | 3 | 18.33 | 12.40 | 9.28 | 48.44 | Significant |
| Preheat Time, C (min) | 11.08 | 3 | 3.69 | 2.50 | 9.28 | 27.63 | |
| Sintering Temperature, D (°C) | 21.71 | 3 | 7.24 | 4.89 | 9.28 | 16.55 | |
| Error, E | 12.14 | 3 | 4.05 | 2.74 | 9.28 | 7.38 | |
| All Other | 4.44 | 3 | 1.48 | ||||
| Total | 104.35 | 15 | 34.78 | 100.00 |
Table 13.
S/N response table for loss on ignition.
| Parameter | Mean S/N Ratio (η, Unit: dB) | Delta (Max η − Min η) | Rank | |||
|---|---|---|---|---|---|---|
| Level 1 | Level 2 | Level 3 | Level 4 | |||
| Cullet Content, A (%) | −20.92 | −20.59 | −19.76 | −19.51 | 1.41 | 2 |
| Drying Method, B | −23.89 | −25.65 | −13.83 | −17.41 | 11.82 | 1 |
| Preheat Time, C (min) | −20.46 | −19.92 | −20.20 | −20.19 | 0.54 | 4 |
| Sintering Temperature, D (°C) | −20.34 | −20.10 | −20.54 | −19.80 | 0.74 | 3 |
| Error, E | −19.98 | −20.47 | −20.25 | −20.08 | 0.49 | 5 |
Table 14.
Analysis of variance and F test for loss on ignition.
| Parameter | Sum of Square (SSZ) | Degree of Freedom | Variance (MSZ) | F Value (FZ) | F0.05;3,3 | Percentage Contribution (PZ) | Note |
|---|---|---|---|---|---|---|---|
| Cullet Content, A (%) | 5.35 | 3 | 1.78 | 9.48 | 9.28 | 1.28 | Sub-significant |
| Drying Method, B | 367.01 | 3 | 122.34 | 650.91 | 9.28 | 97.79 | Significant |
| Preheat Time, C (min) | 0.59 | 3 | 0.20 | 1.04 | 9.28 | 0.76 | |
| Sintering Temperature, D (°C) | 1.23 | 3 | 0.41 | 2.19 | 9.28 | 0.18 | |
| Error, E | 0.56 | 3 | 0.19 | 1.00 | 9.28 | 0.00 | |
| All Other | 0.56 | 3 | 0.19 | ||||
| Total | 374.74 | 15 | 124.91 | 100.00 |
Table 15.
S/N response table for porosity.
| Parameter | Mean S/N Ratio (η, Unit: dB) | Delta (Max η − Min η) | Rank | |||
|---|---|---|---|---|---|---|
| Level 1 | Level 2 | Level 3 | Level 4 | |||
| Cullet Content, A (%) | −31.68 | −30.05 | −30.32 | −27.85 | 3.83 | 1 |
| Drying Method, B | −29.93 | −30.43 | −29.99 | −29.55 | 0.88 | 4 |
| Preheat Time, C (min) | −29.90 | −29.93 | −29.93 | −30.13 | 0.23 | 5 |
| Sintering Temperature, D (°C) | −30.82 | −29.38 | −28.69 | −31.01 | 2.32 | 2 |
| Error, E | −30.18 | −30.64 | −28.67 | −30.42 | 1.97 | 3 |
Table 16.
Analysis of variance and F test for porosity.
| Parameter | Sum of Square (SSZ) | Degree of Freedom | Variance (MSZ) | F Value (FZ) | F0.05;3,3 | Percentage Contribution (PZ) | Note |
|---|---|---|---|---|---|---|---|
| Cullet Content, A (%) | 30.16 | 3 | 10.05 | 217.13 | 9.28 | 53.16 | Significant |
| Drying Method, B | 1.54 | 3 | 0.51 | 11.10 | 9.28 | 2.48 | |
| Preheat Time, C (min) | 0.14 | 3 | 0.05 | 1.00 | 9.28 | 1.23 | |
| Sintering Temperature, D (°C) | 15.14 | 3 | 5.05 | 109.00 | 9.28 | 26.57 | Significant |
| Error, E | 9.49 | 3 | 3.16 | 68.32 | 9.28 | 16.56 | Sub-significant |
| All Other | 0.14 | 3 | 0.05 | ||||
| Total | 56.48 | 15 | 18.83 | 100.00 |
Table 17.
S/N response table for compressive strength.
| Parameter | Mean S/N Ratio (η, Unit: dB) | Delta (Max η − Min η) | Rank | |||
|---|---|---|---|---|---|---|
| Level 1 | Level 2 | Level 3 | Level 4 | |||
| Cullet Content, A (%) | 13.35 | 17.26 | 17.95 | 17.74 | 4.60 | 2 |
| Drying Method, B | 17.14 | 16.54 | 16.53 | 16.07 | 1.07 | 5 |
| Preheat Time, C (min) | 16.99 | 16.86 | 17.18 | 15.26 | 1.92 | 4 |
| Sintering Temperature, D (°C) | 11.22 | 15.15 | 19.41 | 20.51 | 9.29 | 1 |
| Error, E | 17.99 | 16.50 | 16.64 | 15.17 | 2.82 | 3 |
Table 18.
Analysis of variance and F test for compressive strength.
| Parameter | Sum of Square (SSZ) | Degree of Freedom | Variance (MSZ) | F Value (FZ) | F0.05;3,3 | Percentage Contribution (PZ) | Note |
|---|---|---|---|---|---|---|---|
| Cullet Content, A (%) | 56.53 | 3 | 18.84 | 24.36 | 9.28 | 17.98 | Significant |
| Drying Method, B | 2.32 | 3 | 0.77 | 1.00 | 9.28 | 0.00 | |
| Preheat Time, C (min) | 9.38 | 3 | 3.13 | 4.04 | 9.28 | 6.19 | |
| Sintering Temperature, D (°C) | 217.24 | 3 | 72.41 | 93.61 | 9.28 | 71.28 | Significant |
| Error, E | 16.03 | 3 | 5.34 | 6.91 | 9.28 | 4.55 | |
| All Other | 2.32 | 3 | 0.77 | ||||
| Total | 301.50 | 15 | 100.50 | 100.00 |
Table 19.
Process conditions in tunnel kiln.
| Experiment Number | Parameter | |||
|---|---|---|---|---|
| Cullet Content, A (%) | Drying Method, B | Preheat Time, C (min) | Sintering Temperature, D (°C) | |
| P1 | 30 | DM4 | 90 | 1000 |
| P2 | 20 | DM1 | 120 | 1050 |
Table 20.
Test results of fired bricks in tunnel kiln.
| Experiment Number | Finished Brick Features | |||
|---|---|---|---|---|
| Density (g/cm3) | Water Absorption (%) | Compressive Strength (MPa) | Rupture Modulus (MPa) | |
| P1 | 2.21 | 12.9 | 35.2 | 0.62 |
| P2 | 2.24 | 14.5 | 48.2 | 0.68 |
© 2018 by the author. Licensee MDPI, Basel, Switzerland. This article is an open access article distributed under the terms and conditions of the Creative Commons Attribution (CC BY) license (http://creativecommons.org/licenses/by/4.0/).
Share and Cite
MDPI and ACS Style
Tang, C.-W. Properties of Fired Bricks Incorporating TFT-LCD Waste Glass Powder with Reservoir Sediments. Sustainability 2018, 10, 2503. https://doi.org/10.3390/su10072503
AMA Style
Tang C-W. Properties of Fired Bricks Incorporating TFT-LCD Waste Glass Powder with Reservoir Sediments. Sustainability. 2018; 10(7):2503. https://doi.org/10.3390/su10072503
Chicago/Turabian StyleTang, Chao-Wei. 2018. "Properties of Fired Bricks Incorporating TFT-LCD Waste Glass Powder with Reservoir Sediments" Sustainability 10, no. 7: 2503. https://doi.org/10.3390/su10072503
Note that from the first issue of 2016, this journal uses article numbers instead of page numbers. See further details here.