Article

Government Support and Market Proximity: Exploring Their Relationship with Supply Chain Agility and Financial performance

by
Liliana Avelar-Sosa
1,*,
Jorge L. García-Alcaraz
1,
José M. Mejía-Muñoz
2,
Aidé A. Maldonado-Macías
1 and
Giner Alor Hernández
3
1
Department of Industrial Engineering and Manufacturing 1, Universidad Autónoma de Ciudad Juárez, Ave. Del Charro 450 N, Col. Partido Díaz, Ciudad Juárez 32310, Mexico
2
Department of Electrical and Computing Engineering 2, Universidad Autónoma de Ciudad Juárez, Ave. Del Charro 450 N, Col. Partido Díaz, Ciudad Juárez 32310, Mexico
3
Tecnológico Nacional de México 3, Instituto Tecnológico de Orizaba, Ave. Oriente 9 No. 852, Col. Emiliano Zapata, Orizaba 94320, Mexico
*
Author to whom correspondence should be addressed.
Sustainability 2018, 10(7), 2441; https://doi.org/10.3390/su10072441
Submission received: 16 May 2018 / Revised: 29 June 2018 / Accepted: 10 July 2018 / Published: 12 July 2018
(This article belongs to the Special Issue Toward Sustainability: Supply Chain Collaboration and Governance)

Abstract

:
The current paper presents a structural equation model with four variables (Government, Infrastructure, Proximity to market, and supply chain Agility) affecting the Financial performance of a company. Six hypotheses or relationships among variables are proposed, supposing that Government and market Proximity are key elements to achieve a greater Agility in supply chains, considering the regional Infrastructure to determine the impact on Financial performance in manufacturing companies. The model is validated with data from a survey applied to 225 persons in 65 manufacturing companies located in Ciudad Juárez, Chihuahua, Mexico. The model is evaluated using partial least squares, and the findings indicate that there is a direct and positive effect from the Government on regional Infrastructure with a rate of 0.436. When the Government supports the availability of land, energy resources, transportation, telecommunications, mobile telephones, and other services, a positive change is achieved in the Infrastructure and supply chain Agility. Furthermore, the Government also has a direct and positive effect on the market Proximity at a rate of 0.171; consequently, the regional Infrastructure also has an effect on it. Similarly, the market Proximity directly and positively influences the supply chain Agility, as well as a company’s Financial performance at a rate of 0.506.

1. Introduction

Since some decades ago, economists have agreed that the manufacturing sector is an essential element to increase the productivity and thereby improve the economic growth of a country, since it is regularly involved in many industries. For instance, there are more employment opportunities, economic developments, technological advancements, gross domestic product (GDP) input, and a better quality of life is achieved. Therefore, the supply chain (SC) has a significant role within the manufacturing sector, since it allows for a more productive system; on the other hand, the appropriate collaboration between companies to unify their objectives and reach the differentiation levels in the market is what contributes most to achieving a competitive advantage [1]. A SC is defined as a network of interrelated companies integrated by raw materials, information, and economic resources flows, where it is aimed to add the higher value to a benefit or service from the supplier to the customer [2].
Nowadays, the complexity of production systems, globalization, and dynamic aspects have caused the direction of business economics to be achieved through their proper SC [3] and several companies have implemented performance indexes evaluations in their SCs using different trends and methodologies. For example, consider the Agility levels in SCs, which include fulfilling product deliveries to the customer, reducing delivery time, reducing total costs, and improving quality [4]. Those performance indexes in SCs are obtained using cases of study, regression analysis, hierarchical analysis, structural equations, and neural networks [5].
Currently, there are many factors that influence obtaining greater Agility in the supply chain; for example, Braunscheidel and Suresh [6] declared that organizational structure and management commitment are of vital importance for Agility and flexibility. For their part, DeGroote and Marx [7] declared that information and communication technologies are the basis for the integration of partners in a supply chain, since they enable quick decision making almost in real time, giving Agility to SCs. Likewise, Garcia-Alcaraz and Maldonado-Macias [8] declared that the key to Agility lies in the human resources of the companies and the flexibility in their SC to adapt to changes in demand. Finally, Brusset [9] stated that the SC visibility is one of the benefits that can be achieved with Agility, although the most important thing is the Financial performance that the company can obtain [10], so managers should focus on achieving acceptable levels of Agility in the company.
However, the above factors can be considered as internals that are associated with the company. There are other external factors that affect the Agility and performance of companies, which refer to the Government at all levels, since they are responsible for facilitating business activities by streamlining the bureaucratic procedures that are carried out [11,12], providing services as phone, internet, land facilities, taxes, among others. In other words, the Government is responsible for providing the Infrastructure that allows the flow of raw materials and finished products [13]. Thus, the Government and the Infrastructure available in a region are a source of the Agility and the Financial performance of the company.
However, one of the most important strategies for obtaining SC Agility is to reduce the Proximity to customers, which is why some international companies establish subsidiaries in other countries. Specifically, many subsidiaries of foreign transnational companies have been established in Mexico, which are commonly called maquiladoras, and are characterized by importing raw materials and exporting their finished products, especially to the United States of America (USA), Canada, and Europe, which is the most important market [14]. As consequence, Mexico, the USA, and Canada had signed the North American Free Trade Agreement in the 1990s, which helped this region experience a considerable population growth, and currently, the maquiladora sector represents an economic advantages in the region [15].
In December 2017, there were 5089 manufacturing companies in Mexico, of which 512 belonged to the state of Chihuahua, and 335 belonged to Ciudad Juarez, representing 6.7% of national enterprises. Also, among the 335 companies registered in the Index Juarez (Exportation Manufacturing Companies and Maquiladoras Association) of Ciudad Juarez, the automotive industry stands out with 29% of the total, while electronics was at 27%; these are the two largest employer industries in the city. In addition, this type of Mexican exportation companies until November 2017 represented $333.304 billion dollars, where the state of Chihuahua contributed with $46.662 billion, and Ciudad Juarez contributed $36.396 billion [16]. Also, according to Mexican Social Security Institute (IMSS) data, in January 2018 in Chihuahua, there were 443,160 federal Government workers in the manufacturing sector, of which 292,053 were people from Ciudad Juarez (66%). Therefore, Ciudad Juarez is considered the main job generator in this type of industry with 291,500 [17] employees, followed by Tijuana in Baja, California, with 221,703 jobs. In addition, according to data until February 2018, Ciudad Juarez has 22 industrial parks and 16 industrial zones, and a total population of 1,448,859, which is informative knowledge.
Furthermore, newsletters from the Secretariat of Economy stated that Mexico is the fourth worldwide automotive products exporter, representing 15% of gross domestic product for the country, and 17% of foreign direct investment, as published on the Mexican Government information page by the previously mentioned secretariat [18]. Thus, it is relevant to do research on the manufacturing industry, which is intended to improve all types of activities within the production processes. Therefore, benefits are acquired for companies established in Mexico, so they continue to be economically profitable and generate employment.
Given the economic importance of the maquiladora sector in Mexico, the main questions here are: how is the local, state, and federal Government supporting to the Infrastructure in Ciudad Juárez for taking advantage of its Proximity to the USA market? How is the local Infrastructure supporting the SC Agility? How has SC Agility given a better Financial performance to maquiladora companies? This paper aims to identify the relationships between Government, Proximity, Infrastructure, Agility, and Financial performance for the maquiladora industry, because there is a lack of this kind of study. A structural equation model is applied to find the different contributions between the mentioned variables; it is carried out based on data from manufacturing companies in Ciudad Juarez, Chihuahua, Mexico.

2. Government, Supply Chain, and Sustainability

Nowadays, to speak about sustainability is to think about reducing all kinds of waste in order to achieve greater benefits and thus achieve greater social responsibility. This has led companies to adapt their processes to reuse certain parts of the products to also reduce costs. In this sense, they have started logistics strategies to achieve it, in which Infrastructure and transportation are clearly key factors.
The supply chain is characterized by many operations that do not add value to the final product, but do add a lot costs. It is even mentioned that in some industrial sectors, up to 70% of production costs are due to logistical aspects [19]. However, that seems to be a problem of economic importance for the enterprise, since it loses competitiveness and possibly also part of the market. The real problem is that the logistics of raw materials and finished products requires much transport, which emits pollutants that should be regulated by the Government [20]. Klumpp [21] commented that up to 23% of emissions in 2015 in the European Union were due to logistics and transportation; this represents an increase, because in 1990 it was only 15%. Therefore, now it is very common to hear about sustainable supply chains that have been used, and how the Government has established policies and regulations. For example, Bastas and Liyanage [22] carried out a literature review that is associated with quality and sustainability in the supply chain, which shows that it is possible to generate products of quality with environmentally-friendly production processes. Those companies that emit pollutants must conform to Government regulations in order to be able to continue with industrial operations in certain regions, and must always take these rules into account before being located in any region or city [23]. For this reason, many companies invest in new technologies to meet these regulations by monitoring, controlling, and reducing emissions in supply chain management; currently, these activities are part of manufacturing strategies [24]. Another important role of the Government is to support the companies that are committed to sustainable aspects by offering support and preferential tariffs that are aimed at beginning a culture of green production process and green supply chain [25]. As mentioned by Mahmoudi and Rasti-Barzoki [26], supply chains require Government intervention to enforce established regulations.
However, the Government should not only regulate the logistics and sustainable aspects during the procurement of raw materials, production process, and distribution of finished products; it must also regulate the reprocessing of materials after the life of the product has finished [27]. For example, in Shu [20] reported a study in which there are useful components for remanufacturing, which is done with Government subsidies, and Mo [28] presented a study of the analysis of the life of products that have intellectual property rights. Therefore, it is observed that the sustainability of companies and their supply chains is widely associated with regulations given by Government, so it is currently considered that it must be fully committed to the establishment of sustainable standards and monitor their compliance, and for this reason, the Government is declared to be one of the pillars of sustainability, and should be the main promoter of that culture [29]. In addition, Government support is a major reason for any organization to get into new processes and change its policy for both the environment and society. For its part, the Government is also a key factor for companies achieving sustainability, since it is necessary to configure a set of rules or systems that allow for the better management of the business of a company through different benefits that the Government can offer [30].
Fortunately, some research on this subject has reported metrics that a supply chain should have in order to be sustainable, such as those reported by Popovic [31], who discussed a social and qualitative approach. However, quantitative approaches have also been reported, such as those from Qorri [32]. With these implications, the purpose of knowing the Government role in aspects associated with the Proximity of customers as a means of avoiding transport and polluting emissions and procurement and distribution costs, as well as the relationship that they have with the Infrastructure available in a geographical region and how it encourages the Agility of supply chain and the Financial performance of the company, this article reports a structural equations model in which these variables are related. The results will allow managers to meet better performance through focusing their attention on activities that are relevant for the company, while at the same time identifying weaknesses in Government support to address the aspects that are required in order to be a sustainable company.

3. Hypotheses and Literature Review

In this section, the hypotheses for the proposed model are formulated from previous investigations in which the supply chain performance has been analyzed considering the variables under study. First, it highlights the Government support and its importance for the economic growth of the regions, and subsequently the Proximity market and the Infrastructure as mediating variables to achieve Agility.
Moreover, the role of the Government as a fundamental part of the strategies to achieve economic development is an active factor in the business world, since it facilitates how companies and organizations carry out their operations in a determined region. In this sense, companies and organizations reach their growth objectives through productive activities. In fact, the Government has a varied and critical influence on supply chains, playing a significant role through the various functions that it performs. Also, one of the forces that promote change and shape the economic and political landscape of any country or region is Government support, since it establishes the policies, regulations, and taxes that affect businesses and their SCs. For instance, regulations are established in transportation, communications, and financial institutions because they are the base for the Infrastructure in most organizations [33]. As Sánchez-Reaza [34] mentioned, an Infrastructure policy is focused on reducing transport costs that may only be effective if the regional policy coordinates additional efforts to provide human capital to the region, and improves the business environment locally, causing capital engrossment, skills, and work. In addition, telecommunications are part of the Infrastructure required nowadays due to evolution in the new global markets.
Similarly, the Government is the one that must look forward and strengthen local Infrastructure, and they must consider it an attractive competitive advantage for companies, because sometimes this is considered in order to decide their location [35]. In fact, the Government is responsible for collecting taxes and managing them, which are returned to society as Infrastructure that facilitates their economic development. However, their commitment not only conclude there; they must manage their maintenance and minimize the risks that could affect it, which is seen in roads and airports, among others [36,37]. In addition, in any country, the Government must always create strategies that allow for Infrastructure development and maintenance to facilitate business activities, which are not always physical. Sometimes, they are services, such as internet Infrastructure for virtual supply chains, telephones, banking, and legal services, among others [38]. Moreover, sometimes it has been observed that the Government supports private companies’ co-investors in producing Infrastructure, and companies’ services in determining the shortcomings that they have. However, these co-investing companies receive remuneration for leasing their use [39]. Additionally, considering the role that the Government has in all Infrastructure management levels, the following hypothesis is proposed:
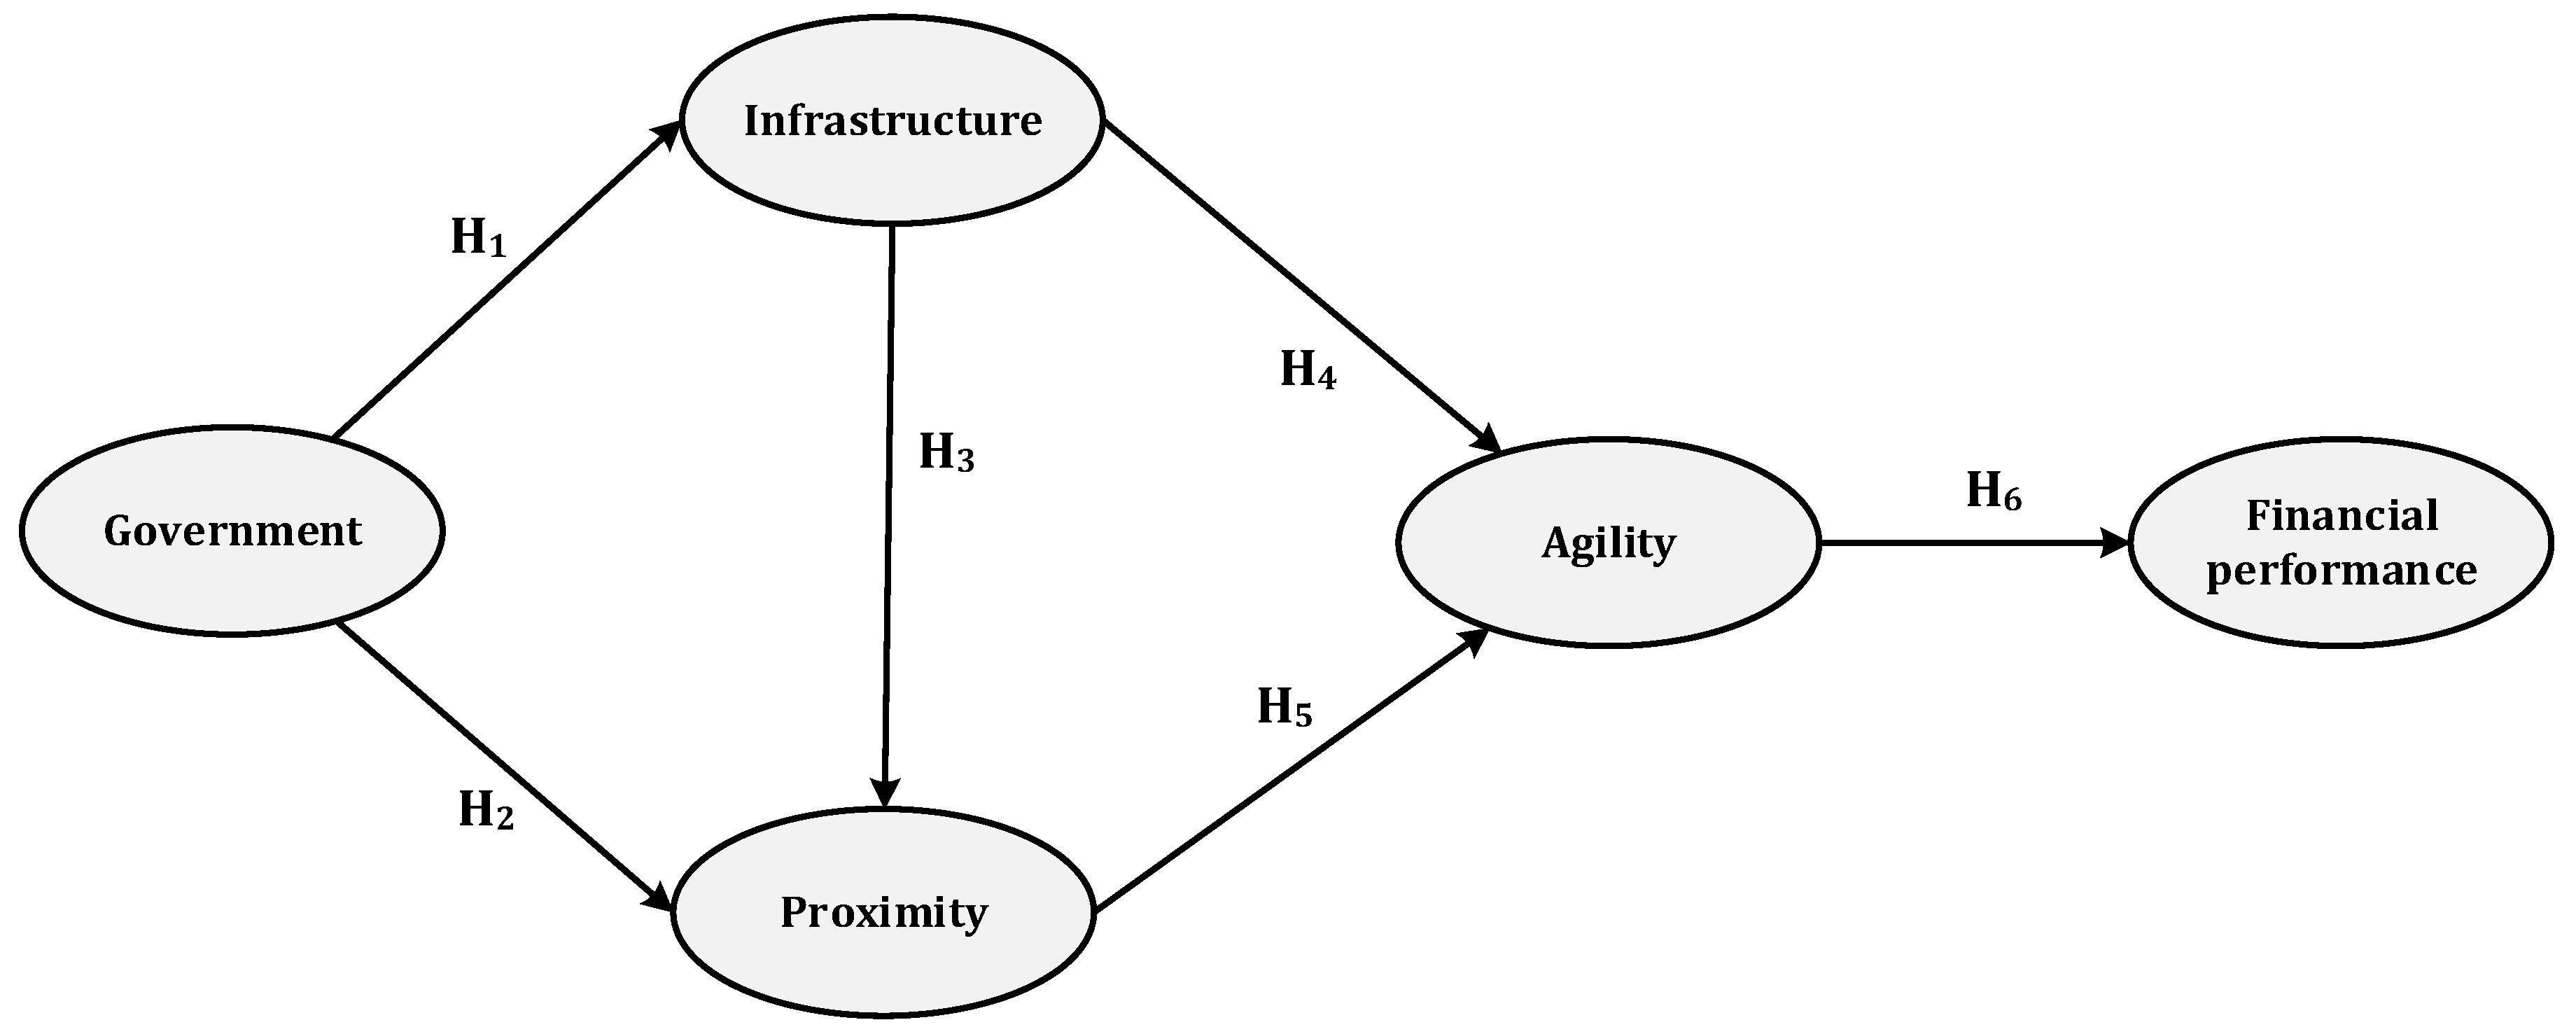
Hypothesis 1 (H1).
The support provided by the Government has a direct and positive effect on the regional Infrastructure levels.
Government support is a key factor when the business environment demands market updating and globalization. Therefore, in order to have access to this market, it is necessary to have favorable environments that attracts new companies or link local companies to global productive supply chains, and not only through the provision of Infrastructure itself [40]. Also, a low productivity and quality level, or simply a global disconnection from value chains by local companies, may affect the financial goals where they have been established in the country, as well as economic growth [34]. Therefore, it is essential to count on the support of public policies in order to promote the economic growth of any region where aspects of equity, efficiency, and coordination are included. Thus, vertical coordination between diverse Government levels becomes not only desirable, it is also an inescapable factor [34,40]. An equally important possible strategy for many Mexican regions that may provide productive business environmental factors, is the use of the information and communication technologies (ICT) networks. Where the local labor market can achieve a greater connection between northern and central regions. And where, in the same way, the Government should promote cooperation between companies, which should enable innovation and the acquisition of proper technology, and boost their human capital [40].
Apparently, the regional growth of northern Mexico is guided by manufacturing exportations and Proximity to the United States of America, being undoubtedly a connection that profits the border states. In addition, distance has a relevant effect on the trade patterns between Mexico and the United States, which has been achieved over time. Therefore, Proximity to the northern neighbor and the exportation of manufactured products have been key factors that have determined regional economic growth [41]. On the other hand, some authors have argued that in order to achieve greater economic development, it is necessary to boost productivity and competitiveness through the transfer of technology and integration of the SCs, supporting the location of multinational companies in the country. In this manner, it is possible to locate or be located as close as possible to one of the world’s largest markets in the world, the United States of America, and thus take advantage of this Proximity [42]. Likewise, among the economic growth determinants for a region, there is the opening of trade agreements between countries, where Government public policies directly influence the exchange of goods, which are created precisely for exportation [34]. Consequently, the Proximity to the destination marketing helps the innovation of the companies in a sense that it allows them to reach greater competitiveness; it also enables the promotion of more sophisticated business design and the management of more sustainable processes [43], providing greater benefits to the country itself.
Furthermore, according to Iimi [44], in order to improve competitiveness, companies must be located in urbanized areas with industrial zones, and in this way, they will share benefits related to the labor force, the entry to new marketing strategies, and the reduction of commercial and transaction costs. Additionally, Government participation is certainly considered to have effects related to the closeness to suppliers, services, and support companies to facilitate supply chains operations, among others. Also, based on this conjecture, the following hypothesis is proposed:
Hypothesis 2 (H2).
The support provided by the Government in its three administrative levels has a direct and positive effect on the market Proximity, where suppliers and competitors facilitate the innovation of the companies in the region.
Similarly, Infrastructure is required along with the productive development service, and it must be planned in order to support existing or further production centers. Thereby, the national policy should be shaped as a continuous improvement process, which demands periodic changes depending on the internal and external environment where it is inserted [45]. In addition, Raghunandan et al. [46] suggest that organizations apply a wide range of digital communication channels to increase their market, which includes mobility, social media, real-time activities, market personalization, and data analysis; these are what really define marketing strategies in companies, and therefore can influence Proximity. As a matter of fact, it means that having an Infrastructure of communication and services availability, e.g., Internet, telephones, television, and radio, facilitates operations regarding market Proximity [47]. In addition, geographical Proximity is the result of the historically accumulated transportation foundation called Infrastructure as well as related places, both in a more material and virtual sense, and the arrangement of territorially delimited spaces along the social, institutional, political, and economic dimensions. In general, it enables specific localization effects that support the physical Infrastructure development, labor market, and commercial support specialization [48]. Therefore, the following hypothesis is proposed:
Hypothesis 3 (H3).
The available regional Infrastructure has a direct and positive effect on the market Proximity, which includes suppliers, service providers, customers, and products.
Additionally, the SC Agility is about responding to a certain request, having a set plan, and obtaining the capacity and visibility for a customer response [6]. Likewise, for Fayezi et al. [49], it is also defined as the strategic ability to answer to internal and external uncertainties through an effective integration of all employers. In addition, organizational Agility needs to be leveled and supported through the SC to create a sustainable business success [49]. Also, it is argued in the literature that Agility in the SC may influence the prosperity of an organization [50], so internal (intra-functional operations) and external integration (suppliers and clients) are the ones who help an organization get the ability to act in an agile form within their own SC Actually, these authors emphasized the need to have intra-organizational capacities such as: information Infrastructure, functional flexibility, and participation to maintain and develop Agility, and hence, the importance of evaluating Agility levels to establish improvement criteria that help achieving greater economic benefits in companies. Subsequently, the previous information allows concluding that in order to look for Agility, it is necessary to have information exchange, communication, and coordination through the information systems, as well as having the Infrastructure and available services among all of the chain participants, whether they are suppliers, manufacturers, distributors, or retailers [51,52].
Furthermore, the relationship between Infrastructure and Agility characteristics in the SC has been empirically confirmed in the literature on SC and operations management, where several investigations are identified. For example, DeGroote and Marx [7] proposed a structural model where the independent variable is ICT; the mediating variable to Agility is the response to market changes, and the performance achieved in the SC is the dependent variable. In addition, among the considered aspects in ICT, those that stand out include: shared information among members, collaboration to improve transport logistics, demanded outlooks, stock management, product deliveries, and even flexibility. The results of the model that are evaluated indicate that the appropriate implementation and use of ICT improves the Agility in the SC; it is supports Yang [53] as well in his structural model by validating the effects that ICT has as part of the available communication Infrastructure. He argued that ICT results in the Agility of the SC, and communication is a key factor to improve collaboration with its suppliers and customers, where benefits are improved and may be transformed into economic growth by companies. Therefore, it is crucial to consider in the first place the Agility or adaptability levels in the productive chains of manufacturing companies. Similarly, other authors have confirmed that the energy, transportation, and telecommunication Infrastructure are determinant elements for the growth of border cities. Among these, Infrastructure in energy is the most important, since it directly benefits the manufacturing industrial exportation [54]. Considering the preceding information, the following hypothesis is proposed:
Hypothesis 4 (H4).
The regional Infrastructure available has a direct and positive effect on the Agility levels of supply chains in manufacturing companies.
Moreover, the costs associated with labor force are another essential factor in Mexican manufacturing industrial exportation. In other words, companies from other countries are established in the region in order to take advantage of these low-cost benefits [14,55], as well as those who are from a tariff-type, which are products of free treaty agreement, as is the case of Mexico [56,57]. However, it is also desirable to be in touch with customers and suppliers, since this reduces logistics costs and improves the ability to adjust to unknown changes in customer requirements. Also, manufacturing companies that are established in the northern region of Mexico have advantages due to their Proximity to the United States of America, which is considered the main consumer market of these products, especially in the automotive and electrical sector [58,59]. In addition, the existence of agencies that facilitate the importation and exportation processes of merchandise should be considered regularly if they are specialized customs agencies [60]. According to Besik and Nagurney [61], the quality levels in perishable products delivery are directly affected by the costs associated with the Infrastructure that is used to transport them, which provides the environmental and physical conditions to achieve deliveries on time. For this reason, Infrastructure directly or indirectly is a way that accelerates and provides flexibility to product deliveries.
Additionally, having the customers of finished products and raw materials suppliers at short distances from the company’s location allows a logistics operations to better control and improve Agility in companies. For instance, when greater distances exist between clients and suppliers, their performance may be affected, as is commented by Shi [62] in a study conducted in China. On the other hand, in order to reduce these issues, specifically when there are international clients and suppliers, it is recommended that there be good integration through the use of ICT [63], because it improves visibility in operations and accelerates decision making that is adjusted to unexpected changes in customer demand, and thereby improves Financial performance [64]. In order to find the relationship between the aspects associated with Proximity and Agility in the SC, therefore, in this research it is presented that besides the regional Infrastructure, the market Proximity may affect outcomes in the Agility from the supply chains as well. According to these premises, the following research hypothesis is proposed:
Hypothesis 5 (H5).
Market Proximity, which is linked to suppliers, customers, and regional competitors, has a direct and positive effect on the Agility levels of the supply chains in manufacturing companies.
In addition, the Agility of the SC is widely considered a success factor in companies, since it allows boosting competitive advantages. Authors such as Swafford [65] have mentioned that Agility represents a strong interface between the company and its market, improving deliveries to its customers. Also, as an answer to market changes, companies should keep as much as possible the ability to provide the highest value to their products, improve risk management, and fulfill their customers’ needs in an agile manner, in order to improve the company performance. Additionally, manufacturing Agility has a direct and positive effect on Financial performance. This was substantiated by several authors. For instance, in their study of manufacturers enterprises, Gligor et al. [4] found evidence that Agility directly impacts the firm’s Financial performance (i.e., Return on Assets). Similarly, other authors have proposed a direct and positive relationship between agile manufacturing and Financial performance [7,66,67]. In general, the Financial performance envisages the strengthening of the competitive position in companies, the adaptability to change market scenarios and Government regulations, market image improvement, customer attention and satisfaction, loyalty augmentation, and customer retention. According to the previous conjectures, the following hypothesis is proposed in the manufacturing sector.
Hypothesis 6 (H6).
Agility in the supply chain has a direct and positive impact on the manufacturing companies’ Financial performance.
Using the previous data and the proposed hypotheses, the following illustrated model in Figure 1 is presented, which indicates the relationships that must be evaluated to determine if there is any contribution between the variables.

4. Methodology

4.1. Obtaining and Screening Information

In the present research, a measurement instrument (questionnaire) was applied, which was focused on determining valuations regarding SC aspects, which included different variables to find relationships between them. In addition, the considered dimensions in the instrument were: Government (five items), regional Infrastructure (four items), market Proximity (three items), Agility (five items), and Financial performance (three items). It was necessary to adapt the instrument dimensions to the Spanish language, because the instrument was originally applied in English language among manufacturing companies by Bhatnagar and Sohal [51]. Additionally, there was an inclusion of different items. In the questionnaire, a Likert rating scale (totally disagree = 1, disagree = 2, disagree or agree = 3, agree = 4, and totally agree = 5) was used to determine the activities and performance levels achieved (benefits) in the chain when they were applied. Also, in order to achieve the previous process, two fundamental stages were considered: one related to the questionnaire, and the other to its validation.
The questionnaire: A previously applied questionnaire was used as a base; therefore, a validation is done by professional judges to adapt it to the current context. In addition, the redaction, congruence, and clarity of the item in each dimension was considered, which allowed readjusting the statements in order to improve their quality. The next step was to conduct a pilot test of the questionnaire by applying it to 20 people in the industry. Also, improvement observations were received and considered; with this information, the initial consistency of the questionnaire was calculated. Data gathering was successful; consequently, it was determined to apply the questionnaire to the companies. Moreover, this instrument was applied to employees from manufacturing companies in Ciudad Juárez, Chihuahua, Mexico, with random participation. In addition, to promote the electronic questionnaire (SurveyMonkey platform) the association of maquiladoras Index Juárez presented a formal invitation to registered companies to achieve a greater collaboration. Thus, the instrument was sent to managers and engineers in order to get more participation. Also, undergraduate students who currently work in the logistics or SC area and their supervisors were also invited to complete the questionnaire. These application methods were the finest way to get more participation from companies. Finally, the collected data was recorded in the SPSS 24.0 software to continue with the validation.
Validation: For this stage, the data was registered in SPSS database first; then, it continued to detect extreme and missing values, because it usually happens that participants forget to provide some answer. These are then replaced by the median through an ordinal scale [68]. In the statistical validation, indicators were considered that measure the internal consistency of the items, the convergent and discriminant validity between them, and their extracted variance.
First, the Cronbach’s alpha index (CAI) was used to evaluate the internal consistency of the items along with their assigned values. The recommended values for CAI are greater or equal to 0.7 [69,70,71]. Then, the average extracted variance (AVE for its acronym in English) and the combined and cross-charges were used as indicators of convergent and discriminant validity, where the recommended minimum values are values of 0.50, in addition to the p-value in the case of crossed charges, where values less or equal to 0.05 are accepted [69,72,73]. Also, the variance inflation factor (VIF) was also used to detect the possible collinearity between variables; in this case, values less or equal to 3.3 are accepted [69]. Finally, the Q2 indicator was used as a non-parametric measure, because the questionnaire was answered on a scale, and values greater than zero are expected, which must be similar to the R2 values [69,72,73].

4.2. Structural Model Analysis

In this section, finding the causal relationships between the variables that integrate the proposed model to define the contributions between them is considered. Therefore, the Financial performance outcomes are evaluated. In addition, these variables are composed by items or the observable variables that describe them. The best tool to find simultaneous causal relationships among diverse variables is through structural equation modeling, which is a second-generation multivariable methodology analysis. For this reason, it will be necessary to use a specialized software, specifically with algorithms based on partial least squares, which is recommended for small samples in order to discover theories about a particular behavior [68].
Furthermore, in Figure 1, the proposed relationships are modeled using WarpPLS 6.0 to test and estimate their parameters, which meant finding the contributions of each relationship with the statistic that expresses the degree where the data fit the proposed model, confirming its validity. Also, in order to evaluate the parameters in the model, the following efficiency indexes should be considered: the coefficients average in the APC (average path coefficient) ratios, the average R2 (ARS), the average variance inflation factor (AVIF), and the Tenenhaus goodness of fit (GoF) adjustment goodness index, which is a measure of the explanatory capacity model. For the APC and ARS, the associated p-value is considered, which must be less than 0.05. In the case of AVIF, the values must be under five (91), although a value of 3.3 is often allowed. The GoF instead considers values > 0.1 to indicate low adjustment, values > 0.25 to indicate medium adjustment, and values > 0.36 to indicate a high setting [69]. In addition, in order to evaluate the contributions as direct effects, the values of the β and p-values found in the proposed relationships (hypotheses) are observed, and they are indicated with the dates in Figure 1. The β will indicate a unit of change in the independent variable and the dependent variable expressed in standard deviations. The p-value will be used to indicate the statistical significance of each obtained relationship.
Moreover, the effects are the acquired values about each contribution given by one or more independent and dependent variables in the model. The direct effects are the causal relationships that happen directly between two variables; they also indirectly imply the presence of three or more variables. There is an indirect effect when a third variable is involved that modulates the effect between the first two; in other words, the effect of the third variable passes to the first variable through the second. The total effects are also presented, which are the total sum of both direct and indirect effects among the model variables.

5. Results

5.1. Demographics Characteristics

In the present study, participants answered aspects related to their job position, including their experience level in that job, as well as the industrial sector related to the company where they work. In addition, it should be mentioned that there were some people who did not provide information on any of the demographic aspects, such as gender. Table 1 shows the demographic characteristics of the representative sample from the study, where it can be observed that the participation of 225 people from 65 companies was achieved. Also, among the identified sectors there are the following: automotive, medical, plastic, electronics, and packaging, among others. Table 1 illustrates, for example, the participation of 29.77% employees in companies focused on the automotive industry, another 24% in the electronics sector, and 17.33% in the medical sector; these were the highest percentages.
On the other hand, Table 2 shows the number of employees that the surveyed company has, which starts with five categories, and where the large companies with more than 500 employees predominated, as they corresponded to 68.88% of the total. Companies with between 201–500 employees followed, corresponding to 20.44%.
Additionally, we can comment that the job positions of the surveyed people were also identified. Among them, 54 managers, 50 operative workers and purchasing planners participated; there were also 40 supervisors and three operating directors. Most had more than four years of experience in their job; in fact, 60.44% of respondents had more than three years of experience, which means that the information provided in the questionnaire is acceptable due to the respondents’ experience and relationship with the SC.

5.2. Statistical Validation of Questionnaire

Table 3 projects the internal instrument validity, where composite reliability values and a CAI over 0.70 are observed. Regarding the market Proximity, a value of 0.640 is observed; it was not rejected, since it was considered relevant for the analysis. In addition, concerning the predictive validity, values over 0.20 and in some cases close values are presented, which concludes that the latent variables have an adequate prediction level. In relation to the convergence validity, the values from the average variance extracted (AVE) are greater than 0.50. This is the minimum value to be accepted in the variance, which is extracted from the items from each variable. It is also remarkable that there are no collinearity problems, since each variable has variance inflation indexes (VIF) under 3.3, which is the maximum allowed value.
The validation process also considers a discriminant validity to evaluate the level where each of the items measure their construct concepts, that is, to know to what extent they relate and correlate with each other. Also, this validity implies that each latent variable must be significantly different from the rest of the variables that have no relation [74]. In this case, the combined and cross-loads presented by the items are valued, as well as their p-value. In Table 4, this information is shown; note that the numbers marked in bold are the high saturations that the items have in their corresponding construct, and the rest of the numbers are the low (crossed) loads they have with the rest of the constructs. In all of the cases the loads are respected, and all of the p-values are 95% meaningful; this demonstrates the convergent and discriminant validity from the latent variables.

5.3. Efficiency Characteristics of Structural Model

As mentioned in the methodology section, the efficiency indexes of the model are used to evaluate the ability of the collected data to adjust with the causal relationships proposed. Table 5 presents the main indexes for these inferences; in the APC index, a value of 0.309 is observed for the Path coefficients, being significant with a p-value < 0.001. In the same way, the ARS (R2) has a value of 0.188 with a p-value also of 0.001; the ARS has a value of 0.182, which is also significant with 0.001 in its p-value. Also, the AVIF index corresponding to the inflation factor of the variance shows a value of 1.239, being very acceptable as it is under the allowed cut-off point of 3.3.
In addition, the GoF index shows an average adjustment of 0.344, because the relationships initially proposed are supported with the information provided by the participants. Finally, for an appropriate adjustment, it is only required to have values over 0.25; therefore, the obtained model is considered efficient to indicate these causal relationships.

5.4. Structural Model and the Effects between Variables

The structural model obtained is presented in Figure 2, and the direct relationships between the variables are indicated by arrows. The value of β shows the dependence between two latent variables, while the p-value points out the statistical significance of the relationship. As it can be observed, all p-values are under 0.01, which proves that all of the indirect relationships are statistically significant. Also, six significant relationships can be seen, where the greatest effect is the one presented by the Agility on the Financial performance of companies. In addition, this relationship is direct and positive with a β = 0.506, p < 0.001; this indicates that when each unit increases its standard deviation over Agility activities, an increase in the standard deviation of the company’s Financial performance benefits will be achieved with 0.506 units.
Furthermore, following with the analysis, it is observed that in each dependent variable, a value of R2 is portrayed, which indicates the variance percentage explained by the independent variables, that is, by the variables that impact them. In this model, we have two dependent latent variables affected by an independent latent variable (Infrastructure and Proximity), two variables influenced by a latent dependent variable (Agility and Proximity), and finally, a latent dependent variable affected by another dependent latent variable (Financial performance). Additionally, in order to explore the relationships found, it is also noticed that the regional Infrastructure has a R2 value = 0.190, meaning that 19% of the variance for this dependent latent variable is explained only by the support received from the Government.
Also, a R2 value = 0.141 is detected for Agility, which means that 14.1% of its variance is explained by the market Proximity and regional Infrastructure. In Agility, there are other aspects that are considered to achieve a satisfactory Agility level; the activities and elements used in this research validate that the available Infrastructure in a region and the Proximity to the target market help create a greater Agility in the SC, especially in manufacturing companies, which is the case where the questionnaire was applied. Finally, the model also displays a R2 value = 0.256 for Financial performance, which it means that 25.6% of the variance to explain this variable is only given by the Agility levels achieved in the SC.

5.4.1. Direct Effects, Size of the Effect, and Indirect Effects of Latent Variables

As previously mentioned, the effects are the values obtained about each relationship given by one or more independent and dependent variables in the model. The direct effects are the causal relationships that happen directly between two variables; while an indirect effect implies the presence of three or more variables. Table 6 shows the direct effects between variables that were already described in Figure 2, as well as the associated p-values and the size of the effects (ES). For instance, there is a direct and positive effect from the Government on the Infrastructure by β = 0.436, p < 0.001, and ES = 0.190, which means that the services availability and quality and Infrastructure depends in large part on the public policies anticipated and defined by the Government; it can explain 19% of the variability levels in the Infrastructure. On the other hand, Infrastructure has an effect on market Proximity of β = 0.297, p < 0.001 with a value of ES = 0.111; this means that the suppliers, competitors, customers, services, etc., Proximity are achieved through Infrastructure, since this can explain 11.1% of the variability in Market Proximity.
In addition, remember that the indirect effects are obtained by multiplying the direct effects of the involved latent variables. As an example, market Proximity is indirectly related through Agility, with the Financial performance as 0.221 × 0.506 = 0.111. Similarly, for all of the effects, the same argument applies, even though the indirect effect is by three or more ways. In all of the cases, the values of p-value are under 0.05 and significant at 95%. This can be presented in Table 7, where the indirect effects in the model are illustrated. Also, note that the greater indirect effect occurs between the Infrastructure and the Financial performance with 0.146 change units, and it has a weak explanatory power since a 2.7% variability is achieved with an ES = 0.027. There is an indirect effect from the Government on the Financial performance (in bold letters) either by Infrastructure or Proximity; however, it is important to notice that this indirect effect is not significant, because the p-value is higher than 0.05, and which is the maximum acceptable level suggested for the statistical significance test.

5.4.2. Total Effects between Variables

Table 8 presents the total effects among the latent variables according to the p-values; only one total effect is not statistically significant (bold letters), and the rest of them are significant at a reliability level of 95%. Thus, the greater total effect occurs between Agility and the Financial performance, with a value of 0.506 being 99% relevant with an effect size ES = 0.256, indicating a contribution in the benefits variability with 25.6%.
According to the previous information, the following statements can be established:
  • All effects between the variables are positive.
  • The support offered by the Government affects the Regional Infrastructure to a greater extent, which means that public policies influence the available Infrastructure in cities, regions, or countries.
  • The Government also indirectly impacts the Agility of SCs through such policies that affect the Infrastructure such as services, roads, transportation, ports, land, energy, etc.
  • Government support has no direct effect on the supply chains Financial performance as benefits in manufacturing companies, although an indirect effect was identified; however, it was not statistically significant.
  • According to the previous observations, it is possible to discuss the industrial implications that represent the effects found in the model.

6. Discussion: Industrial Implications

In the structural model, some significant implications were found for the manufacturing industry of Ciudad Juarez. On the one hand, the hypotheses are based on the information gathered from questionnaires; therefore, the suggested relationships agree with those practices that are related closely with the relationship that Government support and Infrastructure have in the SC in this type of company. On the other hand, the contributions between the variables are the result of the levels of execution activities in industrial practice. It means, the levels of Infrastructure in the region (land availability, energy resources, transportation, telecommunications, Internet) from the current case are considered adequately linked to the demands of the active manufacturing companies. Furthermore, the support received from the Government to protect foreign investment or facilitate logistics operations is also considered acceptable, although improvements in the health aspect are suggested. Also, the market Proximity, which includes suppliers, customers, competitors, and services is considered a principal factor to create Agility, in other words, to respond quickly to market changes or adjust its customers’ needs, which depends on the Government support.
Finally, participants consider that in their companies, the Government support is adequate due to the Infrastructure in the region. This is supported by Bhatnagar and Sohal [51], who assured that companies obtain greater benefits when the environment where they operate (Infrastructure, Government, Proximity) are considered. Therefore, the data provided by the respondents for these aspects is relevant, because it is the antecedent to establish new strategies to improve both the current governmental and industrial system; in this way, it is possible to increase the industry development in the region.

7. Conclusions

As conclusions, the six proposed hypotheses in the model from Figure 1 are accepted, since statistically there is evidence to declare that in each of them, the causal relationship or effect between variables is not trivial; that is, the proposed relationship is supported by the obtained data from the manufacturing companies and the p-value associated with it.
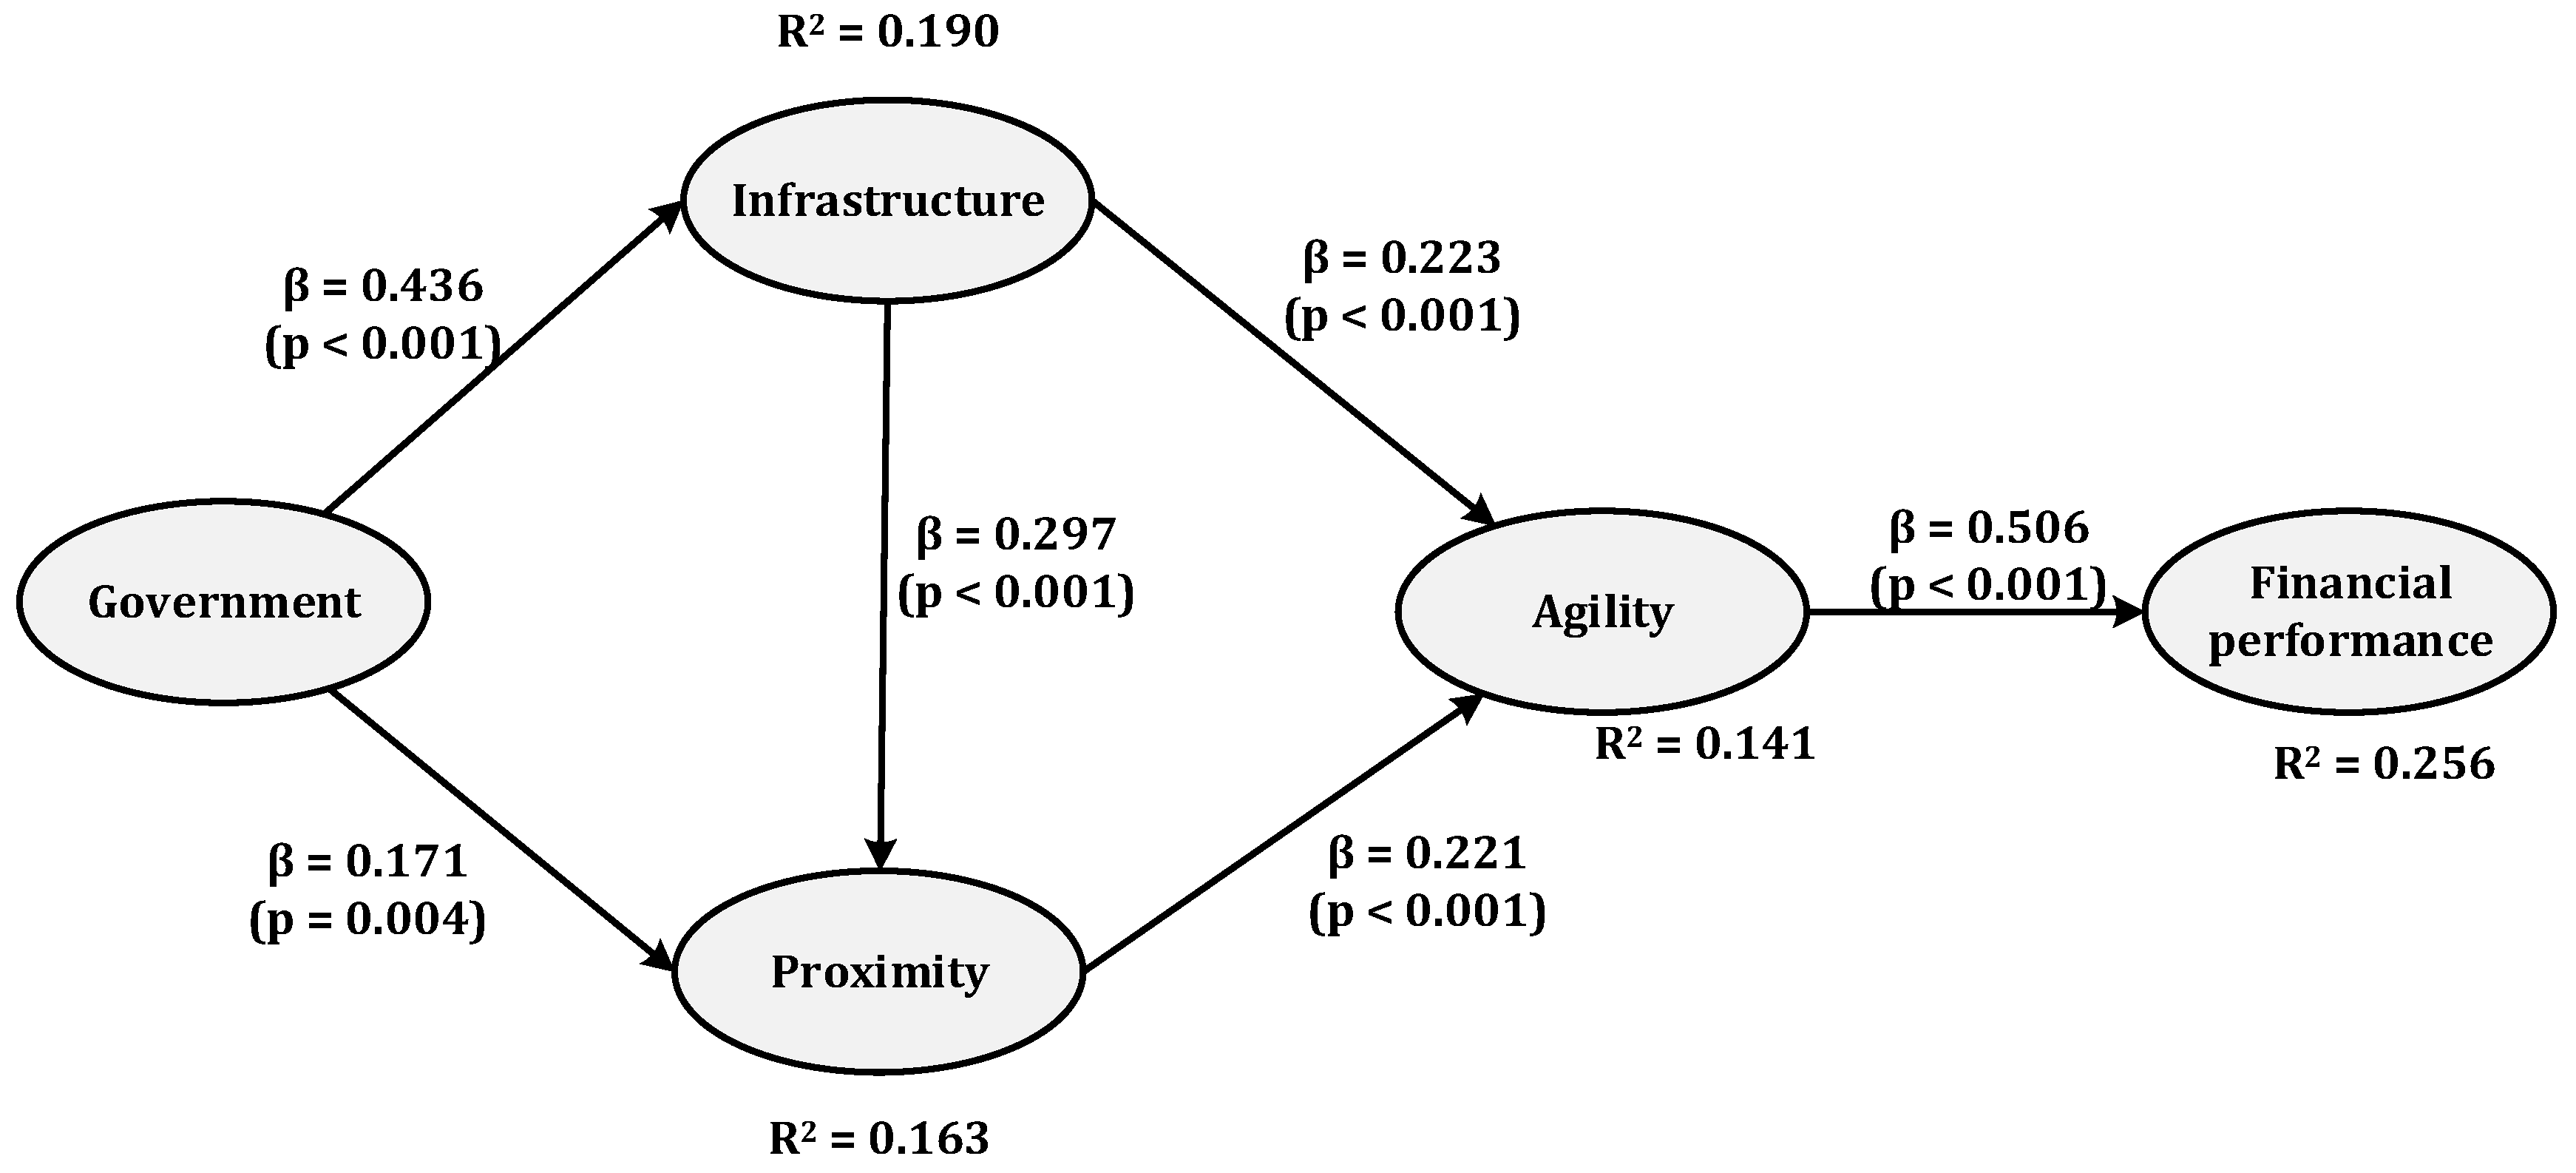
According to Hypothesis H1, there is statistical evidence to declare with a 99% level of significance that the Government directly and positively influences the regional Infrastructure levels at a rate of 0.436. In H2, there is also statistical evidence to declare that Government support influences the market Proximity, because it is certain that through the Infrastructure levels available in the region, it is easier to locate suppliers, clients, and service providers to improve operations in the supply chains in manufacturing companies engaged with exportation. Likewise, regarding H3, statistical evidence declares that the regional Infrastructure levels influence the market Proximity. This means that the market Proximity destination is achieved when there are adequate levels of transportation services, roads, energy, communications, labor, television, radio, etc. in a certain city or country. Hence, we intend to locate companies in the northern border of Mexico, because of its Proximity to the United States of America and the services that are offered to facilitate the importation and exportation operations of goods.
Regarding hypothesis H4, statistical evidence was found to declare a 99% level of significance as well, because the regional Infrastructure influences a proportion of 0.223 in the Agility achieved in the supply chains in manufacturing companies. Consequently, as some authors comment [4], Agility is the companies’ ability to respond to changes in customers demand and needs; therefore, if there is no exchange data in real time (internet, telephone), it is not possible to adjust the manufacturing processes in the company.
In the same way, there is statistical evidence to state that the market Proximity influences the Agility at a change rate of 0.221. Evidently, the Proximity of suppliers, customers, services, and transportation, among others, facilitate the operations in the supply chains, because the Proximity that Ciudad Juárez has with the United States of America is undoubtedly an advantage for the region due to the importation and exportation creating and generating competitiveness in human capital. As a result, together with the available Infrastructure, a higher level of innovation is achieved where there is greater interest from the industry, which makes sense.
Finally, for hypothesis H6, statistical evidence was also gathered to claim that Agility has a direct and positive influence on companies’ Financial performance through the improvement in the management of their supply chains. This certainly means that the Government’s public policies and support indirectly influence companies’ economic growth, because it is a direct provider of the improvement in regional Infrastructure and market Proximity levels to improve operations; it also indirectly influences the Agility of the chain. In this sense, Government support and the generated policies have positive effects, as found in the results on the manufacturing companies Financial performance, such as cash flow or sales improvement, in addition to the value aggregation and reduction of costs in operations. All of this is accomplished through the Proximity advantage and regional Infrastructure that is available, as well as the ability to adapt to market dynamic changes (SC Agility).
To sum up with the model and the outcomes that were retrieved according to the present case study, as some authors had suggested [41], the Proximity of the market destination, whether they are suppliers, customers, services, allows speeding up industrial operations [51] of importation and exportation of goods; therefore, it reduces costs investment and the time to carry them out. This is particularly true for Ciudad Juarez with the United States, being a city border. In addition, this Proximity has allowed the regional Infrastructure to acquires acceptable levels and quality over time to facilitate the productive supply chain operations of the companies established in the city. On one hand, this has been supported by Government policies to attract more investment to the country. On the other hand, it would be considered that Government support directly affects companies’ financial achievements. In this sense, this model contradicts itself, since such an improvement is only perceived through Infrastructure, Proximity, and Agility. Therefore, there is evidence to establish that improvements in public policies provide Infrastructure consolidation, because the environment does have an impact on supply chains and regional development.
Furthermore, Government support and the market Proximity analysis, as well as their relationship with Agility and Financial performance, allow concluding that the industrial scheme available in Ciudad Juárez allows companies to improve their competitiveness by reducing times, costs, and commuting distances to import raw materials and export finished products. Also, the particular circumstances in the supply chains (global chain structure) for this type of company—such as innovation and transfer of development, for instance in the Delphi Case—have allowed them to not only obtain benefits, but also improve the cash flow in the region, since the amount of employment opportunities increased along with the workforce competitive skills.
The model obtained helps offer some interpretations about the data collected from managers, technicians, engineers, and specialists regarding the perceptions that they have about the Government support in the industry and the Infrastructure levels that are available in order to carry out product transformation and distribution operations abroad. The results found indicate the importance of having public policies that support the growth of companies, so that they directly intervene in the results of regional competitiveness, which are achieved through competencies reached by workers, experiences, services, and economic growth, among many other factors. In this sense, it was discovered in the region of the case presented, that indeed through the supply chains, the indirect participation of the Government regarding Infrastructure and market Proximity influence the Financial performance of the companies. This is a key factor in the manufacturing companies given the global competition, mainly as it prevents companies from relocating to other cities since they generate employment, and it is through them that the livelihood of a large part of the population is achieved. The applicability of the results found in the model suggests giving feedback to companies and the Government on the way in which public policies and Infrastructure levels intervene in their financial growth, thereby establishing strategies to improve Infrastructure, and municipal, state, and federal Government support.

Author Contributions

In the elaboration of this article some collaborators participated who contributed significantly in order to get the expected final product. Particularly, L.A.-S. carried out the experimental analysis from the questionnaire design and the field research as well, on the model proposal; J.L.G.-L. participated in the data analysis to achieve the structural equation modeling and find the relationships between the variables; On the other hand, J.M.M.-M. carried out the data descriptive analysis and helped writing the background for the hypotheses. Finally, A.A.M.-M. Maldonado and G.A.H. improved the writing of the document and wrote the final conclusions.

Funding

This research was funded by CONACyT through project Thematic Network of Industrial Process Optimization (ROPRIN) no. 293683.

Acknowledgments

The present research has been done thanks to the manufacturing industry availability in Ciudad Juarez to answer the survey about SC, and additionally, we thank the National Council of Science and Technology (CONACyT) and the Teachers’ Professional Development Program (PRODEP) for the support granted in this investigation.

Conflicts of Interest

The authors in this article claim the following: “I Liliana Avelar Sosa, Jorge Luis García Alcaraz, José Manuel Mejía Muñoz, Aide Aracely Maldonado Macías, and Giner Alor Herández” authors of this investigation declare that there is no conflict of interest.

References

  1. Zeng, B.; Yen, B.P.C. Rethinking the role of partnerships in global supply chains: A risk-based perspective. Int. J. Prod. Econ. 2017, 185, 52–62. [Google Scholar] [CrossRef]
  2. Hoffmann, P.; Schiele, H.; Krabbendam, K. Uncertainty, supply risk management and their impact on performance. J. Purch. Supply Manag. 2013, 19, 199–211. [Google Scholar] [CrossRef]
  3. Banerjee, A.; Ganjeizadeh, F. Modeling a Leagility Index for Supply Chain Sustenance. Proced. Manuf. 2017, 11 (Suppl. C), 996–1003. [Google Scholar] [CrossRef]
  4. Gligor, D.M.; Esmark, C.L.; Holcomb, M.C. Performance outcomes of supply chain agility: When should you be agile? J. Oper. Manag. 2015, 33–34, 71–82. [Google Scholar] [CrossRef]
  5. Sangari, M.S.; Razmi, J.; Zolfaghari, S. Developing a practical evaluation framework for identifying critical factors to achieve supply chain agility. Measurement 2015, 62, 205–214. [Google Scholar] [CrossRef]
  6. Braunscheidel, M.J.; Suresh, N.C. The organizational antecedents of a firm’s supply chain agility for risk mitigation and response. J. Oper. Manag. 2009, 27, 119–140. [Google Scholar] [CrossRef]
  7. De Groote, S.E.; Marx, T.G. The impact of IT on supply chain agility and firm performance: An empirical investigation. Int. J. Inf. Manag. 2013, 33, 909–916. [Google Scholar] [CrossRef]
  8. Garcia-Alcaraz, J.L.; Maldonado-Macias, A.A.; Hernandez-Arellano, J.L.; Blanco-Fernandez, J.; Jimenez-Macias, E.; Muro, J.C. The impact of human resources on the agility, flexibility and performance of wine supply chains. Agric. Econ. (Czech Repub.) 2017, 63, 175–184. [Google Scholar] [Green Version]
  9. Brusset, X. Does supply chain visibility enhance agility? Int. J. Prod. Econ. 2016, 171 Pt 1, 46–59. [Google Scholar] [CrossRef] [Green Version]
  10. Loya, V.M.; Alcaraz, J.L.; Reza, J.R.; Gayosso, D.G. The Impact of ICT on Supply Chain Agility and Human Performance. In Handbook of Research on Information Management for Effective Logistics and Supply Chains; Leal, J.G., Lucas, S.A., Magalhães, P.C.R., Eds.; IGI Global: Hershey, PA, USA, 2017; pp. 180–198. [Google Scholar]
  11. Mergel, I.; Gong, Y.; Bertot, J. Agile government: Systematic literature review and future research. Gov. Inf. Q. 2018, 35, 291–298. [Google Scholar] [CrossRef]
  12. Kim, M.; Chai, S. The impact of supplier innovativeness, information sharing and strategic sourcing on improving supply chain agility: Global supply chain perspective. Int. J. Prod. Econ. 2017, 187, 42–52. [Google Scholar] [CrossRef]
  13. Samdantsoodol, A.; Cang, S.; Yu, H.; Eardley, A.; Buyantsogt, A. Predicting the relationships between virtual enterprises and agility in supply chains. Expert Syst. Appl. 2017, 84, 58–73. [Google Scholar] [CrossRef]
  14. Hadjimarcou, J.; Brouthers, L.E.; McNicol, J.P.; Michie, D.E. Maquiladoras in the 21st century: Six strategies for success. Bus. Horiz. 2013, 56, 207–217. [Google Scholar] [CrossRef]
  15. OECD. Higher Education in Regional and City Development Higher Education in Regional and City Development: North Pass, Mexico and the United States 2010; Higher Education in Regional and City Development; OECD Publishing: Paris, France, 2010. [Google Scholar]
  16. IndexJuárez. Weekly Statistics. 2018. Available online: https://indexjuarez.com/estadisticas/infograma (accessed on 31 March 2018).
  17. INEGI. Manufacturing Industry and Non Manufacturing of Exportation Industry. 2018. Available online: http://www.beta.inegi.org.mx/temas/manufacturasexp/ (accessed on 31 March 2018).
  18. Economía, S.D. Automotive Exporter. 2016. Available online: https://www.gob.mx/busqueda?utf8=✓&site=se&q=exportador+automotriz (accessed on 31 March 2018).
  19. Zhou, Y.-W.; Guo, J.; Zhou, W. Pricing/Service Strategies for a Dual-Channel Supply Chain with Free Riding and Service-Cost Sharing. Int. J. Prod. Econ. 2018, 196, 198–210. [Google Scholar] [CrossRef]
  20. Shu, T.; Wang, Y.; Chen, S.; Wang, S.; Lai, K.K.; Yang, Y. Decisions on Remanufacturing with WTP Disparity and Recycling Competition under Government Subsidies. Sustainability 2017, 9, 1503. [Google Scholar] [CrossRef]
  21. Klumpp, M. How to Achieve Supply Chain Sustainability Efficiently? Taming the Triple Bottom Line Split Business Cycle. Sustainability 2018, 10, 397. [Google Scholar] [CrossRef]
  22. Bastas, A.; Liyanage, K. Sustainable supply chain quality management: A systematic review. J. Clean. Prod. 2018, 181, 726–744. [Google Scholar] [CrossRef]
  23. Chu, S.H.; Yang, H.; Lee, M.; Park, S. The Impact of Institutional Pressures on Green Supply Chain Management and Firm Performance: Top Management Roles and Social Capital. Sustainability 2017, 9, 764. [Google Scholar] [CrossRef]
  24. Lou, G.X.; Xia, H.Y.; Zhang, J.Q.; Fan, T.J. Investment Strategy of Emission-Reduction Technology in a Supply Chain. Sustainability 2015, 7, 10684. [Google Scholar] [CrossRef]
  25. Madani, S.R.; Rasti-Barzoki, M. Sustainable supply chain management with pricing, greening and governmental tariffs determining strategies: A game-theoretic approach. Comput. Ind. Eng. 2017, 105, 287–298. [Google Scholar] [CrossRef]
  26. Mahmoudi, R.; Rasti-Barzoki, M. Sustainable supply chains under government intervention with a real-world case study: An evolutionary game theoretic approach. Comput. Ind. Eng. 2018, 116, 130–143. [Google Scholar] [CrossRef]
  27. Xie, L.; Ma, J. Study the complexity and control of the recycling-supply chain of China’s color TVs market based on the government subsidy. Commun. Nonlinear Sci. Numer. Simul. 2016, 38, 102–116. [Google Scholar] [CrossRef]
  28. Mo, W.; Balen, D.; Moura, M.; Gardner, K.H. A Regional Analysis of the Life Cycle Environmental and Economic Tradeoffs of Different Economic Growth Paths. Sustainability 2018, 10, 542. [Google Scholar] [CrossRef]
  29. Mani, V.; Gunasekaran, A.; Delgado, C. Supply chain social sustainability: Standard adoption practices in Portuguese manufacturing firms. Int. J. Prod. Econ. 2018, 198, 149–164. [Google Scholar] [CrossRef]
  30. Marí Farinós, J. Sustainability as an Object of Corporate Social Responsibility; Universitat Politècnica de Valencia: València, Spain, 2017. [Google Scholar]
  31. Popovic, T.; Barbosa-Póvoa, A.; Kraslawski, A.; Carvalho, A. Quantitative indicators for social sustainability assessment of supply chains. J. Clean. Prod. 2018, 180, 748–768. [Google Scholar] [CrossRef]
  32. Qorri, A.; Mujkić, Z.; Kraslawski, A. A conceptual framework for measuring sustainability performance of supply chains. J. Clean. Prod. 2018, 189, 570–584. [Google Scholar] [CrossRef]
  33. Coyle, J.J.; Novack, R.A. Supply Chain Management: A Logstic Perspective, 9th ed.; Nelson Education: Toronto, ON, Canada, 2013; p. 720. [Google Scholar]
  34. Sánchez-Reaza, J. Trade, proximity and growth: The impact of economic integration on regional disparities in Mexico. Integr. Trade Mag. N 2010, 14, 19–32. [Google Scholar]
  35. Harrison, A.; New, C. The role of coherent supply chain strategy and performance management in achieving competitive advantage: An international survey. J. Oper. Res. Soc. 2002, 53, 263–271. [Google Scholar] [CrossRef]
  36. Viljoen, N.M.; Joubert, J.W. The Road most Travelled: The Impact of Urban Road Infrastructure on Supply Chain Network Vulnerability. Netw. Spat. Econ. 2017, 18, 85–113. [Google Scholar] [CrossRef]
  37. Blümel, E.; Boevé, W.; Recagno, V.; Schilk, G. Ship, port and supply chain security concepts interlinking maritime with hinterland transport chains. WMU J. Marit. Aff. 2008, 7, 205–225. [Google Scholar] [CrossRef]
  38. Verdouw, C.N.; Wolfert, J.; Beulens, A.J.; Rialland, A. Virtualization of food supply chains with the internet of things. J. Food Eng. 2016, 176, 128–136. [Google Scholar] [CrossRef] [Green Version]
  39. Kogan, K.; Tapiero, C.S. Coordination of co-investments in supply chain infrastructure. J. Intell. Manuf. 2012, 23, 2471–2475. [Google Scholar] [CrossRef]
  40. OECD. How Regions Grow: Trends and Analysis; OECD: Paris, France, 2009. [Google Scholar]
  41. Mendoza, J.E. The labor market in the northern border of Mexico: Structure and employmnet policies. Bord. Stud. 2010, 11, 9–42. [Google Scholar]
  42. Arroyo, P.E.; Cruz-Mejía, O. Logistics Activities as an Impetus for Regional Economic Development. In Sustainable Regional Development Veredas; Mexican Academy of Administratives Sciences: Mexico City, Mexico, 2017. [Google Scholar]
  43. Moradinasab, N.; Amin-Naseri, M.R.; Behbahani, T.J.; Jafarzadeh, H. Competition and cooperation between supply chains in multi-objective petroleum green supply chain: A game theoretic approach. J. Clean. Prod. 2018, 170, 818–841. [Google Scholar] [CrossRef]
  44. Iimi, A.; Humphrey, R.M.; Melibaeva, S. Firms? Locational Choice and Infrastructure Development in Rwanda; World Bank: Washington, DC, USA, 2015. [Google Scholar]
  45. Cipoletta, G.; Pérez, G.; Sánchez, R. Integrated Infraestructure, Transport and Logistics Policies: International Experiences and Initial Proposal; United Nations Economic Commission for Latin America and the Caribbean (CEPAL): Santiago, Chile, 2010. [Google Scholar]
  46. Raghunandan, H.; Parimal, N. Integrated Digital Marketing: The Key to Understanding Your Customer. Available online: http://www.tcs.com/SiteCollectionDocuments/White%20Papers/Integrated-Digital-Marketing-Understanding-Customer.pdf (accessed on 3 March 2014).
  47. Giurea, A.M. Proximity Market, the New Trend Approved by the Consumer’s Behavior. Int. J. Econ. Pract. Theor. 2015, 5, 462–469. [Google Scholar]
  48. Lagendijk, A.; Lorentzen, A. Proximity, Knowledge and Innovation in Peripheral Regions. On the Intersection between Geographical and Organizational Proximity. Eur. Plan. Stud. 2007, 15, 457–466. [Google Scholar]
  49. Fayezi, S.; Zutshi, A.; O’Loughlin, A. How Australian manufacturing firms perceive and understand the concepts of agility and flexibility in the supply chain. Int. J. Oper. Prod. Manag. 2015, 35, 246–281. [Google Scholar] [CrossRef]
  50. Qrunfleh, S.; Tarafdar, M. Lean and agile supply chain strategies and supply chain responsiveness: The role of strategic supplier partnership and postponement. Supply Chain Manag. Int. J. 2013, 18, 571–582. [Google Scholar] [CrossRef]
  51. Bhatnagar, R.; Sohal, A.S. Supply chain competitiveness: Measuring the impact of location factors, uncertainty and manufacturing practices. Technovation 2005, 25, 443–456. [Google Scholar] [CrossRef]
  52. Swafford, P.M.; Ghosh, S.; Murthy, N. The antecedents of supply chain agility of a firm: Scale development and model testing. J. Oper. Manag. 2006, 24, 170–188. [Google Scholar] [CrossRef]
  53. Yang, J. Supply chain agility: Securing performance for Chinese manufacturers. Int. J. Prod. Econ. 2014, 150, 104–113. [Google Scholar] [CrossRef]
  54. Barajas Bustillos, H.A.; Gutiérrez Flores, L. La importancia de la infraestructura física en el crecimiento económico de los municipios de la frontera norte. Estud. Front. 2012, 13, 57–88. [Google Scholar]
  55. Utar, H.; Ruiz, L.B.T. International competition and industrial evolution: Evidence from the impact of Chinese competition on Mexican maquiladoras. J. Dev. Econ. 2013, 105, 267–287. [Google Scholar] [CrossRef] [Green Version]
  56. Sayogo, D.S.; Zhang, J.; Luna-Reyes, L.; Jarman, H.; Tayi, G.; Andersen, D.L.; Pardo, T.A.; Andersen, D.F. Challenges and requirements for developing data architecture supporting integration of sustainable supply chains. Inf. Technol. Manag. 2015, 16, 5–18. [Google Scholar] [CrossRef]
  57. Cervantes-Martínez, R.; Villaseñor-Becerra, J.; Romero-Morett, M. NAFTA trade (and some extra NAFTA trade) in value added and its distribution, 1995–2011. J. Econ. Struct. 2016, 5, 27. [Google Scholar] [CrossRef]
  58. Sargent, J.; Matthews, L. What Happens When Relative Costs Increase in Export Processing Zones? Technology, Regional Production Networks, and Mexico’s Maquiladoras. World Dev. 2004, 32, 2015–2030. [Google Scholar] [CrossRef]
  59. Alcaraz, J.L.; Maldonado, A.A.; Iniesta, A.A.; Robles, G.C.; Hernández, G.A. A systematic review/survey for JIT implementation: Mexican maquiladoras as case study. Comput. Ind. 2014, 65, 761–773. [Google Scholar] [CrossRef]
  60. Vargas, G.A.; Johnson, T.W. An analysis of operational experience in the US/Mexico production sharing (maquiladora) program. J. Oper. Manag. 1993, 11, 17–34. [Google Scholar] [CrossRef]
  61. Besik, D.; Nagurney, A. Quality in competitive fresh produce supply chains with application to farmers’ markets. Socio Econ. Plan. Sci. 2017, 60, 62–76. [Google Scholar] [CrossRef]
  62. Shi, Y.; Yang, Z.; Yan, H.; Tian, X. Delivery efficiency and supplier performance evaluation in China’s E-retailing industry. J. Syst. Sci. Complex. 2017, 30, 392–410. [Google Scholar] [CrossRef]
  63. Jean, R.-J.; Sinkovics, R.R.; Cavusgil, S.T. Enhancing international customer–supplier relationships through IT resources: A study of Taiwanese electronics suppliers. J. Int. Bus. Stud. 2010, 41, 1218–1239. [Google Scholar] [CrossRef]
  64. Um, J. The impact of supply chain agility on business performance in a high level customization environment. Oper. Manag. Res. 2017, 10, 10–19. [Google Scholar] [CrossRef]
  65. Swafford, P.M.; Ghosh, S.; Murthy, N. Achieving supply chain agility through IT integration and flexibility. Int. J. Prod. Econ. 2008, 116, 288–297. [Google Scholar] [CrossRef]
  66. Inman, R.A.; Sale, R.S.; Green, K.W., Jr.; Whitten, D. Agile manufacturing: Relation to JIT, operational performance and firm performance. J. Oper. Manag. 2011, 29, 343–355. [Google Scholar] [CrossRef]
  67. Chan, A.T.L.; Ngai, E.W.T.; Moon, K.K.L. The effects of strategic and manufacturing flexibilities and supply chain agility on firm performance in the fashion industry. Eur. J. Oper. Res. 2017, 259, 486–499. [Google Scholar] [CrossRef]
  68. Avelar-Sosa, L.; García-Alcaraz, J.L.; Cedillo-Campos, M.G.; Adarme-Jaimes, W. Effects of regional infrastructure and offered services in the supply chains performance: Case Ciudad Juarez. DYNA 2014, 81, 208–217. [Google Scholar] [CrossRef]
  69. Kock, N. WarpPLS 4.0 User Manual; ScriptWarp Systems: Laredo, TX, USA, 2013. [Google Scholar]
  70. Nunnally, J.C.; Bernstein, I.H. Psychological Theory; MacGraw-Hill: New York, NY, USA, 1994. [Google Scholar]
  71. Fornell, C.; Larcker, D.F. Structural Equation Models with Unobservable Variables and Measurement Error: Algebra and Statistics. J. Mark. Res. 1981, 18, 382–388. [Google Scholar] [CrossRef]
  72. Hair, J.F., Jr.; Hult, G.T.; Ringle, C.; Sarstedt, M. A Primer on Partial Least Squares Structural Equation Modeling (PLS-SEM); Sage Publications: Thousand Oaks, CA, USA, 2016. [Google Scholar]
  73. Avelar-Sosa, L.; García-Alcaraz, J.L.; Vergara-Villegas, O.O.; Maldonado-Macías, A.A.; Alor-Hernández, G. Impact of traditional and international logistic policies in supply chain performance. Int. J. Adv. Manuf. Technol. 2015, 76, 913–925. [Google Scholar] [CrossRef]
  74. Bagozzi, R.P.; Yi, Y. Specification, evaluation, and interpretation of structural equation models. J. Acad. Mark. Sci. 2012, 40, 8–34. [Google Scholar] [CrossRef]
Figure 1. Structural model proposal and the relationship between variables.
Sustainability 10 02441 g001
Figure 2. Structural model obtained regarding market Proximity and Government support.
Sustainability 10 02441 g002
Table 1. Industrial sector from the surveyed companies.
SectorPercentage
Automotive29.77%
Medical17.33%
Plastics2.66%
Metals2.66%
Electronics24.00%
Packaging1.33%
Comunication0.88%
Services4.44%
Other13.33%
Consumption3.55%
Total100%
Table 2. Quantity of employees and companies sizes.
EmployeesQuantityPercentageSize Company
>50015568.88Large
101–5004620.44Medium
0–1002410.66Small
Total225100
Table 3. Statistical of questionnaire validation. AVE: average extracted variance, CAI: Cronbach’s alpha index, VIF: variance inflation factor.
IndicesGovernmentProximityVariables InfrastructureAgilityFinancial performance
R2 0.1640.1900.1410.256
Adjusted R2 0.1560.1870.1330.253
Reliability0.9190.8070.8420.9090.837
CAI0.8890.6400.7490.8740.705
AVE0.6980.5840.5710.6660.634
VIF1.2501.2011.3171.4601.365
Q2 0.1640.1890.1400.259
Table 4. Combined and crossed loads.
ItemGovernmentProximityVariables InfrastructureAgilityFinancial performancep-Value
Gob280.897−0.0800.065−0.1140.020<0.001
Gob290.917−0.0570.003−0.019−0.047<0.001
Gob300.887−0.0680.018−0.018−0.029<0.001
Gob310.7050.163−0.0980.1170.055<0.001
Gob320.7480.092−0.0110.0710.017<0.001
Proxi370.1420.7250.0710.004−0.145<0.001
Proxi38−0.0900.851−0.033−0.0100.110<0.001
Proxi39−0.0380.710−0.0330.0080.016<0.001
Infr170.075−0.0100.797−0.085−0.052<0.001
Infr180.016−0.0520.780−0.1310.025<0.001
Infr19−0.1400.0110.7600.0690.027<0.001
Infr200.0510.0590.6830.1720.003<0.001
Agi670.034−0.018−0.0850.835−0.016<0.001
Agi680.021−0.075−0.0530.844−0.037<0.001
Agi690.0390.033−0.0370.7820.062<0.001
Agi70−0.0760.0320.0360.835−0.086<0.001
Agi71−0.0170.0320.1460.7840.086<0.001
Fin72−0.1550.0630.0660.0060.663<0.001
Fin730.098−0.077−0.019−0.0010.842<0.001
Fin740.0230.026−0.031−0.0030.868<0.001
Table 5. Efficiency indices of the model. APC: average path coefficient.
IndexValueDecision
APC0.309p < 0.001
R20.188p < 0.001
R2 adjusted0.182p < 0.001
AVIF1.239Ideal ≤ 3.3
GoF0.344Medium ≥ 0.25
Table 6. Direct effects between variables (of Figure 2).
VariableGovernmentProximityInfrastructureAgility
Infrastructureβ = 0.436 (p < 0.001) ES = 0.190
Proximityβ = 0.171 (p = 0.008) ES = 0.052 β = 0.297 (p < 0.001) ES = 0.111
Agility β = 0.221 (p < 0.001) ES = 0.070β = 0.223 (p < 0.001) ES = 0.071
Financial performance β = 0.506 (p < 0.001) ES = 0.256
Table 7. Indirect effects between variables (of Figure 2).
VariableGovernmentProximityInfrastructure
Proximity0.130 (p = 0.003) ES = 0.040
Agility0.164 (p = 0.006) ES = 0.041 0.066 (p = 0.080) ES = 0.021
Financial performance0.083 (p = 0.062) ES = 0.0180.112 (p = 0.008) ES = 0.0100.146 (p < 0.001) ES = 0.027
Table 8. Total effects between variables.
VariableGovernmentProximityInfrastructureAgility
Infrastructure0.436 (p < 0.001) ES = 0.190
Proximity0.301 (p < 0.001) ES = 0.092 0.297 (p < 0.001) ES = 0.111
Agility0.164 (p = 0.006) ES = 0.0410.221 (p < 0.001) ES = 0.0700.228 (p < 0.001) ES = 0.092
Financial performance0.083 (p < 0.062) ES = 0.0180.112 (p = 0.008) ES = 0.0100.146 (p < 0.001) ES = 0.0270.506 (p < 0.001) ES = 0.256

