Article

Environmental Quantification of the Existing Waste Management System in a Developing World Municipality Using EaseTech: The Case of Bahawalpur, Pakistan

by
Asma Majeed
1,*,
Syeda Adila Batool
2 and
Muhammad Nawaz Chaudhry
3
1
College of Earth and Environmental Sciences, University of the Punjab, Lahore 54600, Pakistan
2
Department of Space Science, University of the Punjab, Lahore 54600, Pakistan
3
Department of Environmental Science and Policy, Lahore School of Economics, Lahore 53200, Pakistan
*
Author to whom correspondence should be addressed.
Sustainability 2018, 10(7), 2424; https://doi.org/10.3390/su10072424
Submission received: 23 May 2018 / Revised: 7 July 2018 / Accepted: 9 July 2018 / Published: 11 July 2018

Abstract

:
Evaluation of existing operational and managerial provisions and identification of specific actions that fit and impact in a local context is key to find sustainable solutions. The study aims to develop an understanding of existing waste management practices for a medium sized city of Pakistan and to quantify the related environmental impacts using life cycle assessment (LCA). The existing waste management system in “Bahawalpur”, a city with predominant rural-urban infusion, is characterized by straining resources, low generation rates (0.424 kg/capita/day), prominent source separation, high scavenging activities and open dumping practices. The waste composition analysis proposes organic wastes as the largest constituent (64%) followed by recyclables (27%) and inerts (9%). The LCA model “EaseTech” used to quantify the environmental performance of existing waste management arrangements illustrated that existing waste management system in Bahawalpur City has tangible effects on climate change (3.16 × 10⁷ kg CO2-Eq) and ecotoxicity (3.12 × 10⁶ CTU) categories, while depletion of abiotic resources fossil (−9.60 × 10⁷) category points up most environmental savings. Significant environmental compensations for different impact categories are offered due to high source separation and recycling trade off. The overview necessitates suitable modification in existing waste disposal practice that poses severe impacts on the environment.

1. Introduction

Advancement in the waste management sector during the past decade has transformed the simple process of collection of unsorted waste and its disposal to landfills into a systematic, integrated system [1,2,3]. Decision making today, takes into account a holistic approach considering the environmental, social, technical and economic aspects of the system [4,5,6]. Public health, environment, resource scarcity, climate change, public awareness and participation have acted as solid waste management drivers towards the current integrated waste management paradigm in the industrialized world. All these ends involve in-depth knowledge of the existing system to provide reliable information that can lead us to arrive at conclusions on how environmental hazards can be minimized and resources capitalized [7,8,9,10,11].
The situation in the LEDCs (less economically developed countries) is rather different, because understanding of these fundamental characteristics is scarce. Due to limited data availability, unskilled workforce and lack of expertise in the field, the strategic decisions are often based on presumptions rather than objective judgments [12,13]. Many LEDCs have opted for newer policies and conventional waste management practices are being abandoned for modern waste management options [14,15,16,17]. Per contra, there are practical challenges to consider in this very broad field and a variety of areas in which further achievements need to be made [18,19,20]. Low level of services, ineffective legislations, insufficient knowledge, deficiency of funds and following foreign schemes constrain the development of effective solid waste management systems in developing countries. The degree and nature of improvement towards environmental sustainability are also variable and highly dependent upon the economic status of the country [21,22]. The composition of generated municipal solid waste (MSW) also varies between geographical regions, from a country to another, among nations, cities and even within a city [23,24]. However, in a broad perspective the composition in LEDCs is similar with organic waste as the most prominent component. The waste has high moisture content and low calorific value [25,26]. While in MEDCs (more economically developed countries) the recyclable content is much higher in generated waste and the resulting waste has high calorific value and lower moisture content [24]. There is no single solution that can be applied to all cities and all situations. A useful requisite to consider is to narrow down the investigations to local levels to identify the hotspots (the areas with high environmental load potential) [27,28]. The step towards a sustainable society requires intricate measures to manage waste [29]. It has been perceived that assortment and implication of actions in local environmental and financial perspective with a strong political and social will can bring radical changes to the current waste management and is necessary for endurable solutions [20,30,31]. Incessant efforts are required to make people responsive to the demands of modern waste management practices. Continuous improvement is the only key to achieve waste management sustainability [23].
The situation as regards Pakistan is very reflective of developing countries. Increasing waste generation, high population, rapid urbanization, scarce resources, social inequality, communal perceptions and insufficient regulations have boosted the complexity of the system. 54,888 tons of municipal solid waste is being produced daily in cities of Pakistan. The average waste generation rate of some main cities varies from 1.896 kg/house/day to 4.29 kg/house/day [32]. Pakistani municipalities have always been accused of providing inadequate services to the people in their jurisdictions from waste collection up till its disposal. The subsequent discrepancy between the current solid waste management system and the increasing necessity for extended collection, treatment and disposal facilities leads to mounting amounts of solid waste within the urban environment producing unaesthetic and unhygienic conditions. The impacts are expected to gradually exceed and need to be quantified to realize the extent of problem and finding appropriate solutions.
Life cycle assessment (LCA) is a “cradle-to-grave” approach for assessing systems. According to ISO 14040:2006, LCA is “an analytical framework that is applied to assess the resources used and potential environmental impacts throughout a product’s life cycle, i.e., from raw material acquisition to waste disposal” [33]. Life cycle assessment has been extensively used in waste management studies, especially in MEDCs [34,35,36,37]. Strategic planning for waste management requires LCA modeling and can be referred as an advancement in waste management system. Many LCA tools have been developed for quick evaluation of the environmental impacts of various waste technologies and systems [38,39]. The process has been rapidly developing and widely acknowledged for quantification of environmental burdens associated with waste management practices. EaseTech “Environmental assessment system for Environmental technologies” is the latest model offered by DTU (Technical University of Denmark). It is most user-friendly, reliable and flexible among various other models. The scenarios are easy to assemble using boxes for different processes and joining them through arrows in any required order [40]. Moreover the model allows modifications to be used under varied circumstances in different geographic and socioeconomic regions. It surmises the loads and savings for different environmental categories originating from various waste management settings under different life cycle impact analysis (LCIA) methods. The overall goal is to illustrate the environmental costs associated with existing waste handling practices in Bahawalpur in a life cycle perspective. While fairly comprehensive studies exist on MSW of metropolitan Lahore [26,41,42] no thorough study exists for small and medium sized cities (population 250,000 to 1 million) of Pakistan. This study will help understand the existing solid waste scenario of small cities of the country that can be particularly supportive to administrators and decision-makers to help find sustainable solutions and navigate the strategic policy making process.

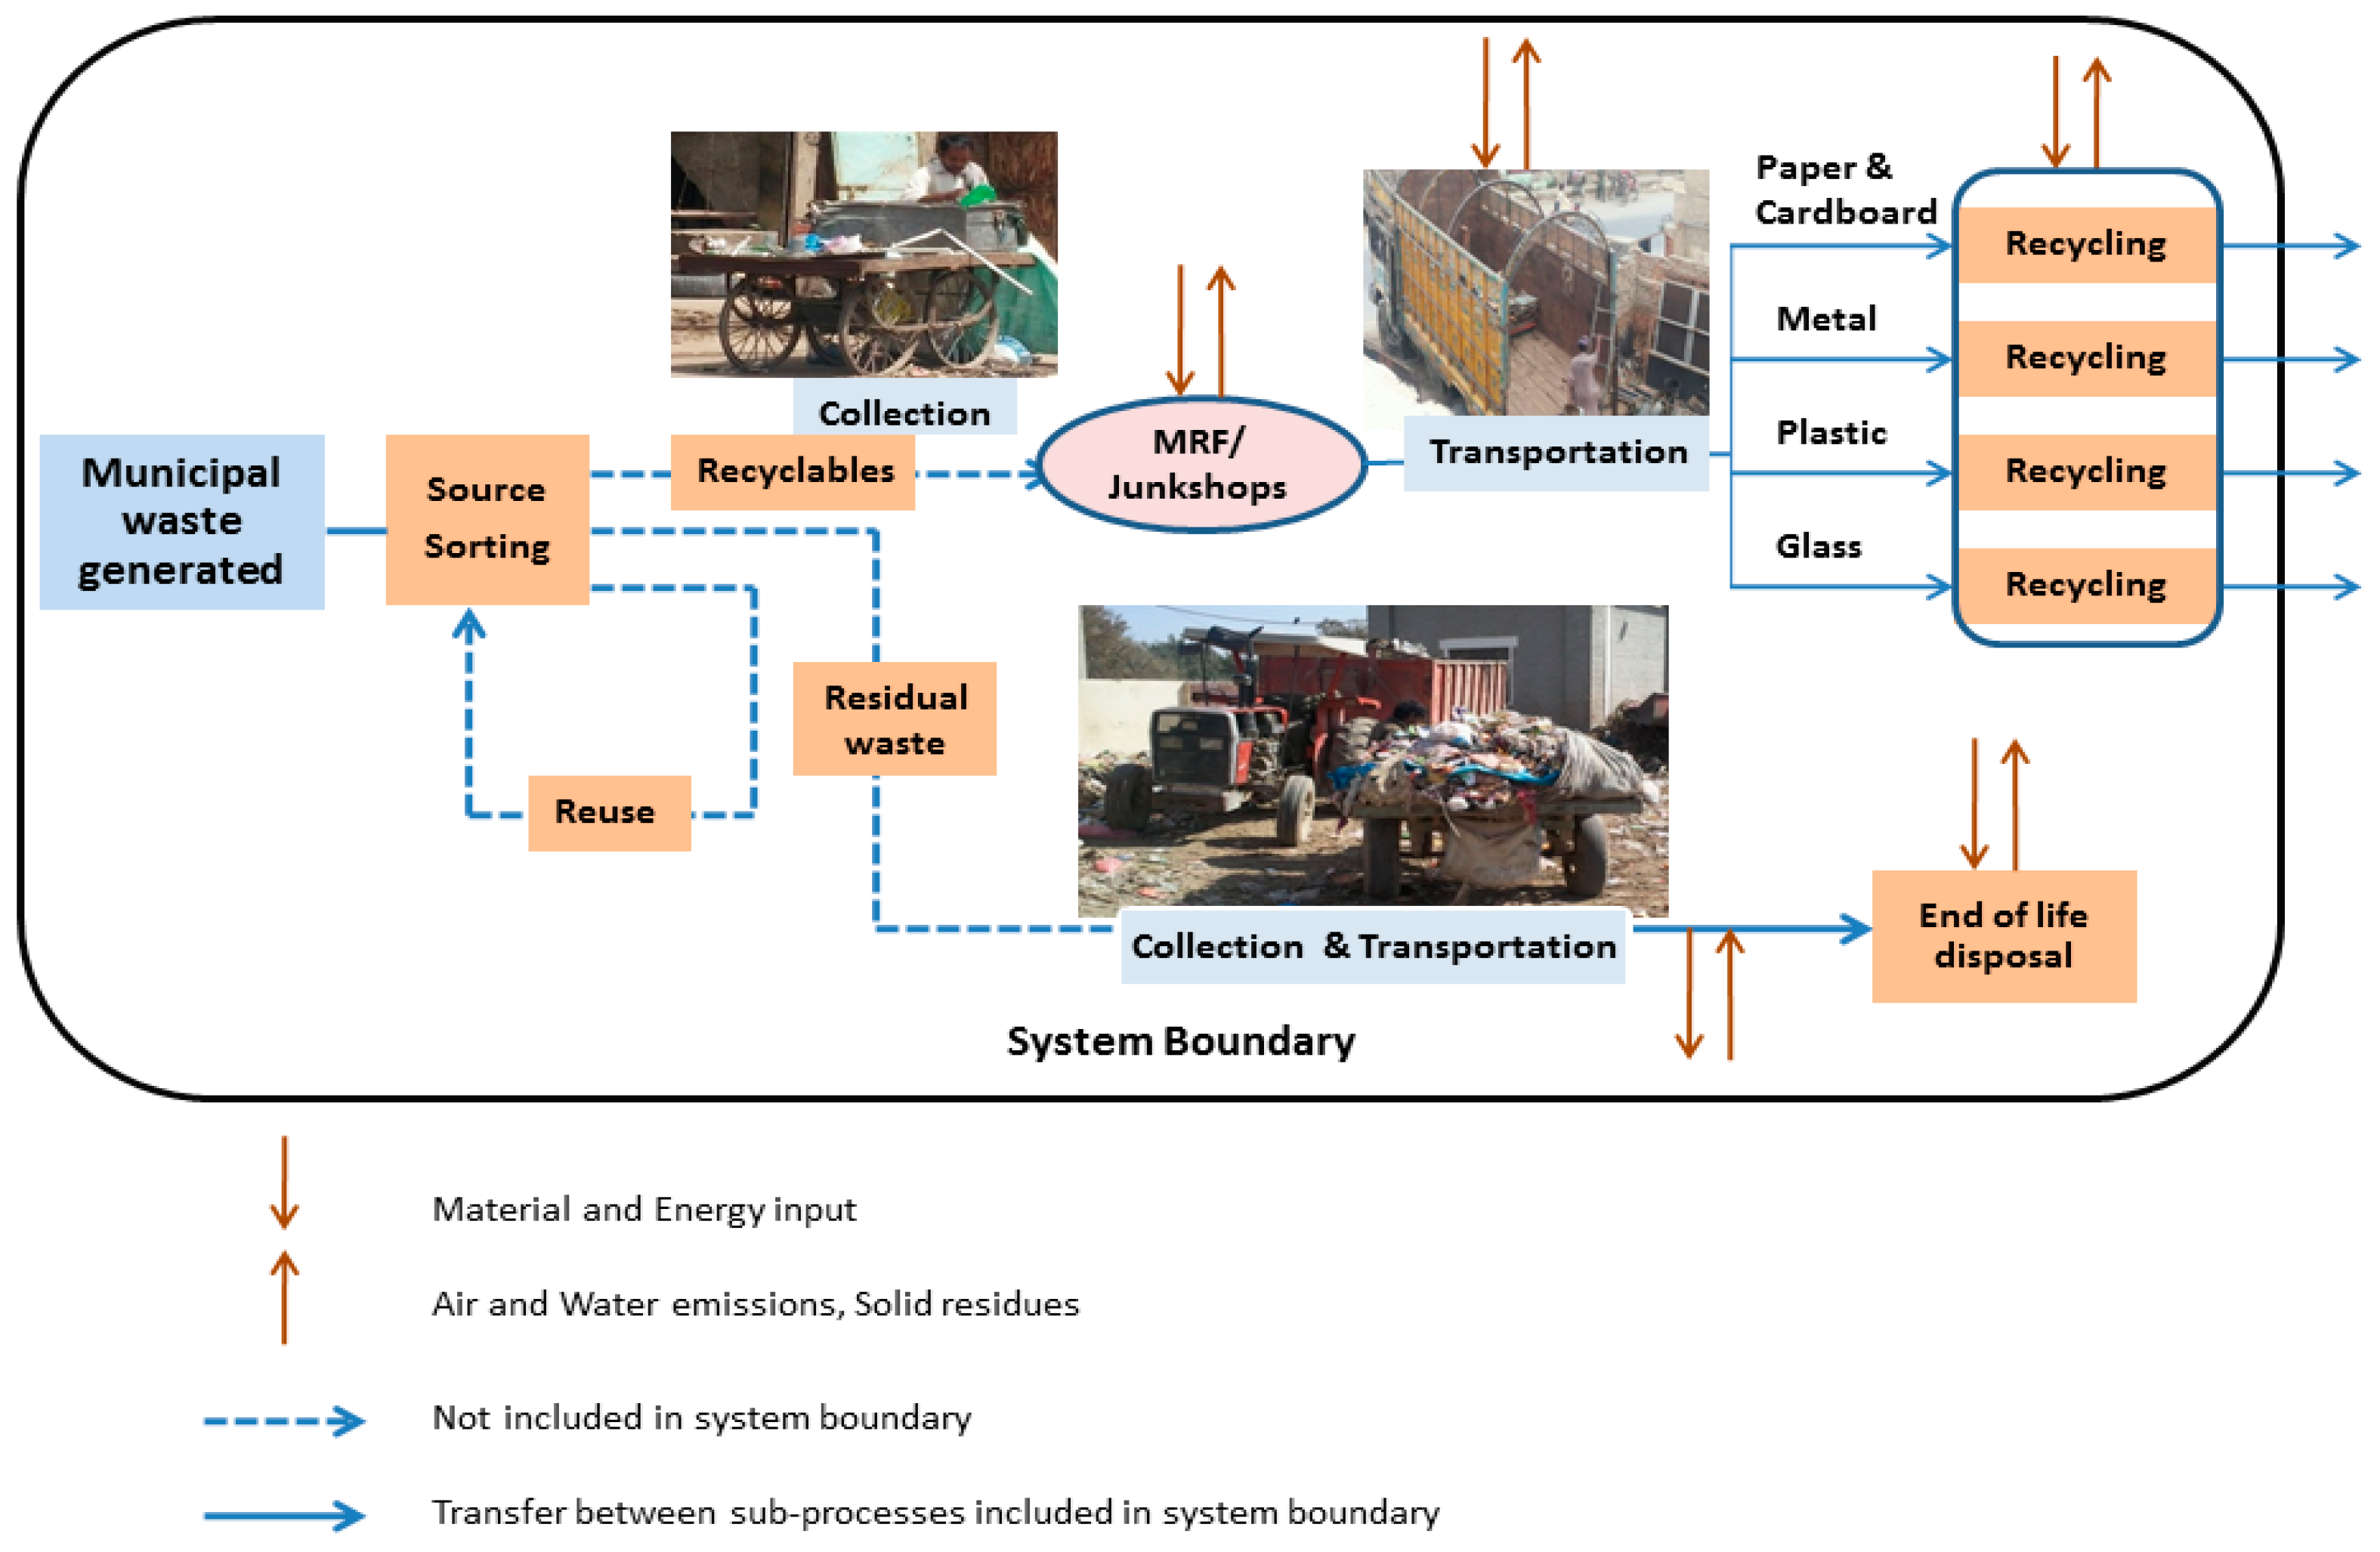
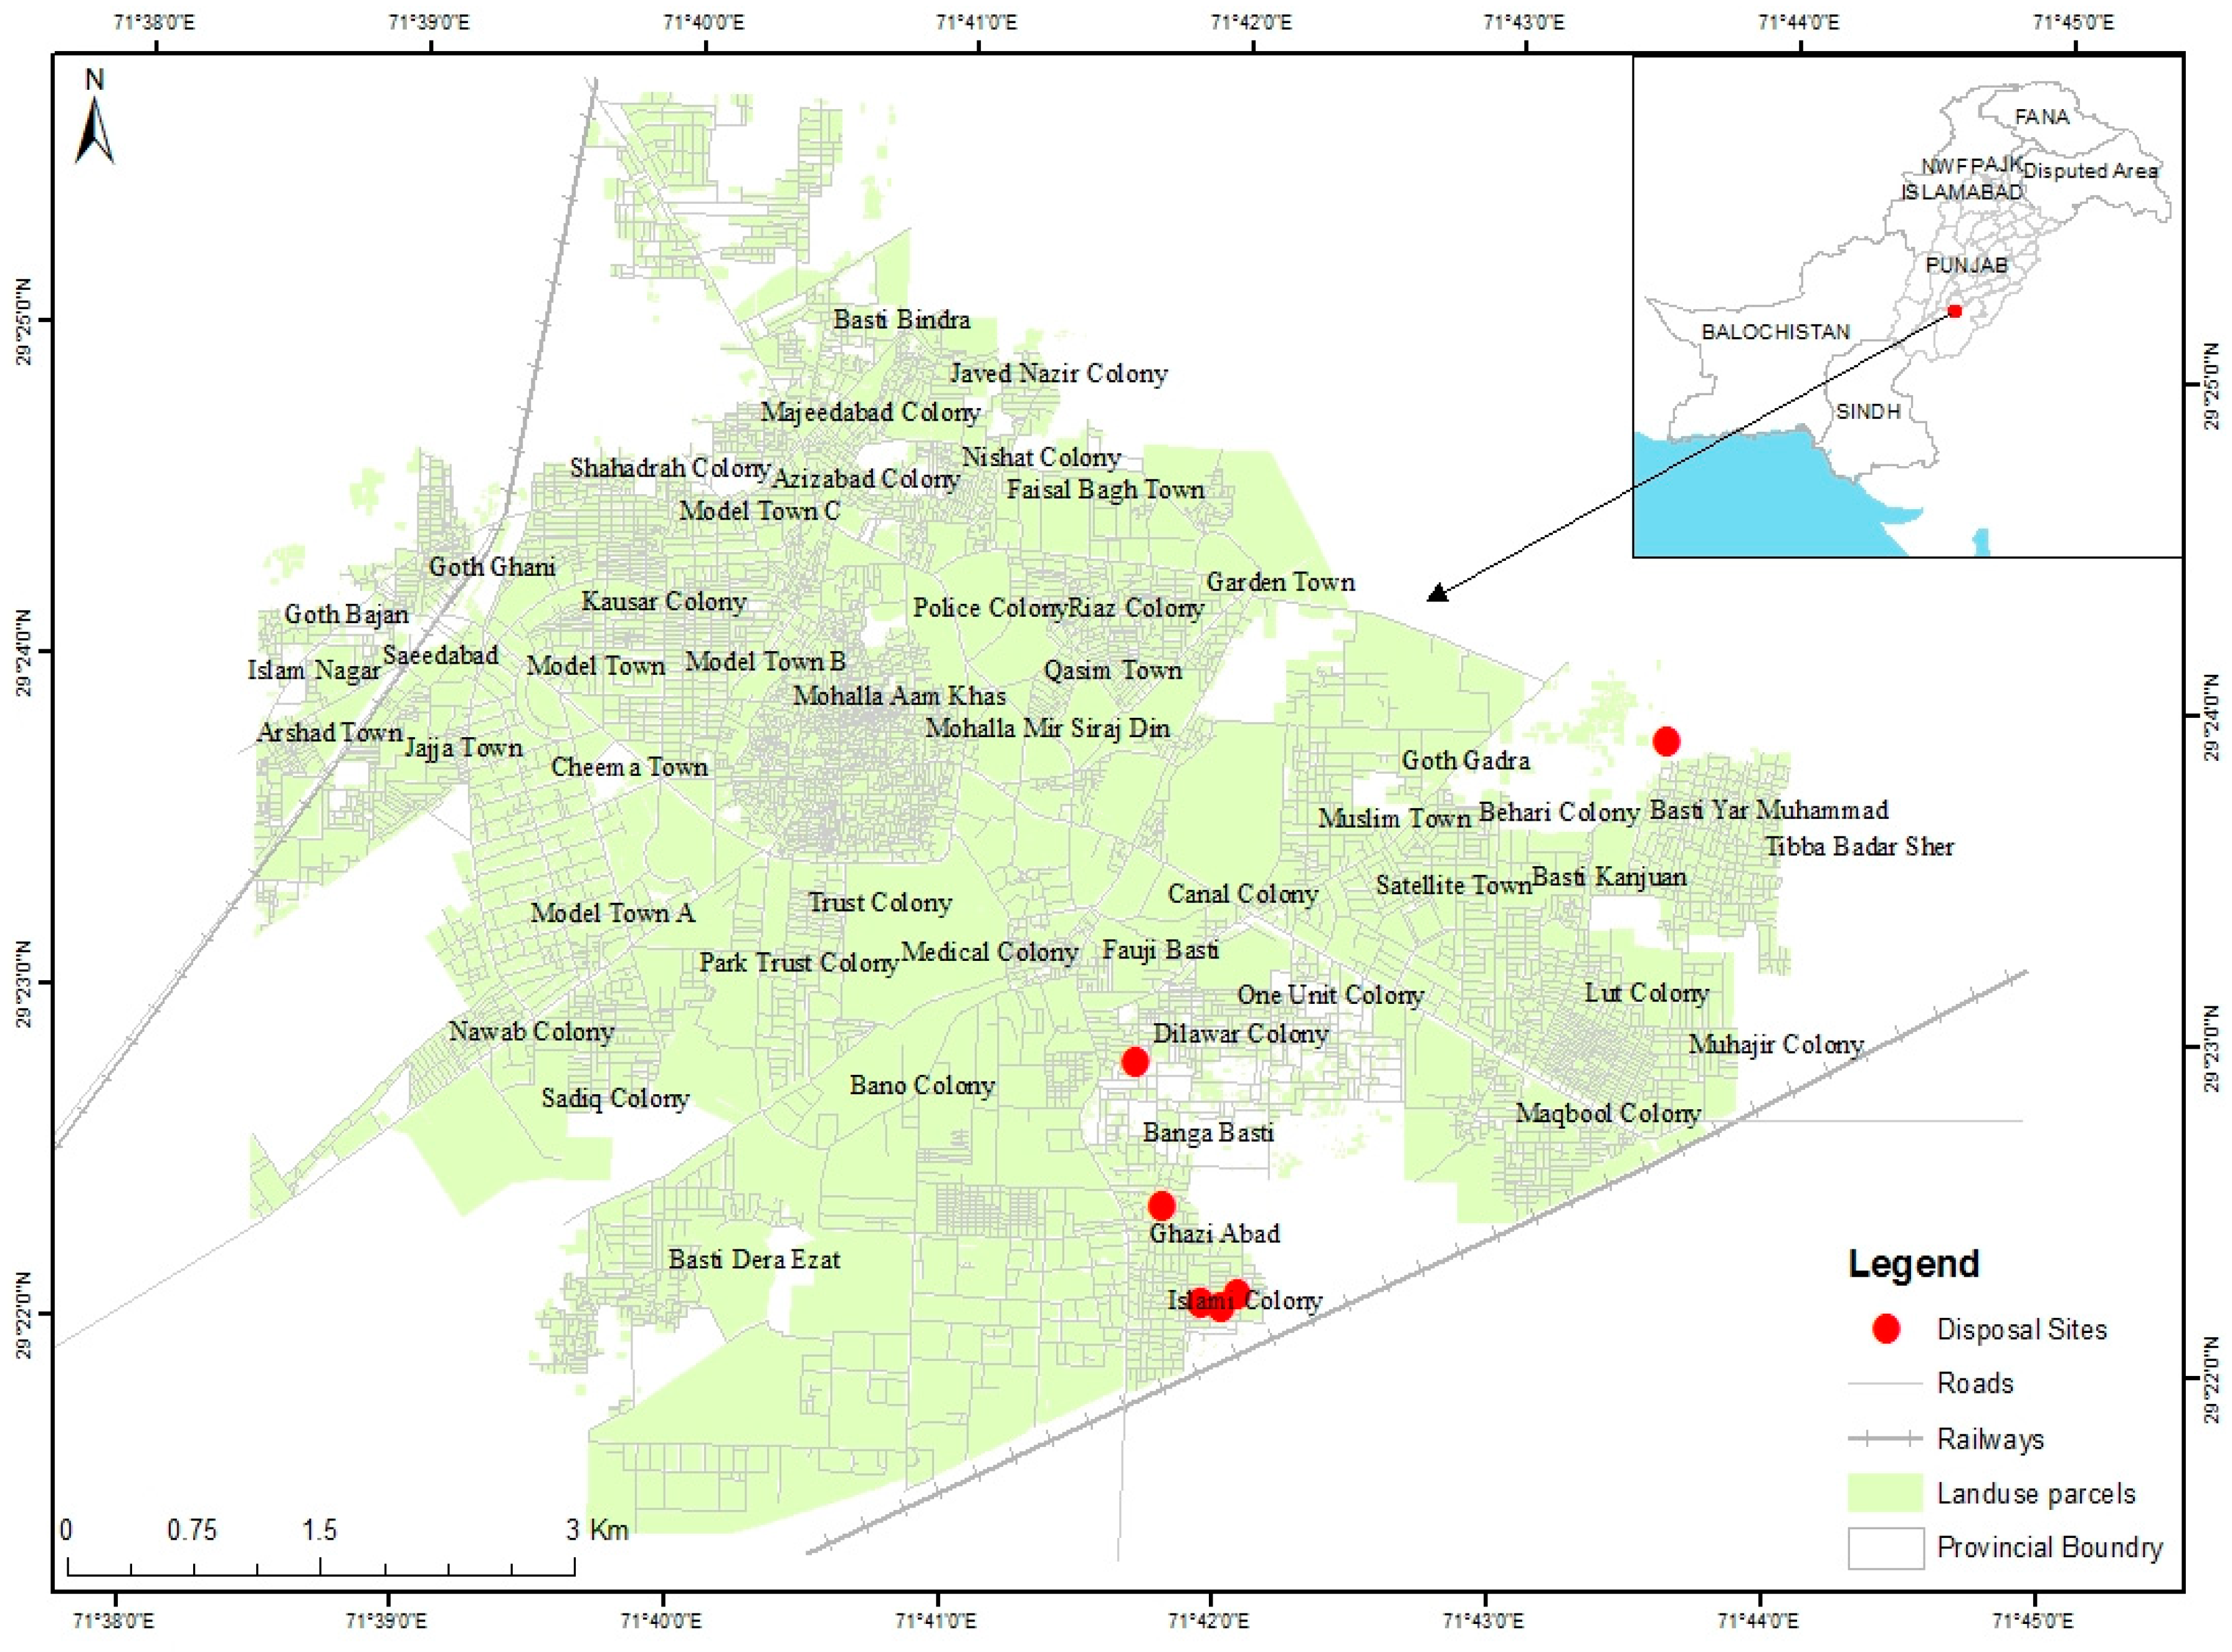
Existing Waste Management Scenario in the Study Area

Punjab is the most populous province of Pakistan with an urban population of 40% [43]. Bahawalpur is one of the main cities in the southern Punjab, Pakistan accommodating more than 650,000 people. It is located in arid zone with yearly average precipitation of 168.6 mm only. The area surrounding the city is irrigated with canal water and produces mango, wheat, rice and vegetables. The main industries are cotton ginning, rice, flour milling and pottery. The city has a historical background with an old city area, city center, and urban and suburban residential sectors and is unique in a sense that one can observe a glimpse of urban and rural areas at the same time.City people are influenced by rural lifestyle and values. They are not very modernized, many of them have some land holding and get direct benefits from agricultural activities. The social, climatic and economic conditions of the study area are different from metropolitans of the country and accordingly the waste composition also varies. High reuse, recycling and waste scavenging activities prevail, anything with resale value, including paper, cardboards, soft and hard plastics, glass and metals are either separated from household or picked by scavengers and sold to junk shops. The recyclables are further transported to various recycling industries located in different areas of the country. More details regarding recycling activities in the area are part of another study [44].
The existing solid waste collection is divided into primary and secondary collection systems. There are 20 individual containers with a capacity of 0.5 m3 and 15 communal containers with a capacity of 5 m3 in the entire city. Indiscriminate dumping of waste is observed in public spaces and around the bins on the street and roads. The reasons include the insufficient container capacity, placement of bins without any planning or provision of the need in the community and social ignorance of people regarding waste management issue. Fly tipping is a common practice. Most of the households drop waste on alley corners while sweepers clean the streets using brooms. To collect the garbage, work has been distributed shift wise. The first group collects the waste between 6.00 a.m. to 11.00 a.m. while the second shift works between 2.00 p.m. to 5.00 p.m. on a daily basis. Waste is transferred to communal stations or the only designated transfer station in the city (filth depot). In the secondary collection system municipal solid waste is further transferred to final disposal sites. The two approaches are used for the transfer of waste including direct discharge and storage discharge. Almost 40% of collected garbage is coming from the inner sectors of the city (mohallas) is shifted using storage discharge. The garbage is picked and dumped in the main filth depot (transfer station) through handcarts, wheel barrows and donkey carts. As soon as the machinery and manpower finish this work, they start to shift the garbage from the transfer station. About 60% of collected garbage is being shifted using direct discharge out of the city area via tractor trollies. Municipal workers collect waste via handcarts from small dumps at alley corners and shift it to tractors for final disposal. The waste is dumped openly at government owned lands, if the place does not remain sufficient to take up more waste the site is simply abandoned or the waste is burnt to accommodate more waste. A total of 50 hand carts, 20 donkey carts, only 4 tractors and 13 tractor trollies with a capacity of almost 4.5 tons are available for waste collection and transportation. The solid waste management system of Bahawalpur was being managed by the co-unit Tehsil Municipal Administration (TMA). The recent establishment of “Bahwalpur waste management company” is an indication of increased awareness and extended concerns regarding the issue and considered as a suitable intervention to deal with some of the waste management challenges.
Figure 1 shows the map of the Bahawalpur city with main waste disposal sites.

2. Method of Analysis

Life Cycle Assessment (LCA) in the waste management sector is still in its early stages for a country like Pakistan with no existing databases. LCA encompasses four main steps, the adopted approach takes into consideration different phases of LCA in a sequence. The EASETECH model is designed to support LCA studies in the waste management sector throughout different phases.

2.1. Goal and Scope Definition

An attributional LCA is employed that seeks to describe the environmentally relevant physical flows to and from different products or services under study [45]. The goal of this study is twofold: compilation of life cycle inventory by initiation of a thorough study to ascertain necessary information regarding waste management system for the study area and to evaluate the environmental burdens of the existing household solid waste management practices in the Bahawalpur City from a life cycle perspective using latest waste LCA model EaseTech. The functional unit of the analysis includes the management of 103,000 tons of solid waste produced from the household sector in the Bahawalpur City for a year (2013–2014). All relevant elements of the waste life cycle, including its generation, source separation, transportation, treatment (if any), scavenging activities (if any), till its final disposal are included, end of life treatment of recyclables are also incorporated within the boundary of MSW management system. The limitations of study have been defined in the form of LCA system boundary in Figure 2.
As the Figure 2 indicates, the study intends to include all relevant elements of the waste management system into consideration. Reuse and waste collection are an important part of waste management system. The reuse activities take place within the houses while the collection of recyclables from household and residual waste typically takes place manually using hand carts and donkey carts without any resource consumption in terms of fuel and energy. These processes are anticipated to have no environmental impact and hence, do not constitute part of the LCA system boundary.

2.2. Inventory Analysis

The life cycle inventory (LCI) is intended for recognition, introduction and quantification of the environmental interventions related to the structure under consideration. EaseTech incorporates default datasets including different physical and chemical parameters for forty eight (48) different waste material fractions, energy use (kg/energy) and emissions inventories are also available. The study aims to gather the specific inventory data from the study area to the extent possible. LCI data is fairly reliable as gathered through field surveys, waste characterization studies, laboratory analysis and existing reports. Data regarding collection, transportation, energy consumptions, waste recovery, recycling processes, substitution rates and landfill characteristics were assembled through personal communications and field surveys. The chemical characterization of all the waste components could not be carried out, the gaps were filled out using default data. Unavailable data and relevant background records were derived from the EaseTech 2013 database. Since the model is especially designed in a European perspective, several conjectures were well thought-out to fit data obtained from studied area in the used model.

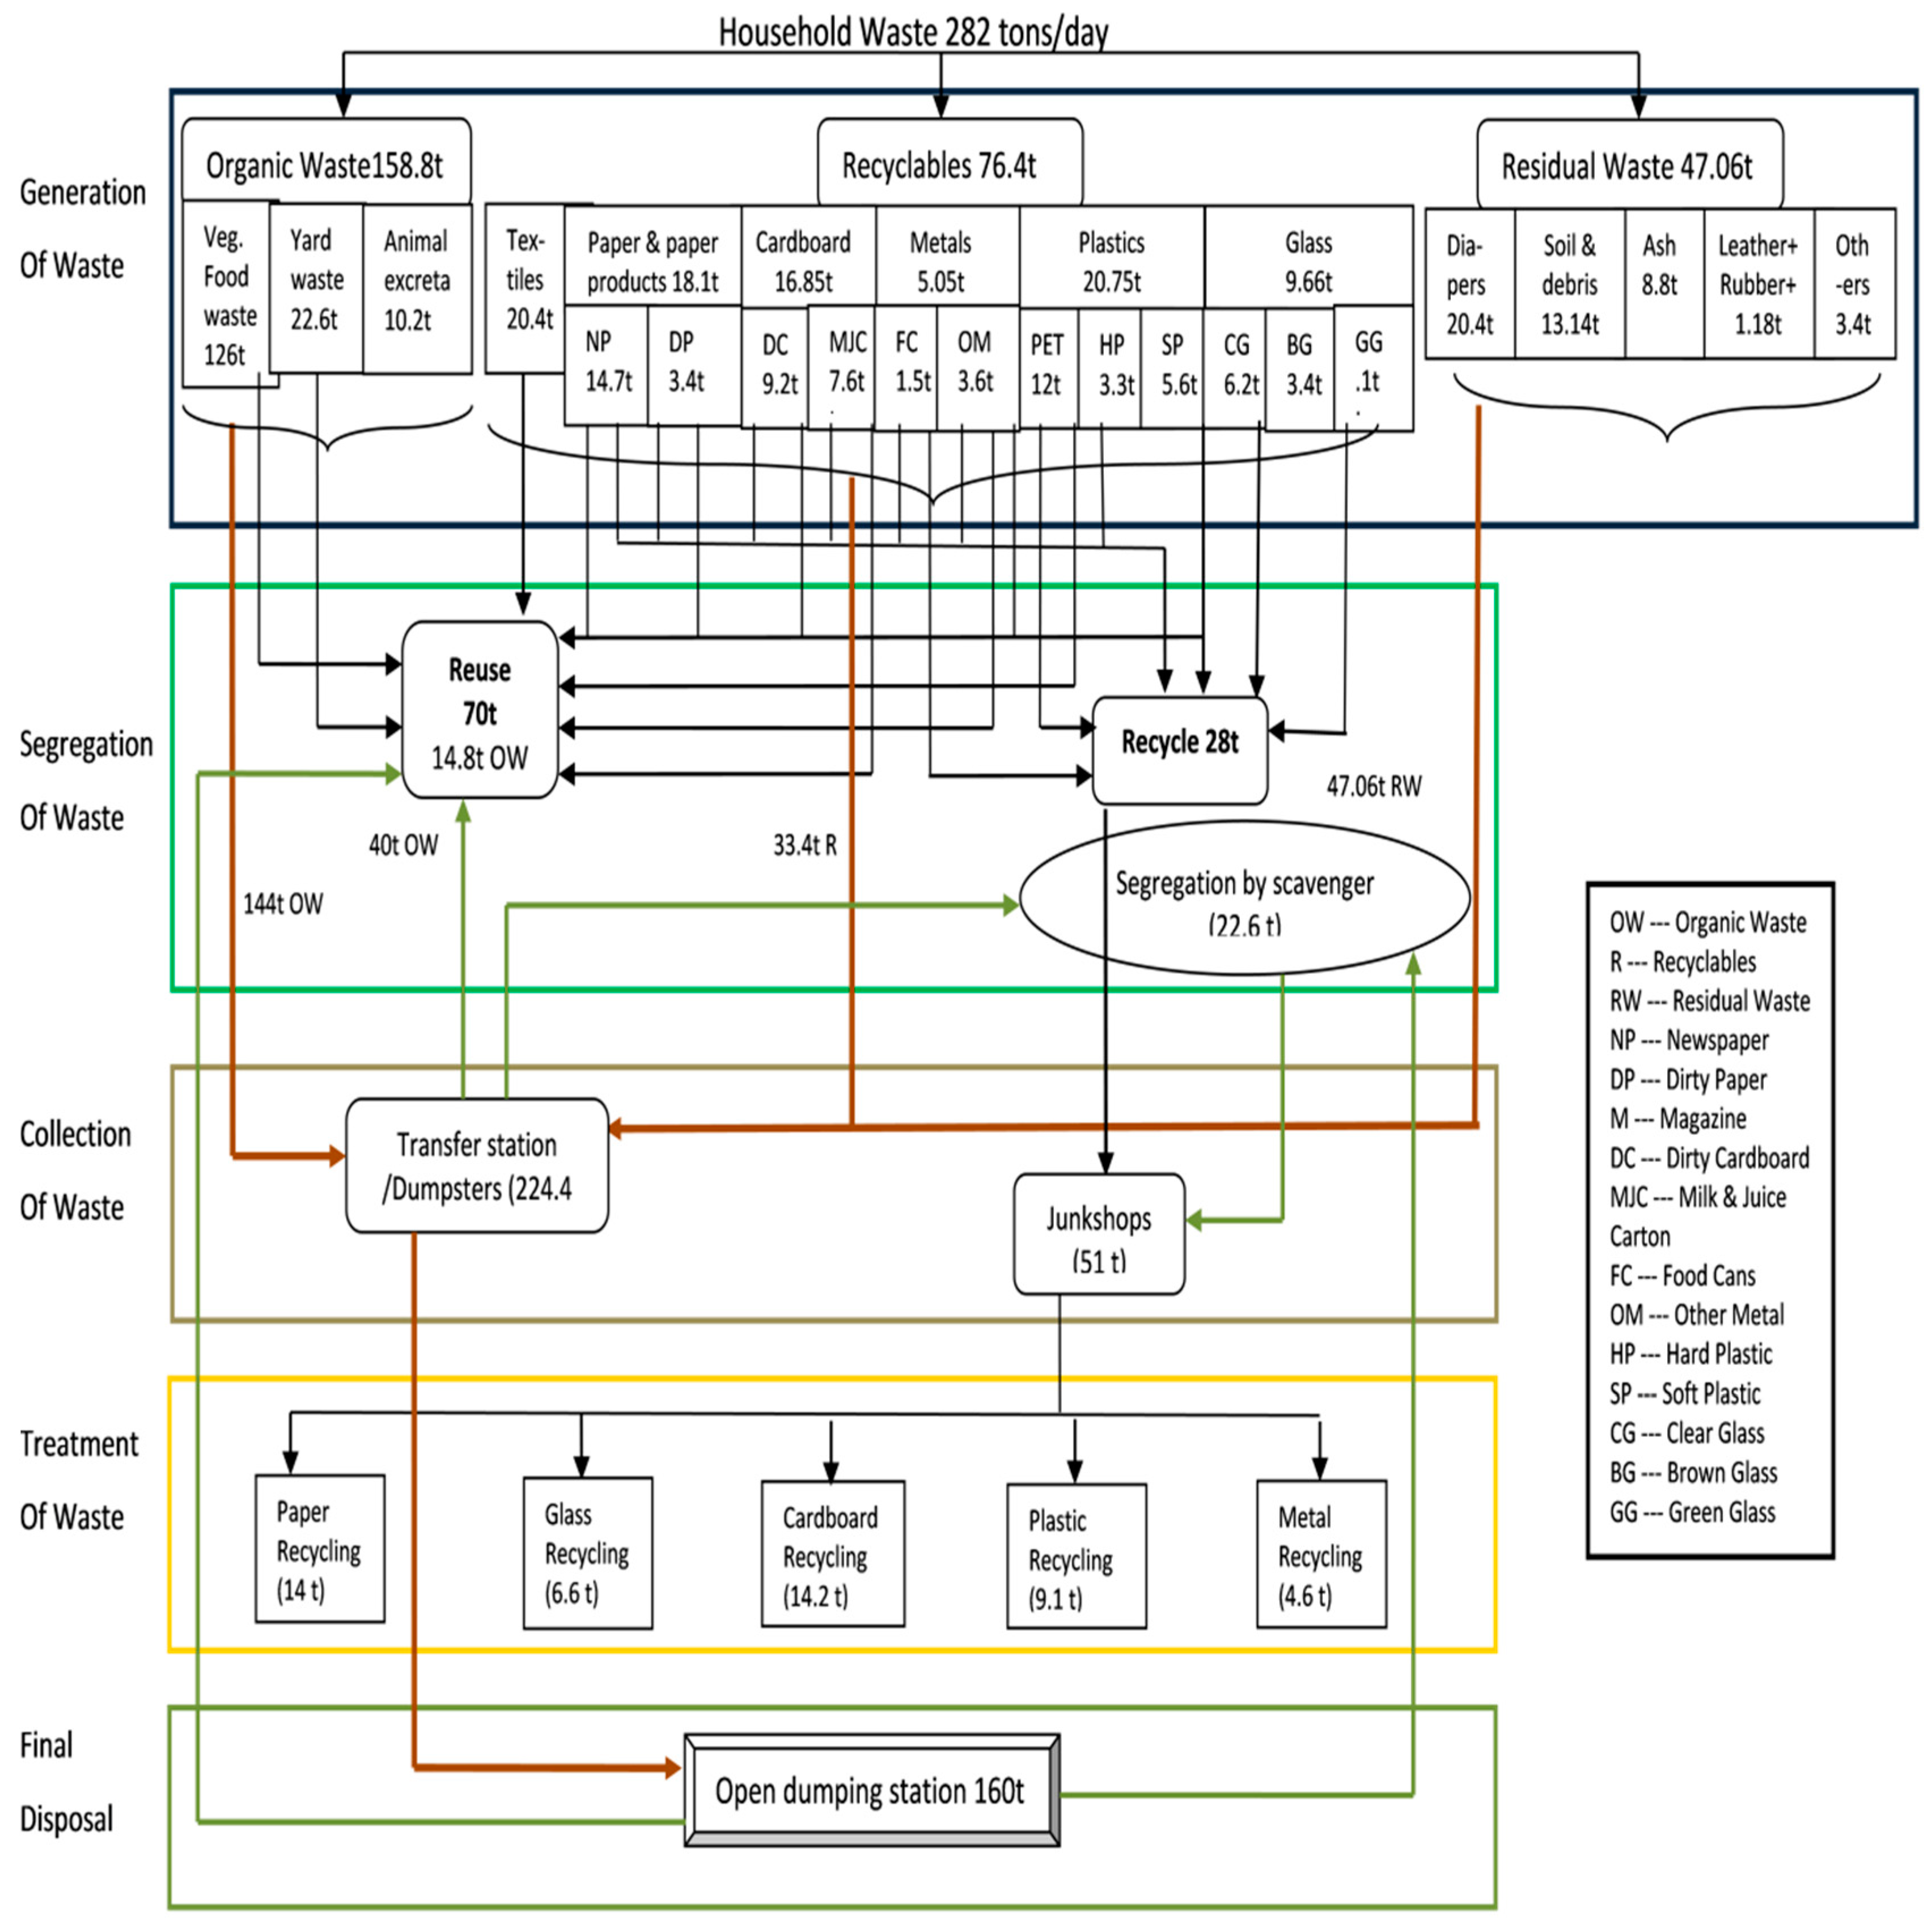
2.2.1. Municipal Solid Waste Characterization

Quantification of environmental impacts of the existing system is partially a function of the waste characteristics [2,46,47]. A systematic study was carried out for one week during all four seasons (Summer, Monsoon, Winter, Spring) of a year from June 2013 to March 2014 [42,48]. The study was narrowed down to the household level to have a closer look at the living pattern, people’s attitude and socioeconomic conditions of the city. The households in the study area were divided into three socioeconomic strata based on these criteria:
(1)
Property value of the area
(2)
Structure and area of the house
(3)
Average income of the households
The property values were derived through personal communication with the property dealers. The structure, area of houses and average income of households was gathered during the field surveys. Some previous studies from Pakistan considered the average income level as a measure for socioeconomic classification into groups where the monthly income of high group is considered more than 60,000 Rupees ($700) middle group income is 20,000 Rupees ($250 US) and low income group is 10,000 Rupees ($115) [16,47]. However with changing lifestyles and increasing inflation in US$ price this criteria for economic classification is not very reliable and the income levels are considered to rise. This study considers the per capita income as an approach to estimate the ratio of socioeconomic classes in the area, i.e., low income class (1.25–2 $/capita/day) middle income class (2–20 $/capita/day) and high income class (>20 $/capita/day) [49]. The city area was broadly divided into three socioeconomic divisions where 25% of the population belongs to the high income group, 45% are placed in the middle income group and remaining 30% fall under low income group category.
Forty-five households from high, middle and low income areas were randomly selected and requested to contribute in the waste characterization study. Each household was provided with shopping bags labeled with the house number. The bags with the full day collection were gathered from each household and characteristics of household solid waste (HSW) were analyzed by sorting and weighing different waste fractions. The collected samples are a representation of the waste collection rate. The weighted average for waste composition of study area originated from sorting analysis of a total of 1260 waste samples manually collected from 15 houses from each of the three socioeconomic classes for one week during four seasons as represented below:
15 houses × 3 socioeconomic groups × 4 seasons × 7 days = 1260 solid waste samples
Questionnaires were also filled from each household in all four seasons, direct observations and in-depth interviews regarding the income, lifestyle, consumption pattern and recycling behavious of households suggested that there was a considerable difference in the amounts of generated and collected waste, this difference is attributed to high source separation activities in the area. The amount of generated waste was derived based on the information provided by each household and is discussed in detail in another study [44]. A detailed questionnaire was completed by the administrator co-unit Tehsil Municipal Administration (TMA). Existing documents related to waste management in Bahawalpur [50] and municipal reports on waste management were gathered (internal communication). Relevant personnel including two sanitary inspectors and ten sanitary workers involved in various management activities were also interviewed. Various bins and small dumpsters located in different localities and bulk samples of 90 kg [51] from dumpsites in each season were also characterized to ensure data consistency and estimate the resource recovery along waste stream.

2.2.2. Laboratory Analysis

The samples for physical, ultimate and heating value analyses were taken at the time of waste composition sampling. Laboratory analyses were performed for certain combustible material categories. The determination of the moisture content of the waste fractions was made at 105 °C in a drying oven until a constant weight via ASTM E949-88 [52] volatile matter was determined using ASTM E897-88 [53] and ash content was determined using ASTM E830-87 [54]. The dried samples were ground to fine particle size to perform ultimate and thermal analysis. Gross calorific value (GCV) was determined using bomb calorimeter according to ASTM E711-87 [55]. Carbon, Hydrogen, Nitrogen and Sulfur (CHNS) contents were monitored using an elemental analyzer system GmbH (VarioMICRO V1.9.4) while Oxygen (O) content was determined using an indirect calculation with respect to other elements using equation
O% = 100 − C% − H% − N% − S% − Ash

2.2.3. Data Regarding Recycling

An extensive study relateing to recycling activities in the Bahawalpur was carried out at various levels. The households, waste pickers, itinerant buyers and junkshop owners play an important part in the waste recycling hierarchy. Forty five households, hundred scavengers, ten itinerant buyers and thirty junkshop owners were interviewed to get a clear depiction of recycling activities in the area [40] while forty scavengers and and ten junkshop owners agreed to participate in the waste quantification studies carried out for a week for result validation. The results are presented in Figure 4 and Table 4. A more thorough discussion regarding recycling activities in Bahawalpur city is a part of other two studies [40,56], A comprehensive field survey of randomly selected recycling industries located in various parts of the country was carried out during 2015–2016. The “desk study method” could not be applied as there are no official records available related to recycling activities in Pakistan. A total of fifteen recycling industries agreed to share their data. The information as regards sources and amounts of energy utilized in recycling was obtained by visiting different industries, questionnaires were filled based on information provided by factory owners and their electric and natural gas bills were analyzed. The average energy consumption of different recycling industries was calculated based on the monthly billing records of industries divided by the average amount of raw material processed per month. Electricity consumed during recycling process is presented in kWh/kg, while the natural gas is converted from mmBtu to MJ/kg. The data on substitution rates was derived from a previous study carried out in Pakistan [57] and verified by field surveys.

2.3. Life Cycle Impact Analysis (LCIA)

The LCA standard ISO 14044 recommends to avoid the partitioning/allocation of the system as it can lead to compromised results. The used model (EaseTech) utilizes process of system expansion with substitution as a way of avoiding allocation. The life cycle impact analysis (LCIA) aims to enumerate the comparative significance of environmental aspects attained in the LCI phase. Two mandatory elements within the LCIA outline, classification and characterization are included in study. The ‘ILCD recommended 2013′ method is used in the study. ILCD stands for “International Reference Life Cycle Data System” it is an up-to-date LCIA method that accumulates the most suitable impact evaluation schemes used so far and offers reliable and quality life cycle assessment results for twelve different impact categories. The selection of important impact indicators under LCIA method is consistent with the International LCA Standards [45]. Seven significant impact indicators, including Climate change, depletion of abiotic resources-reserve, depletion of abiotic resources-fossil, human toxicity-carcinogenic, human toxicity-non-carcinogenic, eco-toxicity and particulate matter are chosen for further discussion.

2.4. Interpretation

The EaseTech model can deliver results for potential environmental impacts of various waste management activities. The interpretation step presents and evaluates the numerical results of LCIA. The quantitative contributions of each subsystem are assigned to different impact categories. These contributions are aggregated to present the characterized impacts. Characterization value provides aggregated environmental impacts while normalization value presents per capita impacts of the analyzed system. Characterized results are presented as there are no available normalization references for Pakistan. The up to date method (ILCD) makes convincing, reliable and quality life cycle data results available for presentation.

3. Results and Discussion

3.1. System Description and Modeling Inputs

3.1.1. Generation and Composition of Household Waste in Bahawalpur City

Our study revealed that the average waste generation rate of Bahawalpur City is 0.424 Kg per capita per day. The total amount of waste generated daily is 282 tons, which translates into almost 103,000 tons per year. The joint family system (a system where three generations, i.e., grandparents, parents and children live in a common house) is observed in few high, some middle and many low income houses. The average household size of Bahawalpur City is 6.9. In developed countries the waste generation and collection rates are same, but in developing countries, people tend to source separate the valuable recyclables from the waste stream. This results in a notable difference in amounts of collected and generated waste that cannot be overlooked. Considerable relationship exists between income groups and waste generation rate as established by a few previous studies [58,59]. Table 1 presents the waste generation and collection rates for various income groups in the study area.
Organic waste is the largest contributor of HSW in Bahawalpur including food waste (44.75%), yard waste (8%), animal excreta (3.6%). The collection rate was found to be highest for food waste for middle and high income houses the percentage was comparatively low for low income houses. In looking into the grounds, we found an interesting fact about the area. There is a trend of keeping pets like cows, goats and hens. These pets are not only in economic service, but are a potential source for waste abatement. People in low income areas utilize the vegetable waste from nearby houses and dumpsters as a food for these pets so the amount of collected vegetable waste was small. The outcomes submit that more food waste was brought forth on weekends, which may be due to guest onset and due to the fact that there is a less trend of dining out. In many middle and almost all high income residential areas there is a tendency of keeping small to large gardens or indoor plants. Garden waste along with some soil and debris was reported to be almost 8%. The physical composition of generated solid waste is presented in Figure 3.
Recyclables account for 27% of the total waste flow. Paper and paper products make a share of 6.4%. In comparison to mega cities procurement of newspaper and magazines is relatively less due to low literacy level and affordability issues. People buy one newspaper per day in middle income houses. While in low income houses people are not keen to pay for newspapers or magazines. Cardboards make 5.9% of the total amount including juice cartons (1.45%) and milk cartons (1.26%). It is notable that the percentage of milk cartons is not much; because of easy availability of fresh milk there is a tendency to buy a specified quantity of milk from milkmen on a daily base. Hard plastics (5.36%) mainly consist of Plastic bottles that account for 4.2% of household waste due to high use of drinks that is attributed to long summers and hot climate. Soft plastics make a share of 2%. 3.4% of glass takes in clear glass, brown and green glass. Textiles make a share of 2.13%, which may be ascribable to the tendency of sewing clothes at homes in many middle and low income households. Metals including food can (0.101%), beverage cans (0.34%) and Aluminum foil and containers (0.1%) and other metal products make 1.8% collectively.
Other fractions include soil and debris, ash, ceramics, diapers and some other inert. The composition of waste from low income houses is very different as compared to high and middle income houses. On average making 3.6% of the waste stream, animal waste composes 16.5% of low income house waste. The share of soil and inert debris is 4.6% of total waste since the region is considered a fertile agricultural zone and partly because the area is receiving less average rainfall and more storms throughout the year. In low income areas the amount of dirt and debris is high (14%) as compared to high and middle income houses because in such areas most houses are fixed up of bricks cemented with mud (katcha) and roads are unpaved. Natural gas is furnished in the metropolis as a source of energy, but in some low income areas this facility is not available so wood is being utilized for cooking purposes. Subsequently the generation amount of ash is high in low income household waste (13%). The collection rate, however, shows relatively less value since it is easily blown away or dispersed. The diapers, the non-degradable, non-recyclable category of waste is a dominant part of the small dump site. They make a significant share of almost 7%. Their use is increasing day by day in high and middle income houses, but low income people use it occasionally because of affordability issues. Some other components like ceramics, rubber, batteries, cotton and wood make 1.23% of total waste jointly.
The chemical composition of some major waste fractions was determined and presented in Table 2. The chemical composition of waste is essential to know as it makes the basis for LCA modelling and affects the final outcome. The results described in terms of emissions/kg, biogas potential, leachate production or concentration of various pollutants etc. are dependent on the chemical properties of waste. The molecular composition (C, H, N, O, P, etc.) is particularly important in estimating the environmental burdens of waste management practices and to evaluate the alternative waste processing and recovery options.
Quantitative data obtained regarding the amount of household waste produced and its flow in the Bahawalpur waste management system is discussed and presented in the form of Figure 4.
A total of 282.2 tons of waste are being generated daily in the residential areas of Bahawalpur that consist of three main fractions, including organic waste (56%), recyclables (27%) and residual waste 16) along with sub-fractions in each category. Waste generation refers to the amount of waste produced prior to source separation and scavenging activities. Approximately 58 tons of the generated waste are source separated at domestic level, almost 30 tons of produced waste (organic waste + recyclables) is either retained, reused by households or maids or burned in the hearth or feed to cattles. While 28 tons of recyclables are reaching junkshops either directly from households or through the maids and call on the scavengers. The remaining 224 tons reaches to designated transfer stations or make a part of small dumpsters in the city area. Our study found that Solid waste collection and transportation services are only enough to collect 70% of the waste. 157 tons of the waste are collected by municipality workers, while 30% remain on the streets with skips, depressions, or road corners making small dumpsters. High scavenging activities of organic waste and recyclables exist in the study area. From a total of 28% scavenging activities almost 20% takes place at dumpsites while 8% along road sites and streets. The scavenging activities in Bahawalpur retrieve almost 64 tons of waste daily, including 40 tons of organic waste and 22.6 tons of recyclables. 51 tons of recyclables finally reaches to junkshops, where they are sorted and transported to various recycling industries. A total of 160 tons makes the final disposal that includes 48 tons of waste left on streets while an amount of 112 tons reaches to designated dumping sites.

3.1.2. Description of Recycling Facilities

Though most of the units visited were small and disorganized, the presented values are more typical regarding energy consumption during the recycling process in Pakistan. The total resource utilization for various recycling industries was derived using information provided by local industry administrators and presented in Table 3.
Most of the paper and cardboard are transported to recycling industries in Multan at a distance of 103 km from the study area. The presented information is typical for a medium sized paper recycling industry that recycles almost 4500 tons of paper annually to produce paper of different grades and quality. The manufacturing unit operates for 6 days of the week for 12 h/day. A number of cardboard industries locally called “gatta factory” are operating in and around Multan. Information assembled from different gatta factories demonstrates that on average 2.8 tons of cardboard is recycled daily for 320 days of the year. Raw cardboard is soaked in 10 × 10 ft ponds for a day. Most of the succeeding operations are carried out manually with little electricity consumption. The cardboard is then sun-dried conserving energy.
Most of the metal recycling industries are present in metropolitan cities. The metals including iron, tinplate and steel scrap are loaded in trucks and transported from the study area to the recycling industries in Lahore (558 km). Based on the information obtained by visiting different steel recycling industries almost 27–28 tons of scrap are sorted on daily basis, shredded, subjected to high temperatures and poured in molds. The presented values are based on the information provided by the industry administration.
Various small plastic recycling units are present throughout the country; an average plastic recycling unit recycles almost 20 tons of plastic per month to produce granules. The plastic is manually sorted into various categories on the basis of its color and type. Plastic is washed, dried, crushed and put into a mixer at low temperature to avoid bubbling. Soft plastic is subjected to high heat for melting, poured into water for cooling and then cut into small granules. The granules may vary in color and quality depending on the type and color of plastic feed. The Table 3 represents the energy utilization for an average plastic recycling unit.
Glass recycling industries are mostly located in the Sindh province of the country. Most of the glass from the study area reaches in and around Hyderabad (693 km away), where it is melted in large firebrick ceramic furnaces, further processed and sold to other industries. Most of the work is carried out manually and almost 15 people are engaged in the production unit. The information presented is based on some typical recycling units in Hyderabad; almost 2 tons of glass is melted daily to make glass rings that are further bought by bangle making factories. It is a high energy intensive industry; energy consumption is based on monthly billing records of industries against the average quantity in kg/month processed.

3.1.3. Modeling using EASETECH

The waste flow modeling presented in Table 4 considered dividing the total waste input (100%) into reuse, recycle (R) and residual waste (RW) categories. R is divided into R1 and R2, where R1 represents the 1st level of recycling that takes place at household level while R2 represents the 2nd level of recycling that refers to the scavenging activities in the study areas. The rest of the waste (RW) reaches the dumping sites.
The scenario assumed the existing waste management situation in the Bahawalpur city. The reuse and recycling activities were based on actual circumstances in the vicinity. The weighted averages for waste composition originated from sorting analysis of household waste were used. The difference between generated and collected waste was accredited to be source separated, the percentages were documented under reuse and recyclables categories. For modeling purposes, waste sorting was either considered as waste prevention or waste diversion. The reuse activities were assumed as waste prevention since the waste is produced, but will not be a direct part of MSW system, moreover the activities do not involve any resource consumption. While waste storage of recyclables for recycling activities has no influence in terms of the quantity of product services supplied but may alter the waste destination, hence assumed as waste diversion. Since scavenging is also a recycling activity, 2% of default value is assumed for the reason that scavenging activities may restrain some extraneous matter. The junkshops present in the area are assumed as MRFs, where all the sorting and pretreatment of recyclables takes place manually with little electricity consumption of almost 0.0002 kWh/kg. Collection technologies for recyclables and residual waste were not included within the system boundary as they are typically collected manually using hand carts and donkey carts. The transportation routes, volume and type of truck used for transportation of recyclables and energy utilization during recycling were based on information obtained from field surveys. The residual waste is being transported to designated dump site. Since only 70% of the waste is collected and transported, we assumed all waste to reach the disposal site. Open dumping without any any landfill gas collection and leachate control is the only method of waste disposal in the area. The assumption can assist to account for the environmental impact potential of all the waste dumped in the system. Besides new waste collection arrangements for the city are in place and these problems will be taken care of within a couple of years. Transportation trolleys collect waste from different sites of the city and finally transport it to a landfill site. The dumping site is situated on the fringes of the Bahawalpur city; average transportation distance to the landfill site was almost 25 km. Diesel-fueled trucks are utilized for shipping activities that subscribe to the Euro2 or lower exhaust standard. The unloading operation at the dumpsite consume about 0.00084 L/kg/ total wet wt. Conventional household landfill with the height of waste piled up to 10 m and bulk density of 1.0 t/m3 was assumed for modeling with zero leachate and gas collection while the net infiltration rate for 10 years is 168.6 mm/year according to the average precipitation in the region.

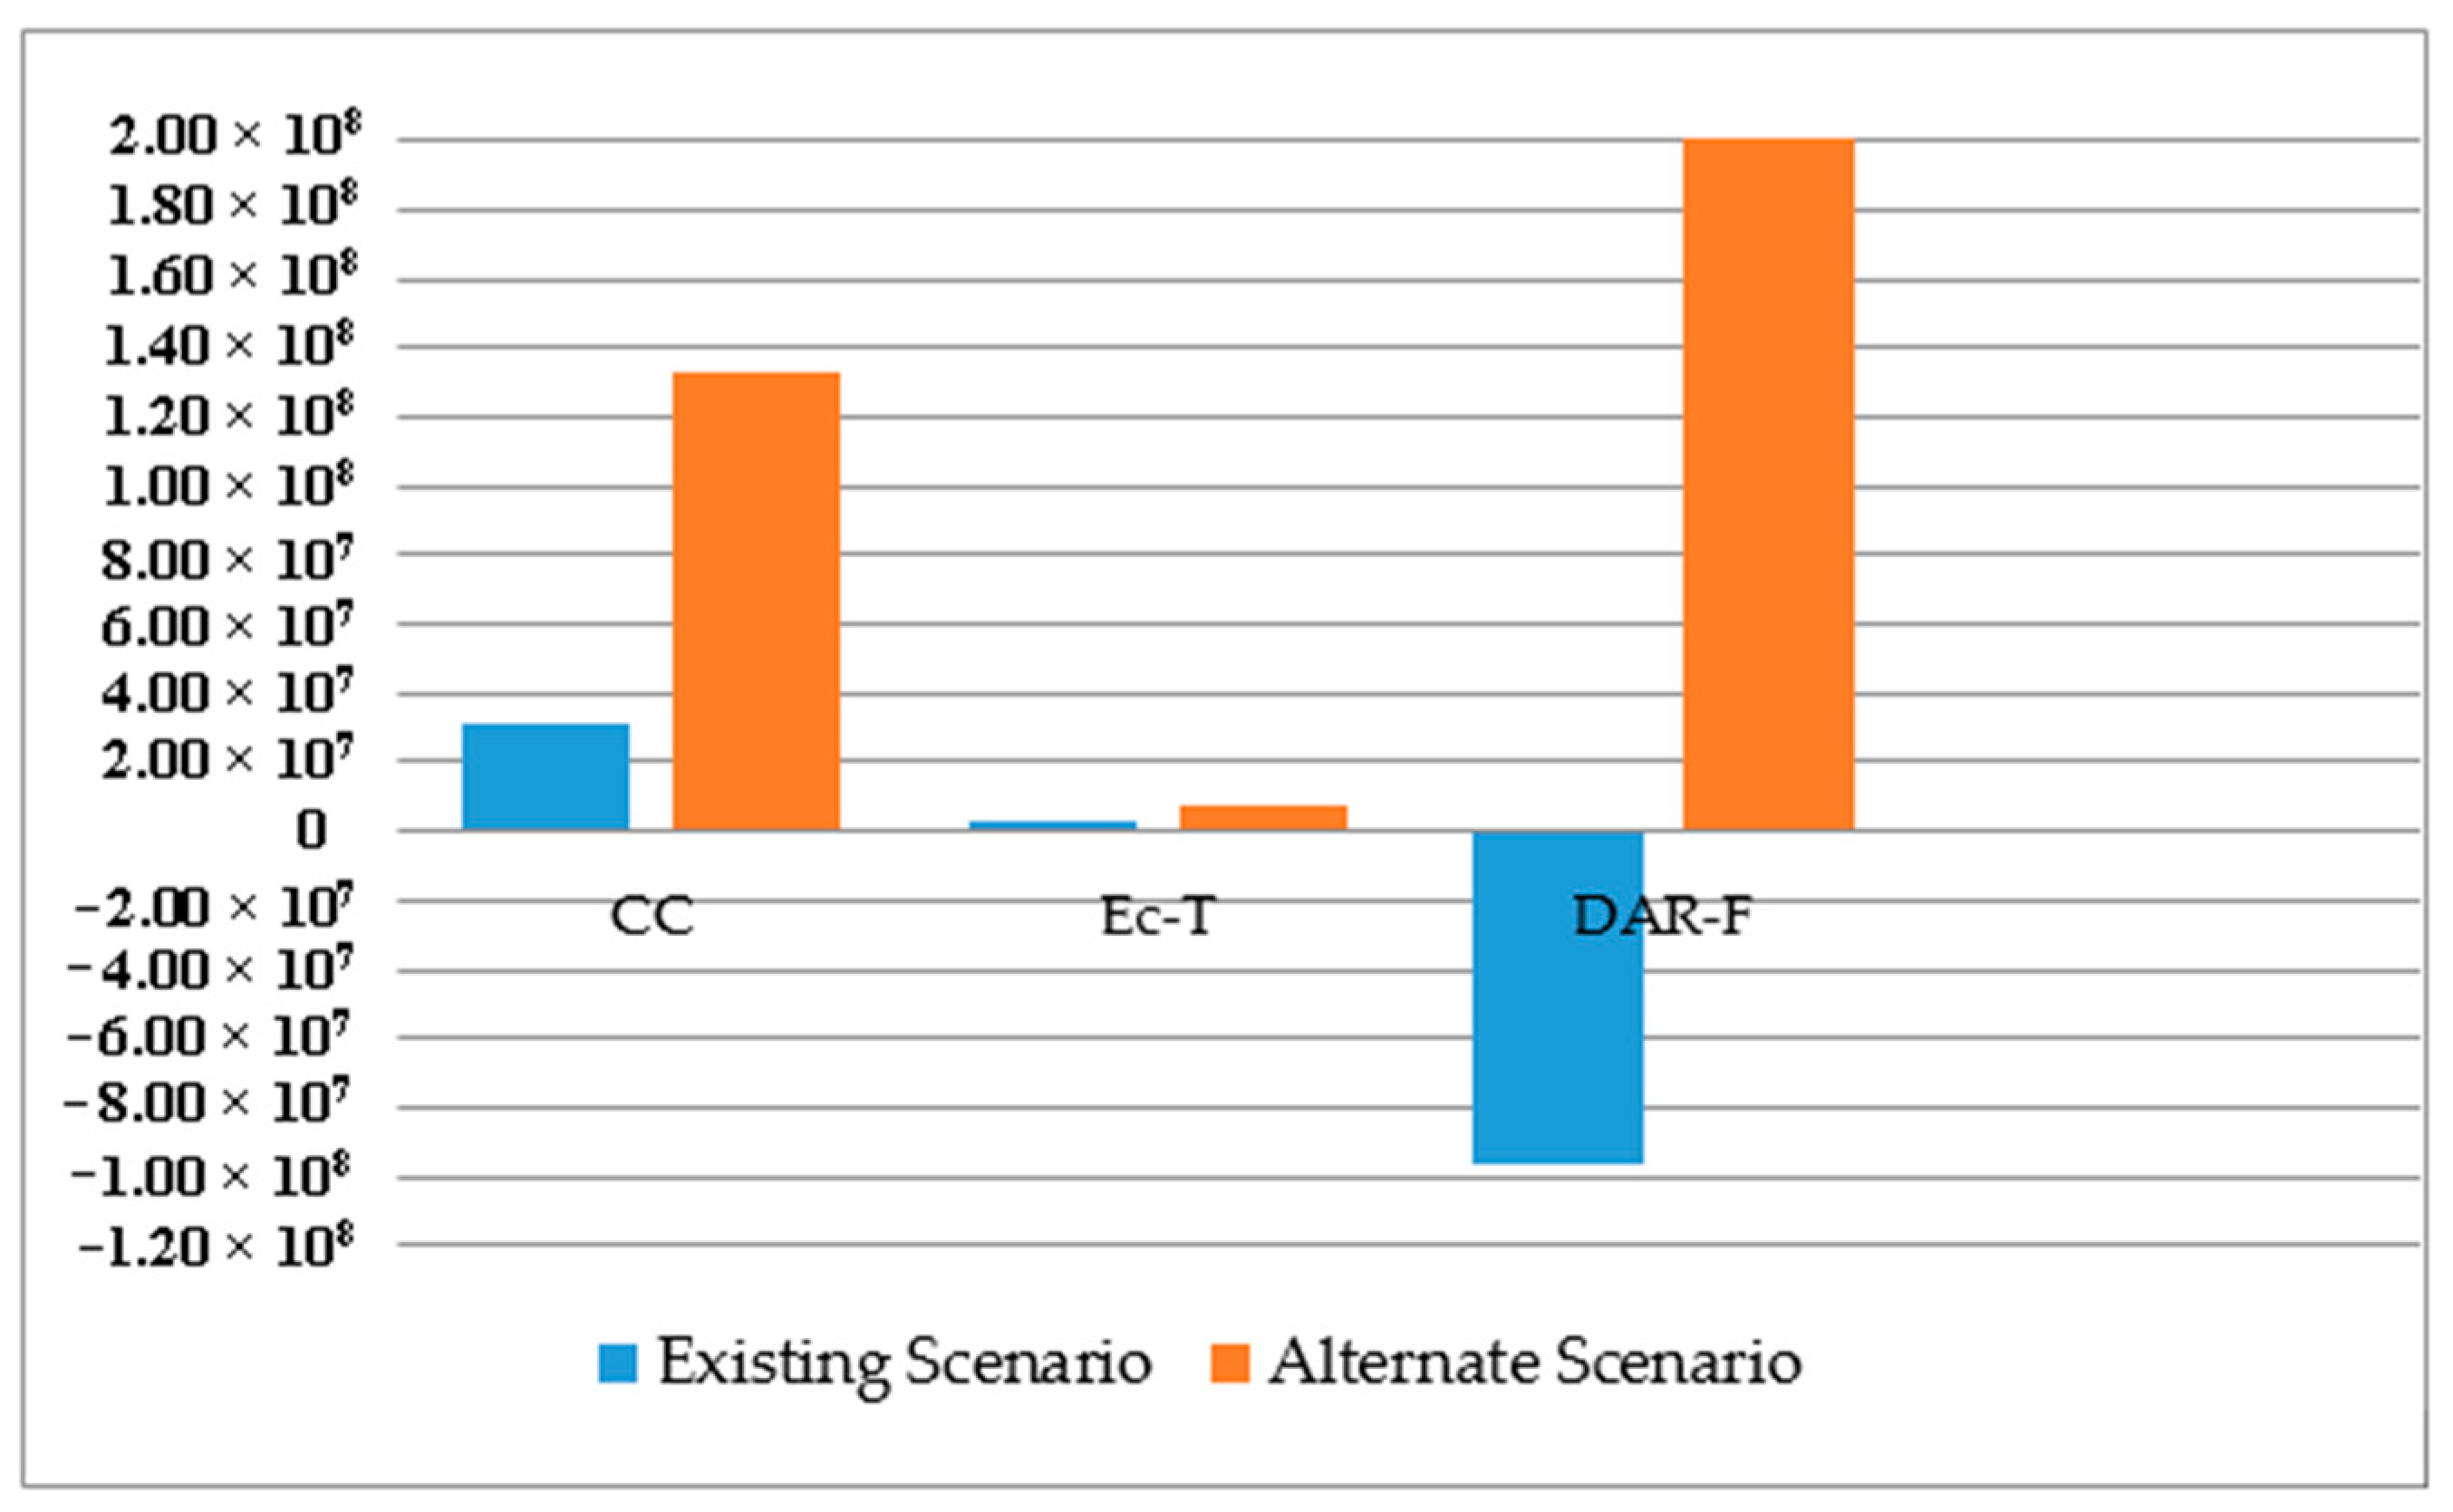
3.2. Quantification of Environmental Impacts

LCA is a composite tool which covers all activities and related interactions for all stages of waste management cycle [5]. EaseTech, a recent waste LCA model is particularly useful to recognize the contribution analysis of specific operations and environmental loads attributed to particular impact categories [40]. The analysis of the environmental results begins with the presentation of the characterized potential impacts for seven different impact categories based on ILCD recommended method in order to find out the general performance of the existing system in practice. The net balance can be portrayed by the mutual input of burdens and gains. For a clear interpretation the seven impact categories, their units and characterized impacts are presented in the form of a table. Positive values in five impact categories show net environmental burdens while negative values in two categories show environmental savings related to the overall waste management arrangements in practice.
Analyzing different subsystems is justified as some of them make a great deal in manipulating the final outcome. Evaluation of different process in terms of their contribution to environmental quantification using EaseTech revealed that the waste generation and source separation activities oblige no harmful effects to the surroundings. Reuse is an environmental friendly alternative while Junkshops contribute some part in environmental loadings due to marginal electricity consumption. Fossil fuel consumption for waste collection and transportation operations make them an important environmental loader for discussed categories, the impacts were observed to increase with increased distances and fuel consumption. Recyclables are transported to distant places for further processing; these transportation processes entail high environmental loadings for all discussed categories. Recycling is generally considered a promising option for waste treatment, the environmental benefits derived from recycling are accredited to avoided emissions. The term ‘avoidance’ is tricky in case of different recycling activities as it refers to the credited emissions consigned due to substitution of virgin material and associated processes. It is important to note that the recycling results significantly rely upon life cycle inventories. Cardboard recycling presented savings in six environmental categories in all scenarios except for climate change due to certain process- specific emissions. Paper recycling was found to be a loader for three categories including depletion of resources (fossil and reserve) and ecotoxicity. Plastic recycling added environmental charges to eco-toxicity and human toxicity carcinogenic categories and savings to remaining five categories. Steel recycling was an environmentally favorable contributor for five impact categories except for ecotoxicity and human toxicity, non-carcinogenic categories. Glass recycling contributed loadings to depletion of resources (fossil and reserve) owing to high fuel consumption in the process. The significant contribution of landfilling in environmental charges for all discussed categories is affirmative as established by few previous investigations [46,60,61] and an immediate alteration in existing waste disposal practices is highly recommended.
In discussion of various impact categories as shown in Table 5; climate change is the category with highest environmental loading. Hence it refers to the outcomes of increasing temperature in the atmosphere; the increasing temperature may result in global and regional global warming. Certain greenhouse gases including Carbon dioxide (CO2), Methane (CH4), Nitrogen dioxide (N20) and Chloroflouro carbons (CFC’S) are the main contributor to the category [62]. As shown in Table 5 Landfilling is the practice with greatest produced impacts for the global warming category (4.7 × 10⁷ kg CO2-Eq). The open dumping practice contribution to climate change is significant due to the free release of methane in the air and the composition of the entering waste, while transport operations also play a major role. Major substances contributing to climate change are CH4 non-fossil (6.33 × 10⁷ kg CO2-Eq), CO2-fossil (9.09 × 10³ kg CO2-Eq) and CO-fossil in the air part (2.2 × 10³ kg CO2-Eq). It is important to mention that the produced CO2 with biogenic origin are presented as carbon-neutral in most of the LCA studies [63] and the LCA models typically do not account the biogenic CO2 emissions for the global warming category and even treat biogenic CO2 emission as offering some environmental savings [64,65]. CO2 produced from waste decomposition is biogenic in origin that do not add to green house gas (GHG) emission while CO2-fossil contributes to climate change along with CH4 and N2O produced at landfill sites. CH4 is produced during the decay of organic waste while N2O is produced and released due to the high nitrogen content of organic waste along with favorable microbial conditions at landfill sites. Some notable climatic change loading compensations were due to avoided emissions from various recycling processes, including paper, plastic, metal and glass recycling owing to credited emissions and reduced energy consumption consigned due to substitution of virgin material. The recyclable, offering the highest benefits for the category is paper recycling followed by steel and plastic recycling, while the net balance of cardboard recycling is found to be towards environmental loadings owing to various process specific emissions (9.33 × 10⁵ kg CO2-Eq) including CO2-fossil, CO-fossil, CH4-fossil and N2O emissions. Transportation operations also play a major role due to associated combustion of fossil fuels and considerably longer distances. Total load due to transport operations in Bahawalpur waste management system was observed to account for almost 3.5% of the net global warming impacts.
The human toxicity (carcinogenic and non-carcinogenic) refers to the potential harm that an unconstrained toxic substance may cause; level of toxicity is dependent on toxicity level and quantity of encountered substance [66]. The category can cause local as well as regional impacts. The causative sources and influencing agents were observed to be more or less same for both categories. Modeling suggests emissions of certain heavy metals including Chromium (Cr), Arsenic (Ar), Nickel (Ni), Cadmium (Cd), Lead (Pb), Zinc (Zn) and certain dioxins in environment. All these substances are of great concern for the categories as they can be harmful to animals and humans at relatively low concentrations and tend to accumulate in soil, plants, and animals. Pb and Cd enter the environment from dumping of batteries while dumping of plastics also introduces some metal contaminants, including Cd, Ni and Pb in the solid waste stream. Textile, green glass and shoes dumped in waste stream were found to contribute to Cr contamination. While consumer electronics, ceramics, light glass, house dust, paint, lead foils and oils also contribute to human toxicity in the waste stream. Some impact in HT-C category were attributed to absence of leachate and gas collection system in landfills that contributed to emission of various toxic substances, including Ar ion, Cr and Zn ion in water and some Mercury (Hg) in the air. Some loadings are also ascribed to various transportation operations. Some savings were contributed by paper, cardboard and steel recycling for HT-C except for plastic and glass recycling that contributed certain loadings. Many glass products including decoration items, glasswares and crystalline items contain Pb and their recycling could cause its release to the environment. Hg, Ar and Formaldehydes were major contributing substances to human toxicity carcinogenic category. Hg discharges to the environment can be attributed to impurities in consumed fuels, while Ar could be volatilized as a result of glass melting during recycling. Some organic compounds, including Benzo(a)pyrene and formaldehydes were discharged to the atmosphere from furnaces used for glass melting. While for HT-NC all recycling processes offered some savings except for steel recycling, Zn and Pb are main contributing substances to the category.
Ecotoxicity can be acute and chronic, terrestrial and aquatic; the category takes in a wide range of substances that can be harmful for the environment [67]. Various heavy metal ions including Cadmium (4.52 × 10³ CTU), Barium (3.17 × 10³ CTU), Chromium (2.86 × 10³ CTU), Selenium (2.10 × 10³ CTU), Zinc (7.52 × 10² CTU) and Nickel (6.98 × 10² CTU) are the main contributor to Eco-toxicity category. A study regarding the presence of heavy metals in solid waste suggests that Zn is the highest concentrated heavy metal in the solid waste as compared to Mn, Cu, Cr, Cd, Pb, Ni and Hg. Among these metals Mn, Zn and Cd have a higher susceptibility to be leached easily [68]. Four solid waste components, including kitchen waste, ash, plastic, and paper are the main sources of certain heavy metals including Cu and Zn. The heavy metal concentrations in solid waste are also reported to vary with seasonal variations and are much higher in summer than winter [69]. The process of open dumping is highest contributor of eco-toxicity (3.50 × 10⁶ CTU) due to uncollected leachate and gas. Zn, Cu, Ar and Ni ions in leachate cause toxicity for water sources while Vanadium (V), Cu, Zn and Hg are responsible for pollution in the air part. Surprisingly the other main contributors to ecotoxicity are paper recycling (1.3 × 10⁵ CTU) and plastic recycling due to coal consumption for marginal electricity production and metal recycling (6.72 × 10⁴ CTU) owing to some process specific emissions. Emissions of V, Ba and Zn from plastic recycling were the main contributor to ecotoxicity category. The discharge of V in the environment can be associated with heat plants using fossil fuels, while a small amount may be released due to its consumption in making plastics. The discharge of Ba from plastic recycling can be associated with its consumption to increase plastic density. Pigments used for coloration in plastics can also be responsible for the release of certain toxic metal, including Cr VI and Pb in the environment. For metal recycling main contributing substances for ecotoxicity were found to be Zn and Cr VI, Most widespread use of Zn includes making protective coatings for steel for corrosion inhibition, while the Cr VI is used for metal surface treatment. Cr plated metal product are not collected for recycling in European countries, but no such practices exist in developing countries and hence release of this toxic metal during metal recycling is predictable. While glass and cardboard recycling processes confer some input in environmental savings.
Abiotic resource depletion is the process of overall reduction in total resource reserves while depletion of abiotic resources, fossil is the reduction in its fuel content or total energy reserves [67]. Recycling of various materials is generally less resource consuming than virgin material production, this led to the inference that all the recycling processes present net savings, however on contrary paper and glass recycling were the main loading process for both categories. For Paper recycling DAR-F loadings were attributed to consumption of crude oil, while for DAR-R main contributing substance was Barite (crude), its consumption can be attributed to its application as paper brightener. Glass recycling contributed loadings to depletion of resources (fossil and reserve) owing to high fuel consumption in the process, main depleting substances include hard coal, crude oil and brown coal. Paper, steel and cardboard recycling contributed savings to category due to substitution of large resource requirements for production from virgin material. Basis for net savings was circumventing the use of hard coal (MJ) for steel recycling and evading use of crude oil and hard coal for plastic and cardboard recycling. High diesel consumption in various transportation operations laid some burdens on abiotic resources depletion in fossil category, while the contribution of landfilling was found to be minimal due to less resource consumption owing to open dumping practices.
Particulate matter is a recently added category owing to the augmented identification of its intended risks to human health [70,71,72]. Most of the nitrogen oxides (2.362 Kg PM2.5-eq), sulfur dioxides (1.349 Kg PM2.5-eq) and particulates <2.5 um (0.154 Kg PM2.5-eq) enter the system due to certain transportation processes, including waste transportation to landfills and recyclable transportation to distant places for further processing while landfilling also caused some loadings to the category but the shift of net balance towards savings is yet again attributed to certain recycling process.
As shown in Figure 5, an alternate scenario was modeled to highlight the benefits of the recycling and reuse activities in the study area. The scenario considered diversion of all the generated waste to landfills without any source separation and scavenging activities. As the graph depicts, the reuse and recycling activities could offer environmental compensation of up to 77% for climate change (CC), 58% for ecotoxicity (Ec-T) and more than 100% for depletion of abiotic resources-fossil (DAR-F) categories. The HT-C and HT-NC and DAR-R categories also show some increase in the environmental loadings for alternate scenario as compared to the existing scenario, while the PM category shows the shift of net impacts from environmental savings (−2350 Kg PM2.5-eq) towards environmental loadings (5914 Kg PM2.5-eq). The results suggest that the environmental loadings could have increased many fold if reuse and recycling activities do not prevail in the study area.

4. Conclusions and Recommendation

Sketching a fresh waste management plan is very expensive for small and medium sized cities of a low GDP country. For capacity building the existing system needs to be thoroughly studied to find out the gaps. The existing waste management system is characterized by low per capita waste generation, inappropriate waste collection and storage system, outdated vehicles, more manual exertion, unhygienic working conditions, higher reuse and recycling activities, social unacceptance for the informal waste management sector, deficiency of records, financial constraints and open dumping practices. The overall result suggests that existing waste management system in Bahawalpur City puts a substantial burden over climate change (3.16 × 10⁷ kg CO2-Eq) and ecotoxicity (3.12 × 10⁶ CTU) categories, while depletion of abiotic resources-fossil (−9.60 × 10⁷) is the main contributor in environmental saving part. Considerable compensations for most of the environmental effects are offered by high reuse and recycling practices in the area. While open dumping practices in the area showed the highest contribution in environmental loadings and actions are needed for immediate alterations in current waste disposal practices.
The outcomes specify that LCA is a practical device that can help decision makers in finding directions towards sustainable waste management options. The modeling and presentation of existing impacts can be helpful for waste management officials and policy makers to change the system incrementally over a period of time. Complex systems with the expectation of immediate returns are not very feasible for developing countries as they usually overburden their economy. Simple yet effective systems need to be employed. The Initial focus should be put on indispensable options such as creating awareness among residents, institution of efficient waste collection and transportation systems, separation and diversion of organic waste for composting and better disposal options, ensuring more manual work while considering safety measures is also suggested based on the social and economic circumstances of the area. Some other neglected aspects include the need to promote reuse and recycling activities as the society is observed to be gradually shifting towards throw away culture and a need to look out for recycling markets in nearby areas to cut short the transportation distances. As signs of transformation appear in the area the attention can be given to other complex interventions such as integration of informal sector in the formal set up and introduction of modern and complex waste treatment alternatives.

Author Contributions

All the three authors have substantially contributed to the reported work. “Conceptualization, S.A.B. and N.C.; Methodology, S.A.B.; Software, A.M. and S.A.B.; Validation, S.A.B. and N.C.; Formal Analysis, S.A.B; Investigation, A.M.; Resources, A.M.; Data Curation, A.M.; Writing-Original Draft Preparation, A.M.; Writing-Review and Editing, S.A.B. and N.C.; Visualization, A.M.; Supervision, S.A.B. and N.C.; Project Administration, S.A.B.; Funding Acquisition, A.M.

Funding

This research was funded by Higher Education Commission Pakistan under grant number 117-6973-PS7-084. The publication is funded by University of the Punjab, Lahore.

Conflicts of Interest

The authors declare that they have no conflict of interest, the work is original and is a part of Ph.D project.

References

  1. Bovea, M.D.; Ibáñez-Forés, V.; Gallardo, A.; Colomer-Mendoza, F.J. Environmental assessment of alternative municipal solid waste management strategies. A Spanish case study. Waste Manag. 2010, 30, 2383–2395. [Google Scholar] [CrossRef] [PubMed]
  2. Manfredi, S.; Goralczyk, M. Life cycle indicators for monitoring the environmental performance of European waste management. Resour. Conserv. Recycl. 2013, 81, 8–16. [Google Scholar] [CrossRef]
  3. Parkes, O.; Lettieri, P.; Bogle, I.D.L. Life cycle assessment of integrated waste management systems for alternative legacy scenarios of the London Olympic Park. Waste Manag. 2015, 40, 157–166. [Google Scholar] [CrossRef] [PubMed]
  4. Pires, A.; Martinho, G.; Chang, N.-B. Solid waste management in European countries: A review of systems analysis techniques. J. Environ. Manag. 2011, 92, 1033–1050. [Google Scholar] [CrossRef] [PubMed]
  5. Clift, R.; Doig, A.; Finnveden, G. The application of life cycle assessment to integrated solid waste management: Part 1—Methodology. Process Saf. Environ. Prot. 2000, 78, 279–287. [Google Scholar] [CrossRef]
  6. Zurbrügg, C.; Gfrerer, M.; Ashadi, H.; Brenner, W.; Küper, D. Determinants of sustainability in solid waste management—The Gianyar waste recovery project in Indonesia. Waste Manag. 2012, 32, 2126–2133. [Google Scholar] [CrossRef] [PubMed]
  7. Ayres, R.U. Life cycle analysis: A critique. Resour. Conserv. Recycl. 1995, 14, 199–223. [Google Scholar] [CrossRef]
  8. Ayres, R.U.; Ayres, L.W.; Martinás, K. Exergy, waste accounting, and life-cycle analysis. Energy 1998, 23, 355–363. [Google Scholar] [CrossRef]
  9. Blengini, G.A.; Busto, M.; Fantoni, M.; Fino, D. Eco-efficient waste glass recycling: Integrated waste management and green product development through LCA. Waste Manag. 2012, 32, 1000–1008. [Google Scholar] [CrossRef] [PubMed]
  10. Hanifzadeh, M.; Nabati, Z.; Longka, P.; Malakul, P.; Apul, D.; Kim, D.-S. Life cycle assessment of superheated steam drying technology as a novel cow manure management method. J. Environ. Manag. 2017, 199, 83–90. [Google Scholar] [CrossRef] [PubMed]
  11. Kim, D.-S.; Hanifzadeh, M.; Kumar, A. Trend of biodiesel feedstock and its impact on biodiesel emission characteristics. Environ. Progress Sustain. Energy 2018, 37, 7–19. [Google Scholar] [CrossRef]
  12. Henry, R.K.; Yongsheng, Z.; Jun, D. Municipal solid waste management challenges in developing countries—Kenyan case study. Waste Manag. 2006, 26, 92–100. [Google Scholar] [CrossRef] [PubMed]
  13. Marshall, R.E.; Farahbakhsh, K. Systems approaches to integrated solid waste management in developing countries. Waste Manag. 2013, 33, 988–1003. [Google Scholar] [CrossRef] [PubMed]
  14. Thomas, C. Waste management and recycling in Romania: A case study of technology transfer in an economy in transition. Technovation 1999, 19, 365–371. [Google Scholar] [CrossRef]
  15. Metin, E.; Eröztürk, A.; Neyim, C. Solid waste management practices and review of recovery and recycling operations in Turkey. Waste Manag. 2003, 23, 425–432. [Google Scholar] [CrossRef]
  16. Matete, N.; Trois, C. Towards zero waste in emerging countries—A South African experience. Waste Manag. 2008, 28, 1480–1492. [Google Scholar] [CrossRef] [PubMed]
  17. Acosta, V.; Paul, J.; Lao, C.; Aguinaldo, E.; Valdez, M.D.C. Development of the Philippines national solid waste Management STRATEGY 2012–2016. Procedia Environ. Sci. 2012, 16, 9–16. [Google Scholar] [CrossRef]
  18. Bolaane, B.; Isaac, E. Privatization of solid waste collection services: Lessons from Gaborone. Waste Manag. 2015, 40, 14–21. [Google Scholar] [CrossRef] [PubMed]
  19. Bleck, D.; Wettberg, W. Waste collection in developing countries—Tackling occupational safety and health hazards at their source. Waste Manag. 2012, 32, 2009–2017. [Google Scholar] [CrossRef] [PubMed]
  20. Alamgir, M.; Bidlingmaier, W.; Cossu, R. Successful waste management strategies in developing countries require meaningful involvement of the concerned stakeholders. Waste Manag. 2012, 32, 2007–2008. [Google Scholar] [CrossRef] [PubMed]
  21. Mohee, R.; Mauthoor, S.; Bundhoo, Z.M.A.; Somaroo, G.; Soobhany, N.; Gunasee, S. Current status of solid waste management in small island developing states: A review. Waste Manag. 2015, 43, 539–549. [Google Scholar] [CrossRef] [PubMed]
  22. Thi, N.B.D.; Kumar, G.; Lin, C.-Y. An overview of food waste management in developing countries: Current status and future perspective. J. Environ. Manag. 2015, 157, 220–229. [Google Scholar] [CrossRef] [PubMed]
  23. Asase, M.; Yanful, E.K.; Mensah, M.; Stanford, J.; Amponsah, S. Comparison of municipal solid waste management systems in Canada and Ghana: A case study of the cities of London, Ontario, and Kumasi, Ghana. Waste Manag. 2009, 29, 2779–2786. [Google Scholar] [CrossRef] [PubMed]
  24. Aphale, O.; Thyberg, K.L.; Tonjes, D.J. Differences in waste generation, waste composition, and source separation across three waste districts in a New York suburb. Resour. Conserv. Recycl. 2015, 99, 19–28. [Google Scholar] [CrossRef]
  25. Al-Khatib, I.A.; Monou, M.; Abu Zahra, A.S.F.; Shaheen, H.Q.; Kassinos, D. Solid waste characterization, quantification and management practices in developing countries. A case study: Nablus district—Palestine. J. Environ. Manag. 2010, 91, 1131–1138. [Google Scholar] [CrossRef] [PubMed]
  26. Batool, S.A.; Chaudhry, M.N. Municipal solid waste management in Lahore City District, Pakistan. Waste Manag. 2009, 29, 1971–1981. [Google Scholar] [CrossRef] [PubMed]
  27. Ripa, M.; Fiorentino, G.; Vacca, V.; Ulgiati, S. The relevance of site-specific data in Life Cycle Assessment (LCA). The case of the municipal solid waste management in the metropolitan city of Naples (Italy). J. Clean. Prod. 2017, 142, 445–460. [Google Scholar] [CrossRef]
  28. Guerrero, L.A.; Maas, G.; Hogland, W. Solid waste management challenges for cities in developing countries. Waste Manag. 2013, 33, 220–232. [Google Scholar] [CrossRef] [PubMed]
  29. Seadon, J.K. Sustainable waste management systems. J. Clean. Prod. 2010, 18, 1639–1651. [Google Scholar] [CrossRef]
  30. Othman, S.N.; Zainon Noor, Z.; Abba, A.H.; Yusuf, R.O.; Abu Hassan, M.A. Review on life cycle assessment of integrated solid waste management in some Asian countries. J. Clean. Prod. 2013, 41, 251–262. [Google Scholar] [CrossRef]
  31. Soltani, A.; Hewage, K.; Reza, B.; Sadiq, R. Multiple stakeholders in multi-criteria decision-making in the context of Municipal Solid Waste Management: A review. Waste Manag. 2015, 35, 318–328. [Google Scholar] [CrossRef] [PubMed]
  32. Hoi-Seong, J.; Kwang-Yim, K. KOICA-WorldBank Joint Study on Solid Waste Management in Punjab, Pakistan; Korea International Cooperation Agency: Seongnam, Korea, 2007.
  33. International Organisation for Standardization. Environmental management—Life cycle assessment—Principles and framework. In ISO 14040 International Standard; ISO-14040; International Organisation for Standardization: Geneva, Switzerland, 2006. [Google Scholar]
  34. Buratti, C.; Barbanera, M.; Testarmata, F.; Fantozzi, F. Life Cycle Assessment of organic waste management strategies: An Italian case study. J. Clean. Prod. 2015, 89, 125–136. [Google Scholar] [CrossRef]
  35. Blengini, G.A. Using LCA to evaluate impacts and resources conservation potential of composting: A case study of the Asti District in Italy. Resour. Conserv. Recycl. 2008, 52, 1373–1381. [Google Scholar] [CrossRef]
  36. De Feo, G.; Malvano, C. The use of LCA in selecting the best MSW management system. Waste Manag. 2009, 29, 1901–1915. [Google Scholar] [CrossRef] [PubMed]
  37. Di Maria, F.; Micale, C. A holistic life cycle analysis of waste management scenarios at increasing source segregation intensity: The case of an Italian urban area. Waste Manag. 2014, 34, 2382–2392. [Google Scholar] [CrossRef] [PubMed]
  38. Winkler, J.; Bilitewski, B. Comparative evaluation of life cycle assessment models for solid waste management. Waste Manag. 2007, 27, 1021–1031. [Google Scholar] [CrossRef] [PubMed]
  39. Gentil, E.C.; Damgaard, A.; Hauschild, M.; Finnveden, G.; Eriksson, O.; Thorneloe, S.; Kaplan, P.O.; Barlaz, M.; Muller, O.; Matsui, Y.; et al. Models for waste life cycle assessment: Review of technical assumptions. Waste Manag. 2010, 30, 2636–2648. [Google Scholar] [CrossRef] [PubMed]
  40. Clavreul, J.; Baumeister, H.; Christensen, T.H.; Damgaard, A. An environmental assessment system for environmental technologies. Environ. Model. Softw. 2014, 60, 18–30. [Google Scholar] [CrossRef] [Green Version]
  41. Batool, S.A.; Chuadhry, M.N. The impact of municipal solid waste treatment methods on greenhouse gas emissions in Lahore, Pakistan. Waste Manag. 2009, 29, 63–69. [Google Scholar] [CrossRef] [PubMed]
  42. Jadoon, A.Z.; Batool, S.A.; Chuadhry, M.N. Assessment of factors affecting household solid waste generation and its composition in Gulberg Town, Lahore, Pakistan. J. Mater. Cycles Waste Manag. 2014, 16, 73–81. [Google Scholar] [CrossRef]
  43. Jan, B.; Iqbal, M. Urbanization trend and urban population projections of Pakistan using weighted approach. Sarhad J. Agric. 2008, 24, 173–180. [Google Scholar]
  44. Majeed, A.; Batool, S.A.; Chaudhry, M.N. Informal waste management in the developing world: Economic contribution through integration with the formal sector. Waste Biomass Valoriz. 2016, 8, 679–694. [Google Scholar] [CrossRef]
  45. International Organisation for Standardisation. Environmental Management—Life Cycle Assessment—Requirements and Guidelines. In ISO 14044 International Standard; ISO-14044; International Organisation for Standardisation: Geneva, Switzerland, 2006. [Google Scholar]
  46. Erses Yay, A.S. Application of life cycle assessment (LCA) for municipal solid waste management: A case study of Sakarya. J. Clean. Prod. 2015, 94, 284–293. [Google Scholar] [CrossRef]
  47. Slagstad, H.; Brattebø, H. Influence of assumptions about household waste composition in waste management LCAs. Waste Manag. 2013, 33, 212–219. [Google Scholar] [CrossRef] [PubMed]
  48. Gómez, G.; Meneses, M.; Ballinas, L.; Castells, F. Seasonal characterization of municipal solid waste (MSW) in the city of Chihuahua, Mexico. Waste Manag. 2009, 29, 2018–2024. [Google Scholar] [CrossRef] [PubMed]
  49. Durr-e-Nayab. Estimating the middle class in Pakistan. Pak. Dev. Rev. 2011, 77, 1–28. [Google Scholar]
  50. The Urban Unit, P & D Department. Bahawalpur City Profile, The Urban Unit; P & D Department: Punjab, Pakistan, 2010. Available online: http://uu.urbanunit.gov.pk/Documents/Publications/0/109.pdf (accessed on 7 July 2018).
  51. ASTM International. Standards Test Method for Determination of the Composition of Unprocessed Municipal Solid Waste; ASTM-5231-92; ASTM International: West Conshohocken, PA, USA, 2007. [Google Scholar]
  52. ASTM International. Test Method for Total Moisture in a Reused Derived Fuel Laboratory Sample; ASTM-E949-88; ASTM International: West Conshohocken, PA, USA, 2004; pp. 839–842. [Google Scholar]
  53. ASTM International. Test Method for Volatile Matter in Analysis Sample of Refuse Derived Fuel; ASTM-E897-88; ASTM International: West Conshohocken, PA, USA, 2004; pp. 836–842. [Google Scholar]
  54. ASTM International. Test Method for Ash in the Analysis Sample of Refuse Derived Fuel; ASTM-E830-87; ASTM International: West Conshohocken, PA, USA, 2004; pp. 778–783. [Google Scholar]
  55. ASTM International. Test Method for Gross Calorific value of Reuse-Derived fuel by the Bomb Calorimeter; ASTM-E711-87; ASTM International: West Conshohocken, PA, USA, 2007; pp. 734–741. [Google Scholar]
  56. Majeed, A.; Batool, S.; Nawaz Chaudhry, M.; Aatif Siddique, R. Scavenging demeanor in Bahawalpur, Pakistan: Social and health perspective. J. Mater. Cycles Waste Manag. 2017, 19, 815–826. [Google Scholar] [CrossRef]
  57. Jadoon, A.Z.; Batool, S.A.; Chaudhry, M.N. Life Cycle Assessment of Municipal Solid Waste Management System of Gulberg Town. Ph.D. Thesis, University of the Punjab, Lahore, Pakistan, 2015. [Google Scholar]
  58. Dangi, M.B.; Pretz, C.R.; Urynowicz, M.A.; Gerow, K.G.; Reddy, J.M. Municipal solid waste generation in Kathmandu, Nepal. J. Environ. Manag. 2011, 92, 240–249. [Google Scholar] [CrossRef] [PubMed] [Green Version]
  59. Sujauddin, M.; Huda, S.M.S.; Rafiqul Hoque, A.T.M. Household solid waste characteristics and management in Chittagong, Bangladesh. Waste Manag. 2008, 28, 1688–1695. [Google Scholar] [CrossRef] [PubMed]
  60. Aye, L.; Widjaya, E.R. Environmental and economic analyses of waste disposal options for traditional markets in Indonesia. Waste Manag. 2006, 26, 1180–1191. [Google Scholar] [CrossRef] [PubMed]
  61. Song, Q.; Wang, Z.; Li, J. Environmental performance of municipal solid waste strategies based on LCA method: A case study of Macau. J. Clean. Prod. 2013, 57, 92–100. [Google Scholar] [CrossRef]
  62. Intergovernmental Panel on Climate Change. Fourth Assessment Report Climate Change 2007; IPCC: Geneva, Switzerland, 2007. [Google Scholar]
  63. Cherubini, F.; Strømman, A.H. Life cycle assessment of bioenergy systems: State of the art and future challenges. Bioresour. Technol. 2011, 102, 437–451. [Google Scholar] [CrossRef] [PubMed]
  64. Frischknecht, R.; Jungbluth, N.; Althaus, H.J.; Hischier, R.; Doka, G.; Bauer, C.; Dones, R.; Nemecek, T.; Hellweg, S.; Humbert, S.; et al. Implementation of Life Cycle Impact Assessment Methods. Data v2. 0 Ecoinvent Report No. 3 (No. IS-CH--10091); Ecoinvent Centre: Zurich, Switzerland, 2007. [Google Scholar]
  65. Foster, B. IPCC Third Assessment Report; The Scientific Basis: Geneva, Switzerland, 2001. [Google Scholar]
  66. Hertwich, E.G.; Mateles, S.F.; Pease, W.S.; McKone, T.E. Human toxicity potentials for life-cycle assessment and toxics release inventory risk screening. Environ Toxicol Chem. 2001, 20, 928–939. [Google Scholar] [CrossRef] [PubMed]
  67. EC-JRC. ILCD Handbook, Recommendations for Life Cycle Impact Assessment in the European Context—Based on Existing Environmental Impact Assessment Models and Factors; Publications Office of the European Union: Luxembourg, 2011; p. 181. [Google Scholar]
  68. Prechthai, T.; Parkpian, P.; Visvanathan, C. Assessment of heavy metal contamination and its mobilization from municipal solid waste open dumping site. J. Hazard. Mater. 2008, 156, 86–94. [Google Scholar] [CrossRef] [PubMed]
  69. Long, Y.Y.; Shen, D.S.; Wang, H.T.; Lu, W.J.; Zhao, Y. Heavy metal source analysis in municipal solid waste (MSW): Case study on Cu and Zn. J. Hazard. Mater. 2011, 186, 1082–1087. [Google Scholar] [CrossRef] [PubMed]
  70. Greco, S.L.; Wilson, A.M.; Spengler, J.D.; Levy, J.I. Spatial patterns of mobile source particulate matter emissions-to-exposure relationships across the United States. Atmos. Environ. 2007, 41, 1011–1025. [Google Scholar] [CrossRef]
  71. Pope, C.A., 3rd; Burnett, R.T.; Thun, M.J.; Calle, E.E.; Krewski, D.; Ito, K.; Thurston, G.D. Lung cancer, cardiopulmonary mortality, and long-term exposure to fine particulate air pollution. J. Am. Med. Assoc. 2002, 287, 1132–1141. [Google Scholar] [CrossRef]
  72. Van Zelm, R.; Huijbregts, M.A.J.; den Hollander, H.A.; van Jaarsveld, H.A.; Sauter, F.J.; Struijs, J.; van Wijnen, H.J.; van de Meent, D. European characterization factors for human health damage of PM10 and ozone in life cycle impact assessment. Atmos. Environ. 2008, 42, 441–453. [Google Scholar] [CrossRef]
Figure 1. Map of the study area showing main disposal sites.
Sustainability 10 02424 g001
Figure 2. System boundary of the Bahawalpur waste management system under study.
Sustainability 10 02424 g002
Figure 3. Percentage physical composition of solid waste in high income houses (a); middle income houses (b); low income houses (c) and weighted average (d) in residential area of Bahawalpur City.
Sustainability 10 02424 g003
Figure 4. Description of existing waste management scenario.
Sustainability 10 02424 g004
Figure 5. Environmental impacts of existing and alternate scenario for various impact categories.
Sustainability 10 02424 g005
Table 1. Waste generation rate variation with income groups.
Income GroupsGeneration Rate
Kg/Capita/Day
Collection Rate
Kg/Capita/Day
Difference between Collection and Generation Rates KG/Capita/Day
High income group0.6350.4700.164
Middle income group0.3840.2910.094
Low income group0.3100.1450.164
Weighted Average0.4250.2920.133
Table 2. Chemical composition of MSW in Bahawalpur city.
ComponentMoisture (%)VS (%)FCAshCHNS0GCV *
(Kcal/kg)
Vegetable food waste60.830.194.725.3241.86.13.30.1936.53694
Yard waste44.241.47.37.1235.14.51.50.1247.54075
Newspaper5.879.89.55.735.66.11.20.4051.04301
Paper and paper products10.672.78.19.132.54.60.710.1852.94016
Milk and juice cartons6.378.35.79.744.05.90.300.2037.64907
Dirty Cardboard8.471.510.410.141.76.20.680.0243.23825
Hard Plastics0.43970.22.860.410.00.69.01525.96175
* Gross Calorific Value.
Table 3. Modeled processes for various recycling activities.
Processes Used in RecyclingNumerical Info Type of Use
Paper Recycling Process
Paper transportation for recycling0.0000206 L/km/kg
Electricity production0.35 kWh/kg inputConsumption
Natural gas consumption 3.19 Mj/kg inputConsumption
Heavy fuel oil0.058 kg/kg inputConsumption
Water from waterworks11.10 kg/kg inputConsumption
Virgin newspaper−0.75 kg/kg inputAvoidance/Substitution
Cardboard Recycling Process
Cardboard transportation for recycling0.0000206 L/km/kg
Electricity production0. 106 kWh/kg inputConsumption
Water from waterworks11.35 kg/kg inputConsumption
Virgin cardboard−0.70 kg/kg inputAvoidance/Substitution
Metal Recycling Process
Metal transportation for recycling0.00006 L/km/kg
Metal Collection for recycling0.00204 L/kg inputConsumption
Electricity production0.11 kWh/kg inputConsumption
Hard coal0.04 kg /kg inputConsumption
Water from waterworks0.00053 kg/kg inputConsumption
Oxygen0.014 kg/kg inputConsumption
Natural gas1.95 Mj/kg inputConsumption
Furnace oil0.025 kg/kg inputConsumption
Steel sheets (97.75% primary)0.87 kg/kg inputAvoidance/Substitution
Plastic Recycling Process
Plastic transportation for recycling0.00010 L/km/kg
Electricity production0.17 kWh/kg inputConsumption
Natural gas consumption *0.88 Mj/kg inputConsumption
Water from waterworks0.250 kg/kg inputConsumption
Polyethylene high density granulate −0.8 kg/kg inputAvoidance/Substitution
Glass Recycling Process
Glass transportation for recycling0.0000206 L/km/kg
Marginal electricity consumption0.45 kWh/kg inputConsumption
Production and combustion of diesel oil0.0016 L/kg inputConsumption
Natural gas consumption2.2 Mj/kg inputConsumption
Glass products−1 kg/kg inputAvoidance/Substitution
Table 4. Characteristics of waste fractions as modeled in EASETECH.
Waste
Component
Total
Input %
Reuse %Recycle
R1%
Residue
RW%
Scavenging Activities
R2 (% of RW)
To Landfill
(% of RW)
Vegetable Food waste10010.45089.5525.0974.91
Yard waste1007.060092.9437.1562.85
Animal excreta100------100---100
Paper and paper products10013.8255.3030.8886.014
Cardboard1009.1451.7039.1692.47.6
Glass10013.4616.4470.179.021
Plastic10036.8130.1133.0897.42.6
Metals1006.9062.9130.1998.51.5
Residuals100------100---100
Table 5. Selected Impact categories, measured units and characterized/aggregated impacts for existing waste management system in Bahawalpur City.
Impact CategoriesClimate Change
(CC)
Human Toxicity, Carcinogenic
(HT-C)
Human Toxicity, non-Carcinogenic
(HT-NC)
Eco–Toxicity
(Ec-T)
Depletion of Abiotic Resources, Fossil
(DAR-F)
Depletion of Abiotic Resources
(DAR-R)
Particulate Matter
(PM)
Unitskg CO2-EqCTUCTUCTUMJkg antimony-eqKgPM2.5-eq
Characterized impacts3.16 × 1071.91 × 10−39.72 × 10−23.12 × 106−9.60 × 10723.53−2.35 × 10³
Junkshop3.94 × 1032.87 × 10−73.47 × 10−58.2924.36 × 1044.0 × 10−40.3912
Metal transportation6.95 × 1041.09 × 10−64.92 × 10−42.3 × 1039.1 × 1051.72 × 10−118.27
Glass transportation1.23 × 1051.93 × 10−68.70 × 10−44.2 × 1031.60 × 1063.04 × 10−132.3
Cardboard transportation1.14 × 1051.79 × 10−68.10 × 10−43.9 × 1031.49 × 1062.83 × 10−130.06
Plastic transportation6.13 × 1059.61 × 10−64.34 × 10−32.1 × 1048.0 × 1061.517161.1
Paper transportation1.14 × 1051.79 × 10−68 × 10−43.8 × 1031.5 × 1062.82 × 10−129.97
Glass recycling−1.21 × 1041.6 × 10−6−0.001−2.5 × 1041.3 × 1072.24−430.7
Steel recycling−4.37 × 10⁶−1.1 × 1040.027.2 × 10−4−3 × 10⁷−2.81−449.4
Plastic recycling−4.31 × 1061.76 × 10−6−2 × 10−41.1 × 103−1 × 10⁸−1.01 × 10⁻¹−1060
Paper recycling−7.94 × 10⁶−2.84 × 10⁻³−0.0841.29 × 1051.4 × 10724.02−537.8
Cardboard recycling1.51 × 105−9.45 × 10⁻⁵−0.02−6 × 10⁵−8 × 10⁶−2.628−169.4
Residual waste transport8.35 × 1041.31 × 10−66 × 10−42.8 × 1031.1 × 1062.07 × 10−121.97
Landfill4.7 × 1074.94 × 1031.74 × 10−13 × 1062.2 × 1054.28 × 10−24.393
The grey area indicates environmental savings.

