Vulnerability Assessment to Climate Variability and Climate Change in Tijuana, Mexico

El Colegio de la Frontera Norte AC, 22560 Tijuana, Mexico
*
Author to whom correspondence should be addressed.
Sustainability 2018, 10(7), 2352; https://doi.org/10.3390/su10072352
Submission received: 10 May 2018
/
Revised: 15 June 2018
/
Accepted: 25 June 2018
/
Published: 6 July 2018
(This article belongs to the Special Issue Climate Resilient Urban Development)
Abstract
:This paper presents research results of a recent project creating an operational approach to assess vulnerability to climate variability and climate change in Tijuana, Mexico. Despite chronic flooding problems throughout the history of the city, local authorities and state authorities have given little attention to vulnerability to climate variability and climate change. This is the first assessment of vulnerability to flooding carried out in Tijuana. Research results show that over 10 percent of the total population in the city (over 153,000 inhabitants) lives in areas with high vulnerability to flooding, and an additional 18 percent (277,000 inhabitants) are in areas with what we classify as medium-high vulnerability. Results by census track identified specific areas and social groups in these categories, as well as the underlying drivers of vulnerability associated with the biophysical conditions of the landscape that have been modified by urban growth and through social processes (namely, deficiencies in local urban planning and its enforcement along with deficient social policies). Information and knowledge of vulnerability is a useful first step in the long process of creating climate adaptation and resilient pathways within the context of sustainable urban development.
1. Introduction
The latest IPCC Assessment reports broad agreement among the international scientific community that climate change risks, vulnerabilities, and impacts are increasing across the world in urban centers of all sizes [1]. Although the report stresses climate change will have profound impacts on a broad spectrum of infrastructure systems, services, the built environment and ecosystem services, it recognizes urban centers around the world face severe constraints to raising and allocating resources to implement adaptation. This problem is particularly relevant in cities within low-income and middle-income countries. Significant future population growth will take place in these types of cities [2,3]—primarily in Asia (mostly in China and India), Africa and, to a lesser extent, in Latin America [4]. Cities in high-income countries have created adaptation plans and strategies in an effort to reduce risks and vulnerabilities associated with climate change, recognizing that adaptation to future impacts requires initiating responses as soon as possible to avoid being locked into situations that would limit adaptation options in the short-term, middle-term, and long-term [5,6]. Large cities (London, New York, Rotterdam, Chicago, Paris, etc.) have created climate change adaptation plans and begun implementing them [7,8,9]. Many of the adaptation plans in these cities have a strong emphasis on infrastructure as a key component of their adaptation plans [1,7].
In contrast, few cities in low-income and middle-income countries have created adaptation plans to climate change [10,11]. Funding has been considered a major constraint to develop adaptation in these cities. The level of funding needed for sound urban adaptation is likely to exceed the capacities of local and national governments and international agencies [12]. Funding key element of urban development in these countries are also essential components of climate change adaptation. However, few local governments have the capacity to secure the quality of provision and coverage of infrastructure and services, or the capacity to invest in land management [13]. Climate change presents an additional challenge for them: mainstreaming adaptation in their development plans and policies [14,15,16]. Although this has been a problem in cities around the world, it is far more challenging in low-income and middle-income countries. [10,17,18,19].
We consider that adaptation should be inclusive of formal and informal urban growth. It is important to remember that cities in low-income and middle-income countries face structural socioeconomic constraints. They are often characterized by top-down approaches and their implementation and effectiveness depend on complex politically negotiated processes [11,20]. The construction of urban infrastructure, housing programs, and urban services are top-down actions managed by local governments through urban planning and the real estate market. It would be unrealistic, however, to expect that planning by itself could make a difference in urban areas of low and middle-income countries. This is because a significant part of rapid urban growth in these countries takes place outside of the framework of urban planning [11]. Top-down actions do not often reach low-income individuals and groups in informal settlements [21,22]. Informal settlements grow rapidly, they represent a large extent of the urban area, and they are among the communities with the highest vulnerability and most urgent need to adapt to climate change [2,3,19,23].
We argue there are opportunities conducive to creating adaptation processes in low-income and middle-income countries despite their financial constraints. We suggest the study of vulnerability and its underlying causes related to climate impacts is a key analytical tool to connect them with existing policies and development stressors. The analysis of vulnerability includes attention to social processes that condition the exposure, sensitivity, and capacity to cope with the negative consequences of climatic events [24,25]. These processes are also often responsible for socioeconomic and urban problems that local elected officials, practitioners, and stakeholders can relate and respond to. Considering adaptation as part of local development is an important step in mainstreaming adaptation in urban development and in developing an inclusive adaptation processes [20].
This point was highlighted by Dovers (2009) who stressed the importance of connecting adaptation to existing policy, agendas, knowledge base, and risks communities already face [26]. He suggested that there is an existing set of options on which to base adaptation policy development, representing a better beginning than starting afresh. This approach has been suggested by other scholars [27,28,29,30] and is relevant for fostering the participation of local elected officials, practitioners, and stakeholders in building and implementing adaptation strategies.
We argue vulnerability is an analytical concept useful in the study of climate impacts and their consequences in urban areas. It helps identify adaptation needs within the context of existing development policies. The concept of vulnerability has evolved through three main approaches in recent decades [24,25,31,32,33,34]: firstly, a biophysical approach within a risk–hazard framework which conceptualizes vulnerability of a system as a dose–response relationship between an exogenous hazard and its effect on a system; secondly, a social constructivist framework that regards social vulnerability as a pre-existing condition created by unequal access to resources; and finally, an approach that conceptualizes vulnerability as the differential abilities of a system to cope with external stressors. This approach considers vulnerability a function of an external dimension represented by the exposure of a system to climate variations, and an internal dimension of non-climatic factors consisting of the sensitivity and the adaptive capacity to climatic stressors [24,31]. This approach is common in the climate change community, international organizations [3,35,36,37], and the IPCC. The IPCC (2007) considers vulnerability as the degree to which a system is susceptible to, or unable to cope with, adverse effects of climate change, including climate variability and extremes [38]. Vulnerability is a function of the character, magnitude, and rate of climate variation to which a system is exposed, its sensitivity, and its adaptive capacity. These three dimensions can be seen as the outcome of the interaction of approaches to vulnerability in the physical and social sciences and a better account of the contextual and social dynamics of climate hazards and the linkages driving their impacts [34].
Unfortunately, the broad interpretation of vulnerability in the international community has led to diverse approaches leading to confusion and limiting ours analytical capacity in the last two decades [24,25,39,40,41]. The operationalization of the concept of vulnerability through these dimensions has remained problematic, particularly due to the lack of clarity of the relationship between these dimensions and in turn their relationship to vulnerability [33,34].
Recent publications have addressed this problem. Results of a meta-analysis of 134 papers, used as a representative sample of the vulnerability literature in the peer-reviewed journal publications, show 65% of papers in the study sample consist of vulnerability assessment focusing on a specific setting; 15% are dedicated to theoretical issues around vulnerability assessment; 10% engage with theoretical aspects of vulnerability assessment and report an assessment study; 9% of methodological papers also include an application component; and only 1% are dedicated exclusively to methodological issues [34]. Several additional results in this study are relevant to this paper. Tonmoy et al. found that 16% of the sample papers focus on the urban ecosystem, and only 17% of vulnerability studies have been conducted at the local level.
We consider there is a need to expand the discussion of methodological approaches in vulnerability assessment, particularly at the local level. Vulnerability assessment studies applied to specific settings do not always detail the methods used in the research [33,34,42,43]. Although attention to methodological aspects of vulnerability has increased in recent years, the prevailing diversity of approaches in vulnerability assessment remains an obstacle for the development of methodological frameworks. The review of 50 publications addressing vulnerability in the context of climate change identified lack of coherence in the selection of variables [43]. Variables used to characterize exposure in some studies were used to characterize sensitivity or even adaptive capacity in other studies. Variables used to define sensitivity in some studies appear defining adaptive capacity in others.
There is also little agreement on how vulnerability as a function of exposure, sensitivity and adaptive capacity should be interpreted [33]. Most authors assign the same weight to each of these three elements without a clear justification. Authors also use diverse interpretations around the equation of vulnerability. Most common are studies adding exposure and sensitivity and subtracting adaptive capacity, although some authors add all three elements while others multiply them [43]. We argue the popularity of the concept of vulnerability has often transformed it into an end in and of itself rather than an analytical tool as it was originally intended to be. The lack of focus on to developing robust methodological frameworks has diminished its analytical contributions. The assessment of vulnerability in the context of climate variability and climate change should not only be useful to identify individuals and communities in this condition but also to understand the underlying forces causing vulnerability. Understanding the root causes of vulnerability is a valuable contribution in the design of policies and strategies of adaptation to climate change within the context of local development stressors.
We designed a research project to assess vulnerability to select climate impacts in the city of Tijuana, Mexico keeping in mind the problems mentioned above. The project was funded by Mexico’s National Institute of Ecology and Climate Change (INECC), a research agency of Mexico’s Ministry of the Environment and Natural Resources (SEMARNAT). We explored alternatives to make the IPCC definition of vulnerability [25,33,43] an analytical tool conducive to achieving the three main research goals of the project: identify local communities vulnerable to climate change and their degree of vulnerability; identify and analyze the underlying causes of their vulnerability; and develop a methodological framework useful to the assessment of vulnerability to climate variability and climate change in other Mexican cities. We modified the IPCC conceptual approach to vulnerability by incorporating and analyzing historical records of climate damages in Tijuana (1970–2015). This historical information added important contextual characteristics and it helped better understand the root causes of vulnerability.
The case of Mexico is interesting. The country created a Climate Change Law in 2012 and a National Climate Change Strategy in 2014. Both the law and the strategy give vulnerability assessment a key role in climate change adaptation at the federal, state, and municipal level based on IPCC’ definition of vulnerability. Unfortunately, Mexico has given little attention to the implementation of these provisions and to developing methodological approaches for vulnerability assessment. A recent study analyzing 80 Municipal Climate Action Plans in Mexico found a lack of coherence in the methods used to assess vulnerability [44].
The research results show the negative consequences of planning deficiencies and a complete disregard of climatic conditions during decades of fast population and urban growth in Tijuana. Despite numerous climate-related damages, local authorities and state authorities have given little attention to preventing these problems. Vulnerability is not considered at all in urban planning and in strategic decisions orienting future urban growth, including future infrastructure needs. The case of Tijuana shows that low cost opportunities to reduce local vulnerability to flooding have been lost in recent decades and climate-related damages have continued to aggravate, reducing the alternative options to adapt to climate variability and climate change. The situation in Tijuana is similar to most cities in Mexico as well as in many other cities in low-income and middle-income countries. The unavoidable need to adapt to climate change highlights the importance of immediate action to avoid “locked-in” situations that would even further limit adaptation options. An important step forward is creating efficient and useful analytical tools to assess vulnerability to climate variability and climate change in order to better understand adaptation needs and opportunities.
Tijuana is a Mexican city located at the U.S./Mexico border that has experienced impressive growth during the last four decades. Its urban economy has been based on trade and services since its foundation over 100 years ago, but rapid industrialization since the 1970s has diversified and expanded economic activities in the city. Its population grew from 240,000 in 1970 to 1,559,683 in 2010 [45], and its urban area expanded from 7789 hectares in 1972 to 30,626 hectares in 2017.
Rapid industrialization has aggravated deficiencies caused by fast urban expansion and population growth, creating areas of incomplete urbanization and fragmented spaces with high levels of spatial segregation that aggravates social exclusion [46,47]. Tijuana is a mosaic of contrasts with a clear division between formal and informal urbanization. Informal settlements account for 43 percent of Tijuana’s urban area, concentrating 53 percent of its population, and containing 52 percent of its family dwellings [48]. These areas have grown outside of planning regulations. Many of these settlements are located in risk-prone areas where floods and landslides have been a common problem [49]. Records of climate related damages compiled by our research show flooding and landslides continue to be a problem in Tijuana. This is discussed in more detail below.
2. Relevant Elements for the Assessment of Vulnerability in Tijuana
The assessment of vulnerability to climate variability and climate change in Tijuana has four components: the study of climate documenting historical trends, regional climate, extreme events, and climate change scenarios; the process of urban growth and the way it has modified the landscape; documenting historical climate-related damages in the city; and the assessment of vulnerability and its root causes.
2.1. Climate Analysis
The analysis of historical records available for Tijuana and regional climate focused on temperature, daily precipitation above the mean, and extreme events. The most extreme wet years and the larger number of floods per year took place after 1976–1977, during constructive phases of El Niño and the Pacific Decadal Oscillation (PDO) that occurred in 1978, 1983, 1993, and 1998 [50]. However, floods also occurred during weak El Niño (e.g., January 1980 and February 1995) and even during non-El Niño years (e.g., January 1967, January 1991, and January 2000). For example, flooding in 2000 affected over 1000 hectares and nearly 14,000 homes in Tijuana [51]. Local authorities have learned to pay attention to El Niño years but few preventive actions are taken during non-El Niño years (such as cleaning up canals in the municipal storm drainage system, ordering evacuation from some hazardous areas and preparing emergency response actions before strong occurrences).
Historical records available for the city used in the project (1932–2011) show events of extreme daily precipitation correlate with strong El Niño years as expected, but also occurring during the Pacific Decadal Oscillation, as mentioned above. Historical records also show an increase in daily precipitation in recent decades [50].
The project used scenarios of climate change for 2015–2039 and 2075–2099 (RCP 4.5 and RCP 8.5) for changes in high temperature and precipitation created by Mexico’ National Institute of Ecology and Climate Change [52]. We focused mainly on the 2015–2039 RCP 4.5 scenario that shows moderated temperature increase in the Tijuana region (Cavazos and Arriaga-Ramírez’s (2012) study in the same region reports similar results [53]). The same scenario shows a small increase in average precipitation in Tijuana. A recent publication studying drought in the Southwest part of the U.S. [54] found a combined effect of Palmer’s drought index and climate change index. The study covered a long time series divided into two periods 1896–1994 and 1994–2014 and found a stronger combined signal for this second period. The authors foresee longer periods of drought combined with occasional extreme precipitations events during coming decades in the southwest region of the United States that extends to Mexico’s northwest where Tijuana is located. Two of Tijuana’s major challenges for coming decades are to secure future sources of water and to cope with chronic flooding problems when it rains.
2.2. The Transformation of the Landscape by Urban Growth in Tijuana
The project studied urban growth in Tijuana and how it has modified the local landscape. Urban growth in Tijuana extended onto a small valley of the Tijuana River, a binational watershed at the western corner of the U.S.–Mexico border. Tijuana’s fast urban expansion and population growth since the 1950s rapidly saturated available flat land. Urban growth began to occupy the slopes surrounding the Tijuana River early in the 1970s.
The project reconstructed urban growth and land use in Tijuana from 1972 to 2014 using remote sensing and created a geographic information system to manage data and facilitate their analysis and visualization. The study used the following images: 1972 black and white aerial photo scale 1:75,000 (Comisión de Estudios del Territorio Nacional, Distrito Federal, México; 1986 black and white aerial photo scale 1:75,000 (Comisión de Estudios del Territorio Nacional, Distrito Feederal, México); 1994–2005 Spot images Tijuana–San Diego area scale 1:100,000 (San Diego State University, San Diego, CA, USA); 2008 aerial photo scale 1:5000 (Municipality of Tijuana, Tijuana, México); and 2014 Spot image scale 1:75,000 (ERMEX, Ciudad de México, México). Projections used up to 2008 UTM NAD 27 zone 11 and UTM WGS 84 zone 11 afterwards. Population data were added for 1990, 2000 and 2010 by census tract.
Tijuana has been constructed by a complex web of social processes that include legal and illegal large-scale urban developments fracturing the stability of slopes and modifying the natural drainage of the terrain. However, it also includes informal settlements modifying the landscape at a low scale. Informal settlements extend to outlying parts of the urban area, particularly the peripheries (as mentioned above, 42% of urban growth has been created by informal settlements in Tijuana).
Local authorities have sought to create order in urban growth since the late 1970s explosive growth in the city was dispersed and unplanned, extending into flood-prone lowlands and up slopes with inclines of up to 40 percent. Figure 1 presents urban growth in Tijuana since 1972 and the table below the map shows progressive extension of urban growth on the slopes by decades. Figure 2 illustrates the formal and informal urban growth extending onto slopes in Tijuana and how diverse processes of urban growth have modified the landscape.
Understanding modifications to the landscape by urban growth between 1972 and 2015 proved to be an important contribution to the study of vulnerability to climate change in Tijuana. The new landscape resulting from these modifications affects the type of interactions between climate and the city. We were particularly interested in changes in precipitation runoff and changes in the stability of slopes compromised by urban growth. Urban growth has modified and blocked the natural runoff of the landscape, aggravating the risk of flooding. We identified the areas with severe and moderate modifications to the runoff using remote sensing (Spot image scale 1:75,000 (ERMEX), 2014) and incorporated these results into the exposure analysis into the assessment of vulnerability to flooding. We identified also areas where slopes had been modified by urban growth and added them to the exposure analysis in the assessment of vulnerability to landslides associated with climate variability.
2.3. Historical Climate-Related Damage
One of the hypotheses of our research was that climate-related damages could help better analyze vulnerability to climate variability and climate change in Tijuana. Mexico’s National Emergency Response Agency (Sistema Nacional de Protección Civil) has kept a database of major disasters since 2000. Unfortunately, the process to register a disaster is complicated and as a result damages with significant local consequences but not classified as a national disaster are not included in the national database. A second problem with the national database is that its records do not provide detailed information on the location of the disaster and its characteristics. As a result, the national database of disasters had no records for Tijuana. Confronted by the lack of official information on climate related disasters in Tijuana, we reviewed local newspapers for the period 1970–2015. We used climate data (targeting days with precipitation above the mean) to guide the search and found a rich pool of information documenting low, middle, and severe climate damages reported by the main journals in the city. We focused on damages related to flooding and landslides caused by precipitation.
Every record in the database we created included a description of the damage, major consequences, location within the city, and, when possible, actions taken to address it. Records were georeferenced and input into the project’s GIS, but not all records had a clear location in the urban space. Those records without clear locational data were not georeferenced and excluded from the study. Records were grouped according to their consequences for people, housing, infrastructure, and urban mobility. Each event was classified according to its level of damage. For example, major consequences for people included the number of casualties, number of people injured, or number of people evacuated, while damages to dwellings included a total loss, severe damage or partial damage. Higher weight was assigned to consequences for people (the highest weight was given to events recording casualties), then damages to dwellings (the highest weight was given to total loss), damages to infrastructure (higher weight to major damage) and the lowest weight was assigned to damages affecting urban mobility. Records were also classified by decade to facilitate their study as an evolution in time.
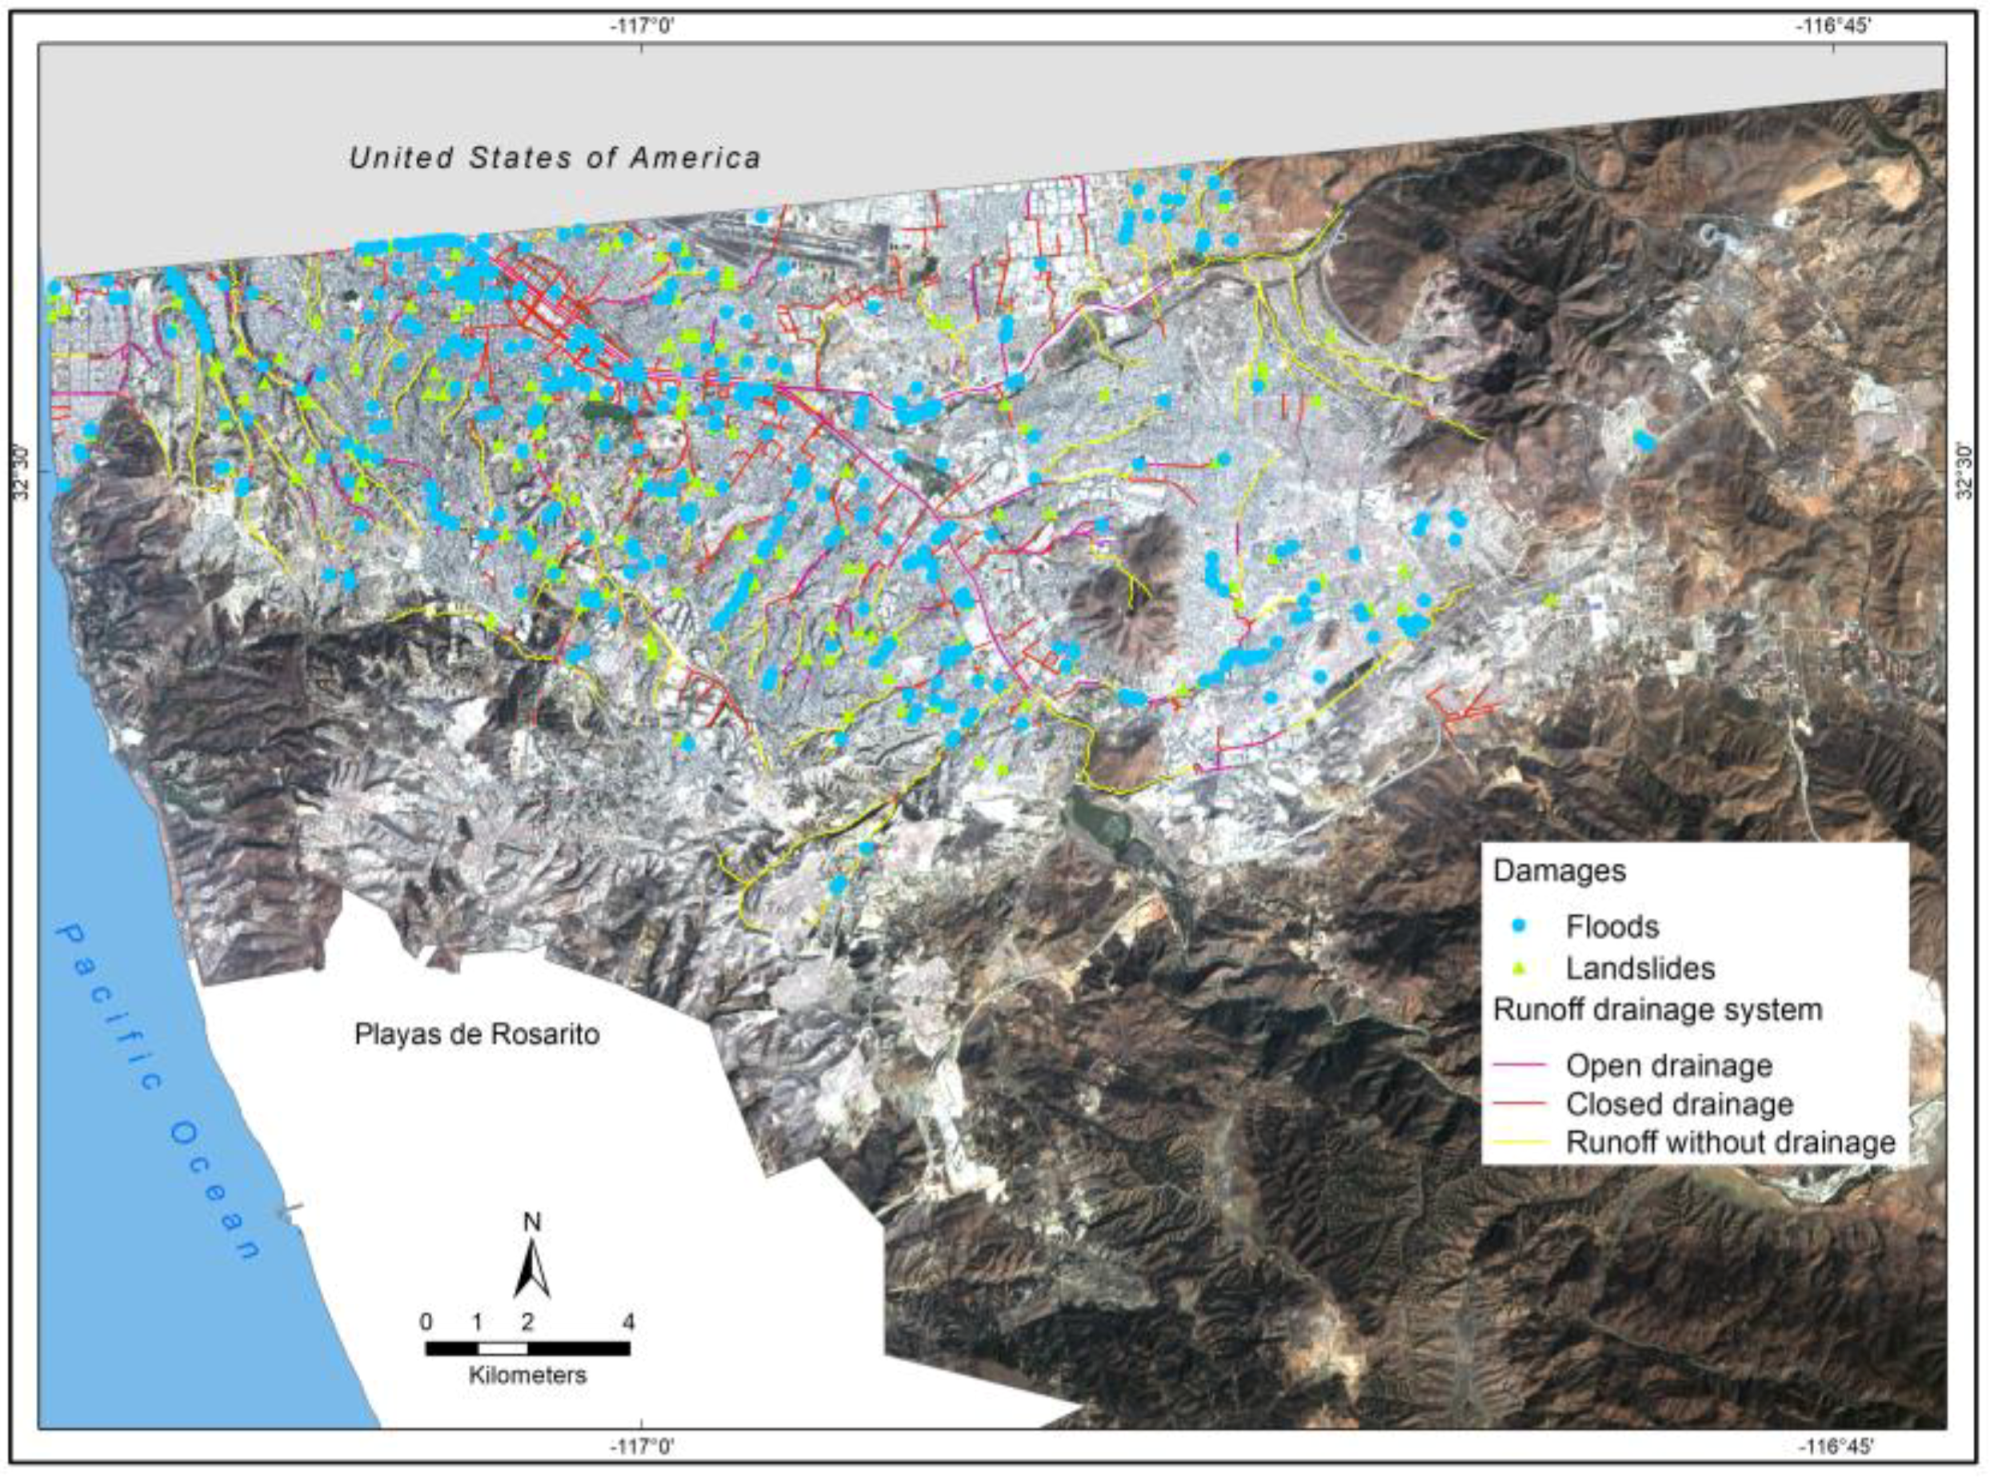
Figure 3 is a map of climate-related damages in the urban space of Tijuana. Dots in blue indicate flooding and triangles in green indicate damage by landslides. This figure illustrates that climate related damages have occurred in most of the city. The analysis of records by decades helped identified recurrent damages in some areas. The map includes also the storm drainage system, open drains in red, enclosed drains in orange, and runoff not served by the storm drainage system in yellow. The map shows several flooding damages in areas not served by the storm drainage system, but they also occur in low parts of the city where runoff concentrations surpasses the capacity of open or enclosed drains. The map is also a good illustration of the consequences of the modification of the landscape by urban growth mentioned above. Damages created by landslides (green triangles) are common in large parts of the city due to the topography and the lack of protection of slopes modified by urban growth.
Historical records of climate-related damages were useful indicators of exposure in the vulnerability assessment described in the next section. The analysis of climate related damages also helped understand the low prevention level in the city. Local actions have concentrated on immediate responses to major contingencies with limited efforts to address their root causes.
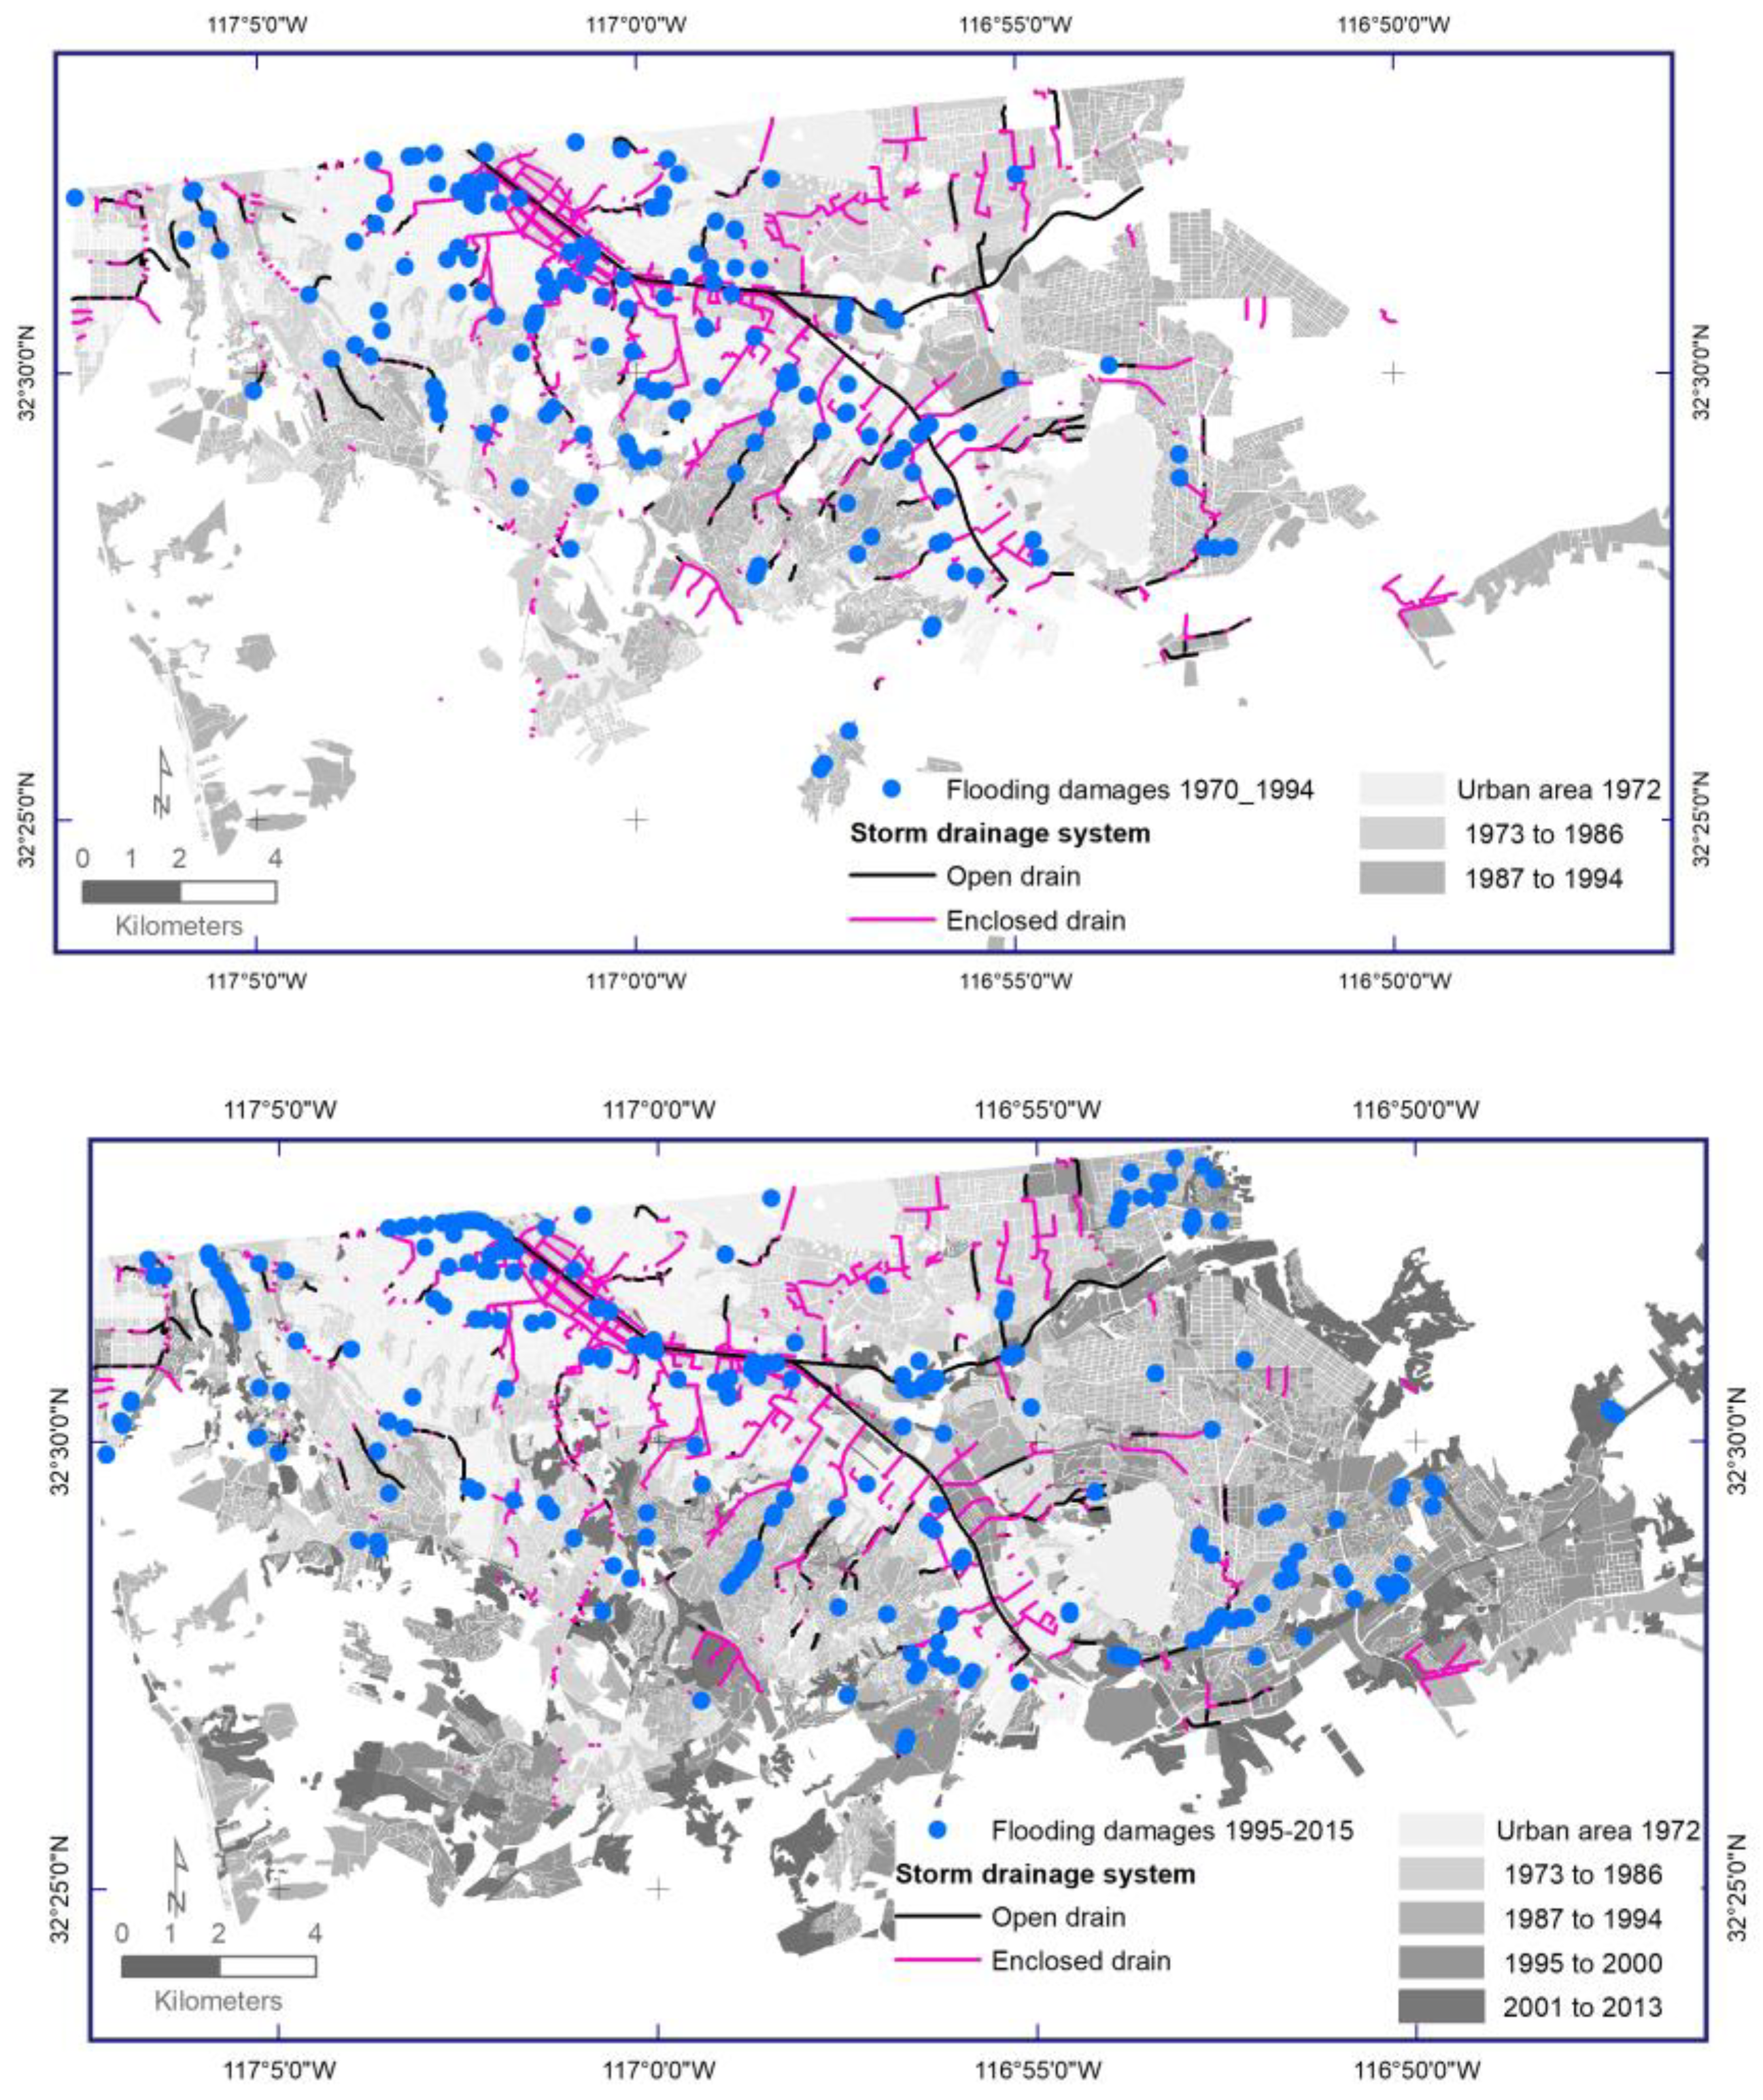
The analysis of the storm drainage system in Tijuana is a good example of the reactive approach of local authorities. Figure 4 shows two maps displaying the extent of the system. The first one illustrates the system in the urban area of Tijuana up to the early 1990s. It includes flooding damages until 1994 in the database compiled by the project (blue dots). One characteristic of the storm drain system in Tijuana is that not all the drains are connected to the central system. The existence of unconnected drains was explained once the layer of damages was overlaid on the map. The unconnected drains were constructed to solve specific chronic flooding problems in Tijuana. The second map presents urban growth in Tijuana up to 2013, the extension of the storm drainage system up to that year, and flooding damages recorded also to that year. These two maps show that the rapid expansion of the urban area has not been met with the expansion of the storm drainage system. It also shows flooding problems in areas recently urbanized and an aggravation of problems in areas previously flooded between 1972 and 1994. Tijuana’s storm drainage system was developed as a defensive strategy to severe flooding in the late 1970s and early 1990s but it did not continue to growth at the same pace as urban growth. Although flooding continues to be a chronic problem, state authorities and local authorities have not provided enough attention to it during the last two decades. An additional problem is that there is no data of the amount of runoff in the 23 sub watersheds in the city or the capacity of the storm drainage system in light of current and future precipitation.
The project combined historical evidence of climate-related damages and climate data to identify the type and severity of damages associated with daily precipitation. Table 1 clusters historical records of daily precipitation by levels in the columns (0.1–10 mm per day, 10.1–20.0 mm per day, 20.1–30 mm per day, etc.) for the period 1970–2011. The rows in the table list major and more frequent damages recorded in Tijuana (deaths, evacuated, population in shelters, total loss of dwelling, partial damage of dwellings, flooding and landslide in neighborhoods, disruption in water supply, and power interruption). The results of this analysis show damages occurred even during low levels of daily precipitation (0.1–10 mm) but more severe damages have occurred after 10 mm of daily precipitation (1 death, 193 records of dwellings damaged, 823 records of people evacuated, 35 records of communities flooded, and 13 communities with landslides).
Table 1 also shows that the frequency and severity of damages are related to daily precipitation above 20 mm and up to 60 mm per day (events of daily precipitation above 60 mm have been rare). For example, results of a study on landslides in Tijuana carried out by Mexico’s National Center of Disaster Prevention (CENAPRED) showed landslides are closely associated with daily precipitation above 20 mm [56]. Table 1 shows similar results. They are a useful tool for decision making in disaster risk reduction and prevention and a valuable asset to the study of vulnerability to climate variability and climate change and its root causes. Georeferenced historical damage records helped identify critical areas within the city of Tijuana.
3. Methods, Results, and Discussion of the Vulnerability Assessment
Several authors have argued vulnerability assessment at the local scale is where processes generating vulnerability are well defined and the scientific validity of the assessment is likely to be at its highest [33,34]. We concur with this perspective. The objective of this research was to identify vulnerable areas and vulnerable population to climate variability and climate change in the city as well as to understand the underlying causes of vulnerability. To achieve these goals, we modified the IPCC’s original working definition and included the results of an analysis of historical climate-related damages as evidence of damage. This is a fourth dimension to be added to exposure, sensitivity, and adaptive capacity in defining vulnerability. This project studied vulnerability to three major effects of climate variability and climate change in Tijuana: flooding, landslides, and water access. It created a vulnerability index for each of these impacts. We used census tracks as our basic unit of analysis within the urban area to achieve detailed georeferenced socio-economic and biophysical information. The city of Tijuana is divided in 568 census tracks [45]. Due to space limitations, we only describe below the method and indicators used in the assessment of vulnerability to flooding.
A review of vulnerability studies in the international literature mentioned in the Introduction states that the IPCC approach to assess vulnerability is common in the climate change community [3,35,36,37]. Vulnerability is a function of the character, magnitude, and rate of climate variation to which a system is exposed, its sensitivity, and its adaptive capacity [36]. As stated above, we added evidence of damage as an additional dimension to the assessment of vulnerability. These dimensions can be seen as the outcome of the interaction of approaches to vulnerability in the physical and social sciences and a better account of the contextual and social dynamics of climate hazards and the linkages driving their impacts [34]. We selected the IPCC approach of vulnerability not only because it is common within the climate change community, but also because this working definition of vulnerability was adopted in Mexico’s climate change legislation (2012) and in its National Climate Change Strategy (2014). Vulnerability assessment is a key element in Mexico’s climate change adaptation policy. We also mentioned above that the operationalization of the concept of vulnerability has remained problematic and that assessment studies applied to specific settings do not always detail the methods used in the research [33,34,42,43].
In our method. vulnerability is expressed as the function: , where V is vulnerability, E is exposition, S is sensitivity, C is adaptive capacity, and D is evidence of damage. The vulnerability index for each impact is expressed as: , where is vulnerability in the i census track to impact j, is exposition in the i census track to impact j, is adaptive capacity in the i census track to impact j, and is damages in the i census track to impact j.
The components are weighted according to the impact j as follows: . To normalize all the components scores, we use the formula: . We constructed the vulnerability index by using the formula: .
Table 2 describes the method used for the assessment of vulnerability to flooding.
3.1. Exposure Index to Flooding
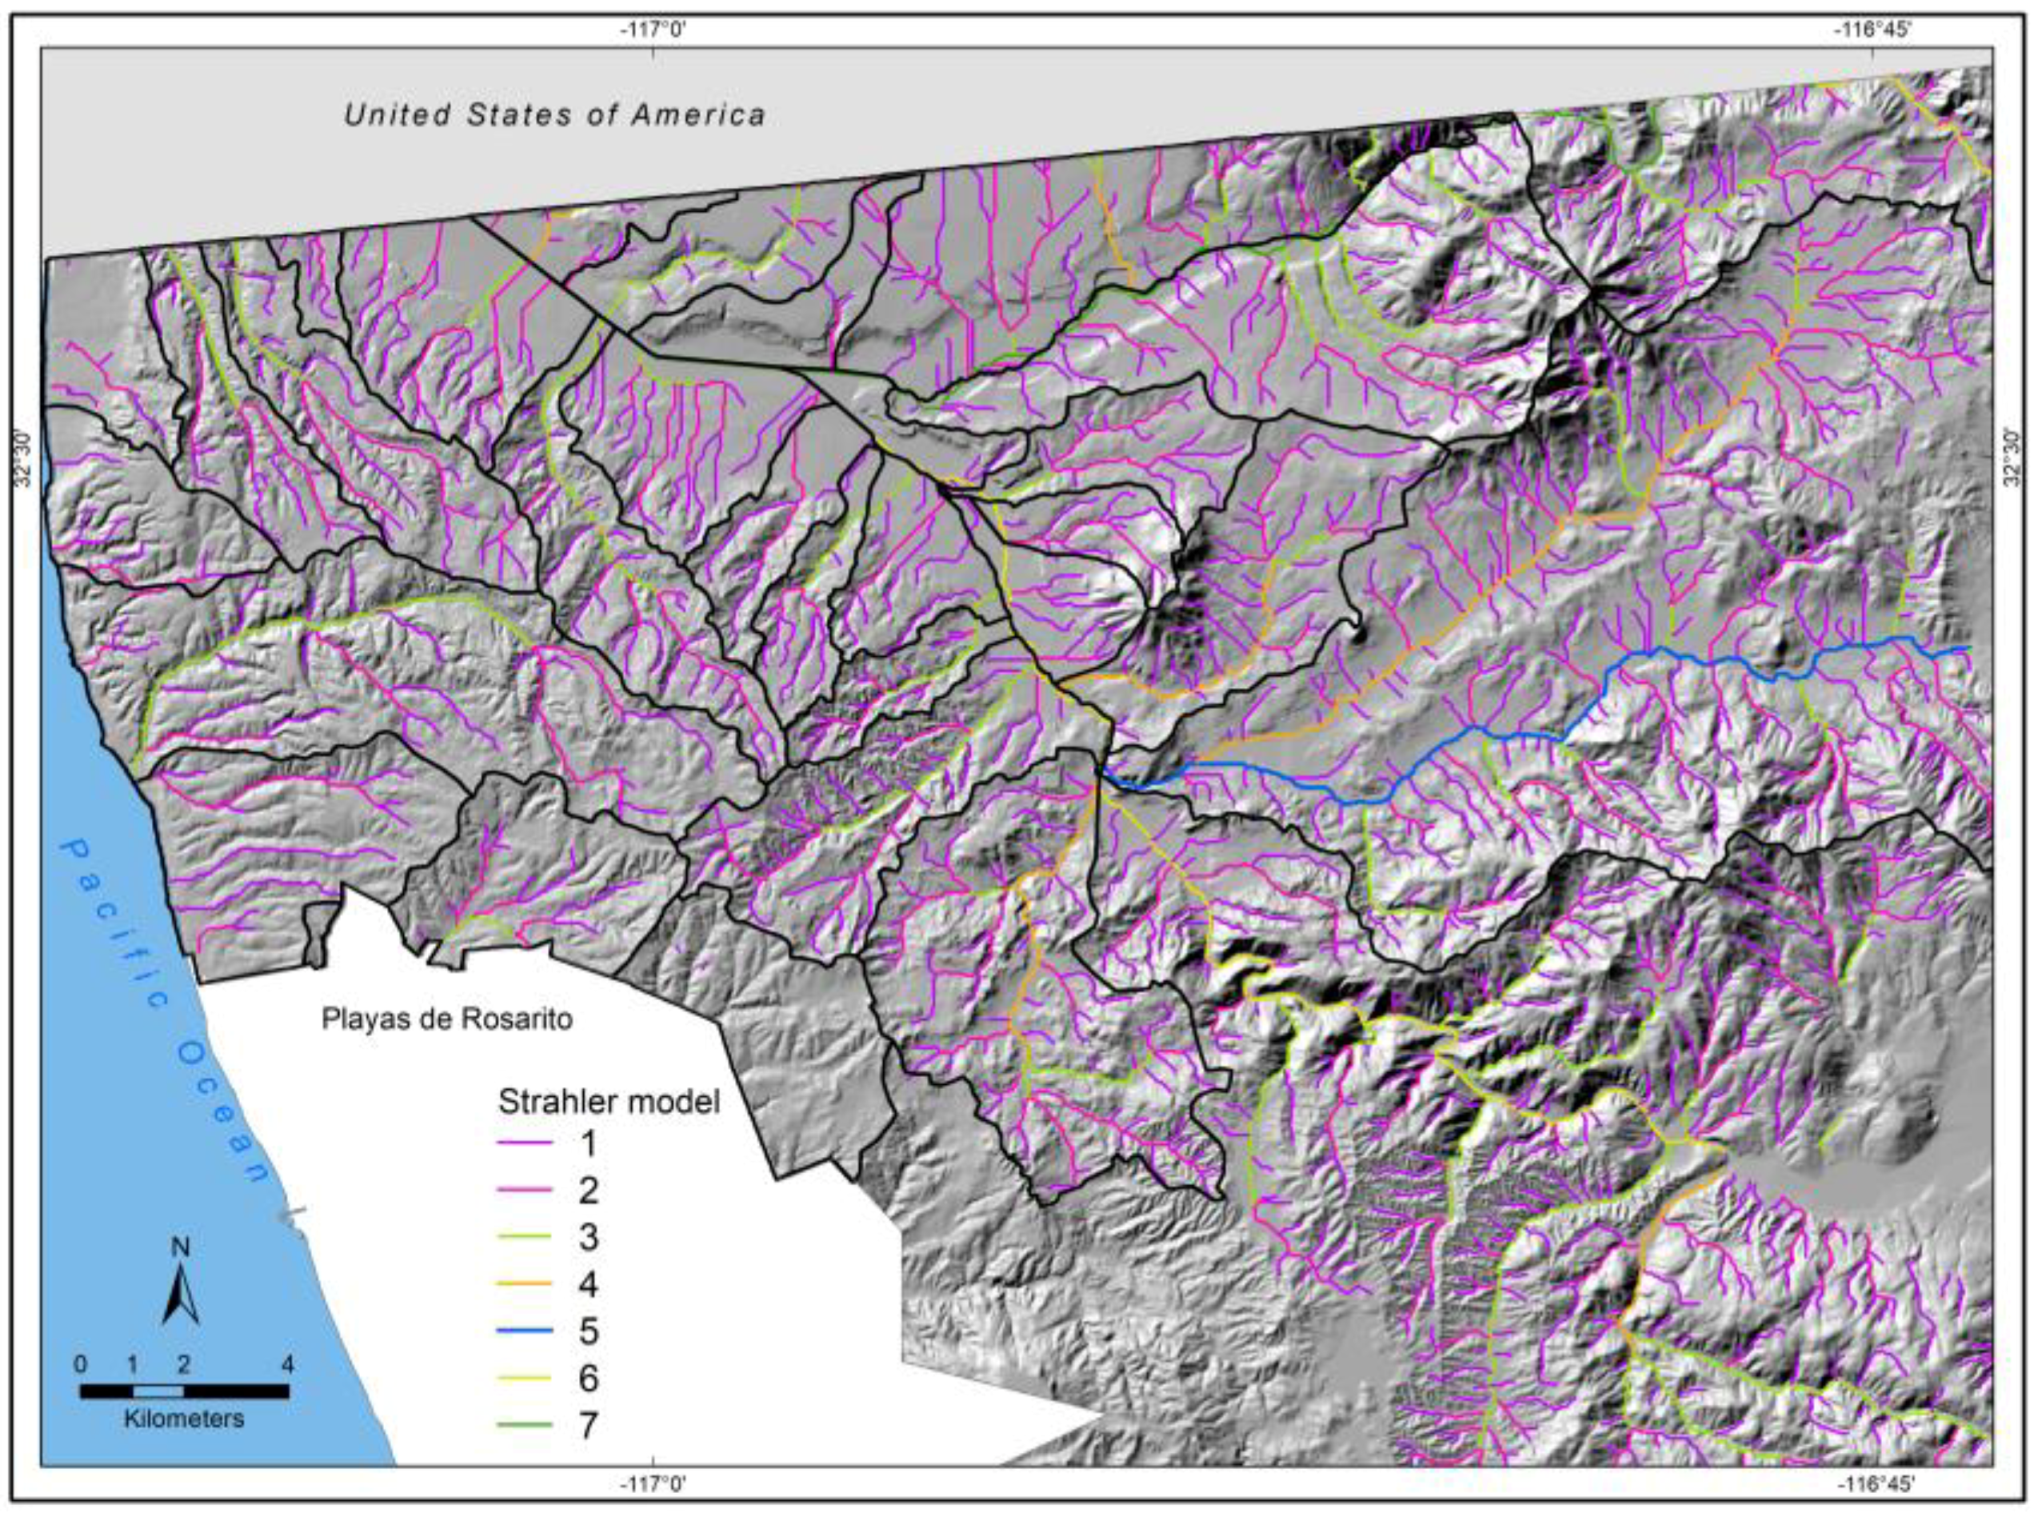
Most vulnerability studies consider climate variables to characterize exposure but we found this approach not helpful for achieving the goals of this project. Climate variables are part of the analysis as discussed above, particularly extreme events of daily precipitation and changes in temperature. Due to the lack of data and information on urban climate in Tijuana, particularly different volumes of precipitation within the urban area and runoff data in the 23 watersheds in Tijuana, we decided the dimension of exposure would be better characterized through biophysical variables and the consequences of social processes on them. For the assessment of vulnerability to flooding we used a hydrological model estimating levels of runoff within the urban area. We analyzed runoff based on the Strahler model (1957) [58]. Figure 5 shows the results of the model. The intensity of runoff is expressed in seven levels, with 1 being the weakest and 7 the strongest.
Exposure was defined through three indicators: runoff intensity (seven levels following Strahler model) in each census track, the length of runoff in each census track, and the degree of obstruction of the runoff caused by urban growth in each census track. The length of runoff was calculated in GIS and the degree of obstruction of runoff by urban grow was identified through remote sensing and then incorporated into the GIS model.
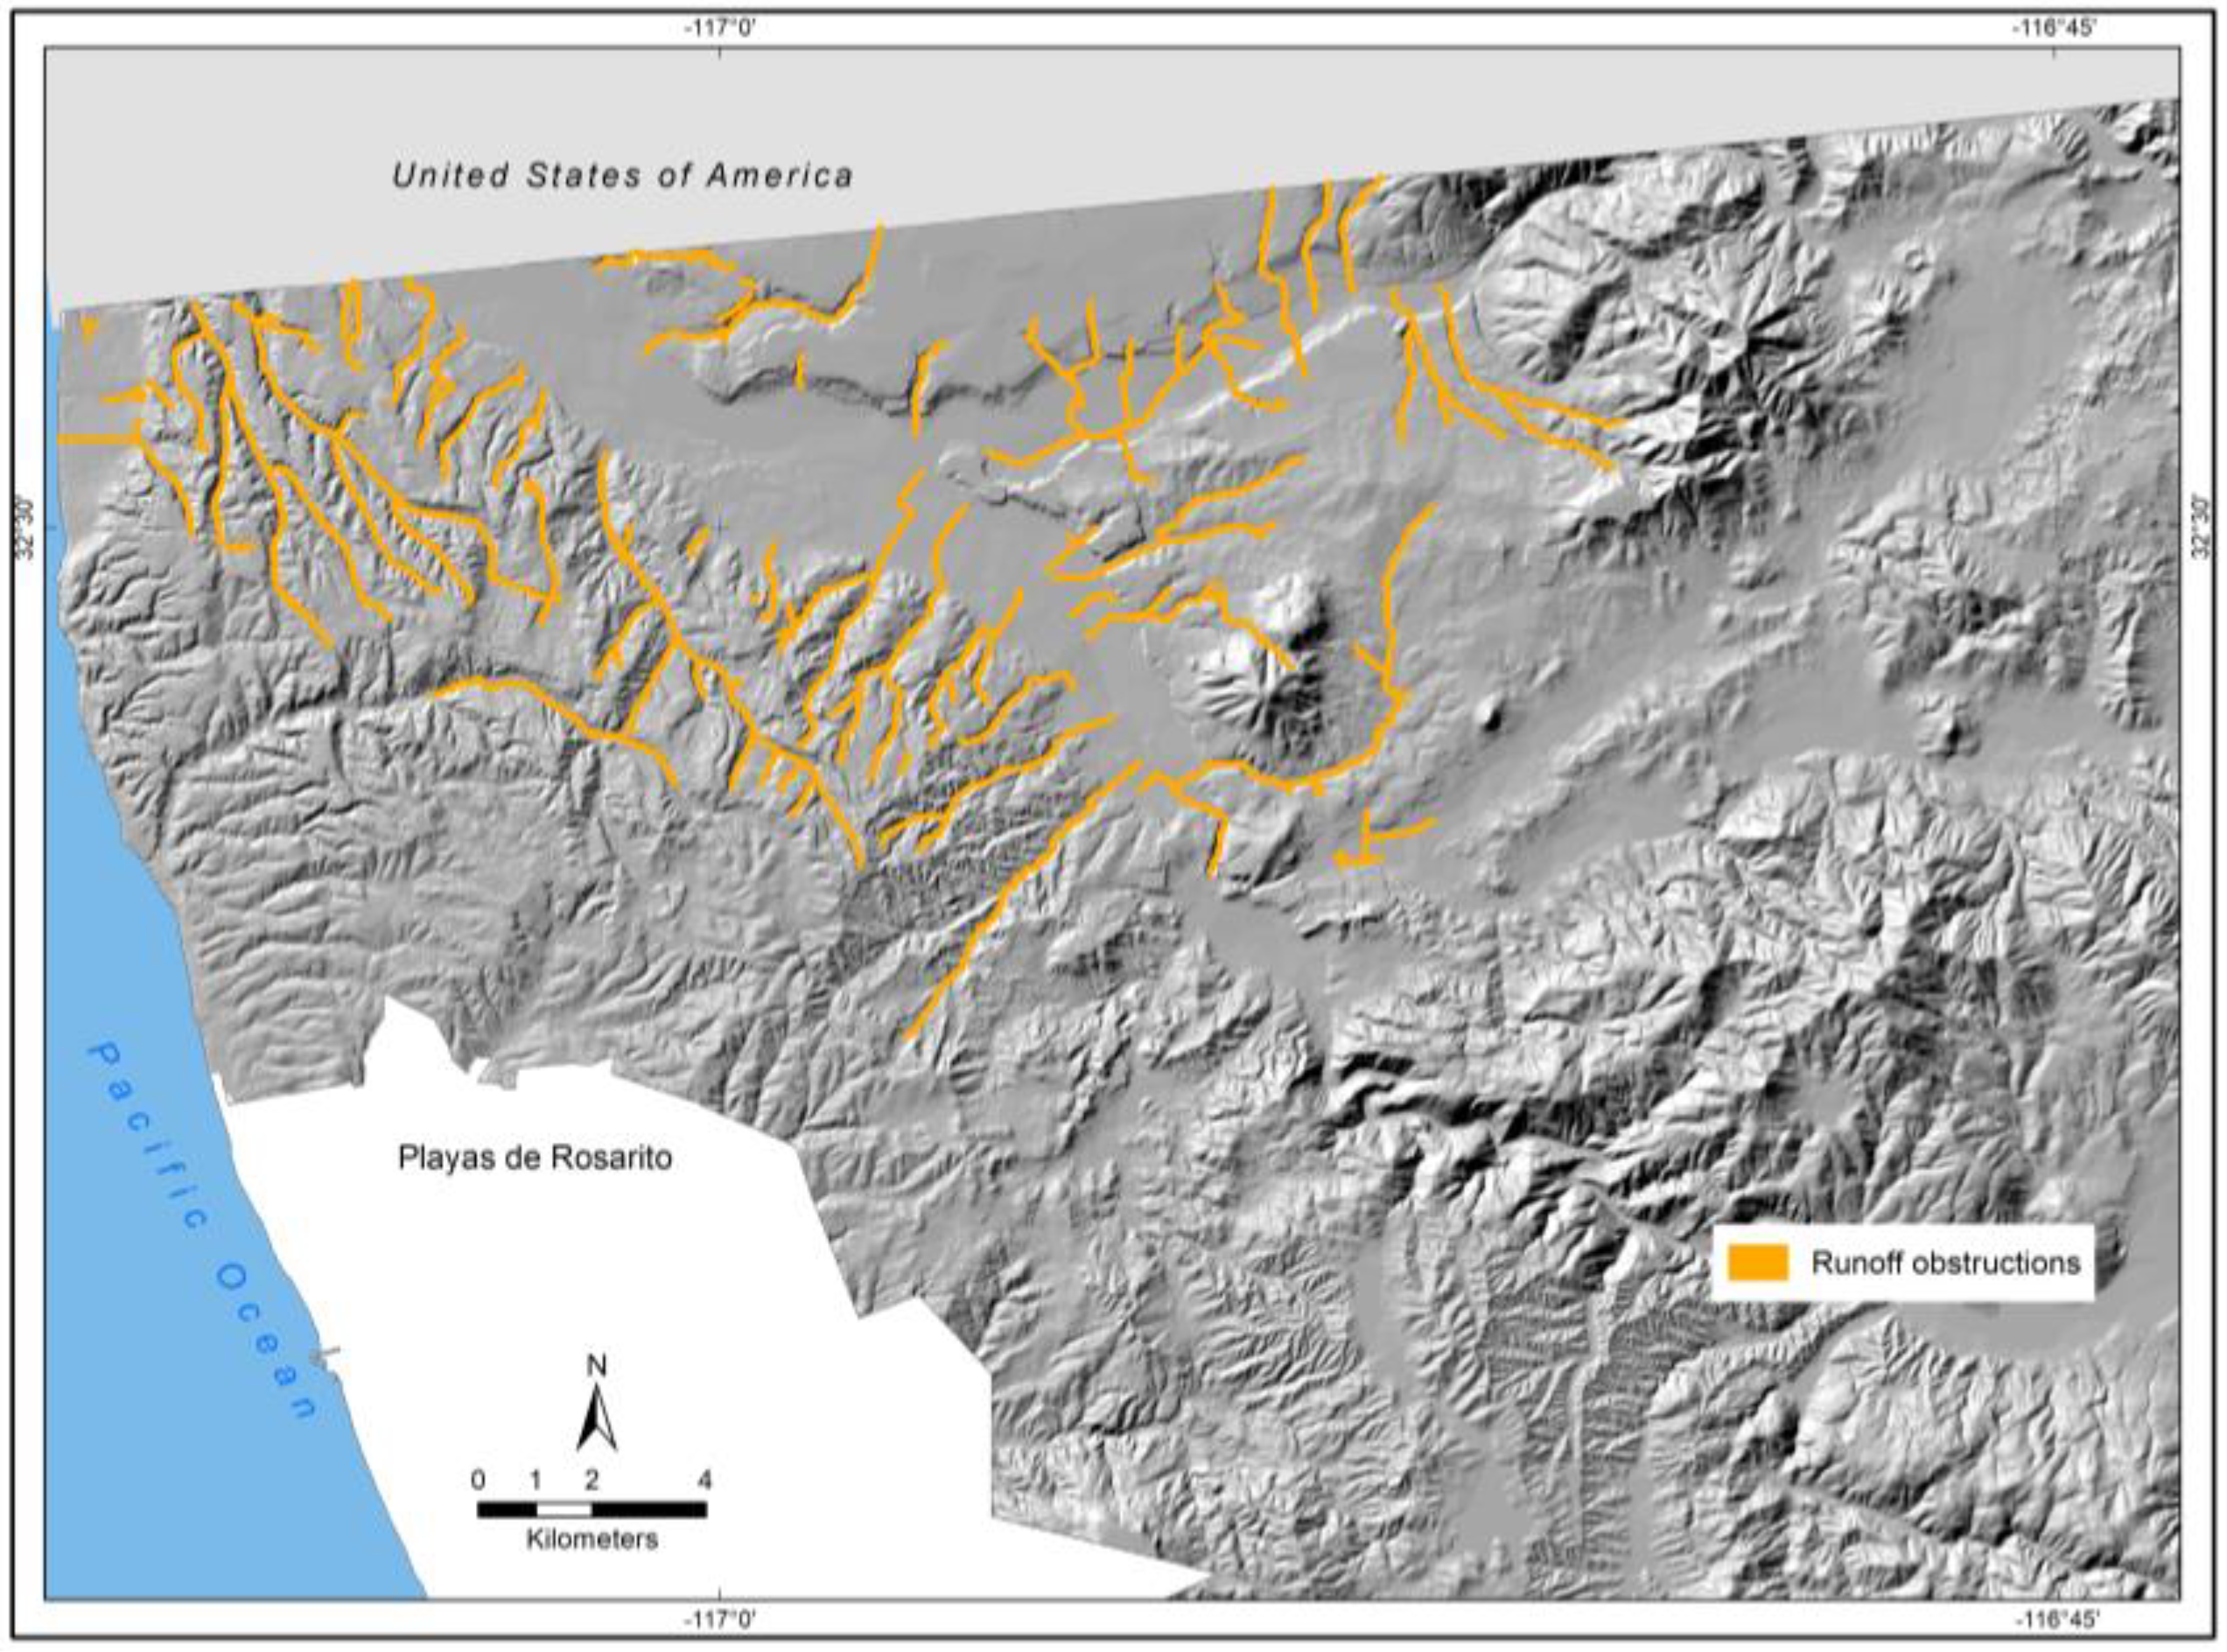
Figure 6 illustrates that the obstruction of runoff in Tijuana covers significant parts of the city. Obstructions of runoff are often created by informal settlements, but the analysis identified formal developments that have also obstructed runoff in several parts of the city, and fieldwork later corroborated these results. The obstruction of runoff by urban growth is a consequence of deficiencies in local urban planning and lack of protection of sensitive areas. We also found urbanization of the upper parts of the watershed has modified runoff in most watersheds in Tijuana, shortening the time to reach low areas and aggravating flooding problems. We found this characterization of exposure particularly useful and conducive to a better understanding of the underlying causes of vulnerability. In these case topography plays an important role in explaining the root causes of vulnerability. The limited amount of flat space suitable for urban growth has led to strong modifications of the landscape. Social processes driving urban growth in Tijuana escape the control of local authorities and are related to the strategic location of Tijuana at the U.S.–Mexico border and its attraction to immigration and relocation of industries. However, the root causes of vulnerability are also related to major deficiencies in local urban planning and its enforcement, including a complete disregard of climate, deficient social policies at the federal, state, and local level, and strong inequality in income distribution that has characterized Mexican society in recent decades.
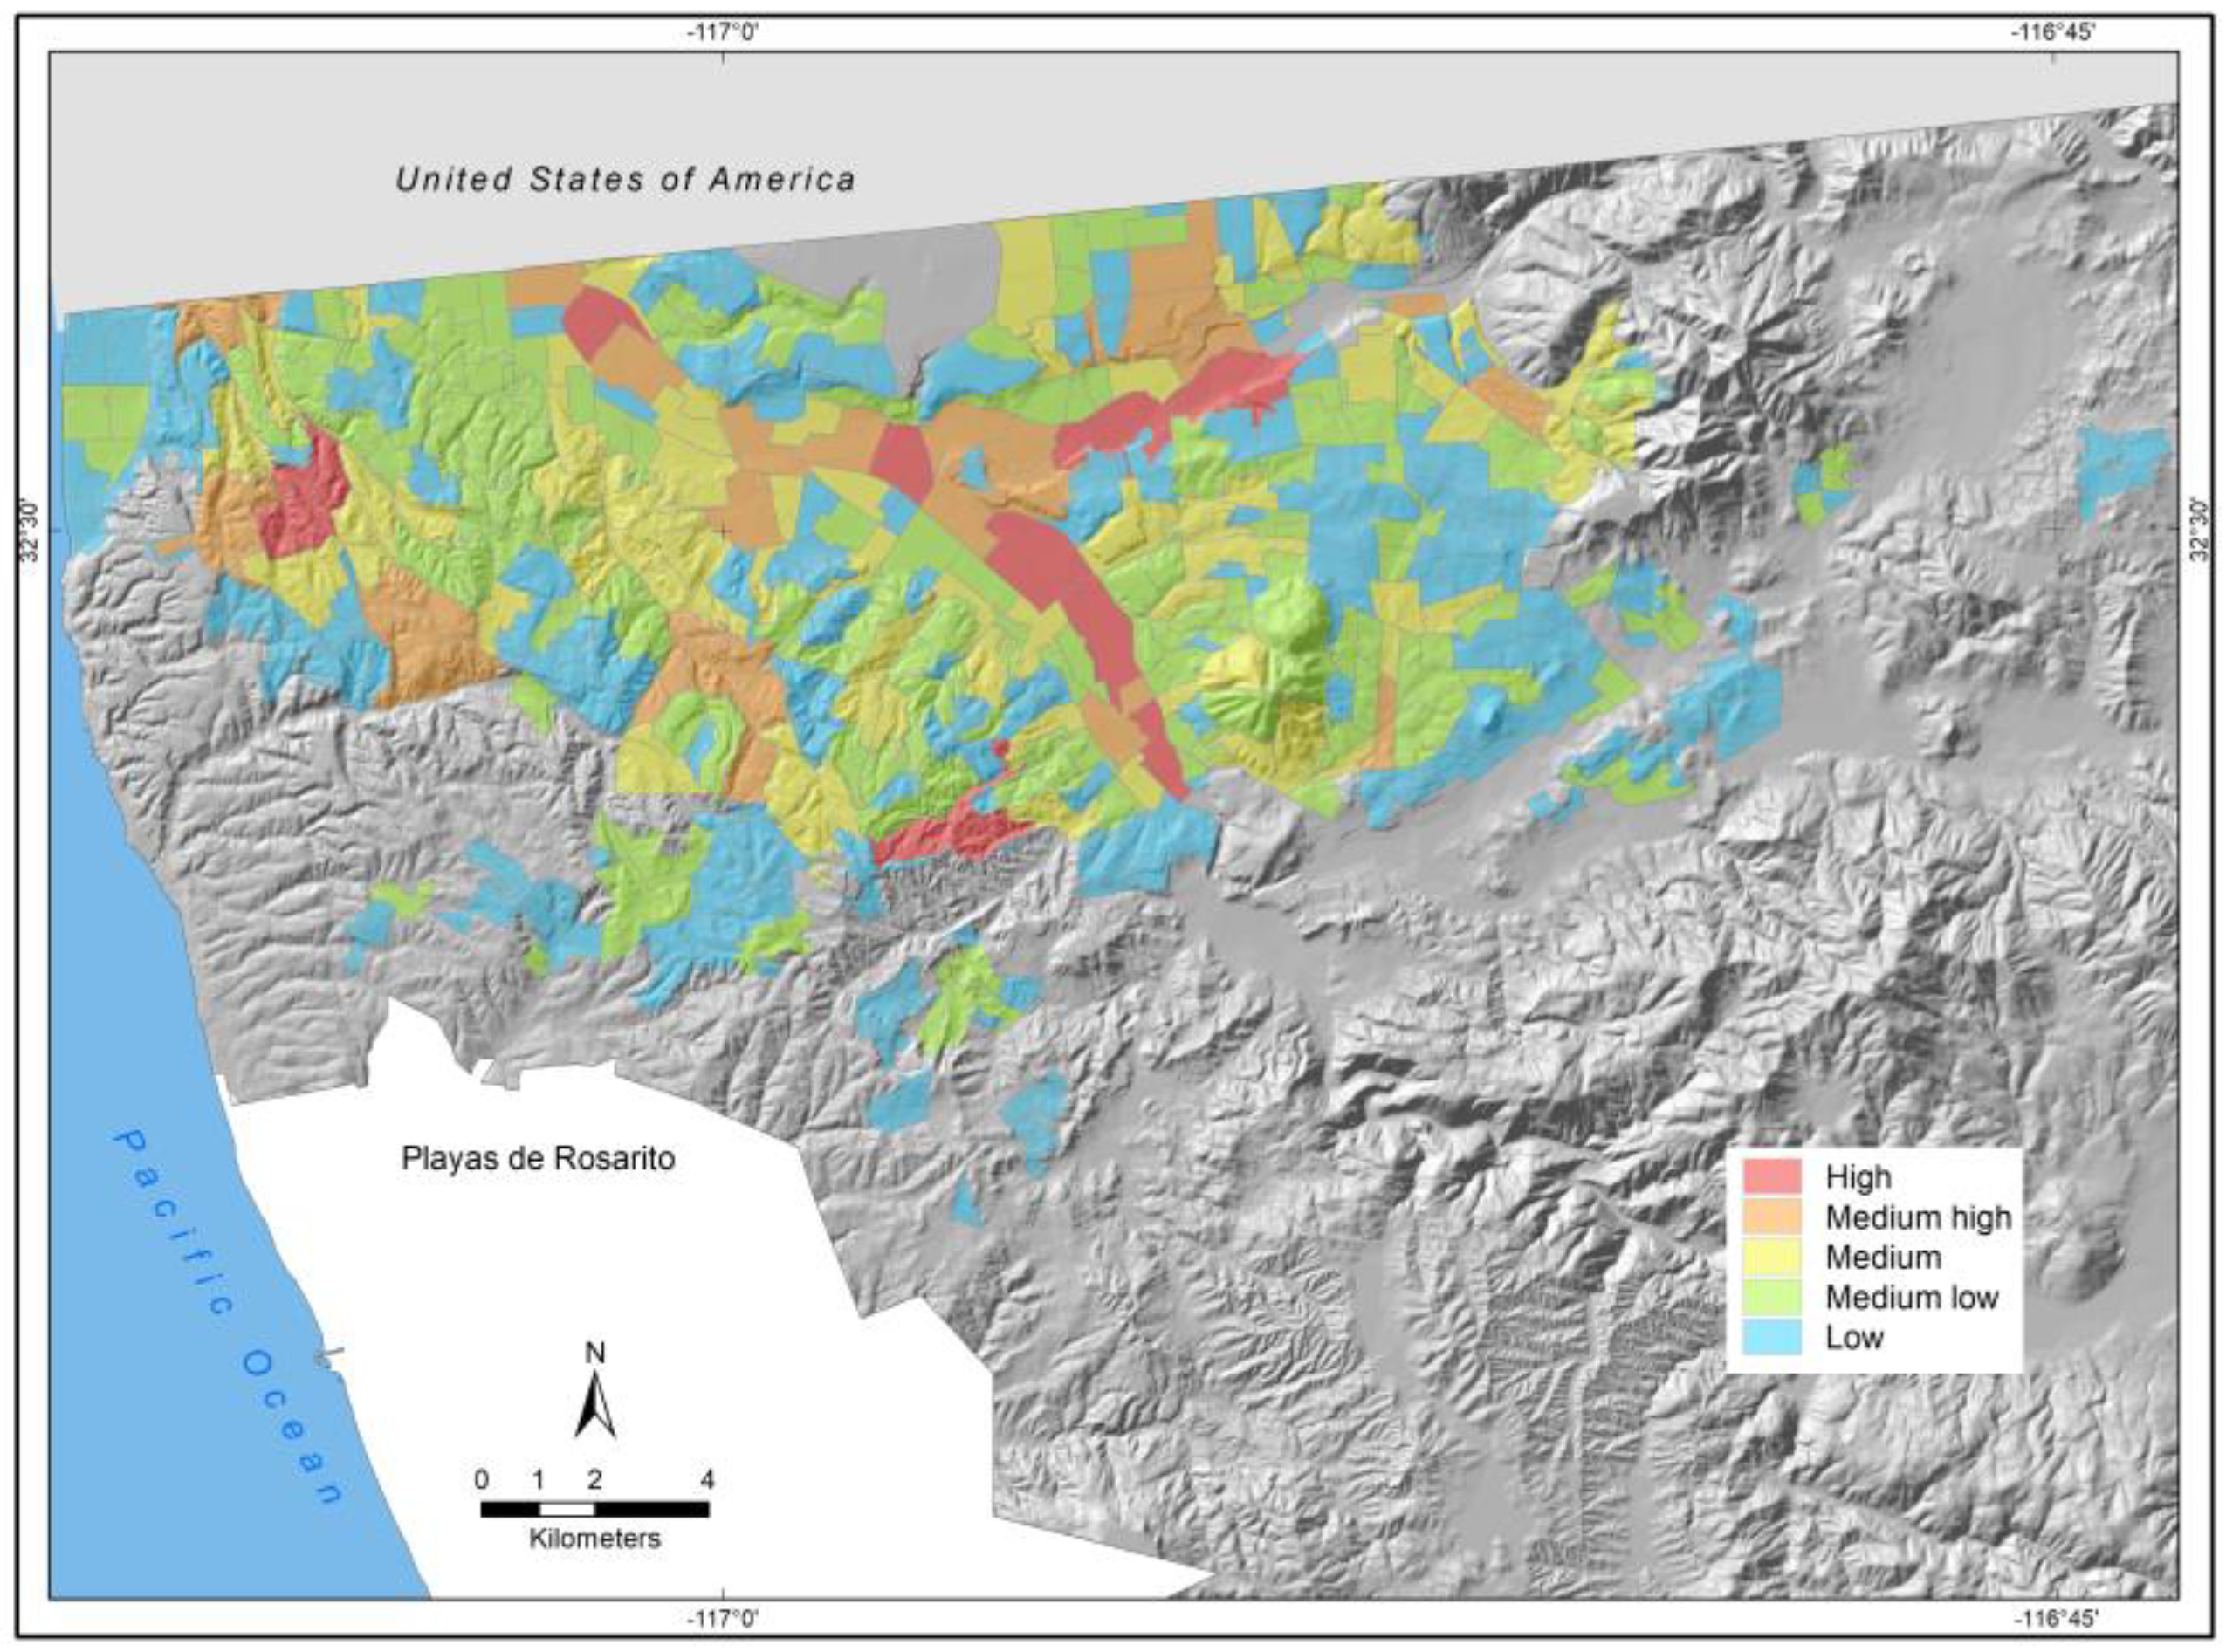
Figure 7 shows the exposure index to flooding in Tijuana. Results are classified into five levels: high vulnerability (5) in red, medium high vulnerability (4) in orange, medium vulnerability (3) in yellow, medium low vulnerability (2) in green, and low vulnerability (1) in blue. Areas with high exposure are concentrated in low areas in Tijuana, particularly along the Tijuana River and the Río Alamar where most runoff of watersheds flow. Some areas with high and medium high exposure are in low areas in the west part of Tijuana where flooding problems have been frequent during the last decades. It is worth noting that low areas along the Río Tijuana and the Río Alamar are occupied by middle class groups and affluent communities that are well-urbanized and include diverse land uses (commercial, services, residential, and local and state offices). Despite the existence of storm drainage system in these areas, they concentrate significant volume of the runoff and they are frequently flooded. Many areas in the west part of the city with high and middle high exposure were created originally by informal settlements and later incorporated into the formal urban areas of the city. Deficiencies in the urbanization of these areas include the lack of a storm drainage system.
3.2. Sensitivity Index to Flooding
The study of sensitivity in the international literature has shown little agreement in the type of variables that characterize it [43]. Following the conceptual framework of vulnerability, we focused on variables illustrating a lack of access to assets. The best available source of information was the 2010 National Census [45]. We used principal components to identify variables explaining a lack of access to assets in the National Census. This analysis resulted in 12 variables covering key social conditions (households without access to urban services, households without access to key appliances, dwelling characteristics, population without access to basic education, population without access to health services, population unemployed, population with less than five years’ residency in the state). It is worth mentioning that income was not included in the 2010 National Census and could not be considered in this analysis.
The sensitivity index was calculated as: , where represents the weight for each component (PC) (the 12 variables): 0.1258 Z1i + 0.1108 Z2i + 0.1346 Z3i + 0.1652 Z4i + 0.1540 Z5i + 0.1582 Z6i + 0.1062 Z7i + 0.3942 Z8i + 0.1288 Z9i + 0.1062 Z10i + 0.1148 Z11i + 0.1815 Z12i. The index was calculated with the PC1 (first component explains the largest possible amount of variation in the original data). The values were normalized using the Zni formula: , where VVA is the variable value for each Census track, X1 is the average of each variable and Sc1 is the standard deviation. The sensitivity index was categorized into five classes by using the natural breaks method. Figure 8 shows the results of the sensibility analysis to flooding.
The figure shows that there is not always a direct relationship between exposure to flooding and sensitivity to flooding. High and medium high sensitivity in the west part of Tijuana are also areas with medium high and high exposure to flooding. However, large areas with high exposure to flooding in the low central part of the city have low or medium low sensitivity. As mentioned above, these are areas occupied by middle-class and affluent communities. Conversely, areas with low or medium-low exposure in the east part of the city are areas with high and medium-high sensitivity.
3.3. Adaptive Capacity Index to Flooding
The international literature considers adaptive capacity as the result of non-climatic components (infrastructure, economic resources, technology, information, capacities, institutional strength, and equity) and endogenous components (family and social networks, and community organizations) [32]. Several authors highlight the importance of endogenous components in adaptive capacity [24,59,60,61], while others stress that there is no single method to assess adaptive capacity and studies apply different factors and indicators to assess it making it difficult to compare it across studies [62]. We tried to include endogenous information in the analysis of adaptive capacity in Tijuana but we found few data available on the role of community organizations. It was particularly difficult to find detailed information describing their activities and their geographical location within the city. To overcome this limitation, we carried out a 1000 household survey in Tijuana seeking to document the extent of family and social networks, activities of community organizations, as well as people’s perception and knowledge of climate related damages and their knowledge of climate change. The results of the survey showed a limited role of community organizations in supporting social capital in the city and weak family and social networks in most of the neighborhoods. Tijuana is a city with high levels of immigration from different parts of Mexico, which explains in part the lack of social cohesion and limited knowledge on local climate-related damages.
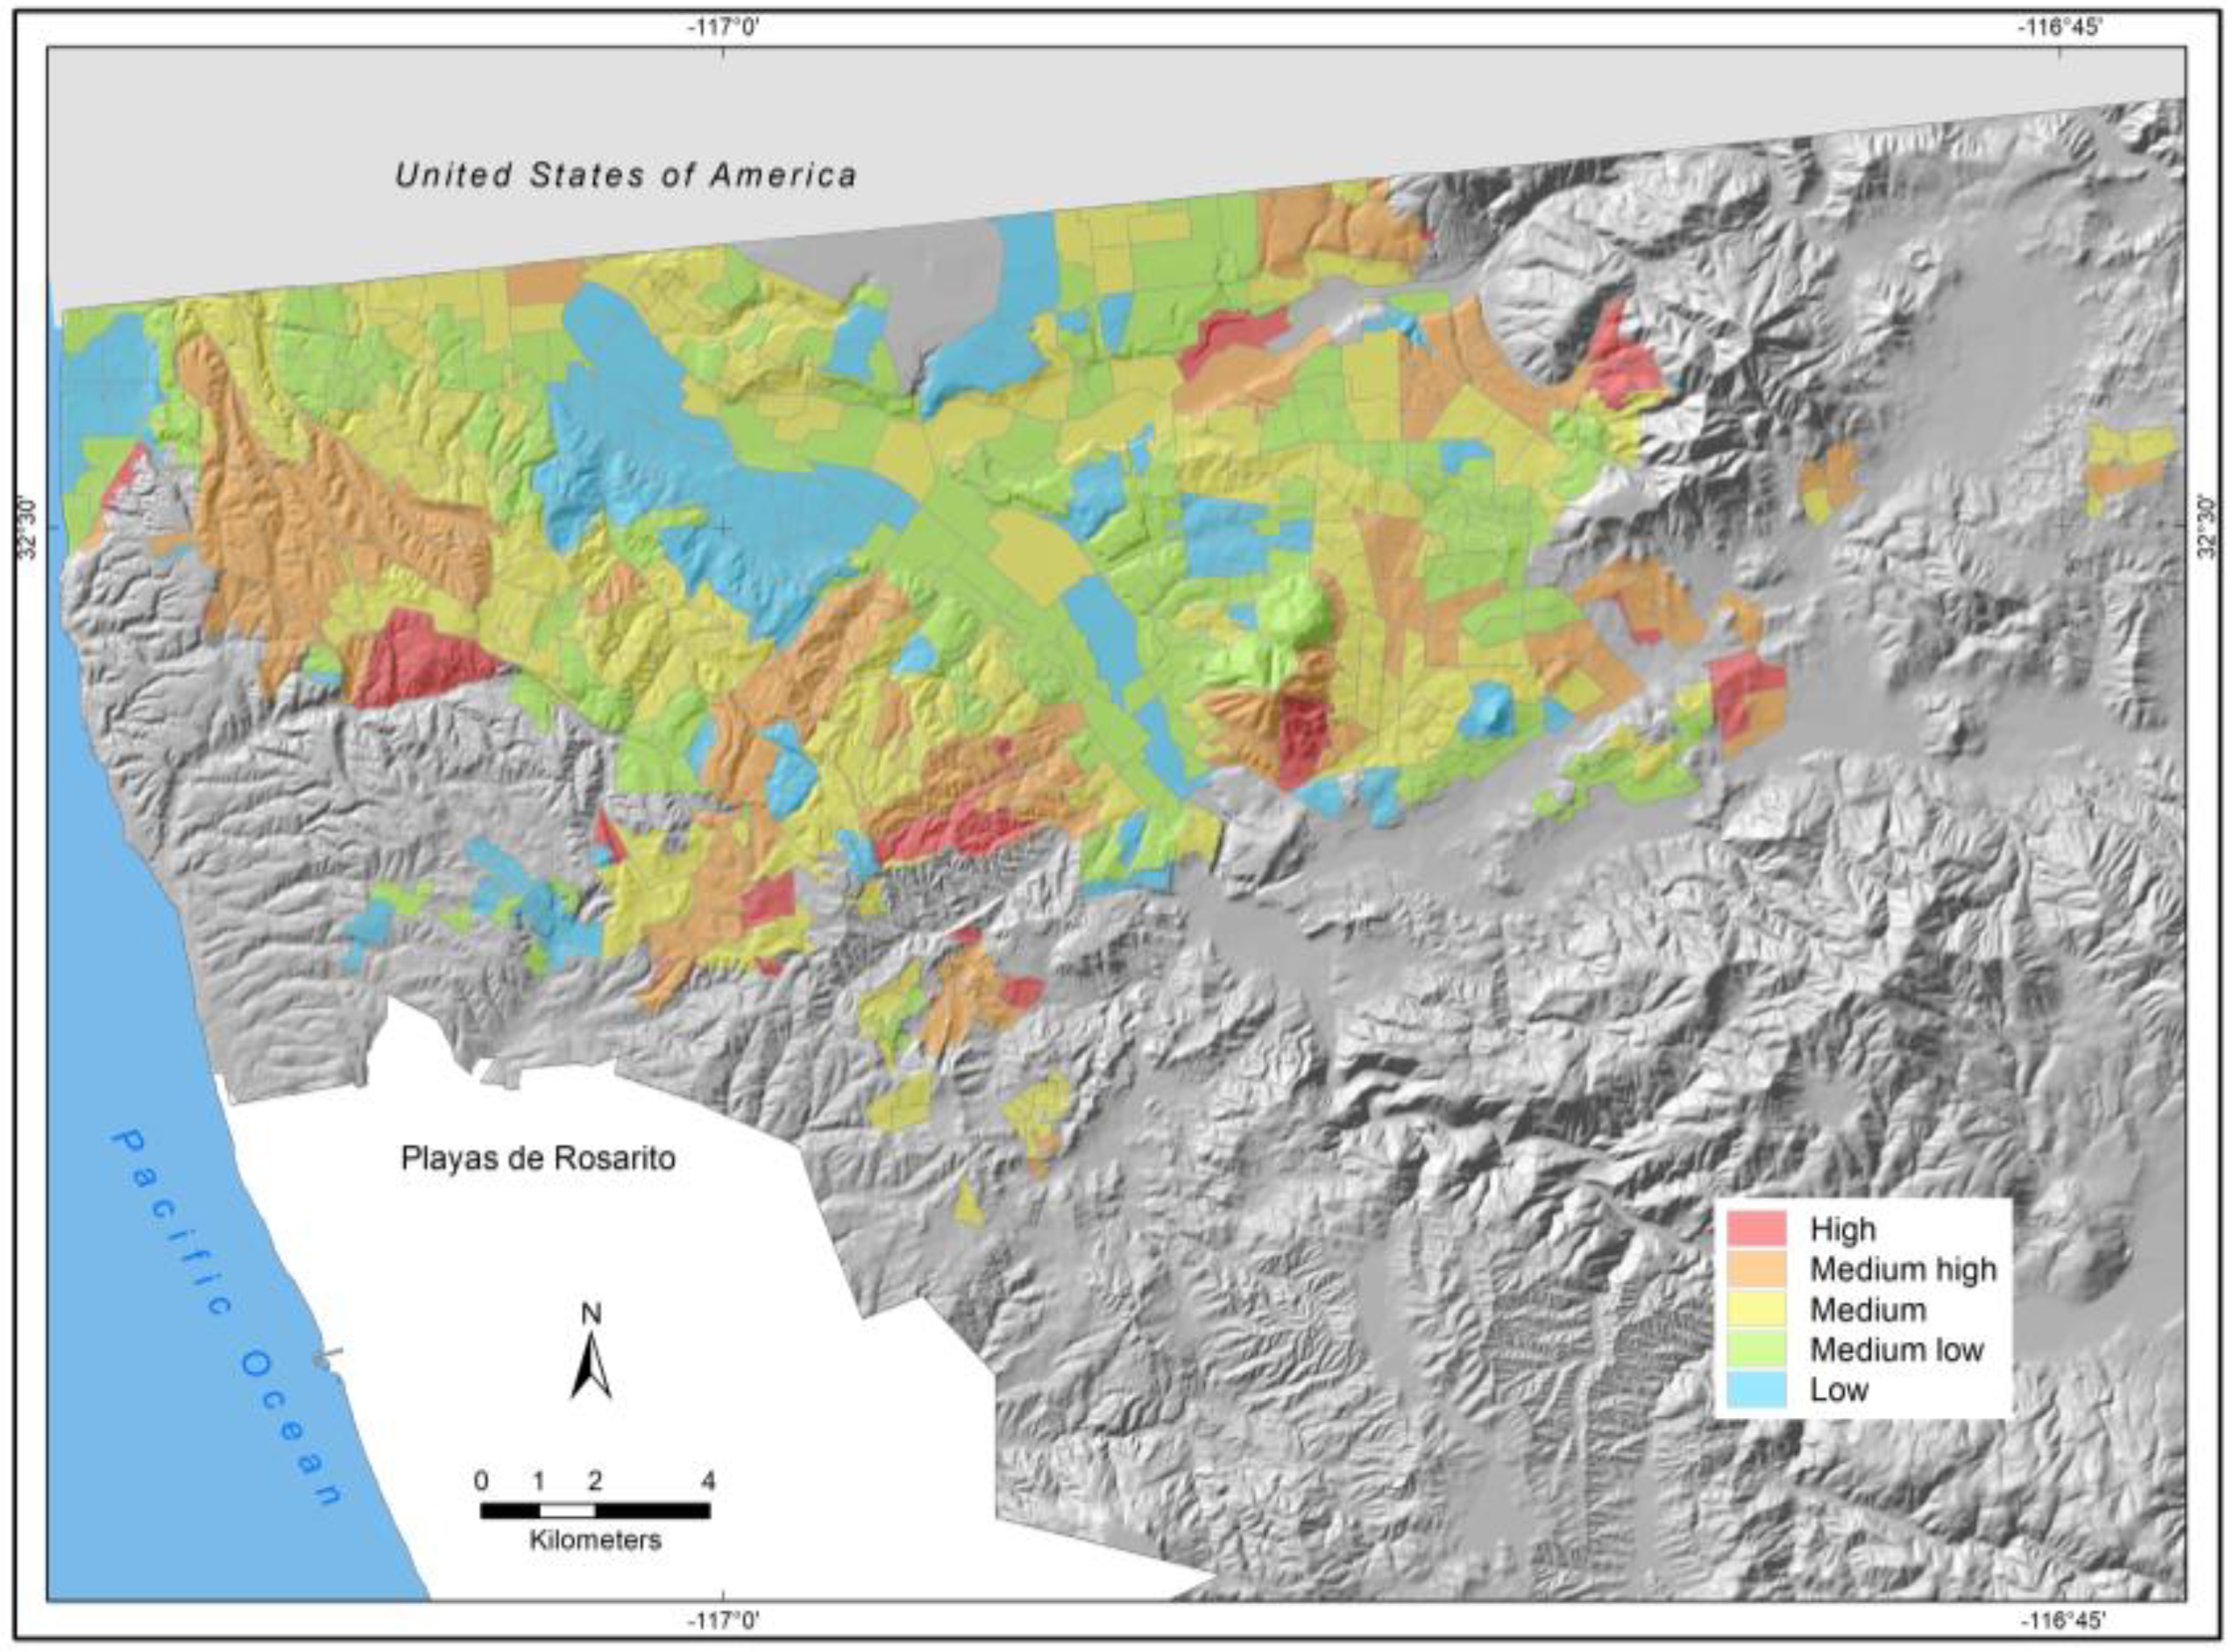
Despite the limited presence of social capital in Tijuana, we analyzed the role of infrastructure (in this case storm drainage system) as part of adaptive capacity to flooding. We measured the profile of open drains to document their draining capacity; unfortunately, there was no information available on the profile of enclosed drains as a result we only considered the length of the drain in each census track. Enclosed drains of the storm drainage system are also used to collect sewage. We assigned them a lower weight than open drains to reflect differences in their capacity to drain runoff. Figure 9 shows the adaptive capacity index in Tijuana. It illustrates high adaptive capacity in areas with a storm drainage system and low areas in the central part of the city. The figure also illustrates deficiencies in the expansion of the storm drainage system in other parts of the city, as illustrated in Figure 4.
3.4. Evidence of Flooding Damages
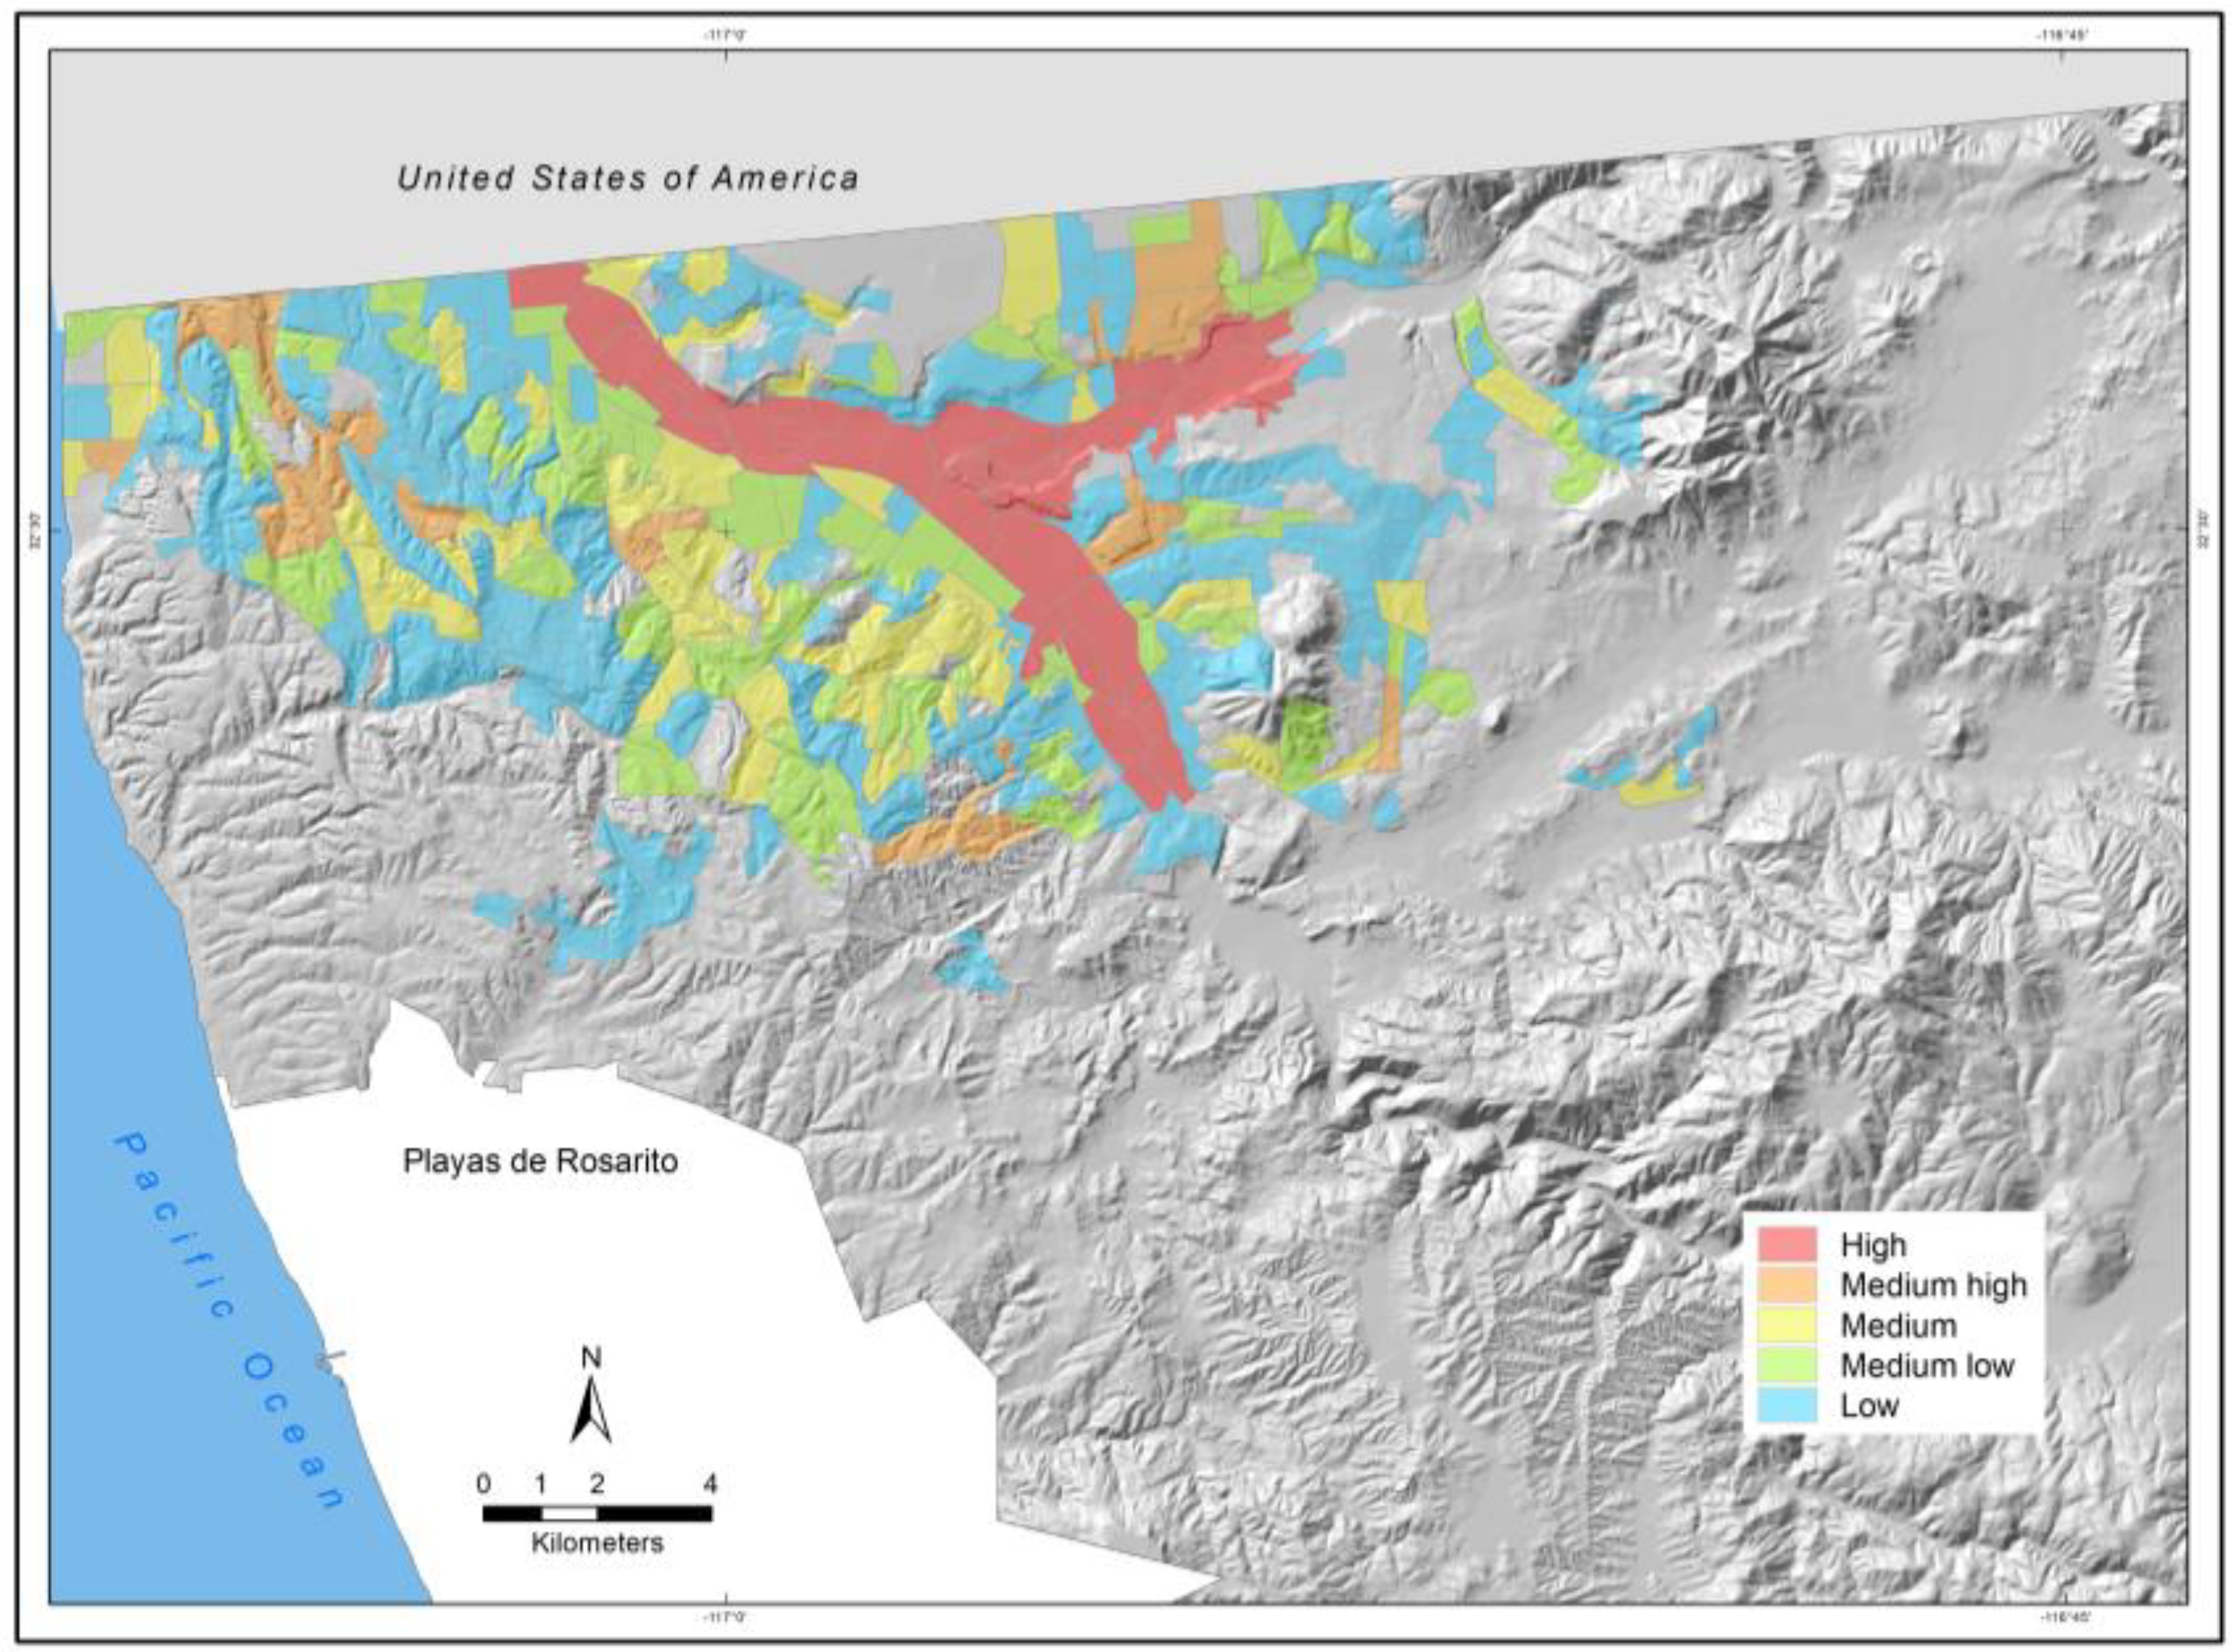
Evidence of damage was calculated based on the 1970–2015 database compiled by the project. The evidence of damage index for flooding is expressed as: , where is total flooding damages in i census track and j the corresponding level of impact; is total population affected in i census track to impact j ; is total homes damaged in the i census track to impact j; is total infrastructure damaged in the i census track to impact j; and is total services disturbances in the i census track to impact j. The aggregation method was weighted as follow: . Figure 10 presents the evidence of damage index of flooding in Tijuana. It is interesting to show evidence of damage in the low central part of the city with high adaptive capacity are paradoxically areas with high and medium high evidence of flooding damage. However, some of these low areas have low and medium-low evidence of damage that reflect a better operation of the storm drainage system in said areas. The Strahler model used to characterize exposure is helpful for explaining the persistence of flooding in areas with high evidence of damages. These are areas concentrating significant volume of runoff from watersheds in the city. Thus, evidence of damage is a helpful dimension to understand the root causes of vulnerability in Tijuana. The discussion above highlights the need to evaluate the capacity of the storm drainage system in different parts of the city. This is particularly important in light of the evidence of damage illustrated in this section and in the discussion above. Urbanization in the upper parts of the watersheds has reduced the time runoff takes to reach low areas of the city, limiting alternative strategies to diminish vulnerability and to adapt to changes in climate. Extreme precipitation events under the climate change and drought scenarios discussed above in Section 2.1 require major actions to reduce vulnerability and produce adaptation.
3.5. Composed Vulnerability Index to Flooding
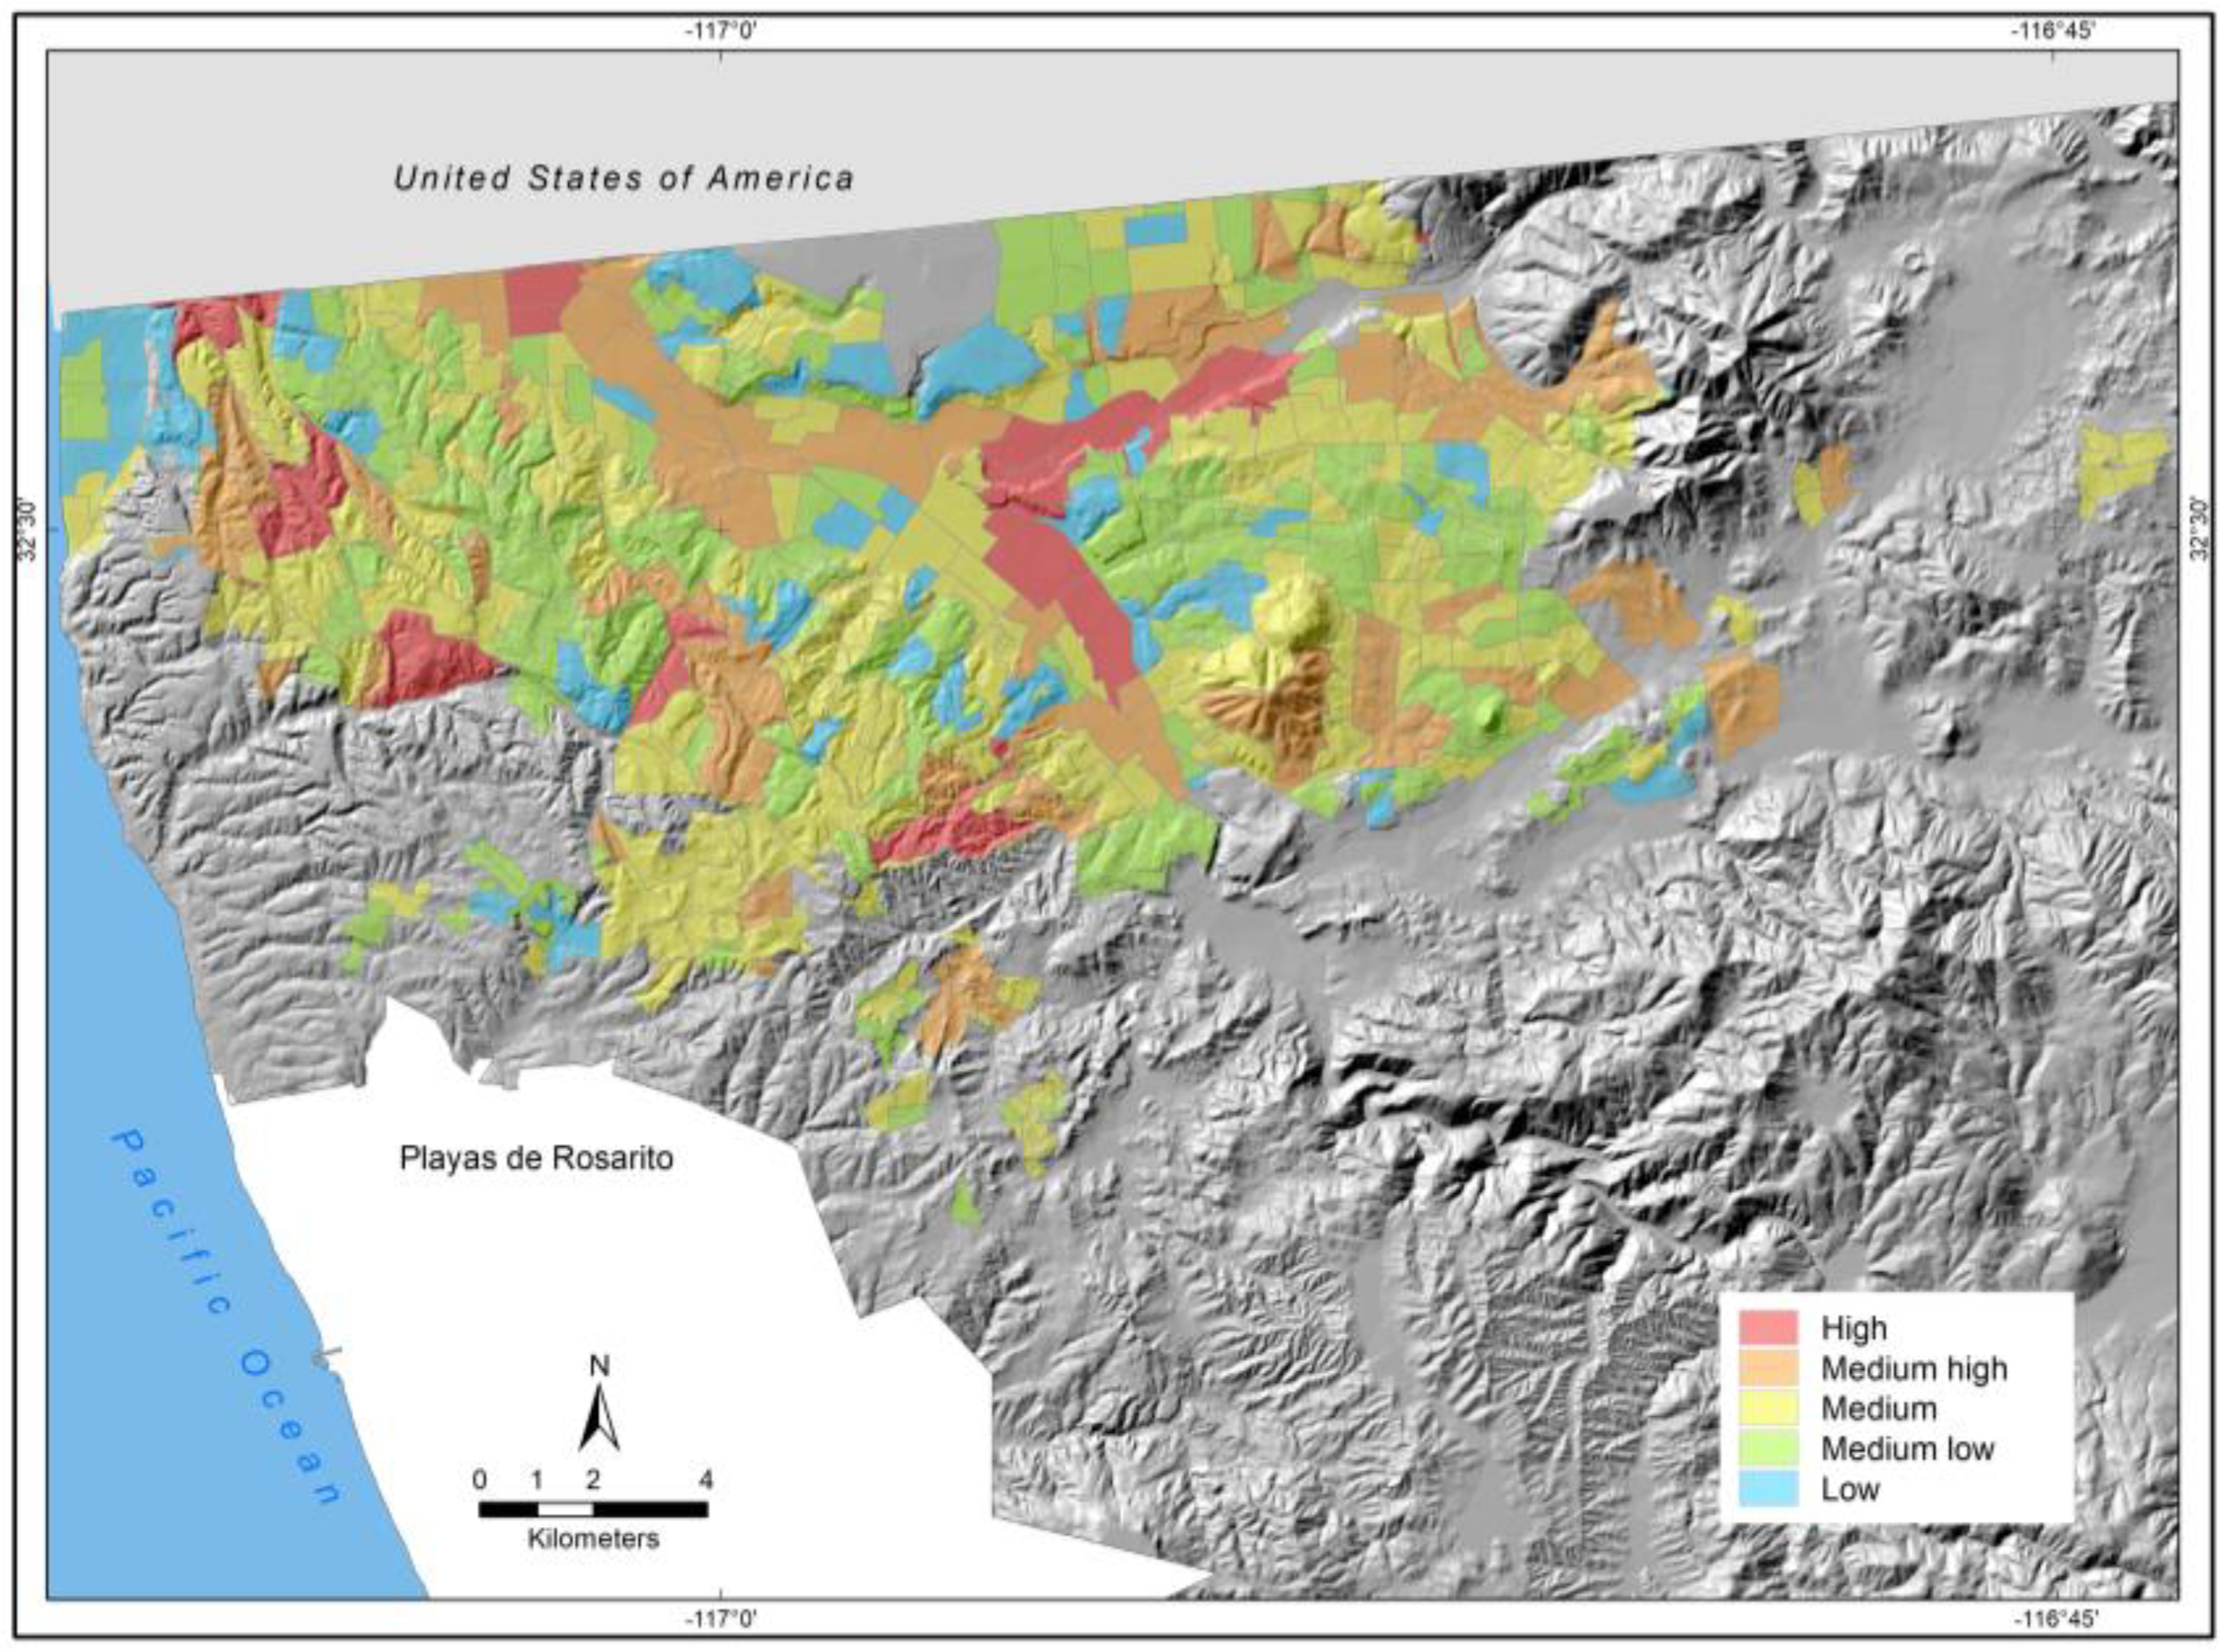
The results of the vulnerability index to flooding are presented below. Results are classified into five levels: high vulnerability (5) in red, medium-high vulnerability (4) in orange, medium vulnerability (3) in yellow, medium-low vulnerability (2) in green, and low vulnerability (1) in blue. Table 3 identifies the population in each range of vulnerability, and the percentage they represent of the total population in Tijuana. It also identifies the urban area in each range of vulnerability and the percentage it represents of the total Tijuana urban area.
Although the number of people as well as urban area with high vulnerability is less than in other ranges of vulnerability, they still represent a significant number of people and a significant surface of the city. In the case of vulnerability to flooding 55,322 people and 20.2 square kilometers fall into this high range (Table 3). As such, addressing high vulnerability should be considered a priority requiring immediate action. Medium-high vulnerability and medium vulnerability represents the majority of the population and urban area in Tijuana and illustrate the combined effect of the characteristics of the landscape, deficiencies in urban planning, chaotic urbanization, and social inequality and poverty in Tijuana mentioned above.
Figure 11 shows the vulnerability index to flooding in Tijuana. Areas of high vulnerability in red are the lower parts in the central part of the city where runoff concentrates along the Alamar River and the Tijuana River. Due to the topography in the area, they also include lower areas in between watersheds where runoff also concentrates. We found a correlation between high vulnerability areas and areas with chronic flooding problems in the historical database of damages. It is also worth noting the areas with medium-high vulnerability in large parts of the city and particularly in the east are correlated with the areas where urban growth has concentrated in recent decades.
The project also explored different scenarios for climate change and future urban growth. We decided to only work with the RCP 4.5 2015–2039 scenario, as we considered uncertainty to be too high in the long-term climate change scenarios. Indeed, it is difficult to work with urban growth scenarios at this level of detail for the 2075–2099 scenarios. We explored using automated cells to create a scenario of future urban growth in Tijuana but were not satisfied with the results. Instead, we identified areas within the city (in these case census tracks) that still have the potential to accommodate further urban and population growth, as well as areas that due to their physical conditions are suitable to accommodate future urban growth. These areas were overlaid on the 2015–2039 climate change scenarios for precipitation and temperature.
Figure 12 presents a 2015–2039 scenario for temperature change showing an increase of high temperatures in the east and southern parts of the city. As mentioned above, Tijuana has mostly grown towards the east in recent decades, and this is also an area where the city retains potential to accommodate future urban growth. However, planning for future urban growth will require a strategy to adapt to higher temperatures during the summer months in said part of the city, especially as Tijuana is located in a semi-arid area and the combined effect of climate change and the heat island effect of urbanization can translate into higher temperatures with significant consequences on public health, the biometric comfort index, and social life and cohesion in these areas. Furthermore, Tijuana also has areas capable of accommodating future urban growth in the west and central part of the city and local authorities should consider strategies to orient future urban growth to these areas. An additional aspect to be considered is the drought scenario for the coming decades mentioned in Section 2.1 [54]. Coping with higher temperatures while also securing water access will bring major challenges for Tijuana. Drought scenarios will represent higher temperatures and less precipitation on average but also more extreme precipitation events likely to aggravate chronic flooding problems in Tijuana.
4. Conclusions
Tijuana exemplifies the negative consequences that come from a combination of deficiencies in urban planning and a complete disregard for climatic conditions during decades of rapid urban expansion and population growth. Despite numerous climate-related damages, local state authorities have given little attention to vulnerability to climate variability and climate change. Vulnerability is not considered at all in urban planning and in strategic decisions orienting future urban growth. The situation in Tijuana is similar to most cities in Mexico and in many other cities in low-income and middle-income countries. International efforts through the United Nations and other international organizations to build climate resilient cities and disaster risk reduction have had limited impact in these cities so far [35,36]. The unavoidable urgent need to adapt to climate change highlights the importance of immediate action to avoid cities being locked into situations that would even further limit alternative strategies and increase the cost of adaptation. An important step forward is creating efficient and useful analytical tools to assess vulnerability to climate variability and climate change to better understand adaptation needs and opportunities. The case of Tijuana shows how low-cost opportunities to reduce local vulnerability to flooding have been lost in recent decades due to a fast urbanization of watersheds and deficiencies in urban planning. As a result, a significant effort has to be made to create alternative strategies to adapt to climate variability and climate change in the short term.
This project sought to create an analytical tool to assess vulnerability and its underlying causes in an effort to better understand the needs and options available for adaptation to climate variability and climate change. We argue this is an essential element for the decision-making orienting formal and informal urban growth in Tijuana. Many other cities in Mexico and in other low-income and middle-income countries face similar challenges. There has been little attention paid to assess their vulnerability to climate-related impacts. Information and knowledge of vulnerability is a useful first step in the long process of creating climate adaptation and resilient pathways within the context of sustainable urban development. We argue the real value of knowledge and information is empowering those making the decisions which orient and guide urban growth on a regular basis, from planners and decision-makers in local governments to inhabitants in informal settlements. The results of this research are expected to be a contribution in this direction. They do not intend to be a blueprint to be reproduced in other cities, but instead can be considered a precedent that could help other cities in the design of their own vulnerability assessment.
Author Contributions
Conceptualization of the text, R.S.R.; Methodology, R.S.R and A.E.M.S.; Validation, R.S.R and A.E.M.S.; Formal analysis and investigation, R.S.R and A.E.M.S.; Resources, R.S.R; Writing-original draft preparation, R.S.R; Writing-review and editing, R.S.R; Visualization, A.E.M.S.; Data curation A.E.M.S.; Supervision and project administration, R.S.R and A.E.M.S.; Funding acquisition, R.S.R. Both authors read and approved the final manuscript.
Funding
“This research was funded by Instituto Nacional de Ecología y Cambio Climático (INECC) grant number [INECC/A1-009/2014]”.
Acknowledgments
We want to thank other members of our research team for their contribution in the development of this project: Francisco Lares, Gloria Muñoz, Joanna Félix, Jonathan Gómez, Yolva Herrera, Ana Magaña, Alberto Casas, Lourdes Romo, Juan Manuel Rodríguez, and Pilar Vargas. We thank also Francisco Lares for his support with figures in this publication.
Conflicts of Interest
We declare the founding sponsors had no role in the design of the study; in the collection, analyses, or interpretation of data; in the writing of the manuscript, and in the decision to publish the results. Opinions expressed in this paper are the sole responsibility of the authors.
References
- Revi, A.; Satterthwaite, D.E.; Aragón-Durand, F.; Corfee-Morlot, J.; Kiunsi, R.; Pelling, M.; Roberts, D.; Solecki, W. Urban Areas. In Climate Change 2014 Impacts and Adaptation Assessment. Part A: Global and Sectoral Aspects Contribution of Working Group II to Fifth Assessment Report Intergovernmental Panel on Climate Change; IPCC: Geneva, Switzerland, 2014; pp. 535–612. [Google Scholar]
- Martine, G.; McGranahan, G.; Montgomery, M.; Fernandez-Castilla, R. Introduction. In The New Global Frontier; Routledge: London, UK, 2008; ISBN 9781849773157. [Google Scholar]
- UN-HABITAT/Routledge. Prosperity of Cities: State of the World’s Cities 2012/2013; UN-HABITAT/Routledge: London, UK, 2012. [Google Scholar]
- Seto, K.C.; Sanchez-Rodriguez, R.; Fragkias, M. The New Geography of Contemporary Urbanization and the Environment. Annu. Rev. Environ. Resour. 2010, 35, 167–194. [Google Scholar] [CrossRef]
- Carter, J.G.; Cavan, G.; Connelly, A.; Guy, S.; Handley, J.; Kazmierczak, A. Climate change and the city: Building capacity for urban adaptation. Prog. Plan. 2015, 95, 1–66. [Google Scholar] [CrossRef] [Green Version]
- Hunt, A.; Watkiss, P. Climate change impacts and adaptation in cities: A review of the literature. Clim. Chang. 2011, 104, 13–49. [Google Scholar] [CrossRef] [Green Version]
- Araos, M.; Berrang-Ford, L.; Ford, J.D.; Austin, S.E.; Biesbroek, R.; Lesnikowski, A. Climate change adaptation planning in large cities: A systematic global assessment. Environ. Sci. Policy 2016, 66, 375–382. [Google Scholar] [CrossRef]
- Coffee, J.E.; Parzen, J.; Wagstaff, M.; Lewis, R.S. Preparing for a changing climate: The Chicago climate action plan’s adaptation strategy. J. Great Lakes Res. 2010, 36, 115–117. [Google Scholar] [CrossRef]
- Bierbaum, R.; Smith, J.B.; Lee, A.; Blair, M.; Carter, L.; Chapin, F.S.; Fleming, P.; Ruffo, S.; Stults, M.; McNeeley, S.; et al. A comprehensive review of climate adaptation in the United States: More than before, but less than needed. Mitig. Adapt. Strateg. Glob. Chang. 2013, 18, 361–406. [Google Scholar] [CrossRef]
- Carmin, J.; Anguelovski, I.; Roberts, D. Urban Climate Adaptation in the Global South. J. Plan. Educ. Res. 2012, 32, 18–32. [Google Scholar] [CrossRef]
- Sanchez-Rodriguez, R. Adaptation to climate change in rapidly growing cities. In Routledge Handbook of Urbanization and Global Environmental Change; Seto, K.C.-Y., Solecki, W., Griffith, C., Eds.; Routledge: London, UK, 2016; ISBN 978-0-415-73226-0. [Google Scholar]
- Brugmann, J. Financing the resilient city. Environ. Urban. 2012, 24, 215–232. [Google Scholar] [CrossRef] [Green Version]
- Stern, N.H. The Economics of Climate Change: The Stern Review; Cambridge University Press: Cambridge, UK, 2007; ISBN 0521700809. [Google Scholar]
- Mozumder, P.; Flugman, E.; Randhir, T. Adaptation behavior in the face of global climate change: Survey responses from experts and decision makers serving the Florida Keys. Ocean Coast. Manag. 2011, 54, 37–44. [Google Scholar] [CrossRef]
- Solecki, W.; Leichenko, R.; O’Brien, K. Climate change adaptation strategies and disaster risk reduction in cities: Connections, contentions, and synergies. Curr. Opin. Environ. Sustain. 2011, 3, 135–141. [Google Scholar] [CrossRef]
- Larsen, S.V.; Kørnøv, L.; Wejs, A. Mind the gap in SEA: An institutional perspective on why assessment of synergies amongst climate change mitigation, adaptation and other policy areas are missing. Environ. Impact Assess. Rev. 2012, 33, 32–40. [Google Scholar] [CrossRef] [Green Version]
- Roberts, D. Prioritizing climate change adaptation and local level resilience in Durban, South Africa. Environ. Urban. 2010, 22, 397–413. [Google Scholar] [CrossRef] [Green Version]
- Sanchez-Rodriguez, R. Learning to adapt to climate change in urban areas. A review of recent contributions. Curr. Opin. Environ. Sustain. 2009, 1, 201–206. [Google Scholar] [CrossRef]
- Satterthwaite, D.; Huq, S.; Pelling, M.; Reid, H.; Romero-Lankao, P. Adapting to Climate Change in Urban Areas: The Possibilities and Constraints in Low- and Middle-Income Nations; International Institute for Environment and Development: London, UK, 2007; ISBN 9781843696698. [Google Scholar]
- Sanchez-Rodriguez, R. El cambio climático y las áreas urbanas de América Latina: A manera de introducción. In Respuestas Urbanas al Cambio Climático en América Latina; Sánchez-Rodríguez, R.A., Ed.; Comisión Económica para América Latina y el Caribe (CEPAL): Santiago de Chile, Chile, 2013; pp. 9–24. [Google Scholar]
- Hull, A. Spatial planning: The development plan as a vehicle to unlock development potential? Cities 1998, 15, 327–335. [Google Scholar] [CrossRef]
- Watson, V. ‘The planned city sweeps the poor away…’: Urban planning and 21st century urbanisation. Prog. Plan. 2009, 72, 151–193. [Google Scholar] [CrossRef]
- Wilbanks, T.J.; Romero Lankao, P.; Bao, M.; Berkhout, F.G.H.; Cairncross, S.; Ceron, J.P.; Kapshe, M.; Muir-Wood, R.; Zapata-Marti, R.; Perry, M.L.; et al. Industry, settlement and society. In Climate Change 2007: Impacts, Adaptation and Vulnerability, Contribution of Working Group II to the Fourth Assessment Report of the Intergovernmental Panel on Climate Change; Perry, M.L., Canziana, O.F., Palutikof, J.P., van der Linden, J.P., Hanson, C.E., Eds.; Cambridge University Press: Cambridge, UK, 2007; pp. 357–390. [Google Scholar]
- Adger, N. Vulnerability. Glob. Environ. Chang. 2006, 16, 268–281. [Google Scholar] [CrossRef]
- Ribot, J. Cause and response: Vulnerability and climate in the Anthropocene. J. Peasant Stud. 2014, 41, 667–705. [Google Scholar] [CrossRef]
- Dovers, S. Normalizing adaptation. Glob. Environ. Chang. 2009, 19, 4–6. [Google Scholar] [CrossRef]
- Burton, I. Vulnerability and adaptive response in the context of climate and climate change. Clim. Chang. 1997, 36, 185–196. [Google Scholar] [CrossRef]
- Beg, N.; Morlot, J.C.; Davidson, O.; Afrane-Okesse, Y.; Tyani, L.; Denton, F.; Sokona, Y.; Thomas, J.P.; Rovere, E.L.; Parikh, J.K.; et al. Linkages between climate change and sustainable development. Clim. Policy 2002, 2, 129–144. [Google Scholar] [CrossRef]
- Schipper, E. Conceptual History of Adaptation in the UNFCCC Process. Rev. Eur. Community Int. Environ. Law 2006, 15, 82–92. [Google Scholar] [CrossRef]
- Smit, B.; Wandel, J. Adaptation, adaptive capacity and vulnerability. Glob. Environ. Chang. 2006, 16, 282–292. [Google Scholar] [CrossRef]
- Füssel, H. Adaptation planning for climate change: Concepts, assessment approaches, and key lessons. Sustain. Sci. 2007, 2, 265–275. [Google Scholar] [CrossRef]
- Füssel, H.; Klein, R. Climate Change Vulnerability Assessments: An Evolution of Conceptual Thinking. Clim. Chang. 2006, 75, 301–329. [Google Scholar] [CrossRef]
- Hinkel, J. “Indicators of vulnerability and adaptive capacity”: Towards a clarification of the science-policy interface. Glob. Environ. Chang. 2011, 21, 198–208. [Google Scholar] [CrossRef]
- Tonmoy, F.N.; El zein, A.; Hinkel, J. Assessment of Vulnerability to Climate Change Using Indicators: A Meta-Analysis of the Literature. WIREs Clim. Chang. 2014, 5, 775–792. [Google Scholar] [CrossRef]
- UNDP. 2010 Annual Report. Bureau for Crisis Prevention and Recovery United Nations Development Programme; UNDP: New York, NY, USA, 2010. [Google Scholar]
- UNISDR. How to Make Cities More Resilient a Handbook for Local Government Leaders. A Contribution to the Global Campaign 2010–2015; UNISDR: Geneva, Switzerland, 2012. [Google Scholar]
- WORLD BANK. Guide to Climate Change Adaptation in Cities: Executive Summary; The International Bank for Reconstruction and Development/The World Bank: Washington, DC, USA, 2011. [Google Scholar]
- IPCC. Climate Change 2007 Synthesis Report; IPCC: Geneva, Switzeland, 2007. [Google Scholar]
- Gallopín, G.C. Linkages between vulnerability, resilience, and adaptive capacity. Glob. Environ. Chang. 2006, 16, 293–303. [Google Scholar] [CrossRef]
- Ionescu, C.; Klein, R.J.T.; Hinkel, J.; Kavi Kumar, K.S.; Klein, R. Towards a Formal Framework of Vulnerability to Climate Change; NeWater Working Paper 2 and FAVAIA Working Paper 1; Potsdam Institute for Climate Impact Research: Potsdam, Germany, 2005. [Google Scholar]
- Preston, B.L.; Yuen, E.J.; Westaway, R.M. Putting vulnerability to climate change on the map: A review of approaches, benefits, and risks. Sustain. Sci. 2011, 6, 177–202. [Google Scholar] [CrossRef]
- Ford, J.D.; Keskitalo, E.C.H.; Smith, T.; Pearce, T.; Berrang-Ford, L.; Duerden, F.; Smit, B. Case study and analogue methodologies in climate change vulnerability research. Wiley Interdiscip. Rev. Clim. Chang. 2010, 1, 374–392. [Google Scholar] [CrossRef]
- Nguyen, T.; Bonetti, J.; Rogers, K.; Woodroffe, C. Indicator-based assessment of climate-change impacts on coasts: A review of concepts, methodological approaches and vulnerability indices. Ocean Coast. Manag. 2016, 123, 18–43. [Google Scholar] [CrossRef] [Green Version]
- Adaptación y Mitigación Urbana del Cambio Climático en México. Available online: https://agua.org.mx/biblioteca/adaptacion-y-mitigacion-urbana-del-cambio-climatico-en-mexico/ (accessed on 25 June 2018).
- INEGI. Censo de Población y Vivienda 2010. Censos y Conteos; INEGI: Aguascalientes, Mexico, 2011. [Google Scholar]
- Beall, J. Globalization and social exclusion in cities: Framing the debate with lessons from Africa and Asia. Environ. Urban. 2002, 14, 41–51. [Google Scholar] [CrossRef]
- Pírez, P. Buenos Aires: Fragmentation and Privatization of the Metropolitan City. Environ. Urban. 2002, 14, 5876. [Google Scholar] [CrossRef]
- Alegría, T.; Ordóñez, G. Legalizando la Ciudad: Asentamientos Informales y Procesos de Regularización en Tijuana; El Colegio de la Frontera Norte: Tijuana, Mexico, 2005; ISBN 9687947365. [Google Scholar]
- Bocco, G.; Sanchez-Rodriguez, R.; Riemann, H. Evaluación del impacto de las inundaciones en Tijuana (enero de 1993). Uso integrado de percepción remota y sistemas de información geográfica. Rev. Front. Norte 1993, 5, 53–83. [Google Scholar]
- Cavazos, T.; Rivas, D. Variability of extreme precipitation events in Tijuana. Clim. Res. 2004, 25, 229–242. [Google Scholar] [CrossRef]
- Bringas-Rábago, N.; Sanchez-Rodriguez, R. Social vulnerability and disaster risk in Tijuana. Preliminary findings. In Equity and Sustainable Development. Reflections from the U.S.-Mexico Border; Center for U.S.-Mexican Studies, UCSD: La Jolla, CA, USA, 2006; pp. 149–174. ISBN 1-878367-55-2. [Google Scholar]
- Cavazos, T.; Salinas, J.; Martínez, B.; Colorado, G.; de Grau, P.; Prieto, R.; Conde, A.; Quintanar, A.; Santana, J.; Romero, R.; et al. Actualización de Escenarios de Cambio Climático Para México Como Parte de Los Productos de la Quinta Comunicación Nacional; INECC: Ciudad de México, Mexico, 2013. [Google Scholar]
- Cavazos, T.; Arriaga-Ramírez, S. Downscaled climate change scenarios for Baja California and the North American monsoon during the twenty-first century. J. Clim. 2012, 25, 5904–5915. [Google Scholar] [CrossRef]
- Diffenbaugh, N.S.; Swain, D.L.; Touma, D. Anthropogenic warming has increased drought risk in California. Proc. Natl. Acad. Sci. USA 2015, 112, 3931–3936. [Google Scholar] [CrossRef] [PubMed] [Green Version]
- INECC. Desarrollo de Estrategias de Adaptación al Cambio Climático en Municipios Vulnerables del Noroeste de México; INECC: Ciudad de México, Mexico, 2015. [Google Scholar]
- Sistemas de Alerta Hidrometeorolóca en Acapulco, Tijuana, Motozintla, Tapachula y Monterrey. Available online: http://cidbimena.desastres.hn/pdf/spa/doc15773/doc15773.htm (accessed on 25 June 2018).
- SMN Datos Climáticos Diarios del CLICOM del SMN a Través de su Plataforma Web del CICESE. Available online: clicom-mex.cicese.mx (accessed on 18 January 2017).
- Strahler, A.N. Quantitative analysis of watershed geomorphology. Trans. Am. Geophys. Union 1957, 38, 913. [Google Scholar] [CrossRef]
- Pelling, M.; High, C.; Dearing, J.; Smith, D. Shadow Spaces for Social Learning: A Relational Understanding of Adaptive Capacity to Climate Change within Organisations. Environ. Plan. A 2008, 40, 867–884. [Google Scholar] [CrossRef]
- Eakin, H.C.; Lemos, M.C.; Nelson, D.R. Differentiating capacities as a means to sustainable climate change adaptation. Glob. Environ. Chang. 2014, 27, 1–8. [Google Scholar] [CrossRef]
- Lemos, M.C.; Agrawal, A.; Eakin, H.C.; Nelson, D.R.; Engle, N.L.; Johns, O. Building Adaptive Capacity to Climate Change in Less Developed Countries. In Climate Science for Serving Society: Research, Modeling and Prediction Priorities; Springer: Dordrecht, The Netherlands, 2013; pp. 437–457. [Google Scholar]
- Mortreux, C.; Barnett, J. Adaptive capacity: Exploring the research frontier. Wiley Interdiscip. Rev. Clim. Chang. 2017, 8, e467. [Google Scholar] [CrossRef]
Figure 1.
Historic urban growth in Tijuana 1972–2013. Source: INECC (2015) [55].
Figure 1.
Historic urban growth in Tijuana 1972–2013. Source: INECC (2015) [55].

Figure 2.
Formal and Informal urban growth in Tijuana. Source: Sánchez Rodríguez.

Figure 3.
Climate-related damages in Tijuana 1970–2015. Source: INECC (2015) [55].
Figure 3.
Climate-related damages in Tijuana 1970–2015. Source: INECC (2015) [55].

Figure 4.
Urban growth and storm drainage system in Tijuana. Source: INECC (2015) [55].
Figure 4.
Urban growth and storm drainage system in Tijuana. Source: INECC (2015) [55].

Figure 5.
Runoff in Tijuana (Strahler model). Source: INECC (2015) [55].
Figure 5.
Runoff in Tijuana (Strahler model). Source: INECC (2015) [55].

Figure 6.
Runoff obstruction by urban growth. Source: INECC (2015) [55].
Figure 6.
Runoff obstruction by urban growth. Source: INECC (2015) [55].

Figure 7.
Exposure index to flooding. Source: INECC (2015) [55].
Figure 7.
Exposure index to flooding. Source: INECC (2015) [55].

Figure 8.
Sensibility index to flooding. Source: INECC (2015) [55].
Figure 8.
Sensibility index to flooding. Source: INECC (2015) [55].

Figure 9.
Adaptive capacity index to flooding. Source: INECC (2015) [55].
Figure 9.
Adaptive capacity index to flooding. Source: INECC (2015) [55].

Figure 10.
Evidence of flooding damages. Source: INECC (2015) [55].
Figure 10.
Evidence of flooding damages. Source: INECC (2015) [55].

Figure 11.
Vulnerability index to flooding in Tijuana. Source: INECC (2015) [55].
Figure 11.
Vulnerability index to flooding in Tijuana. Source: INECC (2015) [55].

Figure 12.
Temperature changes in 2015–2039 RCP 4.5 climate change scenario and areas of potential urban growth. Source: INECC (2015) [55].
Figure 12.
Temperature changes in 2015–2039 RCP 4.5 climate change scenario and areas of potential urban growth. Source: INECC (2015) [55].


Table 1.
Precipitation related damages in Tijuana, 1970–2015. Source: Local newspapers 1970–2015; CLICOM, SMM [57].
Table 1.
Precipitation related damages in Tijuana, 1970–2015. Source: Local newspapers 1970–2015; CLICOM, SMM [57].
| Damages, 1970–2011 | Precipitation (mm) | |||||||
|---|---|---|---|---|---|---|---|---|
| 0.1–10.0 (9 Events) | 10.1–20.0 (17 Events) | 20.1–30.0 (15 Events) | 30.1–40.0 (8 Events) | 40.1–50.0 (4 Events) | 50.1–60.0 (3 Events) | 60.1–70.0 (2 Events) | 80.1–90.0 (3 Events) | |
| Deaths | 1.00 | 18.00 | 48.00 | 16.00 | 5.00 | 2.00 | 2.00 | |
| Evacuated | 64.00 | 823.00 | 579.00 | 11,985.00 | 183.00 | 6.00 | 36.00 | |
| People in shelters | 236.00 | 51.00 | 258.00 | |||||
| Dwellings destroyed | 2.00 | 1.00 | 5.00 | 141.00 | 1.00 | 18.00 | 2.00 | |
| Dwellings with damages | 12.00 | 193.00 | 323.00 | 111.00 | 344.00 | 19.00 | 8.00 | |
| Neighborhoods flooded | 7.00 | 35.00 | 75.00 | 199.00 | 14.00 | 1.00 | 7.00 | 61.00 |
| Neighborhoods with landslides | 4.00 | 13.00 | 31.00 | 42.00 | 4.00 | 5.00 | 4.00 | |
| Neighborhoods with drinking water interruption | 7.00 | 11.00 | 52.00 | |||||
| Neighborhoods with power interruption | 1.00 | 9.00 | 12.00 | 14.00 | 1.00 | |||
Table 2.
Vulnerability index to flooding. Source: INECC (2015) [55].
Table 2.
Vulnerability index to flooding. Source: INECC (2015) [55].
| Component | Variable | Indicator |
|---|---|---|
| Exposition | Exposition index | I: Stralher runoff Order (1–7) |
| L: runoff’s length | ||
| A: Runoff with obstructions (0;1) | ||
| E = I × L × A | ||
| Sensibility | Sensibility index | S: Principal component analysis |
| Adaptive capacity | Adaptive capacity index | Csa: Open drain |
| Cc: Enclosed drain | ||
| Sc: Runoff with no drain | ||
| C = 3×Csa + 2×Cc + 1×Sc | ||
| Damages | Damage index | D: Total damages |
| Vulnerability index | IV = 2/5E + 1/5S − 1/5C + 1/5D | |
Table 3.
Results of the vulnerability index to flooding in Tijuana. Source: INECC (2015) [55].
Table 3.
Results of the vulnerability index to flooding in Tijuana. Source: INECC (2015) [55].
| Class | Range | Total Population | Population (%) | Area (m) | Area (km) | Area (%) |
|---|---|---|---|---|---|---|
| 1 | 0.035016–0.160437 | 185,838 | 12.23 | 26,284,073.18 | 26.28 | 9.81 |
| 2 | 0.160438–0.253298 | 510,540 | 33.60 | 66,310,354.15 | 66.31 | 24.75 |
| 3 | 0.253299–0.365118 | 532,370 | 35.04 | 88,956,381.90 | 88.96 | 33.20 |
| 4 | 0.365119–0.583202 | 234,534 | 15.44 | 56,319,066.05 | 56.32 | 21.02 |
| 5 | 0.583203–1.00 | 55,322 | 3.64 | 20,191,155.14 | 20.19 | 7.54 |
| Missing | 850 | 0.06 | 9,891,638.36 | 9.89 | 3.69 | |
| Total | 1,519,454 | 100.00 | 267,952,668.78 | 268 | 100.00 |
© 2018 by the authors. Licensee MDPI, Basel, Switzerland. This article is an open access article distributed under the terms and conditions of the Creative Commons Attribution (CC BY) license (http://creativecommons.org/licenses/by/4.0/).
Share and Cite
MDPI and ACS Style
Sánchez Rodríguez, R.A.; Morales Santos, A.E. Vulnerability Assessment to Climate Variability and Climate Change in Tijuana, Mexico. Sustainability 2018, 10, 2352. https://doi.org/10.3390/su10072352
AMA Style
Sánchez Rodríguez RA, Morales Santos AE. Vulnerability Assessment to Climate Variability and Climate Change in Tijuana, Mexico. Sustainability. 2018; 10(7):2352. https://doi.org/10.3390/su10072352
Chicago/Turabian StyleSánchez Rodríguez, Roberto Alejandro, and Aarón Eduardo Morales Santos. 2018. "Vulnerability Assessment to Climate Variability and Climate Change in Tijuana, Mexico" Sustainability 10, no. 7: 2352. https://doi.org/10.3390/su10072352
Note that from the first issue of 2016, this journal uses article numbers instead of page numbers. See further details here.