An Empirical Analysis of Green Electricity Adoption Among Residential Consumers in Poland


Department of Operations Research, Faculty of Computer Science and Management, Wroclaw University of Science and Technology, 50-370, Wroclaw, Poland
†
Current address: Wyb. Wyspianskiego 27, 50-370Wroclaw, Poland.
Sustainability 2018, 10(7), 2281; https://doi.org/10.3390/su10072281
Submission received: 27 April 2018
/
Revised: 24 June 2018
/
Accepted: 26 June 2018
/
Published: 2 July 2018
(This article belongs to the Special Issue Social Innovations in the Energy Transition)
Abstract
:This paper investigates the acceptance of green electricity among Polish residential consumers. Our focus was on the socio-economic and environmental attributes of consumers in terms of their willingness to adopt renewable energy sources (RES) and green electricity tariffs. In particular, this study explores the determinants of adoption by examining consumers’ willingness to pay (WTP) for green electricity, willingness to switch to green electricity tariffs, and willingness to install small-scale generators in the household. The hypotheses were tested empirically with data collected by means of a standardized telephone survey of 502 household electricity consumers in Poland. Most Polish people accept and support the development of RES, but they do not know how to contribute to this process. Their WTP increases with income, education, pro-environmental attitudes, and knowledge. They also care about social influence. To increase the adoption rate of RES among residential consumers, stable legal regulations, clear procedures, subsidies, social campaigns, and educational trainings are needed. We believe that the findings from this study may be valuable for those involved in marketing green electricity offers and for politicians responsible for the increase of the share of renewables in the Polish power system.
1. Introduction
In order to meet the challenge of maintaining a clean environment and supporting the sustainable development of modern industries, many governments, local authorities, and regulators have decided to support non-fossil fuels such as wind, hydro, and solar as well as biomass, biofuels, and biogas and to some extent replace conventional energy production based on fossil fuels by the energy generated from these low carbon sources. According to the so-called Winter Package proposed by the European Commission in the late 2016, the share of renewable energy sources (RES) in electricity generation should increase significantly even up to 50% in the European Union by 2030 [1]. The package also encourages national governments to support decentralized production and self consumption of electricity. Hence, a new role of prosumers for electricity consumers has been created. The Winter Package states: Consumers are active and central players on the energy markets of the future. Consumers across the EU will, in the future, have a better choice of supply, access to reliable energy price comparison tools, and the possibility of producing and selling their own electricity [1]. Based on this, perspectives on the further development of RES in the EU seem to be quite optimistic.
The up-to-date literature suggests that a successful diffusion of RES is conditioned by the social acceptance of electricity consumers [2,3,4,5,6,7,8,9]. Wuestenhagen et al. [9] distinguishes three, sometimes interdependent, categories of social acceptance: socio-political acceptance (of technologies and policies, by the public, by key stakeholders, and by policy makers), community acceptance (procedural and distributed justice and trust), and finally market acceptance (of consumers, investors, and intra-firms). This paper focuses on the acceptance of green electricity by residential consumers (as a part of community and market acceptance). Active consumer involvement and hence acceptance of RES can be expressed in various forms: by attitudes (positive thinking about green energy and verbal support of the development of RES) and behaviors (investments in domestic small-scale installations, switching to green electricity tariffs, and so forth). Without any doubt, as Wuestenhagen et al. [9] mentions, domestic micro-generation especially requires active acceptance by homeowners, whereby individual households become part of the electricity supply infrastructure.
Social acceptance on the private and public level is a precondition of the smooth diffusion of renewable energy sources in the market. Moreover, according to one of the most popular models of technology adoption (namely Roger’s model of innovation diffusion) the consumer adoption rate (i.e., the number of consumers who start using a certain product or good during a specific period of time) depends on (a) the relative advantages of a new innovation compared to existing products, (b) compatibility with values, needs, and past experiences, (c) the complexity or simplicity of the innovation, (d) the degree to which an innovation may be experimented with, and (e) observability—the degree to which the results of an innovation are visible to others [10]. In the case of the adoption rates of RES, the potential advantages (both financial and non-financial) of RES, consistency with consumers’ beliefs and needs, the difficulty of adoption (which is also procedural), and finally the social impact play the most important roles [5].
In Poland, residential consumers may support the development of RES mainly by investing in small-scale energy generators, such as photovoltaic (PV), small water or wind turbines, installed in the household or by sending funds as special donations dedicated to RES [5,11,12,13,14]. In other countries, consumers may also decide to utilize green electricity tariffs or programs and thereby support RES by paying more for electricity [3,7,15]. At the moment such an option is not offered to Polish consumers. However, this study also investigates Polish consumers’ interest in green electricity tariffs.
The purpose of this paper is to empirically explore factors influencing the willingness to adopt green electricity among Polish residential consumers. This paper investigates the expectations of Polish consumers of the renewable energy market. Are the consumers interested in the development of RES? Are they ready to pay more for electricity if it is green? Are they interested in green electricity tariffs? What social and economic conditions determine the consumers’ interest and engagement toward RES?
The contribution of this paper is threefold. Firstly, this paper presents the overall examination of perceptions of RES by Polish residential consumers. Secondly, it explores the impact of pro-environmental attitudes, behaviors, and knowledge about RES, as well as social influence, on green electricity adoption. This approach will complement the literature regarding the determinants of successful diffusion of RES among households. Finally, it provides some policy recommendations regarding the strategy needed to increase the level of social acceptance toward and the share of RES in Poland.
The structure of the article is as follows: In Section 2 the literature is reviewed, by discussing the determinants of green electricity adoption. This section also presents some current data about the RES market in Poland. Section 3 describes the research methods and the sample. Next, in Section 4, the findings on factors influencing consumers’ willingness to adopt green electricity are presented. Finally, in Section 5, the results and their implications for practitioners and policy makers are discussed.
2. The Main Determinants of Green Electricity Adoption—Literature Review
2.1. Socio-Economic and Other Determinants of Green Electricity Adoption
The literature review reveals that there is a wide set of variables that may influence the adoption of innovative energy services, to which RES and green electricity programs or tariffs certainly belong (for a review, see the research by Kowalska-Pyzalska [5]). The adoption of these goods is quite difficult, because the electricity itself is an abstract commodity and people do not usually engage much in its conservation unless they are motivated by financial, environmental, or social incentives.
Various models and concepts, based on behavioral economics and social psychology, indicate that, in opinion formation and decision-making processes, not only do environmental attitudes and beliefs play a great role, but so too do environmental values, drivers, and barriers, the perceived difficulty of adoption, social and community influence, government policy and subsidy, or even affection, see previous research [2,4,8,16,17,18,19,20,21,22,23,24,25,26]. Within this paper, green electricity adoption is discussed from two main points of view: as a decision to install a small-scale generator (i.e., adopting prosumer technologies, such as PV and small wind generators) and as a decision to switch to green electricity tariffs or programs (i.e., purchasing green electricity products). Many factors, such as income or pro-environmental attitudes, influence the propensity of consumers to adopt green electricity (either by becoming a prosumer and/or by switching to a green electricity tariff). This is why the main determinants of adoption are discussed together.
Demographics
The impact of income, expenditures on the electricity bill, and household size on consumers’ willingness to install small-scale green energy sources has been investigated in many surveys. While most of the findings provide empirical evidence that willingness increases with consumer income [14,27], the effect of other variables is not as clear. Some authors [14] indicate that willingness to become a prosumer is positively correlated with both electricity cost and household size. The more consumers pay for electricity, and the bigger the size of the household, the higher the declared willingness to adopt tends to be. On the other hand, in the case of green electricity tariffs, there is some empirical evidence that willingness to adopt may actually decrease with increasing electricity bills and household size [2,28,29,30]. A few authors have also found a negative correlation between willingness to pay for green electricity and age [27,31,32] and a positive correlation with education level [27,32]. Finally, the impact of gender on adoption is ambiguous (e.g., in [14], men are more willing to install green energy in their households than women, but Sundt and Rehdanz [33] report that in most studies willingness to pay for green electricity is generally lower for male than for female respondents).
Environmental Attitudes and Behaviors
There is clear evidence that pro-environmental attitudes and beliefs support the decision to adopt green electricity [7,23]. According to Ozaki [7], the belief that green energy is a clean energy source may convince consumers to pay more. Gerpott and Mahmudova [15] indicate that attitudes toward environmental protection issues have the strongest impact on respondents’ willingness to adopt green electricity tariffs. It has been also proven that green activities, such as recycling, conserving energy, utilizing electro-rubbish, and so forth, are positively correlated with a willingness to install a small-scale RES (e.g., becoming a prosumer [14]).
Psychological Factors
Apart from attitudes, other psychological factors—such as individual or collective values—influence the evaluation and adoption of green electricity [18,22,34,35]. In [2,22,36], the authors indicate that self-transcendence values (i.e., interest on the welfare of others rather than oneself well-being) increase WTP and the willingness to accept and adopt to green energy solutions. The same studies show that self-enhancement values (i.e., self-interest and comfort) correlate negatively with WTP.
Social and Community Influence
Social endorsement of green electricity use was identified as one of the most important determinants of willingness to adopt. It has been proven in many studies that social influence has a positive effect on the intention to engage in environmental behaviors, such as installing a green energy source or deciding to participate in green electricity tariffs [7,15,19,37,38,39]. Most people want to adjust their behavior to match their peers because they need social approval. Some studies have shown that people even tend to compete with their peers in terms of energy conservation. That is, the reduction of energy consumption by the neighbors was found to be the strongest motivation to save energy [5,21,38,40]. Finally, social norms (i.e., normative beliefs) have a positive impact on the intention to adopt a certain environmental behavior, as seen in the research by Ozaki or Stern [7,23].
Past Experiences in the Energy Market
Lack of trust in energy suppliers, uncertainty as to whether green energy is really a clean energy source and fear that the electricity delivered to the household has not actually been produced from green energy sources may cause reluctance to adopt [3,41]. In the work of Gerpott and Mahmudova [15], it was shown that switching experiences, especially perceived switching difficulty, may have an effect on the intention to adopt green electricity among consumers with a low electricity consumption level. This segment of consumers, as Gerpott and Mahmudova emphasize, can be encouraged to change to a green electricity tariff if they believe that an energy supplier acts in a socially responsible manner [15].
Difficulty of Adoption
There are many potential barriers to adoption. In the case of adopting prosumer technologies, the cost and expected long return on investments are among the main obstacles [3,41,42]. Consumers also suffer from insufficient information, advice, and knowledge [23,34,39]. The propensity to shift the responsibility of environment protection to other entities, such as local authorities, government, or even neighbors also decreases the likelihood of adoption [3,41]. Sometimes the obstacles on the supply side (e.g., the technical impossibility of installing a green small-scale generator at the household, or a lack of green electricity tariffs in the supplier’s offer) may hinder adoption [43].
Financial Subsidies and Legislation
2.2. Willingness to Adopt Green Electricity
The literature of innovation diffusion, as well as of non-market goods’ evaluation, distinguishes various methods of determining consumers’ willingness to adopt [11,32,45,46]. In the case of green energy markets, as Diaz-Rainey and Tzavara argue [46], the research focuses mainly on either investigating consumers’ willingness to pay (WTP) a premium for green electricity—both in an absolute sense and as a proportion of the population (so-called ’stated willingness to adopt’, or SWA) [27,31,32,47,48]—or on explaining the large differences between SWA and actual adoption of green energy [27,46,47]. The literature also differentiates feasible adoption (usually lower than SWA) from actual adoption, mainly because of some supply side problems and regulatory failures [46].
WTP can be expressed either in relative or absolute terms, as an increase in the amount of an electricity bill or an increase in the price per kWh of electricity supplied [5]. The literature review revealed that WTP estimates depend on differences in the macroeconomic conditions in a given country, the local social customs, environmental awareness, and factors such as sample size, time period, and the methods and questionnaires used in the research [30,32,45]. According to Zoric and Hrovatin [32], studies regarding WTP can be divided into three categories: first, estimating percentage premiums or absolute amounts that a household is willing to pay for generic green electricity [2,27], second utilizing the choice experiment (CE) methods, based on consumer stated preferences to explore the willingness to pay for a specific types of renewables [28], and third applying the contingent valuation methods [8,30,33,45]. There is also a wide research regarding various aspects of social acceptance of renewable energy on private and public level [8,11,22,24,39,43].
The most common findings regarding WTP, SWA, and social acceptance of RES show that WTP and acceptance of RES are positively correlated with income, education, environmental awareness and concern, and positive beliefs and attitudes toward green energy [2,5,32,48]. WTP for green electricity has also been positively associated with state support and energy subsidies [6]. On the other hand, it is negatively correlated with age, values focused on one’s own happiness and comfort, the perceived difficulty of switching an energy supplier, and electricity cost [2,15,22,31,32].
Below, we present some information about the renewable energy market in Poland and the findings from the latest surveys regarding Poles’ preferences and their willingness to adopt green electricity.
2.3. The Renewable Energy Market in Poland
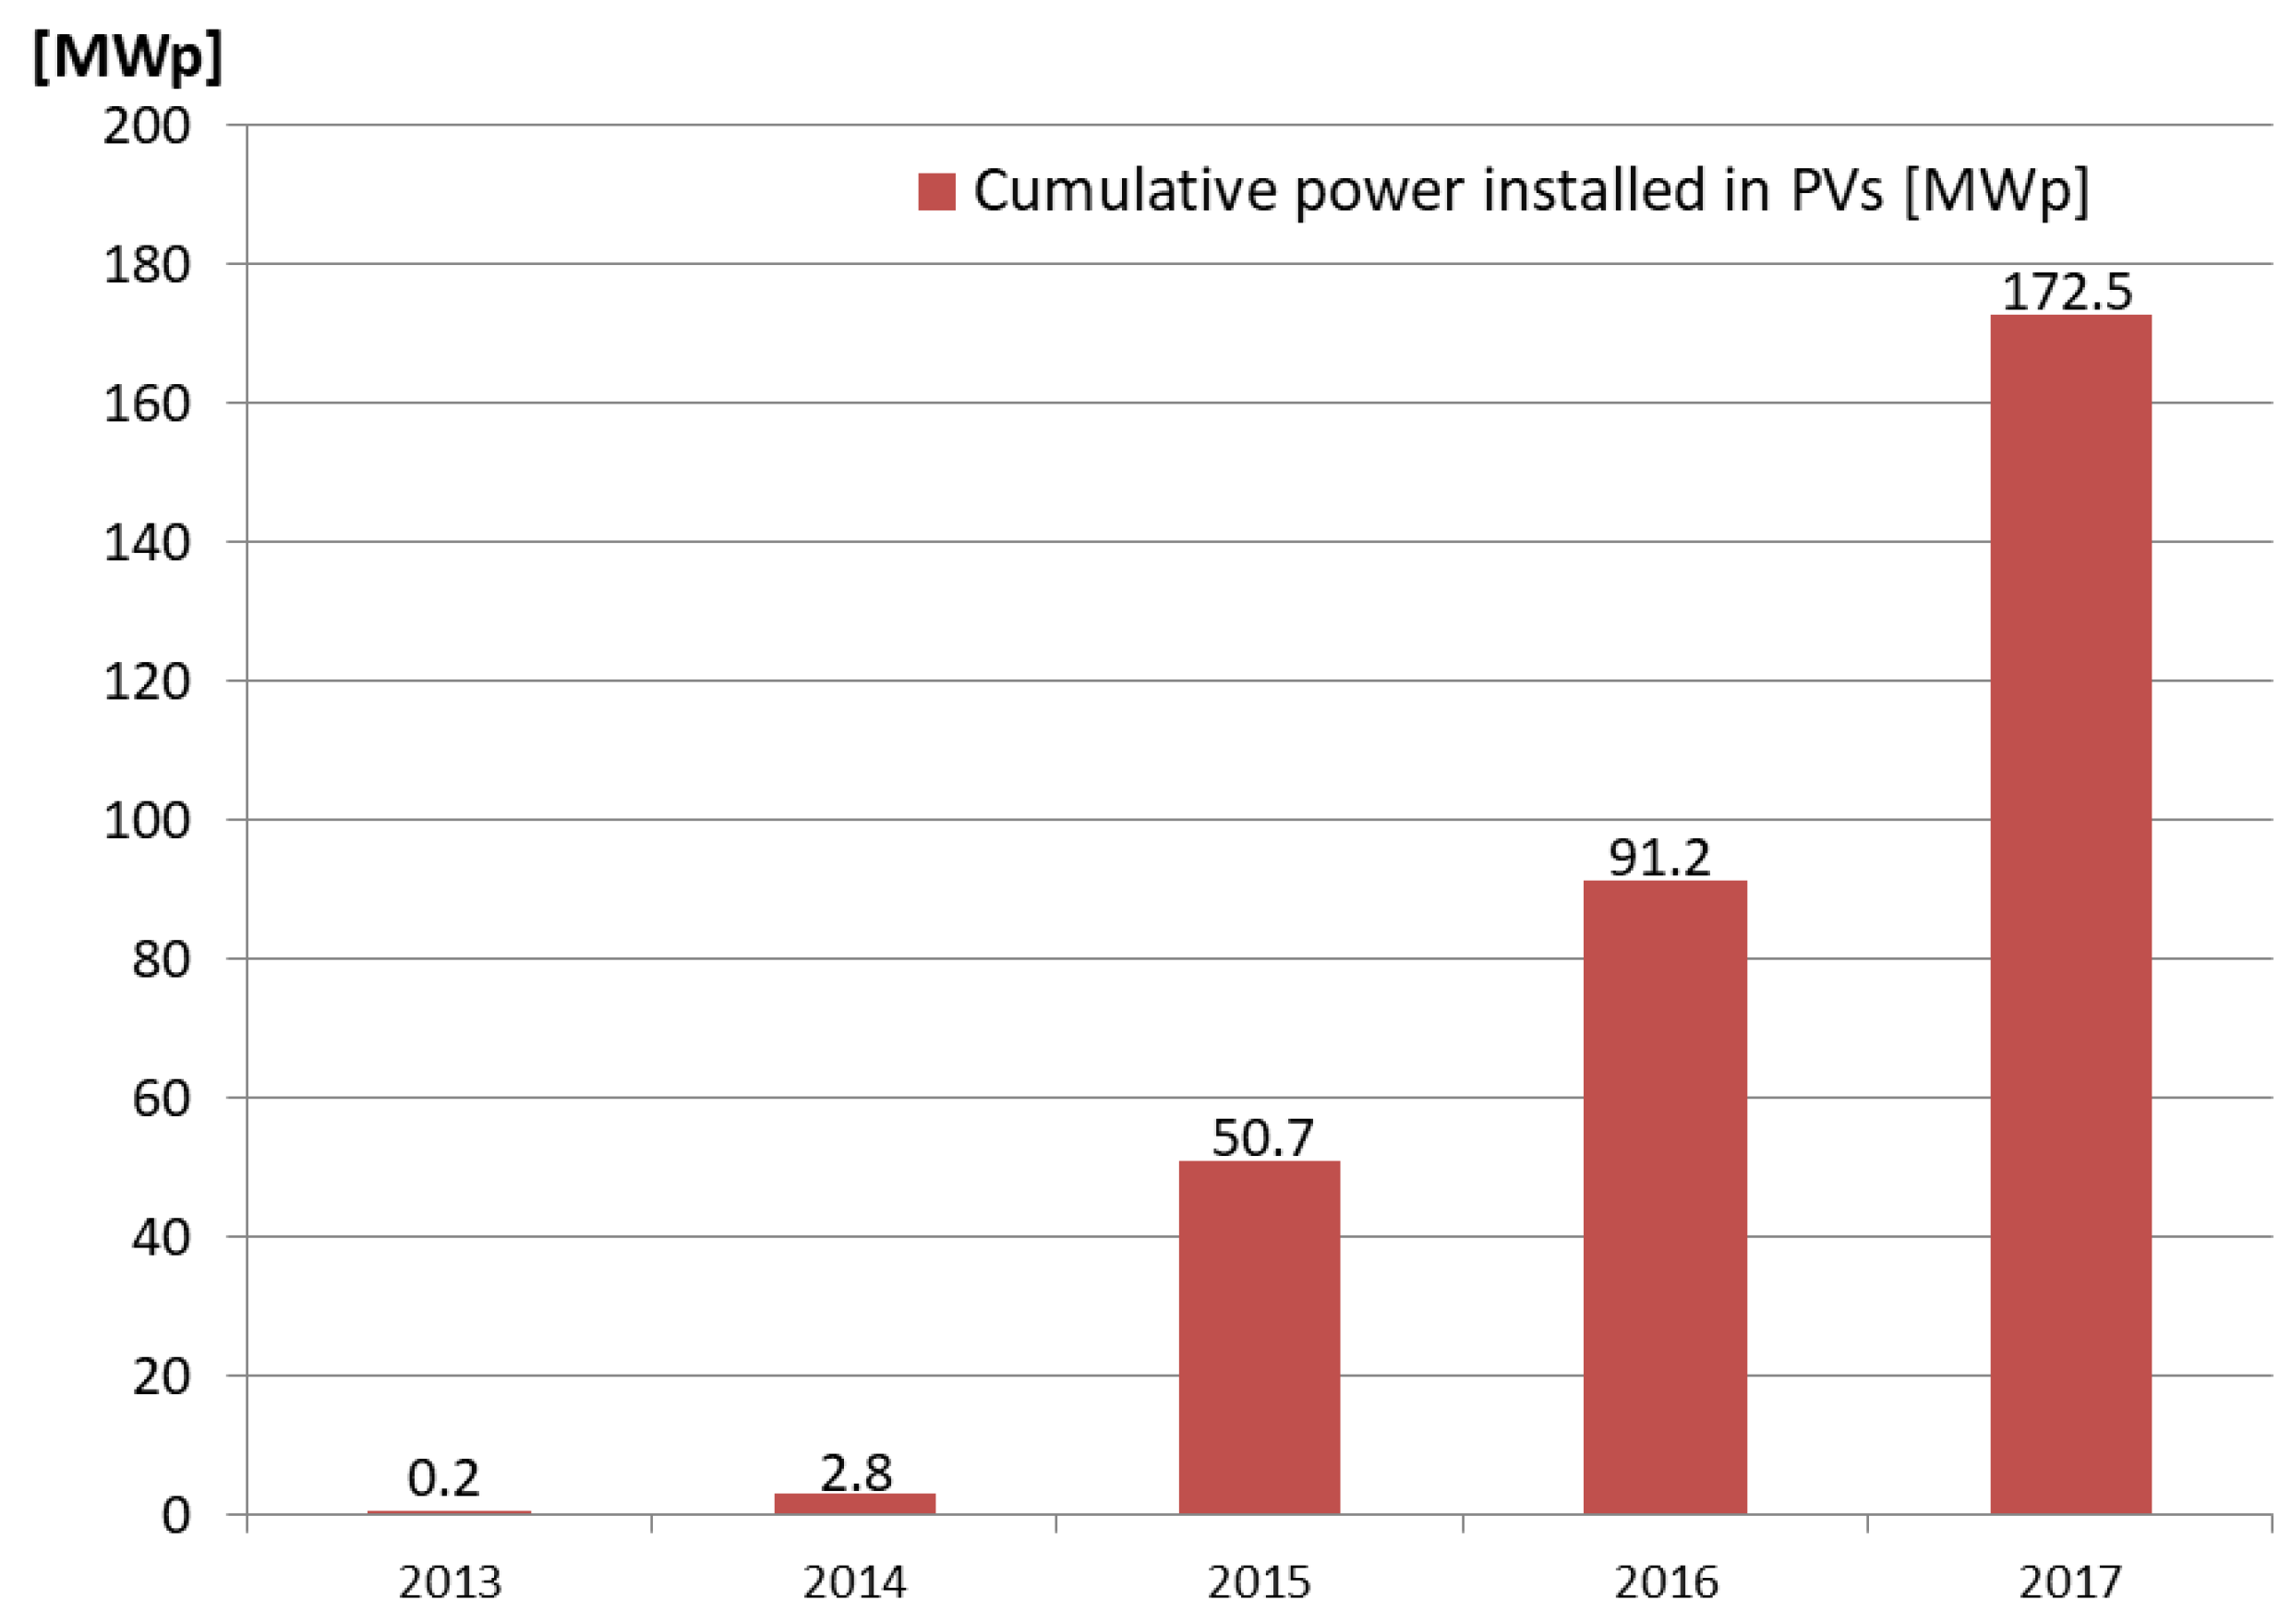
At the end of 2017, the share of RES in Polish energy production was estimated by the Energy Regulatory Office (URE) (https://www.ure.gov.pl/en/ accessed on 4 April 2018) to be 8.54GW (around 13.5% of the total production). The main share (c.a. 68%) of this production belongs to wind power generators, followed by 15.95% biomass, 11.5% hydro generators, 2.7% biogas, and finally 1.2% solar energy. The association of PV Poland (https://pv-polska.pl/ accessed on 4 April 2018) claims that these statistics do not include micro-installations, with an almost 99% share of this belonging to PVs. Such micro-installations contribute to the segment of prosumers in the Polish energy market. According to experts, this segment will develop rapidly in the coming years because of favorable legal regulations and financial subsidies from national programs and EU funds. The development of the PV market in Poland is presented in Figure 1. The total number of PV installations at the end of 2017 reached 27,310 systems and further growth is expected.
According to EU regulations, by 2020, 15% of the energy in Poland should come from renewable sources. Poland can increase its share of RES in power generation to nearly 38% by 2030 (compared to only 7% in 2010). According to the report known as REmap 2030: Renewable Energy Prospects for Poland, prepared by the International Renewable Energy Agency (IRENA) with input from the Polish Ministry of Economy, the share of renewable energy from the final energy consumption could more than double, to nearly 25% by 2030 [49]. As the report explains, opportunities to scale up renewables are not limited to the power sector. The renewable share of energy applications in buildings could nearly triple, to almost 35%, while the industry and transport sectors could see their shares double [49].
In 2016, there were some 17.24 million final customers, among whom 90.6% (15.61 million) are customers in the G tariff group (i.e., mostly a uniform tariff (G11), or with an option of a lower price at night, or during weekends and holidays (G12 or G12w), or G13 with three time zones), with a great majority being household consumers (over 14.63 million). At the moment, Polish energy suppliers do not offer green energy tariffs or programs.
The scheme of renewable energy support in Poland is based on the Renewable Energy Act (RES-Act). The latest legislative changes implemented through this act in 2015 introduced two new mechanisms to advocate for the development of renewable energy investment in the power generation sector: an auction system to replace green certificates and the Feed-in-Tariff (FiT) applied to microgeneration (up to 10 kW) [12,49]. Poland’s previous renewable energy promotion system was based on green certificates. According to the experts, the new regulations will give the government almost complete control over the rate of the deployment of each technology and the volume of related investments [49]. As the IRENA report states [49], the government can now take into account the most recent economic and technological trends as well as externalities and indirect economic impacts associated with various renewable energy technologies. The auction system is weighted toward the most cost-effective projects and technologies.
Apart from these legislative changes, the state also supports prosumers (individual consumers of energy who produce energy in small-scale generators) in production for their own purposes (not for profits) (http://www.res-legal.eu/search-by-country/poland, accessed on 4 April 2018). There is no fixed tariff, but the prosumers are allowed to exchange the surplus of energy produced by favorable conditions for gaps in energy production in the future, to the order of 1–0.8 in the case of micro-installations with a capacity up to 10 kW, and 1–0.7 in the case of micro-installations with a capacity above 10 kW (but below 40 kW) [13].
The legislative scheme of green energy support is important, but usually it is not enough to convince consumers to support RES. Some findings about the attitudes and behaviors of Polish residential consumers toward green energy are discussed below.
2.4. Data for Poland
According to the survey conducted in 2014 by Optimal Energy, 95% of investigated Poles support an energy policy which develops RES in Poland, and 78% would like to produce energy in their household if it were possible (Report “Electrical energy in Polish households”, https://optimalenergy.pl/raport-o-rynku-energii-w-polsce/ (in Polish), accessed on 4th April 2018) . In the study conducted in 2015 by TNS Polska, Poles were asked about their preferences regarding investment in RES, and in particular about their knowledge regarding RES, and legal regulations and their willingness to become a “potential investor in PV panels” [13]. The findings showed that every second respondent (c.a. 50%) was not interested in RES, mainly due to an inability to install the panels (e.g., respondents living in a flat or renting a house). The study also revealed that 21% of respondents would be ready to invest in PV panels but only if the return on investment would not be longer than five years. The most common motivations to install PV included: the possibility of lowering electricity bills (60%), independence from energy producing companies (15%), the desire to actively participate in environmental protection (13%), and higher social status (5%) [13]. Based on these findings, it has been concluded that a potential Polish prosumer is a person who has a medium to high income level (monthly earnings from USD 675–1080 net), is under the age of 29, and is living in a detached or semi-detached house in a rural area, where the likelihood of being able to implement RES installations is higher [13].
Finally, according to another study performed in 2015 [14], only 4.76% of respondents had already installed RES, but 31% were willing to install in the future. Consumers who had already decided to install RES in their households were mainly motivated by potential savings and profits from RES (c.a. 70%). Among other reasons to install RES, the respondents mentioned being ecologically friendly (17%), persuasion by professional (c.a. 10%), and the influence of neighbors or friends (4.5%). The main factors influencing the reluctance to install RES included: high installation costs, technical barriers (e.g., the complicated process of connection to the grid, impossibility of installing RES), lack of interest and knowledge, and unclear regulations.
This paper presents findings from a study in which all possible forms of adoption to green electricity in Poland (i.e., willingness to install RES or willingness to pay for electricity if it is green) were investigated. Section 3 presents the data collection and the research method.
3. Materials and Methods
3.1. Analytical Procedure
Consumers’ adoption of green electricity can be investigated from various points of view. Namely, consumers can adopt green electricity by (1) being ready to pay more for electricity (WTP), (2) being ready to become a prosumer or to change energy supplier if one offers green electricity tariff (SWA, feasible adoption), and (3) already being a prosumer (actual adoption). In Poland, a propensity to switch to a green electricity tariff is examined only theoretically, because at the moment no green tariffs are offered to the residential consumers.
Based on the literature review and the results from the surveys for Poland, it is assumed that Polish residential consumers are likely to adopt green electricity, when
- their income is high and they are well educated and young (H1),
- they have positive attitudes and behaviors toward environmental protection (H2),
- their peers (family members, friends or colleges) support their decision to install RES or to switch to a green electricity tariff (H3), and
- they are well informed about the green energy market (H4).
To verify these hypotheses, a questionnaire was prepared and a survey carried out. The questions and scales were proposed with regard to other similar studies conducted in other countries [7,15]. The main theoretical assumptions behind this study are Roger’s model of diffusion of innovation [10] and Ajzen’s theory of the planned behavior [35], as in various other studies [2,7,15]. Based on Roger’s model, the study assumes that adoption of an innovation (in this case, green electricity) is a process that requires transition from opinions (based on some initial level of awareness and knowledge) to decision (e.g., purchasing green electricity products). Ajzen’s model investigates the main drivers of behavioral intentions. In particular, the model considers attitudes toward a behavior, subjective norms (social influence), and perceived behavioral control (e.g., accepted cost) [35]. Hence, the questionnaire was designed in such a way as to include most of the important variables indicated by both models, such as pro-environmental attitudes and behaviors, social norms, knowledge, and awareness. Finally, respondents’ WTP was estimated based on the absolute amounts that a household was ready to pay if the electricity delivered was to come from RES.
3.2. Data Collection and Sample
The data were collected in November 2017 by means of a standardized telephone survey (N = 502). Around 10,800 phone calls were made, with a response rate of 4.6%. Personal records were obtained with respect to the norm (ISO/IEC 27001) by the professional survey agency. The questionnaire was pre-tested in the pilot study. The average duration of the interview was 11 min. The random stratification of the sample was based on the representation of all the Polish regions (i.e., voivodeship) based on the statistics regarding population published by the Poland Central Statistical Office (CSO). The respondents were also screened by age (they must have been over 18 years old) and whether they held the responsibility of paying electricity bills in the household. The data were analyzed in the SPSS program, using descriptive statistics and testing.
The sample demographic characteristics are presented in Table 1. A total of 53.8% of the participants were male. Around 66% of the participants were in the age range of 25–60. Almost half of the respondents declared higher education. Around 60% of the participants reported living in a house (detached house, semi-detached house, or terrace house). The rest of the respondents lived in various kinds of flats or apartments. The respondents’ household size varied from 1–10 persons, with the mean sample household size of 3.13 persons. Around 60% of the participants lived in a city (of 20,000 to over 100,0001 inhabitants). The financial situation of their household was perceived to be moderate (i.e., average income) by 47% of the respondents, and 40% claimed that the household income was rather or very good. For most of the respondents, the average monthly electricity bill was in the range of 100–200 PLN (1 PLN = c.a. 0.27 USD).
4. Results and Discussion
4.1. Descriptive Statistics
The questionnaire consisted of a few blocks of questions. All the questions were asked in Polish. Respondents were asked for their demographic information, pro-environmental attitudes and activities, social influence, knowledge and awareness of how to support green energy, satisfaction with the current energy supplier and readiness to change supplier, and finally about their willingness to pay more for their electricity knowing that it is generated by RES. First, some descriptive statistics related to findings are provided below.
Environmental Attitudes and Behaviors
The respondents overall were quite pro-environmental. Specifically, more than 80% claimed that environmental protection is important to them, and around 50% disagreed that the reports about ecological crises have been exaggerated. Around 70% were glad if the environment and climate protection play a vital role in politics, and more than 85% were sure that each individual citizen can bring about a great deal of change for environmental protection through their own behaviors. On the other hand, less than half of respondents were willing to pay much higher taxes to protect the environment. The mean value and standard deviations are shown in Table 2.
The respondents were also asked about their green activities (see Table 3). More than 70% of respondents claimed to recycle on a regular basis, to use energy saving bulbs, and to keep public spaces clean. On the other hand, the respondents neither contributed financially to environmental organizations (83% negative answers) nor belonged to an environmental organization (93% negative answers).
Knowledge and Awareness of RES and Green Electricity Tariffs
Polish residential consumers claimed to have heard of green technologies for household use (e.g., solar panels and small wind turbines). Surprisingly, 60% had already informed themselves about the use of green technologies in the household (see Table 4). On the other hand, around 60% of respondents had never heard about green electricity tariffs, more than 80% had never informed themselves about them, and 93% had never been offered such a tariff by an energy supplier. Finally, according to around 60% of respondents, advertisements in mass-media were not inspiring enough to support renewable energy.
Social Influence
In the next block, some questions about social influence were asked (see Table 5). We wanted to know whether most of the people important to the respondent (family members or friends) support the production of electricity by RES. The respondents were quite positive about this, as around 70% confirmed this was the case. The majority of respondents (80%) agreed that most of the important people in their lives would support their decision to use green electricity in their households (i.e., becoming a prosumer) and approximately 60% answered that most of the important people in their lives would support their decision to switch to green electricity tariffs. For the last question, however, 32% of respondents marked the neither agree nor disagree option, which shows a lack of knowledge and experience regarding green electricity tariffs in Poland.
Respondents’ Satisfaction with the Current Energy Supplier
We also investigated whether consumers are satisfied with their current energy supplier. Among the respondents, 68% claimed to be satisfied, but 20% were unsure. According to 40% of respondents, it is quite difficult to compare the offers from various suppliers, and 35% were not able to answer this question (the dominant answer was neither agree nor disagree). Surprisingly, 70% of respondents claimed to be willing to consider switching energy supplier if they knew that part or all of the energy they produced was from RES (see Table 6).
4.2. Green Electricity Adoption
Below, we discuss the results regarding WTP for green electricity and willingness to change energy supplier in order to access green electricity. Feasible and actual adoption were both investigated. Finally, we present some of the main attitudes and statements of the respondents regarding green energy support.
Willingness to Pay (WTP)
To investigate consumers’ WTP, a contingent valuation method was chosen. The respondents’ WTP was determined in a closed-ended manner, in which respondents had to choose a level of extra payment for electricity, if it was partially or fully produced by RES, from a predefined and ordered list with interval scales. Such a procedure allowed us to determine the extent to which respondents were willing to pay additionally for electricity if it was green. Only payments above 30 PLN (8 USD) could be precisely declared by the respondent in an open-ended manner. In the pre-test, the correlation between respondents’ WTP and the average amount of their electricity bill was negative, but statistically insignificant (). Moreover, the respondents claimed that estimating their WTP as a percentage of the current electricity bill is difficult. This is why, in the main study, WTP was estimated in absolute terms (not as a percentage of the monthly electricity bill) from a predefined interval list.
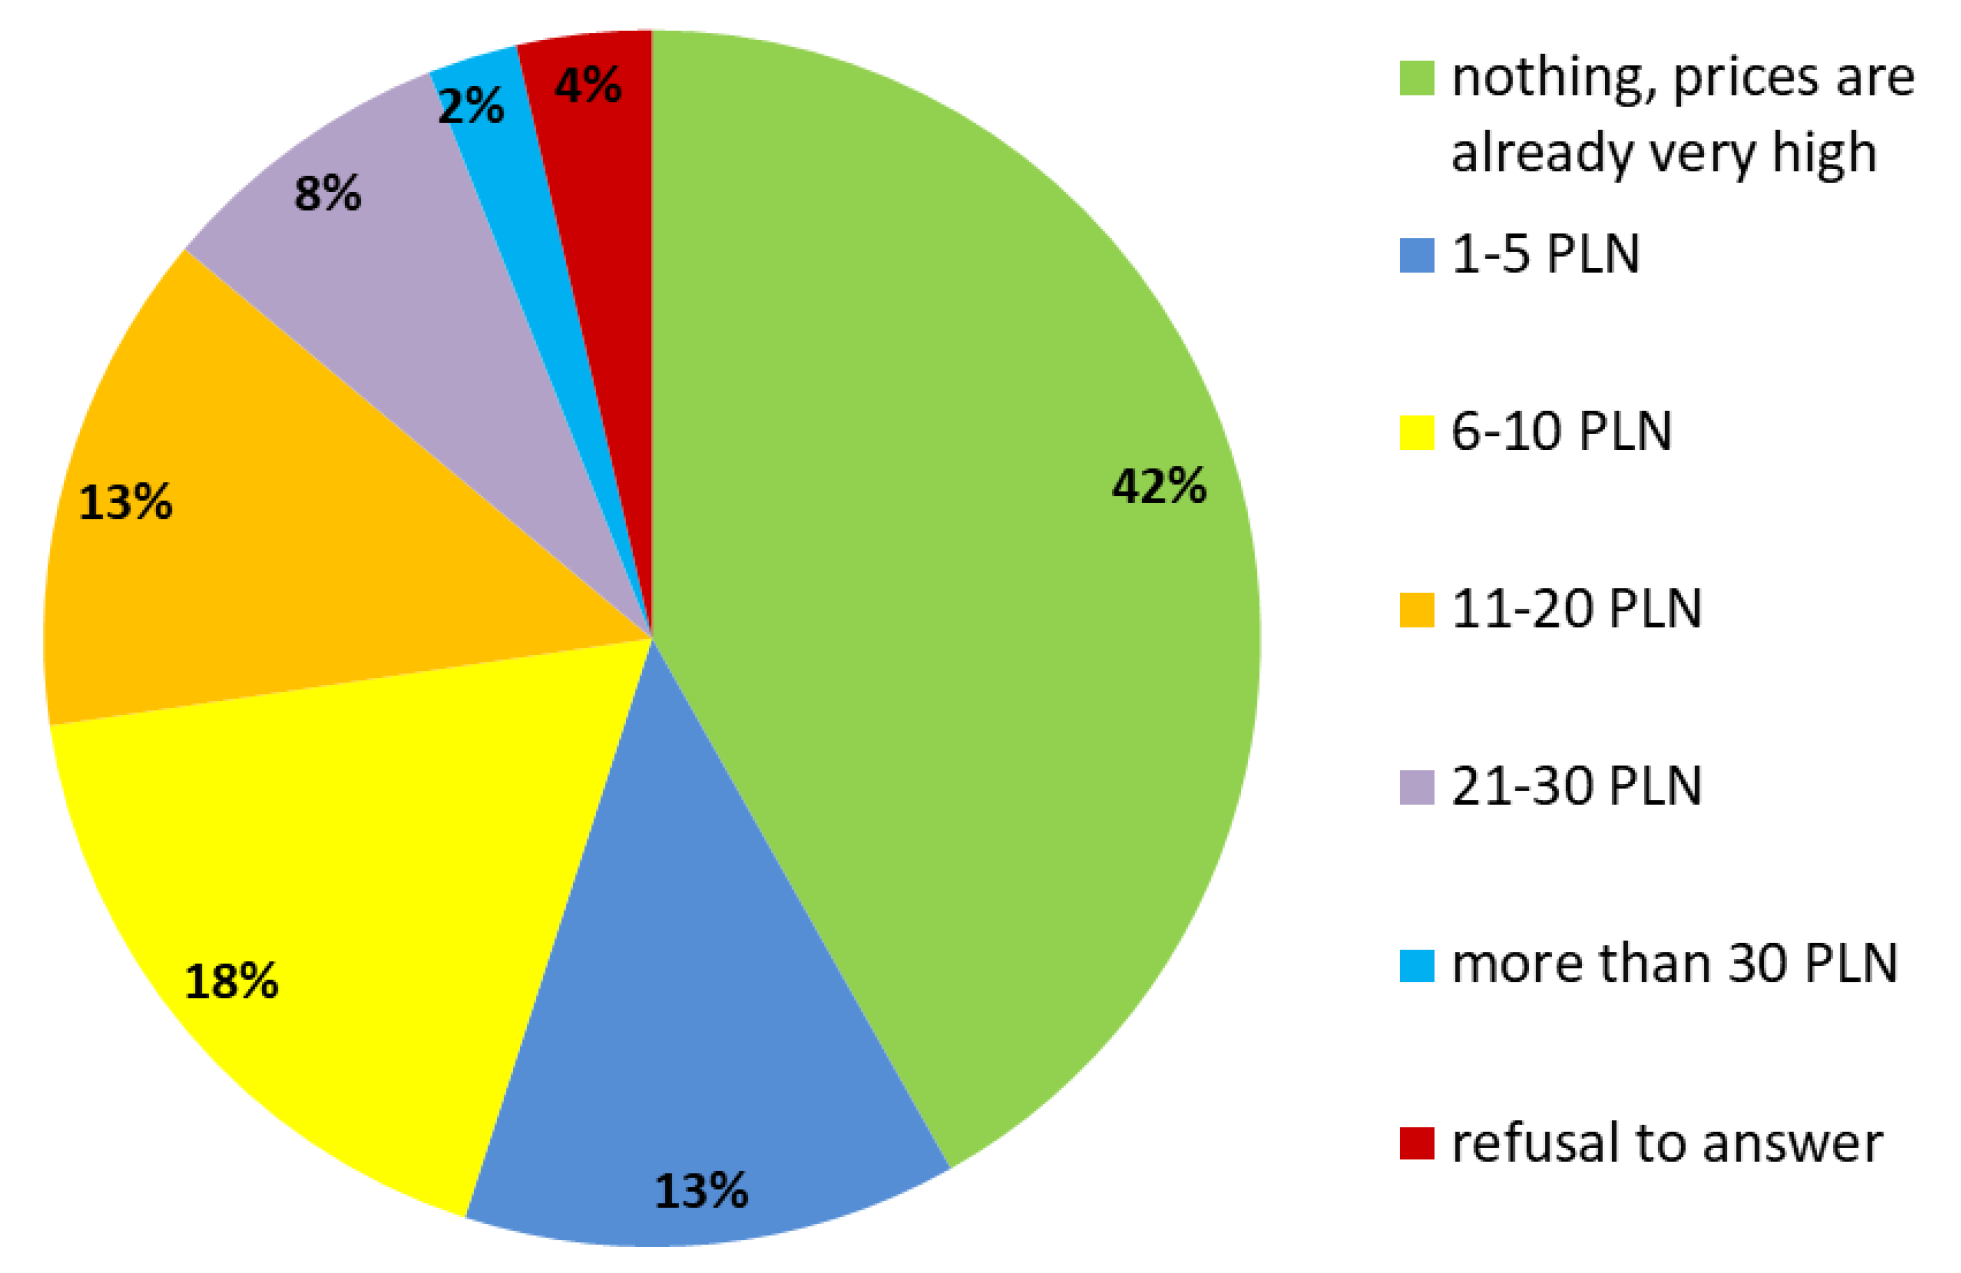
First, respondents’ WTP is presented in Figure 2. From among the whole sample of respondents, 42% were not ready to pay more for electricity than they pay now. Willingness to pay between 1–5 PLN was reported by 13% of the respondents, 18% were willing to pay between 6–10 PLN, 13% between 11–20 PLN, and 8% between 21–30 PLN (1 PLN = c.a. 0.27 USD). Only 2% of respondents reported being ready to pay more than 30 PLN. Among this small group, most were ready to pay an additional 50 PLN. The remainder indicated payments between 35 and 200 PLN.
Then, to verify Hypotheses H1–H4 (see Section 3.1), we estimated the correlation coefficients and conducted the t-test of independence between all the indicators and WTP (see Table 7). In all statistical tests, we assumed a significance level of at least 5% (i.e., the p-value should be less than 0.05 in order to accept the hypothesis of dependence between given variables). Below, we will present and discuss only the results that were statistically significant. Spearman’s test of correlation and the independent sample t-test were carried out in the SPSS program to investigate the relationship between the given variables. In the case of indicators representing environmental attitudes (see Table 2) and social influence (see Table 5), the reliability test equaled 0.596 and 0.765, respectively. This allowed us to aggregate the data and analyze their relationship to WTP. For the rest of the indicators, the reliability tests were too low (<0.5) to build aggregated constructs.
This analysis focuses on general consumers’ WTP for green electricity, regardless of whether this additional payment is low or high. For this reason, the WTP indicator has also been aggregated into two main categories: (1) those who refuse to pay, who refuse to switch the energy supplier or who refuse to answer the question (N = 228) and (2) those who want to pay at least 1 PLN (N = 274). The results are discussed below.
In terms of demographic characteristics, only three were shown to be relevant: age, income, and education. It was found that age is negatively associated with WTP (i.e., the older the consumers are, the less they are ready to pay for green electricity). Income and education are positively correlated with WTP (i.e., WTP increases with consumers’ wealth and education). These findings are in agreement with the literature. The correlation coefficients between age, income, education, and WTP are on a low level of around 0.14, but the results are statistically significant (According to Cohen’s suggestion [50], all correlations found are rather small (below 0.3) or medium (between 0.3–0.5), but still statistically significant ().). The statistically significant results of the t-test ( in the case of income and education and in the case of age) confirms Hypothesis H1.
The highest correlation coefficients were found between WTP and pro-environmental attitudes (rho = 0.3) and social influence (rho = 0.2). Both indicators are positively correlated with WTP. These results indicate that with peers’ support and approval, as well as pro-environmental attitudes and beliefs, the WTP increases. The analysis of the t-test for independent samples support those results and allow us to verify Hypotheses H2 and H3. Respondents who do not want to pay more for electricity if it is green tend to declare less pro-environmental attitudes (M = 18.87; SD = 3.76) than respondents who are willing to pay even small additional amounts of money (M=21.07; SD = 3.09). On the other hand, we have not found any association between pro-environmental behaviors (see Table 3) and WTP (). Only one activity—recycling regularly—was found to be statistically significant (, , ). Therefore, Hypothesis H2 is partially confirmed. The respondents for whom social support and the approval of their peers are important are more willing to pay for green energy (M = 12.29; SD = 2.06) than those who do not care much about social influence (M = 11.32; SD = 2.59). The t-test found , , so Hypothesis H3 is also confirmed.
Finally, it was found that consumers’ knowledge about green energy and knowledge of green electricity tariffs have a low impact on WTP (). The t-tests in both cases were statistically significant ( for both indicators). As expected, this association is positive (i.e., consumers with more knowledge of green electricity tariffs are more likely to have a positive WTP (M = 5.53; SD = 0.81) than consumers with less knowledge and awareness (M = 5.31; SD = 0.84)). Similarly, consumers with more knowledge about green energy usage at the household levels are more likely to have a positive WTP score (M = 3.47; SD = 0.87) than consumers with less knowledge and awareness (M = 3.23; SD = 0.97). Hence, Hypothesis H4 is confirmed.
We also examined the association between WTP and willingness to change energy supplier if the energy offered is green (i.e., switching to a green electricity tariff). As expected, there is a strong relationship between these variables showing that only consumers with a positive WTP score are interested in green electricity tariffs, if offered. The t-test for this was with and .
In Table 8, we present some statistically significant results regarding the association between certain factors and consumers’ willingness to change energy supplier if the electricity offered is green. Again, we observed that social influence and pro-environmental attitudes have the strongest impact on the willingness to switch to green electricity tariffs. The t-test for independent samples showed that the willingness to change an energy supplier increases with pro-environmental attitudes (M = 20.79; SD = 3.15 versus M = 18.45; SD = 3.96) and peer support and approval (M = 12.23; SD = 2.21 versus M = 11; SD = 2.41). The access to information and general knowledge about green energy and green electricity tariffs are positively correlated with willingness to switch to a green electricity tariff, however this relationship is rather weak (). The result of the t-test indicates the association between these variables is statistically significant and indicates that, within the increase of knowledge about green electricity tariffs, the willingness to opt for such a tariff increases (M = 5.55; SD = 0.82 versus M = 5.35; SD = 0.84). Similarly, with the increase of knowledge and awareness about green energy, the willingness to change energy supplier if the electricity offered is green increases (M = 3.57; SD = 0.85 versus M = 3.24; SD = 0.95).
Feasible and Actual Adoption
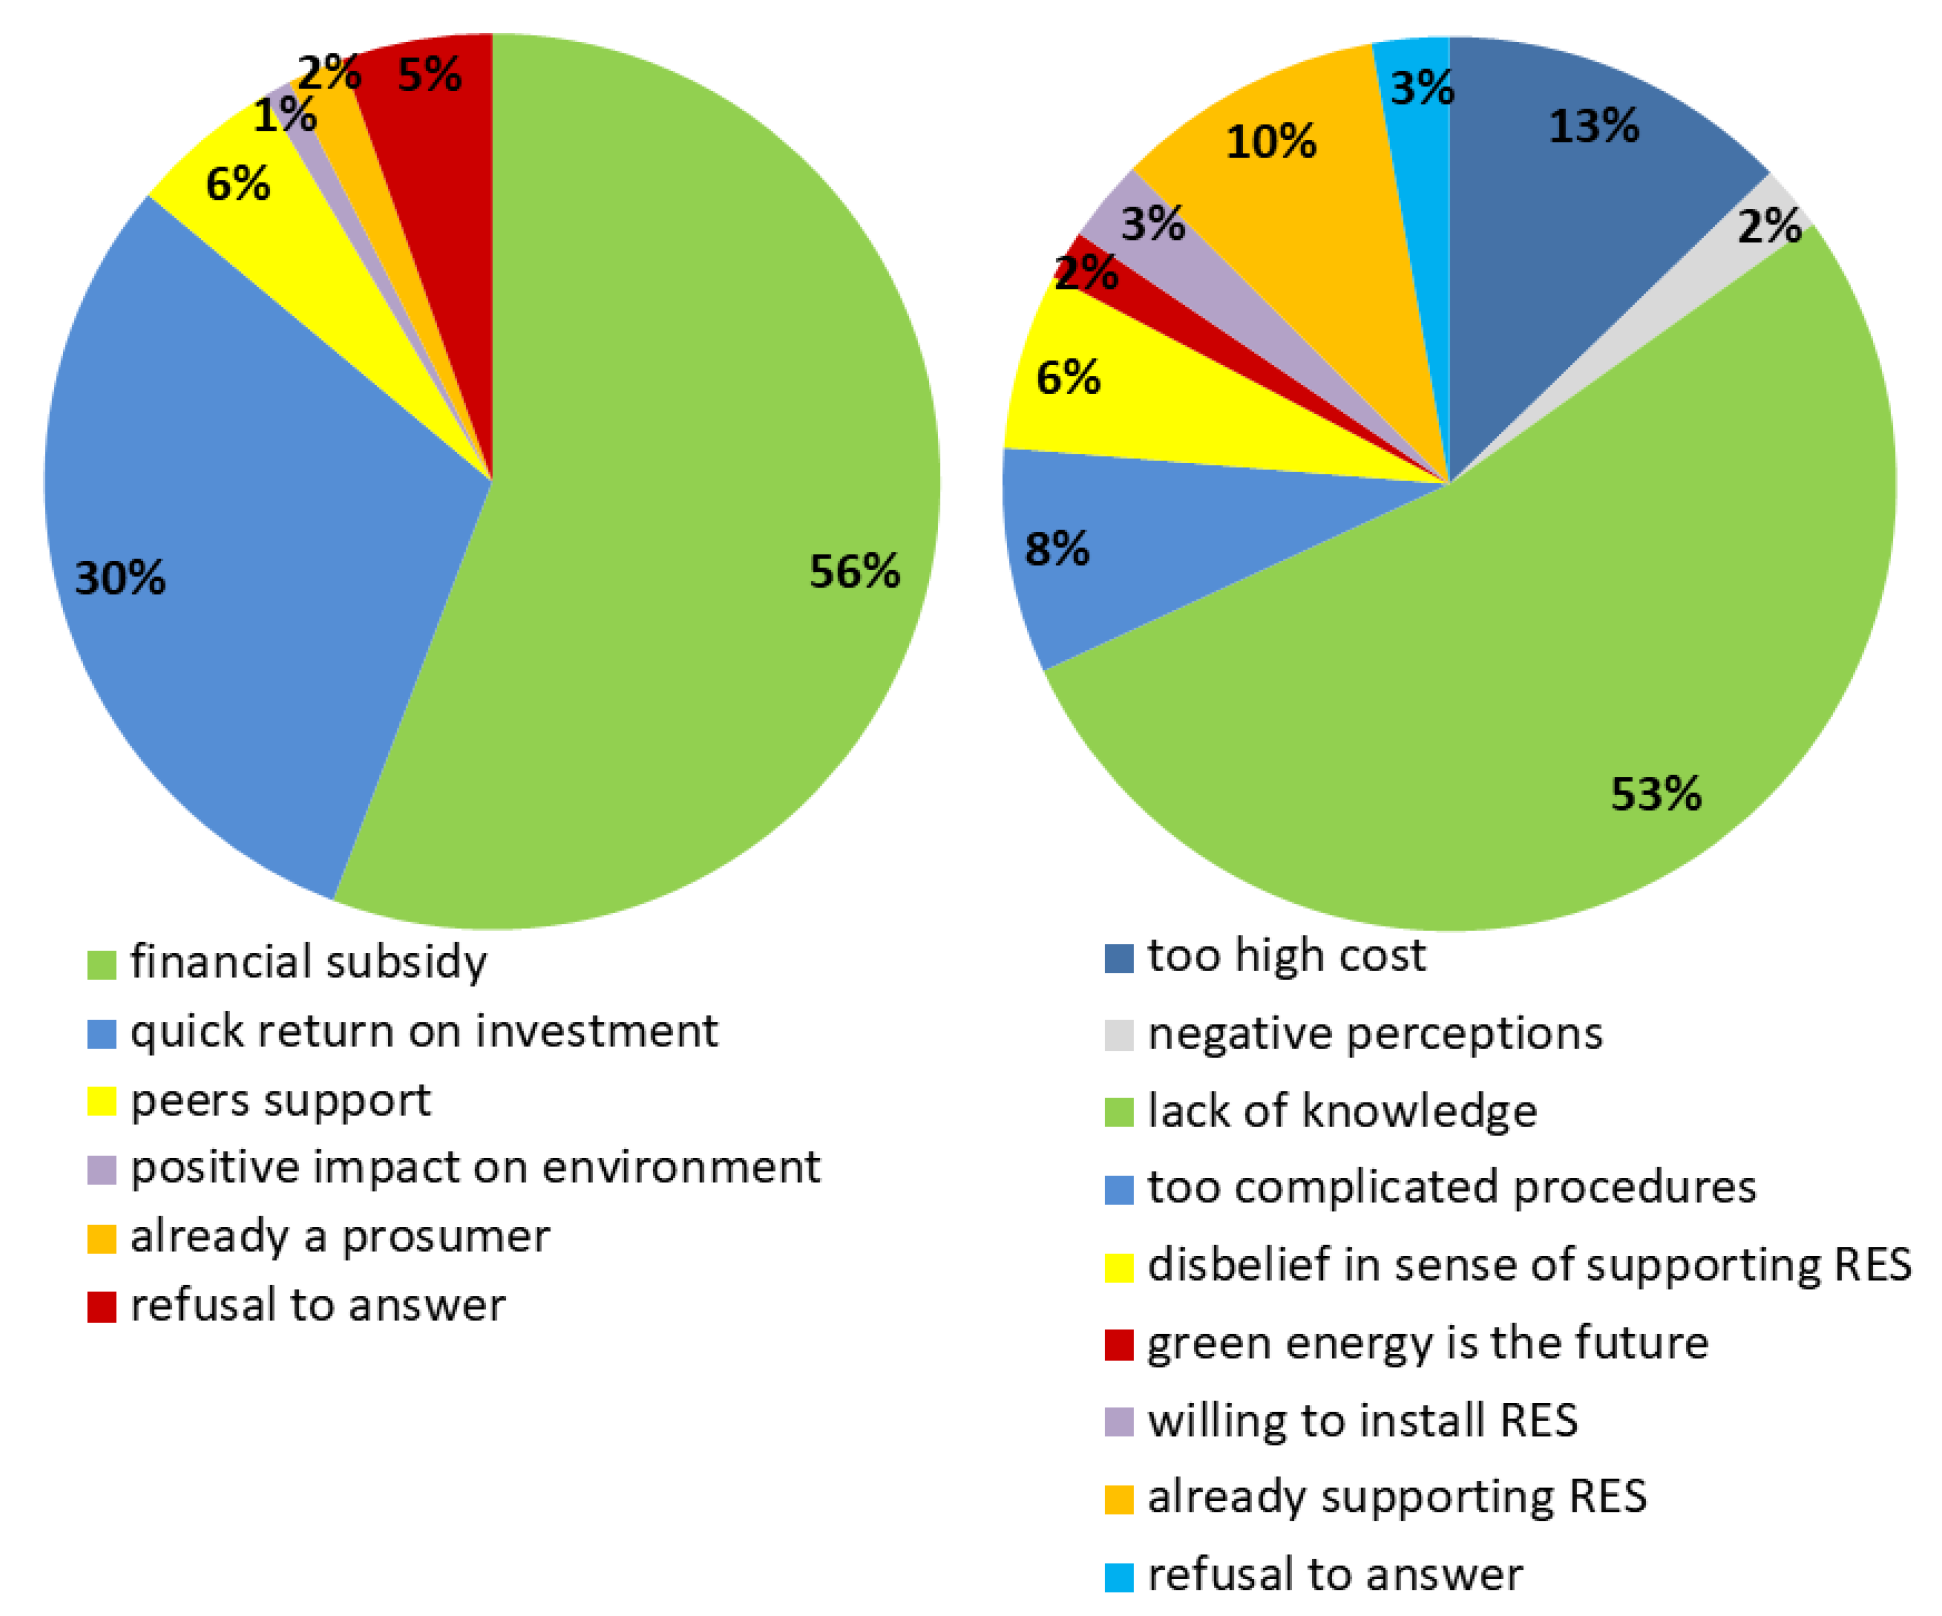
Those respondents who live in a detached, semi-detached, or a terrace house, and so have the technical ability to install RES in their households, were asked about the main factor that could encourage them to become a prosumer (see Figure 3, left panel). More than half of respondents (56%) indicated a financial subsidy. The second most common answer was a quick return on investment (30%). Residential consumers need financial help to invest in RES, and they want to be sure that their investment will be profitable. Some respondents indicated peer support as a vital motivation (6%). In terms of actual adoption, only six families in our sample had already installed RES (mainly PV panels).
General Attitudes Towards Green Energy Support
The right panel of Figure 3 presents respondents’ general attitudes and statements toward green energy support (respondents had to choose the single most suitable answer). Most of respondents (53%) pointed out a lack of knowledge about green energy and the ways to support it. For 13% of the respondents, investment and maintenance cost associated with RES was considered too high, and for 10% the procedures of changing the energy supplier and the legal regulations were considered too complicated. In other words, they did not trust in the fairness of the energy suppliers’ offers. A small number of respondents (6%) did not believe that supporting the development of green energy could bring about positive effects to the climate and environment protection. A total of 10% of respondents marked that they already support green energy. This group includes consumers who have installed RES in their households as well as those who generally think that, by their positive attitudes (“RES is the future”), they support green energy development. A smaller number (3% of respondents) claim to be willing to install RES in the future.
These findings show that Polish residential consumers are in favor of further development of green energy. They lack some important information regarding how to support RES at the residential level and they need financial subsidies to decide to invest in the green sector.
5. Conclusions and Policy Recommendations
This paper has empirically examined some of the determinants of green electricity adoption among Polish residential consumers. Based on the literature review, it was assumed that consumers’ willingness to adopt would be positively influenced by income, education, a young age, pro-environmental attitudes and behaviors, sensitivity to social influence, and general knowledge about the green energy market. Nowadays, Poles can adopt green electricity mainly by opting for small-scale generators in their households. Green electricity tariffs have not yet been offered in Poland, but consumers’ declarations of their WTP for green electricity, and their willingness to change an energy supplier if the electricity offered is green, were considered in this research.
It has been shown that general positive attitudes toward green energy has so far rarely transformed into actual adoption. Very few consumers have already opted for small-scale installations (i.e., becoming a prosumer). On the other hand, many respondents reported that they will consider such an investment in the future. For most of them, financial barriers and a lack of knowledge are the main reasons for non-adoption.
Some consumers refuse to pay for green electricity. It has been found that WTP increases with pro-environmental attitudes, knowledge, peer support and approval, income, and education. At the moment, consumers are not familiar with green electricity tariffs, which are not currently being offered by energy suppliers. Generally, consumers are not aware of how they could support the development of RES, even if their WTP is high. This problem is especially significant in the case of consumers who cannot become prosumers for technical reasons (i.e., impossibility of installing green energy in their households). This segment of consumers especially requires some advice from local authorities, associations, and institutions dealing with RES, regarding the ways they could support further development of renewables.
If the Polish government wants to increase the share of RES in the power system, the contribution and acceptance of residential consumers should not be neglected. Social campaigns and educational trainings are needed to overcome the lack of knowledge about the ways to support the development of RES. Stable legal regulations and clear market rules are also important. Consumers are sensitive to costs. To accelerate diffusion of RES and to increase adoption rates, subsidy systems with clear and easy to understand procedures are needed. Finally, as consumers care about their peer support and approval, pilot programs with elements of competition between the neighbors (as already utilized in the case of energy conservation) could help.
Limitations of the Study and Future Work
This paper aimed to empirically explore factors influencing the willingness to adopt green electricity among Polish residential consumers. Moreover, it also examined the expectations and interest of Polish consumers toward the market of RES. Although these aims were achieved, this work has some limitations. Firstly, the sample was limited to around 500 respondents. On the one hand, the representativeness of the sample and the whole population, at least in the case of age, sex, urban population, and place of living, is acceptable. On the other hand, almost half of the sample declared higher education, whereas in the whole population the share of people between 25–64 years old with higher education is approximately 21%. Secondly, as green electricity tariffs are not offered to Polish residential consumers, their WTP was estimated only theoretically. The WTP was estimated by means of contingent valuation method, as the absolute premium that respondents were willing to pay, not as a percentage premium of the average monthly electricity bill. Most of the residential consumers had had no experience with green electricity tariffs, although 70% of respondents declared a willingness to switch to green electricity tariffs (if offered). At the same time, however, more than 40% of them were not ready to pay more for electricity. This indicates a gap between consumers’ declarations about supporting RES and their actual readiness to contribute, especially financially, to this sector of the energy market. Residential consumers are eager to adopt to small-scale generators, mainly PV installed in their households. The decision to become a prosumer is now the fastest way to achieve active consumer involvement in further development of RES in Poland. In the future, an extended study with a larger sample that includes some elements of the stated choice experiment for a more precise estimation of WTP should be considered.
Funding
This research was funded by the National Science Centre (NCN, Poland) grant number 2017/01/X/HS4/00246.
Acknowledgments
We thank the anonymous reviewers for their careful reading of the manuscript and their insightful comments and suggestions.
Conflicts of Interest
The authors declare no conflict of interest.
Abbreviations
The following abbreviations are used in this manuscript:
| RES | renewable energy sources |
| WTP | willingness to pay |
References
- European Commission. Accelerating Clean Energy Innovation: COM(2016) 763 Final: Winter Package; European Commission: Brussels, Belgium, 2016. [Google Scholar]
- Hansla, A.; Gamble, A.; Juliusson, A.; Gaerling, T. Psychological determinants of attitude towards and willingness to pay for green electricity. Energy Policy 2008, 26, 768–774. [Google Scholar] [CrossRef]
- Hobman, E.; Frederiks, E. Barriers to green electricity subscription in Australia: Love the environment, love renewable energy...but why should I pay more? Energy Res. Soc. Sci. 2014, 3, 78–88. [Google Scholar] [CrossRef]
- Kowalska-Pyzalska, A. Social acceptance of green energy and dynamic electricity tariffs a short review. In Proceedings of the International Conference on Modern Electronic Power Systems (MEPS), Wroclaw, Poland, 6–9 July 2015. [Google Scholar]
- Kowalska-Pyzalska, A. What makes consumers adopt to innovative energy sources in the energy market? A review of incentives and barriers. Renew. Sustain. Energy Rev. 2018, 82, 3570–3581. [Google Scholar] [CrossRef]
- Ntanos, S.; Kyrakopoulos, G.; Chalikais, M.; Arabatzis, G. Public perceptions and willingness to pay for renewable energy: A case study from Greece. Sustainability 2018, 10, 687. [Google Scholar] [CrossRef]
- Ozaki, R. Adopting sustainable innovation: What makes consumers sign up to green electricity? Bus. Strateg. Environ. 2011, 20, 1–17. [Google Scholar] [CrossRef]
- Stigka, E.; Paravantis, J.; Mihalakakou, G. Social acceptance of renewable energy sources: A review of contingent valuation applications. Renew. Sustain. Energy Rev. 2014, 32, 100–106. [Google Scholar] [CrossRef]
- Wuestenhagen, R.; Wolsink, M.; Buerer, M.J. Social acceptance of renewable energy innovation: An introduction to the concept. Energy Policy 2007, 35, 2683–2691. [Google Scholar] [CrossRef] [Green Version]
- Rogers, E.M. Diffusion of Innovations; The Free Press: New York, NY, USA, 2003. [Google Scholar]
- Bartczak, A.; Chilton, S.; Czajowski, M.; Meyerhoff, J. Gain and losses of money in a choice experiment. The impact of financial loss aversion and risk preferences on willingness to pay to avoid renewable energy externalities. Energy Econ. 2017, 65, 326–334. [Google Scholar] [CrossRef]
- Budzianowski, W. Sustainable biogas energy in Poland: Prospects and challenges. Renew. Sustain. Energy Rev. 2012, 16, 342–349. [Google Scholar] [CrossRef]
- Graczyk, M. The profile of polish prosumer and its political background. Econ. Environ. Stud. 2016, 16, 35–48. [Google Scholar]
- Ropuszynska-Surma, E.; Weglarz, M. The pro-economical behavior of households and their knowledge about changes in the energy market. In Energy and Fuels; E3S Web of Conferences; EDP Sciences: Les Ulis, France, 2016; Volume 14, p. 01006. [Google Scholar]
- Gerpott, T.; Mahmudova, I. Determinants of green electricity adoption among residential customers in Germany. Int. J. Consum. Stud. 2010, 34, 464–473. [Google Scholar] [CrossRef]
- Clark, C.; Kotchen, M.; Moore, M. Internal and external influences on pro-environmental behavior: Participation in a green electricity program. J. Environ. Psychol. 2003, 23, 237–246. [Google Scholar] [CrossRef]
- Ek, K. Psychological determinants of attitude towards green electricity: The case of Swedish wind power. Energy Policy 2005, 33, 1677–1689. [Google Scholar] [CrossRef]
- Frederiks, E.; Stenner, K.; Hobman, E. Household energy use. Applying behavioral economics to understand consumer decision making and behavior. Renew. Sustain. Energy Rev. 2014, 41, 1385–1394. [Google Scholar] [CrossRef]
- Gadenne, D.; Sharma, B.; Kerr, D.; Smith, T. The influence of consumers environmental beliefs and attitudes on energy saving behaviors. Energy Policy 2011, 39, 7684–7694. [Google Scholar] [CrossRef]
- Masini, A.; Menichetti, E. The impact of behavioral factors in the renewable energy investment decision making process: Conceptual framework and empirical findings. Energy Policy 2012, 40, 23–38. [Google Scholar] [CrossRef]
- Nolan, J.; Schultz, P.; Cialdini, R.; Goldstein, N.; Griskevicius, V. Normative social influence is underdetected. Personal. Soc. Psychol. Bull. 2008, 34, 913–923. [Google Scholar] [CrossRef] [PubMed]
- Perlaviciute, G.; Steg, L. Climate change and individual decision making: An examination of knowledge, risk-perception, self-interest and their interplay. Renew. Sustain. Energy Rev. 2014, 35, 361–381. [Google Scholar] [CrossRef]
- Stern, P. Individual and household interactions with energy systems: Toward integrated understanding. Energy Res. Soc. Sci. 2014, 1, 41–48. [Google Scholar] [CrossRef]
- Wuestenhagen, R.; Bilharz, M. Green energy market development in Germany: Effective public policy and emerging customer demand. Energy Policy 2006, 34, 1681–1696. [Google Scholar] [CrossRef]
- Claudy, M.C.; Michelsen, C.; O’Driscoll, A.; Mullen, M.R. Consumer awareness in the adoption of microgeneration technologies. An empirical investigation in the Republic of Ireland. Renew. Sustain. Energy Rev. 2010, 14, 2154–2160. [Google Scholar] [CrossRef]
- Sung, B.; Park, S.-D. Who drives the transition to a renewable-energy economy? Multi-actor perspective on social innovation. Sustainability 2018, 10, 448. [Google Scholar] [CrossRef]
- Zarnikau, J. Consumer demand for green power and energy efficiency. Energy Policy 2003, 31, 1661–1672. [Google Scholar] [CrossRef]
- Borchers, A.; Duke, J.; Parsons, G. Does willingness to pay for green energy differ by source? Energy Policy 2007, 5, 3327–3334. [Google Scholar] [CrossRef]
- Ma, C.; Rogers, A.A.; Kragt, M.E.; Zhang, F.; Polykov, M.; Gibson, F.; Chalak, M.; Pandit, R.; Tapsuwana, S. Consumers’ willingness to pay for renewable energy: A meta-regression analysis. Resour. Energy Econ. 2015, 42, 93–109. [Google Scholar] [CrossRef]
- Mengaki, A. Social marketing mix for renewable energy in Europe based on consumer stated preferences surveys. Renew. Energy 2012, 39, 30–39. [Google Scholar] [CrossRef]
- Zhang, L.; Wu, Y. Market segmentation and willingness to pay for green electricity among urban residents in China: The case of Jiangsu Province. Energy Policy 2012, 51, 514–523. [Google Scholar] [CrossRef]
- Zoric, J.; Hrovatin, N. Household willingness to pay for green electricity in Slovenia. Energy Policy 2012, 47, 180–187. [Google Scholar] [CrossRef]
- Sundt, S.; Rehdanz, K. Consumers’ willingness to pay for green electricity: A meta-analysis of the literature. Energy Econ. 2015, 51, 1–8. [Google Scholar] [CrossRef]
- Pongiglione, F. Contextual and Psychological Factors Shaping Evaluations and Acceptability of Energy Alternatives: Integrated Review and Research Agenda; FEEM Working Paper; Fondazione Eni Enrico MatteiL: Viggiano, Italy, 2011; pp. 1–27. [Google Scholar]
- Ajzen, I.; Fishbein, M. The influence of attitudes on behavior. In The Handbook of Attitudes; Albarracin, D., Johnson, B.T., Zanna, M.P., Eds.; Laurence Erlbaum Associates: New York, NY, USA, 2005. [Google Scholar]
- Sopha, B.; Kloeckner, C. Psychological factors in the diffusion of sustainable technology: A study of Norwegian household’s adoption of wood pellet heating. Renew. Sustain. Energy Rev. 2011, 15, 2756–2765. [Google Scholar] [CrossRef]
- Bollinger, B.; Gillingham, K. Peer effects in the diffusion of solar photovoltaic panels. Mark. Sci. 2012, 31, 900–912. [Google Scholar] [CrossRef]
- Schultz, W.; Nolan, J.; Cialdini, R.; Goldstein, N.; Griskevicius, V. The constructive, destructive and reconstructive power of social norms. Psychol. Sci. 2007, 18, 429–434. [Google Scholar] [CrossRef] [PubMed]
- Sidiras, D.; Koukios, E. Solar systems diffusion in local markets. Energy Policy 2004, 32, 2007–2018. [Google Scholar] [CrossRef]
- Ayers, I.; Raseman, S.; Shih, A. Evidence from two large field experiments that peer comparison feedback can reduce residential energy usage. J. Law Econ. Org. 2013, 29, 992–1022. [Google Scholar] [CrossRef]
- Good, N.; Ellis, K.; Mancarella, P. Review and classification of barriers and enablers of demand response in the smart grid. Renew. Sustain. Energy Rev. 2017, 16, 57–72. [Google Scholar] [CrossRef]
- Negro, S.; Alkemade, F.; Hekkert, M. Why does renewable energy diffuse so slowly? A review of innovation system problems. Renew. Sustain. Energy Rev. 2012, 16, 3836–3846. [Google Scholar] [CrossRef]
- Nygren, A.; Kontio, P.; Lyytimaki, J.; Varho, V.; Tapio, P. Early adopters boosting the diffusion of sustainable small-scale energy solutions. Renew. Sustain. Energy Rev. 2015, 46, 79–87. [Google Scholar] [CrossRef]
- Diaz-Rainey, I.; Tzavara, D. Investment inefficiency and the adoption of eco-innovations: The case of household energy efficiency technologies. Energy Policy 2015, 82, 105–117. [Google Scholar] [CrossRef]
- Oerlemans, L.; Chan, K.-Y.; Voschenk, J. Willingness to pay for green electricity: A review of the contingent valuation literature and its source of error. Renew. Sustain. Energy Rev. 2016, 66, 875–885. [Google Scholar] [CrossRef]
- Diaz-Rainey, I.; Tzavara, D. Financing the decarbonized energy system through green electricity tariffs: A diffusion model of an induced consumer environmental market. Technol. Forecast. Soc. Chang. 2012, 79, 1693–1704. [Google Scholar] [CrossRef]
- Diaz-Rainey, I.; Ashton, J. Profiling potential green electricity tariff adopters: Green consumerism as an environmental policy tool? Bus. Strateg. Environ. 2011, 20, 456–470. [Google Scholar] [CrossRef]
- Paravantis, J.; Stigka, E.; Mihalakakou, G.; Michalena, E.; Hills, J.M.; Dourmas, V. Social acceptance of renewable energy projects: A contingent valuation investigation in Western Greece. Bus. Strateg. Environ. 2018, 123, 639–651. [Google Scholar] [CrossRef]
- Gielen, D.; Saygin, D.; Wagner, N.; Budzianowski, W. Remap 2030 Renewable Energy Prospects for Poland; IRENA: Abu Dhabi, UAE, 2015; Available online: www.irena.org/remap (accessed on 4 April 2018).
- Cohen, J. Statistical Power Analysis for the Behavioral Studies, 2nd ed.; Taylor & Francis Inc.: Abingdon, UK, 1988. [Google Scholar]
Figure 1.
Cumulative power installed in PV micro installations in Poland (source: SBF Polska PV/IX Forum Solar+).
Figure 1.
Cumulative power installed in PV micro installations in Poland (source: SBF Polska PV/IX Forum Solar+).

Figure 2.
Willingness to pay (WTP) for green electricity (N = 502).

Figure 3.
Left panel: Motivations to become a prosumer (N = 294). Right panel: Attitudes toward willingness to support RES (N = 502).
Figure 3.
Left panel: Motivations to become a prosumer (N = 294). Right panel: Attitudes toward willingness to support RES (N = 502).


Table 1.
Respondents’ demographics (N = 502).
| Demographics | ||
|---|---|---|
| Attribute: | (%) | |
| Gender | male | 53.8 |
| female | 46.2 | |
| Age | 18–24 years old | 6.0 |
| 25–34 years old | 19.1 | |
| 35–44 years old | 23.3 | |
| 45–59 years old | 23.9 | |
| over 60 years old | 27.7 | |
| Education | primary | 2.8 |
| secondary | 34.5 | |
| vocational | 13.5 | |
| higher | 49.0 | |
| Housing | living in a house | 58.8 |
| living in a flat | 41.2 | |
| Household size | 1 person | 10.6 |
| 2 persons | 30.9 | |
| 3 persons | 19.7 | |
| 4 persons | 22.1 | |
| 5 persons and more | 16.7 | |
| Place of a living | village | 39.6 |
| town size up to 20,000 inhabitants | 12.7 | |
| town size 20,001 to 100,000 inh. | 19.1 | |
| town size over 100,001 inh. | 28.3 | |
| Average monthly electricity bill | till 50 PLN (13.5 USD) | 4.6 |
| 50–100 PLN (13.5–27 USD) | 23.1 | |
| 100–200 PLN (27–54 USD) | 44.6 | |
| over 200 PLN (54 USD) | 25.7 | |
| Own evaluation of respondent’s income | very bad | 1.0 |
| rather bad | 5.6 | |
| moderate | 47.4 | |
| rather good | 32.3 | |
| very good | 8.0 | |
Note: If the sum of the answers is not equal to 100%, it means that some of the respondents refused to answer the question. The demographic data for Poland in 2018 are as follows: age structure: 15–24 years: 10.7%; 25–54 years: 43.5%; 55–64 years: 14.21%; over 65 years: 16.86%; sex structure: male 48.2%; female 51.8%; urban population: 60.5%; household size: 1 person: 20.6%; 2 persons: 32.8%; 3 persons: 19.8%; 4 persons: 16.6%; 5 persons and more: 10.2%; higher education: 21% of people between 25–64 years (for more data please access: http://countrymeters.info/en/Poland/’ and https://www.indexmundi.com/poland/).
Table 2.
Respondents’ pro-environmental attitudes.
| Opinions: | Mean | SD |
|---|---|---|
| 1. Environment protection is not important for me. | 1.40 | 0.967 |
| 2. I think that reports about ecological crisis have been exaggerated. | 2.40 | 1.330 |
| 3. I am glad if the environment and climate protection play a vital role in politics. | 3.98 | 1.225 |
| 4. I would be willing to pay much higher taxes to protect the environment. | 3.13 | 1.444 |
| 5. Each individual citizen can bring about a lot for environmental protection through own behaviors. | 4.77 | 0.655 |
Note: values are calculated as (=1) strongly disagree, (=2) disagree, (=3) neither agree nor disagree, (=4) agree, or (=5) strongly agree.
Table 3.
Respondents’ green activities.
| Activities: | Mean | SD |
|---|---|---|
| 1. Recycling regularly | 4.40 | 0.162 |
| 2. Usage of energy saving bulbs | 4.56 | 0.911 |
| 3. Being a member of an environmental organization | 1.26 | 0.915 |
| 4. Contributing financially to an environmental organization | 1.61 | 1.172 |
| 5. Using public transportation or riding a bike in the nearby (around 30 km) | 2.75 | 1.635 |
| 6. No littering in public space | 4.58 | 0.969 |
| 7. Expecting daily change of towels in hotels | 3.15 | 1.546 |
Note: values are calculated as (=1) strongly disagree, (=2) disagree, (=3) neither agree or disagree, (=4) agree, (=5) strongly agree.
Table 4.
Respondents’ knowledge about green energy and green electricity tariffs.
| Items: | Mean | SD |
|---|---|---|
| 1. Have you often heard of the use of green technologies for household use | 3.41 | 1.173 |
| 2. Have you informed yourself about the use of green technologies in the household? | 1.40 | 0.507 |
| 3. Have you ever heard of green electricity tariffs? | 1.56 | 0.496 |
| 4. Have you ever informed yourself about the green electricity tariffs? | 1.85 | 0.377 |
| 5. Has your energy supplier offered you green electricity tariffs? | 2.00 | 0.268 |
| 6. Does the advertisement of RES in mass-media inspire you to support green energy? | 1.94 | 0.773 |
Note: for item 1. values are calculated as (=1) never, (=2) rarely, (=3) neither never nor often, (=4) often, (=5) very often; for items 2-6 values are calculated as (=1) yes, (=2) no, (=3) neither yes nor no.
Table 5.
Social influence.
| Items: | Mean | SD |
|---|---|---|
| 1. Most people important to me (family members, friends and colleges) approve using of green energy. | 3.91 | 1.052 |
| 2. Most people important to me would support my decision to use RES in my household (e.g., by installing PV). | 4.13 | 0.879 |
| 3. Most people important to me would support my decision to switch to a green electricity tariff or supplier. | 3.82 | 0.903 |
Note: values are calculated as (=1) strongly disagree, (=2) disagree, (=3) neither agree nor disagree, (=4) agree, or (=5) strongly agree.
Table 6.
Respondents’ satisfaction with the current energy supplier and willingness to switch.
| Items: | Mean | SD |
|---|---|---|
| 1. Are you satisfied with your current energy supplier? | 3.75 | 1.002 |
| 2. Is it difficult to compare the offers from various energy suppliers? | 3.27 | 1.165 |
| 3. If part or whole of the energy supplied would be generated in the RES, would you consider switching to such an energy supplier? | 1.50 | 0.799 |
Note: for Items 1 and 2, values are calculated as as (=1) definitely no, (=2) rather no, (=3) neither yes nor no, (=4) rather yes, or (=5) definitely yes ; for Item 3, values are calculated as (=1) yes, (=2) no, or (=3) neither yes nor no.
Table 7.
Results of statistical tests for an association between chosen factors and respondents’ WTP (N = 502).
Table 7.
Results of statistical tests for an association between chosen factors and respondents’ WTP (N = 502).
| Coefficients: | rho | t-Test |
|---|---|---|
| Age | −0.140 ** | 3.280 ** |
| Income (perceived financial situation of the household) | 0.145 ** | 2.501 * |
| Education | 0.142 ** | 1.459 * |
| Pro-environmental attitudes | 0.301 ** | 7.187 *** |
| Green activities: recycling regularly | 0.126 ** | 2.259 * |
| Social influence | 0.191 ** | 4.762 *** |
| Knowledge and information of green electricity tariffs | 0.131 ** | 2.931 ** |
| Knowledge and information about green energy | 0.139 ** | 3.033 ** |
| Willingness to change energy supplier if energy offered is green | 0.326 ** | 7.701 *** |
Note: *** , ** , * (two-tailed test).
Table 8.
Results of statistical testes for an association between chosen factors and respondents’ willingness to change energy supplier, if the electricity offered is green (N = 502).
Table 8.
Results of statistical testes for an association between chosen factors and respondents’ willingness to change energy supplier, if the electricity offered is green (N = 502).
| Coefficients: | rho | t-Test |
|---|---|---|
| Pro-environmental attitudes | 0.281 ** | 7.105 *** |
| Social influence | 0.236 ** | 5.595 *** |
| Knowledge and information of green electricity tariffs | 0.128 ** | 2.561 ** |
| Knowledge and information about green energy | 0.167 ** | 3.688 *** |
Note: *** , ** , * (two-tailed test).
© 2018 by the author. Licensee MDPI, Basel, Switzerland. This article is an open access article distributed under the terms and conditions of the Creative Commons Attribution (CC BY) license (http://creativecommons.org/licenses/by/4.0/).
Share and Cite
MDPI and ACS Style
Kowalska-Pyzalska, A. An Empirical Analysis of Green Electricity Adoption Among Residential Consumers in Poland. Sustainability 2018, 10, 2281. https://doi.org/10.3390/su10072281
AMA Style
Kowalska-Pyzalska A. An Empirical Analysis of Green Electricity Adoption Among Residential Consumers in Poland. Sustainability. 2018; 10(7):2281. https://doi.org/10.3390/su10072281
Chicago/Turabian StyleKowalska-Pyzalska, Anna. 2018. "An Empirical Analysis of Green Electricity Adoption Among Residential Consumers in Poland" Sustainability 10, no. 7: 2281. https://doi.org/10.3390/su10072281
Note that from the first issue of 2016, this journal uses article numbers instead of page numbers. See further details here.