1. Introduction
Lately, more and more authorities of the countries from the European Union (EU) are concerned about issues regarding the requirements of moving away from an economy driven by fossil fuels, based on a centralized, supply-side approach, relying on old technologies and outdated business models, as it has been emphasized by the European Community Energy Union Package 2015 [
1]. In order to fulfill this requirement, one of the most important steps that need to be taken consists in implementing the advancements in smart grid technologies that enable various options and strategies for consumption optimization in electricity markets. However, there are still barriers for the widespread adoption of smart grid technologies at the EU level, as emphasized by the European Technology and Innovation Platform—Smart Networks for Energy Transition, in the document Final 10-year ETIP SNET R&I Roadmap (2017–26) [
2]. Embracing the same approach, the European Network of Transmission System Operators for Electricity highlights the need to activate the demand as a new source/tool for system operation and to integrate it in the planning and operation stages and market design in ENTSO/E R&I Roadmap 2017–2026 [
3]. In Ireland, the Commission for Energy Regulation (CER), the regulator for the natural gas and electricity sector, has initiated in 2007 the Smart Metering Project within which it has performed rigorous benchmark tests in order to evaluate the performance characteristics of the smart metering devices, analyzing their influence in regard to consumers, energy consumption, tariff schemes and economic aspects in view of implementing these devices at a national level [
4].
Starting from the interested parties in the consumption optimization, different approaches can be envisioned. On one hand, the optimization can lead to minimization of the electricity payment (the consumers’ approach), by shifting their appliances to the cheapest time intervals. On the other hand, it can lead to minimization of the consumption peak (the grid operators’ and suppliers’ approach) that means the peaks are shaved and valleys are filled by uniformly distributing the programmable appliances on top of the fixed consumption. Both approaches require careful analyses and comparisons in order to reach a sustainable power systems development.
From these perspectives, the consumers can be stimulated to change their behavior that leads to higher demand response and electricity consumption reduction. In this respect, the advanced tariff scheme provides incentives for optimal planning of the appliances. In this way, according to the literature, the consumers can save up to 50% of electricity payment due to the fact that off-peak tariff rate can be one third of the peak tariff rate [
5]. Moreover, indirect savings are coming from less grid investments and reduction of losses, therefore achieving a smoother operation of generators that have the possibility to operate closer to their optimum capacity.
From the demand point of view, the electricity supply does not allow interruptions or massive storage, therefore knowing the consumers’ behavior is significant for grid operators, electricity producers and suppliers. The system operator will dispatch the generators so that the demand is optimally supplied by the available generators based on the existing market mechanism. The grid operators will plan the grid capacity based on the consumption requirements, the suppliers will estimate the consumption level at any time and buy or sell on the various electricity markets while the generators will be prepared to produce the necessary energy as to satisfy the demand. Consequently, the predictability of electricity consumption is one of the key factors that influence the sustainable development of power systems.
Moreover, the consumption curve flattening creates the premises for important improvements, by reducing the stress on the generation units and on the entire grid, by diminishing the electricity price, by increasing the potential to achieve an accurate forecast and even by improving the market strategies. The consumption peak has direct impact on grid loading, therefore by shaving the peaks and filling the valleys, the grid will load uniformly during the 24 h of the day and onerous investments in grid infrastructure can be eliminated or at least diminished. Furthermore, by using smart grid technologies, especially smart metering systems and home control applications, the volume of investments in grid facilities can be diminished by reducing the consumption peak and integrating a higher volume of RES distributed generation. Therefore, if the consumption peak is reduced by means of optimization and the electricity is locally generated, then less grid infrastructure will be needed. Consequently, the analyzed issues have been addressed extensively in the scientific literature due to their significant and ever-increasing importance.
For example, the purpose of the study conducted in [
6] consists in developing a solution that is able to manage optimally the battery storage at a large-scale level using a three-layer battery hierarchical control structure by taking into consideration specific control circuits. The authors propose models for the photovoltaics, storage batteries and supercapacitors for developing a distribution network structure that offers the possibility of hierarchical storage. In order to regulate the high and low frequency photovoltaic fluctuations the authors implement a low pass filter. After having performed a series of simulation tests, the authors state that the obtained results confirm the supercapacitor’s and the battery’s control effect. The authors acknowledge the fact that supplementary experiments must be performed in order to check the efficiency of the control when there are considered several distributed storage systems.
In the paper [
7], the authors propose an Energy Scheduling and Distributed Storage (ESDS) algorithm in view of installing it into the smart meter devices that have the capacity to record the detailed Time of Use (TOU) consumption. The proposed algorithm aims to minimize the electricity consumption of the consumer while increasing his satisfaction towards his electricity needs in the same time. In this purpose, the authors have used the ESDS algorithm in three scenarios: in the first scenario they have analyzed the case in which there was not considered the Demand Side Management (DSM), in the second scenario the authors have taken into consideration the DSM without ESDS, while in the third scenario they have considered DSM with ESDS. The authors’ obtained results confirmed that scenario 3 registered the highest level of performance with regard to the energy and financial savings, minimizing the dissatisfaction of consumers during peak periods, reducing the Peak-to-Average-Ratio demand, the sustainability of the energy grid, a series of socio-economic and environmental benefits. In their future work, the authors intend to analyze the possibility to adapt their algorithm so that it can be implemented in the case of large non-household consumers.
Related to the above-mentioned case of large non-household consumers, a study that takes them into account is [
8], a paper in which a part of our research team has developed solutions regarding the hourly forecasting of the energy consumption, situation in which the accurate electricity consumption is extremely important due to the implied costs. The authors have developed several forecasting solutions consisting in a series of artificial neural networks based on the non-linear autoregressive (NAR) model and the non-linear autoregressive with exogenous inputs (NARX) one, trained using the Levenberg-Marquardt, Bayesian Regularization and Scaled Conjugate Gradient algorithms. In the study, the authors have used large datasets recorded by the smart metering devices of the consumer, along with exogenous variables in the case of the NARX model, case in which the authors have built meteorological and time stamp datasets. By means of extensive experimental tests, the authors have identified in each case the best mix between the training algorithm, the number of neurons in the hidden layer and the delay parameter. Based on a series of forecasting scenarios, using specific performance metrics, the developed solutions for the hourly consumption energy prediction have offered a high level of forecasting accuracy, having the potential to become useful tools for both the electricity producers and consumers. The authors consider that the further step of their research consists in refining the study regarding the consumption forecasting up to the individual appliances or devices level.
Paper [
9] describes a method based on a hybrid energy storage system designed to smooth the fluctuating output of a photovoltaic power plant. The Renewable Energy Systems distributed generation (PV) and the hybrid energy storage systems have been modeled in Matlab/Simulink and Piecewise Linear Electrical Circuit Simulation software environment. Using a series of extensive simulations, the authors confirm the effectiveness of their proposed approach for the power control strategy. In [
10], the authors propose a three-layer management system designed to handle the issues raised by large capacity energy storage batteries. The authors discuss the hardware and software implementations of the Battery Management Unit, Battery Cluster Management System and Battery Array Management System, considered as bottom, middle and respectively top layers of the proposed hierarchical management system that is useful in performing a variety of tasks such as: measurement and computation, balance of cells, the safe management of high voltage, data management, the management of the charging and discharging operations, issuing warnings.
The authors of [
11] propose a model for optimizing the operation of a micro-grid, taking into account the distributed generation, the environmental factors as well as the demand response. According to the authors, the main advantages of the devised model consists in cutting down the operational costs at the micro-grid level, without affecting the consumers, therefore creating the premises of consuming clean energy. The authors’ approach consists in employing a genetic algorithm for implementing the objective function and a demand response scheduling strategy. The validation of the model was done on a smart micro-grid from Tianjin. The authors state that the obtained results highlight the strong effect that the distributed generation and the demand response have on the micro- grid operation from the economical point of view. In the paper, there are also analyzed the main factors that impact the optimization results, concluding that the price of the natural gas has the most important influence on the micro-grid’s operation costs and the demand response. The authors conclude that their model has the potential to be implemented in a real production working environment and that they intend to do so in their future researches.
The volatility of the PV output influences to a great extent the stability and the power quality of the PV systems, causing difficulties regarding the grid integration of PV systems. In order to address these issues, the authors of [
12] have developed a control strategy based on energy storage systems in order to attenuate the generation fluctuations of the PV system and the impact of the PV systems to the grid. The active energy flow between the grid and the storage systems is ensured through the usage of bidirectional converters, a battery and ultracapacitors, the direct current constant voltage is maintained using an inverter control strategy, the photovoltaic system is managed as to provide the maximum power. In order to confirm the efficiency of their proposed model, the authors devise a dynamic modeling approach and a simulation study developed using Matlab/Simulink.
In the paper [
13], the authors investigate the feasibility of replacing the autonomous thermal power plants that exist on a small Greek island with distributed energy resources that derive from RES, using also modern storage technologies. This replacement is very important in order to solve many of the problems that electricity autonomous islands have to deal with on a daily basis, for example energy and water shortages. In their study, the authors have chosen as main objectives the minimization of costs, of carbon dioxide emissions and the reliability maximization of the distributed energy resources. In order to conduct the multi-objective analysis, the authors have used a decision support tool, the Distributed Energy Resources Customer Adoption Model, that implements mathematical software designed to find the optimal solutions. After analyzing the obtained results, the authors propose a solution for all the investors that are interested in implementing the proposed approach in the case of other autonomous islands that deal with similar issues. The authors conclude that the development of the distributed energy resources has the potential to bring numerous advantages to the consumers: Energy independence, increased quality of the delivered electricity, stability of the electricity dispatch system along with economic benefits resulting from the local business.
The paper [
14] proposes a reclosing method for distribution systems in the case when the distributed generation and the battery storage system are employed. The system also contains a circuit breaker in the distribution line. The method proposed in this paper is based on a model that uses an electromagnetic transient program. The authors have performed a series of simulations, which reflect the capacities of the distributed generation and the clearance time of the faults. The authors acknowledge that their proposed method has two limitations, the first one being related to the cost and the second one to the type of the distributed generation. As regarding the costs, they represent a limitation of the proposed method because of the circuit breakers and the communication’s electrical installation that both must be installed. The limitation regarding the distributed generation’s type is also worth to be considered, as in their study the authors have taken into account a photovoltaic system, connected through an inverter. If a system that employs a synchronous generator is used instead of this type of distributed generation, then the devised method does not provide satisfactory results. Therefore, the authors state that in a future work they intend to address the above-mentioned limitations of the method by taking into consideration the economic aspects and also the type of the distributed generation.
In the paper [
15], the authors devise a simulation model of a hybrid renewable energy system generation that comprises also an energy storage system, targeting several households that have an annual electricity demand of 30 MWh. The authors state that the obtained results reveal that an energy storage system comprising a 9 kW PV array, an 8 kW wind turbine, a 2 kW water turbine as well as a 256 kWh storage capacity for the energy storage system can be a sustainable and reliable energy source, covering the needs of entire families. After having performed the simulations, the authors acknowledge that the households still have to be connected to the electricity grid taking into consideration the irregular intervals of occurrences that characterize the energy sources of the system, otherwise there is a risk of energy surpluses if the system is oversized or a risk of having an energy deficit. The authors also acknowledge the fact that achieving a proper sizing of the energy storage system as to cover appropriately the seasonal and diurnal patterns of electricity generation and demand is a complex task and emphasize that the model can be improved in the future if one takes into consideration the economic and environmental aspects of the hybrid energy sources.
The authors of [
16] develop a multi-sensor system for a smart home environment by incorporating technology from wearables along with artificial intelligence positioning algorithms and multiple sensors for data fusion. The developed system allows one to operate household appliances remotely, allows the smart home environment to be aware of the residents’ indoor position and the environment of each living space to be monitored in order to assure automated household appliance control, enhance home security and ultimately achieve a smart energy management. The authors state that the experimental results depicted an accuracy for the 3D gesture recognition algorithm in view of operating remotely the appliances ranging from 87.7% to 92.0% while for the positioning within the building and the smart energy management, the accuracy concerning the distance and the positioning was around 0.22% and 3.36% of the total distance that was traveled indoors. The authors stated that they intend in future studies to reduce the size of the wearable sensor as to increase the comfort level for the residents and make use of multiple positioning methods, like WiFi and Beacon systems to refine the accuracy of positioning along with developing a more practical and user-friendly monitoring interface on a smartphone device.
Another study that tackles issues regarding the smart homes and the household appliances is [
17], where a part of our research team has developed and applied a method for the accurate forecasting of the residential consumption of electricity up to the appliance level. The authors have used data recorded by the sensors of the smart homes from residential area, characterized by the fact that they are equipped with solar panels able to sustain a part of the consumed energy. The main difficulties and limitations in developing this research consisted in the fact that historical meteorological data were not available and even if they had been, they would have imposed supplementary costs, as in the future the beneficiary of the forecast had to acquire from time to time accurate forecasts for a short-term horizon from a meteorological institute. In order to overcome all these limitations, the authors have developed an approach based on a mix of non-linear autoregressive with exogenous inputs artificial neural networks and function fitting neural networks. The method represents a useful tool to the contractors and it also has the potential to be incorporated in a cloud solution, in order to be offered as a service to both the operators and the consumers, for a monthly fee. As regarding future work, the authors consider that their method could be refined by taking into consideration the energy class of the appliances, the number, structure and behavioral patterns of the households’ inhabitants, by using future versions of the development environment and by improving the retraining process.
In [
18], the authors develop an approach based on game theory in order to achieve an appropriate balancing electricity consumption within clustered wireless sensor networks. In the approach, the authors have modified the payoff function by including a penalty system within it in order for the nodes that contain a higher amount of energy to be able to strive more vigorously for the cluster head. The authors state that they have employed convex optimization techniques in order to achieve for the clustering game the Nash equilibrium strategy. Due to the devised strategy, the authors made sure that every sensor node has the possibility to attain the highest possible payoff when the decision is taken. After having performed numerous simulations, the authors conclude that their developed approach achieves a good performance concerning the energy balance, therefore extending the lifetime of the network to a great extent. The authors state that in the future they intend to approach issues regarding the multi-hop clustered wireless sensor networks, the cluster head selection in energy harvesting wireless sensor networks and finally to tackle the security issues that arise in clusters that are based on wireless sensor networks.
The authors of [
19] conduct a study that has as a main goal to assess the benefits that can be obtained after having peak shaved the demand response considering in their study different storage devices such as capacitors, magnetic storage, different types of batteries, flywheel, compressed air and pumped hydro. In order to generate randomly the electricity demand profiles at the appliance level for a typical household from the United States, the authors employed an agent-based stochastic model. The authors used the total-energy-throughput lifetime in order to introduce a storage cost model on several levels and afterwards they have tried to optimize both the electricity storage capacity and the limit concerning the demand by devising a strategy that dispatches the stored energy appropriately. The authors found out that the storage devices bring benefits, the annual profit of the demand response mechanism varying from 1 to 39% when compared to the previous period. The authors acknowledge that in the future an even higher profit rate can be obtained if one incorporates in the dispatch strategy weather forecasting aspects.
In the paper [
20], the authors analyze a solution based on a battery energy storage system designed to shave the energy peaks and smooth the load curve, therefore improving the operation of a power system located in Hawaii, in the island of Maui. As the distribution circuit is mainly based on the photovoltaic generation, a series of issues regarding the renewable energy integration are posed to the operator of the power system, principally due to the transmission system. In order to approach this issue, the authors have proposed two methods for obtaining the load forecasting that is mandatory in order to employ safely at its maximum capacity the battery energy storage system and to achieve the shaving of the energy peaks and the smoothing of the load curve. The first method is based on a nonlinear programming technique, while the second one employs a control strategy in real time that offers the possibility to achieve simultaneously the two proposed targets (shaving of the energy peaks and smoothing of the load curve). In order to confirm the usefulness and accuracy of their forecasting methods, the authors benchmark their methods using a real case study, comprising data collected for 108 days.
In [
21], the authors propose an energy management system for residential consumers, taking into account in the same time the energy that has been consumed and the one that has been generated. The system is based on the electricity price that motivates the consumers to reschedule their appliances so that to benefit from the price variation. The approach is analyzed considering a smart home with modern appliances, micro wind power plant, PV and batteries as storage device for a period covering 24 h. The authors have used a series of scenarios in order to evaluate their proposed model and afterwards they have analyzed and compared the obtained results, highlighting situations in which a consumer has to buy, use, store or even sell the available amount of electricity, therefore obtaining an improved efficiency and economic benefits. Based on the obtained results, the authors state that the scheduling of the electrically controllable appliances, thermostatically controllable appliances and optically controllable appliances can be done in the same time, therefore obtaining a viable solution for the management of residential electricity usage.
The authors of [
22] propose an optimization model for residential consumption by shaving the peaks and filling the gaps of the load curve. The authors state that the developed method is useful in reducing the production cost of the energy at peak hours and in increasing the income at off-peak hours. For this purpose, the demand response program is based on rewards for load control. Therefore, the authors implemented a credit function within their model to influence the consumption level and provide incentives to consumers as to attain the desired load curve. After having performed simulations, the authors state that the best approach to reduce the electricity costs is to use the appliances that consume the highest amount of electricity only during the dawn, the midday or the night. The authors consider that if their method would be accepted and enforced by policy makers at the global level, one would achieve clean energy generation. In their future work, the authors intend to adjust the model as to use a multi-objective non-linear approach, to optimize the parameters of the utility function as to be related to the focus of the objective one.
An extensive literature review related to consumption peak shaving is proposed in [
23] analyzing the effect of the following strategies for peak load shaving: Integration of energy storage systems, integration of electric vehicles to grid, demand side management. The paper analyzes in each of the three cases, the possible benefits brought by the peak shaving to both the supplier and the consumer, the main challenges that must be overcome, the future research directions that have to be approached in view of achieving a proper peak load shaving, the main technologies used for energy storage in the purpose of peak shaving, the operation of the energy storage systems, their management and appropriate sizing, the methods for peak shaving in the case of electric vehicles. As a limitation of their paper, the authors mention the fact that they have not analyzed in detail the aspect of using a mix of multiple RES when performing the peak shaving.
Taking into account the ever-growing importance of the consumption optimization process, our paper aims to reveal the effect of the PV and SD on the load curve, emphasizing the impact on consumption peak and electricity payment. Consequently, we develop a set of sensors based on Arduino for monitoring and controlling household appliances and analyze the simulation results of two optimization approaches with different objective functions that provide significant insights on PV and SD benefits.
This paper is structured in four sections. In the current section, the importance of consumption curve flattening, a series of related works and the structure of the paper are presented. In the second section, we propose an optimization method and design the required architecture for its implementation, describe the appliances considered in the optimization process and describe the objective functions implemented in Matlab R2016a by means of intlinprog and fminimax functions. The consumer preferences are configured in terms of hourly and daily consumption of each appliance. Also, we formalize de optimization problem, by setting the variables, constraints and objective functions: consumption peak minimization and electricity payment minimization. In the third section several simulations have been performed underlying the two optimization approaches, using six three-level ToU tariffs. Also, intlinprog and fminimax functions are also compared in terms of optimization results and we analyze the effect of the PV and SD on the consumption curve; both the consumption peak and electricity payment decreased. In section four, the main conclusions based on the simulation findings are presented. However, our approach has several limitations and policy implications that are also presented in the conclusion section.
2. Method and Objective Functions
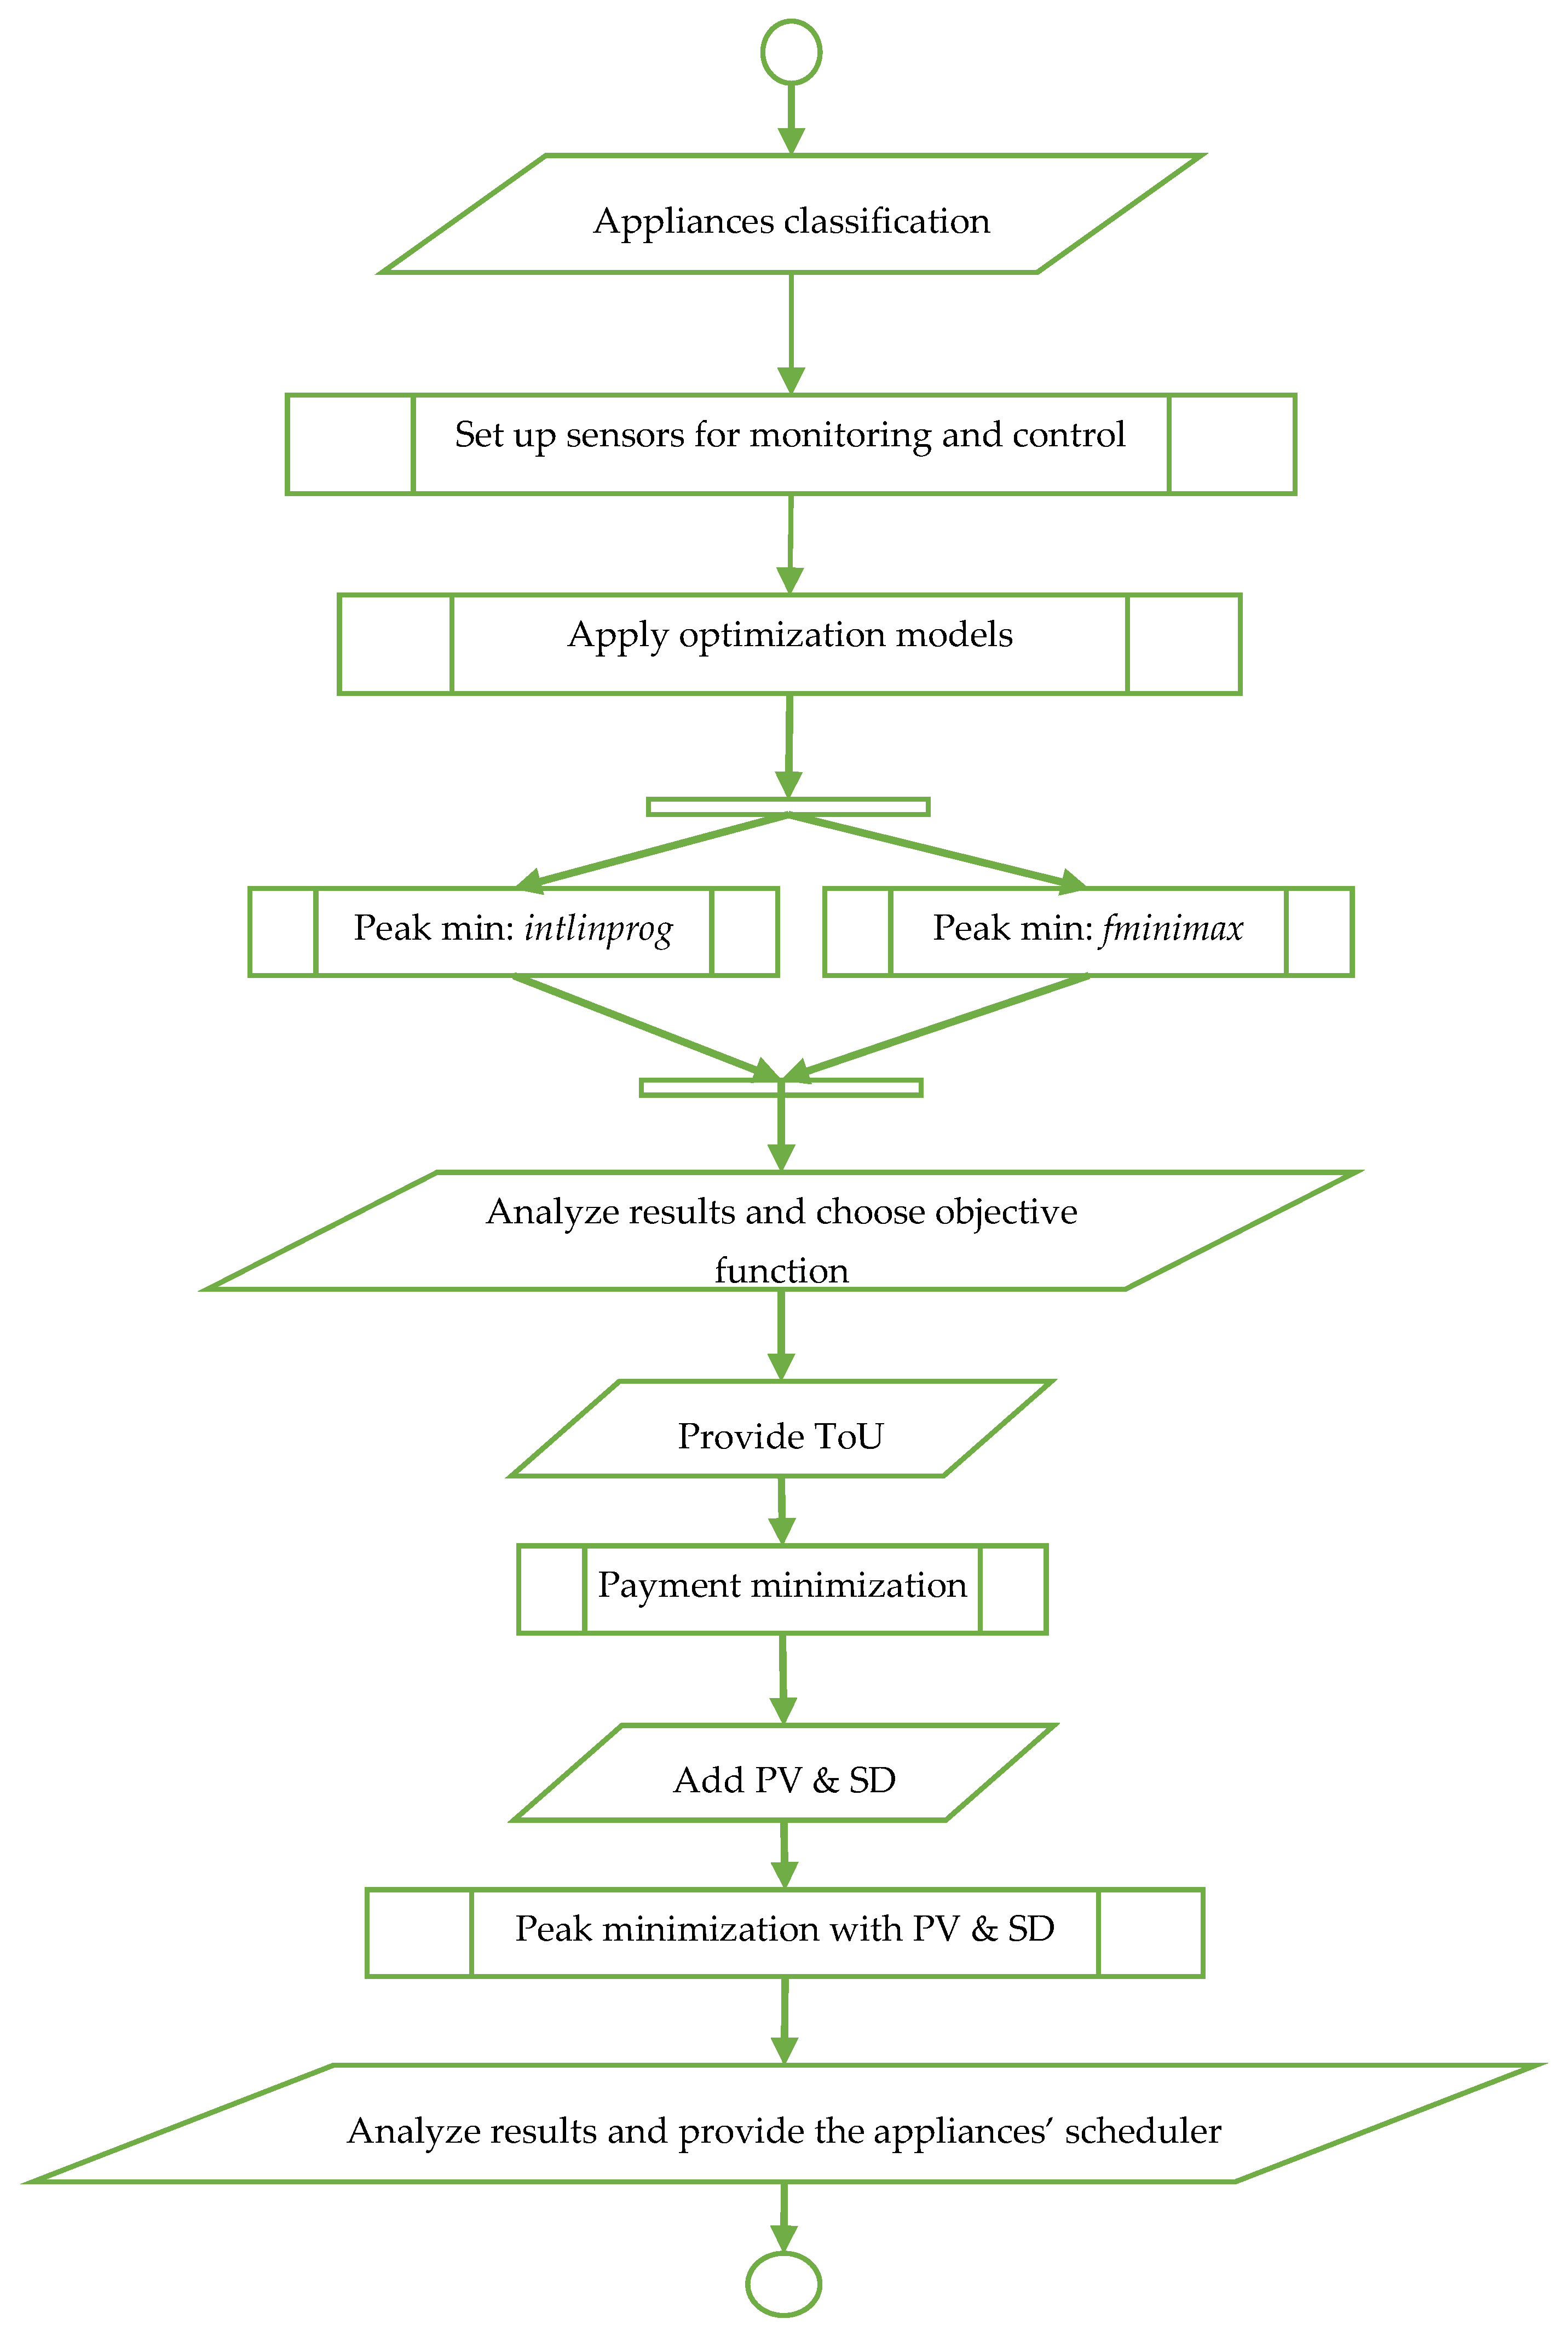
Our optimization method aims to provide an efficient solution for minimization the consumption peak and payment by integrating the PV and SD. The method consists in several steps that allow us to configure the appliances, to set up the sensors for monitoring and controlling their operation, perform consumption peak minimization and payment minimization with two optimization functions (
intlinprog and
fminimax implemented in Matlab), compare the results and choose the best option in terms of objective function. Then, peak minimization is performed with
intlinprog, adding PV and SD to analyze their effect on the consumption curve. These steps are briefly illustrated in
Figure 1.
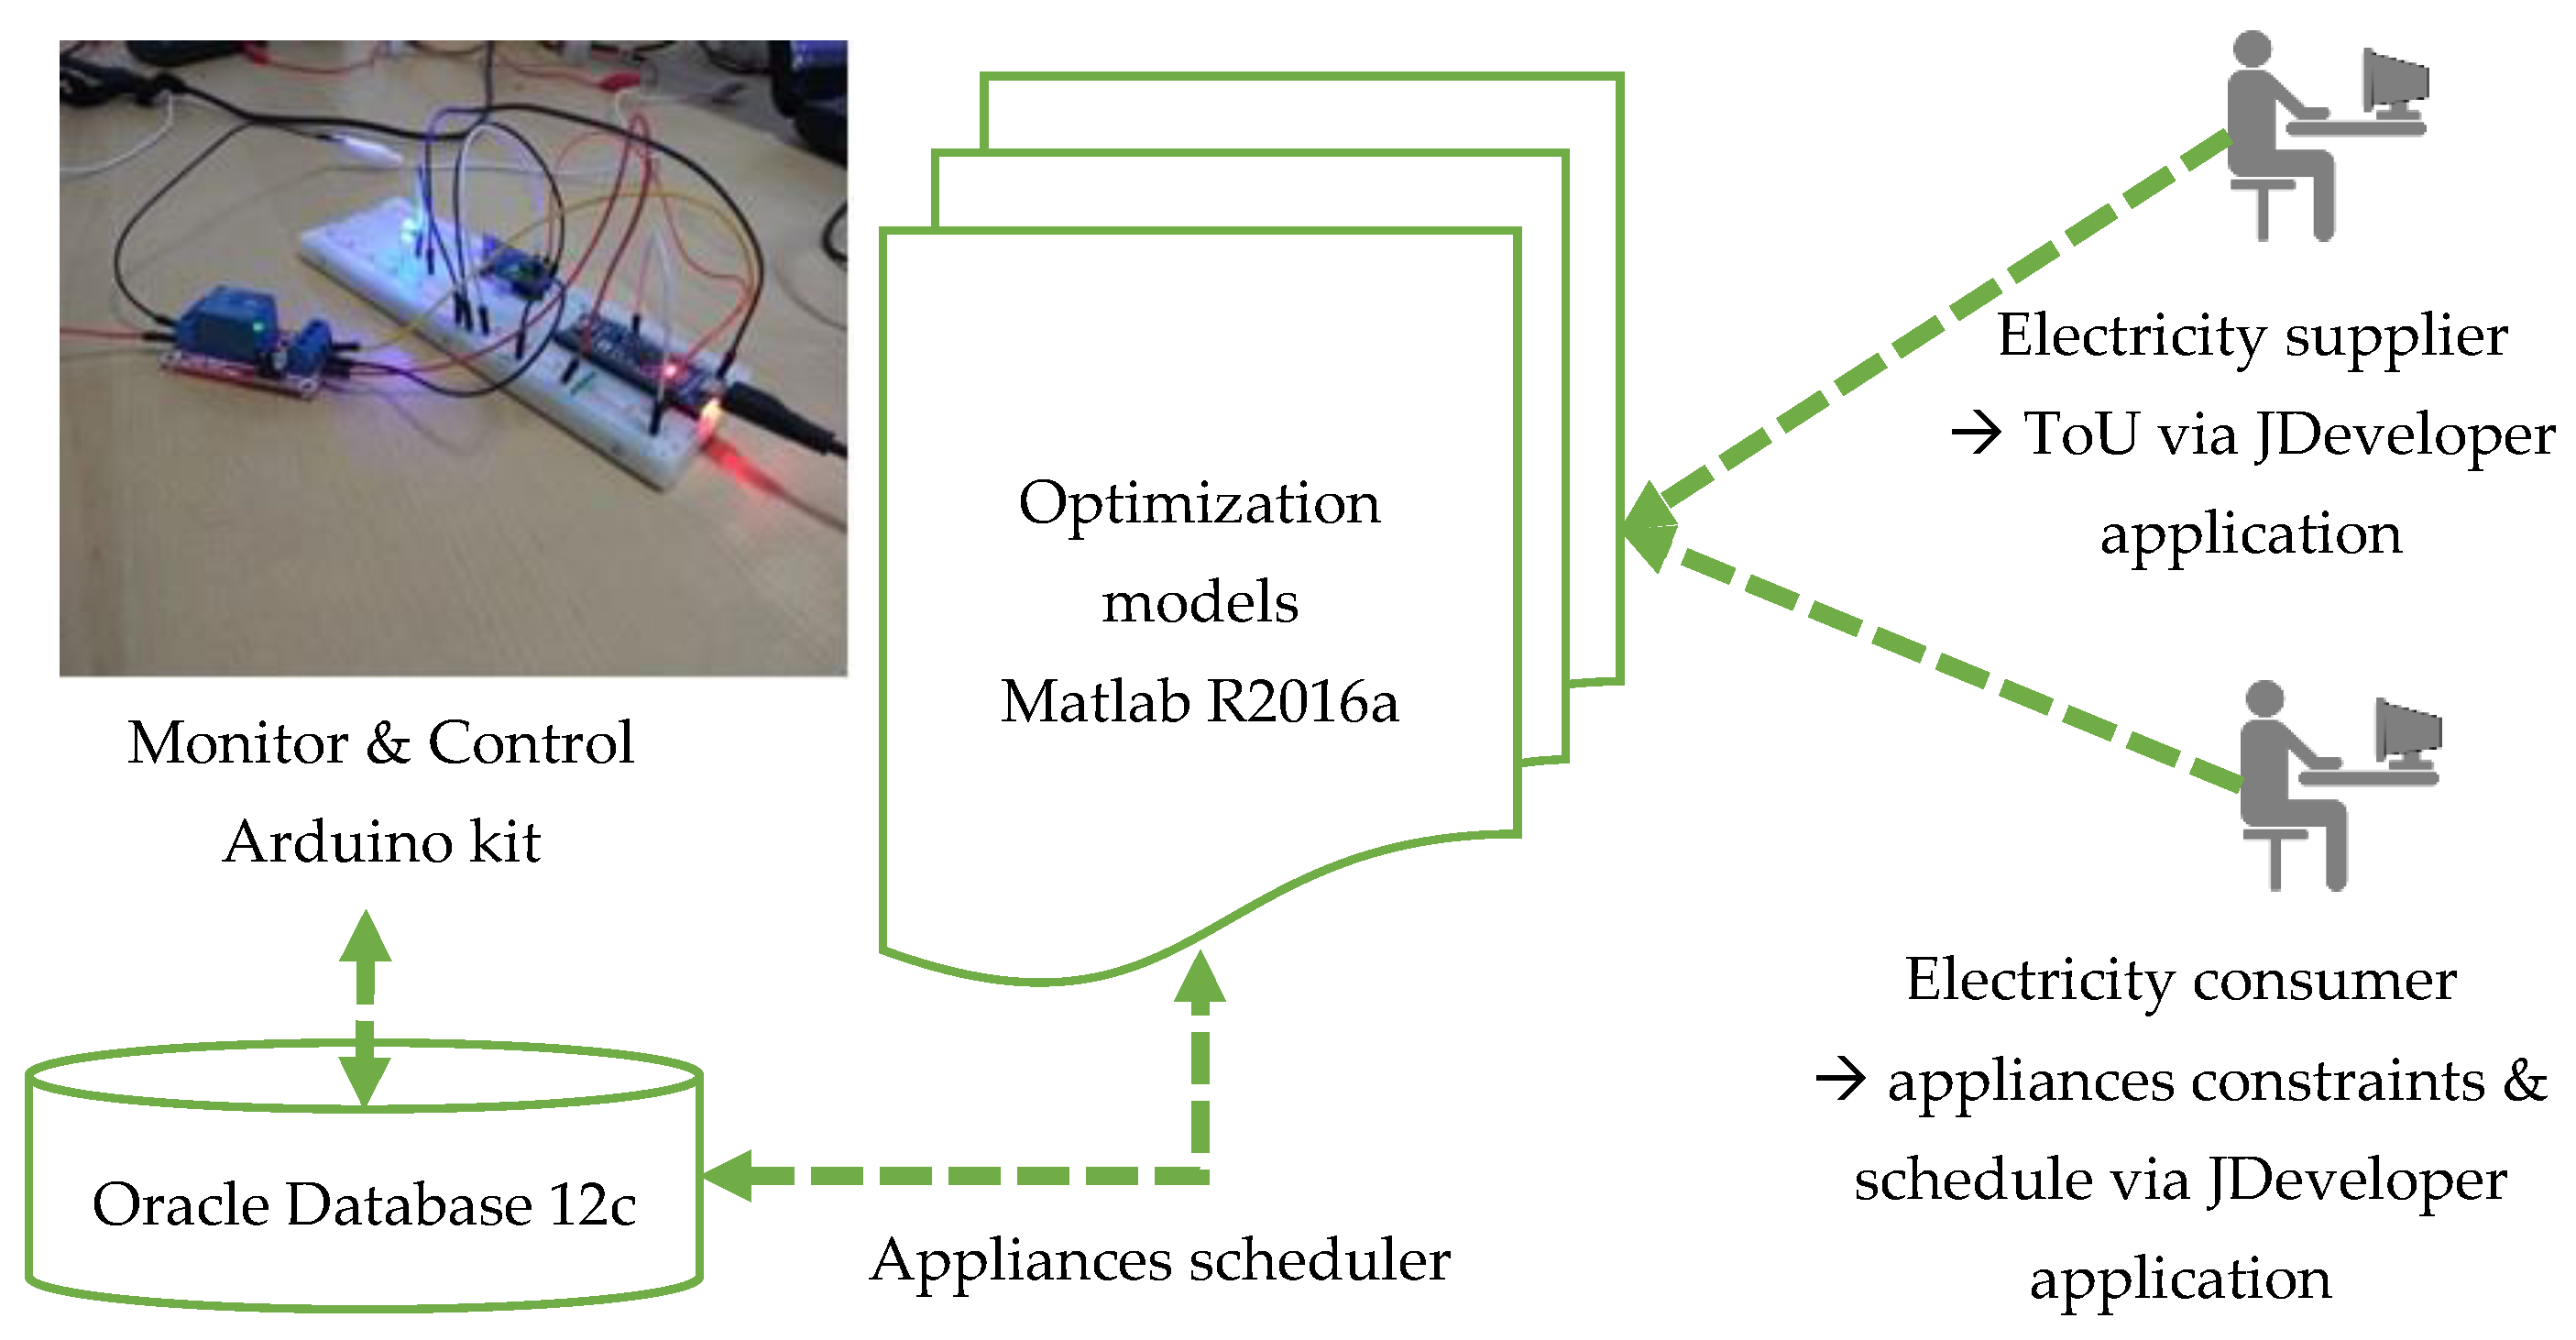
The method is implemented on an architecture that consists in: Arduino-based sensors for monitoring and controlling the appliances; a relational database running Oracle Database 12c for storing the appliances consumption data, electricity tariffs and the scheduler for each programmable appliance that provides the start and operation interval based on the optimization results; a set of optimization models developed in Matlab R2016a based on two functions:
intlinprog and
fminimax. The electricity supplier provides ToU tariff, while the consumers provide appliances constraints and desired operational schedule via portal developed in JDeveloper. The architecture is presented in
Figure 2.
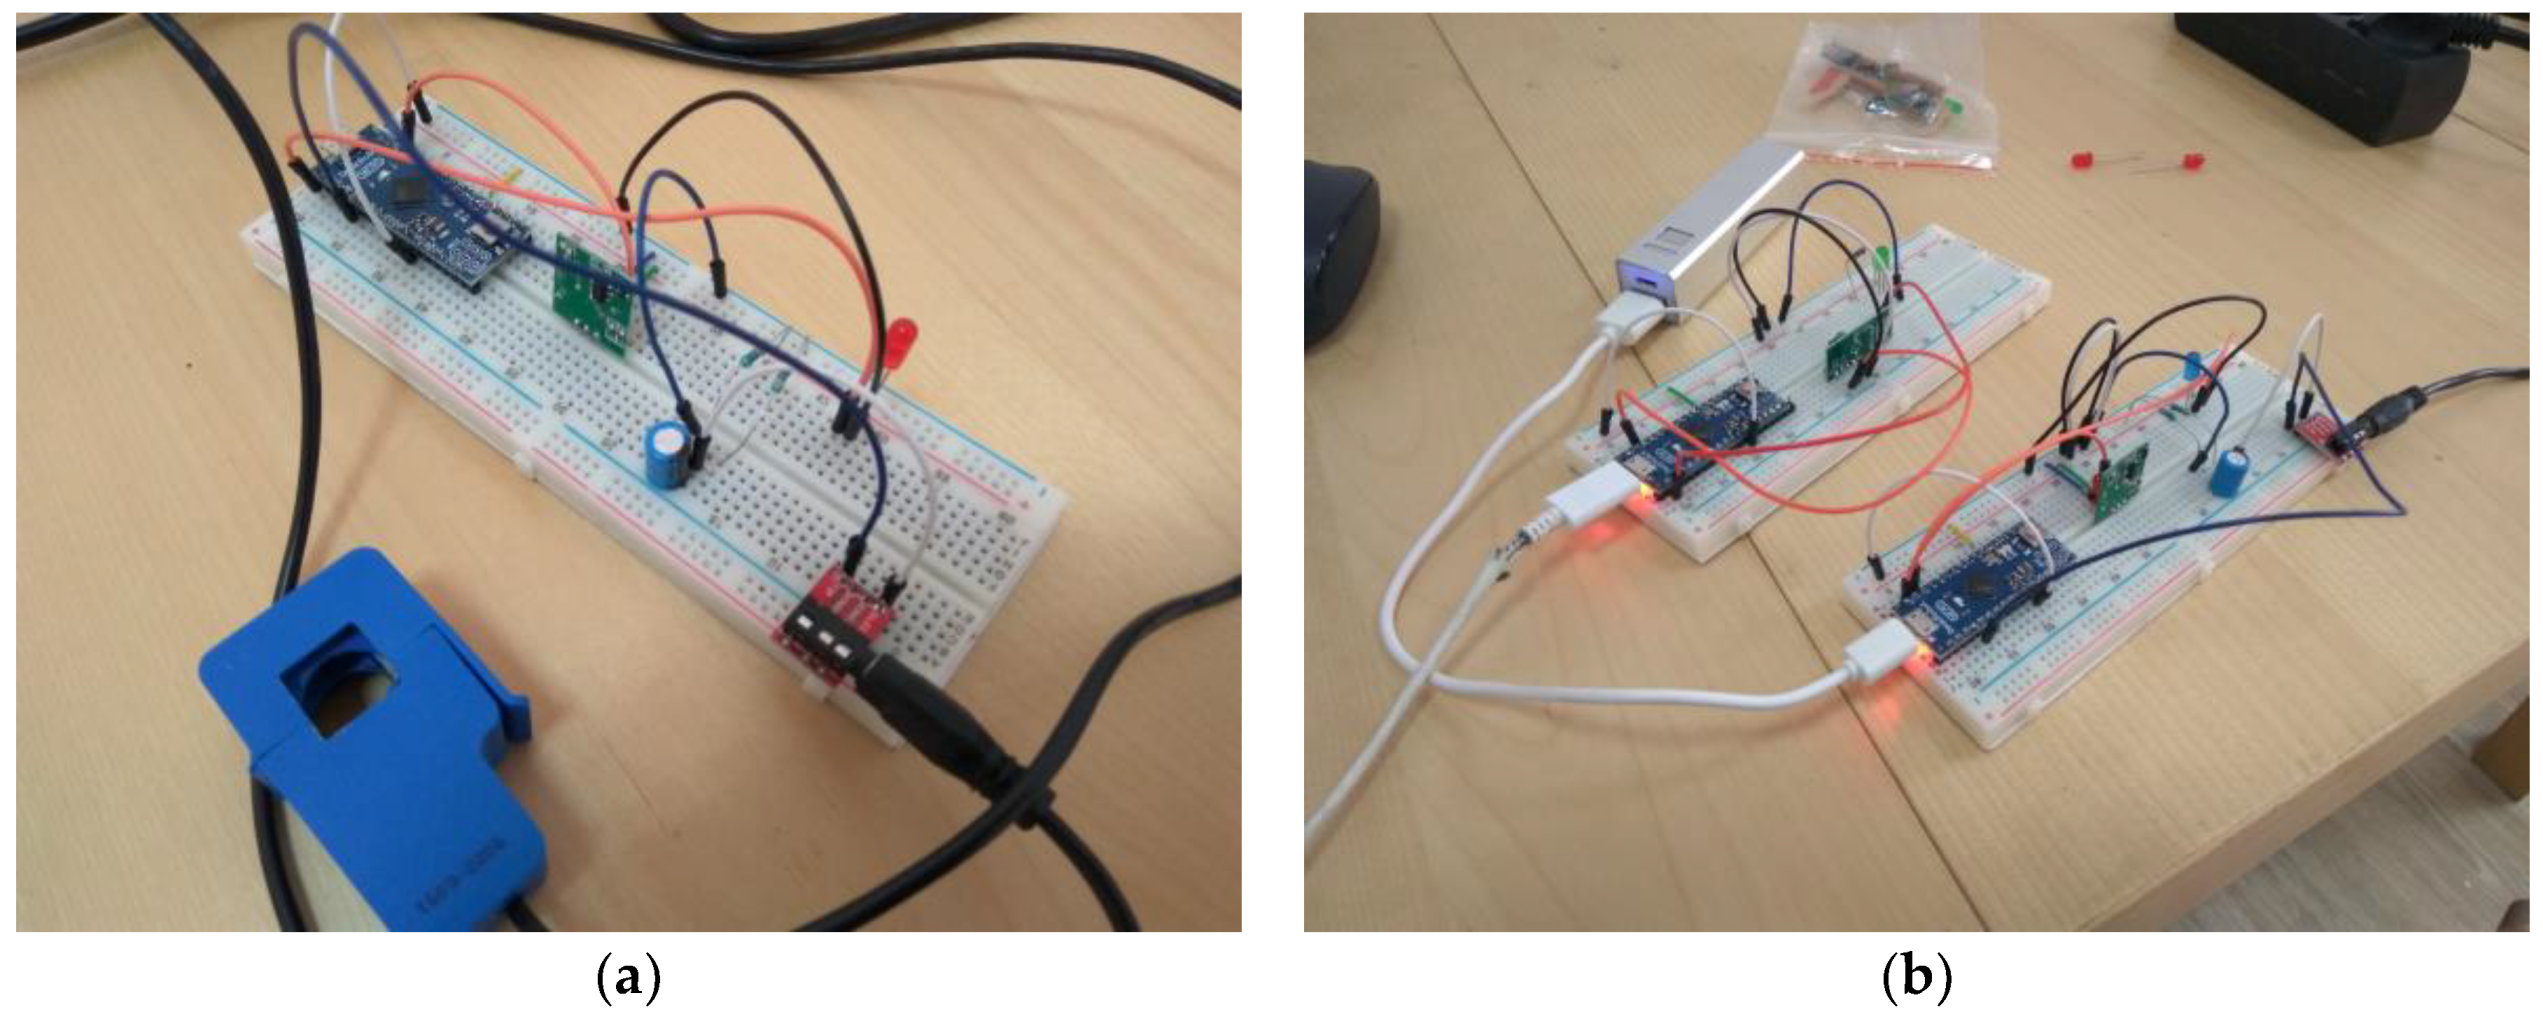
The controlling and surveillance solution of the appliances has components for collecting and receiving data among appliances and the gateway with two parts: Transmitter and receiver. For transmitter, Micro Arduino with ATmega32U4 microcontroller with 20 digital pins was used for I/O. It has an automatic voltage regulator, an oscillator, a micro USB connector, a serial circuit programming/an In-Circuit Serial Programming.
An YHDC SCT-013 current transformer based on AC current sensor of 100A max was connected to Micro Arduino for measuring the electricity consumption of the appliance (for instance a desk lamp). Against overloading, 1 × 220 μF capacitor and 2 × 330 Ohm resistors are also connected. In the emergency cases, the Micro Arduino is energized by a battery with a capacity of 3000 mAh that is connected to the micro USB charger. For controlling the consumption of the appliances, a relay with optocoupler is also connected to Micro Arduino.
A transmitter-controlling device with relay is set up for each programmable appliance and a transmitter-monitoring device for each non-programmable appliance. The receiver consists in Raspberry Pi that communicates with the transmitter component via a RF 433 MHz transmitter-receiver module. The transmitter-receiver components shown in
Figure 3 are managed through a Node.js application that passes the data inserting the records into an Oracle Database.
An ETL process is used for extracting (E), loading (L) and transforming (T) the input into valid data. The process is implemented in Oracle PLSQL language and consists is several procedures and functions that allow data validation and transformation. Data measured at one-minute intervals by AC current sensors is validated first using ETL subroutines to check data consistency and replace missing values with average neighboring values. Then data is aggregated at hourly interval and loaded into the Oracle Database tables for further evaluation and processing.
In
Section 2.1 the appliances are classified and in
Section 2.2 the objective functions are described in terms of variables and models.
2.1. Appliances Description and Classification
The appliances can be classified based on their operation mode in relation with the electricity consumers’ interaction. From this point of view, three appliances categories are identified:
- –
Background appliances are always or periodically in operation without notably intervention from consumers side (i.e., refrigerator, house monitoring system);
- –
Active appliances require the presence of the consumers (i.e., vacuum, electric grill);
- –
Passive appliances are started by consumers, but operate without assistance (i.e., washing machine, bread oven).
Starting from this classification, some appliances such as: refrigerator, lighting cannot be programmed due to the fact that the comfort of the consumer would be prejudiced. However, the operation of other (programmable) appliances can be shifted to operate at lower tariff rate without any comfort prejudice. Some programmable appliances can be interrupted, while others are uninterruptible due to their intrinsic characteristics. Thus, for simulations, all types of appliances that belong to regular residential consumers are taken into account. Therefore, adding, modifying or eliminating an appliance should be an easy task. Describing each appliance in terms of operation mode is essential in order to define the optimization problem.
For simulations performed in Matlab R2016a, we considered twelve modern appliances such as: Oven, heating, refrigerator, water heating, car battery, TV and speakers, washing machine, dish washer, electric hob, lighting, vacuum and bread oven.
The operation period, hourly and daily consumption are required for setting the optimization problem in terms of operation constraints, limits also known as lower/upper bounds and linear equations. In
Table 1, operational mode of the twelve appliances in terms of operation time interval, hourly and daily consumption requirements is described.
The electricity consumers/prosumers become more and more involved in consumption optimization increasing the usage of the PV and SD due to their benefits in cutting-off the electricity bills. At off-peak/peak hours, SD can storage/supply the energy generated by PV, aiming to reduce both the consumption peak and electricity payment.
The usage of batteries as SD are the most appropriate energy storage form at the consumers’ level (also known as distributed storage), but the main problem consists in the efficiency of the successive charging/discharging due to the fact that it may vary between 50% and 90%.
Also, the price for 1 kWh storage varies between 100 and 1050 Euro; the lifetime of the SD varies from 103 to 104 charging/discharging cycles. The efficiency of SD may vary between 72% and 100% based on the SD type; the lifetime may also vary between 200 and 104 charging/discharging cycles.
Therefore, it is difficult to estimate the feasibility investment in SD. However, this goal is beyond our scope that is to analyze the influence of PV and SD on the consumption curve.
Modeling PV takes into account the operating characteristics that are specific for solar-irradiance based technology. Therefore, since PV generate depending of solar irradiance intensity, they have been considered to generate gradually between 6 a.m. and 7 p.m., the correlation coefficient between the solar irradiance and PV output varying between 96 and 99%.
Starting from the consumption requirements of the appliances, characteristics of PV, SD and electricity consumers’ preferences, in
Section 4 we performed several simulations in Matlab R2016a.
2.2. Objective Functions
Our method consists in two optimization approaches: minimization of the consumption peak (suppliers, grid operators approach) and minimization of the electricity payment (consumers approach). For these approaches, we provide the variables of the model and use two optimization functions implemented in Matlab R2016a: intlinprog and fminimax.
The consumption of all home appliances (
HA) for an hour
h, should be less or equal to the objective function
that is first to minimize the peak accumulated hourly consumption (suppliers and grid operators approach).
where:
—consumption of all home appliances (
HA) for an hour
h;
—consumption of appliance a at hour h;
—objective function.
The sum of hourly consumption of an appliance
a represents the total daily consumption for
a. Regardless the hourly operation schedule of an appliance
a, its daily consumption remains the same.
where
—total daily consumption for appliance
a.
The total consumer’s daily consumption
is the sum of the daily consumption of each appliance
a. It remains constant after consumption optimization is implemented.
Considering the different types of appliances (nonprogrammable np, programmable with interruption pi and programmable without interruption pwi, ), we need to define the requirements for individual appliances and user preferences as supplementary constraints that are part of the optimization problem.
For a non-programmable appliance
np with fixed operation requirements given by the consumer’s preferences or intrinsic characteristics of the appliance, the consumption scheduling is fixed to a certain time interval considering that hourly consumption cannot be shifted:
Fixing the operation limits of np appliances can be done by setting the upper and lower bounds. In this case, the consumer indicates the hourly consumption usually by setting the upper and lower bounds to the same value, imposing fixed consumption.
For a programmable appliance with interruption
pi, the consumer predefines a certain consumption schedule intervals that can be written as a vector, where only the starting time can be optimized.
Therefore, all possible operating combinations form a matrix that shows the programmable options of appliance
pi.Another vector is also defined by consumer in order to indicate possible starting time
ST (in or not in operation) for appliance
pi.
where the sum of starting time for 24 h is equal to 1 multiplied by the number of operation times
t per day, considering that the appliance is in operation at least once a day. Thus, in case the appliance operates only once a day, then
t = 1.
The consumption of appliance
pi can be obtained by multiplying the matrix of all possible operating combinations
by vector
.
For a programmable appliance without interruption
pwi, we split their operation into distinct parts or tasks, such as:
. For instance, in case of washing machine, we may assume that first operation part is related to washing, while second part to rinsing and third part to drying. Therefore, the daily consumption
of each appliance
pwi is the sum of its parts:
After the division of
pwi operation into distinct parts, each part of programmable appliance without interruption becomes a programmable appliance with interruption
pi with its hourly consumption requirement. Therefore, the consumption of part
pj of an appliance
pwi is:
where
—matrix of all possible operation combination of part
pj;
—starting time of part pj.
Similar to (8), sum of starting time of each part
pj for a certain hour
h is equal to
t.
However, the starting time of all parts
pj should be less than or equal to 1 in order to ensure consecutive operation of the different parts of the same appliance that cannot be interrupted.
Second, the objective function is to minimize the electricity payment (consumers’ approach). In this case, the objective function
is:
where
—time of use tariff vector.
Storage device is considered either as consumer or generator; its operation constraints are described in the following equations:
where
and
represent the output of SD at
t and
t + 1;
is the loss ratio;
is charging power of SD, is discharging power of SD;
is the maximum charging capacity, is the maximum discharging capacity;
and represent the minimum and maximum output of SD;
and represent the charging and discharging efficiency of the SD.
To avoid simultaneous charging/discharging, the following constraints have been added:
When considering PV and SD into the objective function, Equations (1) and (14) become:
where
represents the output of PV at hour h;
represents the output of SD at hour h;
—time of use tariff vector.
The electricity consumption optimization is a
Mixed Integer Linear Programming (MILP) problem being defined by: variables, objective function, lower/upper bounds and other constraints in terms of equations. MILP restricts the relaxed solution of the linear programming problem due to the fact that part of variables should be integers. To solve the linear programming problem, we use
intlinprog optimization function that can be modeled as:
where:
is hourly consumption of all appliances;
is the hourly consumption multiplied by ToU tariff hourly rates;
linear inequalities system. A—k × n matrix; k—number of inequalities; n—number of variables; b—k length vector;
linear equations system. Aeq—m × n matrix; m—number of equations; n—number of variables; beq—m length vector;
each element of vector should be higher than a lower bond (lb) and lower than an upper bound (ub).
For building the optimization model, we follow the steps: Identifying variables, setting the objective function, formulation of lower and upper bonds and definition of linear equations and inequalities systems. The intlinprog function requires the objective function modeling, setting the integer variables, bounds and constraints: f, intcon, A, Aeq, b, beq, ub, lb.
% intlinprog function call
[x,fval,exitflag,output] = intlinprog(f,intcon,A,b,Aeq,beq,lb,ub)
The advantage of this function is that it allows the imposing of some integer variables that characterize the electricity consumption.
The second optimization function is
fminimax that is based on reaching the goal, considering it as daily average consumption. The problem of reaching the goal considering the minimization of the maximum variable can be formulated as:
3. Appliances Modeling and Optimization Results
First approach is to minimize the consumption peak. At first sight, it may be unattractive for consumers, but on long term it can sustainably reduce the electricity consumption payment due to the fact that by flattening the load curve overloading of the grids can be avoided. Second approach is to minimize the electricity payment that will significantly modify the load curve, but not in the flattening way due to the fact that most of the consumers will change their behavior by consuming when tariff rates are lower. Therefore, it may lead to new peaks that impose the need for a new tariff scheme in a chain reaction. After the new tariffs will be in force, the consumers again will tend to shift their appliances to operate at lower rates leading to other peaks that can be overcome only by new tariff schemes [
24,
25] that should discourage the consumption at peak hours.
For estimation of the payment, regardless the objective functions, we have considered a set of six three-level times of use (ToU) tariffs as in
Figure 4. They encourage the consumption during night when the hourly rates are lower than the rates applied during the day. The implemented ToU tariffs ToU_B, ToU_C, ToU_D, and ToU_E are considered as in Irish Social Science Data Archive [
4], while ToU_A and ToU_F are proposed by the authors considering the same rate structure as in [
4] for testing purposes. ToU_A has similar rates without significant differences among rates, characterized by mildest slopes, while ToU_F has the highest differences between peak and off-peak rates, with sharp slopes. Tariffs, that represent a vector of 24 values that correspond to the 24 h, can be easily replaced with a more advanced tariff systems such as multiple-level ToU tariff, critical peak pricing tariff that is also based on different daily ToU tariffs or real-time tariff. The peak hours from the 1–24 h of the time intervals, 18 and 19 are the most expensive ones, while between 24–8, the electricity rate is less expensive.
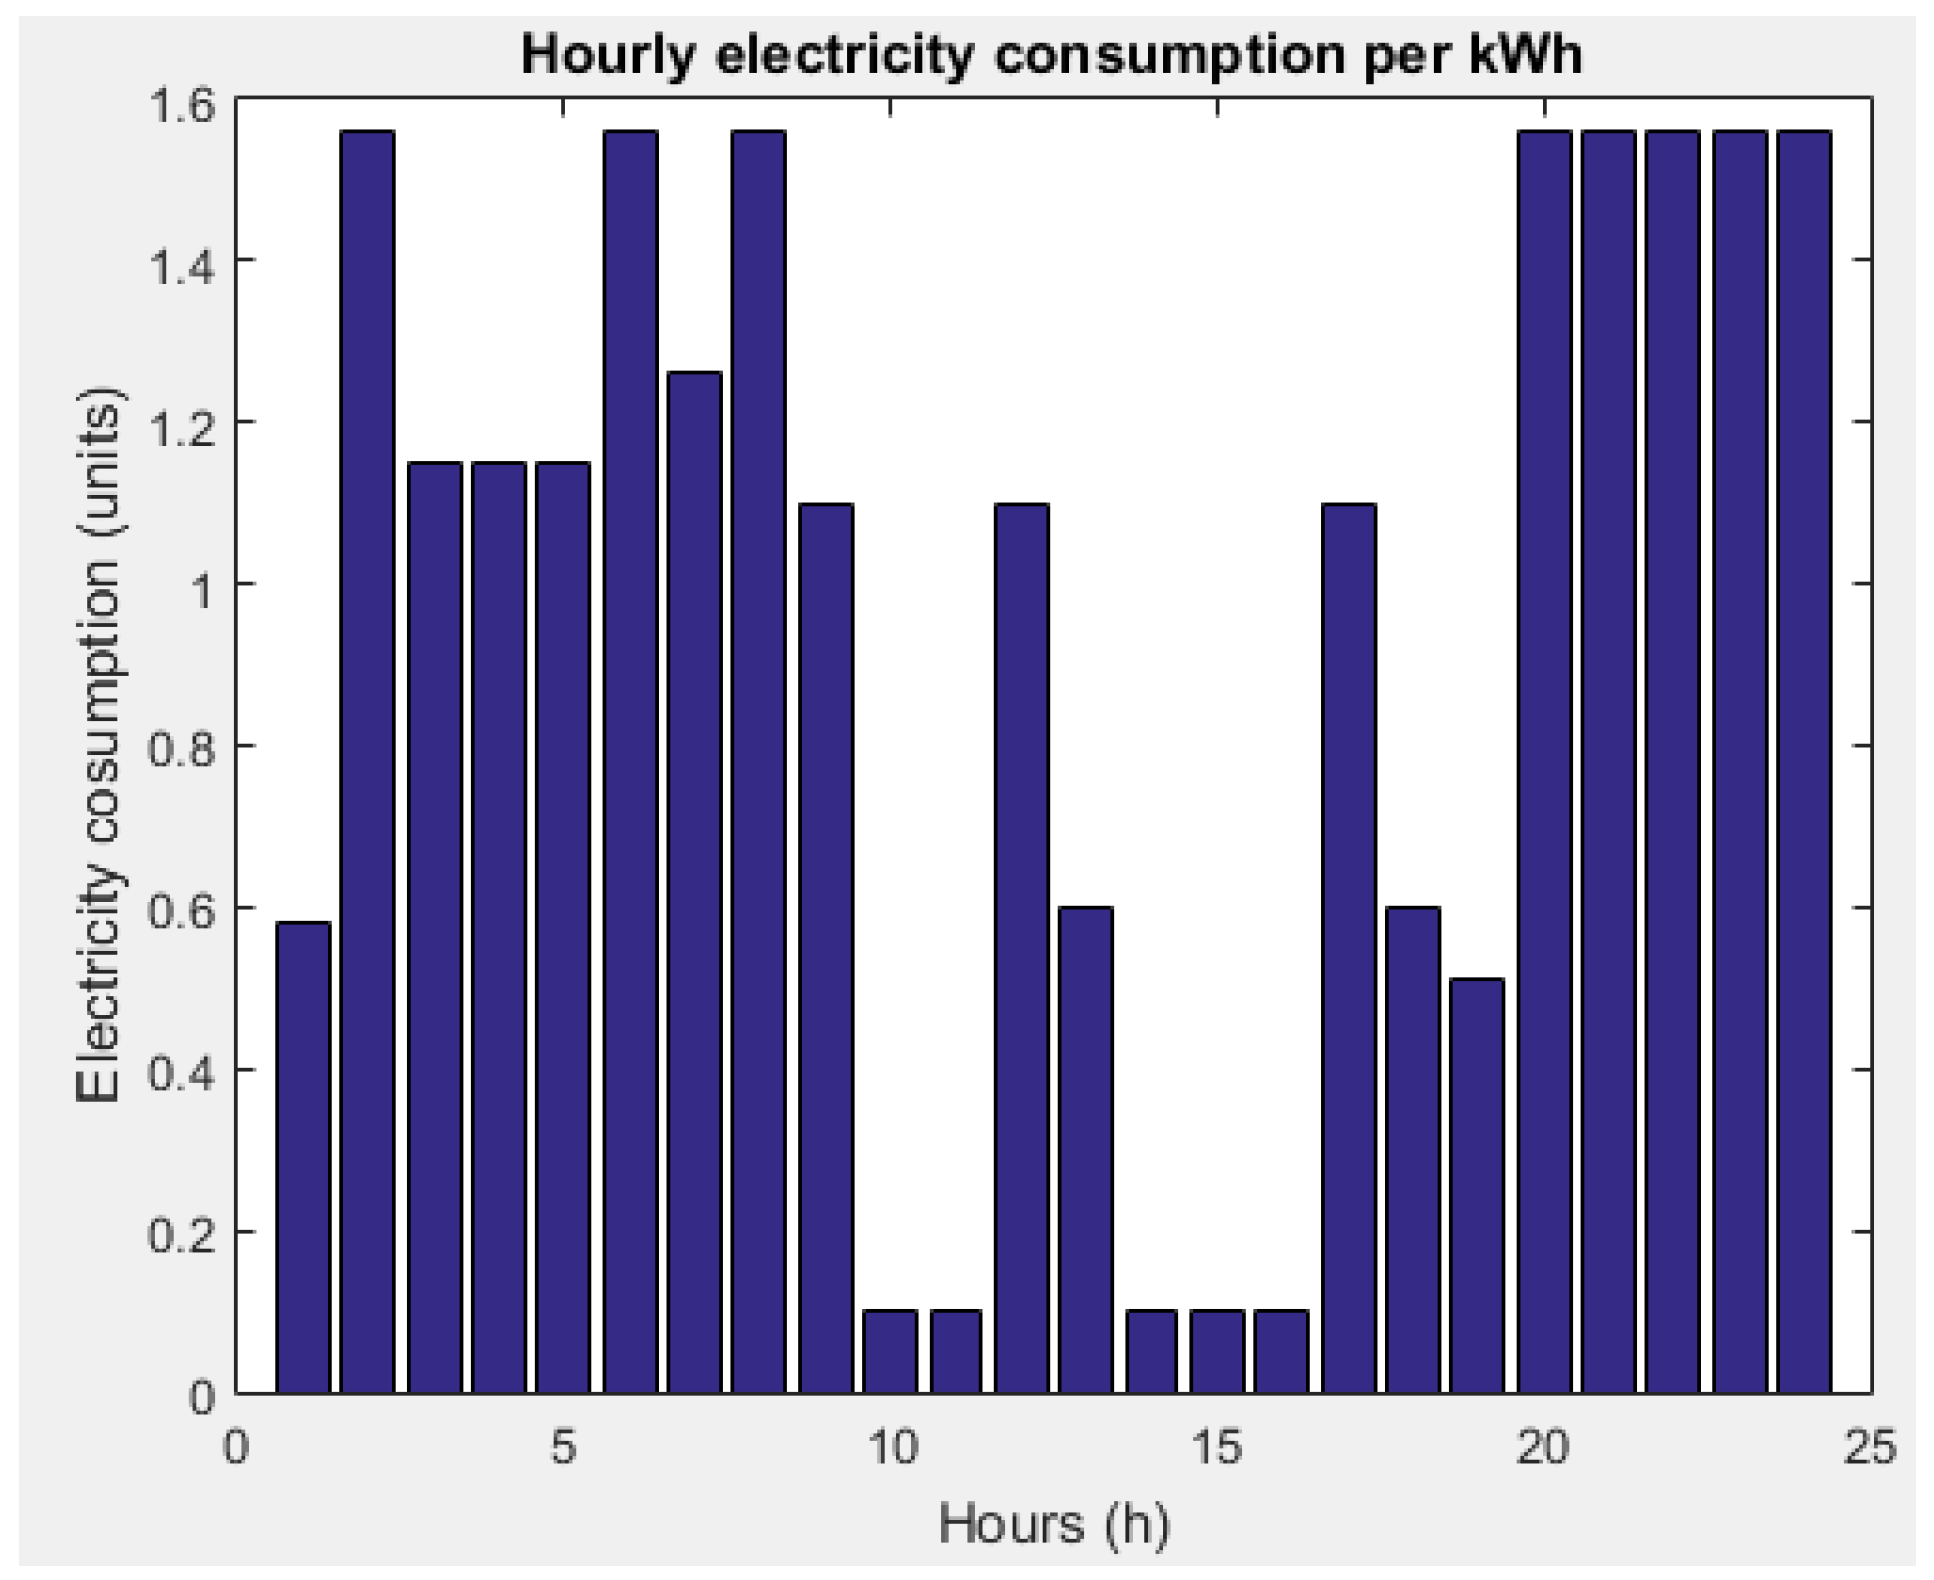
Before optimization, the peak is 2.55 kWh and the electricity payment is between 3.34 € (with ToU B) and 3.72 € (ToU_A).
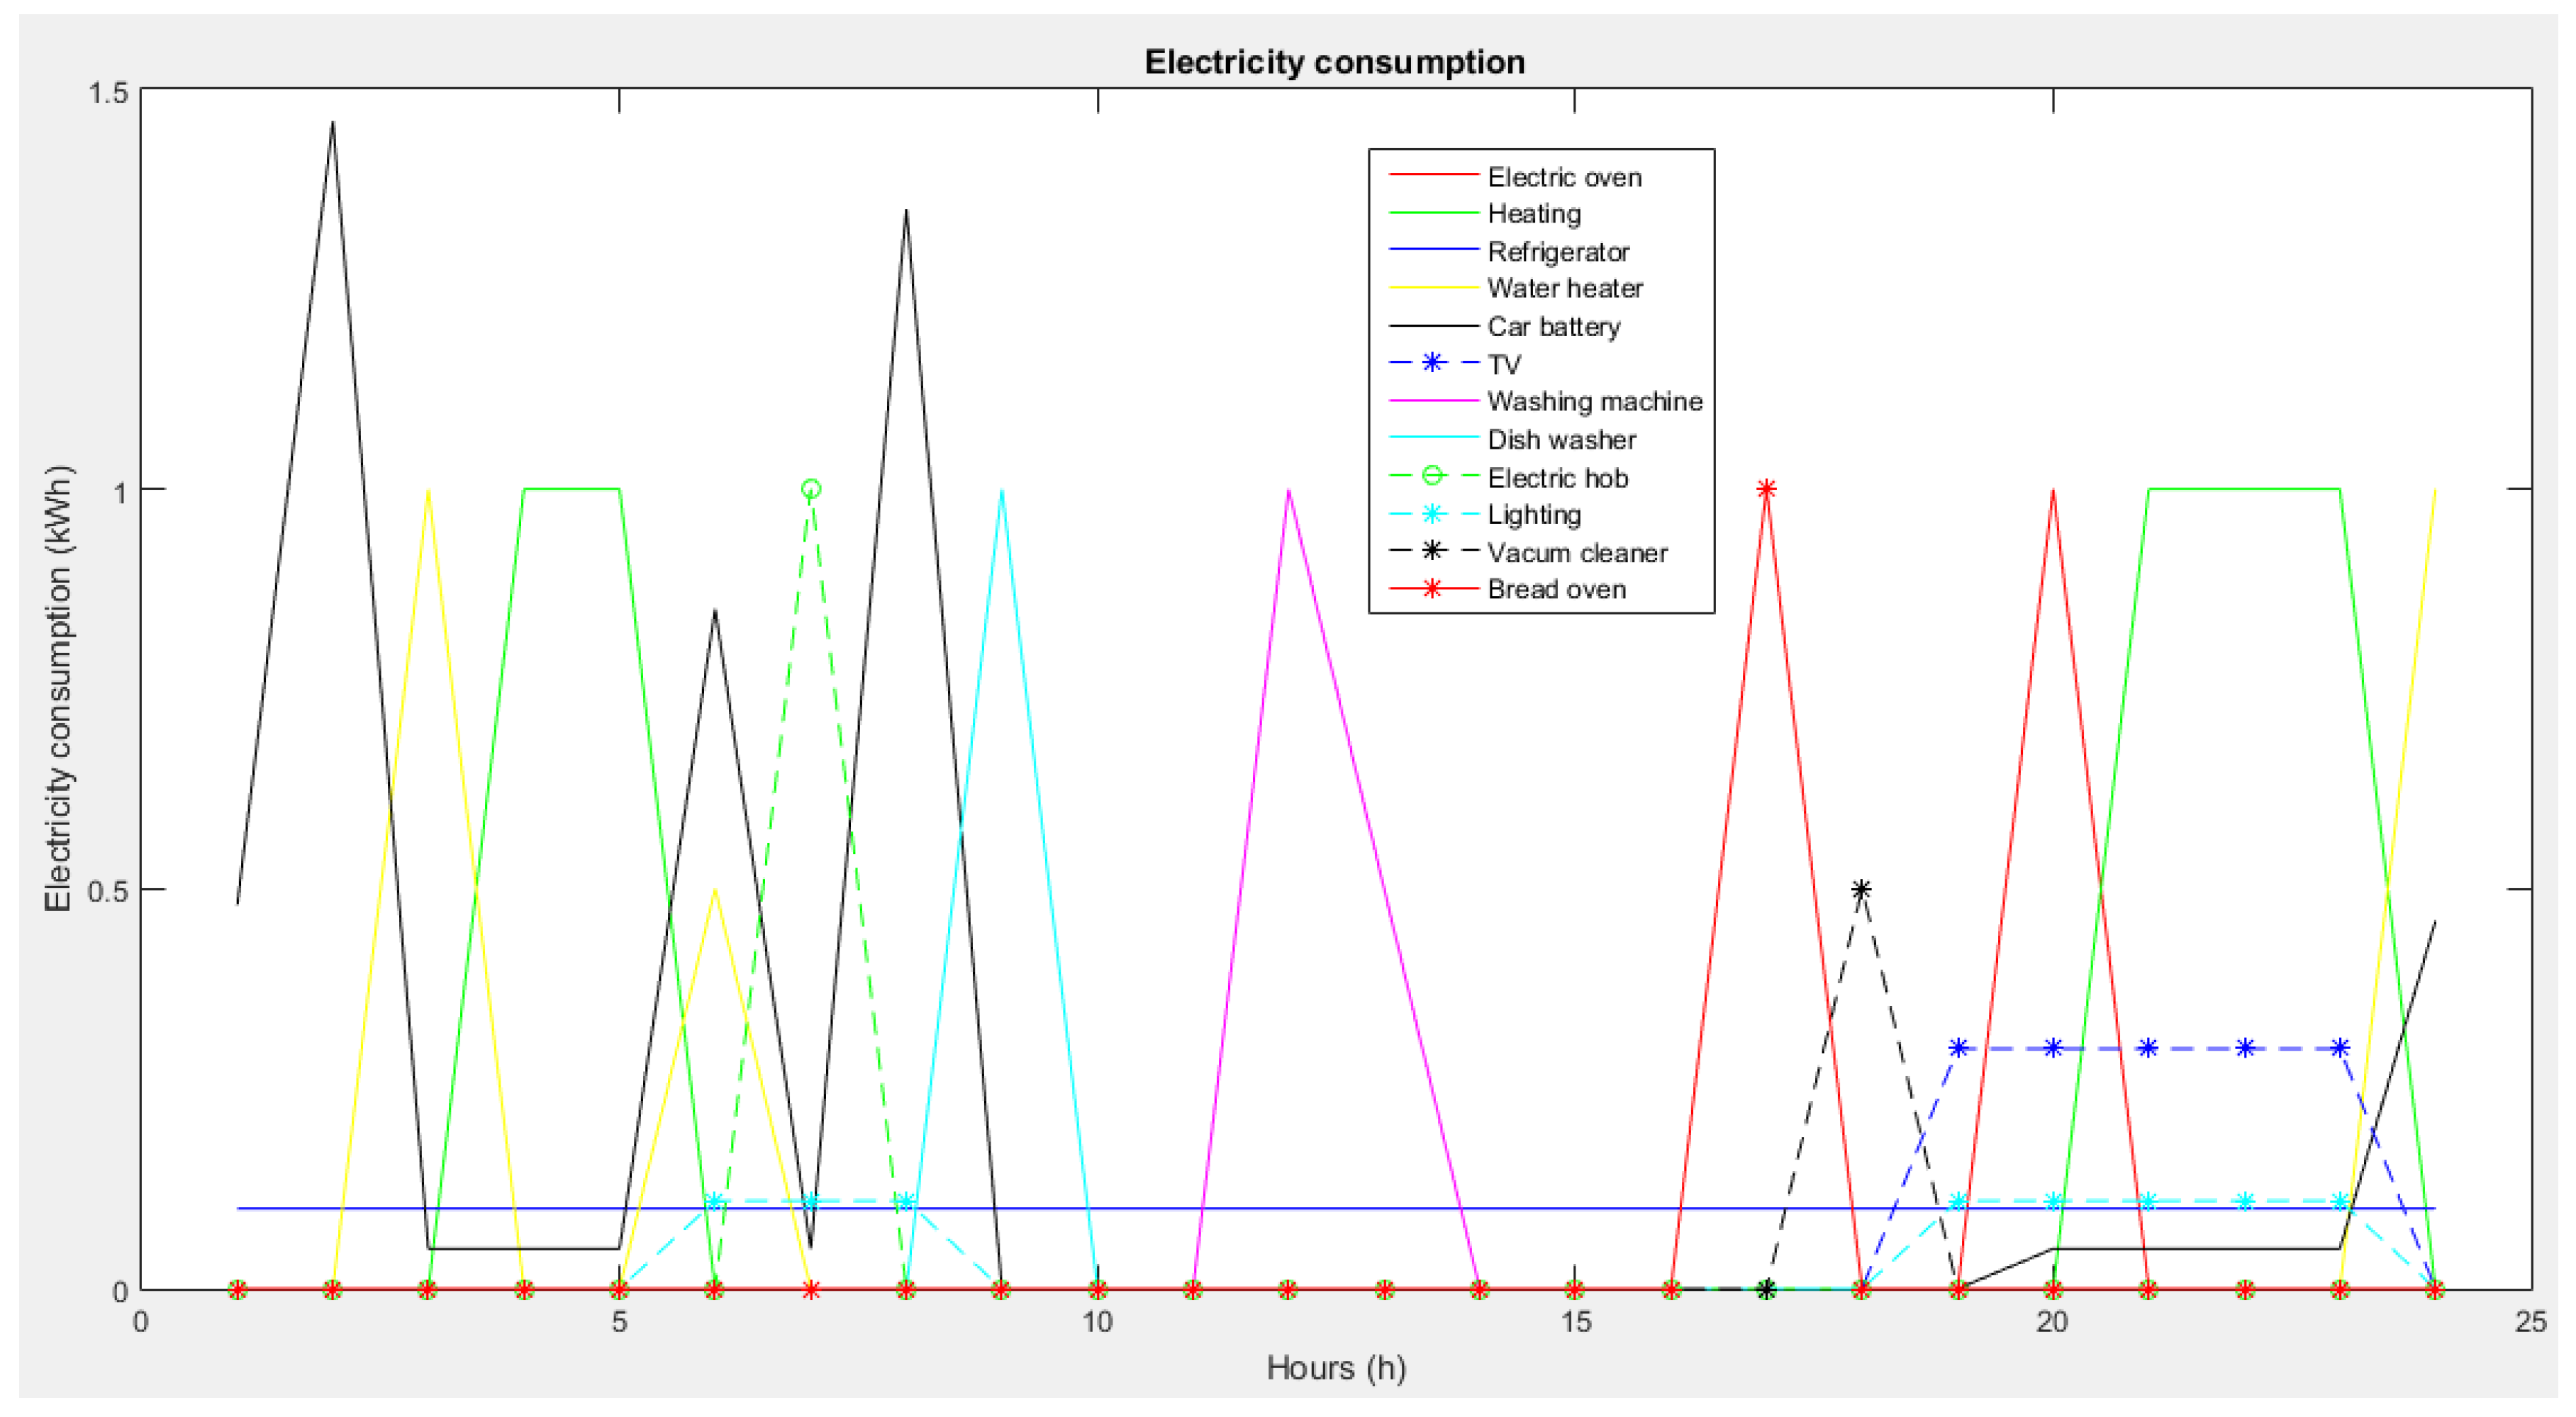
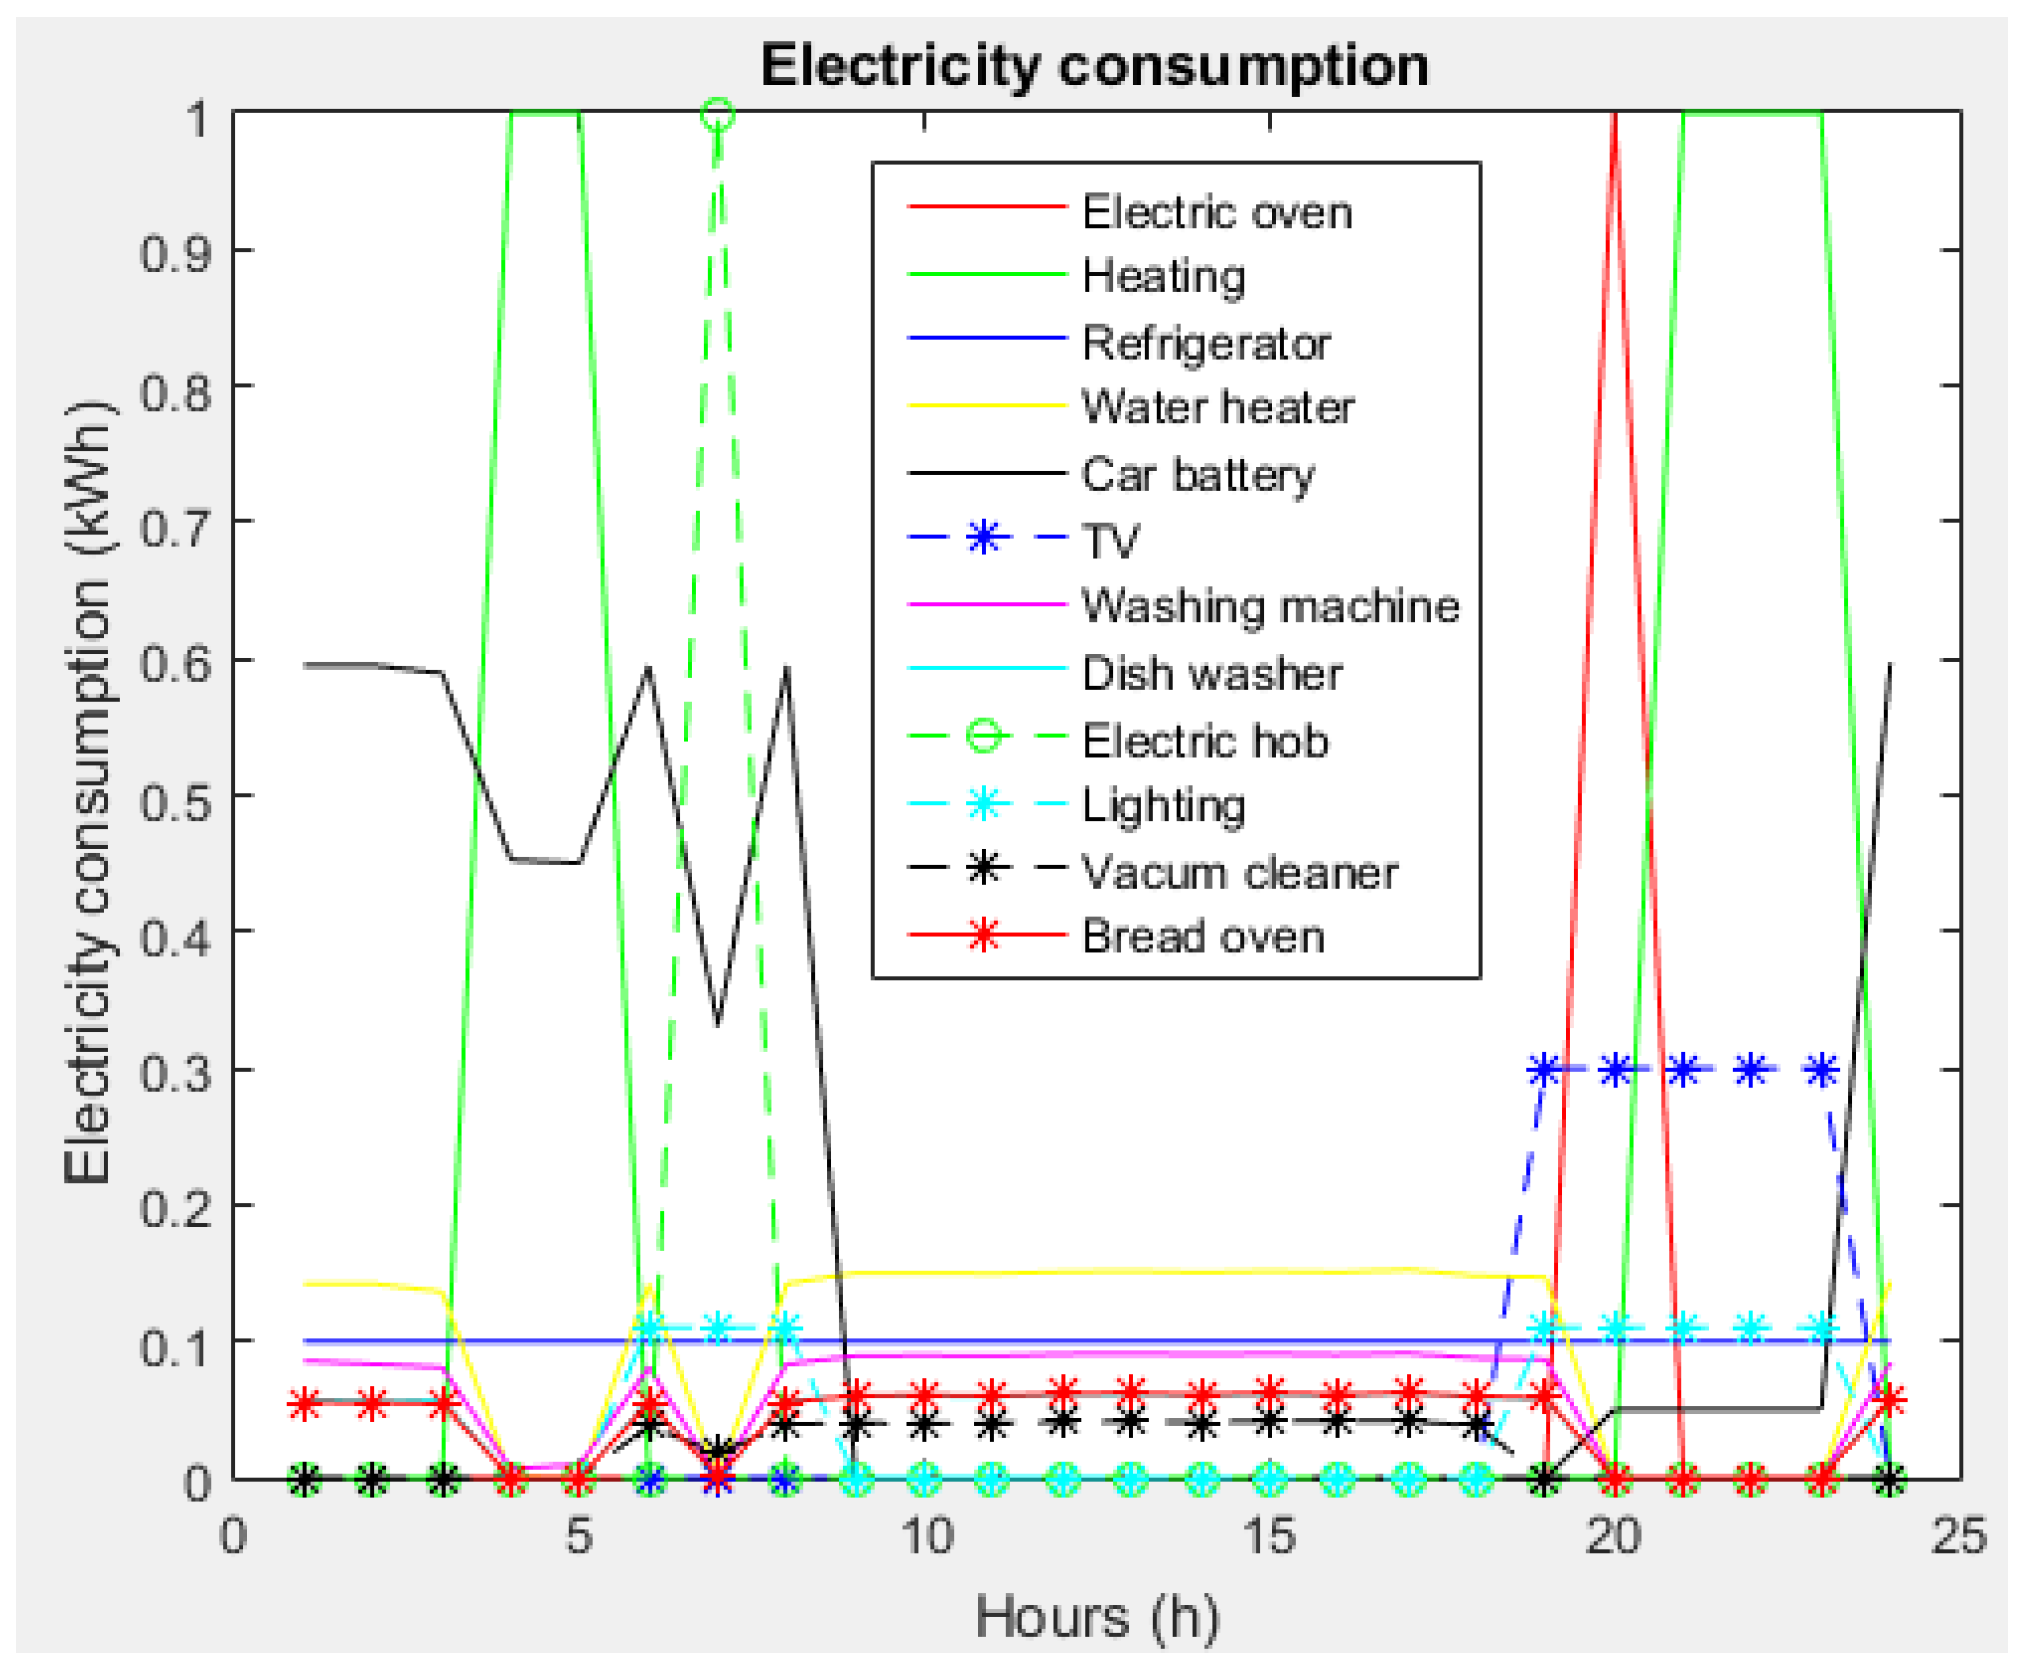
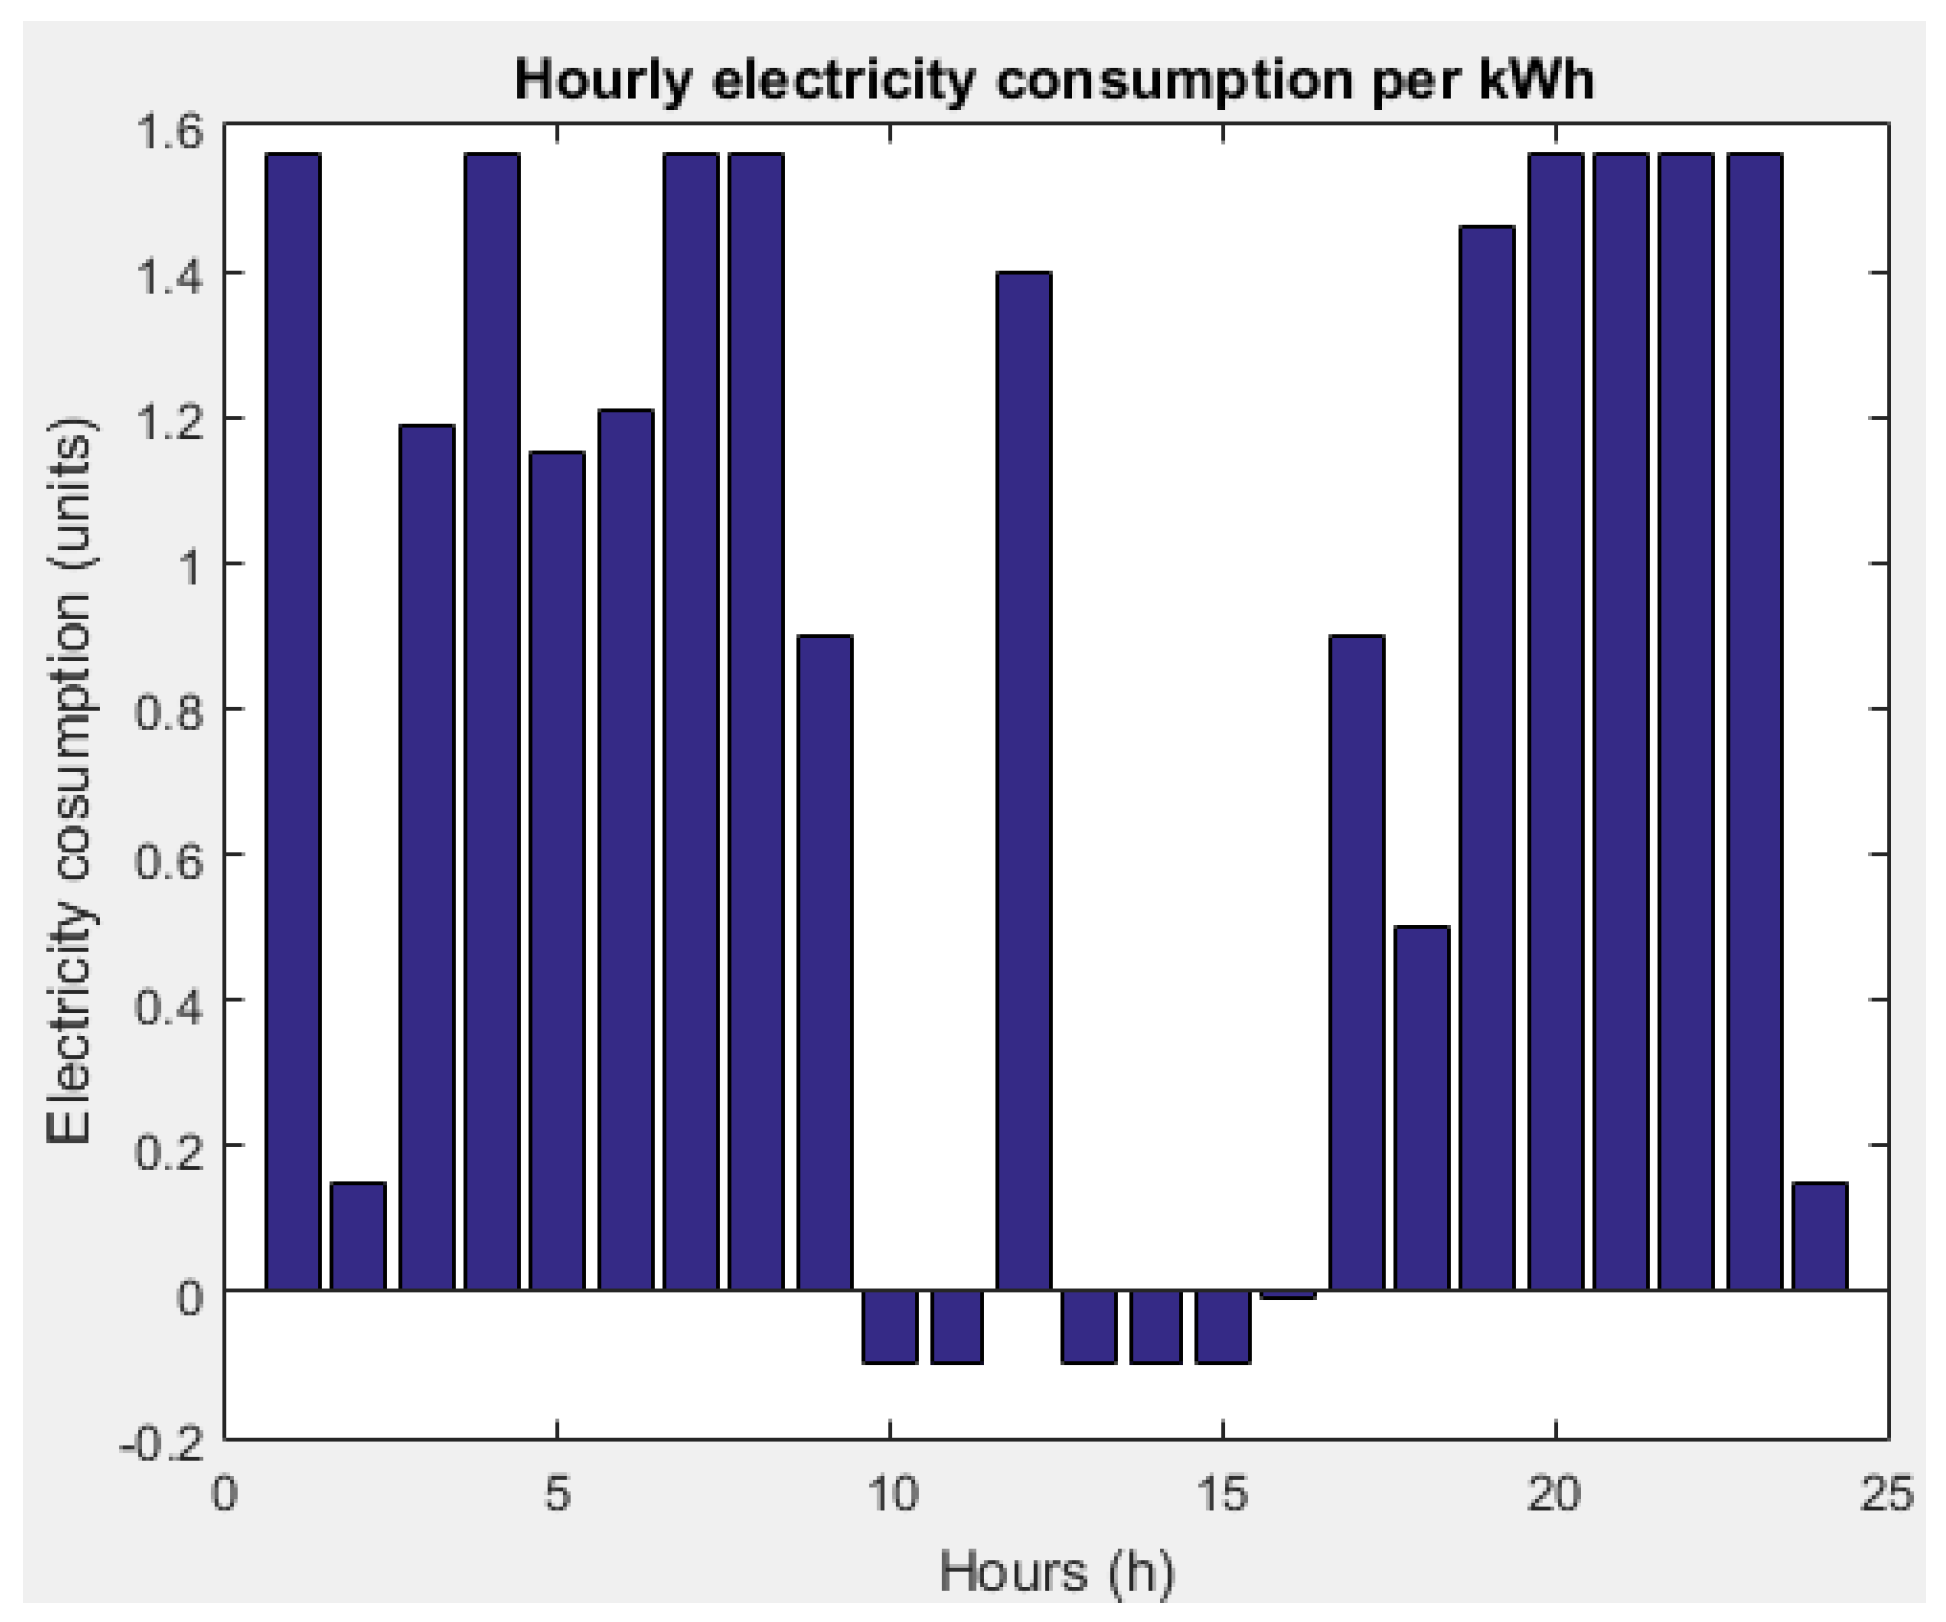
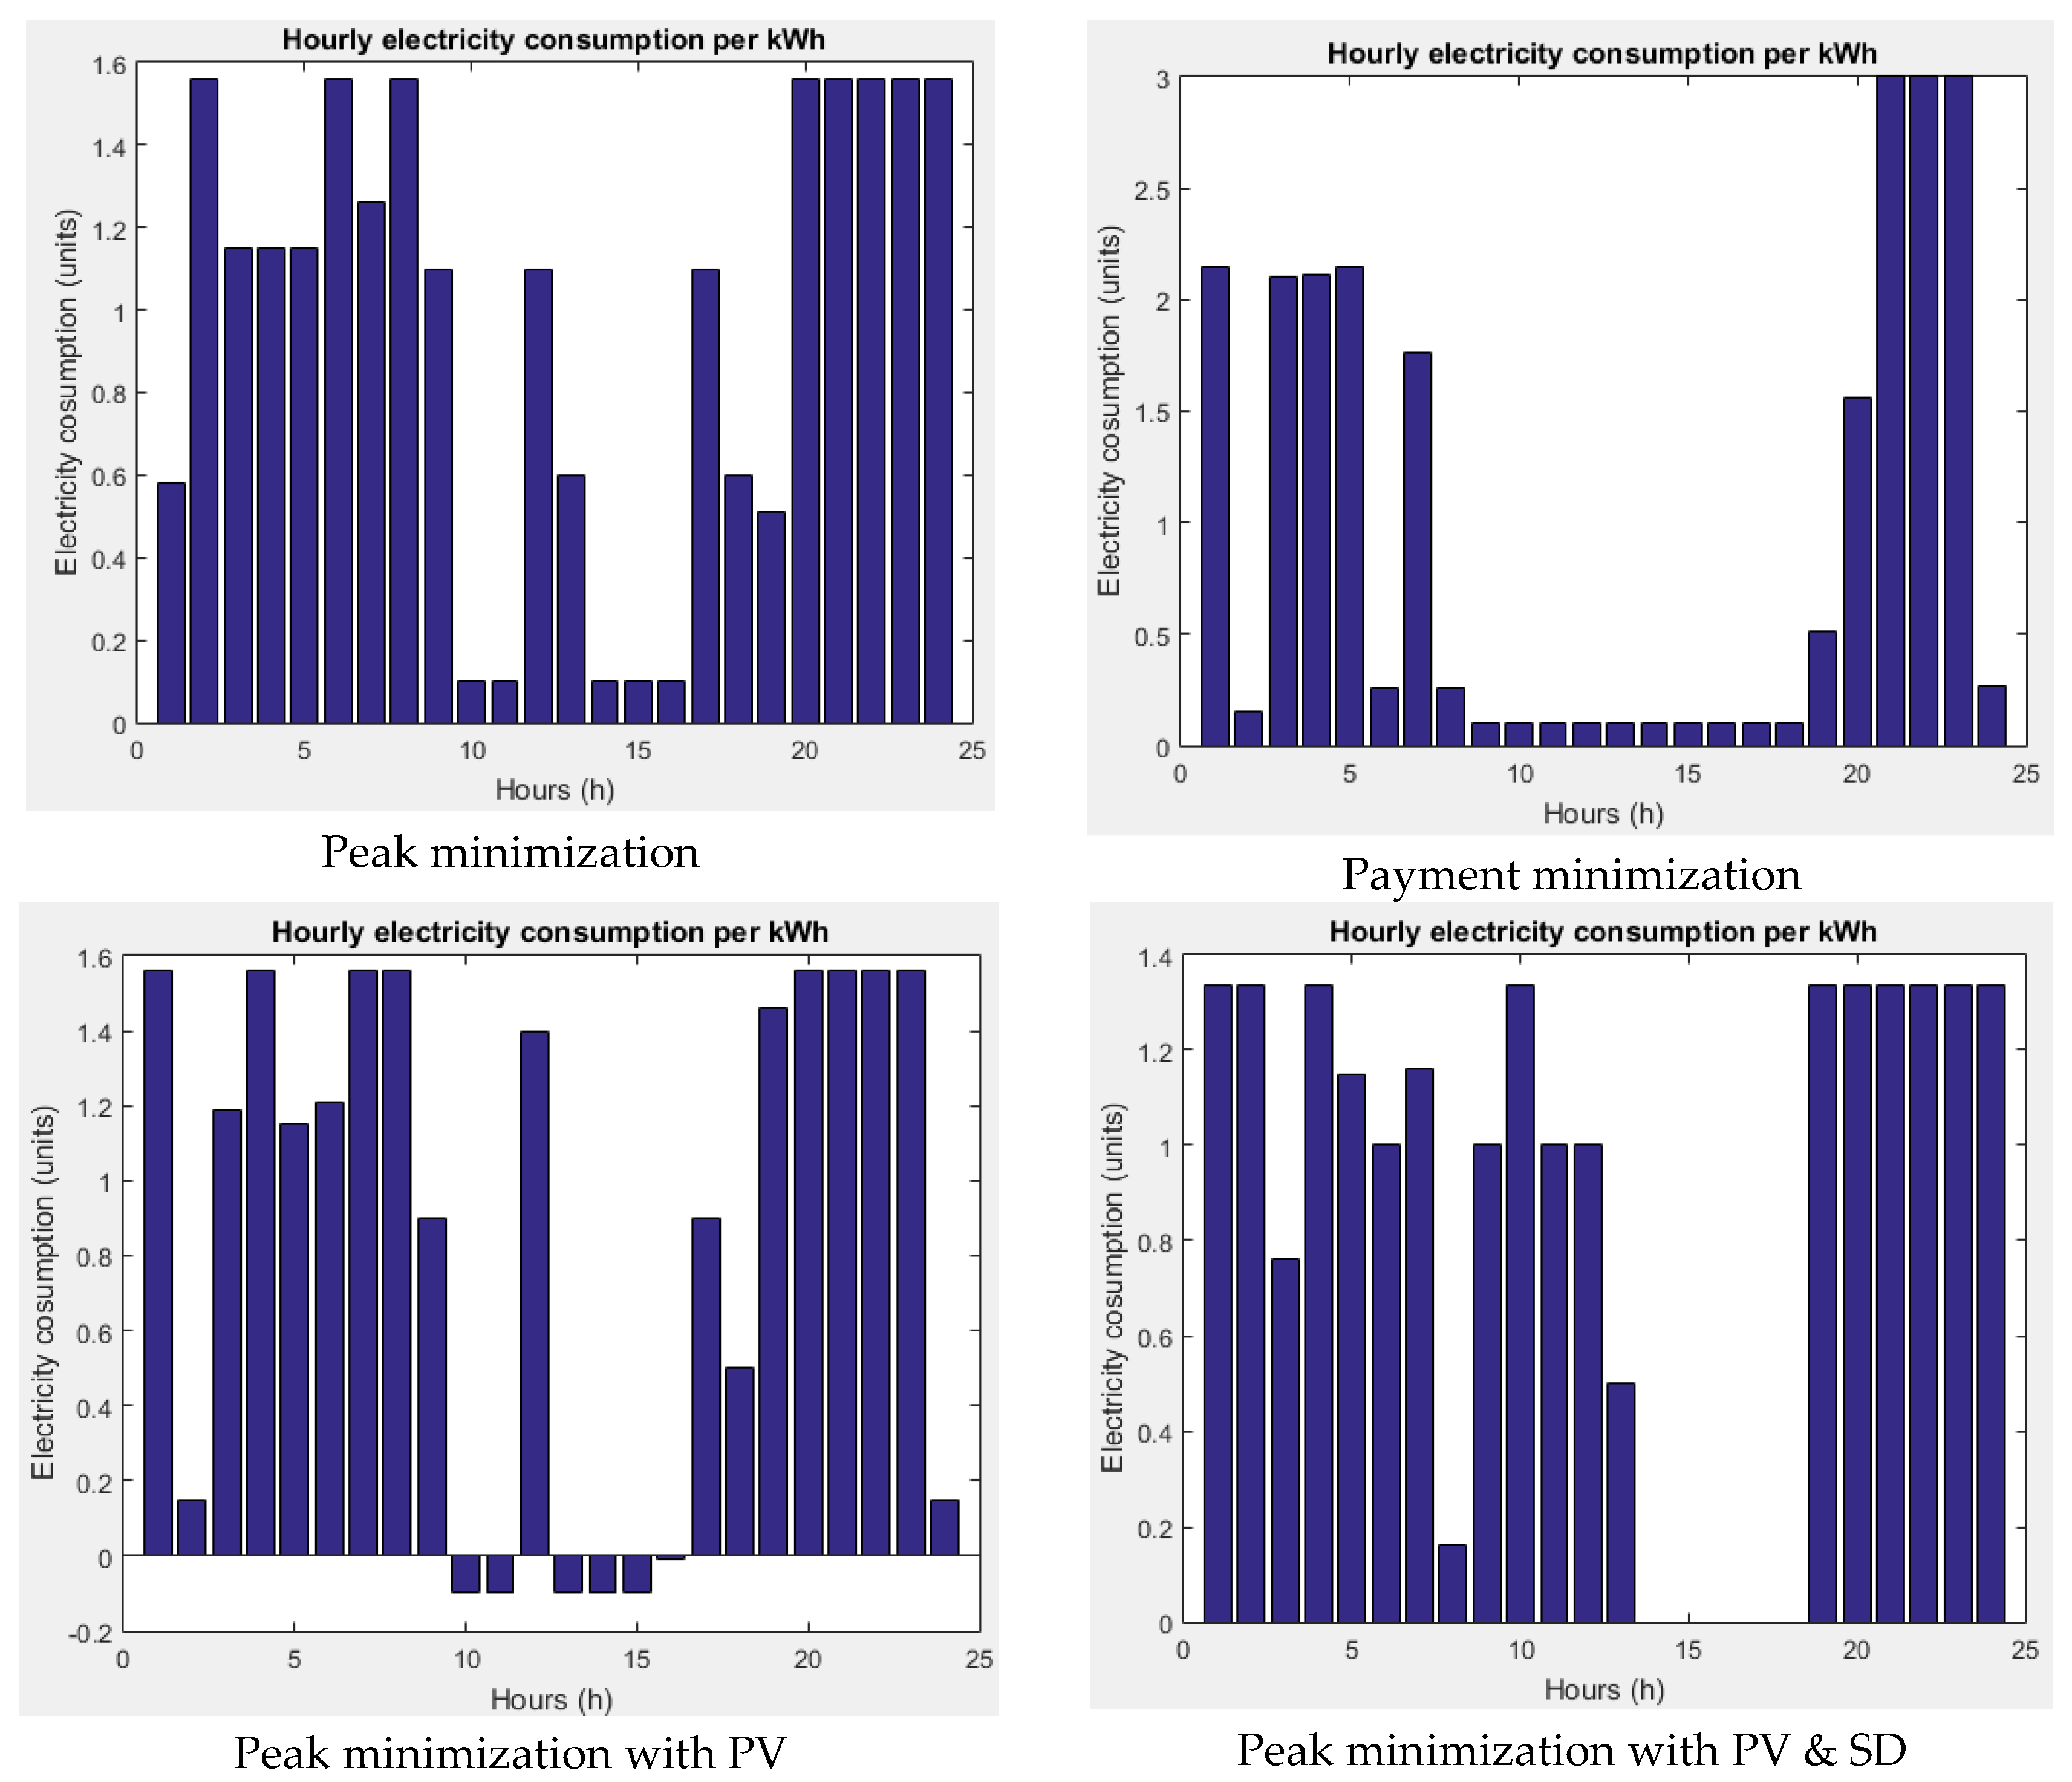
The optimization results in case the objective function is minimization of the consumption peak are shown in
Figure 5 (cumulative consumption) and
Figure 6 (individual consumption).
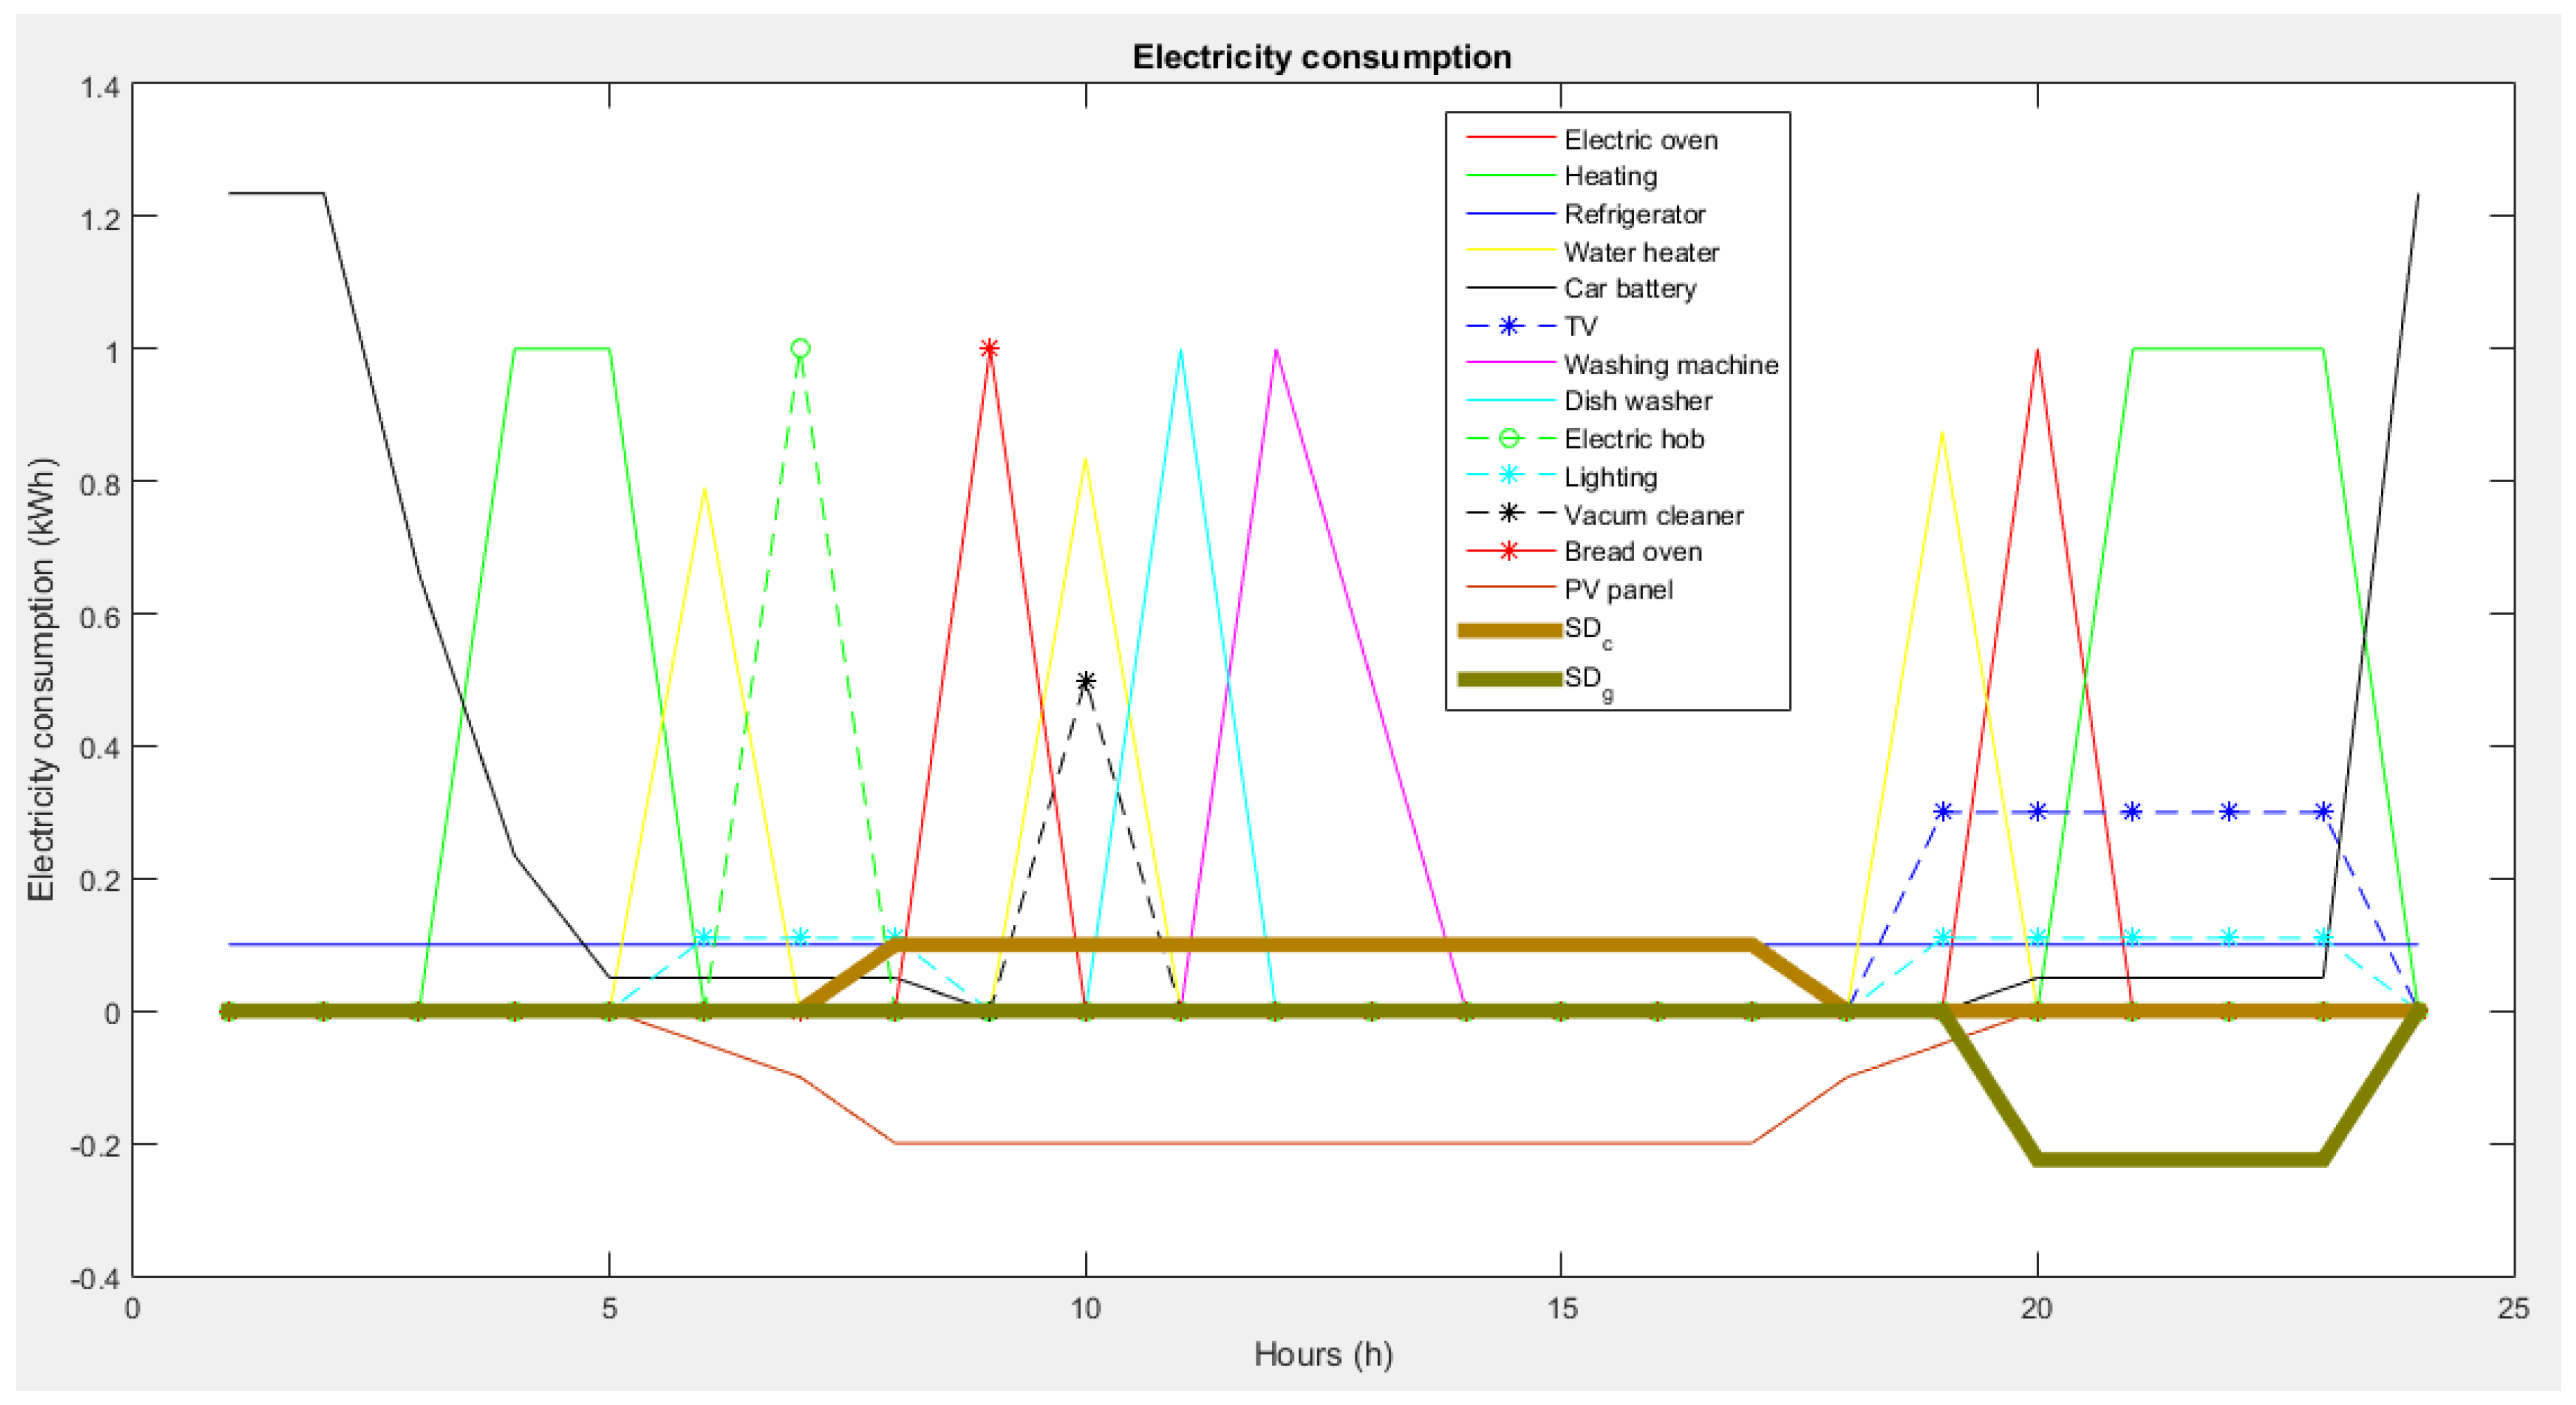
The consumption of individual appliances is uniformly distributed during the 24 h so that the consumption peak is flattened based on the operation constraints of the programmable appliances and the consumer flexibility. Heating, car battery and water heater operate at night, due to the fact that they are programmable and do not involve consumer. In addition, the washing machine is programmed to operate in the afternoon even if the consumer is not at home. In the evening, non-programmable appliances such as: TV, vacuum cleaner and electric oven usually operate as they require the involvement of the consumer. After the optimization function is applied, we obtain the hourly schedule for each appliance for the entire day as in
Figure 6.
In this scenario, the consumption peak is 1.56 kWh and the electricity payment varies between 2.196 € (Tou_F) and 3.632 € (ToU_A). Comparing to “without optimization case”, the consumption peak reduces by around 39%, while the electricity payment reduces between 2.4% (ToU_A) and 31.1% (ToU_F).
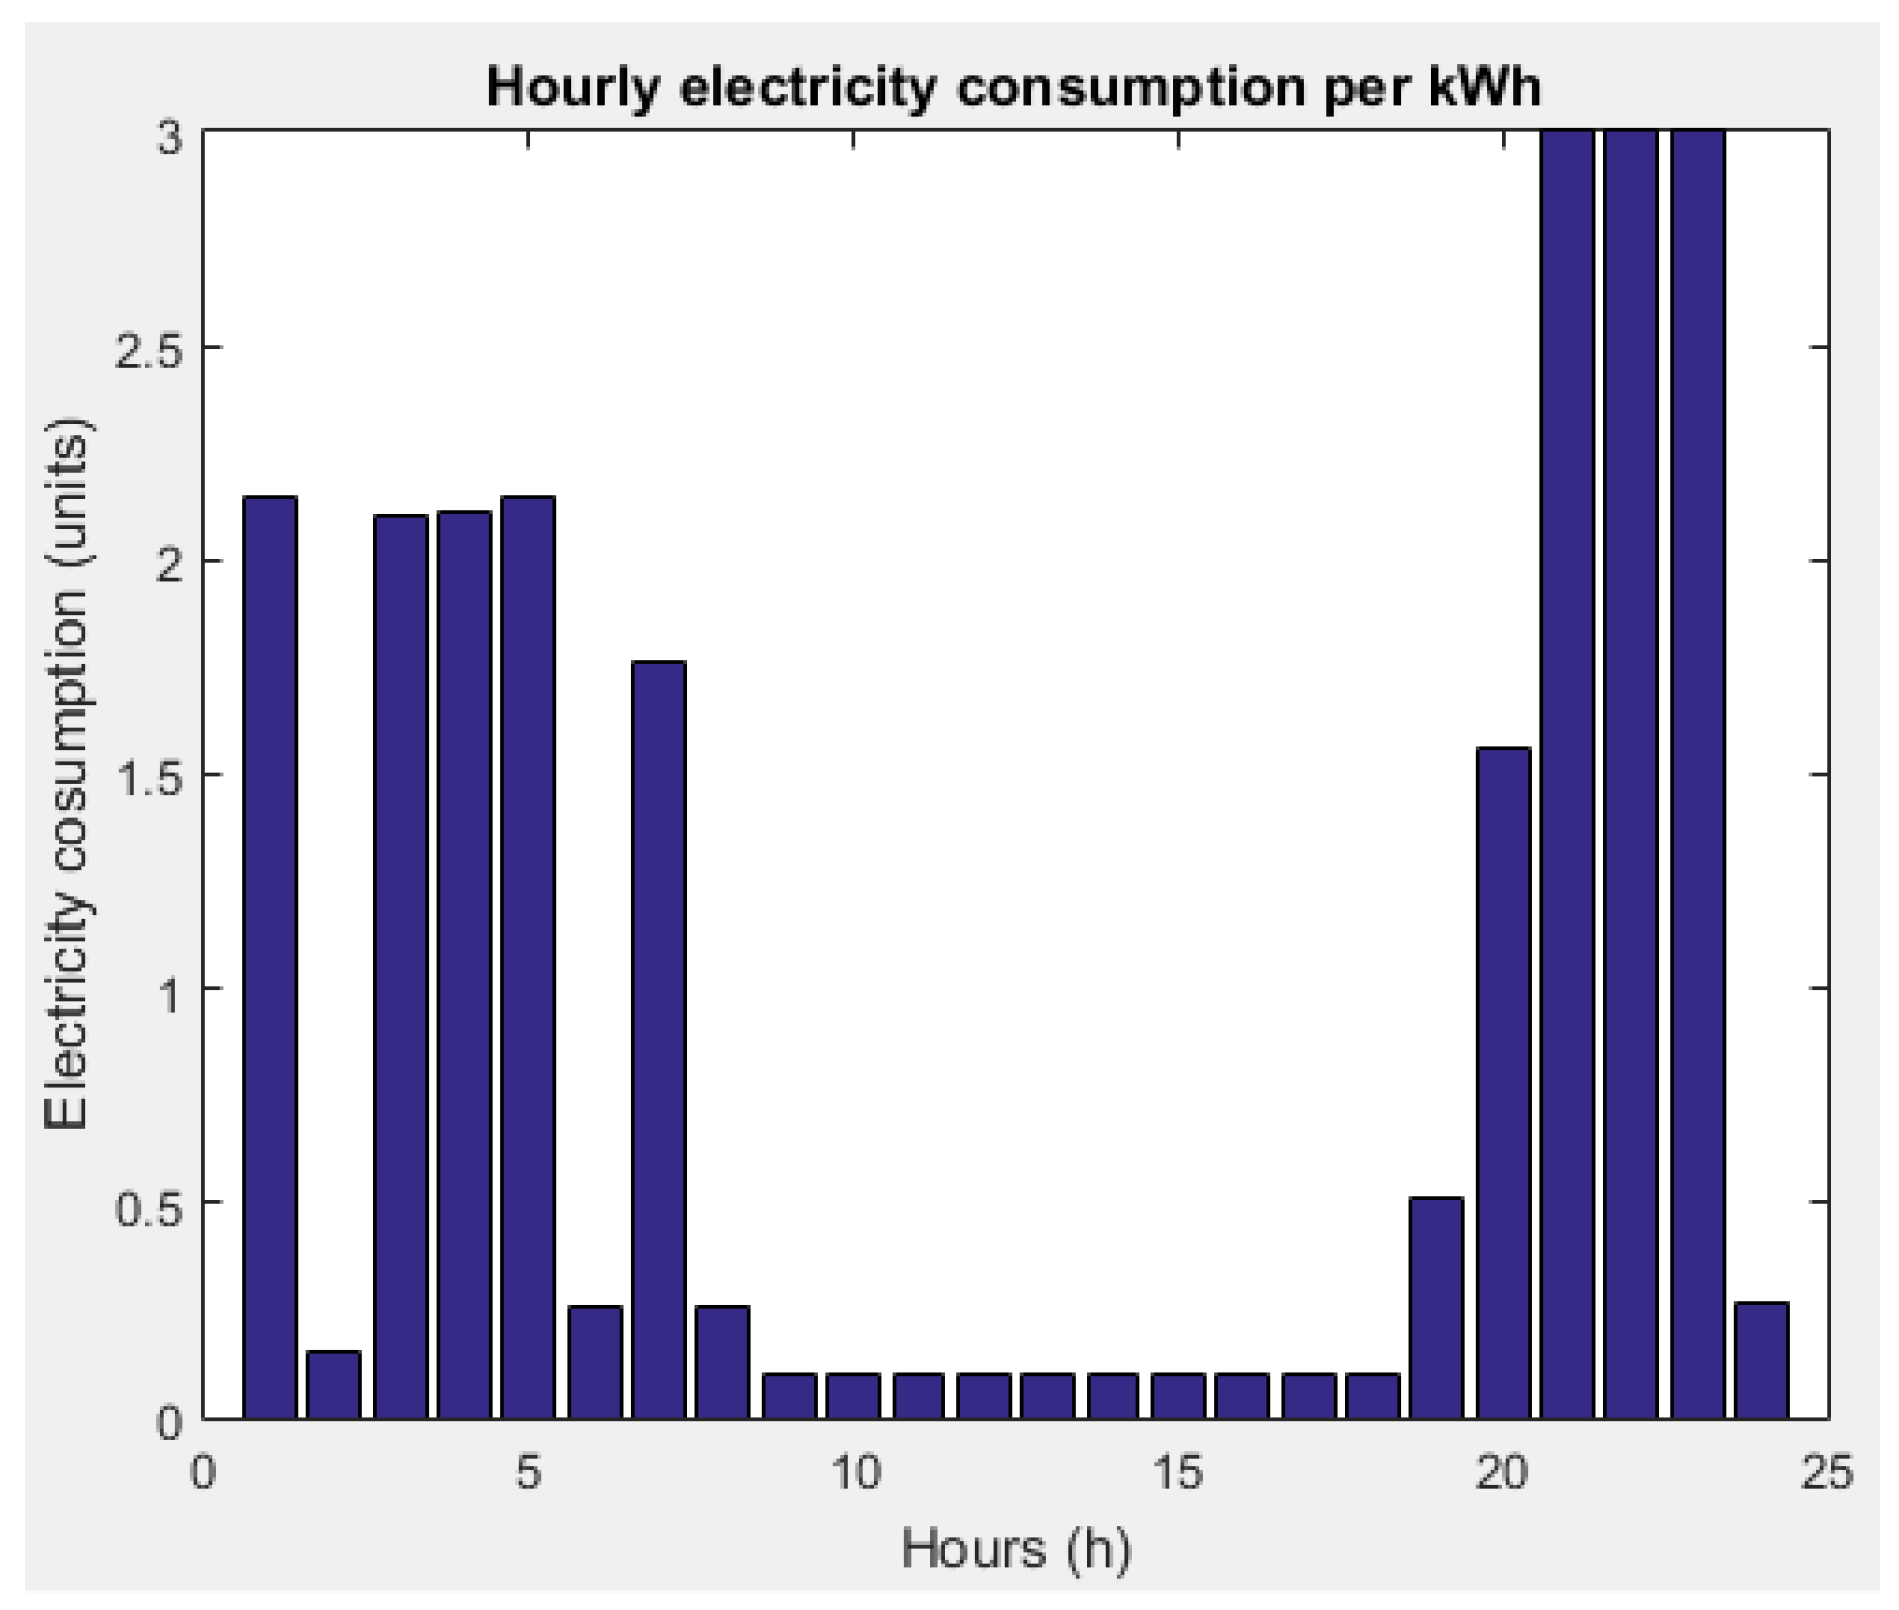
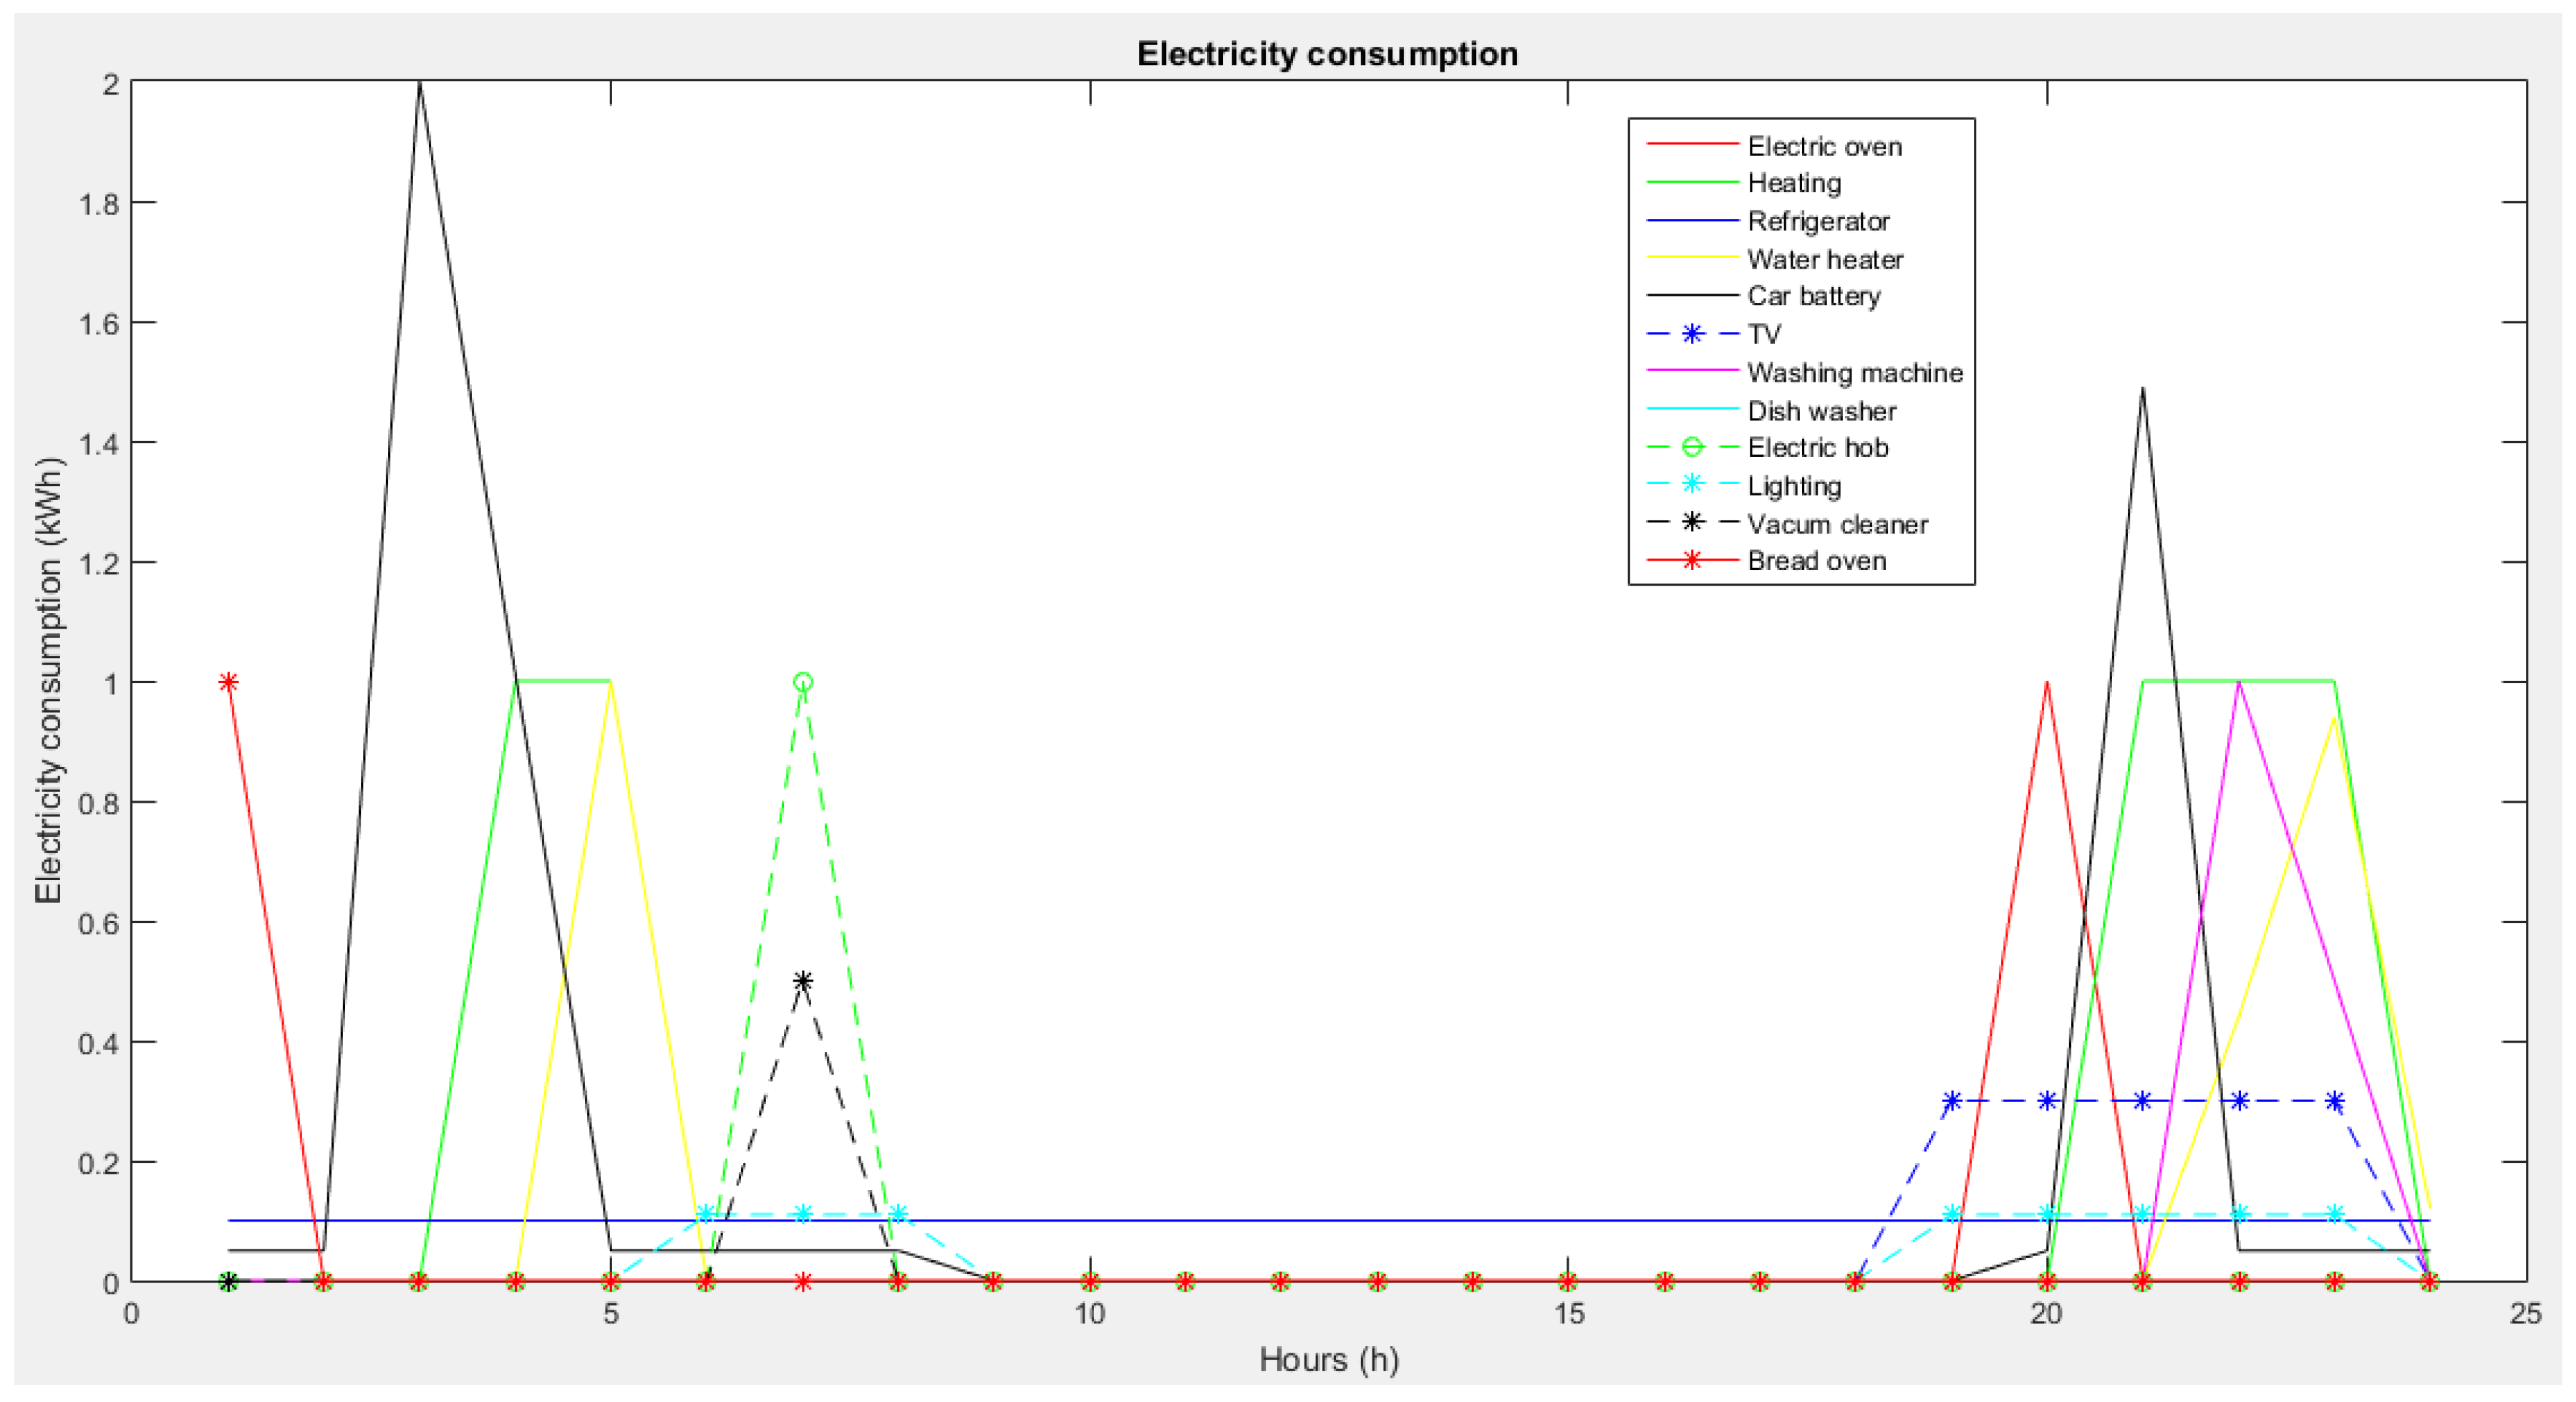
In case the objective function is minimization of the electricity payment, the optimization results are presented in
Figure 7 (cumulative consumption) and
Figure 8 (individual consumption). Most of the appliances operate at lower tariff rate time intervals. Therefore, during the day only non-programmable appliances (such as refrigerator) operate. The consumption is moved from day and evening to night hours due to the ToU tariffs rates differences.
The consumption peak is 3 kWh and electricity payment is between 1.796 € (ToU_F) and 3.582 € (ToU_A). The peak consumption is almost double compared with the case when the objection function is minimization of the consumption peak. The electricity payment is less by 3.8% (ToU_A) and 50.2% (ToU_F) than in the initial case. The peak consumption is even higher compared with the no optimization case. Therefore, this approach is just a temporary solution that is not able to ensure sustainable development of the power system. It can just provide an overview on flexibility of the consumers and their mobility to react to different ToU tariffs. After the optimization function is applied, we obtain the hourly schedule for each appliance for the entire day as in
Figure 8.
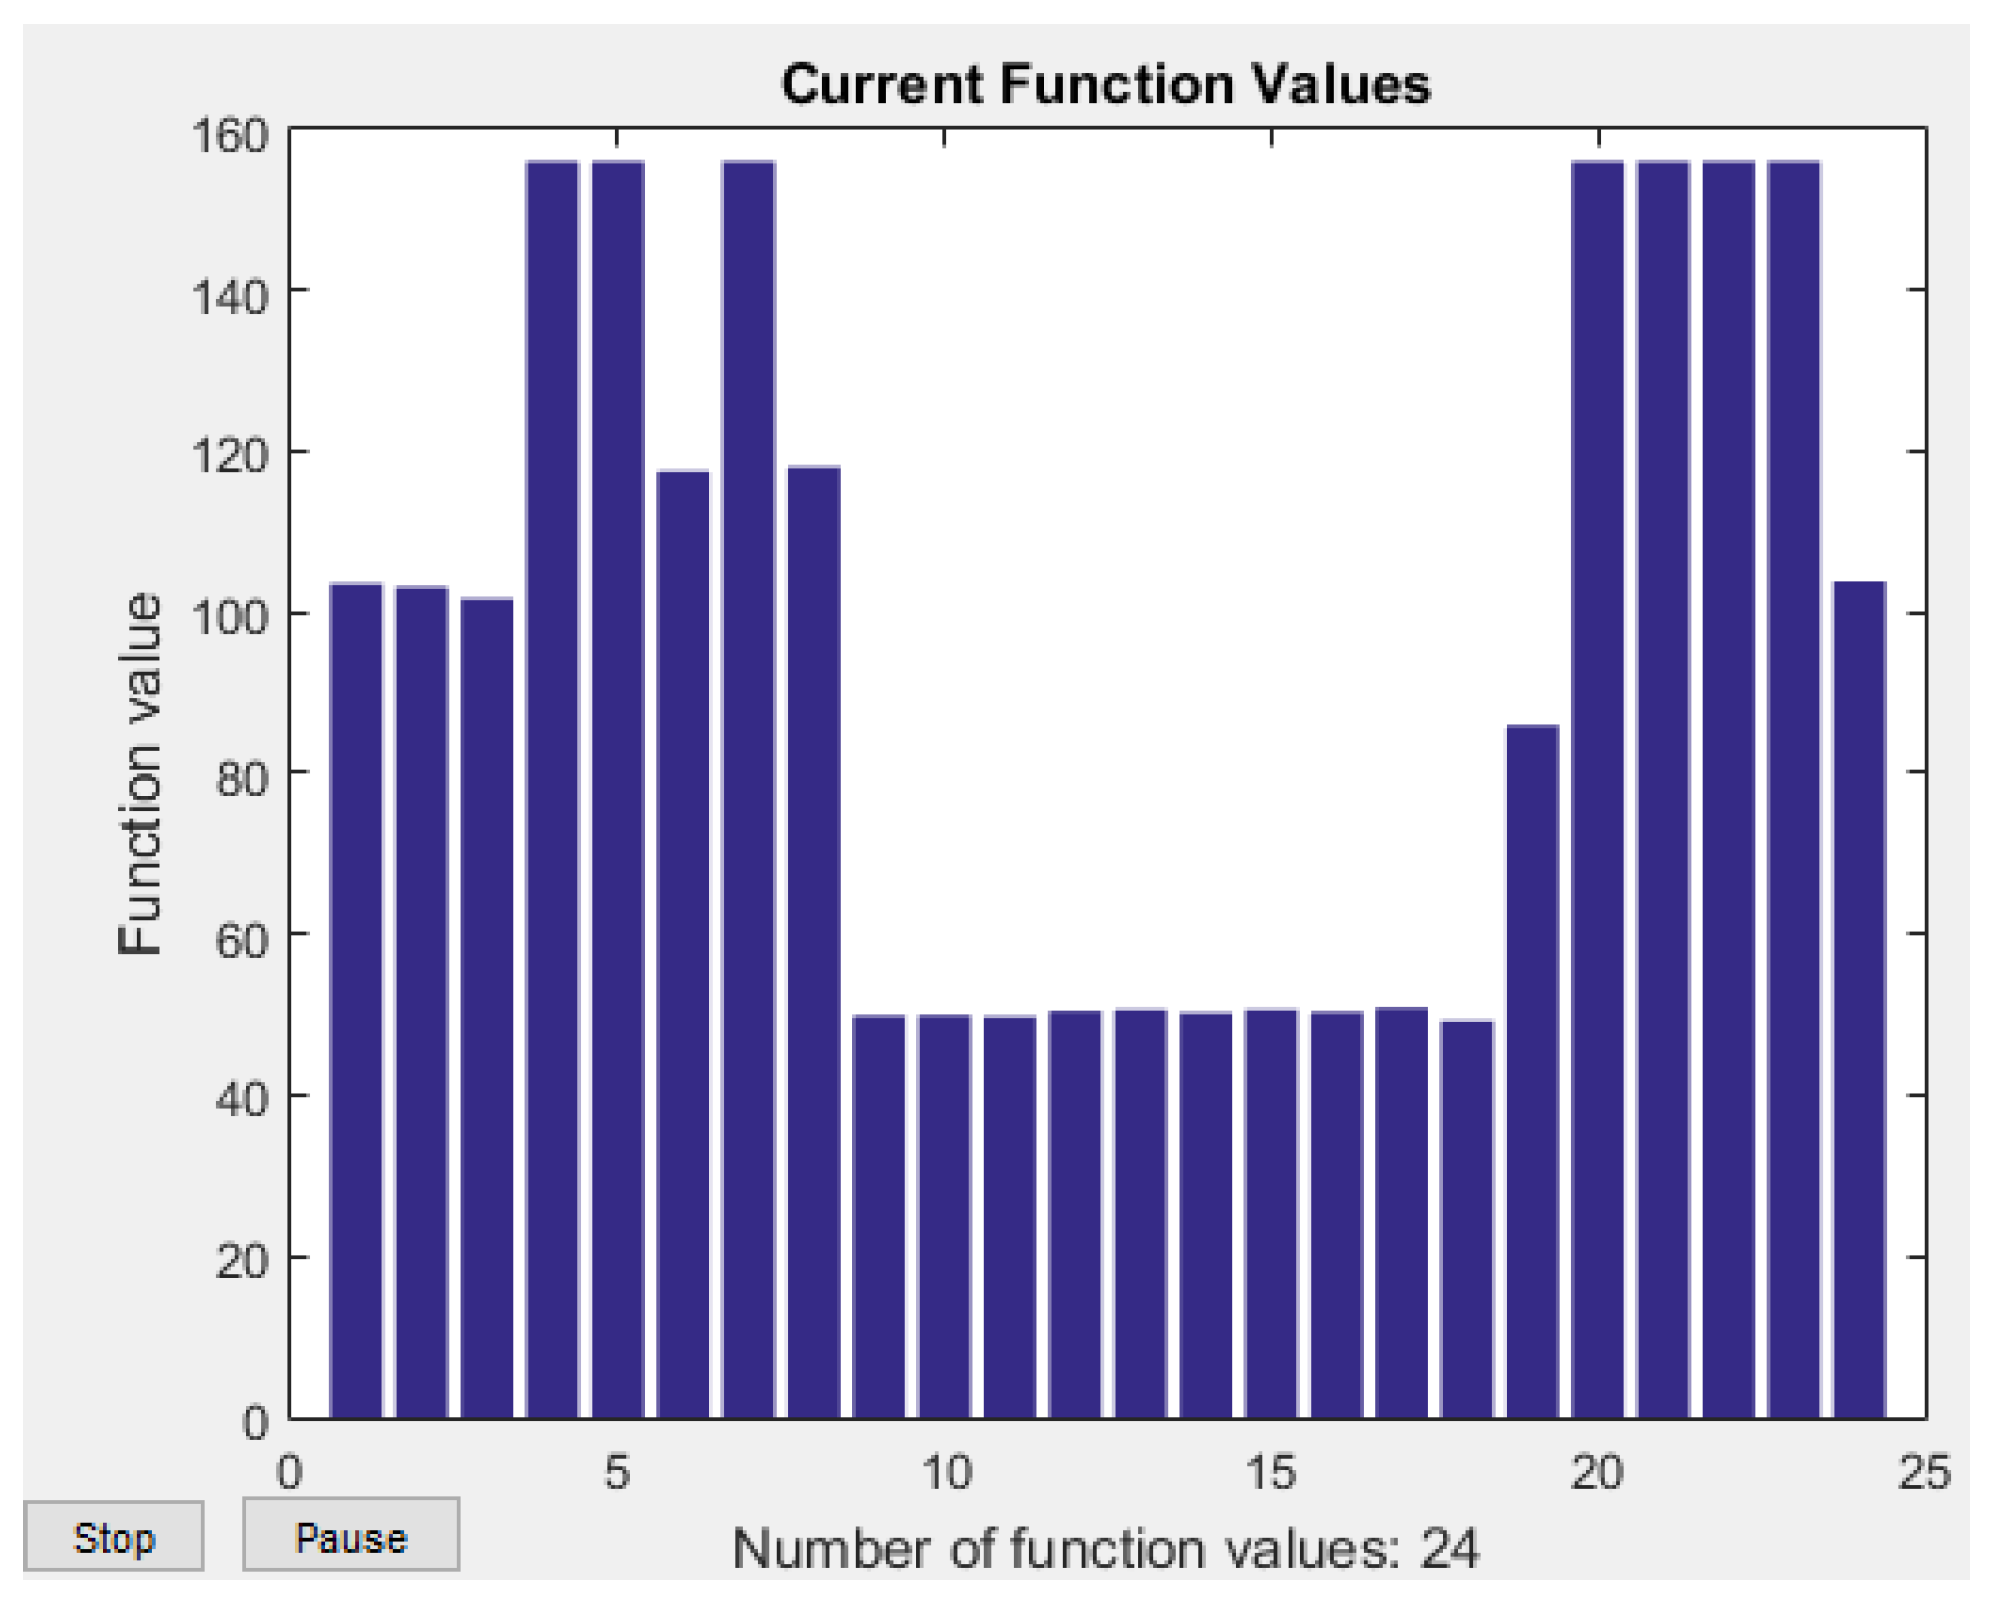
Although the results obtained with intlinprog function are satisfactory, we also applied multi-objective fminimax Matlab function due to the fact that the hourly consumption of all appliances form an array of values that should be minimized.
The optimization results with
fminimax function are presented in
Figure 9 (cumulative consumption) and
Figure 10 (individual consumption).
Comparing with intlinprog function, although the consumption peak is the same (1.56 kWh), the hourly schedule of the appliances does not comply with their characteristics and consumer’s preferences due to the fact that no integer values could be obtained; with fminimax function, imposing integers is not possible.
Therefore, the minimization of the consumption peak as objective function and intlinprog as optimization function are the most appropriate combination to continue the simulations.
In addition to the twelve appliances, we have considered the RES distributed generation (PV) and a storage device. Thus, on top of the twelve appliances, we have added a PV with a total daily output of 2.3 kWh. Hourly minimum/maximum generated energy is around 0.05/0.2 kWh.
For simulations, the day-ahead PV forecast is required. Since it is predictable and mainly depends on solar irradiation, it can be done easily by ARIMA models or even feed-forward neural networks as in [
26,
27].
In case we consider the minimization of consumption peak, with PV the following results have been obtained: Consumption peak 1.56 kWh, electricity payment varies between 2.378 € (ToU_F) and 3.295 € (ToU_A). In
Figure 11 the cumulative daily consumption curve and in
Figure 12 the individual consumption curves for each appliance plus PV as negative consumption are shown.
It can be noticed that the consumption peak remains unchanged, while the electricity payment reduces by 11.5% (ToU_A) and 34.1% (ToU_F) as a consequence of the local generation that reduces the consumption from the grid leading to less electricity payment.
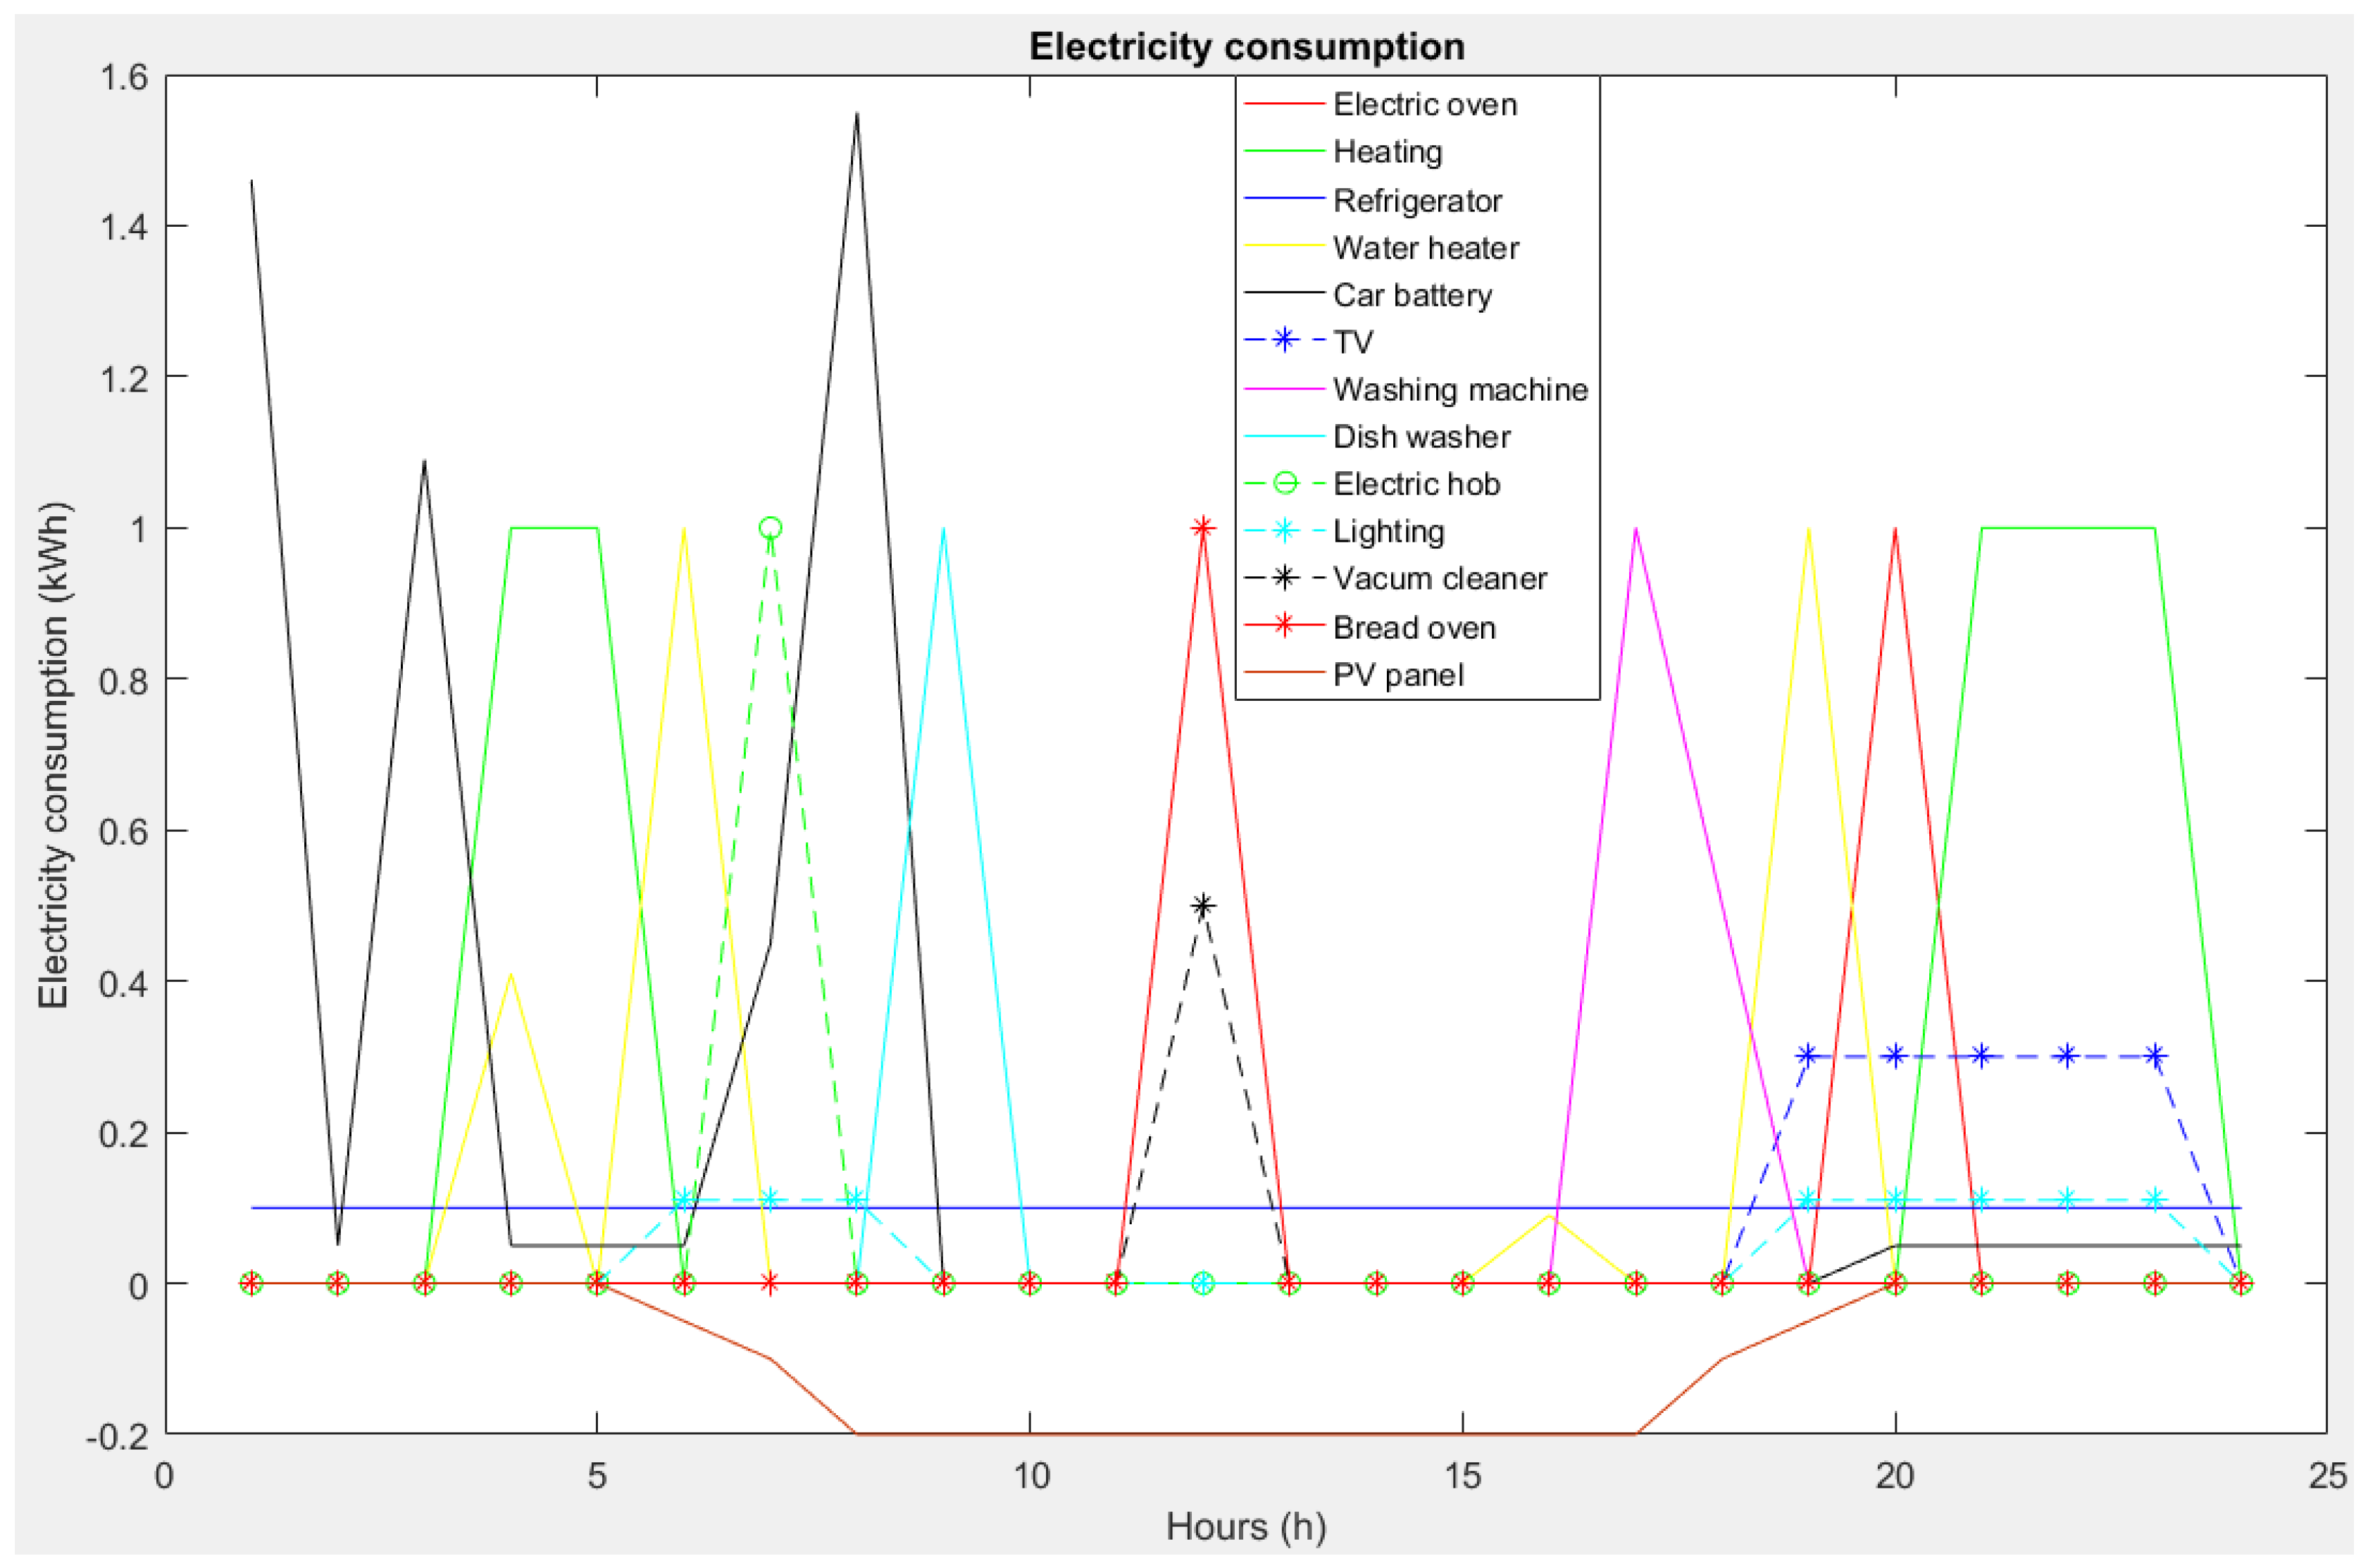
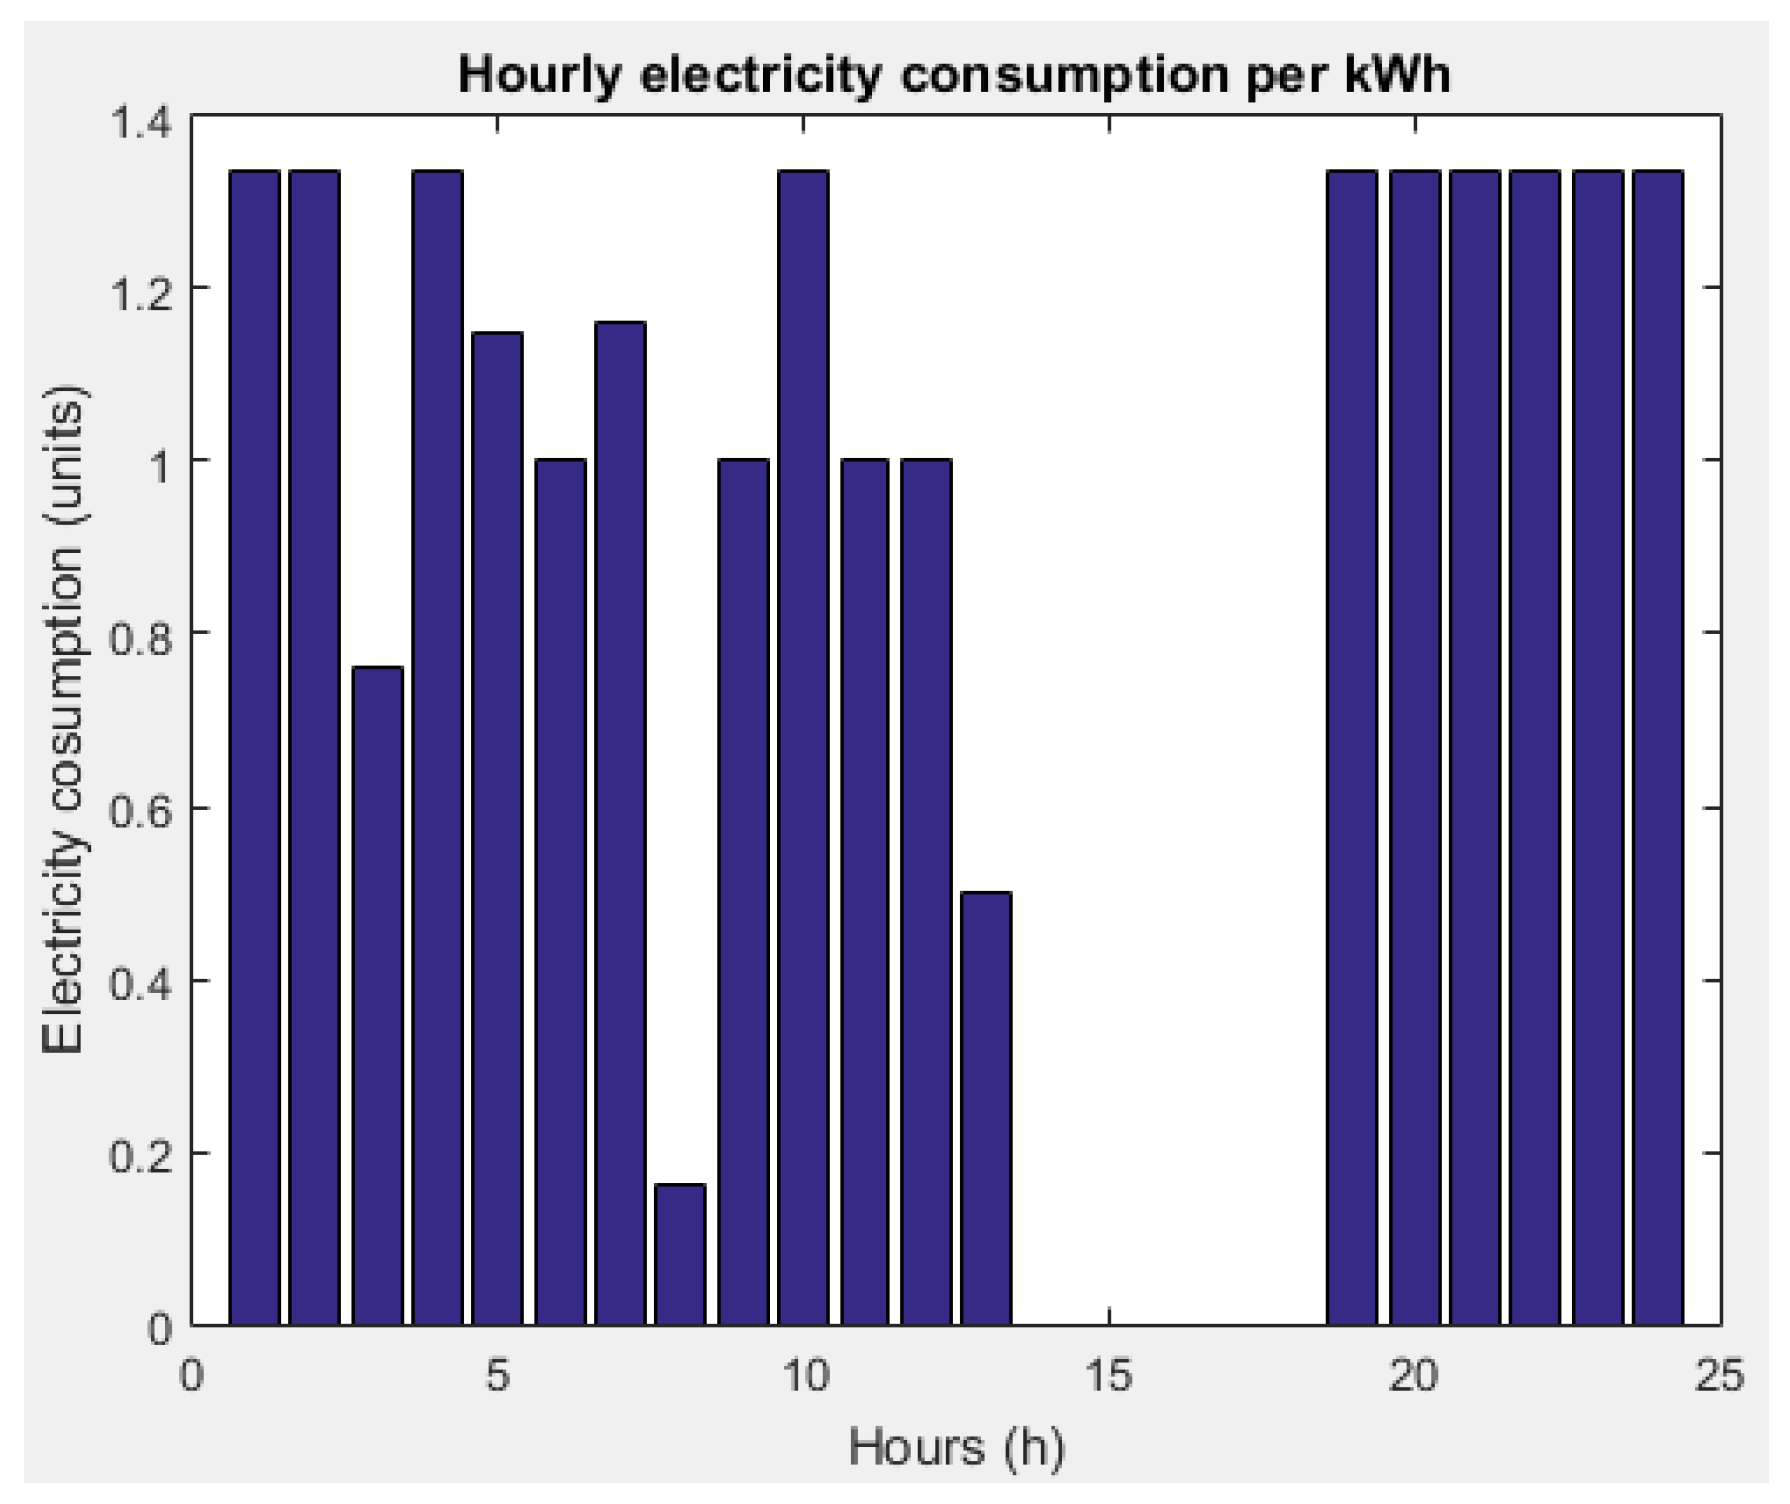
Then, we have added the storage device with high efficiency (90%) that stores the energy generated by PV. It operates in charging/discharging alternative cycles considering the objective function of the optimization model. The maximum charging capacity is 0.1 kW, maximum consumed energy is 1 kWh, while for discharging and the maximum generated energy is 0.9 kWh. In
Figure 13 (cumulative consumption) and
Figure 14 (individual consumption), the optimization results with PV and SD are shown. The daily consumption curve indicates the reduction of the consumption peak, but at some time intervals consumption is fed by PV/ discharging of the SD (especially during 14 and 18 h).
Consumption of the appliances has been uniformly distributed considering their features, consumer’ preferences and the objective: minimization of the consumption peak as in
Figure 14.
In this case as a consequence of adding SD, the consumption peak decreases from 1.56 kWh to 1.34 kWh. Also, the electricity payment varies between 2.164 € (ToU_F) and 3.304 € (ToU_A).
Out of these analyses, the presence of the SD brings benefits from the consumption peak and electricity payment point of view, therefore both grid operators and consumers win when SD is installed, especially when ToU_F is implemented. In
Table 2, the results of the comparative analysis with/without optimization based on the same ToU tariffs A and F, PV and SD scenarios in terms of consumption peak and payment are presented. The two ToU tariffs (A and F) give the extreme values in terms of consumption peak and payment. Tariffs ToU_E and ToU_F offer the best results in terms of electricity payment minimization (as in
Table 3), especially in the scenario consumption peak minimization with PV and SD, applying
intlinprog function.
As in [
24], the optimum capacity of SD could be established considering several consumption base case scenarios. This approach is based on the assumption that the residential consumers’ goal is to minimize the electricity payment. Therefore, the electricity consumers’ flexibility in terms of shifting appliances is rewarded by diminishing the payment using the SD.
In
Figure 15, the daily consumption curves with
inlinprog Matlab function with the two objective functions (minimization of consumption peak and minimization of electricity payment), then adding the PV and SD to the initial scenario are graphically depicted.
In the initial scenario with twelve appliances, we obtain the best results with minimization of consumption peak objective function, then, by adding the PV and SD the results significantly improved.
4. Conclusions
With smart grids technologies such as smart meters, sensors and actuators, the consumption optimization at the residential consumers is nowadays possible. The input data is gathered through a set of sensors based on Arduino components for monitoring and controlling the household appliances and collecting the data into a relational database running Oracle 12 Database. The optimization process considering the type of the appliances, reads the initial scheduler and optimizes their consumption based on two objective functions: Minimization of consumption peak and minimization of electricity payment. The results lead to the conclusion that only minimization of the consumption peak can bring sustainable development of the power systems. In addition, we performed simulations with two Matlab functions: inlinprog and fminimax; comparing the results, intlinprog function is the most appropriate optimization function for reaching our goal.
Then, on top of the twelve applications, we added PV panels and a storage device in order to investigate their effect on the consumption curve. In this scenario, the consumption peak reduced by 47.5% from 2.55 kWh (no optimization) to 1.34 kWh. Also, the daily electricity payment reduces by 11%. Although the highest electricity payment reduction is reached when the objective function is the minimization of the electricity payment (around 50%), the consumption peak in this case increased by 18%, that leads to non-uniformly loading of the power grid and additional stress that in the end new peaks may occur. Therefore, new advanced tariff scheme are needed in order to overcome the new peaks. Thus, it is demonstrated that on the long term only the minimization of the consumption peak lead to sustainable electricity payment minimization.
The presence of PV and SD is benefic for both grid operators and consumers due to the fact that consumption peak and electricity payment are diminished compared with initial scenario. Although the initial proposed scenarios reduce the consumption peak and electricity payment, presence of PV and SD will motivate the consumers to optimize the operation scheduling of their appliances since it leads to more savings.
In this paper, modeling of different types of appliances is performed, dividing the appliances in three categories based on their operation mode. Then, the Arduino based sensors controlling and monitoring of data generated by appliances are depicted, the processing of data being performed by several procedures and functions written in PLSQL language included in a proposed informatics solution architecture. Two objective functions: minimization of electricity payment and minimization of consumption peak are considered in order to identify the impact of PV and SD in different scenarios with six three-level ToU tariffs. Out of the two objective functions, the minimization of consumption peak proved to lead to a sustainable development due to the fact that by flattening the load curve overloading of the grids can be avoided. Second approach is to minimize the electricity payment that may lead to new peaks since the consumers will tend to shift their appliances to low rate tariffs. Out of simulations, the ToU tariff pattern that rewards and could motivate best the consumers that are willing to change the electricity consumption behavior is identified.
One limitation of our approach consists in assuming that the consumers are willing to involve in optimization process that is part of a complex demand response program (DR). However, this is not always the case. From different reasons such as (lack of willingness, refrain from revealing private information or participation denial), some consumers refuse to participate in the DR. In this case the DR should be improved, monitored and its performance periodically evaluated.
Another limitation consists in difficult implementation since sensors, storage devices and smart meters technologies are not yet implemented at large scale. However, this aspect will be overcome in the near future by the progress of new technologies with gradually decreasing investment cost and proper policy regulation.
Another limitation is related to the large volume of data flows that require real-time processing and big data technologies. The electricity suppliers or grid operators should develop or acquire new IC & T solutions that able to process large volume of semi- or unstructured data in order to rapidly react to certain circumstances. Nowadays, only few grid operators take advantage of big data technologies, but in short time perspective, the other smaller companies would benefit from cloud solutions that are more affordable and do not require expensive investment in hardware infrastructure.
The acquisition of the SD by grid operator can be a solution for their integration as planning and operation tool and improvement of the power system operation. This approach would incentive the electricity consumers to use SD. On one hand, the grid operator could benefit from the economy of scale by acquiring SD and should easily remotely control the SD with similar characteristics. On the other hand, the cost of SD is gradually decreasing. However, the investment decision should be taken based on a detailed feasibility study.

 ,
, 


