Assessing Multiple Pathways for Achieving China’s National Emissions Reduction Target


1
School of Public Policy and Management, University of Chinese Academy of Sciences, Shijingshan District, Beijing 100049, China
2
Division of Sustainable Development Strategy, Institutes of Science and Development, Chinese Academy of Sciences (CASISD), Haidian District, Beijing 100190, China
*
Author to whom correspondence should be addressed.
Sustainability 2018, 10(7), 2196; https://doi.org/10.3390/su10072196
Submission received: 28 May 2018
/
Revised: 24 June 2018
/
Accepted: 25 June 2018
/
Published: 27 June 2018
(This article belongs to the Special Issue Challenges on the Asian Models and Values for the Sustainable Development)
Abstract
:In order to achieve China’s target of carbon intensity emissions reduction in 2030, there is a need to identify a scientific pathway and feasible strategies. In this study, we used stochastic frontier analysis method of energy efficiency, incorporating energy structure, economic structure, human capital, capital stock and potential energy efficiency to identify an efficient pathway for achieving emissions reduction target. We set up 96 scenarios including single factor scenarios and multi-factors combination scenarios for the simulation. The effects of each scenario on achieving the carbon intensity reduction target are then evaluated. It is found that: (1) Potential energy efficiency has the greatest contribution to the carbon intensity emissions reduction target; (2) they are unlikely to reach the 2030 carbon intensity reduction target of 60% by only optimizing a single factor; (3) in order to achieve the 2030 target, several aspects have to be adjusted: the fossil fuel ratio must be lower than 80%, and its average growth rate must be decreased by 2.2%; the service sector ratio in GDP must be higher than 58.3%, while the growth rate of non-service sectors must be lowered by 2.4%; and both human capital and capital stock must achieve and maintain a stable growth rate and a 1% increase annually in energy efficiency. Finally, the specific recommendations of this research were discussed, including constantly improved energy efficiency; the upgrading of China’s industrial structure must be accelerated; emissions reduction must be done at the root of energy sources; multi-level input mechanisms in overall levels of education and training to cultivate the human capital stock must be established; investment in emerging equipment and accelerate the closure of backward production capacity to accumulate capital stock.
1. Introduction
Rapid industrialization has brought increased wealth for society and subsequently improved people’s living standards. Furthermore, the growing industrialization has also led to the increase of urbanization. Meanwhile, the demand for energy is growing considerably. However, the current energy structure in China is dominated by fossil fuels. Therefore, the increasing demand for energy will bring a tremendous increase in carbon dioxide emissions [1,2]. According to the Intergovernmental Panel on Climate Change (IPCC), global climate change in the past 50 years is largely attributed to the fact that greenhouse gas emissions are growing [3,4,5]. Following the report from the International Energy Agency (IEA), China had surpassed the USA by 2007 and had become the world’s largest carbon emitter. China was responsible for 19.12% of global carbon emissions in 2016 [6]. At the United Nations Climate Change Conference in 2015, China submitted its Intended Nationally Determined Contribution (INDC) report, in which it states that it will reduce its carbon intensity (CO2 emissions per unit GDP) by 60–65% in 2030 compared to the level in 2005 [7]. The realization of this target can accelerate China’s transformation to a green, low-carbon economy and serve as an important foundation and model in achieving the global target of 2 °C temperature increase [8]. Although some progress has been achieved (i.e., the energy intensity decreased 33.8% from 2005 to 2014), China’s carbon intensity is still at a high level. The energy consumption structure still needs to be optimized [9]. In order to achieve its target on emissions reduction in 2030, there is a need for identifying a scientific pathway and feasible strategies, especially before China achieves the early peaking of its carbon emissions [10,11,12].
The imbalance in economy development between regions appears in all economies, as differentiated growth always results in early-developing and late-developing regions [13]. The imbalances are visible not only in economic growth, but also in other facets like sectorial structures and models of energy consumption [14,15]. In order to achieve the target of emission reduction, policies must fit into the reality of local socioeconomic development. López-Peña et al. [16] found the effect of improving energy efficiency on emissions reduction is more effective and less costly than developing new energy sources in the short to middle run. Chang et al. [17] found that the optimization of the energy demand structure was an effective way for emissions reduction based on an empirical study for Taiwan 1984 to 2004, which includes data from three sectors with the highest carbon emissions: high-speed transportation sector, petrochemical raw materials, and steel. Tian et al. [18] further found that not only should the energy be optimized but also the energy demand structure should be optimized for meeting the target of emissions reduction, as seen from an example in Beijing. Elliott et al. [19] analyzed the relationship between urban energy intensity and transnational corporations shown in a data sample drawn from prefecture-level cities in China from 2005 to 2008, found a significant negative correlation between inflow of foreign direct investments (FDI) and urban energy intensity, which is also affected by the cities’ geographical locations. Peters et al. [20] found that optimizing a country’s trade model could be used to achieve emissions reduction targets. Zhang et al. [12] found most environment-related scientific innovations had positive effects on emissions reduction from their empirical study in 2000–2013. Yang et al. [21] developed transcendental logarithmic functions of production and growth to study China’s energy structure and its evolution, and discovered that human capital investments, capital stock investments, and progressing fossil fuel technologies were helpful towards achieving a win-win scenario of both growth and emissions reduction. Al-Mulali et al., Sheng and Guo [22,23] found that urbanization, to a certain extent, could effectively improve the energy efficiency and thereby reduce carbon emissions.
Among their studies, researchers postulated many strategies and methods to realize reduction targets, including better energy efficiency or demand structure, more FDI, newer trade models, more environment-related innovations, and higher urbanization rates. Despite differences, certain common themes can be gleamed. For example, upgrades to the economic structure can impact emissions through affecting domestic consumption and technological progress, while investments into capital stock and human capital are major factors for economic growth [24]. Urbanization can lead to reduced energy use and emissions by improving human capital use, energy consumption structure, and energy efficiency [25,26]. It is also widely recognized that innovative activities are inseparable from human capital and capital stock, which include environment-related innovations [27,28]. At the same time, practical results from OECD countries have shown that technological improvements and optimization of the energy structure and economic structure are crucial to achieving reduction goals [29,30,31]. Based on existing research, we encapsulate the elements of reduction policies into five main factors: energy structure, economic structure, human capital, capital stock, and potential energy efficiency, and consider all reduction policies and measures to be the optimization of one or more factors [32,33,34,35,36].
In existing studies, investigators have discussed various pathways for increasing energy efficiency, such as optimizing its energy demand structure, attracting FDI, improving its trade model, encouraging environment-related innovations, and furthering urbanization etc. [18,19,20,21,22,23]. On the one hand, the previous researches’ conclusions of carbon intensity emissions reduction give us a theoretical guidance to consider the factors achieving emissions reduction goals, on the other hand, none of the factors affecting the achievement of emissions reduction targets is independent. For example, the improvement of energy may not be independent, it works with others factors, like economic structure, human capital, capital stock, and potential energy efficiency. System analysis method is the key to formulating the scientific emissions reduction pathway. China is the largest developing country and also the largest emissions contributor; therefore, it plays an important role in world development and mitigation. At the same time, the energy structure, economic structure, human capital, capital stock, and potential energy efficiency in China are very different from that in other countries. However, there is a lack of systematic analysis on assessing multiple pathways for carbon emissions reduction. Throughout the existing studies, we have found that research on emissions reduction pathways was either based on the theoretical exploration of single factor scenarios or multi-situation simulations in other countries. How to design and assess its transition pathways to emissions reduction has caught attention from both researchers and policymakers. Any reduction policies should be rooted in the socioeconomics of a region, and reduction measures proven effective elsewhere may not be compatible with the Chinese reality.
In this paper, we set out to build upon previous work, and aim to address the following questions: (1) Can the goal of emissions reduction be achieved through a single-factor pathway? (2) If single-factor pathways cannot meet the targets, how should we develop a multi-factor pathway? (3) How feasible it is for each multiple pathway to achieve the emissions reduction target?
The remainder of this paper is organized as follows. Section 2 will describe the research methodology, data and the parameters used for the scenario development. The parameters include energy structure, economic structure, human capital, capital stock, and potential energy efficiency; Section 3 presents the results of the study. Section 4 concludes the study and the managerial implications are also discussed.
2. Methodology, Data and Parameter Design for the Scenario Development
This section provides a basic description of the model and the source of the data. Further, we describe the parameters for setting up the scenarios in the analysis.
2.1. The Model
Energy efficiency plays an important role in energy saving and emissions reduction, and it is also closely related to industrial development, energy security, environmental protection and social welfare [37,38]. Among the previous studies, Stochastic Frontier Analysis (SFA) and Data Envelopment Analysis (DEA) were the models mainly used to measure efficiency [39,40,41]. Although the DEA method is convenient in evaluating energy efficiency, its production frontier is fixed (i.e., any stochastic disturbance is considered as efficient factors), and thus the result may easily be influenced by extreme values [42]. As a result, the SFA method was recommended by the majority of scholars to evaluate energy efficiency. For example, Lin and Long [41] used the SFA model to analyze energy efficiency of China’s chemical industry; Chen et al. [42] used Bayesian stochastic frontier analysis for measuring efficiency of fossil-fuel electricity generation companies in China. Meanwhile, the SFA will be the key method for evaluating energy efficiency in this paper.
The SFA model of energy intensity by Stern and Jotzo was used for the analysis [43]. This model investigates how energy intensity can be changed by several parameters among 84 countries. In this study, we specify this model in one country, i.e., China. The model has the following form:
where Ei is the mean energy consumption of the country i; Yi is average Gross Domestic Product (GDP) of the country i; Ki is average capital stock of the country i; Hi is average human capital of the country i; Wi is average winter temperature of the country i; yki is the ratio of agriculture, mining, manufacturing, or service sector in its GDP of the country i; eki is the ratio of coal, oil, natural gas, bioenergy, and primary electricity in its total energy consumption of the country i; vi is the normally distributed random error term; ui is potential un-efficiency term, which follows a truncated distribution with a non-negative expectation. The potential energy efficiency is also affected by a series of additional factors denoted by zi, including total factor productivity, ratio of capital stock to land area (representing environmental damage potential in the absence of mitigating technologies), trade rate of market exchange rate to purchasing power parity, openness (ratio of export/import to GDP), corruption, energy reserve, origin of legislations, etc.
The coefficients , and are respectively the coefficients of capital stock, human capital, and winter temperature; is the ratio of coal, natural gas, primary energy, or bioenergy in energy consumption; is the coefficient of energy source; represents the ratio of agriculture, mining and utilities, manufacturing, or service sector in GDP; is the coefficient of sector; is the measurement error. The predicted energy intensity takes the following form:
can be calculated by Equation (3)
The potential energy efficiency in the period t is calculated by beta convergence.
The predictive value of carbon emissions in 2030 is given by the following equations.
where the carbon emission coefficient is 3.693 for coal; 2.884 for oil; 2.055 for natural gas, with data from the IPCC 5th Assessment Reports [44].
In Equation (4), has already been obtained from Equation (3), while refers to the carbon emission per unit energy in period t, and Equation (5) shows its solution. To ensure accuracy, we use 2013 as the base period to revise in the period t by the following:
where is calculated as the ratio of the real carbon emissions to GDP of 2013, with data from EIA [45].
2.2. The Data
The required data and their various sources are presented in Table 1.
It can be noted that the national GDP is used for analyzing the economic structure. In this study, we define that the national GDP is a sum of outputs from the agriculture sector, mining & utilities sector, manufacturing sector and services sector. We collected data for the agriculture sector, manufacturing sector and service sector from World Development Indicators. Afterwards, we computed the output for mining & utilities sector. The unit for GDP is in millions of USD. Using the perpetual inventory equation to measure the Capital stock measure, a detailed process follows Stern and Jotzo [43]. We used the average winter temperature as the temperature data, given a default value of −5.8 °C each year. The human capital is computed by Equations (7) and (8). According to Caselli and Jones’ suggestions [51,52], we assume θ = 0.07, workers denoting the number of workers, and s denoting their average number of years in education. The former comes from Penn World Table, version 9.0, and the latter from Barro and Lee’s database [50]. The human capital factor is calculated by the following:
2.3. Parameter Design and the Scenario Development
China has submitted their emissions reduction contribution plans to the United Nations Framework Convention on Climate Change, yet the feasibilities of the Chinese targets are not fully known. As China is the largest contributor of carbon emission, the realization of its target is important for the world. In this study, we calculate China’s carbon intensity reduction from the five dimensions of energy structure, economic structure, human capital, capital stock, and potential energy efficiency. The CPS, NPS, and 450S scenarios are used for energy structure; the LEC and HEC scenarios for economic structure; the Kruger and HC14 scenarios for human capital; the EIU and HCS scenarios for capital stock; and the β-USA, U4, U5, and U6 scenarios for potential energy efficiency.
2.3.1. Energy Structure
IEA had modeled energy consumption structure in China under the settings of current policies, new policies, and average atmospheric CO2 at 450 ppm, denoted as CPS, NPS, and 450S [32], presented in Table 2.
It appears that changes to energy structure alone can make a significant contribution. Table 3 shows how the growth rates of various energy indicators will change following energy structure adjustments (without other changes).
It can be seen that under these three scenarios, the most prominent changes happen to the growth rates of fossil fuel. A more aggressive energy structure change can lead to a lower growth rate. Under these three scenarios, China needs to reduce the growth rate for coal consumption from current 3.02% to a rate between 0.87% and 2.37%. Besides, the growth rate for oil and natural gas consumption should also be reduced to half of the current level.
2.3.2. Economic Structure
We base our low economy scenario (LEC) on the predictive results of the CGEDRC model by Hu et al. [53,54], and our high economy scenario (HEC) on the LEC and HEC scenarios provided by Li and Lou [55], presented in Table 4.
Under the two scenarios, the growth rates of economic indicators in China are listed as Table 4 shows. Huenemann [56] pointed out that the growth rate of China’s economy has been slowing down in recently years. As can be seen in Table 5, under the LEC scenario the growth rate of each economic structure component continues to decrease, with the largest drop taking place in agriculture (from the current 6.36 to −0.62%), while the changes to the second sector are smaller, and the service sector drops from 9.67 to 6.53%. Under the HEC scenario, the non-service sector shows a remarkable drop from the present 6.62 to 4.24%, while the service sector’s growth rate has a slightly less steep drop compared to LEC. Since carbon emissions largely originate from non-service sectors, the more impactful economic scenario has a stronger reduction result.
2.3.3. Human Capital
Human capital is described by the number of workers and their years of education, which can also partially reflect technological changes. We incorporate predictions on human capital by Bailliu et al. [57], and use Equation (9) below to determine the status of human capital in China by 2030, which will be denoted by the Kruger scenario. This is compared to the HC14 scenario, under which human capital continues to grow at the same rate as 2014 (0.74%). Kruger serves as the more realistic scenario, while HC14 (maintaining the 2014 growth level) simulates the ideal scenario. Kruger assumes an annual human capital growth rate of 1%, and HC14 assumes the 2014 rate of 1.47% can be maintained, just as Figure 1 shows. It can be seen that the HC14 scenario grows faster and more aggressively than Kruger, while the latter predicts steadier growth.
In Equation (1), N is the number of workers, S is the average years of education, the parameter θ is assumed to be 0.07. According to Kruger, the number of workers will be reduced by 7% in 2030 compared to 2010, and the average years of education will have increased by 11.9 years.
2.3.4. Capital Stock
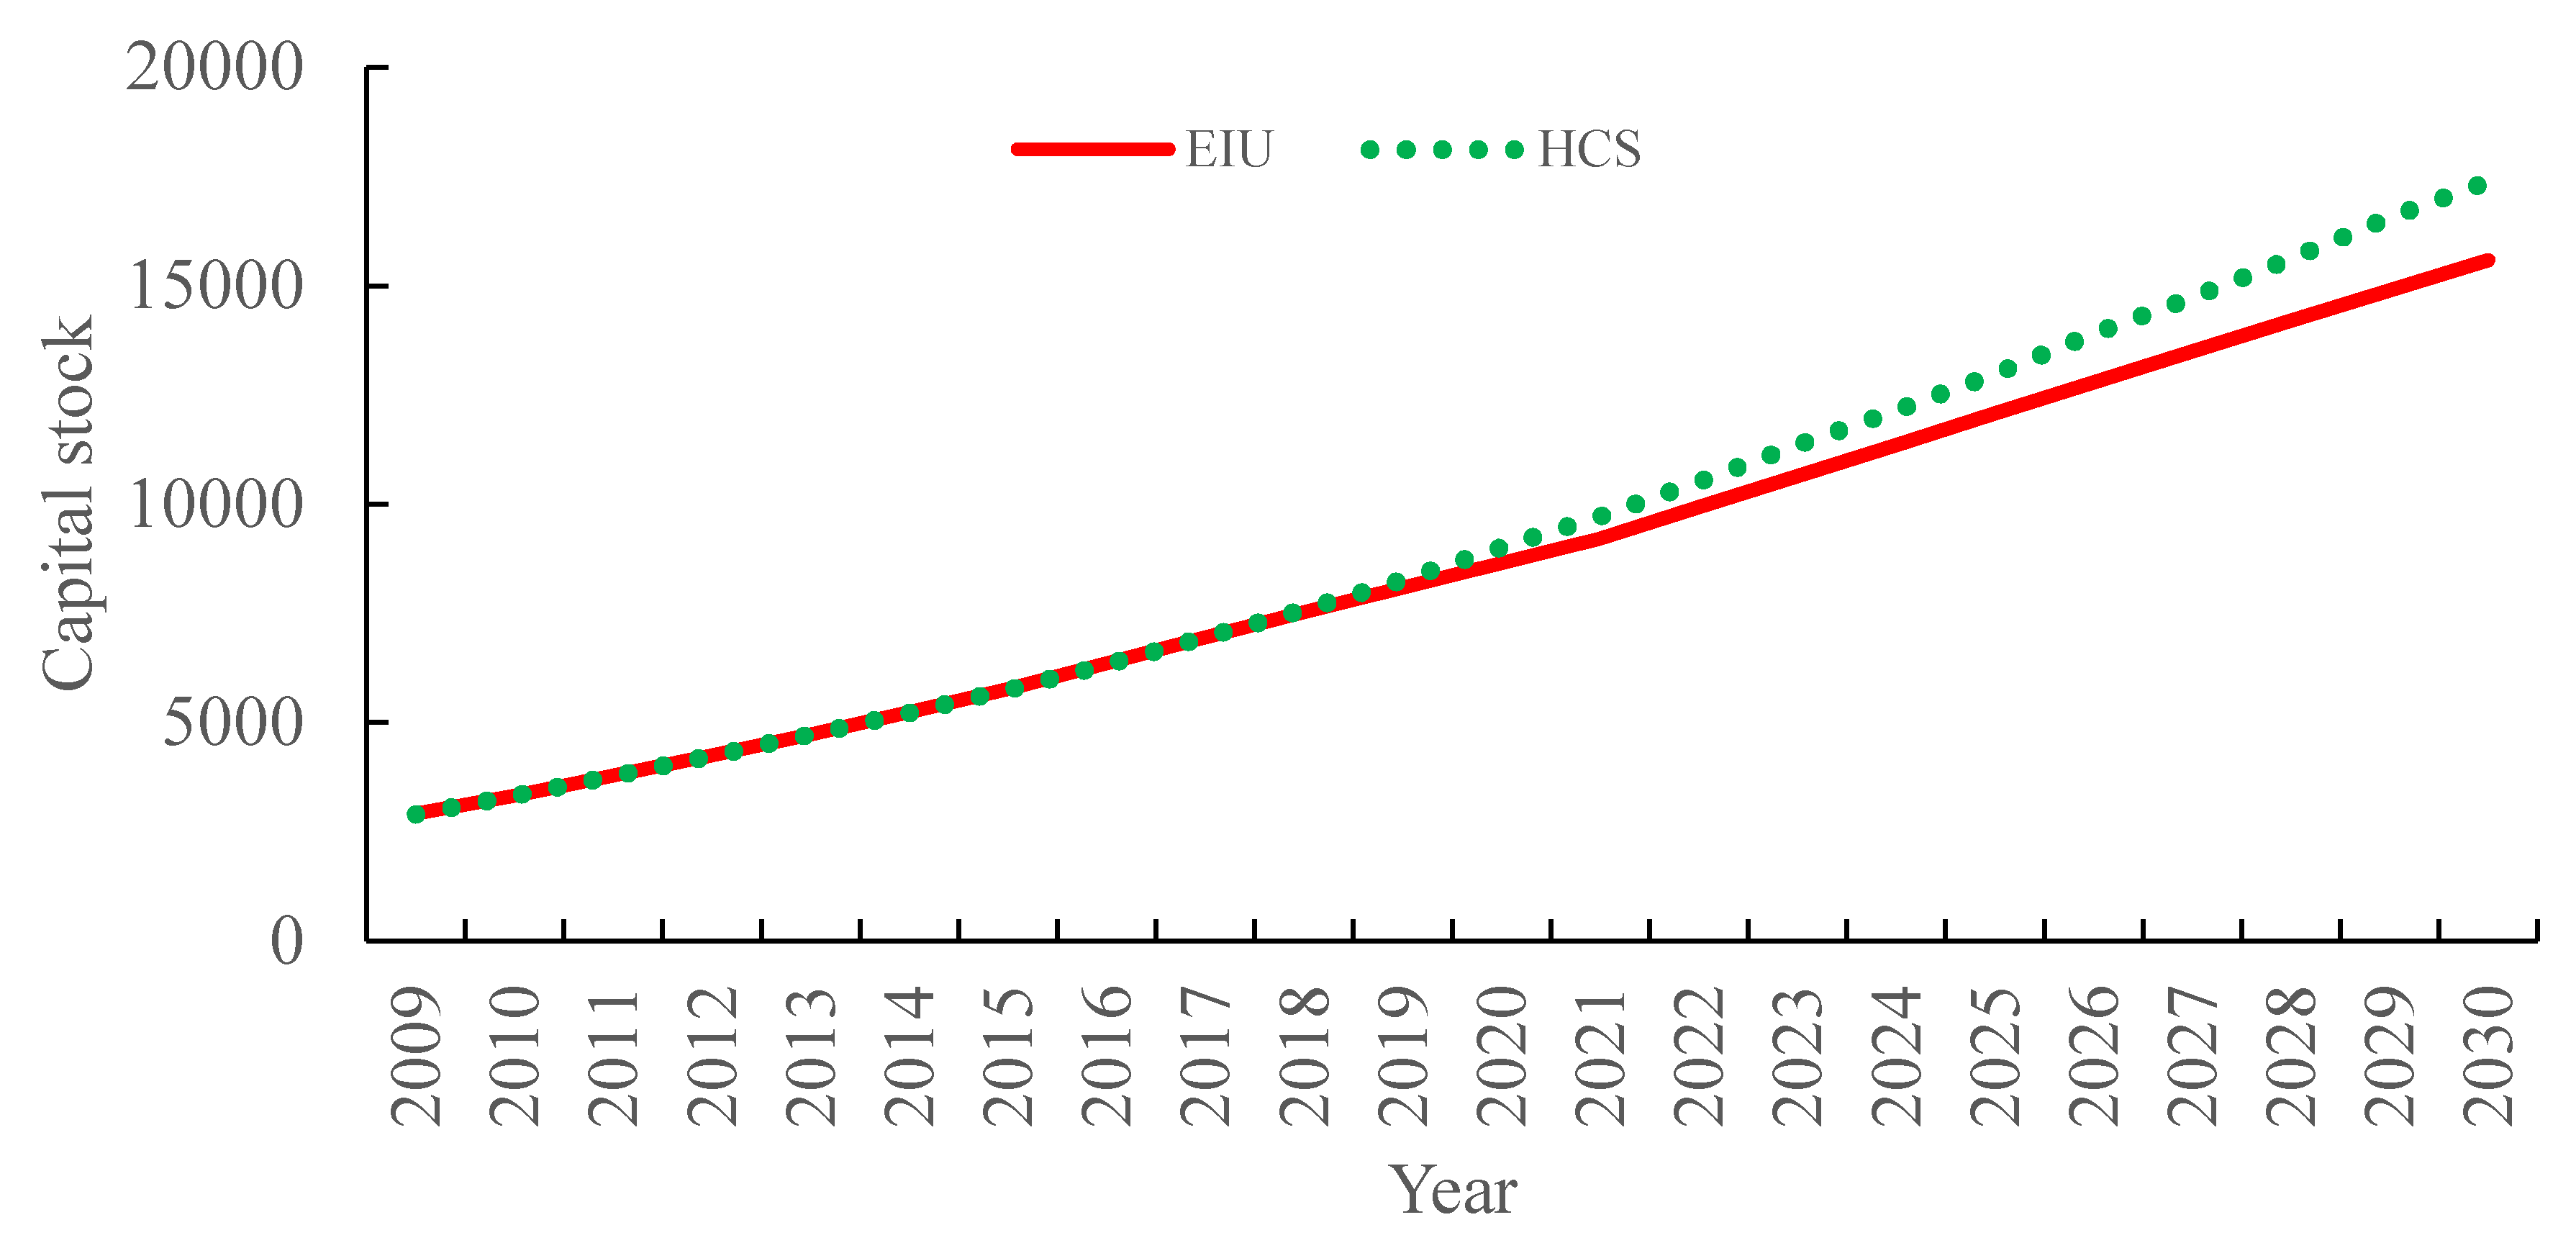
Variations of investments are included under the capital stock dimension. Investment changes have strong effects on both energy consumption and total productivity. We incorporate the EIU database’s predictions on capital stock in China, designated in the EIU scenario, and compare it with the assumption that capital stock has a growth rate based on 2014, except dropping one percent every 3 years, denoted in the HCS scenario.
It can be seen that from 2009 to 2014, the growth of capital stock is relatively stable in China. Assuming the 2014 growth can be maintained, the following predictions can be made. The EIU scenario is less steep and more likely to be achieved, while the HCS scenario is simpler and more aggressive, just as Figure 2 shows. China experienced a capital stock growth rate of 12.47% during 2009–2014, while the EIU scenario forecasts an annual growth of 7.07% in the 2014–2030 period, which is steady enough to appear true to the present Chinese economy. The HCS scenario assumes the growth rate is lowered by one percent every 3 years starting from 2014’s 10.63%.
2.3.5. Potential Energy Efficiency
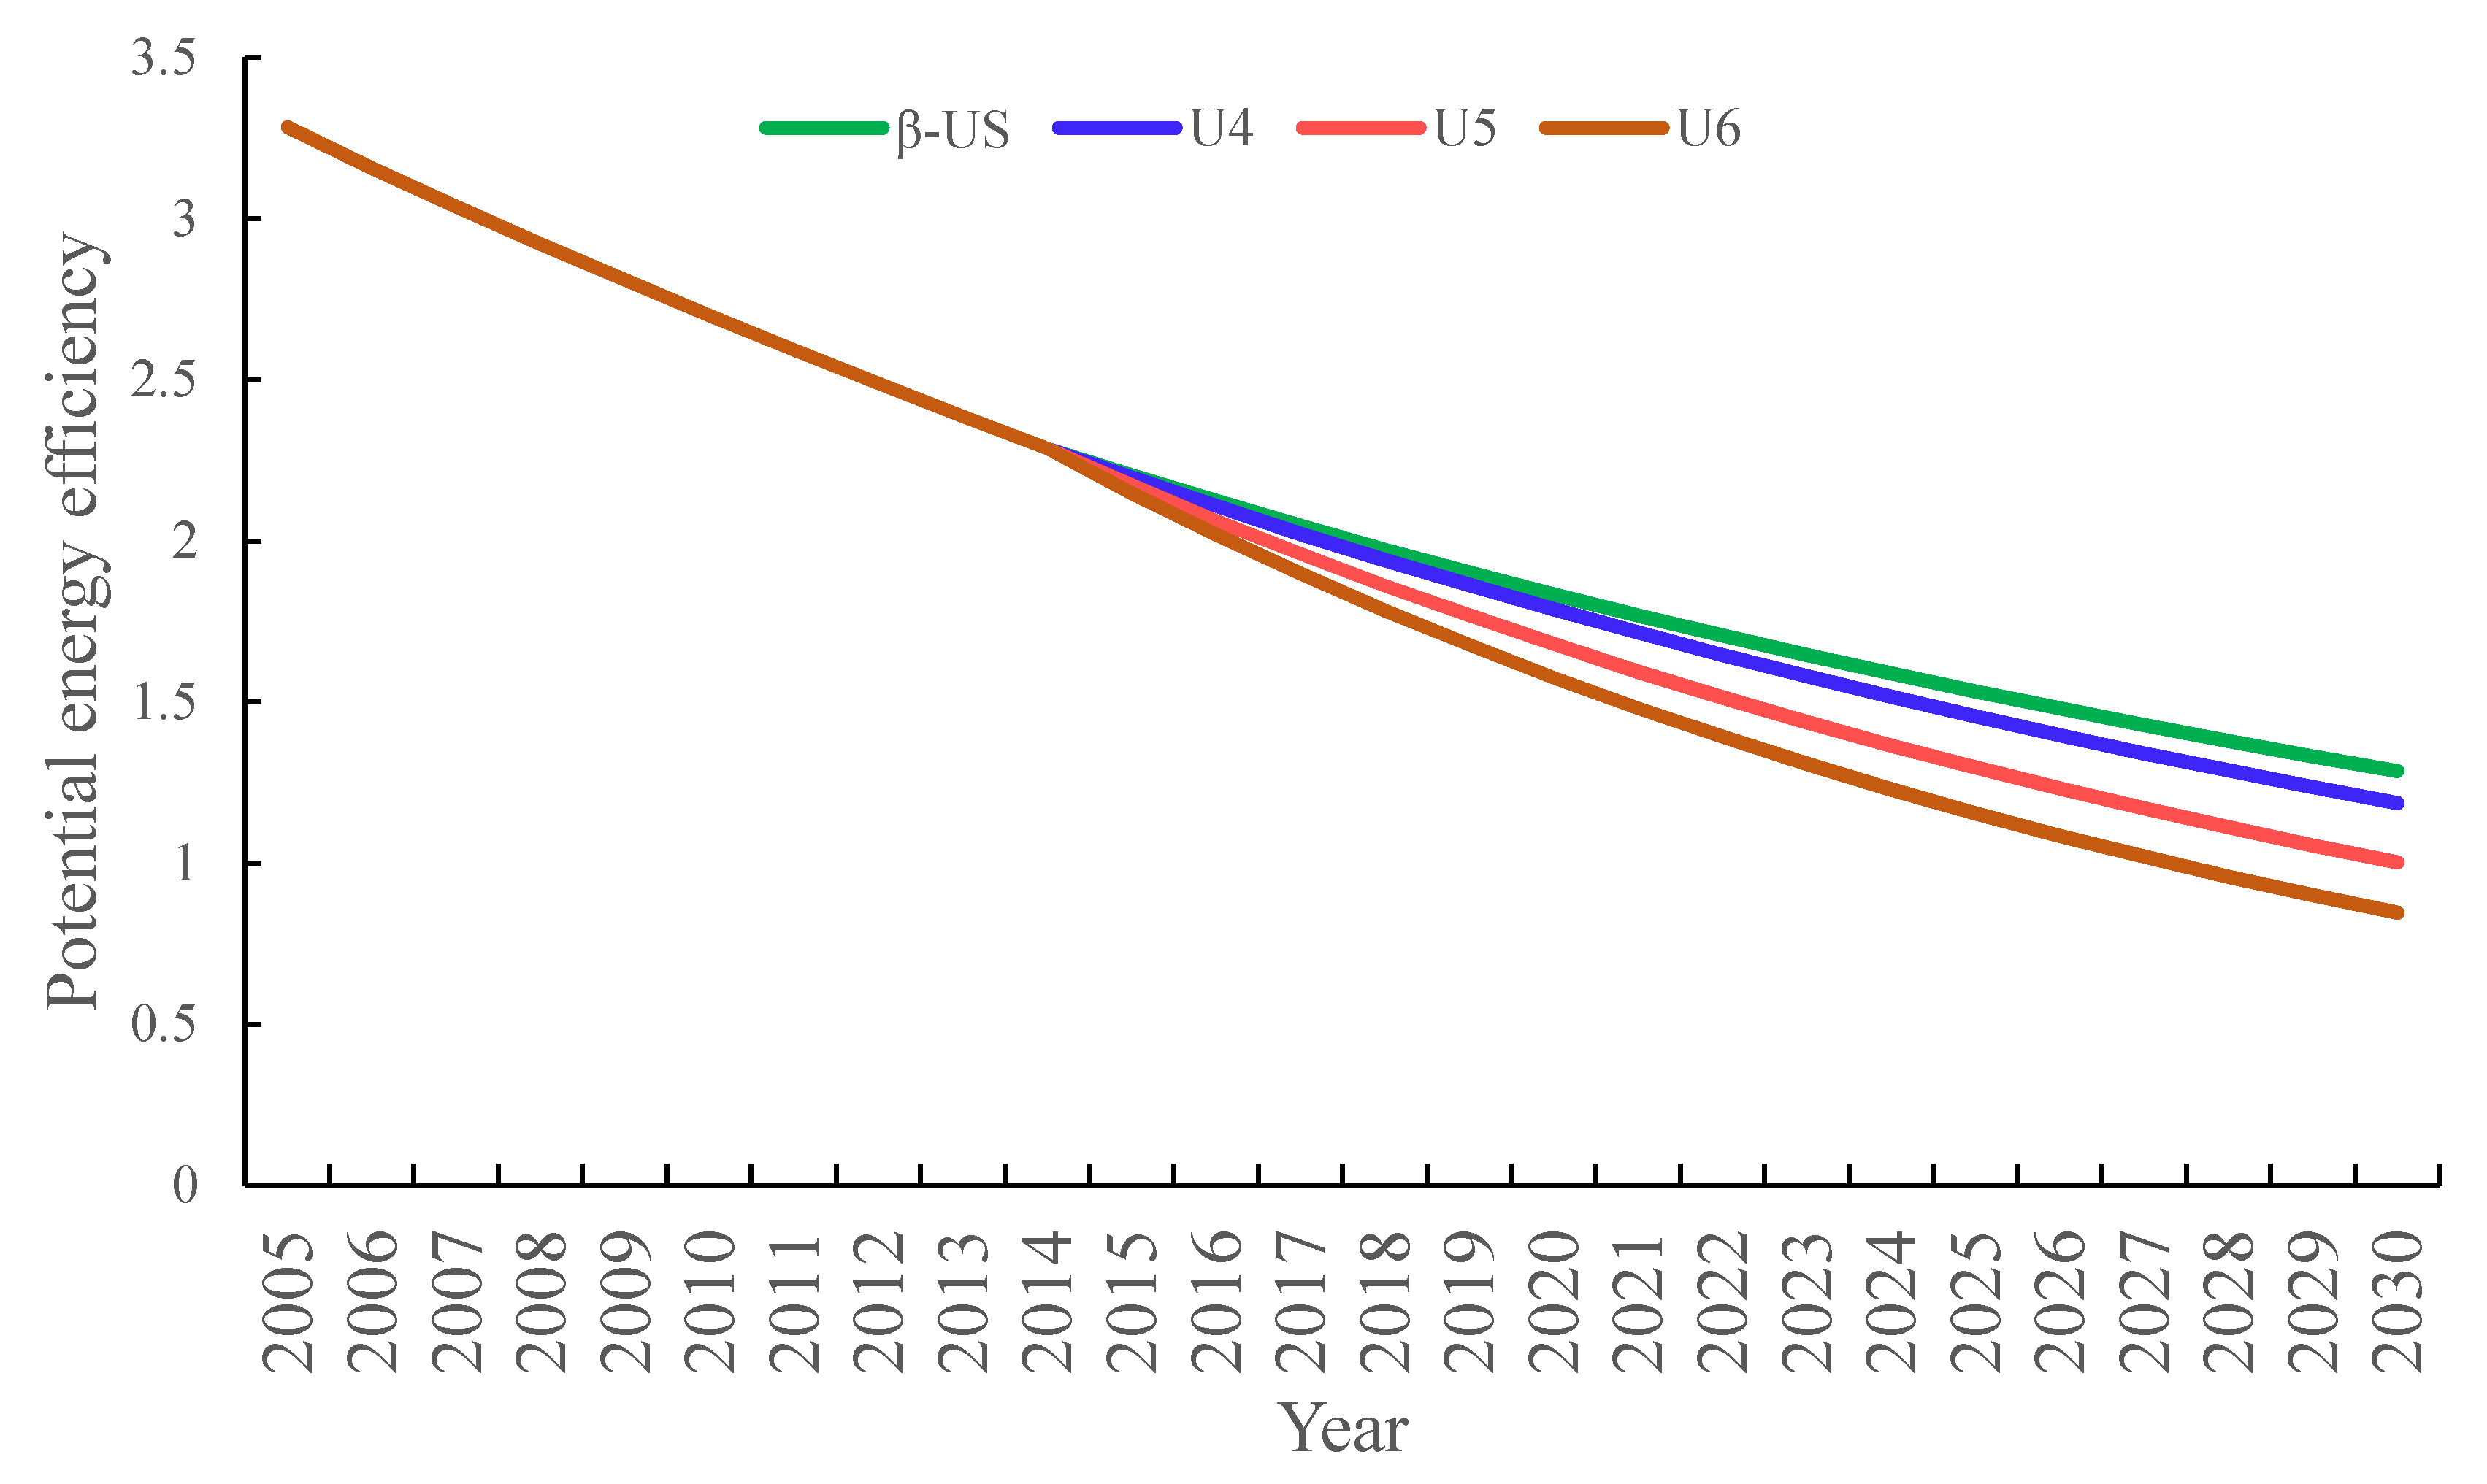
We define potential energy efficiency as the logarithm of the ratio of predicted energy intensity to real energy intensity (lnu, see equations in above sections). This prediction is founded on the presumption that China’s potential energy efficiency can be described by a beta-convergence towards that of the USA. This is the β-USA scenario.
Following Stern [58], we assume conforms to the beta-convergence equation below
The following illustrates β-USA, in which China’s potential energy efficiency converges towards the USA, the largest economy and technological leader in the world. In this study, u is negatively correlated to the speed of technological progress. We have found China to have a u change rate of −4% in the 2009–2014 period. The U4 scenario assumes this rate is maintained. The U5 and U6 scenarios respectively assume change rates that are even steeper by 1% and 2%, presented in Figure 3.
To better illustrate growth rates, we choose 1/u as the growth rate indicator for energy efficiency, presented in Table 6. It represents the ratio of GDP produced by unit energy consumption in China to the world, and it having a higher growth rate means faster progress in energy efficiency. From 2009 to 2014, China experienced a potential energy efficiency growth rate of 4.19%, which is similar to the result of beta-convergence. However, under the U5 and U6 scenario, the 1/u value must be higher by an additional 1.1–2.2 percent.
From the five dimensions laid out above, we obtain policy combinations to forecast how well China performs in hitting its 2030 targets. We found that the results only 24 of the 96 scenarios are close to China’s carbon intensity reduction targets. Thus, the table only shows the 24 combination scenarios and 4 basic scenario combinations, the total combination scenarios are 28.
3. Results
Based on parameter design and the scenario development in Section 2.3, we can predict the carbon intensity reduction effects of China under the BAU scenario, single factor adjustment scenarios, and multi-factors combination scenarios, by 2030. Comparing the effects of emission reduction under different scenarios, the design of scientific emission reduction pathways will be given.
3.1. The BAU (Business As Usual) Combination
First, we assume that China does not take any measure to change its energy structure, meaning that no new policy on energy structure will be made. Its energy structure is assumed CPS, economic structure is assumed LEC, human capital is assumed Kruger, and capital stock is assumed EIU, all of which continue with the normal economic trajectory with external economic impacts not accounted for. Its potential energy efficiency is assumed to follow the β-USA scenario.
Under BAU, by 2030, China’s carbon intensity will be lowered by 32.43% compared to 2005, remarkably less than the 60–65% target in the INDC report. The results in each dimension can be seen below.
3.2. Combinations with Single-Factor Adjustments
The BAU combination only leads to a 32.43% reduction, which means an additional 27.57% contribution is needed to reach the 60% in 2030 target. With BAU as a baseline, we can first analyze how single-factor adjustments contribute to reduction, see Table 7 for details.
With only energy structure adjustments, imposing the NPS and 450S conditions, respectively, carbon intensity is reduced further by 2.31% and 8.4%. That is to say, at most a reduction of 8.4% is achievable by changing energy structure alone.
If we only adjust economic structure, the HEC condition can further decrease carbon intensity by 5.98%, which is considerable.
By only taking human capital into consideration, by imposing the HC14 condition, the combination has a total reduction of 35.36%, meaning HC14 only contributes 2.93%. The effect of human capital seems limited.
Only from the adjustment of capital stock, the combination has a total reduction of 34.55%. The capital stock contribution is only 2.12%.
Considering the adjustments of potential energy efficiency only by imposing the U4, U5 and U6 conditions, respective reductions of 37.72%, 47.33% and 55.54% can be achieved. The contribution is 5.3% from U4, 14.91% from U5, and 23.11% from U6. The target is still unachievable, but potential energy efficiency obviously can make the greatest contribution.
In summary, the potential energy efficiency condition U6 has the highest contribution at 23.11%; the capital stock condition HCS has the lowest at 2.12%. It can be seen that the target cannot be achieved by policy adjustments to any single one of the five factors.
3.3. Multi-Factor Adjustments
Having shown any single factor cannot help reach the goal alone, the 28 combinations are then analyzed and categorized as Table 8 presents.
Under energy structure, CPS is considered the baseline scenario, NPS the steady scenario, and 450S the aggressive scenario. Under economic structure, HEC is considered the aggressive scenario, LEC the steady scenario. Under potential energy efficiency, β-USA is considered the baseline scenario, U4 the steady scenario, U5 the aggressive scenario, and U6 the very aggressive scenario. The baseline and target-achieving combinations are analyzed in the following sections, as Table 8 shows.
As Scenario combinations 1–4 shows, there are four policy combinations for baseline energy structure and efficiency with steady economic policies, achieving reductions between 32.43% and 37.39%. Combination 1 has the lowest contribution at 32.43%, which is the baseline one where the two remaining factors contribute zero. Combination 4 adds 4.96% to achieve a 37.39% reduction, i.e., given other conditions, the most aggressive human capital and capital stock policies have a total contribution of 4.96%.
As Scenario combinations 5–8 shows, with steady energy and economic structures, and very aggressive efficiency policies, the reduction is between 57.06% and 60.21%. Combination 8 achieves a reduction of 60.21%, which reaches the target. In this case, given other conditions, the combination of NPS, U6, HC14, HCS contributes 27.79%. To follow this path means China must make steady adjustments to energy structure and maintain an energy efficiency improvement rate 2% higher than the world.
As Scenario combinations 9–12 shows, by combining aggressive energy structure, steady economic structure, and very aggressive energy efficiency policies, China can reach carbon intensity reductions between 61.06% and 63.92%. Actually achieving these changes would be a great challenge to China’s energy policies and efficiency-related technologies.
As Scenario combinations 13–15 shows, by carrying out aggressive policies in three dimensions, reductions between 57.96% and 61.05% can be achieved. Combination 16 hits the target by causing a 61.05% reduction, in which the conditions of 450S, U5, HC14 and HCS will contribute 28.62%. This path requires China to make aggressive changes to its energy structure and efficiency and general economic structure, raising the ratio of non-fossil energy sources, expanding the service sector further than the steady scenario, and realizing an efficiency improvement rate 1% ahead of the world.
As Scenario combinations 16–20 shows, with this set, reductions between 59.48% and 62.45% can be achieved. Here the combinations 18, 19 and 20 can realize the target. Given the conditions, HEC, U6, HC14 and HCS achieve a contribution of 30.03%. This path involves no change to energy structure, aggressive economic changes, improving energy efficiency at a rate 2% faster than the world, and potentially a faster increase of the service sector ratio.
As Scenario combinations 21–24 shows, this set leads to reductions between 60.86% and 63.74%. All four combinations hit the target, and NPS, HEC, U6, HC14, and HCS combination has a total contribution of 31.33%. Following this path means only making steady changes to energy structure, while aggressively changing the economic structure, and making even faster progress in efficiency. Compared to the previous one, this set has similar economic structure and efficiency requirements, yet ramps up the energy structure change, making it less optimal.
As Scenario combinations 25–28 shows, this set leads to reductions between 64.51% and 67.12%. All four combinations hit the target, and the 450S, HEC, U6, HC14, and HCS combination contributes 34.69%. Again, this requires even greater changes to the energy structure in addition to other aggressive policies, which is suboptimal.
4. Conclusions and Discussion
China is currently the world’s largest energy consumer and contributor for global carbon emission. China has repeatedly stated its willingness to take the responsibility in fighting global climate change, and to also set up clear targets for emissions reduction. As China’s industrialization is still progressing, carefully designed policies are essential to mitigate the economic impact of carbon control. We used multiple policy pathways to simulate the outcomes of emissions reduction. The five factors are energy structure, economic structure, human capital, capital stock, and potential energy efficiency.
By applying the stochastic frontier analysis of energy efficiency for the 96 scenarios of policy combinations, we can find the better pathways for achieving the emissions reduction target for China. The results of the stochastic frontier analysis shows that (1) it is unlikely to reach the 2030 intensity reduction target of 60% by only optimizing a single factor; potential energy efficiency U6, the most effective scenario, still only contributes 23.11%, while the lowest, capital stock HCS only contributes 2.12%; (2) the analysis of multiple-factor pathways show that effective scenarios usually require a very aggressive energy efficiency policy (meaning they have to have 2% higher energy efficiency than the global level), which can be a challenge for China in its middle and later stage of industrialization; (3) if China only adopts an aggressive energy efficiency policy, in order to achieve emission reduction targets, it requires that the proportion of fossil fuels be less than 80% in the energy structure, and the average growth rate of fossil fuels be reduced by about 2.2%; in terms of economic structure, the proportion of the service sectors should reach to 60.4% or more, and the average growth rate of non-sectors should be reduced by 2.4%; in terms of human capital, China is required to maintain at least the growth rate in 2014; the growth rate of the capital stock should follow the current economic development trend and be reduced moderately. Overall, the combination of factors is needed for China to achieve its target, and policy adjustments must be made in its energy structure, economic structure, human capital, capital stock, and efficiency.
4.1. Specific Recommendations
The results also have several specific recommendations for carbon reduction policy makers.
Firstly, energy efficiency must be constantly improved. From the results of the study, it can be seen that energy efficiency is the biggest contributor to emission reduction targets. Thus, policymakers should try to improve regional energy efficiency as much as possible, including relying on technology innovation and proper market-based mitigation mechanisms.
Secondly, the upgrading of China’s industrial structure must be accelerated. Apparently, this goal cannot be achieved by expanding the service sector alone. Instead, policymakers must also encourage the second sector to transform from labor-intensive manufacturing to knowledge-intensive high technologies and equipment manufacturing, ensuring their quality increase at a pace appropriate for their scales.
Thirdly, emissions reduction must be done at the root of energy sources. Presently, China possesses rich coal deposits, is more export-reliant on oil and natural gas, and faces several bottlenecks in growing its renewable energy sources. Any energy policy must be founded on this resource basis and devised with long term considerations. In addition to transforming the energy structure, China has to ensure its energy security and must respond to climate changes. Therefore it is advisable to concentrate efforts on clean low-carbon energy, and develop both non-fossil sources as well as methods to utilize fossil energy more cleanly and efficiently.
Fourthly, to ease the carbon emissions constraints of further growth, it is necessary to increase investment in human capital so as to cultivate and accumulate the human capital stock of the low-carbon economy. The main methods include: increased investment in basic education; vocational education; technical training and raising the overall levels of education; clarifying responsibilities of governments, enterprises and individual; establishing multi-level input mechanisms; strengthening investment in knowledge and skills training for workers.
Finally, capital stock needs enough room to grow before they can support emissions reduction. China needs policies that ensure the sustained and steady growth of investment in domestic capital stock, including focus on the investment in the transformation and upgrading of traditional equipment, accelerating the speed of closure backward production capacity.
There are the same limitations in this article. First, in our study, the factors taken into consideration included energy structure, economic structure, human capital, capital stock, and energy efficiency; some others factor maybe neglected. For a broad analysis, some factors that may affect emissions reductions should also be included in the scenario setting, including urbanization rate, R&D investment, etc. Second, the scenario setting needs to be further updated. More recently, IEA released 2 Degree Scenarios (2DS) and Beyond 2 Degree Scenarios (B2DS) in the Energy Technology Perspectives reports. Future research should be based on the most recently available scenarios to further analysis. Third, the SFA model used in this study assumed that the random error term obeys normal distribution. In future, our study will be based on the hypothesis that the random error term obeys half-norm distribution and truncated normal distribution, respectively.
Author Contributions
For research articles with several authors, a short paragraph specifying their individual contributions must be provided. The following statements should be used Y L. conceived and designed the work; M.Y.W. conducted the analysis; Y.W.L. drafted the paper; S.X.Y. and M.Y.W. polished the manuscript; L.Y.Y. collected the data for analysis.
Acknowledgments
The authors wish to thank for research funding from the National Key Research and Development Program of China (2016YFA0602500), the National Natural Science Foundation of China’s Emergency Management Project (71741017), the National Natural Science Foundation of China (71473242).
Conflicts of Interest
The authors declare no conflict of interest.
References
- Krey, V.; O’Neill, B.C.; Ruijven, B.V.; Chaturvedi, V.; Daioglou, V.; Eom, J.; Jiang, L.; Nagai, Y.; Pachauri, S.; Ren, X. Urban and rural energy use and carbon dioxide emissions in Asia. Energy Econ. 2012, 34, S272–S283. [Google Scholar] [CrossRef]
- Liu, Y.; Tan, X.J.; Yu, Y.; Qi, S.Z. Assessment of impacts of Hubei Pilot emission trading schemes in China—A CGE-analysis using TermCO2 model. Appl. Energy 2016, 189, 762–769. [Google Scholar] [CrossRef]
- Abadie, L.M. Sea Level Damage Risk with Probabilistic Weighting of IPCC Scenarios: An Application to Major Coastal Cities. J. Clean. Prod. 2018, 175, 582–598. [Google Scholar] [CrossRef]
- Sun, M.; Yuan, Y.; Zhang, J.; Wang, R.; Wang, Y. Greenhouse gas emissions estimation and ways to mitigate emissions in the Yellow River Delta High-efficient Eco-economic Zone, China. J. Clean. Prod. 2014, 81, 89–102. [Google Scholar] [CrossRef]
- Wennersten, R.; Sun, Q.; Li, H. The future potential for Carbon Capture and Storage in climate change mitigation—An overview from perspectives of technology, economy and risk. J. Clean. Prod. 2015, 103, 724–736. [Google Scholar] [CrossRef]
- Zhang, S.; Ren, H.; Zhou, W.; Yu, Y.; Chen, C. Assessing air pollution abatement co-benefits of energy efficiency improvement in cement industry: A city level analysis. J. Clean. Prod. 2018, 185, 761–771. [Google Scholar] [CrossRef]
- Suzuki, M. Identifying roles of international institutions in clean energy technology innovation and diffusion in the developing countries: Matching barriers with roles of the institutions. J. Clean. Prod. 2015, 98, 229–240. [Google Scholar] [CrossRef]
- Hou, J.; Teo, T.S.H.; Zhou, F.; Lim, M.K.; Chen, H. Does industrial green transformation successfully facilitate a decrease in carbon intensity in China? An environmental regulation perspective. J. Clean. Prod. 2018, 184, 1060–1071. [Google Scholar] [CrossRef]
- Liao, Z.; Zhu, X.; Shi, J. Case study on initial allocation of Shanghai carbon emission trading based on Shapley value. J. Clean. Prod. 2015, 103, 338–344. [Google Scholar] [CrossRef]
- Liu, Y.; Xiao, H.; Lv, Y.; Zhang, N. The effect of new-type urbanization on energy consumption in China: A spatial econometric analysis. J. Clean. Prod. 2017, 163, S299–S305. [Google Scholar] [CrossRef]
- Xie, R.; Hu, G.; Zhang, Y.; Liu, Y. Provincial transfers of enabled carbon emissions in China: A supply-side perspective. Energy Policy 2017, 107, 688–697. [Google Scholar] [CrossRef]
- Zhang, Y.J.; Peng, Y.L.; Ma, C.Q.; Shen, B. Can environmental innovation facilitate carbon emissions reduction? Evidence from China. Energy Policy 2017, 100, 18–28. [Google Scholar] [CrossRef]
- Liu, L.C.; Liang, Q.M.; Wang, Q. Accounting for China’s regional carbon emissions in 2002 and 2007: Production-based versus consumption-based principles. J. Clean. Prod. 2015, 103, 384–392. [Google Scholar] [CrossRef]
- Jiang, J.; Ye, B.; Xie, D.; Tang, J. Provincial-level carbon emission drivers and emission reduction strategies in China: Combining multi-layer LMDI decomposition with hierarchical clustering. J. Clean. Prod. 2017, 169, 178–190. [Google Scholar] [CrossRef]
- Yu, V.K.; Kolosovsky, A.M.; Tikhonova, A.A. The assessment of research and technical potential in the framework of the innovative model of development of regional economy. Balt. Reg. 2012, 1, 89–96. [Google Scholar]
- López-Peña, Á.; Pérez-Arriaga, I.; Linares, P. Renewables vs. energy efficiency: The cost of carbon emissions reduction in Spain. Energy Policy 2012, 50, 659–668. [Google Scholar] [CrossRef] [Green Version]
- Chang, Y.F.; Lewis, C.; Lin, S.J. Comprehensive evaluation of industrial CO emission (1989–2004) in Taiwan by input–output structural decomposition. Energy Policy 2008, 36, 2471–2480. [Google Scholar] [CrossRef]
- Tian, X.; Chang, M.; Tanikawa, H.; Shi, F.; Imura, H. Structural decomposition analysis of the carbonization process in Beijing: A regional explanation of rapid increasing carbon dioxide emission in China. Energy Policy 2013, 53, 279–286. [Google Scholar] [CrossRef]
- Elliott, R.J.R.; Sun, P.; Chen, S. Energy intensity and foreign direct investment: A Chinese city-level study. Energy Econ. 2013, 40, 484–494. [Google Scholar] [CrossRef]
- Peters, G.P.; Marland, G.; Le Quéré, C.; Boden, T.; Canadell, J.G.; Raupach, M.R. Rapid growth in CO2 emissions after the 2008–2009 global financial crisis. Nat. Clim. Chang. 2011, 2, 2–4. [Google Scholar] [CrossRef]
- Yang, L.; Wang, J.; Shi, J. Can China meet its 2020 economic growth and carbon emissions reduction targets? J. Clean. Prod. 2017, 142, 993–1001. [Google Scholar] [CrossRef]
- Al-Mulali, U.; Fereidouni, H.G.; Lee, J.Y.M.; Sab, C.N.B.C. Exploring the relationship between urbanization, energy consumption, and CO2, emission in MENA countries. Renew. Sustain. Energy Rev. 2013, 23, 107–112. [Google Scholar] [CrossRef]
- Sheng, P.; Guo, X. The Long-run and Short-run Impacts of Urbanization on Carbon Dioxide Emissions. Econ. Model. 2016, 53, 208–215. [Google Scholar] [CrossRef]
- Pan, X.; Yang, Y.; Zhang, W. Spatial effect analysis of foreign direct investment (FDI) on carbon intensity in China. Environ. Eng. Manag. J. 2014, 13, 1251–1255. [Google Scholar]
- Poumanyvong, P.; Kaneko, S.; Dhakal, S. Impacts of urbanization on national transport and road energy use: Evidence from low, middle and high income countries. Energy Policy 2012, 46, 268–277. [Google Scholar] [CrossRef]
- Wang, Z.; Zang, Z. Strategic human resources, innovation and entrepreneurship fit: A cross-regional comparative model. Int. J. Manpow. 2005, 26, 544–559. [Google Scholar] [CrossRef]
- Bosman, P.; Buys, P.W.; Plessis, J.L.D. The impact of human captial development on economic growth. Stud. Univ. Babes-Bolyai 2010, 55, 21. [Google Scholar]
- Li, Y.; Chen, C.; Wang, Y.; Liu, Y. Urban-rural transformation and farmland conversion in China: The application of the environmental Kuznets Curve. J. Rural Stud. 2014, 36, 311–317. [Google Scholar] [CrossRef]
- Cansino, J.M.; Román, R.; Rueda-Cantuche, J.M. Will China comply with its 2020 carbon intensity commitment? Environ. Sci. Policy 2015, 47, 108–117. [Google Scholar] [CrossRef]
- Guan, D.; Klasen, S.; Hubacek, K.; Feng, K.; Liu, Z.; He, K.; Geng, Y.; Zhang, Q. Determinants of stagnating carbon intensity in China. Nat. Clim. Chang. 2014, 4, 1017–1023. [Google Scholar] [CrossRef]
- Yuan, J.; Hou, Y.; Xu, M. China’s 2020 carbon intensity target: Consistency, implementations, and policy implications. Renew. Sustain. Energy Rev. 2012, 16, 4970–4981. [Google Scholar] [CrossRef]
- World Energy Outlook 2014; International Energy Agency: Paris, France, 2014; Volume 2010, p. 3.
- Li, A. Decomposition analysis of factors affecting carbon dioxide emissions across provinces in China. J. Clean. Prod. 2017, 141, 1428–1444. [Google Scholar] [CrossRef]
- Ren, J.; Ren, X. Sustainability Ranking of Energy Storage Technologies under Uncertainties. J. Clean. Prod. 2018, 170, 1387–1398. [Google Scholar] [CrossRef]
- Robaina-Alves, M.; Moutinho, V.; Rui, C. Change in energy-related CO2 (carbon dioxide) emissions in Portuguese tourism: A decomposition analysis from 2000 to 2008. J. Clean. Prod. 2016, 111, 520–528. [Google Scholar] [CrossRef]
- Zhou, Q.; Yabar, H.; Mizunoya, T.; Higano, Y. Exploring the potential of introducing technology innovation andregulations in the energy sector in China: A regional dynamic evaluation model. J. Clean. Prod. 2016, 112, 1537–1548. [Google Scholar] [CrossRef]
- Cullen, J.M.; Allwood, J.M.; Borgstein, E.H. Reducing Energy Demand: What Are the Practical Limits? Environ. Sci. Technol. 2011, 45, 1711–1718. [Google Scholar] [CrossRef] [PubMed]
- Wang, Q.W.; Zhang, C.; Cai, W.H. Factor substitution and energy productivity fluctuation in China: A parametric decomposition analysis. Energy Policy 2017, 109, 181–190. [Google Scholar] [CrossRef]
- Khoshnevisan, B.; Rafiee, S.; Omid, M.; Mousazadeh, H. Reduction of CO2, emission by improving energy use efficiency ofgreenhouse cucumber production using DEA approach. Energy 2013, 55, 676–682. [Google Scholar] [CrossRef]
- Zhou, P.; Ang, B.W.; Zhou, D.Q. Measuring economy-wide energy efficiency performance: A parametric frontier approach. Appl. Energy 2012, 90, 196–200. [Google Scholar] [CrossRef]
- Lin, B.; Long, H. A stochastic frontier analysis of energy efficiency of China’s chemical industry. J. Clean. Prod. 2015, 87, 235–244. [Google Scholar] [CrossRef]
- Chen, Z.; Barros, C.P.; Borges, M.R. A Bayesian stochastic frontier analysis of Chinese fossil-fuel electricity generation companies. Energy Econ. 2015, 48, 136–144. [Google Scholar] [CrossRef]
- Stern, D.I.; Jotzo, F. How ambitious are China and India’s emissions intensity targets? Energy Policy 2010, 38, 6776–6783. [Google Scholar] [CrossRef]
- Working Group I. Contribution to the IPCC Fifth Assessment Report Climate Change 2013: The Physical Science Basis Summary for Policymakers; IPCC WGI AR5; Cambridge University Press: Cambridge, UK, 2013; Available online: https://www.ipcc.ch/report/ar5/wg1/ (accessed on 25 June 2018).
- Conti, J.; Holtberg, P.; Diefenderfer, J.; LaRose, A.; Turnure, J.T.; Westfall, L. International Energy Outlook 2016 with Projections to 2040. United States. Available online: https://www.eia.gov/outlooks/ieo/pdf/0484%282016%29.pdf (accessed on 25 June 2018).
- International Energy Agency. Key World Energy Statistics, Statistics/Key World Energy Statistics 2017; International Energy Agency: Paris, France, 2014; Volume 2011, p. 3. Available online: https://doi.org/10.1787/22202811 (accessed on 25 June 2018).
- The World Bank. World Development Indicators; The World Bank: Washington, DC, USA, 2016. [Google Scholar]
- Achim Zeileis (2017). pwt9: Penn World Table (Version 9.x). R Package Version 9.0-0. Available online: https://CRAN.R-project.org/package=pwt9. (accessed on 25 June 2018).
- Mitchell, T.D.; Carter, T.R.; Jones, P.D.; Hulme, M.; New, M. A Comprehensive Set of High-Resolution Grids of Monthly Climate for Europe and the Globe: The Observed Record (1901–2000) and 16 Scenarios (2001–2100); Tyndall Centre for Climate Change Research Working Paper; Tyndall Centre: Norwich, UK, 2004. [Google Scholar]
- Barro, R.J.; Lee, J.W. International Data on Educational Attainment: Updates and Implications. Oxf. Econ. Pap. 2001, 53, 541–563. [Google Scholar] [CrossRef]
- Caselli, F. Accounting for Cross-Country Income Differences. Handb. Econ. Growth 2005, 1, 679–741. [Google Scholar]
- Jones, C.I. Sources of U.S. Economic Growth in a World of Ideas. Am. Econ. Rev. 2002, 92, 220–239. [Google Scholar] [CrossRef] [Green Version]
- Hu, Z.; Tan, X.; Xu, Z. Scenario Analysis of China’s Economic Development in the Year 2030. In An Exploration into China’s Economic Development and Electricity Demand by the Year 2050; Elsevier: New York, NY, USA, 2014; Chapter 5; pp. 117–140. [Google Scholar]
- Li, S.T. China’s Economic Prospect for the 12th Five-Year Plan Period and 2030. Stat. Res. 2011, 28, 5–10. [Google Scholar]
- Li, P.; Lou, F. Supply-Side Structural Reforms and China’s Potential Economic Growth Rate. China Econ. 2016, 11, 4–21. [Google Scholar]
- Huenemann, R.W. The World Bank and China: Future Prospects. Asia Pac. Policy Stud. 2014, 1, 251–256. [Google Scholar] [CrossRef]
- Bailliu, J.; Kruger, M.; Toktamyssov, A.; Welbourn, W. How Fast Can China Grow? The Middle Kingdom’s Prospects to 2030; Staff Working Papers; Bank of Canada: Ottawa, Canada, 2016; Available online: https://www.banqueducanada.ca/wp-content/uploads/2016/04/swp2016-15.pdf (accessed on 25 June 2018).
- Stern, D.I. Modeling international trends in energy efficiency. Energy Econ. 2012, 34, 2200–2208. [Google Scholar] [CrossRef]
Figure 1.
Forecast of human capital. Sources: Data on workers are from Penn World Table, version 9.0 [48]. Average schooling of the population over the age of 15 from Barro and Lee’s (2001) database [50].
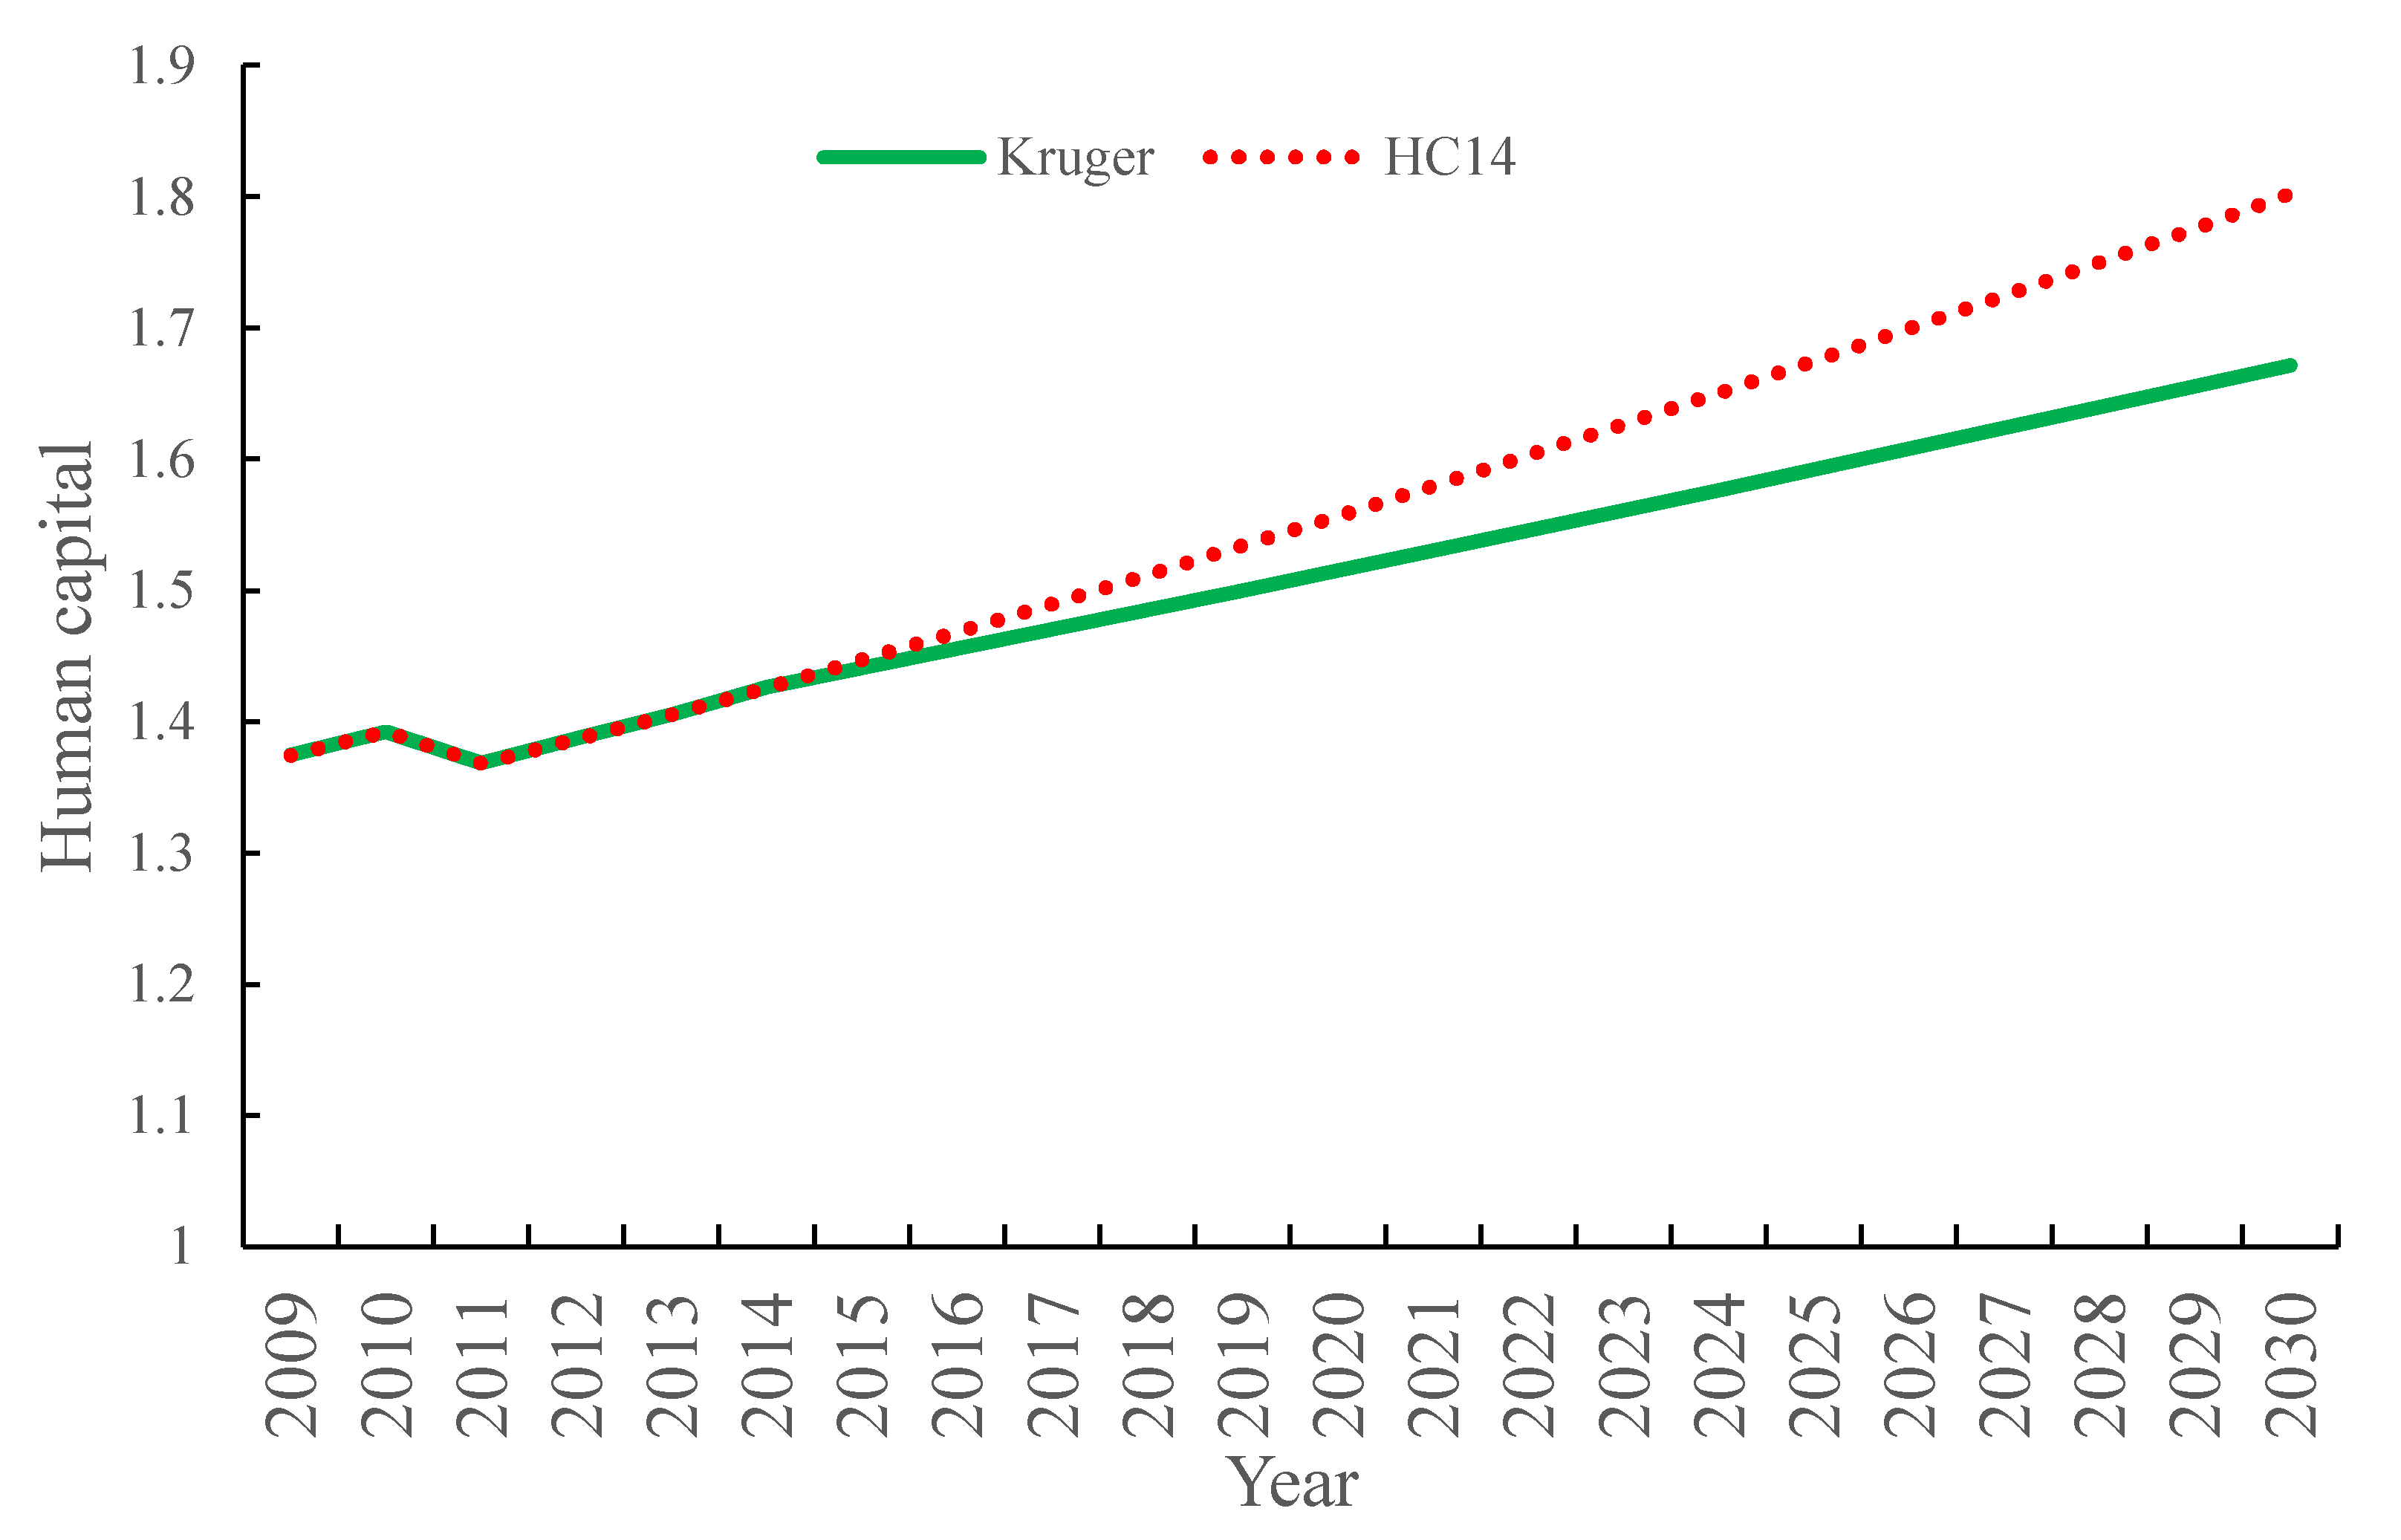
Figure 2.
Forecast of capital stock.

Figure 3.
Forecast of potential energy efficiency.


Table 1.
Data source.
| Data | Source |
|---|---|
| Energy structure | All energy data is from the IEA database [46]. Data was collected on the use of oil, natural gas, coal and peat, primary electricity and biomass. |
| Economic structure | These variables of economic structure are from World Development Indicators [47]. |
| Capital stock | The real investment series in the Penn World Table, version 9.0 [48]. |
| Carbon emission | Data for CO2 emissions from fossil fuel combustion are from the International Energy Agency, IEA [46]. |
| Temperature | The average winter temperature only, temperature data gridded by country as derived by Mitchell et al. [49]. |
| Human capital | Data for number of workers from Penn World Table, version 9.0. [48]; Data of average number of years in education as derived by Barro and Lee [50]. |
Table 2.
Scenario settings.
| Energy Structure | Coal | Oil | Gas | Electricly | Biomass |
|---|---|---|---|---|---|
| CPS | 57.66% | 17.73% | 8.78% | 10.40% | 5.43% |
| NPS | 53.99% | 17.80% | 9.74% | 12.39% | 6.08% |
| 450S | 45.51% | 16.88% | 10.74% | 18.55% | 8.32% |
Data source: CPS, NPS, 450S from IEA: “World Energy Outlook 2014”; 70PP and 73PP from the IEA [32].
Table 3.
Changes of energy index growth rate under various energy scenarios.
| Energy Indexes | 2009–2014 | 2014–2030 | ||
|---|---|---|---|---|
| CPS | NPS | 450S | ||
| Total Energy | 4.84% | 3.20% | 3.20% | 3.20% |
| Fossil | 4.19% | 2.86% | 2.66% | 1.96% |
| Non-fossil | 10.99% | 5.40% | 6.42% | 8.94% |
| Coal | 3.02% | 2.37% | 1.95% | 0.87% |
| Oil | 6.09% | 3.32% | 3.35% | 3.00% |
| Gas | 15.59% | 6.02% | 6.72% | 7.37% |
Table 4.
Economic structure Scenario settings.
| Economy Structure | Agriculture | Mining & Utilities | Manufacturing | Services |
|---|---|---|---|---|
| LEC | 3.20% | 13.62% | 31.78% | 51.40% |
| HEC | 3.10% | 11.58% | 27.02% | 58.30% |
Data source: LEC reference Li Shantong, He Jianwu CGEDRC Model Prediction Results: LEC reference to Li Ping and other CN3ET-DCGE model prediction results. Among them, secondary is allocated to mining & utilities and manufacturing according to the proportion of about 3:7, which refer to the 2014 economic structure.
Table 5.
Growth of economic indicators under various economic scenarios.
| Economy Indexes | 2009–2014 | LEC | HEC |
|---|---|---|---|
| 2014–2030 | 2014–2030 | ||
| Total Economy | 8.02% | 6.05% | 6.05% |
| Agriculture | 6.36% | −0.62% | 5.07% |
| Mining & Utilities | 6.51% | 6.18% | 3.84% |
| Manufacture | 6.75% | 6.49% | 4.15% |
| Service | 9.67% | 6.53% | 7.61% |
| No-service | 6.62% | 5.59% | 4.24% |
Table 6.
The change of energy efficiency index under each situation.
| 2009–2014 | 2014–2030 | ||||
|---|---|---|---|---|---|
| 1/u | 4.19% | β-US | U4 | U5 | U6 |
| 3.66% | 4.19% | 5.29% | 6.41% | ||
Table 7.
Analysis of contribution degree under various situations.
| Scenario | Contribution |
|---|---|
| NPS | 2.31% |
| 450S | 8.40% |
| HEC | 5.98% |
| HC14 | 2.93% |
| HCS | 2.12% |
| U4 | 5.30% |
| U5 | 14.91% |
| U6 | 23.11% |
Table 8.
Combinations with single-factor adjustments.
| Scenario Combinations | Energy Structure | Economy Structure | Human Capital | Capital Stock | Energy Efficiency | Reduced Intensity | Contribution |
|---|---|---|---|---|---|---|---|
| Baseline energy structure + steady economic structure + baseline efficiency | |||||||
| 1 | CPS | LEC | Kruger | EIU | β-USA | 32.43% | 0 |
| 2 | CPS | LEC | HC14 | EIU | β-USA | 35.36% | 2.93% |
| 3 | CPS | LEC | Kruger | HCS | β-USA | 34.55% | 2.12% |
| 4 | CPS | LEC | HC14 | HCS | β-USA | 37.39% | 4.96% |
| Steady energy structure + steady economic structure + very aggressive efficiency | |||||||
| 5 | NPS | LEC | Kruger | EIU | U6 | 57.06% | 24.63% |
| 6 | NPS | LEC | HC14 | EIU | U6 | 58.92% | 26.50% |
| 7 | NPS | LEC | Kruger | HCS | U6 | 58.41% | 25.98% |
| 8 | NPS | LEC | HC14 | HCS | U6 | 60.21% | 27.79% |
| Steady energy structure + steady economic structure + very aggressive efficiency | |||||||
| 9 | 450S | LEC | Kruger | EIU | U6 | 61.06% | 28.64% |
| 10 | 450S | LEC | HC14 | EIU | U6 | 62.75% | 30.33% |
| 11 | 450S | LEC | Kruger | HCS | U6 | 62.28% | 29.86% |
| 12 | 450S | LEC | HC14 | HCS | U6 | 63.92% | 31.50% |
| Aggressive energy structure + aggressive economic structure + aggressive efficiency | |||||||
| 13 | 450S | HEC | Kruger | EIU | U5 | 57.96% | 25.54% |
| 14 | 450S | HEC | HC14 | EIU | U5 | 59.79% | 27.36% |
| 15 | 450S | HEC | Kruger | HCS | U5 | 59.28% | 26.86% |
| 16 | 450S | HEC | HC14 | HCS | U5 | 61.05% | 28.62% |
| Baseline energy structure + aggressive economic structure + very aggressive efficiency | |||||||
| 17 | CPS | HEC | Kruger | EIU | U6 | 59.48% | 27.05% |
| 18 | CPS | HEC | HC14 | EIU | U6 | 61.24% | 28.81% |
| 19 | CPS | HEC | Kruger | HCS | U6 | 60.75% | 28.32% |
| 20 | CPS | HEC | HC14 | HCS | U6 | 62.45% | 30.03% |
| Steady energy structure + aggressive economic structure + very aggressive efficiency | |||||||
| 21 | NPS | HEC | Kruger | EIU | U6 | 60.86% | 28.44% |
| 22 | NPS | HEC | HC14 | EIU | U6 | 62.56% | 30.14% |
| 23 | NPS | HEC | Kruger | HCS | U6 | 62.09% | 29.66% |
| 24 | NPS | HEC | HC14 | HCS | U6 | 63.74% | 31.31% |
| Aggressive energy structure + aggressive economic structure + very aggressive efficiency | |||||||
| 25 | 450S | HEC | Kruger | EIU | U6 | 64.51% | 32.09% |
| 26 | 450S | HEC | HC14 | EIU | U6 | 66.05% | 33.63% |
| 27 | 450S | HEC | Kruger | HCS | U6 | 65.62% | 33.20% |
| 28 | 450S | HEC | HC14 | HCS | U6 | 67.12% | 34.69% |
Notes: According to the scenarios setting method, it was found that only 24 of the 96 scenarios are close to China’s carbon intensity reduction targets. Thus, the table only shows the 24 combination scenarios and 4 basic scenario combinations, the total combination scenarios are 28.
© 2018 by the authors. Licensee MDPI, Basel, Switzerland. This article is an open access article distributed under the terms and conditions of the Creative Commons Attribution (CC BY) license (http://creativecommons.org/licenses/by/4.0/).
Share and Cite
MDPI and ACS Style
Wang, M.; Liu, Y.; Liu, Y.; Yang, S.; Yang, L. Assessing Multiple Pathways for Achieving China’s National Emissions Reduction Target. Sustainability 2018, 10, 2196. https://doi.org/10.3390/su10072196
AMA Style
Wang M, Liu Y, Liu Y, Yang S, Yang L. Assessing Multiple Pathways for Achieving China’s National Emissions Reduction Target. Sustainability. 2018; 10(7):2196. https://doi.org/10.3390/su10072196
Chicago/Turabian StyleWang, Mingyue, Yu Liu, Yawen Liu, Shunxiang Yang, and Lingyu Yang. 2018. "Assessing Multiple Pathways for Achieving China’s National Emissions Reduction Target" Sustainability 10, no. 7: 2196. https://doi.org/10.3390/su10072196
Note that from the first issue of 2016, this journal uses article numbers instead of page numbers. See further details here.