Emission of Volatile Organic Compounds (VOCs) from Dispersion and Cementitious Waterproofing Products


Department of Thermal Physics, Acoustic and Environment, Building Research Institute, 00-611 Warsaw, Poland
*
Author to whom correspondence should be addressed.
Sustainability 2018, 10(7), 2178; https://doi.org/10.3390/su10072178
Submission received: 30 April 2018
/
Revised: 18 June 2018
/
Accepted: 20 June 2018
/
Published: 26 June 2018
(This article belongs to the Special Issue Sustainability in Construction Engineering)
Abstract
:Many different methods and indicators are commonly used for the assessment of indoor air quality (IAQ). One of them is pollution source control; among the sources, building materials are of special concern. This study presents a source characterization of waterproofing products used mainly in non-industrial buildings. The authors have attempted to fill some research gaps by determining emission factors for waterproofing materials. The work contains a summary of the volatile organic compounds (VOCs) emitted from dispersion and cementitious liquid-applied water-impermeable products. VOC emissions were determined in a 100-L stainless steel ventilated emission test chamber. Air samples were collected by an active method on Tenax TA®, while VOCs were analyzed using a TD-GC/MS method. Identified VOCs were also expressed as the total volatile organic compounds (TVOCs) and converted into area-specific emission rates qA. The results for different groups of identified compounds (alcohols, benzene derivatives, aldehydes, ketones, ethers and esters) were compared. It was found that VOC emissions clearly decreased with time during each experiment, which lasted 28 days. It is further noted that different types of products were characterized by the emission of specific groups of compounds that were not emitted by other types of products. An essential factor in the elimination and minimization of the occurrence of sources of indoor air pollution is the appropriate selection of finishing materials, which should be characterized by as low as possible emission of VOCs. The results presented in this work can lead to practical applications in the selection of low-emission products for certified green buildings.
1. Introduction
1.1. Sustainable Construction Materials
The analysis of the existing trend for the market of eco-construction materials indicates that the number of products with certain eco and environmental characteristics on the market is evidently growing. Investors and developers are willing to buy eco-construction products if they offer the same technical performance with the same price in comparison to the “standard products”. The growing eco-awareness regarding adverse impact of buildings on the environment and human health in Europe is slowly becoming a decisive criterion in decision-making process of market stake holders, especially large contractors and investors. The accessibility of information concerning environmental aspects of construction products and elements is considered as a one of the driving forces of green market development in some leading EU countries (UK, Holland, France, Germany, and Sweden).
The worldwide trends show the parameters of well-being of building occupants from the very beginning should be included in design activities and further steps of construction process. All commercial environmental assessment systems (Building Research Establishment Environmental Assessment Method (BREEAM), Leadership in Energy and Environmental Design (LEED) or German Sustainable Building Council (DGNB)) include the issue of low-emitting materials selection in the context of minimizing emissions and impact on users [1,2,3]. The results of studies on volatile organic compound concentrations may influence the results of certification of new office buildings.
The building design stage should include the development of an IAQ plan, which aims to include specifications, installations and activities that reduce IAQ. The plan must also consider the following issues: elimination and control of pollution sources; procedures for air exchange in the facility after completion of finishing works; conducting air quality tests by an independent laboratory; and procedures for maintaining proper air quality during use. An important element is the correct design and use of the building’s ventilation system in accordance with the requirements of the relevant standards (EN 13779: 2007) [4], proper location of ventilation inlets and outlets, and proper design of the location of building objects in relation to external sources of pollution.
1.2. VOC Emission from Building Products
VOCs include various organic chemicals that have a high vapor pressure at room temperature and boiling points in an interval of approximately 50–100 °C to 240–260 °C [5]. According to the United States Environmental Protection Agency (EPA), the average level of VOCs in homes is five times higher than outdoors. For several hours after activities such as paint stripping, levels may be 100–1000 times background outdoor levels [6].
Two different techniques are used for the isolation and preconcentration of VOCs from air samples: a passive method employing a homemade passive sampler and a dynamic method based on a sorption tube [7]. Passive samplers fall into one of two categories: passive diffusion samplers, in which the transport of analytes takes place by way of free diffusion of the analyte through a stagnant gas layer, and passive samplers, in which the transport of analytes takes place by way of permeation of the analyte through a semipermeable membrane [8]. The dynamic method involves passing through the air sampler on a solid sorbent located in a glass or stainless steel tube. There are two methods of dynamic sampling with a sorbent tube—active and passive sampling. During active sampling, a calibrated pump is attached to the tube to draw air through the tube at a constant rate. Active sampling is used for short-term monitoring. In turn, passive sampling is designed for long-term monitoring and it works by molecular diffusion process. VOC samples are thermally desorbed from the adsorptive trap and concentrated by two-stage cryo-focusing process. Detection and identification are carried out by gas chromatography (GC) or gas chromatography mass spectrometry (GC/MS).
In recent years, an increasingly common alternative method of VOCs acquisition is based on sensors that change chemical information from the environment into analytically useful signals [9]. There are various types of commercially available chemical sensors: infrared radiation absorption (NDIR, Nondispersive Infrared Sensors) and thermal sensors (Pellistores) for evaluation of explosion risk and electrochemical (EC, Electrochemical), photoionization (PID, Photoionization Sensor) and semiconductor (MOS, Metal Oxide Semiconductor Sensors) for detection of toxic compounds [9,10]. Recent literature reviews [9,10,11,12] indicate advantages of the chemical sensors include mainly economic aspects such as simple design or low cost of manufacturing. However, these papers describe also limitations of sensors metrological parameters, such as poor sensitivity and selectivity, narrow measurement range or too high limit of detection.
VOCs are emitted by a wide array of products numbering in the thousands. Building materials play an important role in determining indoor environmental quality due to their large surface areas and permanent exposure to indoor air. Building materials release a wide variety of volatile organic compounds that are a main source of indoor air pollutants, worsening the air quality. They are absorbed into the body through respiratory system and the skin, causing headaches or eye and respiratory irritation. It is recognized that such contamination is responsible for long-term health effects associated with the development of allergy or asthma and discomfort among occupants [13,14,15,16,17,18].
The situation in which building occupants experience acute health and comfort effects that appear to be linked to the time spent in a building, but no specific illness or cause can be identified, is called “sick building syndrome” (SBS) [19,20]. Wargocki et al. assessed the perceived air quality and SBS symptoms while performing simulated office work in an existing office in which the air pollution level was modified by introducing or removing a pollution source [21,22].
A comprehensive review of emission rates from different building materials was described by Yu et al. [23]. The work compares the results of emission rates from liquid and paste products and indicates their average levels, e.g., wall primer (6 µg/m2·h), floor waxes (80,000 µg/m2·h) and wall and floor adhesives (220,000–271,000 µg/m2·h) [23]. Wilke et al. (2004) studied VOC emissions from low-emitting adhesives. The TVOC emission rates from tested adhesives ranged 900–10,000 µg/m2·h after 24 h. The emission rates decreased to below 200 µg/m2·h in 28 days for all adhesives. Acetic acid, 2-ethylhexanol and phenoxy propanol were the most abundant compounds [24].
For indoor air quality assessment using the IAQindex, it is suggested to specify the dominant air VOC contaminants [25]. Some building materials are high VOC emitters, such as solvent paints and adhesives and the coatings and coverings on walls, ceilings and floors [26,27]. Paints which are widely used in residential indoor environmental might contribute significantly to poor IAQ, especially as they are applied to large surfaces. Many research projects have been undertaken to determine emissions of VOCs from freshly painted surface and their impact on IAQ [28]. Chang et al. investigated commercially available low-VOC latex paints and performed test emission inside 53-l stainless steel chambers [29]. Schieweck and Bock [30] studied the content of semi-volatile organic compounds (SVOCs) and the emission potential from paints by means of solvent extraction and chamber emission tests. Few studies have been performed so far concerning low VOC-emitting coatings [31,32,33] and no data have been reported on VOC emissions from waterproofing products. In the contemporary literature, no detailed data on this subject have been published.
Extensive research has been conducted on VOC emissions from building materials, including emission chamber studies [34,35] and modeling to predict gaseous emissions. Modeling methods are generally based on theory and fluid dynamics, and many kinds of analytical or numerical models have been proposed for characterizing VOC emissions from wet and dry materials [33,36]. Guo et al. [37] developed a classical vapor pressure and boundary layer model to predict VOC emissions, and Li et al. [38] improved the model by considering VOC emissions from paint applied to an absorptive substrate (mass transfer-based model).
Some European countries introduced rating systems for building products based on volatile pollutant emission levels. They developed numerous voluntary ecolabels, such as EMICODE®, The Blue Angel® or Finnish M1®, and obligatory rating systems, such as German AgBB and French VOC Regulations, with their emission classes (from A+ to C) based on emission testing. An example of a procedure for liquid building materials (adhesives, coatings or products used for installation) and decorative products (wallpaper or paint) is the guideline proposed by the French Agency for Food, Environmental and Occupational Health & Safety (Protocole AFFSET). The document contains a list of VOCs that may be emitted by these products together with the lower concentrations of interest (LCIs) that must be followed [39]. These regulations can increase the number of low-emitting products on the market.
1.3. Waterproofing Products
According to Standard EN 14891: 2017 [40], liquid-applied water-impermeable products are classified into three types: dispersion (DM, dispersion liquid-applied water-impermeable products), cementitious (CM, cementitious liquid-applied water-impermeable products) and reaction resin based (RM, reaction resin liquid-applied water-impermeable products). The cementitious products presented in this publication are divided into two subgroups: products mixed with water (RCM, rigid and waterproof) and polymer-modified products (FCM, flexible and waterproof). A summary of the parameters and typical applications for the tested types of waterproofing products is given in Table 1. Waterproofing products based on reaction resins are applied mainly outdoors and/or in industrial buildings; hence, few data are presented in this study on VOC emissions indoors.
The waterproofing products have been described in various data sheets issued by the ZDB (Federation of the German Construction Industry), BEB (German Screed and Coverings Association) and DIBt (German Institute for Construction Technology). Since 2012, composite waterproofing has been classified into five exposure classes [41]: A0, moderate exposure to water without hydrostatic pressure; A, high exposure to water without hydrostatic pressure; B0, moderate exposure to water without hydrostatic pressure; B, high exposure to permanent internal water pressure; and C, high exposure to water without hydrostatic pressure with additional chemical action (used only for reaction resin products). These classes must be specified by the designer in function of the projected loads and moisture exposure.
DM are made on modified synthetic resin. After applying to the surface, they form a moisture-impermeable dense coating. They are commonly used for seamless and jointless sealing under ceramic coverings, gypsum plasterboard, cement-lime plasters and screeds or concrete surfaces in damp and wet areas, e.g., in private bathrooms with bathtubs, showers, and toilets and kitchens. After drying, waterproofed foils are a ready-to-use substratum for all finishing materials, such as glazed tiles, terracotta, wood floors and panels, and synthetic floor coverings. They are designed for places temporarily exposed to the impact of flowing water. Settlement and edge joints must be secured with sealing tape, and wall junctions and floor drains with sealing collars for walls/floors. DM are particularly convenient for use in tight or poorly accessible places.
Execution of waterproofing jointless sealing is also possible by using FCM. These products are manufactured mortars, whose tightness provides appropriately selected hydrophobic additives. RCM are two-component products—their preparation requires the addition of an adequate amount of batched water to the cementitious component. FCM are two-component products composed of a dry mix of cement, mineral fillers and modifying agents and aqueous dispersions of plastics mixed in proportions recommended by the manufacturers.
2. Materials and Methods
Hydroisolations were obtained directly from domestic manufacturers as freshly made products. Nine different commercially available waterproofing products were evaluated by estimating their VOC emissions. These products were also admitted to trading on the European Union market. This study presents the results of research carried out in the period of 2015–2017.
The waterproofing products were tested under the same test conditions to ensure comparable and reproducible results. According to EN 16516: 2017 [42] and EN ISO 16000-9: 2006 [43], emission rates on Day 3 and Day 28 of a chamber test of waterproofing products should be reported. The VOC emission experiment for these products was carried out in an emission test chamber with a capacity of 0.1 m3. The size of the test chamber was appropriate for the intended use of building products with regard to the reference room described in accordance with Harmonized Standard of EN 16516: 2017 [42] and European Standard EN ISO 16000-9: 2006 [43]. The reference room serves as a convention for calculating and reporting product emissions reflecting the real room conditions.
2.1. Sample Preparation
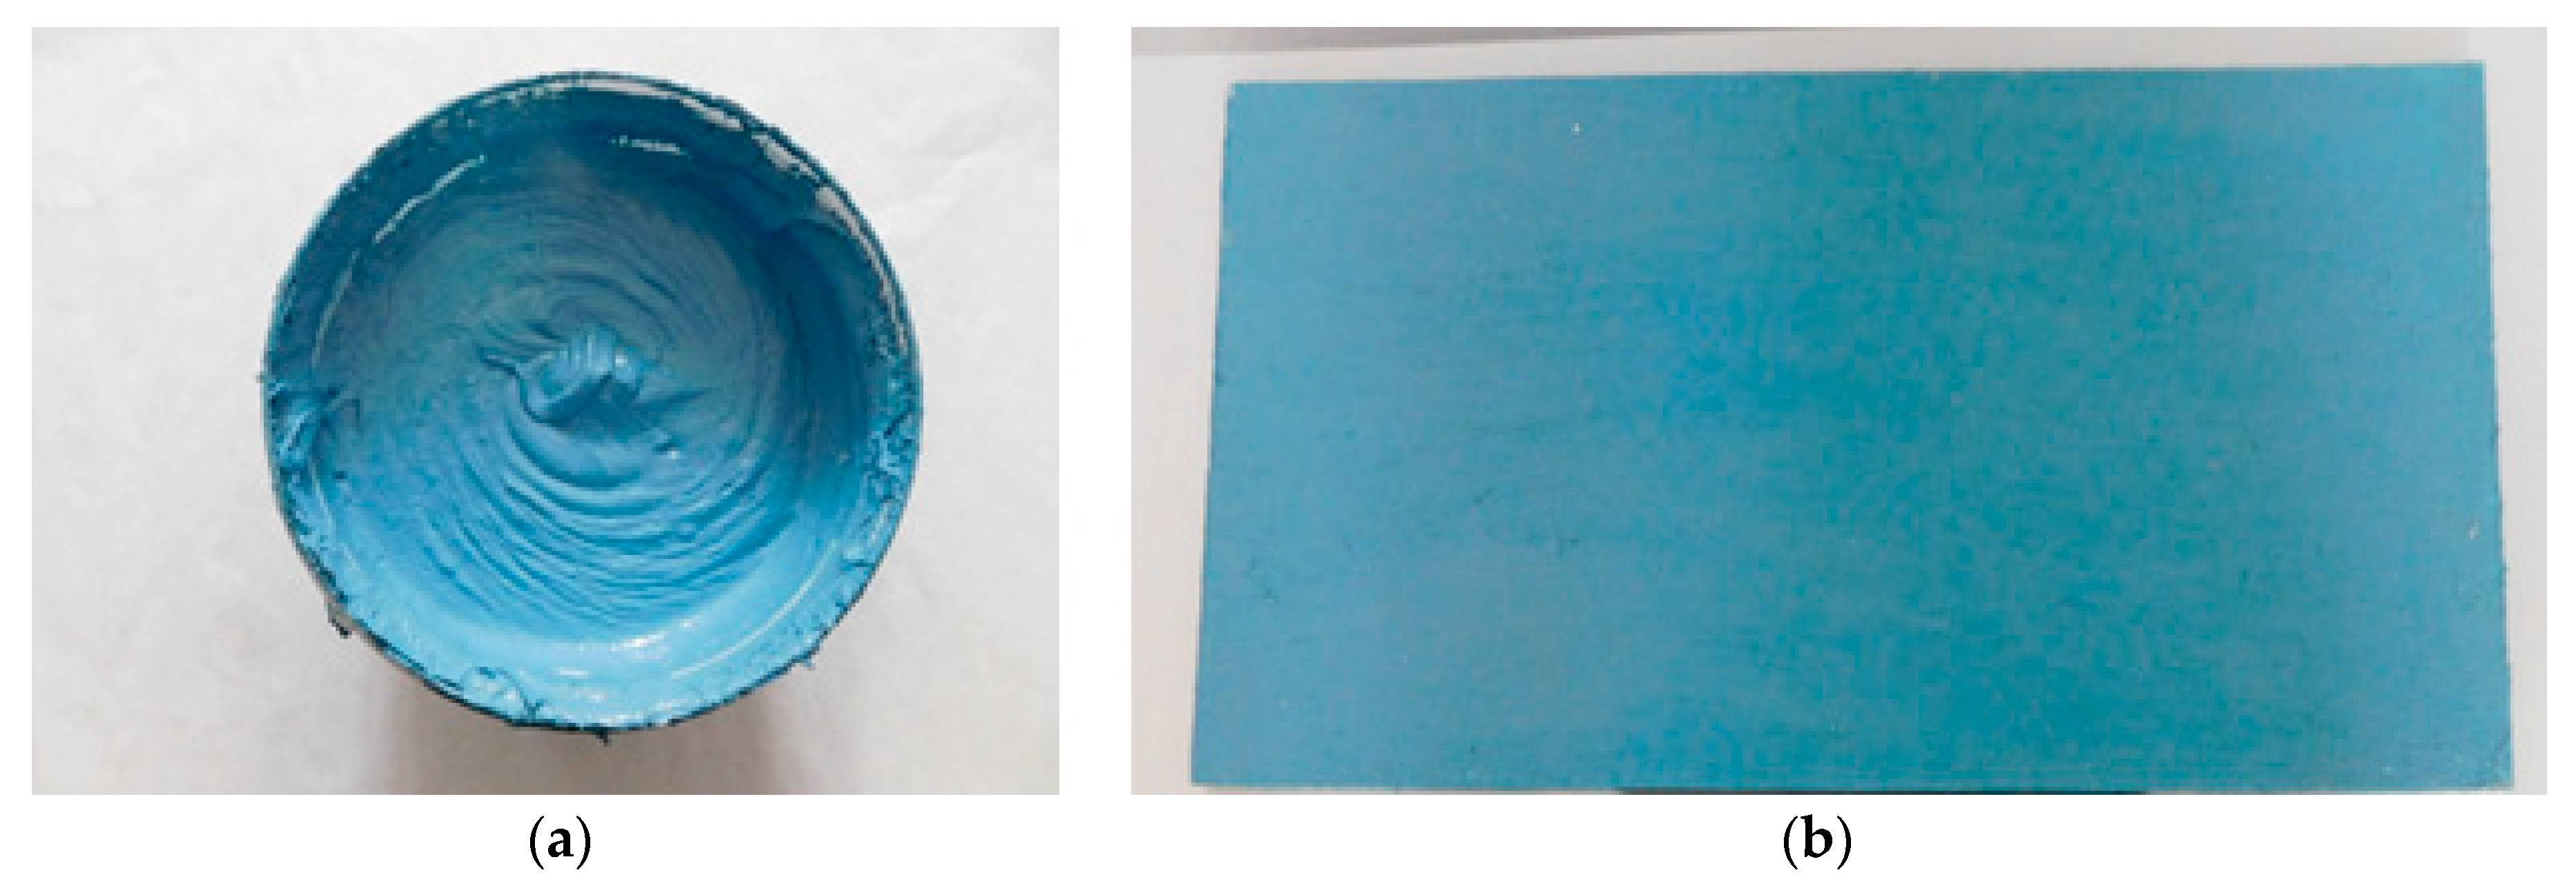
The layer number and coating thickness depended on the data recommended by the manufacturer. In the case of the tested products, two layers were used, and the coating thickness was between 1 mm and 4 mm depending on the product. Minimum dry coat thickness was verified by on-site coat thickness measurements on the cured membrane using caliper rule. Then, each sample was placed onto a fiber-cement board (Figure 1) with defined dimensions appropriate to the size of the considered test chamber and the product loading factor L (20 cm × 20 cm for floors—L = 0.4; 20 cm × 70 cm for walls and floors—L = 1.4; 30 cm × 80 cm for all surfaces—L = 1.8). The loading factor is defined as the ratio of the area of the tested material in the reference room to the volume of the reference room (m2/m3). Each product was applied to the top side of a board by a paintbrush. After a drying period of 24 h under room conditions, the fiber-cement boards covered with the water-impermeable products were placed into an emission chamber to obtain the emissions from the effective area of the examined product. The consumption values are specified by the manufacturer in the product sheets. The emission area, consumption and loading factor for each tested waterproofing product are summarized in Table 2. The sample preparation procedure is in accordance with Harmonized Standard of EN 16516: 2017 [42] and European Standard EN ISO 16000-11: 2006 [44].
2.2. Experimental System
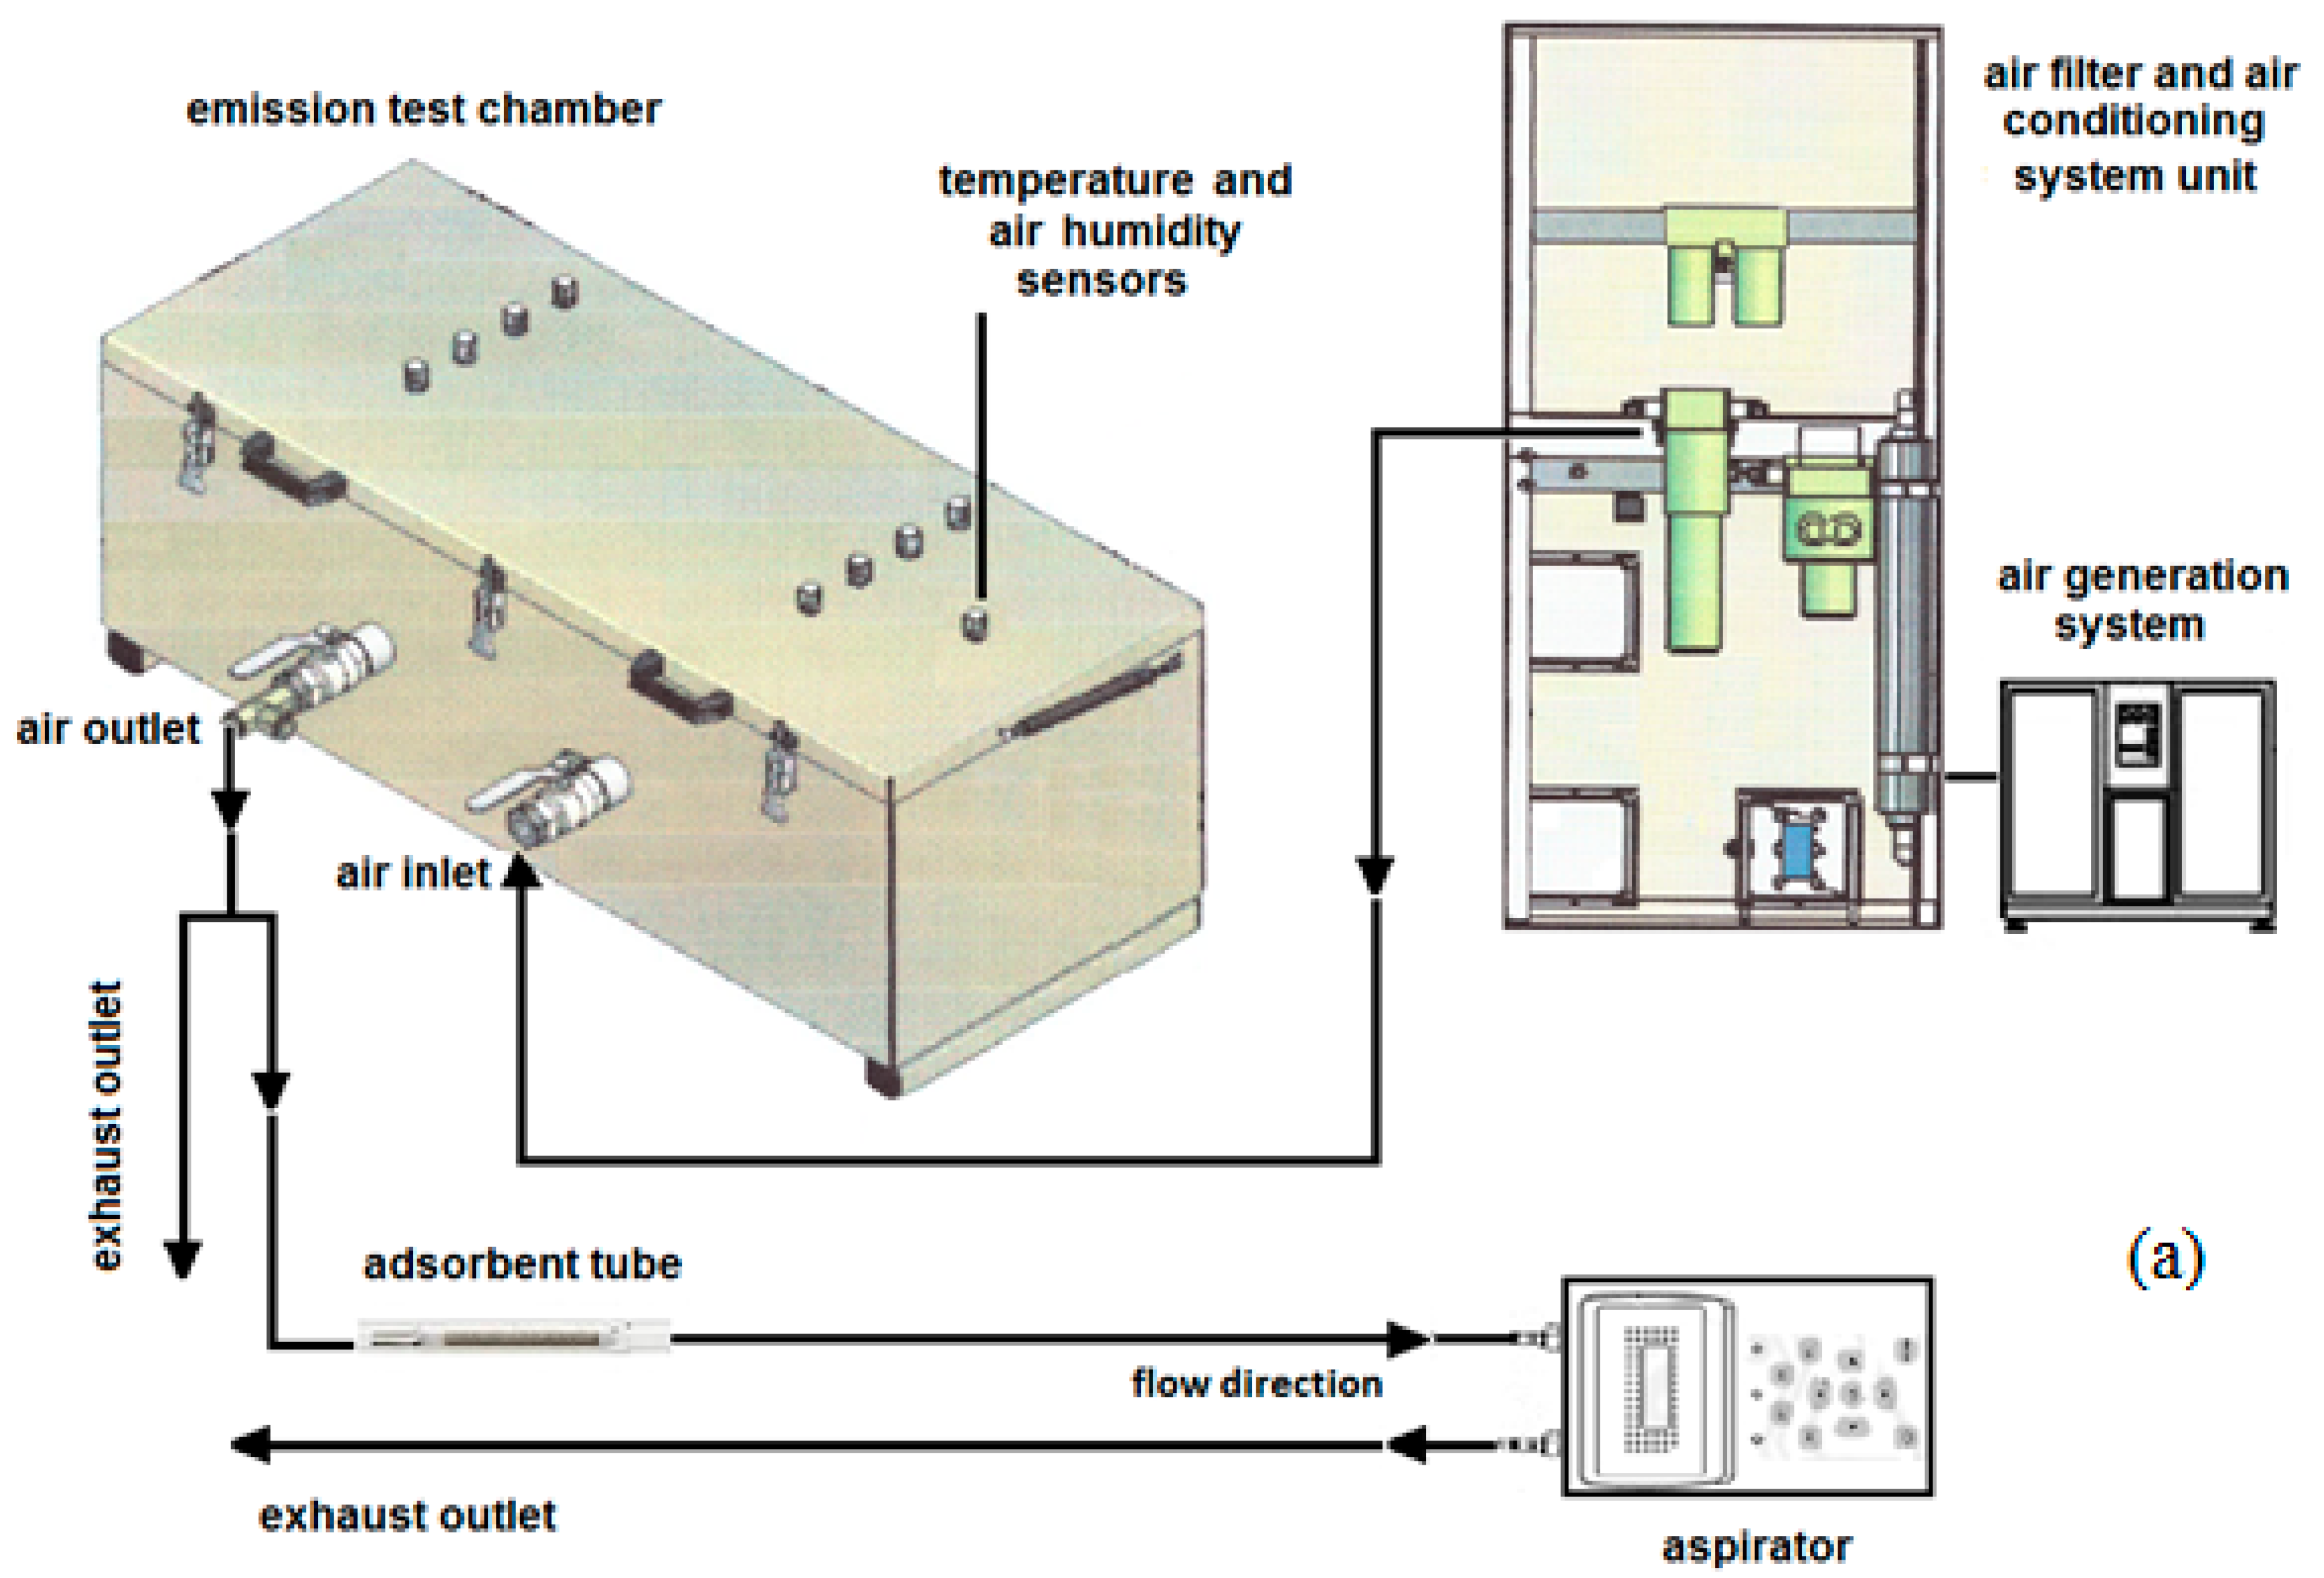
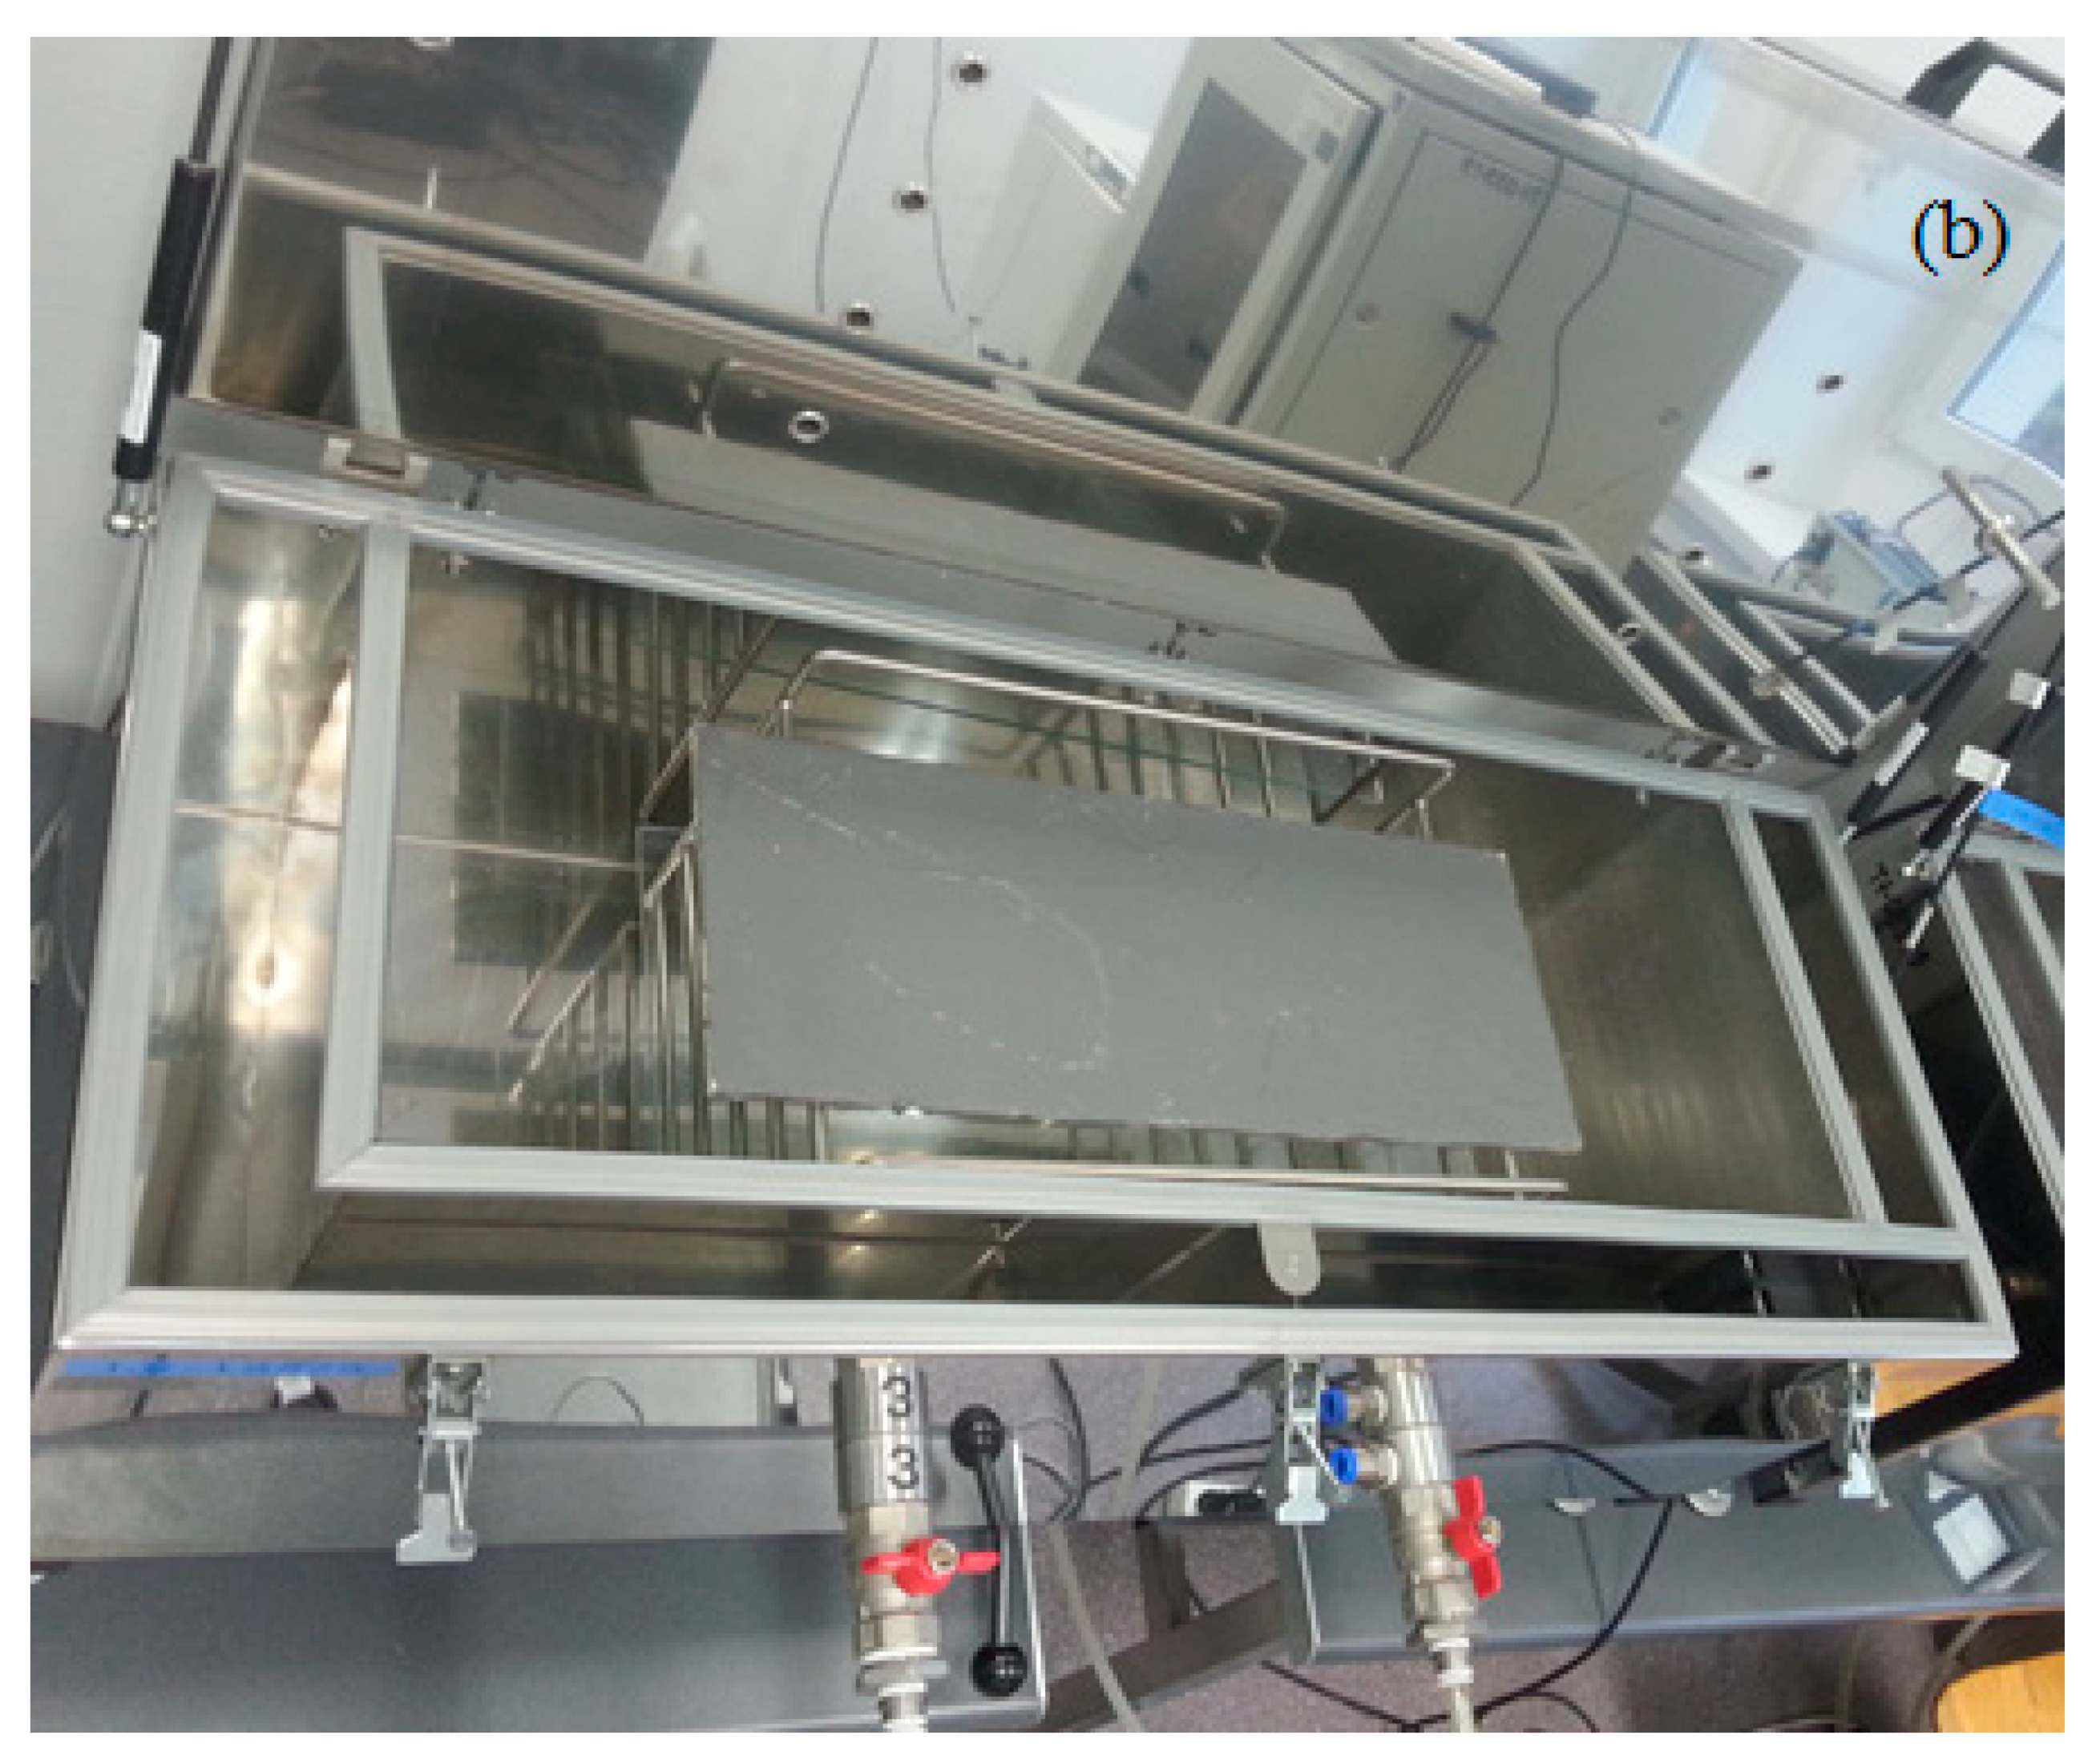
The experimental system contained a stainless steel chamber, a clean air generation and humidification system, an air mixing system and a monitoring system (Figure 2). The mixing devices were made of low-emitting and low-adsorbing materials. The test chamber was connected to an electronic mass flow controller, which controlled the air flow, test time and air change rate. A small fan was running continuously to ensure good mixing of the air inside the chamber. The air velocity above the test samples falls within the range 0.1 m/s to 0.3 m/s. The cover from the emission chamber was filled with sealing material to avoid uncontrolled air exchange with external air. The volume of the chamber was 0.1 m3. During the experimental period, the air exchange rate (n) was 0.5 h−1, and the conditions inside the chamber were controlled by an air conditioning unit at 23 ± 1 °C and 50 ± 5% relative humidity.
2.3. VOC Identification
Air samples were adsorbed onto adsorption tubes filled with resin material. Tenax TA® tubes were chosen because of their efficiency to trap low concentrations of organics from air samples, chemical inertness, thermal stability and good storage stability.
Volatile organic compounds were thermally desorbed using a thermal desorption cold trap injector on a Perkin Elmer Turbo Matrix 350 system (Akron, OH, USA). The tubes were heated at 300 °C for 10 min under a helium flow (30 mL/min), and the substances were cryo-focused at −13 °C. The volatile compounds were injected into a GC capillary column by heating the cold trap to 280 °C for 3 min. The splitless injection mode was applied.
The separation and analysis of volatile compounds was achieved using a gas chromatograph equipped with a mass spectrometer (Perkin Elmer Clarus 500). The following GC oven temperature program was applied: initial temperature of 40 °C for 3 min, 10 °C per min to 300 °C, and final temperature of 300 °C for 1 min. The GC-MS transfer line temperature was held at 250 °C, and source temperatures was kept at 180 °C. Chromatographic separation was performed on a Restek RXI-5 capillary column (30 m, 0.25 mm ID, 1.0 µm df). The MS analysis was carried out over a scan range of 20–600 m/z with an ionization energy of 70 eV in electron ionization mode. The limit of quantification was <1 µg·m−3.
The volatile compounds were identified by comparing the retention times of chromatographic peaks with the retention times of reference compounds and by searching the NIST 2011 mass spectral database. All volatile compounds with mass spectra with match factors p ≥ 90% were considered identified.
Quantitative analysis of volatile organic compounds was performed with the external standard method that uses the relationship between peak areas (or height) and analyte concentration. The calibration curves were obtained based on six distinct known concentration levels. Standard solutions were prepared by injecting them into a tube in the inert gas flow; the spiked adsorbent tubes were then thermally desorbed in the same conditions as the samples.
3. Results and Discussion
To estimate the concentrations of identified VOCs, compound-specific response factors determined by certificated standard solution were used. Identified compounds were quantified using their individual response factors when the reference compound was available. In order cases, quantification was estimated by referring to a substance with similar chemical structure. For compounds that were not identified, the total area under the chromatographic curve was converted on a molecular mass basis to a concentration using the toluene equivalent [45].
To compare different products with similar target VOC profiles coming from different emission areas, an area-specific emission rate qA [µg/m2·h] (also called an emission factor) was used. The relationship between the VOC concentration in the outlet air from the emission test chamber (c), the area-specific emission rate (qA) and the area-specific air flow rate (q) of the emission test chamber can be expressed as a dependency:
where L is the product loading factor (m2/m3) (see Table 2) and n is the air change rate (h−1), which is equal to 0.5 h−1 for the chamber used in the experiments.
qA = c × q = c × (n/L)
For each product (1–9), double sampling was performed. The compound concentrations determined from duplicate air samples did not deviate more than ±15% from their mean. Table 3 presents the average concentrations (µg/m3) of identified VOCs after 3- and 28-day emission chamber experiments. These results ranged from 2 to 2646 µg/m3 and from 2 to 357 µg/m3 after 3 and 28 days, respectively. For RCM (Products 4–6), the VOCs identified were determined at the lowest level of concentration among the studied product groups, with a maximum of 36 µg/m3 (2-butoxyethanol) and 10 µg/m3 (benzoic acid) after 3 and 28 days, respectively. DM (Products 1–3) reached values of 382 µg/m3 (n-butanol) at 3 days and 74 µg/m3 (n-butanol) at 28 days of VOC emissions. The highest VOC concentrations were identified for FCM (Products 7–9), with a maximum of 2646 µg/m3 (n-butanol) after 3 days and 357 µg/m3 (2-propyl-1-pentanol) after 28 days. The number of identified compounds ranged between 1 (Product No. 1 for RCM) and 27 (Product No. 4 for FCM).
The only compound emitted from DM was styrene (Product Nos. 1 and 3). DM are modified synthetic resin dispersions often consisting of styrene and/or acrylate copolymers. Acrylates and acetates were also identified from products in the two-component polymer-modified cementitious group. Butyl acetate is more commonly used for industrial coatings, but ethyl acetate is preferable when faster evaporation is needed [23]. In turn, ketones were present only in FCM emissions (Product Nos. 7 and 9). These compounds are added in small amounts to increase the solubility of difficult-to-dissolve resins in industrial products [23].
The compounds not assigned to the groups of alcohols, benzene derivatives, aldehydes and ketones, or ethers and esters were identified as 3-methyl-2-heptene or 3-carene (Product No. 7).
In addition, Table 3 lists the calculated total volatile organic compound (TVOC) concentrations and area-specific emission rates qA [µg/m2·h]. TVOC was calculated by summing identified and unidentified compounds eluting between n-hexane and n-hexadecane using response factor for toluene. It was found that the amount of TVOCs emitted from each type of waterproofing product after 3 days was approximately 10 times more than the emission after 28 days.
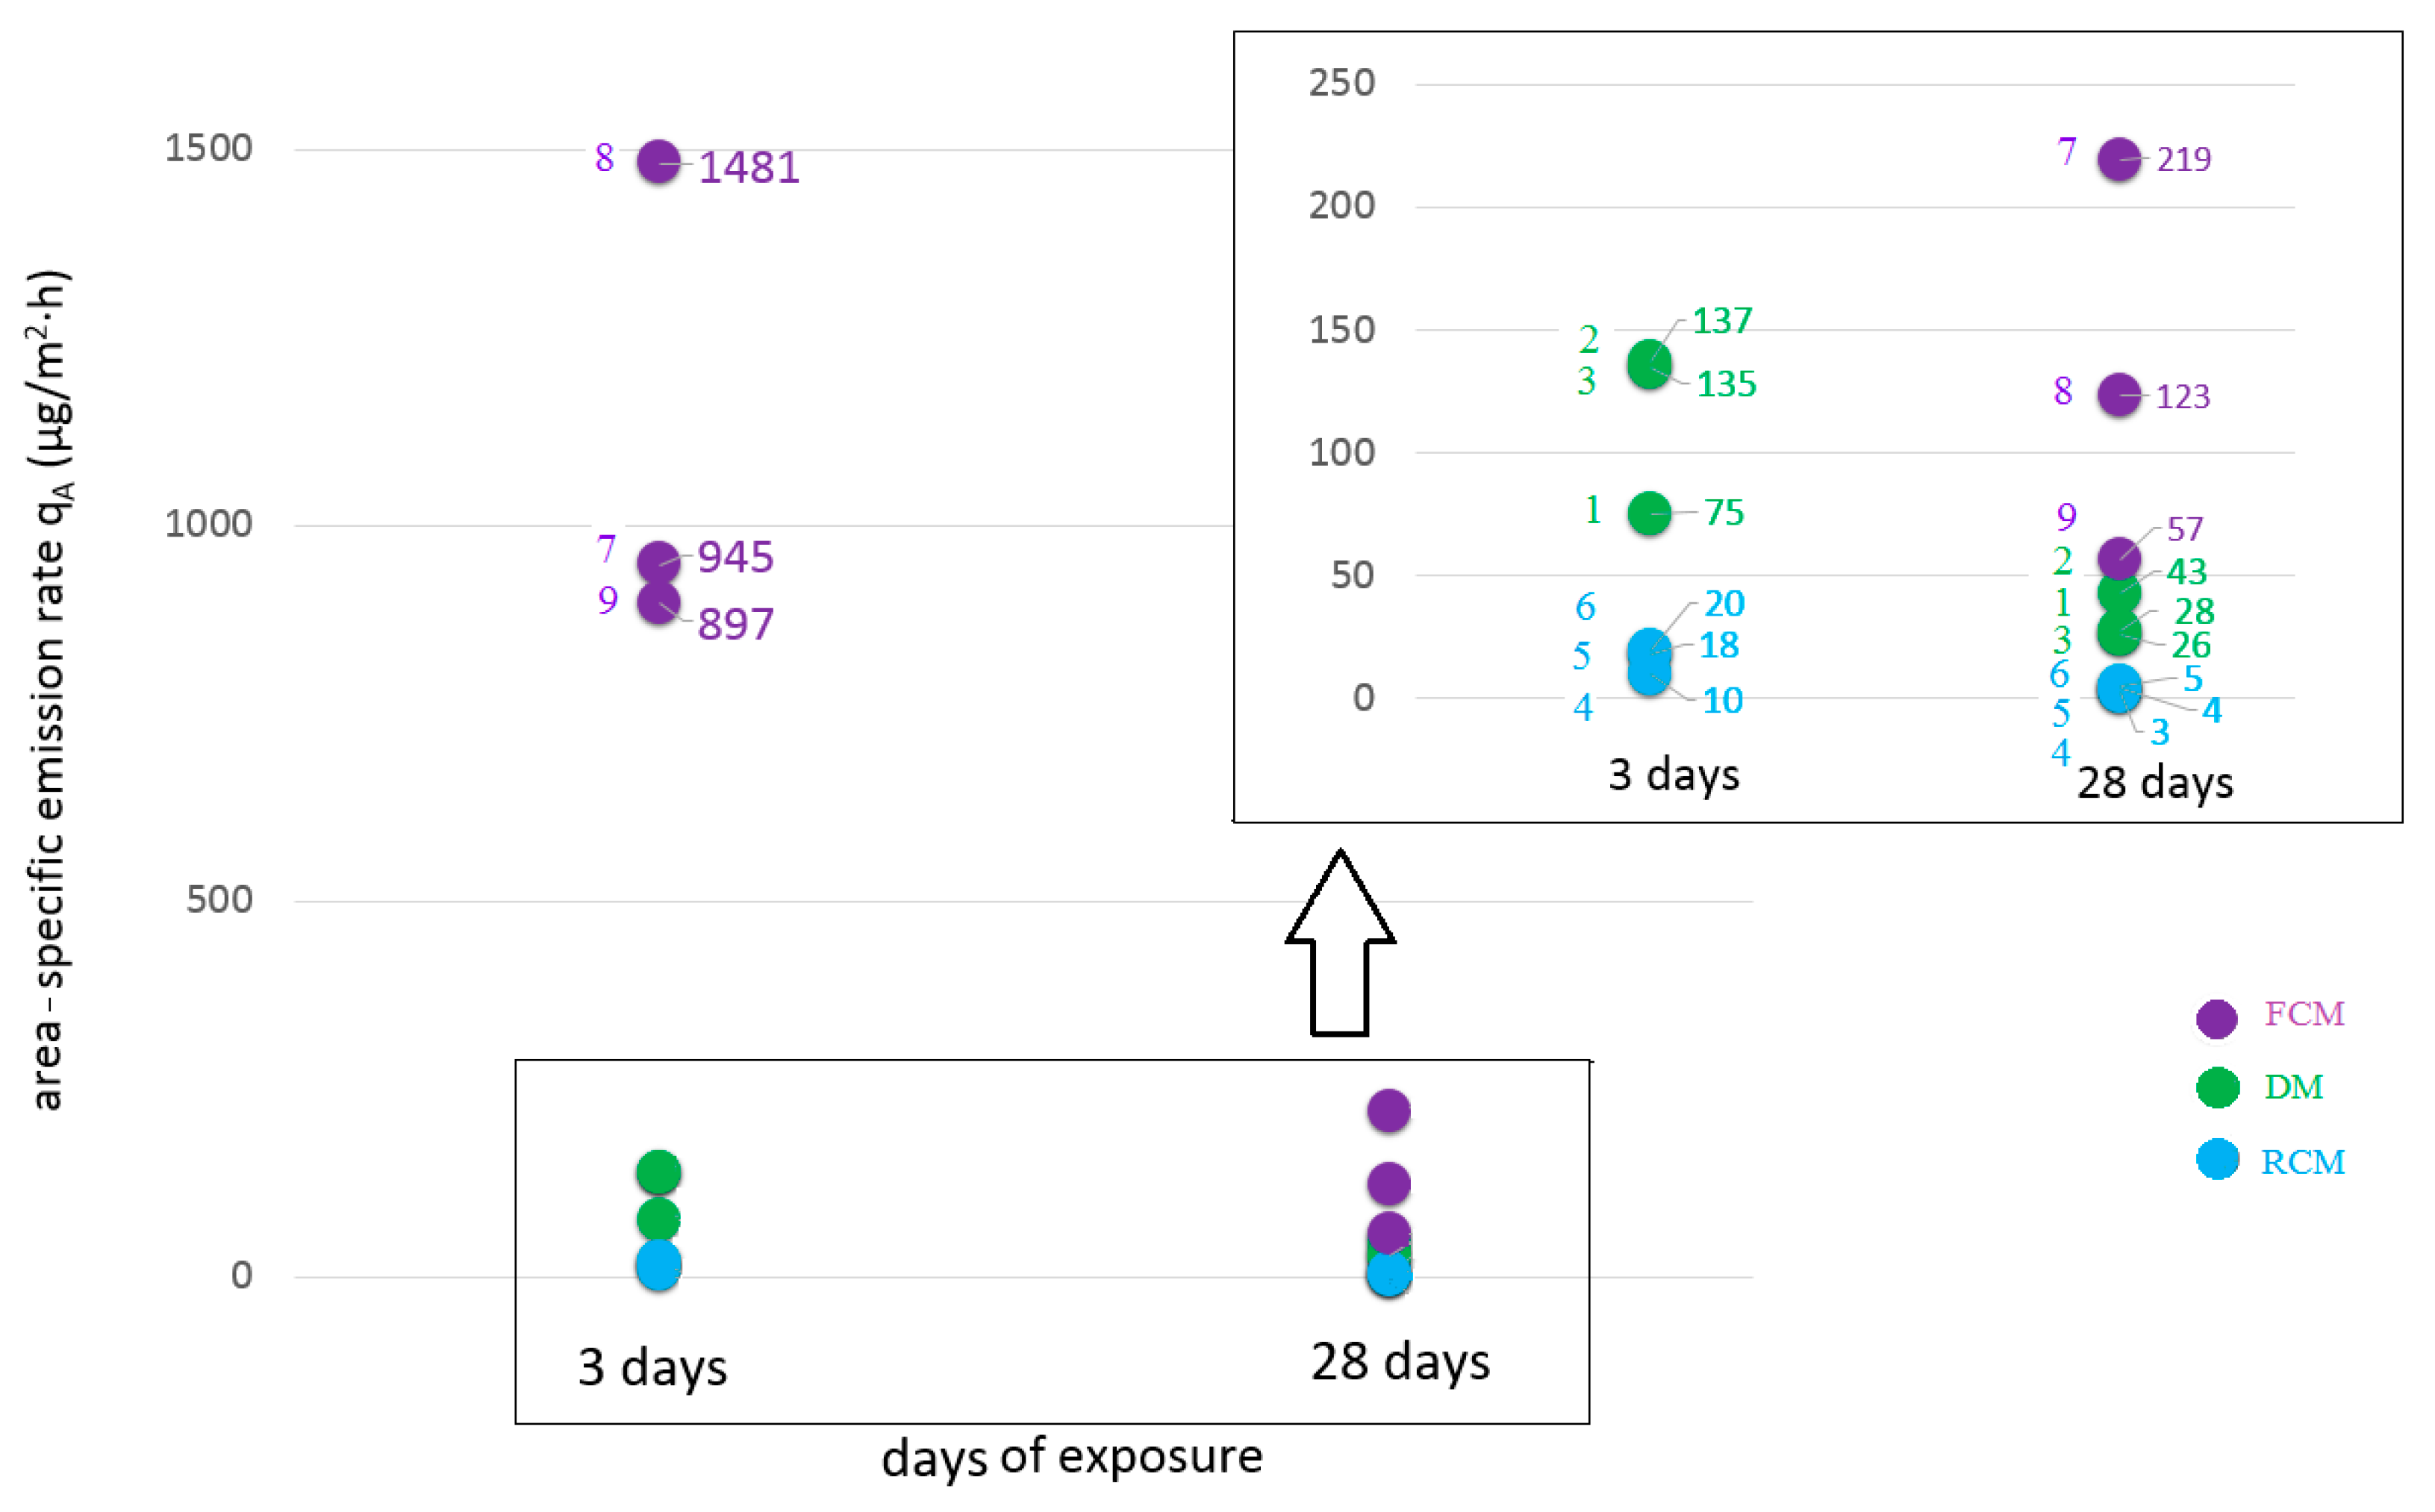
Figure 3 indicates that the area-specific emission rate values for FCM (violet on the chart) were considerably higher (up to 1481 µg/m2·h after 3 days and 219 µg/m2·h after 28 days) than those of the other groups on both days tested. Indirect qA values were determined for DM (green on the chart). The lowest qA values (down to 10 µg/m2·h after 3 days and 3 µg/m2·h after 28 days) were identified for RCM (blue on the chart).
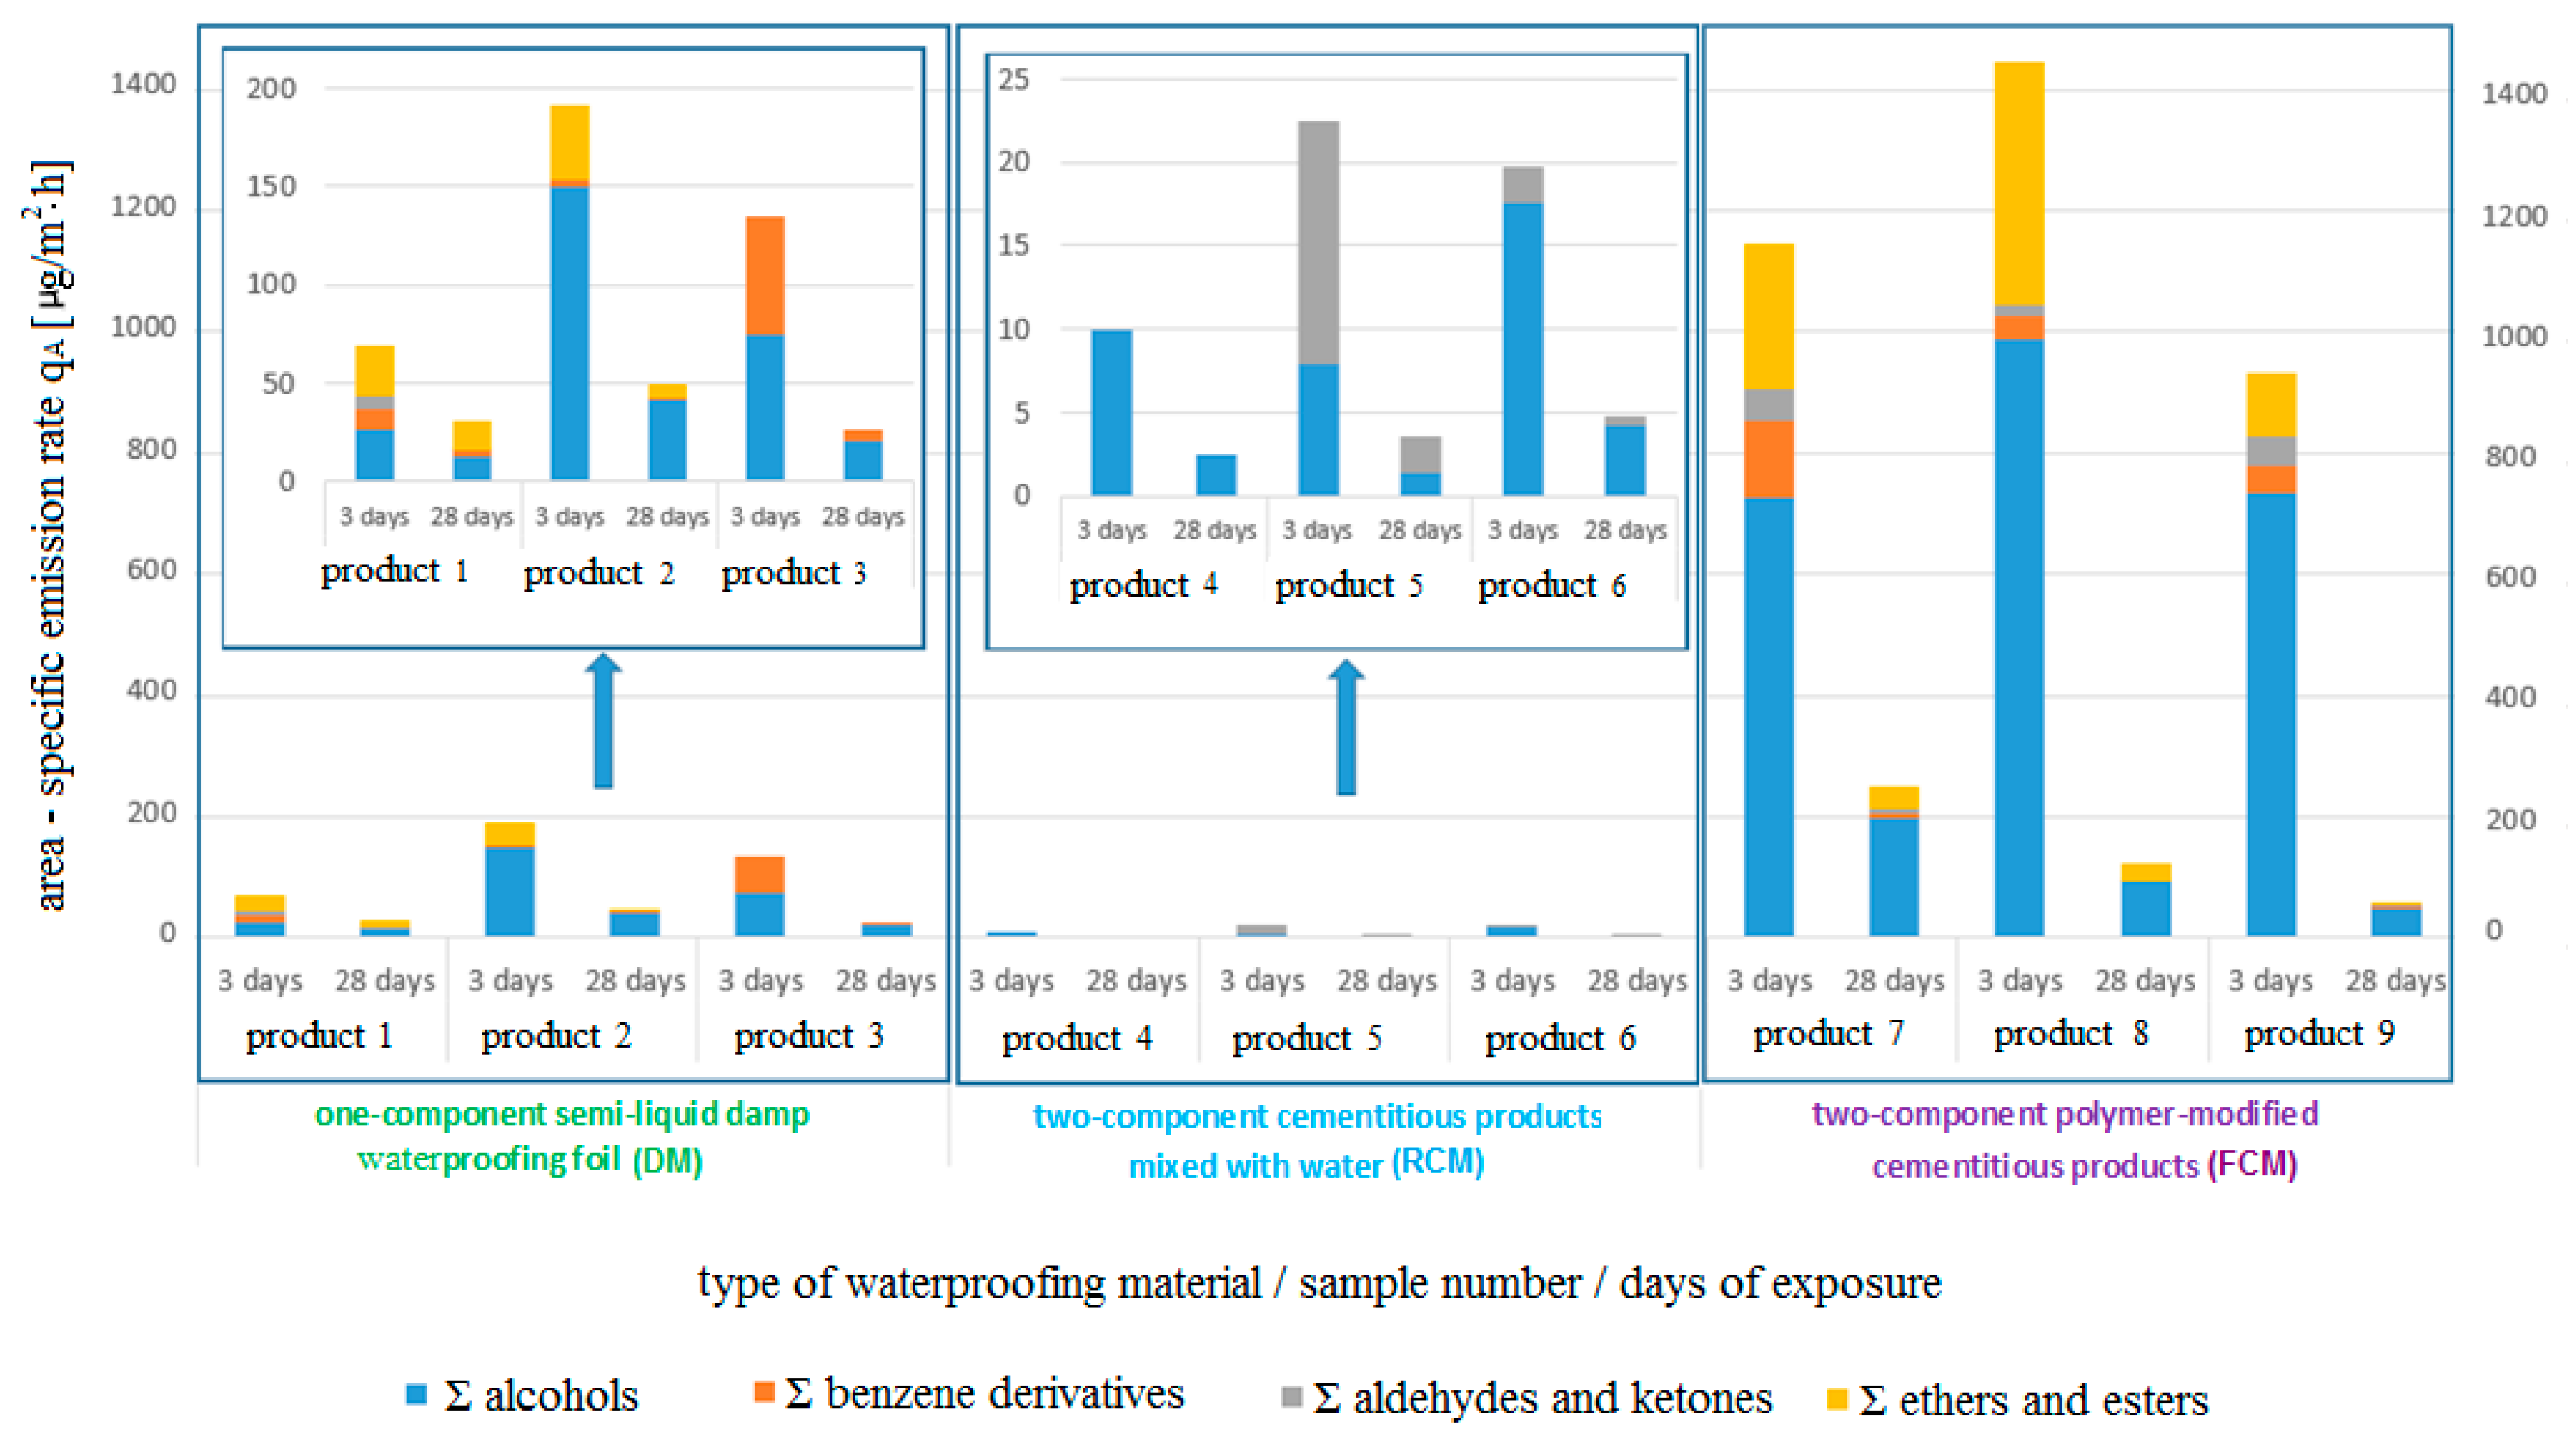
The area-specific emission rates of the identified VOCs are summarized in view of the most numerous group of compounds, including alcohols, benzene derivatives, aldehydes and ketones, and ethers and esters. The results are tabulated in Table 4, and a distribution chart is presented in Figure 4. These data show that RCM did not emit benzene derivatives or ethers and esters. Two other groups (FCM and DM) were diverse in terms of the compounds emitted from them.
The data analysis shows that alcohols were the dominant group of emitted compounds. They constituted 69% of the total emissions after 3 days and 76% after 28 days. The most frequently occurring compound was butyl alcohol, which could be used as a solvent. The group with the second highest emissions was ethers and esters, composing 20% of the total emissions after 3 days and 17% after 28 days. Other groups, i.e., benzene derivatives and aldehydes and ketones, constituted a low percentage of the total emissions in all cases.
4. Conclusions
Emission chamber experiments revealed differences in the emission rates and groups of released compounds between dispersion and cementitious waterproofing products. The area-specific emission rates from the examined waterproofing products after the first 3 days was 10 times higher than the emission after 28 days, which suggests that interior spaces should be ventilated before their uses. Consumers need emission information to assist in making purchasing decisions of waterproofing products.
The starting area-specific emission rates (after three days) reached values between 10 µg/m2·h and 1481 µg/m2·h. After 28 days, the area-specific emission rates were under 219 µg/m2·h for all examined products. Among them, the highest emission proved to be from FCM, while the lowest emission was observed from RCM. Furthermore, no benzene derivatives, ethers or esters were identified from the RCM group. The dominant group of detected compounds were alcohols in each case. n-Butanol, found in most of the tested products, was the most frequently detected chemical. Styrene, acrylates and acetates were identified from DM and FCM. All tested waterproofing products did not contain volatile carcinogens classified in categories 1A and 1B (from UE Regulation (EC) No 1272/2008, Annex VI Part 3).
The area-specific emission rate was used for waterproofing product characterization and categorization. The tested waterproofing products have been proven to belong to the low-emitting group. Among these products, the group with the lowest emission consisted of RCM, while FCM had the highest emission and the most diverse composition. Referring to Standard EN 15251: 2007, products from the DM and RCM groups can be included in the very low VOC-emitting class, while those from the FCM group belong to the low VOC-emitting class. The verification of low-emitting materials and products is important because the use of low-emitting components will result in low-emitting complete building structures. VOC-emitting source material characterization is important for manufacturers, contractors and building designers to provide a healthy and comfortable environment for building occupants. Moreover, the producers of waterproofing materials require VOC content information to be able to improve quality of their product. In addition, this characterization allows these individuals to select low-emission products for certified green buildings.
Author Contributions
M.K. analyzed the results and wrote the paper. The experimental plan was formulated under the supervision of M.P. The experiments were performed by A.G., H.D. and A.N. All authors have read and approved the final manuscript.
Conflicts of Interest
The authors declare no conflict of interest.
References
- Cole, R.J.; Valdebenito, M.J. The importation of building environmental certification systems: International usages of BREEAM and LEED. Build. Res. Inf. 2013, 41, 662–676. [Google Scholar] [CrossRef]
- Bernardi, E.; Carlucci, S.; Cornaro, C.; Bohne, R.A. An Analysis of the Most Adopted Rating Systems for Assessing the Environmental Impact of Buildings. Sustainability 2017, 9, 1226. [Google Scholar] [CrossRef]
- Park, J.; Yoon, J.; Kim, K.-H. Critical Review of the Material Criteria of Building Sustainability Assessment Tools. Sustainability 2017, 9, 186. [Google Scholar] [CrossRef]
- Standard PN-EN 13779: 2007 Ventilation for Non-Residential Buildings. Performance Requirements for Ventilation and Room-Conditioning Systems. Available online: https://wiedza.pkn.pl/web/guest/wyszukiwarka-norm?p_auth=j8sXFgvO&p_p_id=searchstandards_WAR_p4scustomerpknzwnelsearchstandardsportlet&p_p_lifecycle=1&p_p_state=normal&p_p_mode=view&p_p_col_id=column-1&p_p_col_count=1&_searchstandards_WAR_p4scustomerpknzwnelsearchstandardsportlet_standardNumber=PN-EN+13779%3A2007E&_searchstandards_WAR_p4scustomerpknzwnelsearchstandardsportlet_javax.portlet.action=showStandardDetailsAction (accessed on 18 June 2018).
- Dürkop, J.; Horn, W.; Englert, N.; Plehn, W. Building Products: Determining and Avoiding Pollutants and Odours; Umweltbundesamt: Dessau, Germany, 2007. [Google Scholar]
- Hess-Kosa, K. Indoor Air Quality: Sampling Methodologies; CRC Press: Reno, NV, USA, 2001. [Google Scholar]
- Zabiegała, B.; Przyjazny, A.; Namieśnik, J. Passive dosimetry as an alternative technique to dynamic enrichment of organic pollutants of indoor air. J. Environ. Pathol. Toxicol. Oncol. 1999, 18, 47–59. [Google Scholar] [PubMed]
- Zabiegała, B.; Sărbu, C.; Urbanowicz, M.; Namieśnik, J. A Comparative Study of the Performance of Passive Samplers. J. Air Waste Manag. Assoc. 2011, 61, 260–268. [Google Scholar] [CrossRef] [PubMed] [Green Version]
- Szulczyński, B.; Gębicki, J. Currently Commercially Available Chemical Sensors Employed for Detection of Volatile Organic Compounds in Outdoor and Indoor Air. Environments 2017, 4, 21. [Google Scholar] [CrossRef]
- Spinelle, L.; Gerboles, M.; Kok, G.; Persijn, S.; Sauerwald, T. Review of Portable and Low-Cost Sensors for the Ambient Air Monitoring of Benzene and Other Volatile Organic Compounds. Sensors 2017, 17, 1520. [Google Scholar] [CrossRef] [PubMed]
- Ahmad, M.W.; Mourshed, M.; Mundow, D.; Sisinni, M.; Rezgui, Y. Building energy metering and environmental monitoring—A state-of-the-art review and directions for future research. Energy Build. 2016, 120, 85–102. [Google Scholar] [CrossRef]
- Eusebio, L.; Derudi, M.; Capelli, L.; Nano, G.; Sironi, S. Assessment of the Indoor Odour Impact in a Naturally Ventilated Room. Sensors 2017, 17, 778. [Google Scholar] [CrossRef] [PubMed]
- Gostner, J.M.; Zeisler, J.; Alam, M.T.; Gruber, P.; Fuchs, D.; Becker, K.; Neubert, K.; Kleinhappl, M.; Martini, S.; Überall, F. Cellular reactions to long-term volatile organic compound (VOC) exposures. Sci. Rep. 2016, 6, 37842. [Google Scholar] [CrossRef] [PubMed] [Green Version]
- Bernstein, J.A.; Alexis, N.; Bacchus, H.; Bernstein, I.L.; Fritz, P.; Horner, E.; Li, N.; Mason, S.; Nel, A.; Oullette, J.; et al. The health effects of non-industrial indoor air pollution. J. Allergy Clin. Immunol. 2008, 121, 585–591. [Google Scholar] [CrossRef] [PubMed]
- Batterman, S.; Su, F.C.; Li, S.; Mukherjee, B.; Jia, C. Personal exposure to mixtures of volatile organic compounds: Modeling and further analysis of the RIOPA data. Res. Rep. Health Eff. Inst. 2014, 181, 3–63. [Google Scholar]
- WHO/IARC International Agency for Research on Cancer (IARC). IARC Monographs on the Evaluation of Carcinogenic Risks to Humans; WHO/IARC International Agency for Research on Cancer (IARC): Lyon, France, 2006. [Google Scholar]
- Wolkoff, P. Impact of air velocity, temperature, humidity, and air on long-term VOC emissions from building products. Atmos. Environ. 1998, 32, 2659–2668. [Google Scholar] [CrossRef]
- Wolkoff, P.; Wilkins, C.K.; Clausen, P.A.; Nielsen, G.D. Organic compounds in office environments—Sensory irritation, odor, measurements and the role of reactive chemistry. Indoor Air 2006, 16, 7–19. [Google Scholar] [CrossRef] [PubMed]
- United States Environmental Protection Agency. Indoor Air Facts No. 4 (Revised): Sick Building Syndrome; United States Environmental Protection Agency: Washington, DC, USA, 1991.
- Kostyrko, K.; Wargocki, P. Measurements of Odours and Perceived Indoor Air Quality in Buildings; Scientific Studies Research Building Institute: Warsaw, Poland, 2012. [Google Scholar]
- Bakó-Biró, Z.; Wargocki, P.; Weschler, C.J.; Fanger, P.O. Effects of pollution from personal computers on perceived air quality, SBS symptoms and productivity in offices. Indoor Air 2004, 14, 178–187. [Google Scholar] [CrossRef] [PubMed]
- Wargocki, P.; Wyon, D.P.; Baik, Y.K.; Clausen, G.; Fanger, P.O. Perceived air quality, sick building syndrome (SBS) symptoms and productivity in an office with two different pollution loads. Indoor Air 1999, 9, 165–179. [Google Scholar] [CrossRef] [PubMed]
- Yu, C.; Crump, D. A review of the emission of VOCs from polymeric materials used in buildings. Build. Environ. 1998, 33, 357–374. [Google Scholar] [CrossRef]
- Wilke, O.; Jann, O.; Brödner, D. VOC- and SVOC-emissions from adhesives, floor coverings and complete floor structures. Indoor Air 2004, 14, 98–107. [Google Scholar] [CrossRef] [PubMed]
- Piasecki, M.; Kostyrko, K.; Pykacz, S. Indoor environmental quality assessment: Part 1: Choice of the indoor environmental quality sub-component models. J. Build. Phys. 2017, 41, 264–289. [Google Scholar] [CrossRef]
- Wang, H.L.; Nie, L.; Li, J.; Wang, Y.F.; Wang, G.; Wang, J.H.; Hao, Z.P. Characterization and assessment of volatile organic compounds (VOCs) emissions from typical industries. Chin. Sci. Bull. 2013, 58, 724–730. [Google Scholar] [CrossRef] [Green Version]
- Lim, J.; Kim, S.; Kim, A.; Lee, W.; Han, J.; Cha, J.S. Behavior of VOCs and carbonyl compounds emission from different types of wallpapers in Korea. Int. J. Environ. Res. Public Health 2014, 11, 4326–4339. [Google Scholar] [CrossRef] [PubMed]
- Sparks, L.E.; Guo, Z.; Chang, J.C.; Tichenor, B.A. Volatile Organic Compound Emissions from Latex Paint—Part 1. Chamber Experiments and Source Model Development. Indoor Air 1999, 9, 10–17. [Google Scholar] [CrossRef] [PubMed]
- Chang, J.C.; Fortmann, R.; Roache, N.; Lao, H.C. Evaluation of low-VOC latex paints. Indoor Air 1999, 9, 253–258. [Google Scholar] [CrossRef] [PubMed]
- Schiewecka, A.; Bock, M.C. Emissions from low-VOC and zero-VOC paints—Valuable alternatives to conventional formulations also for use in sensitive environments? Build. Environ. 2015, 85, 243–252. [Google Scholar] [CrossRef]
- Guo, Z.; Chang, J.C.S.; Sparks, L.E.; Fortmann, R.C. Estimation of the rate of VOC emissions from solvent-based indoor coating materials based on product formulation. Atmos Environ. 1999, 33, 1205–1215. [Google Scholar] [CrossRef]
- Kwok, N.H.; Lee, S.C.; Guo, H.; Hung, W.T. Substrate effects on VOC emissions from an interior finishing varnish. Build. Environ. 2003, 38, 1019–1026. [Google Scholar] [CrossRef]
- Xiong, J.; Wang, L.; Bai, Y.; Zhang, Y. Measuring the characteristic parameters of VOC emission from paints. Build. Environ. 2013, 66, 65–71. [Google Scholar] [CrossRef]
- Chang, J.C.S.; Tichenor, B.A.; Guo, Z.; Krebs, K.A. Substrate Effects on VOC Emissions from a Latex Paint. Indoor Air 1997, 7, 223–286. [Google Scholar] [CrossRef]
- Yang, X.; Chen, Q.; Zeng, J.; Zhang, J.S.; Shaw, C.Y. Effects of environmental and test conditions on VOC emissions from “wet” coating materials. Indoor Air 2001, 11, 270–278. [Google Scholar] [CrossRef] [PubMed]
- Li, M. Diffusion-controlled emissions of volatile organic compounds (VOCs): Short-, mid, and long-term emission profiles. Int. J. Heat Mass Transf. 2013, 62, 295–302. [Google Scholar] [CrossRef]
- Guo, Z.; Tichenor, B.A. Fundamental mass transfer models applied to evaluating the emissions of vapor-phase organics from interior architectural coatings. In Proceedings of the 1992 EPA/AWMA Symposium, Durham, NC, USA, 4–9 May 1992. [Google Scholar]
- Li, F.; Niu, J.; Zhang, L. A physically-based model for prediction of VOCs emissions from paint applied to an absorptive substrate. Build. Environ. 2006, 41, 1317–1325. [Google Scholar] [CrossRef]
- AFSSET. Procédure De Qualification Des Émissions De Composes Organiques Volatils Par Les Matériaux De Construction Et Produits De Decoration; French Agency for Environmental and Occupational Health Safety: Maisons-Alfort, France, 2009. [Google Scholar]
- Standard EN 14891: 2017 Liquid Applied Water Impermeable Products for Use Beneath Ceramic Tiling Bonded with Adhesives—Requirements, Test Methods, Assessment and Verification of Constancy of Performance, Classification and Marking. Available online: https://standards.cen.eu/dyn/www/f?p=204:110:0::::FSP_PROJECT,FSP_ORG_ID:59329,6050&cs=1915F706706485DF975E96506D90A0C62 (accessed on 18 June 2018).
- ZDB Merkblatt; Verbundabdichtungen. Hinweise fur Die Ausfiihrung von Flussig zu Verarbeitenden Verbundabdichtungen mit Bekleidungen und Belagen aus Fliesen und Platten fur den Innen- und AuBenbereich. 2012. Available online: https://www.baufachmedien.de/hinweise-fuer-die-ausfuehrung-von-fluessig-zu-verarbeitenden-verbundabdichtungen-fuer-den-innen-und-auss.html (accessed on 18 June 2018).
- Harmonized Standard EN 16516: 2017 Construction Products: Assessment of Release of Dangerous Substances—Determination of Emissions into Indoor Air. Available online: https://standards.cen.eu/dyn/www/f?p=204:110:0::::FSP_PROJECT,FSP_ORG_ID:41188,510793&cs=1216364B7D630CA10EDC767A41CE75645 (accessed on 18 June 2018).
- International Organization for Standardization. Standard ISO 16000-9 Indoor Air—Part 9: Determination of the Emission of Volatile Organic Compounds from Building Products and Furnishing—Emission Test Chamber Method; International Organization for Standardization: Geneva, Switzerland, 2006. [Google Scholar]
- International Organization for Standardization. Standard ISO 16000-11 Indoor Air—Part 11: Determination of the Emission of Volatile Organic Compounds from Building Products and Furnishing—Sampling, Storage of Samples and Preparation of Test Specimens; International Organization for Standardization: Geneva, Switzerland, 2006. [Google Scholar]
- ECA-IAQ (European Collaborative Action “Indoor Air Quality and its Impact on Man”). Total Volatile Organic Compounds (TVOC) in Indoor Quality Investigations; Report No. 19; Office for Official Publications of the European Community: Luxembourg, 1997. [Google Scholar]
Figure 1.
Picture of DM product: in the form provided by the manufacturer (a); and as sample No. 2 which placed on top of fiber-cement board about 20 cm × 70 cm dimensions (b) (photo taken by an author).
Figure 1.
Picture of DM product: in the form provided by the manufacturer (a); and as sample No. 2 which placed on top of fiber-cement board about 20 cm × 70 cm dimensions (b) (photo taken by an author).

Figure 2.
Schematic of the experimental system (a) and photograph of the emission test chamber with an examined sample (b) photo taken by an author.
Figure 2.
Schematic of the experimental system (a) and photograph of the emission test chamber with an examined sample (b) photo taken by an author.


Figure 3.
Comparison of the area-specific emission rate qA [µg/m2·h] after 3 and 28 days of the chamber experiment with dispersion and cementitious types of waterproofing products. On the left side of each point is located the product number, while on the right is the proper qA value [mg/m3].
Figure 3.
Comparison of the area-specific emission rate qA [µg/m2·h] after 3 and 28 days of the chamber experiment with dispersion and cementitious types of waterproofing products. On the left side of each point is located the product number, while on the right is the proper qA value [mg/m3].

Figure 4.
Distribution of main groups of compounds emitted from the tested waterproofing products in terms of the area-specific emission rate qA [µg/m2·h].
Figure 4.
Distribution of main groups of compounds emitted from the tested waterproofing products in terms of the area-specific emission rate qA [µg/m2·h].


Table 1.
A summary of the parameters and typical applications for dispersion and cementitious types of waterproofing products.
Table 1.
A summary of the parameters and typical applications for dispersion and cementitious types of waterproofing products.
| Type of Waterproofing | Typical Applications | Consistency | Chemical Composition | Moisture Exposure Class |
|---|---|---|---|---|
| DM | for indoor use; for damp and wet areas, e.g., in private bathrooms with bathtubs, showers, toilets and kitchens | emulsion (semi-liquid damp waterproofing foil) | modified synthetic resin dispersion mixed with fillers and modifying agents | A A0 |
| RCM | for indoor and outdoor use; balconies, patios, in showers, washrooms, toilets; swimming pools and water tanks | powder mix | cement, calcium carbonate, crystalline silica | A A0 B B0 |
| FCM | for indoor and outdoor use; balconies, plaza decks, weathered roofs or topped roofs, mechanical and equipment rooms; water, wastewater, seawater and marine aquarium tanks and other reinforced concrete structures | emulsion + powder mix | dry mix: cement, mineral fillers and modifying agents + emulsion: water dispersion of plastic |
Table 2.
Sample parameters for the dispersion and cementitious types of waterproofing products tested in the study.
Table 2.
Sample parameters for the dispersion and cementitious types of waterproofing products tested in the study.
| Sample Number | Type of Waterproofing | Sample Parameters | ||
|---|---|---|---|---|
| Emission Area (m2) | Consumption (kg/m2) | Loading Factor (m2/m3) | ||
| 1 | DM | 0.14 | 0.8 | 1.4 |
| 2 | 0.14 | 1.1 | 1.4 | |
| 3 | 0.18 | 1.5 | 1.8 | |
| 4 | RCM | 0.09 | 3.0 | 0.4 |
| 5 | 0.14 | 2.8 | 1.4 | |
| 6 | 0.18 | 4.0 | 1.8 | |
| 7 | FCM | 0.14 | 3.4 | 1.4 |
| 8 | 0.14 | 3.5 | 1.4 | |
| 9 | 0.14 | 3.0 | 1.8 | |
Table 3.
Concentrations (µg/m3) and area-specific emission rates (µg/m2·h) of identified VOCs for three types of liquid-applied water-impermeable products (average values after 3- and 28-day emission test chamber experiments).
Table 3.
Concentrations (µg/m3) and area-specific emission rates (µg/m2·h) of identified VOCs for three types of liquid-applied water-impermeable products (average values after 3- and 28-day emission test chamber experiments).
| Identified VOC | Average Value after 3 Days | Average Value after 28 Days | ||
|---|---|---|---|---|
| Concentration [µg/m3] | Area-Specific Emission Rate [µg/m2·h] | Concentration [µg/m3] | Area-Specific Emission Rate [µg/m2·h] | |
| DM | ||||
| product 1 | ||||
| n-Butanol | 11 ± 2 | 4 ± 1 | 3 ± 1 | 1 ± 1 |
| Styrene | 17 ± 3 | 6 ± 1 | 4 ± 1 | 1 ± 1 |
| (1-Methylethyl)benzene | 7 ± 1 | 2 ± 1 | <2 | <1 |
| Propylbenzene | 4 ± 1 | 1 ± 1 | 3 ± 1 | 1 ± 1 |
| Benzaldehyde | 19 ± 3 | 7 ± 1 | <2 | <1 |
| 2-Ethyl-1-hexanol | 64 ± 12 | 23 ± 4 | 32 ± 6 | 11 ± 2 |
| 2-Ethylhexyl acetate | 50 ± 9 | 18 ± 3 | 28 ± 5 | 10 ± 2 |
| 2-Ethylhexyl acrylate | 9 ± 2 | 3 ± 1 | 6 ± 1 | 2 ± 1 |
| Octyl propionate | 11 ± 2 | 4 ± 1 | 6 ± 1 | 2 ± 1 |
| TVOC/Sum | 211 ± 38 | 75 ± 14 | 78 ± 14 | 28 ± 5 |
| product 2 | ||||
| n-Butanol | 382 ± 69 | 136 ± 24 | 74 ± 14 | 26 ± 5 |
| Butyl ether | 47 ± 8 | 17 ± 3 | 7 ± 1 | 2 ± 1 |
| Butyl acrylate | 47 ± 8 | 17 ± 3 | 7 ± 1 | 2 ± 1 |
| Butyl propionate | 6 ± 1 | 2 ± 1 | <2 | <1 |
| 2-Ethyltoluene | 7 ± 1 | 2 ± 1 | <2 | <1 |
| Propylbenzene | 4 ± 1 | 1 ± 1 | <2 | <1 |
| Butyl butyrate | 4 ± 1 | 1 ± 1 | <2 | <1 |
| 1-(2-Butoxyethoxy)ethanol | 37 ± 7 | 13 ± 2 | 42 ± 8 | 15 ± 3 |
| Others | 18 ± 3 | 6 ± 1 | 18 ± 3 | 6 ± 1 |
| TVOC/Sum | 383 ± 69 | 137 ± 25 | 120 ± 22 | 43 ± 8 |
| product 3 | ||||
| n-Butanol | 109 ± 20 | 30 ± 5 | 8 ± 1 | 2 ± 1 |
| 1,2-Propanediol | 62 ± 11 | 17 ± 3 | 14 ± 3 | 4 ± 1 |
| Cyclohexanol | 99 ± 18 | 2 ± 1 | 53 ± 10 | 15 ± 3 |
| Styrene | 216 ± 39 | 60 ± 11 | 20 ± 4 | 6 ± 1 |
| TVOC/Sum | 486 ± 88 | 135 ± 24 | 95 ± 17 | 26 ± 5 |
| RCM | ||||
| product 4 | ||||
| 2-Ethyl-1-hexanol | 8 ± 2 | 10 ± 2 | 2 ± 1 | 2 ± 1 |
| TVOC/Sum | 8 ± 2 | 10 ± 2 | 2 ± 1 | 2 ± 1 |
| product 5 | ||||
| 2-Methyl-1-propanol | 20 ± 4 | 7 ± 1 | <2 | <1 |
| 2-Methylcyclopentanol | 2 ± 1 | 1 ± 1 | <2 | <1 |
| Benzoic acid | 12 ± 2 | 4 ± 1 | 10 ± 2 | 4 ± 1 |
| Others | 17 ± 3 | 6 ± 1 | 2 ± 1 | 1 ± 1 |
| TVOC/Sum | 51 ± 9 | 18 ± 3 | 12 ± 2 | 4 ± 1 |
| product 6 | ||||
| n-Butanol | 16 ± 3 | 4 ± 1 | 5 ± 1 | 1 ± 1 |
| 1-Methoxy-2-propanol | 6 ± 1 | 2 ± 1 | 2 ± 1 | 1 ± 1 |
| 1-Pentanol | 5 ± 1 | 1 ± 1 | 2 ± 1 | 1 ± 1 |
| Hexanal | 8 ± 2 | 2 ± 1 | 2 ± 1 | 1 ± 1 |
| 2-Butoxyethanol | 36 ± 6 | 10 ± 2 | 6 ± 1 | 2 ± 1 |
| TVOC/Sum | 71 ± 13 | 20 ± 4 | 17 ± 3 | 5 ± 1 |
| FCM | ||||
| product 7 | ||||
| 2-Methyl-1-propanol | 76 ± 14 | 27 ± 5 | 11 ± 2 | 4 ± 1 |
| n-Butanol | 1382 ± 249 | 494 ± 89 | 138 ± 25 | 49 ± 9 |
| Ethylene glycol | 39 ± 7 | 14 ± 3 | 10 ± 2 | 4 ± 1 |
| 3-Methyl-2-heptene | 6 ± 1 | 2 ± 1 | <2 | <1 |
| Hexanal | 12 ± 2 | 4 ± 1 | <2 | <1 |
| Butyl acetate | 140 ± 25 | 50 ± 9 | 4 ± 1 | 1 ± 1 |
| 2-Methyl-1-pentanol | 4 ± 1 | 1 ± 1 | <2 | <1 |
| Ethylbenzene | 49 ± 9 | 17 ± 3 | <2 | <1 |
| o,m-Xylene | 146 ± 26 | 52 ± 9 | 5 ± 1 | 2 ± 1 |
| Butyl ether | 227 ± 41 | 81 ± 15 | 2 ± 1 | 1 ± 1 |
| p-Xylene | 68 ± 12 | 24 ± 4 | <2 | <1 |
| Butyl propionate | 113 ± 20 | 40 ± 7 | <2 | <1 |
| 3-Methyl-4-heptanone | 44 ± 8 | 16 ± 3 | <2 | <1 |
| 3-Methyl-2-heptanone | 8 ± 2 | 3 ± 1 | <2 | <1 |
| Allylbenzene | 7 ± 1 | 2 ± 1 | <2 | <1 |
| Propylbenzene | 37 ± 7 | 13 ± 2 | <2 | <1 |
| Benzaldehyde | 42 ± 8 | 15 ± 2 | 2 ± 1 | 1 ± 1 |
| 3-Ethyltoluene | 12 ± 2 | 4 ± 1 | <2 | <1 |
| Butyl butyrate | 47 ± 8 | 17 ± 3 | 3 ± 1 | 1 ± 1 |
| 3-Carene | 5 ± 1 | 12 ± 2 | <2 | <1 |
| 2-Propyl-1-pentanol | 475 ± 86 | 170 ± 30 | 357 ± 64 | 127 ± 23 |
| Benzyl alcohol | 55 ± 10 | 20 ± 4 | 35 ± 6 | 12 ± 2 |
| Dibutoxymethane | 9 ± 2 | 3 ± 1 | <2 | <1 |
| 2-Ethylhexyl acetate | 115 ± 21 | 41 ± 7 | 85 ± 15 | 30 ± 5 |
| Butyl 2-ethylhexyl ether | 6 ± 1 | 2 ± 1 | 4 ± 1 | 1 ± 1 |
| 2-Ethylhexyl acrylate | 11 ± 2 | 4 ± 1 | 5 ± 1 | 2 ± 1 |
| 2-Ethylhexyl butyrate | 4 ± 1 | 1 ± 1 | 2 ± 1 | 1 ± 1 |
| TVOC/Sum | 2647 ± 476 | 945 ± 170 | 614 ± 111 | 219 ± 39 |
| product 8 | ||||
| n-Butanol | 2524 ± 454 | 901 ± 162 | 230 ± 41 | 82 ± 15 |
| Butyl ether | 578 ± 104 | 206 ± 37 | 60 ± 11 | 21 ± 4 |
| 1-Methoxy-2-propanol | 128 ± 23 | 46 ± 8 | 6 ± 1 | 2 ± 1 |
| 1,2-Propanediol | 114 ± 21 | 41 ± 7 | 21 ± 4 | 7 ± 1 |
| Butyl acetate | 146 ± 26 | 52 ± 9 | 2 ± 1 | 1 ± 1 |
| Ethylbenzene | 104 ± 19 | 37 ± 7 | 2 ± 1 | 1 ± 1 |
| Butyl acrylate | 125 ± 23 | 45 ± 8 | 2 ± 1 | 1 ± 1 |
| Butyl propionate | 178 ± 32 | 64 ± 12 | 7 ± 1 | 2 ± 1 |
| Butyl butyrate | 98 ± 18 | 35 ± 6 | 7 ± 1 | 2 ± 1 |
| Benzaldehyde | 52 ± 27 | 19 ± 3 | 6 ± 1 | 2 ± 1 |
| Others | 66 ± 12 | 24 ± 4 | 10 ± 2 | 4 ± 1 |
| TVOC/Sum | 4146 ± 750 | 1481 ± 267 | 345 ± 62 | 123 ± 22 |
| product 9 | ||||
| n-Butanol | 2646 ± 476 | 735 ± 132 | 173 ± 31 | 48 ± 9 |
| Butyl acetate | 82 ± 15 | 23 ± 4 | 3 ± 1 | 1 ± 1 |
| Ethylbenzene | 62 ± 11 | 17 ± 3 | 3 ± 1 | 1 ± 1 |
| Xylene | 28 ± 5 | 8 ± 2 | 3 ± 1 | 1 ± 1 |
| Propylbenzene | 70 ± 13 | 19 ± 3 | 5 ± 1 | 1 ± 1 |
| 4-Heptanone | 27 ± 5 | 7 ± 1 | <2 | <1 |
| 3-Methyl-4-heptanone | 44 ± 8 | 12 ± 2 | <2 | <1 |
| Butyl propionate | 92 ± 17 | 26 ± 5 | 8 ± 2 | 2 ± 1 |
| Butyl butyrate | 31 ± 6 | 9 ± 2 | <2 | <1 |
| Benzaldehyde | 96 ± 17 | 27 ± 5 | 7 ± 1 | 2 ± 1 |
| Isobutyl ether | 178 ± 32 | 49 ± 9 | 3 ± 1 | 1 ± 1 |
| TVOC/Sum | 3229 ± 580 | 897 ± 161 | 205 ± 37 | 57 ± 10 |
Table 3 is supplemented by uncertainty for particular compounds. The expanded uncertainty was calculated using a factor of k = 2, which corresponds to the level of confidence of approximately 95%. Uncertainty was determined based on available data including: data on the accuracy of the measurement system used and experimentally obtained data on repeatability.
Table 4.
The area-specific emission rates qA [µg/m2·h] of the four groups of compounds identified from the different types of liquid-applied water-impermeable products after 3 and 28 days in the chamber test emission experiment.
Table 4.
The area-specific emission rates qA [µg/m2·h] of the four groups of compounds identified from the different types of liquid-applied water-impermeable products after 3 and 28 days in the chamber test emission experiment.
| Group of Compounds | Area-Specific Emission Rate qA [µg/m2·h] | |||||
| DM | ||||||
| Product 1 | Product 2 | Product 3 | ||||
| 3 Days | 28 Days | 3 Days | 28 Days | 3 Days | 28 Days | |
| Ʃ alcohols | 27 | 13 | 150 | 41 | 75 | 21 |
| Ʃ benzene derivatives | 10 | 3 | 4 | 1 | 60 | 56 |
| Ʃ aldehydes and ketones | 7 | 1 | - | - | - | - |
| Ʃ ethers and esters | 25 | 14 | 37 | 6 | - | - |
| RCM | ||||||
| Product 4 | Product 5 | Product 6 | ||||
| 3 days | 28 days | 3 days | 28 days | 3 Days | 28 Days | |
| Ʃ alcohols | 10 | 3 | 7 | 1 | 18 | 4 |
| Ʃ benzene derivatives | - | - | - | - | - | - |
| Ʃ aldehydes and ketones | - | - | 15 | 2 | 2 | 1 |
| Ʃ ethers and esters | - | - | - | - | - | - |
| FCM | ||||||
| Product 7 | Product 8 | Product 9 | ||||
| 3 Days | 28 Days | 3 Days | 28 Days | 3 Days | 28 Days | |
| Ʃ alcohols | 725 | 198 | 988 | 92 | 735 | 48 |
| Ʃ benzene derivatives | 129 | 6 | 37 | 1 | 44 | 3 |
| Ʃ aldehydes and ketones | 50 | 9 | 19 | 2 | 46 | 3 |
| Ʃ ethers and esters | 238 | 38 | 402 | 28 | 106 | 4 |
© 2018 by the authors. Licensee MDPI, Basel, Switzerland. This article is an open access article distributed under the terms and conditions of the Creative Commons Attribution (CC BY) license (http://creativecommons.org/licenses/by/4.0/).
Share and Cite
MDPI and ACS Style
Kozicki, M.; Piasecki, M.; Goljan, A.; Deptuła, H.; Niesłochowski, A. Emission of Volatile Organic Compounds (VOCs) from Dispersion and Cementitious Waterproofing Products. Sustainability 2018, 10, 2178. https://doi.org/10.3390/su10072178
AMA Style
Kozicki M, Piasecki M, Goljan A, Deptuła H, Niesłochowski A. Emission of Volatile Organic Compounds (VOCs) from Dispersion and Cementitious Waterproofing Products. Sustainability. 2018; 10(7):2178. https://doi.org/10.3390/su10072178
Chicago/Turabian StyleKozicki, Mateusz, Michał Piasecki, Anna Goljan, Halina Deptuła, and Adam Niesłochowski. 2018. "Emission of Volatile Organic Compounds (VOCs) from Dispersion and Cementitious Waterproofing Products" Sustainability 10, no. 7: 2178. https://doi.org/10.3390/su10072178
Note that from the first issue of 2016, this journal uses article numbers instead of page numbers. See further details here.