Climatic Changes and Their Relation to Weather Types in a Transboundary Mountainous Region in Central Europe

 ,
,
Abstract
:1. Introduction
2. Data and Methods
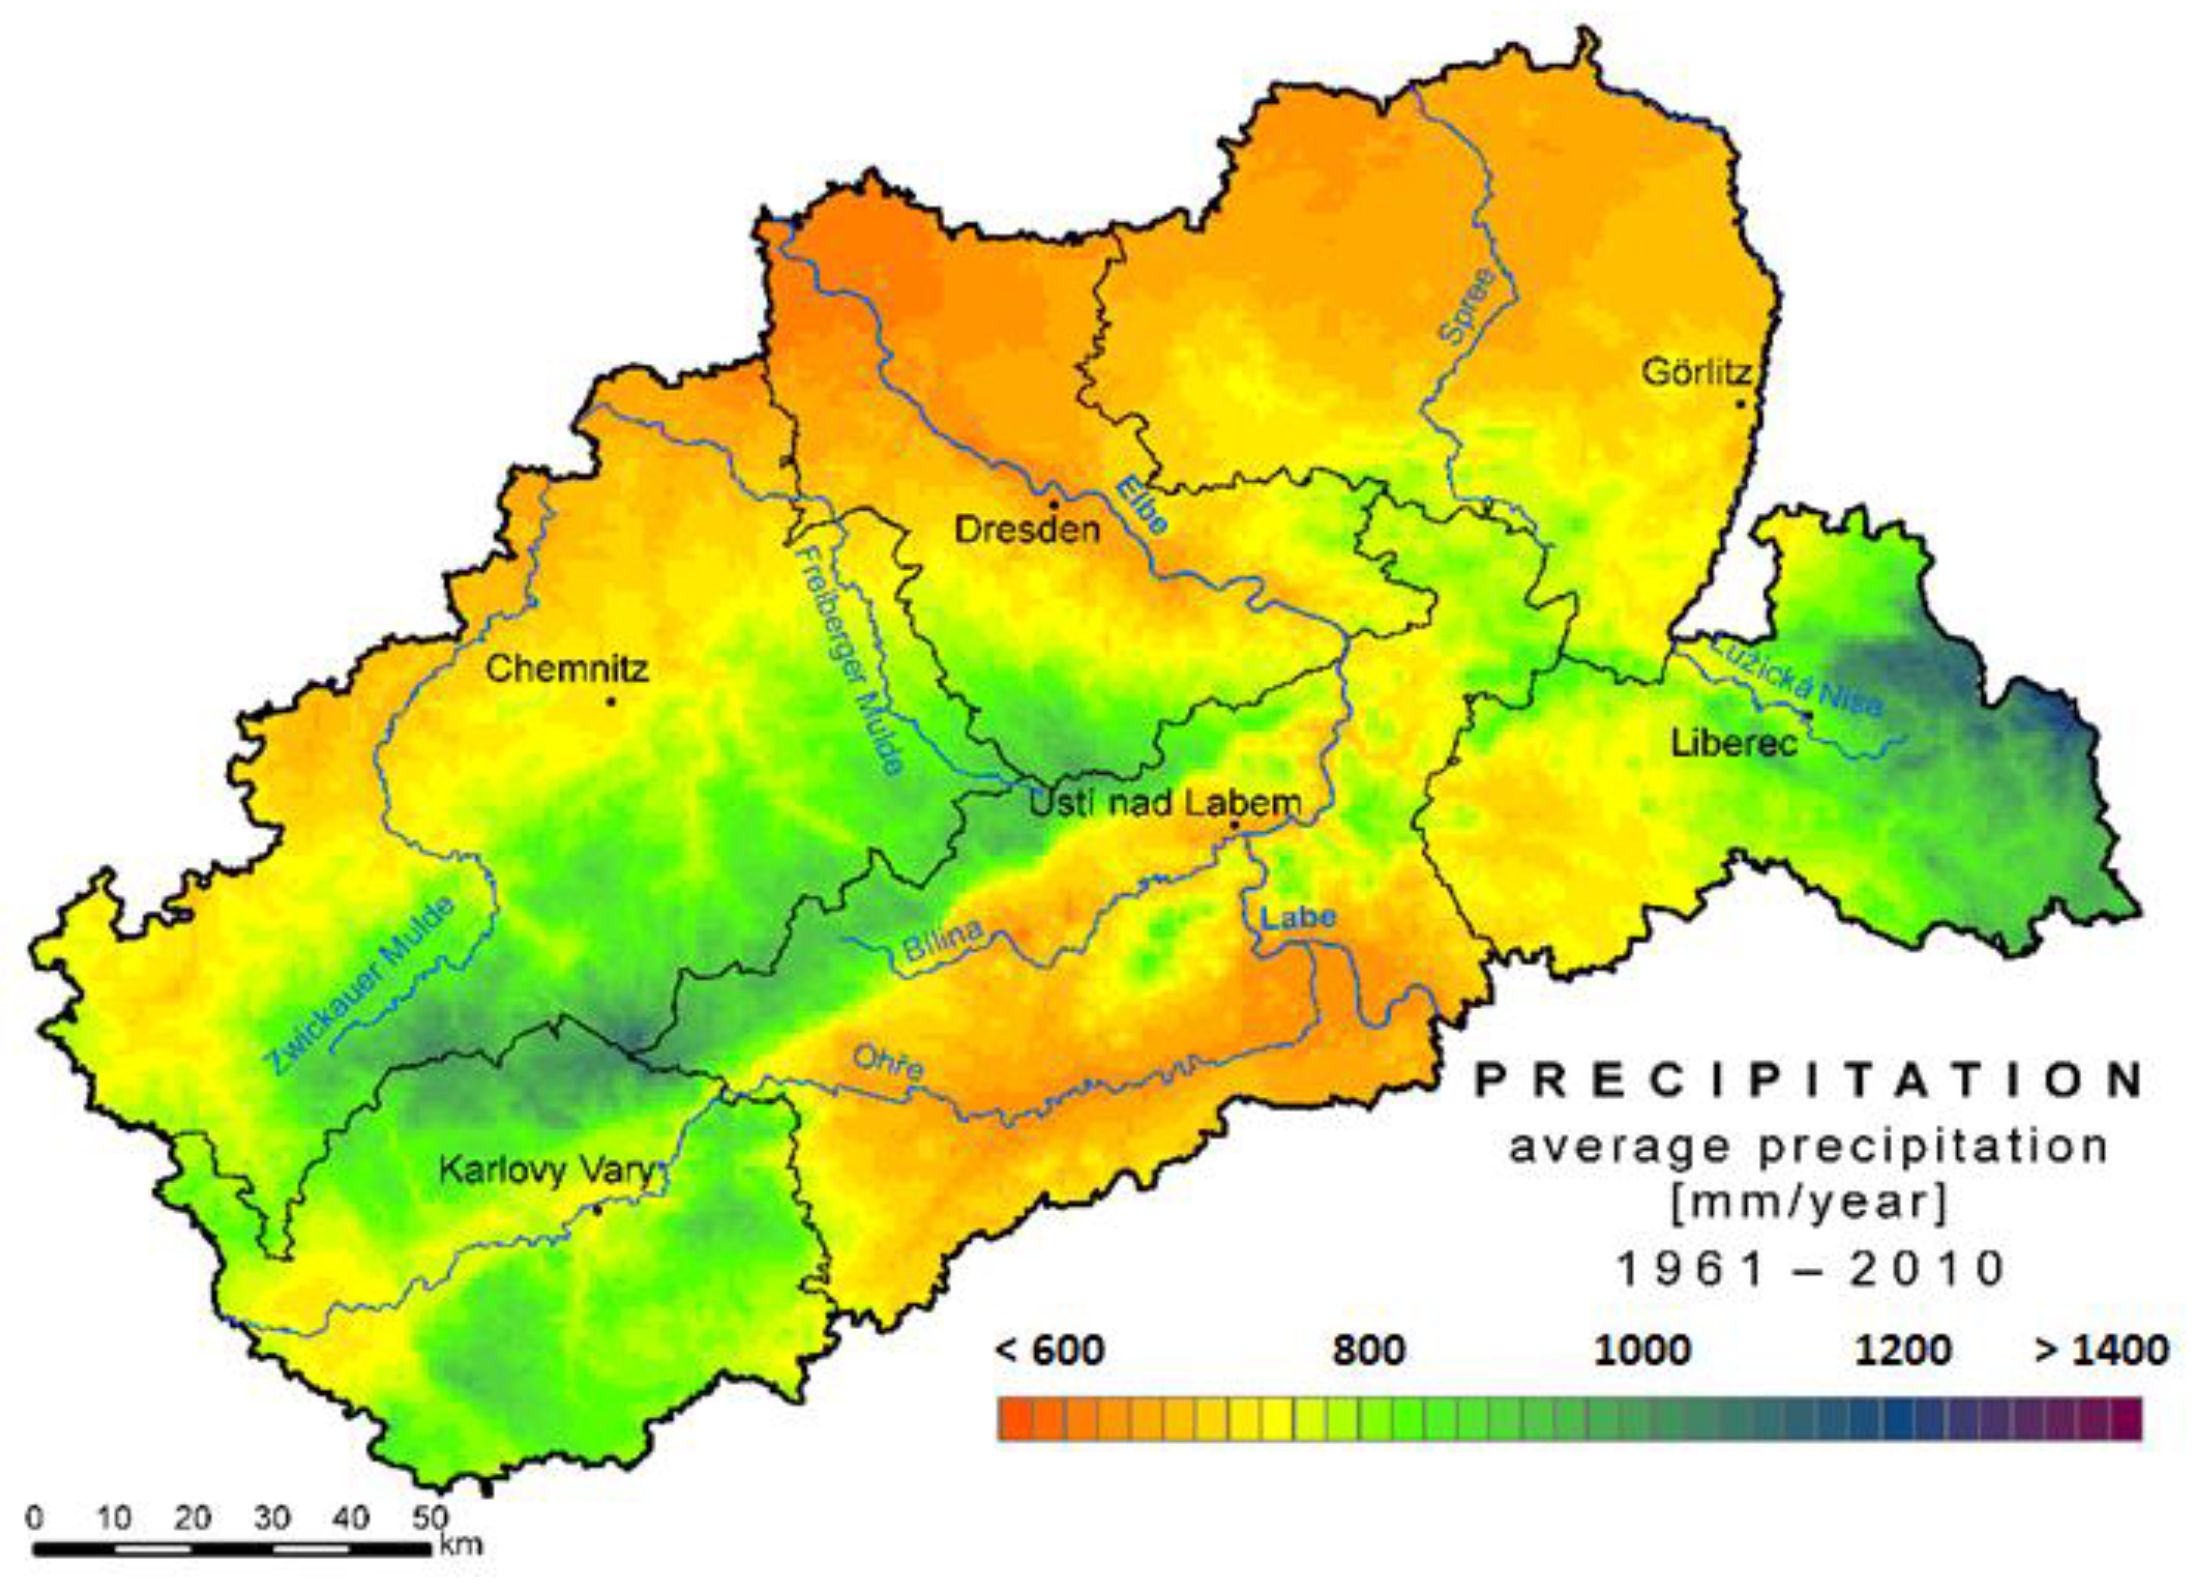
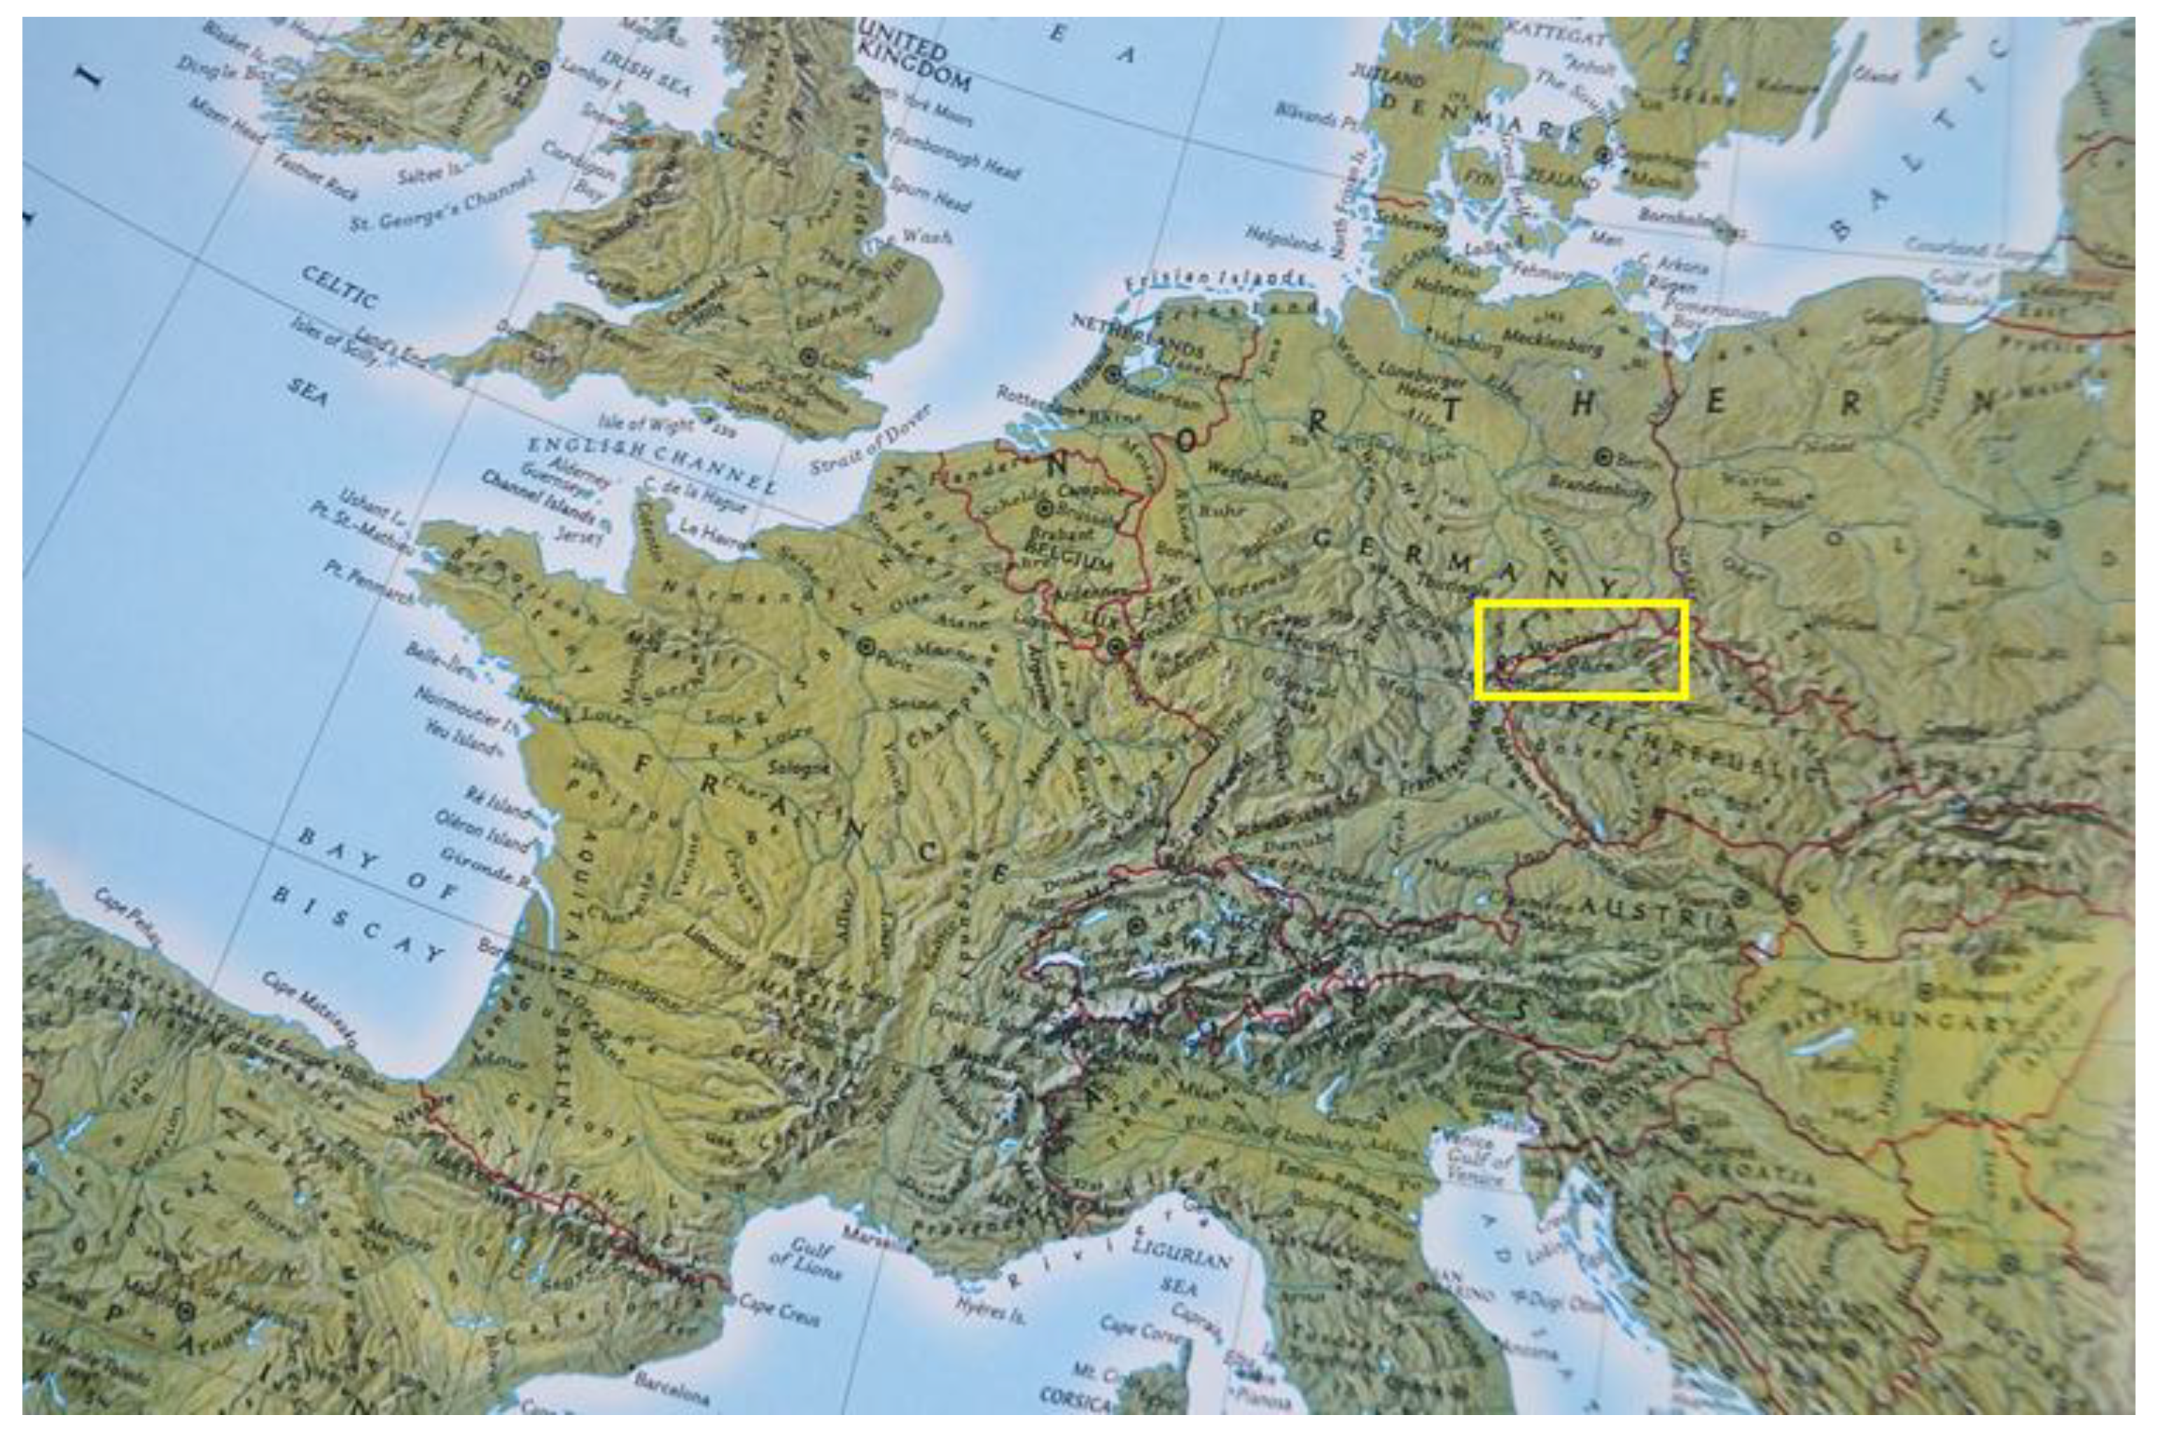
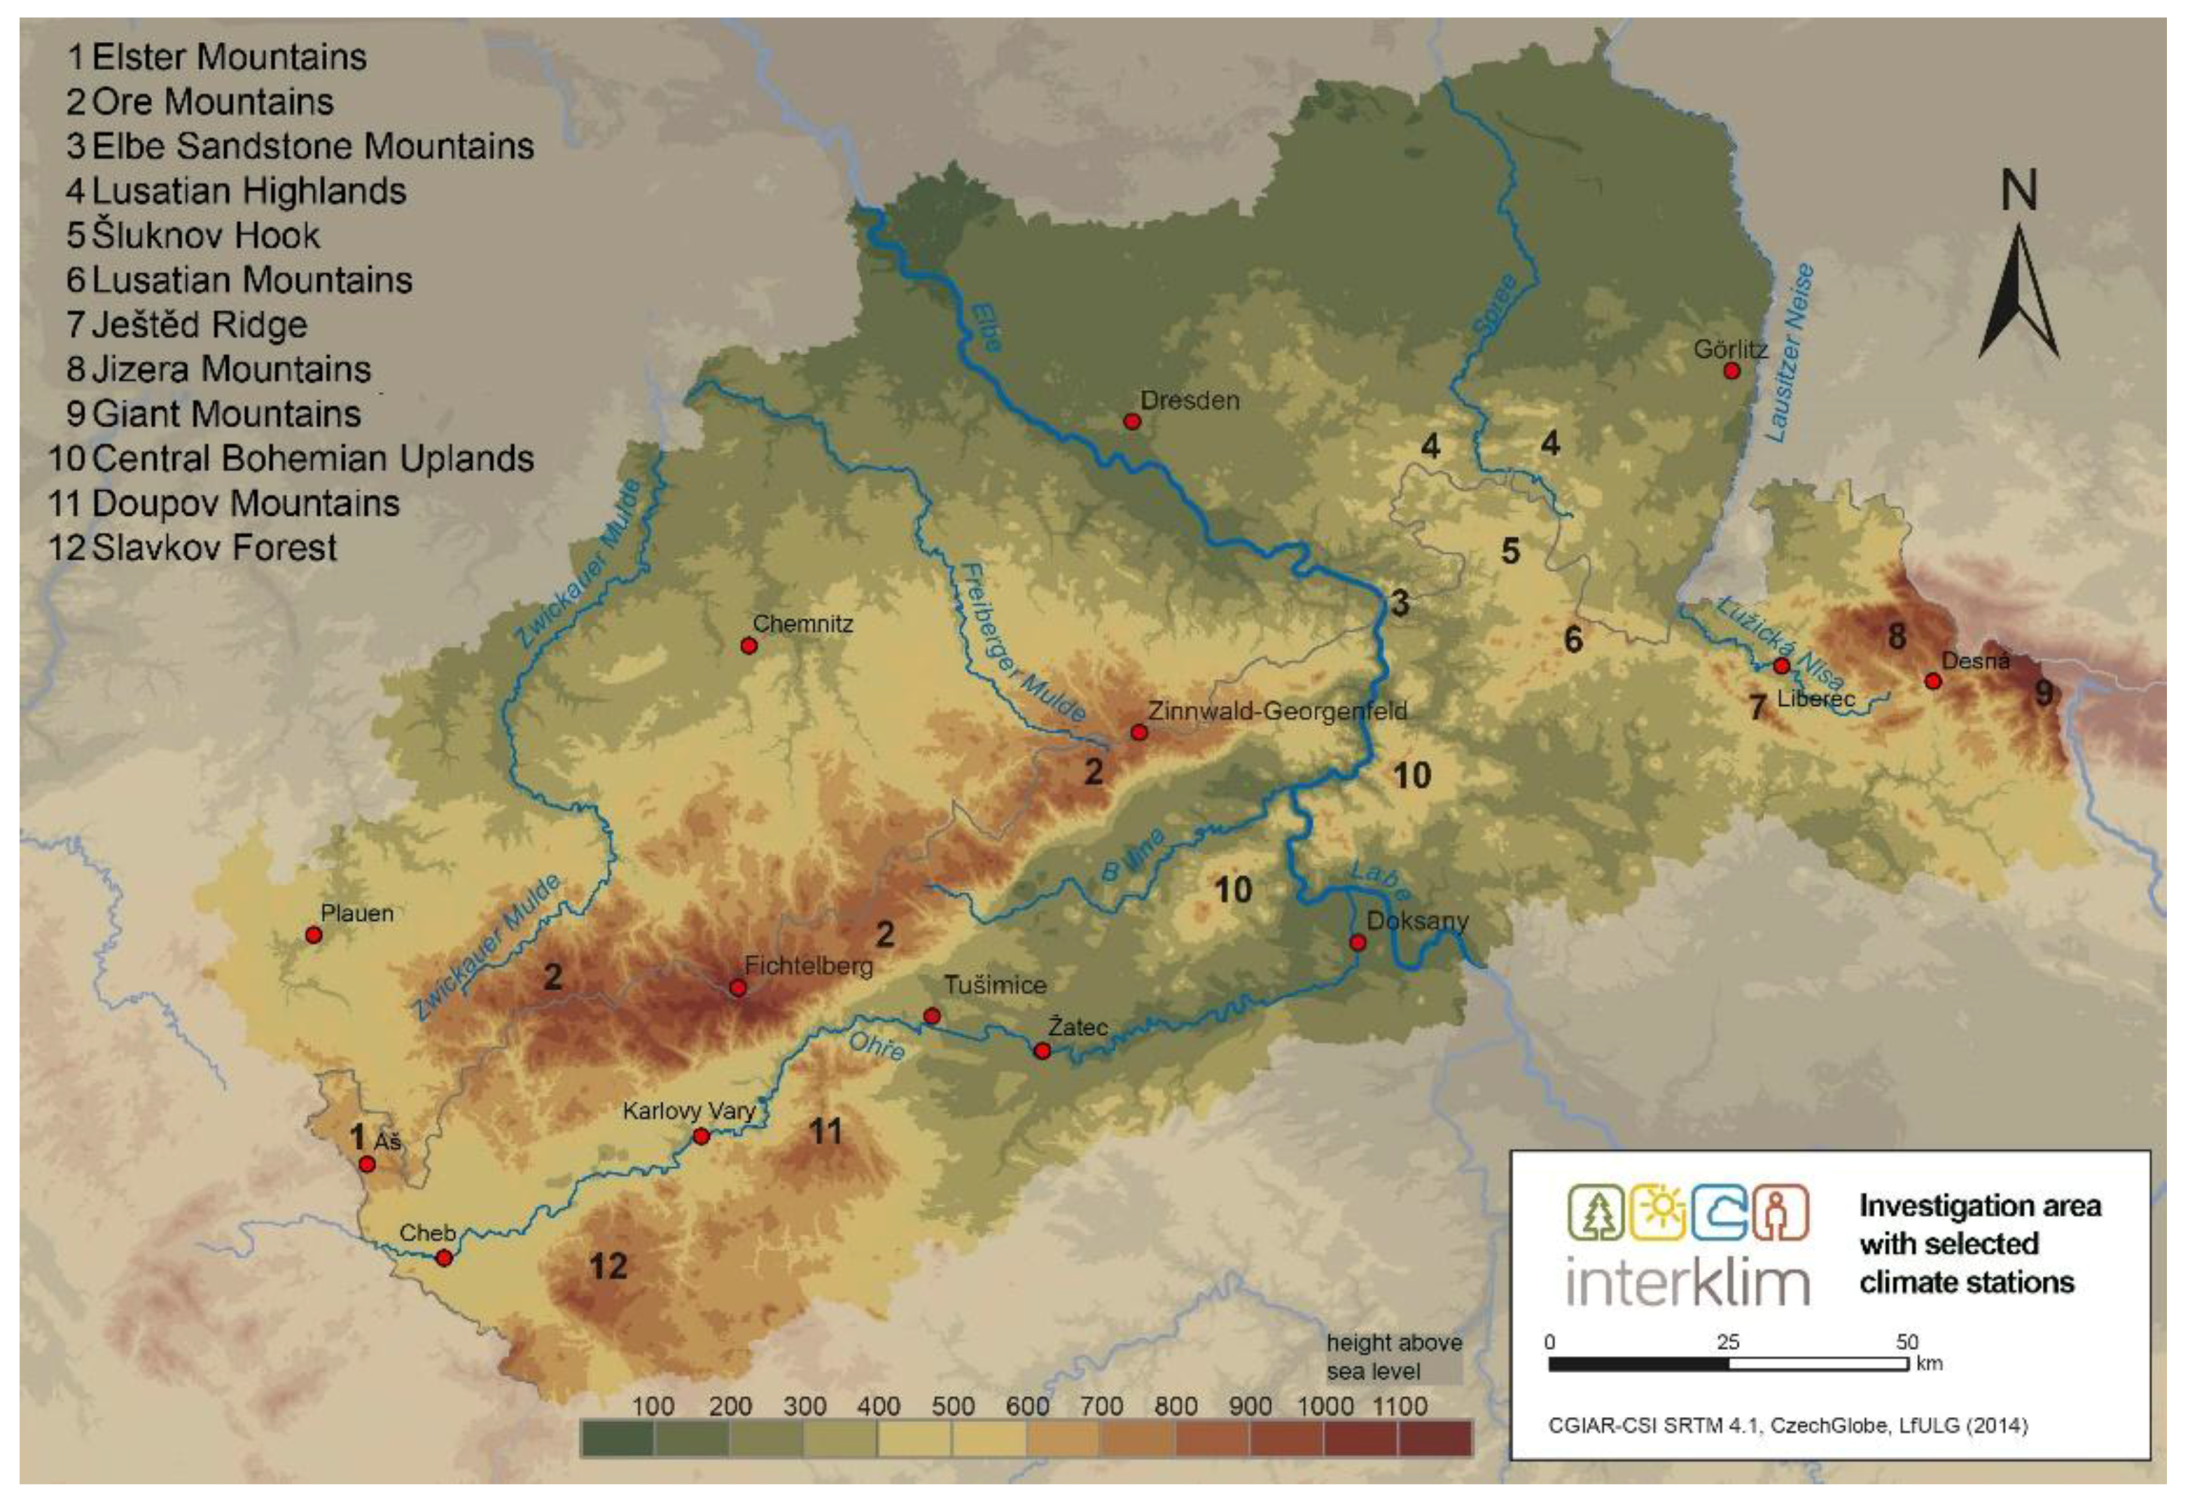
2.1. Study Area Characteristics
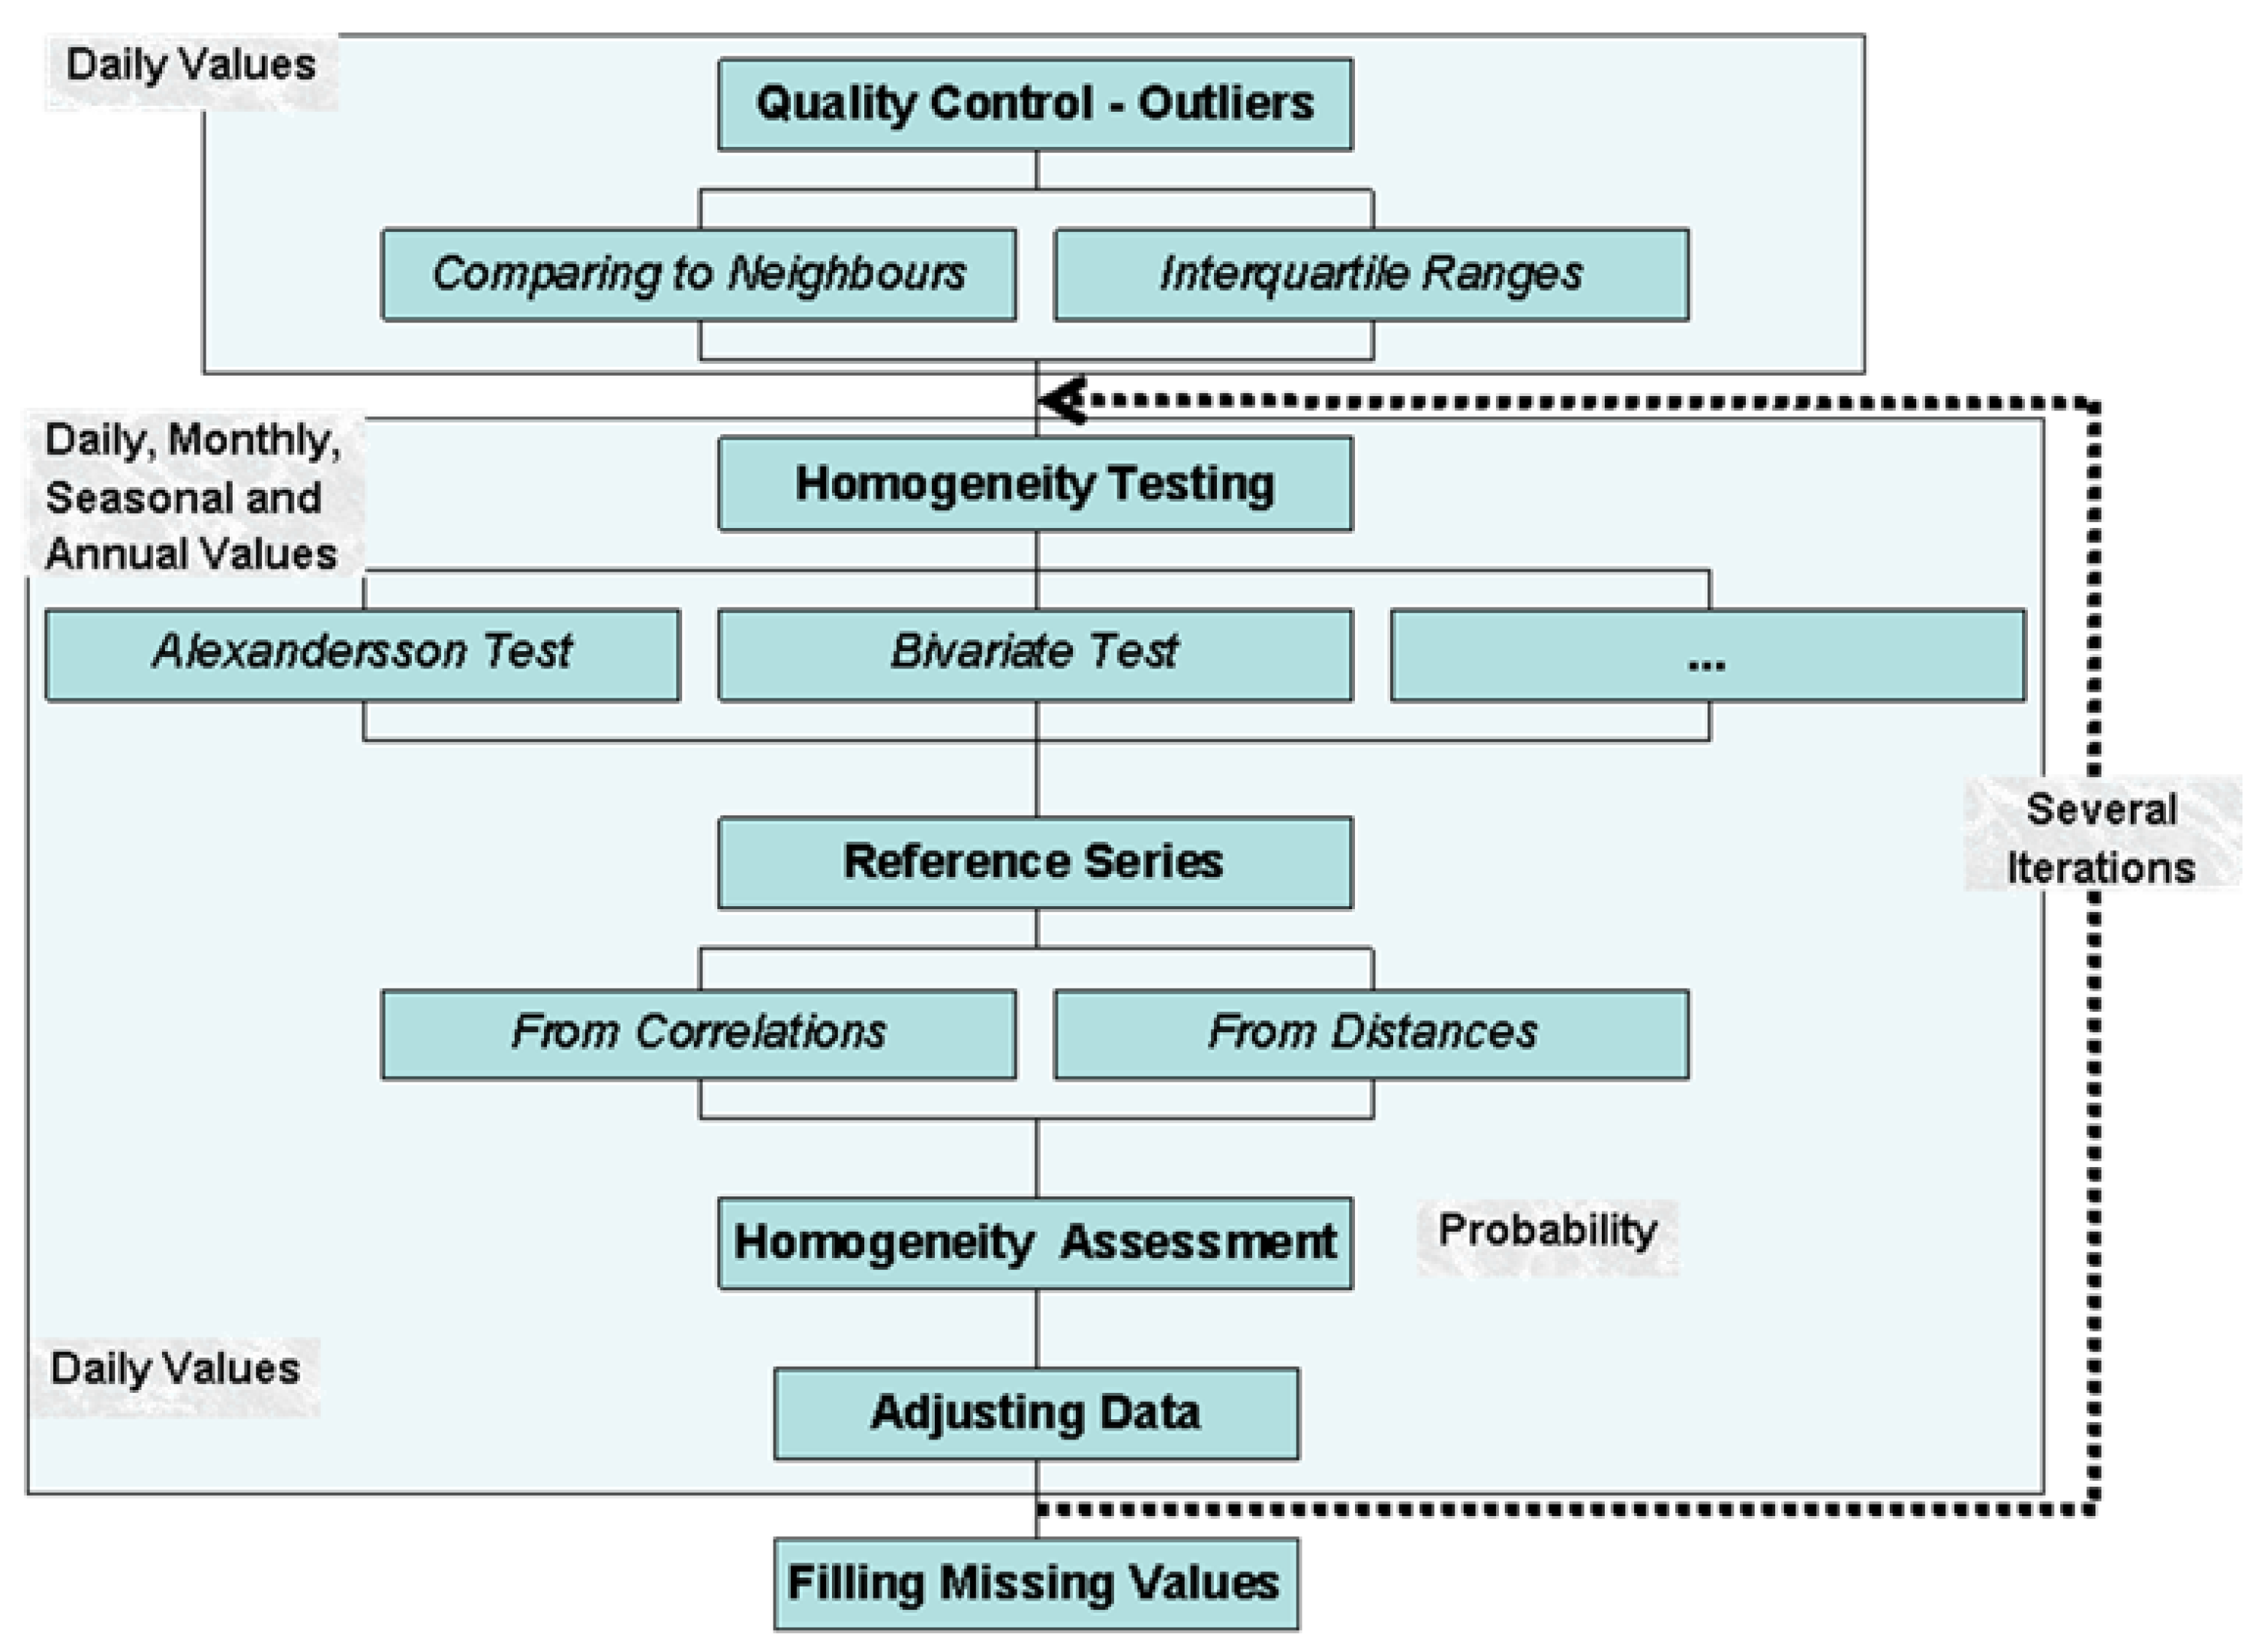
2.2. Climate Data and Processing
- (i)
- analysing time series of differences between candidate and neighbouring stations (i.e., pair-wise comparisons = individual comparison of candidate (tested) series with neighbours; the number of neighbours determines the number of comparisons);
- (ii)
- applying limits derived from inter-quartile ranges; and
- (iii)
- comparing time series of tested values with “expected” (theoretical) values of “technical” series created by means of statistical methods for spatial data. “Expected” values were estimated as weighted means (IDW method) from values of neighbouring stations, standardized by altitude. The weights are reciprocal values of distances, with a given power (one for temperature, three for precipitation). “Technical” series are artificial time series of the same station. Compared to raw data, they are homogenized and do not include gaps.
2.3. Climate Indices
2.4. Weather Types
2.5. Spatial Visualisation of the Results
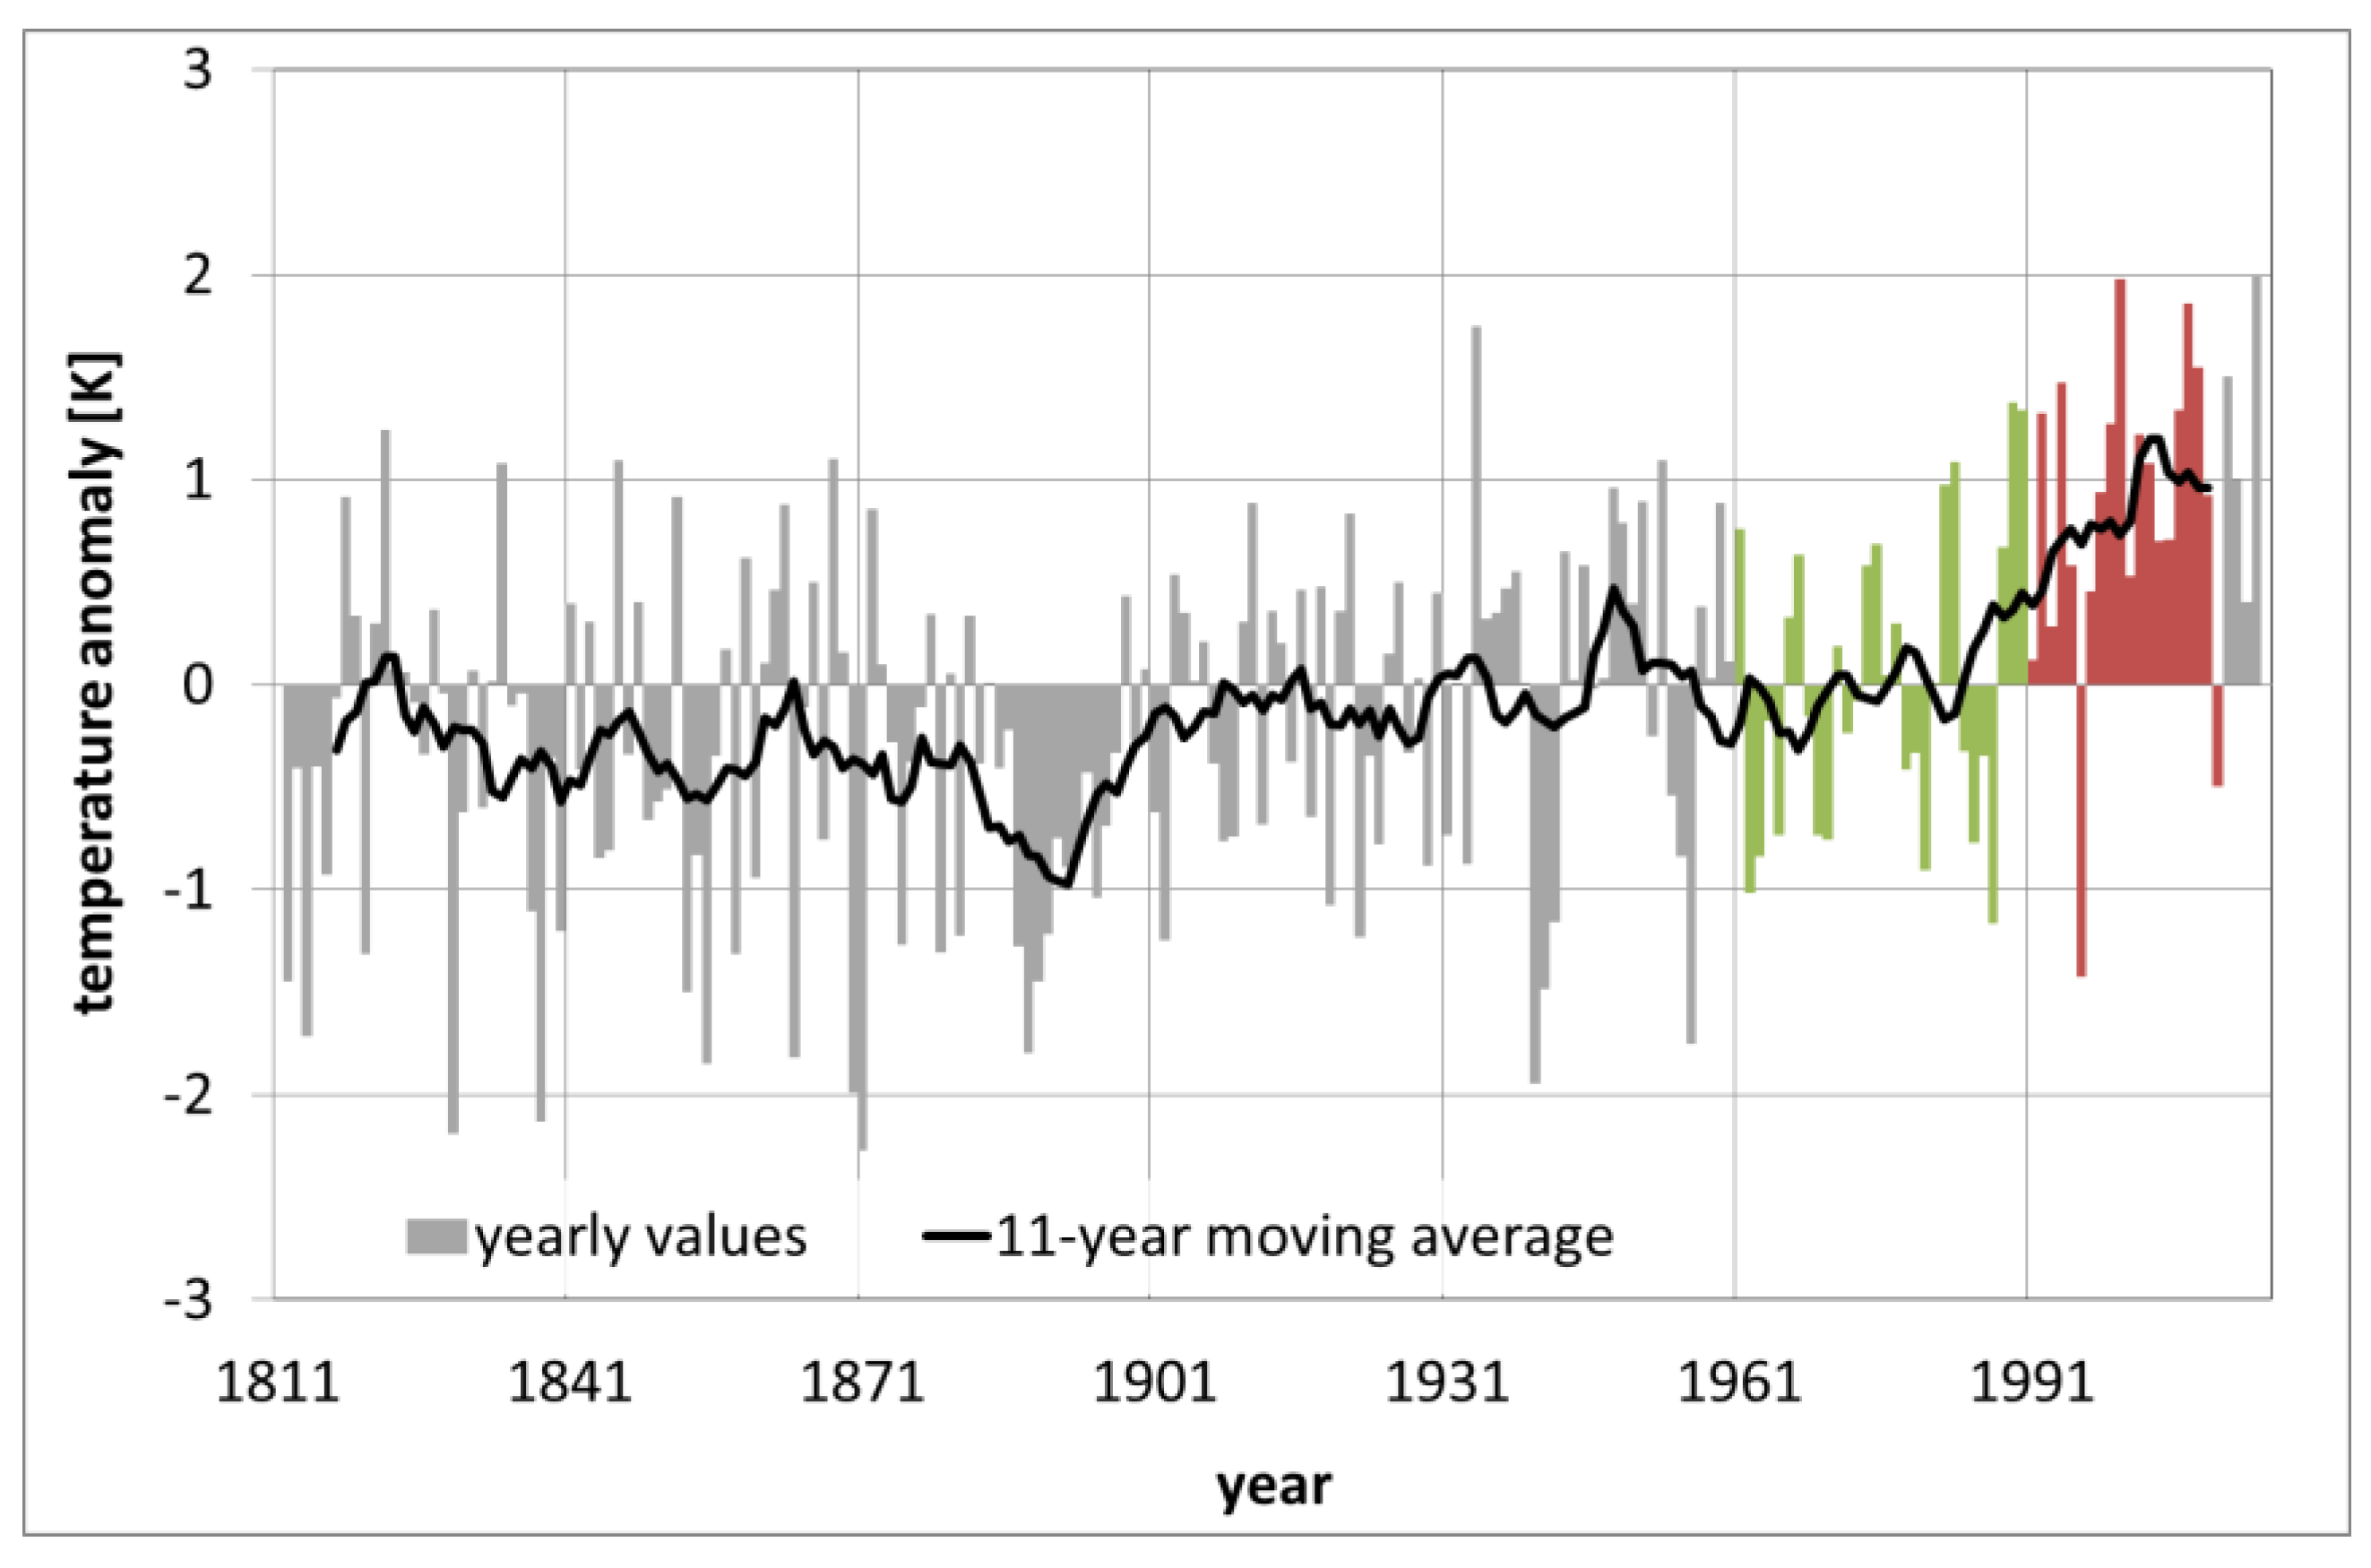
3. Observed Climate Changes
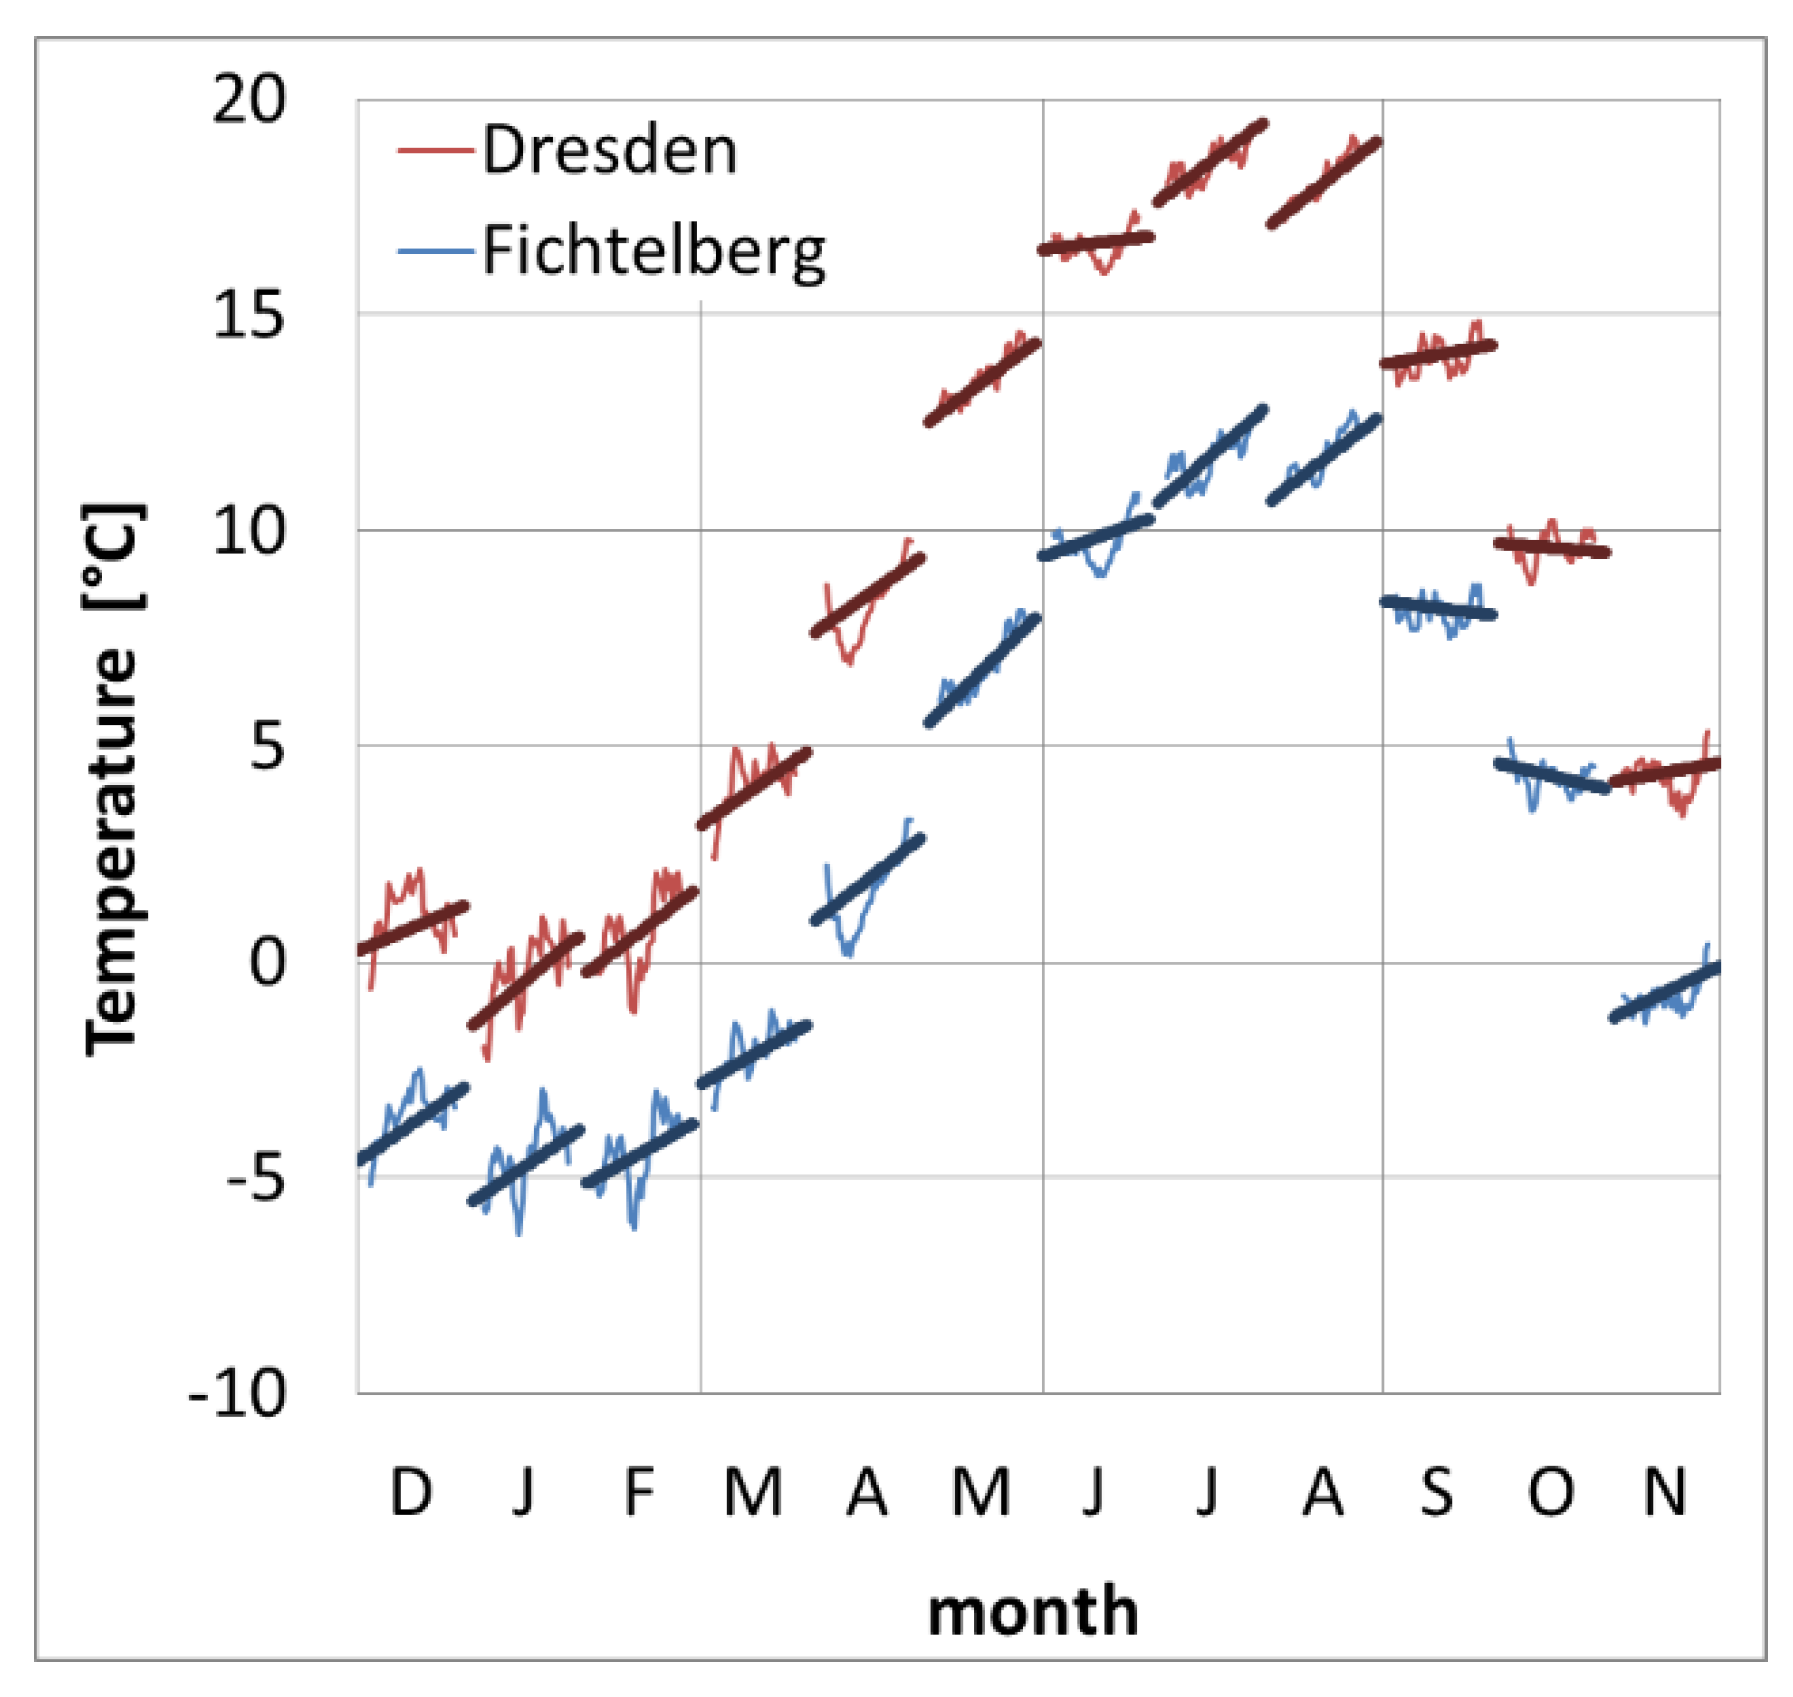
3.1. Temperature
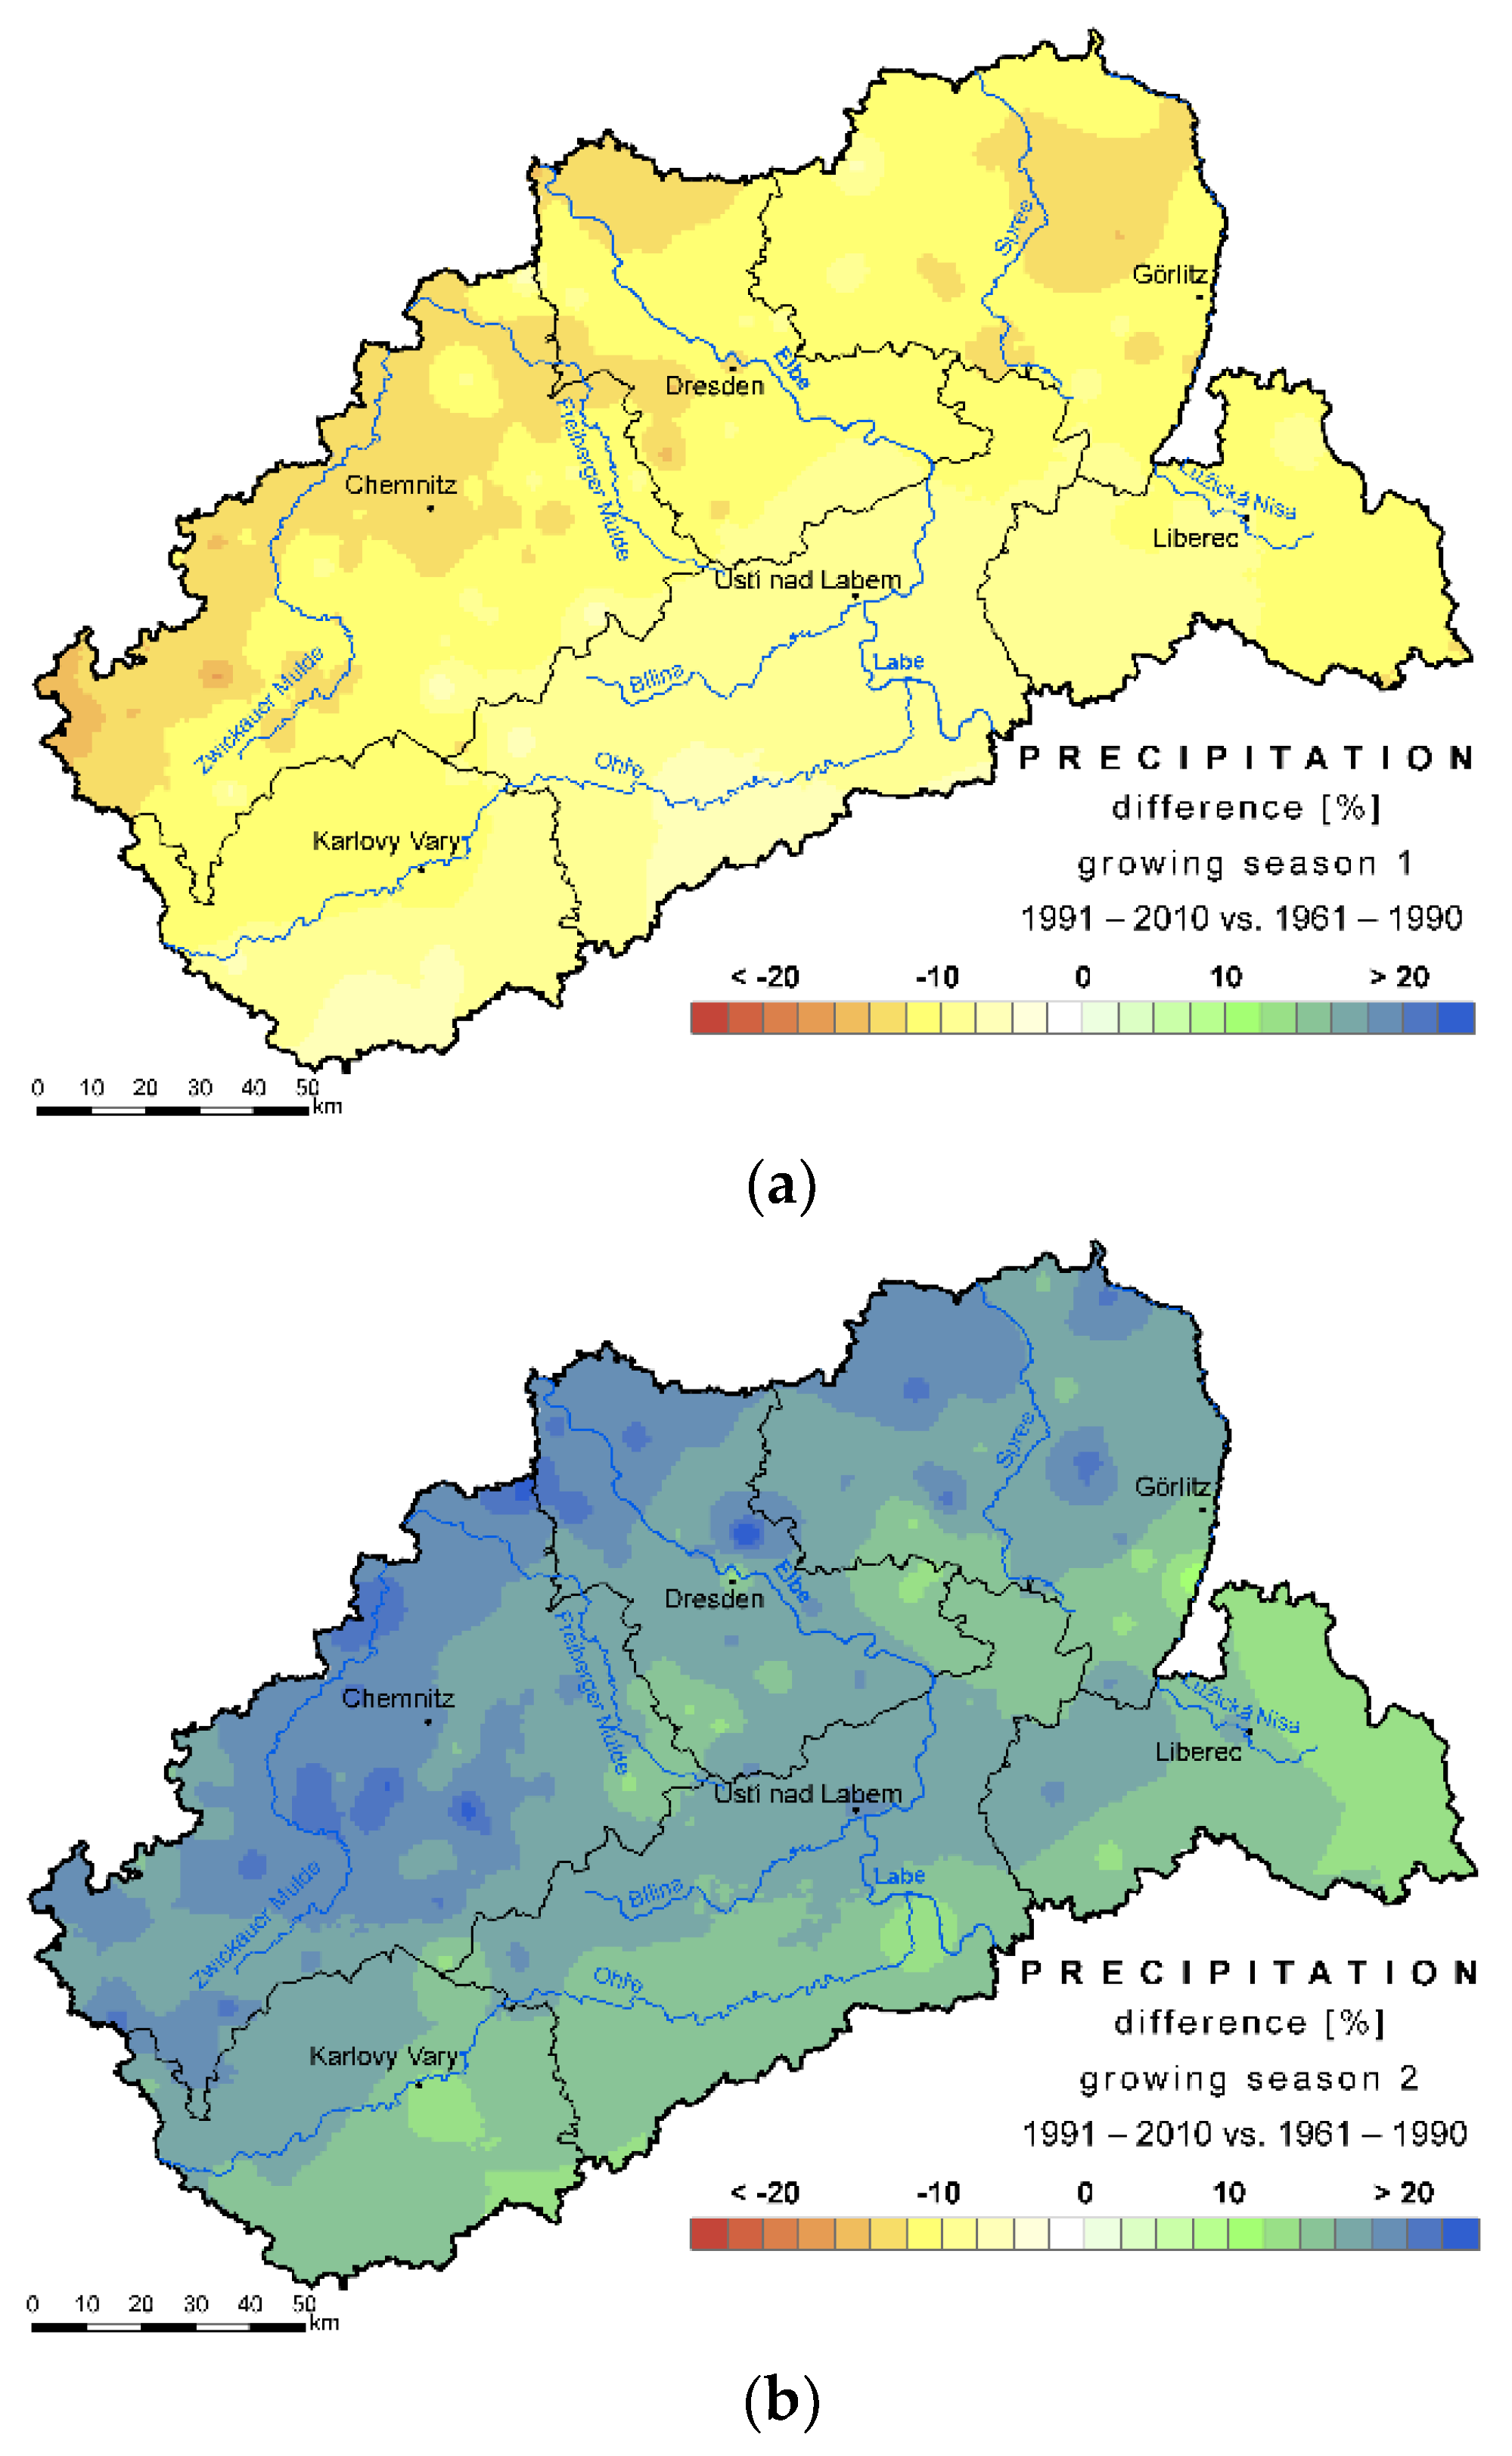
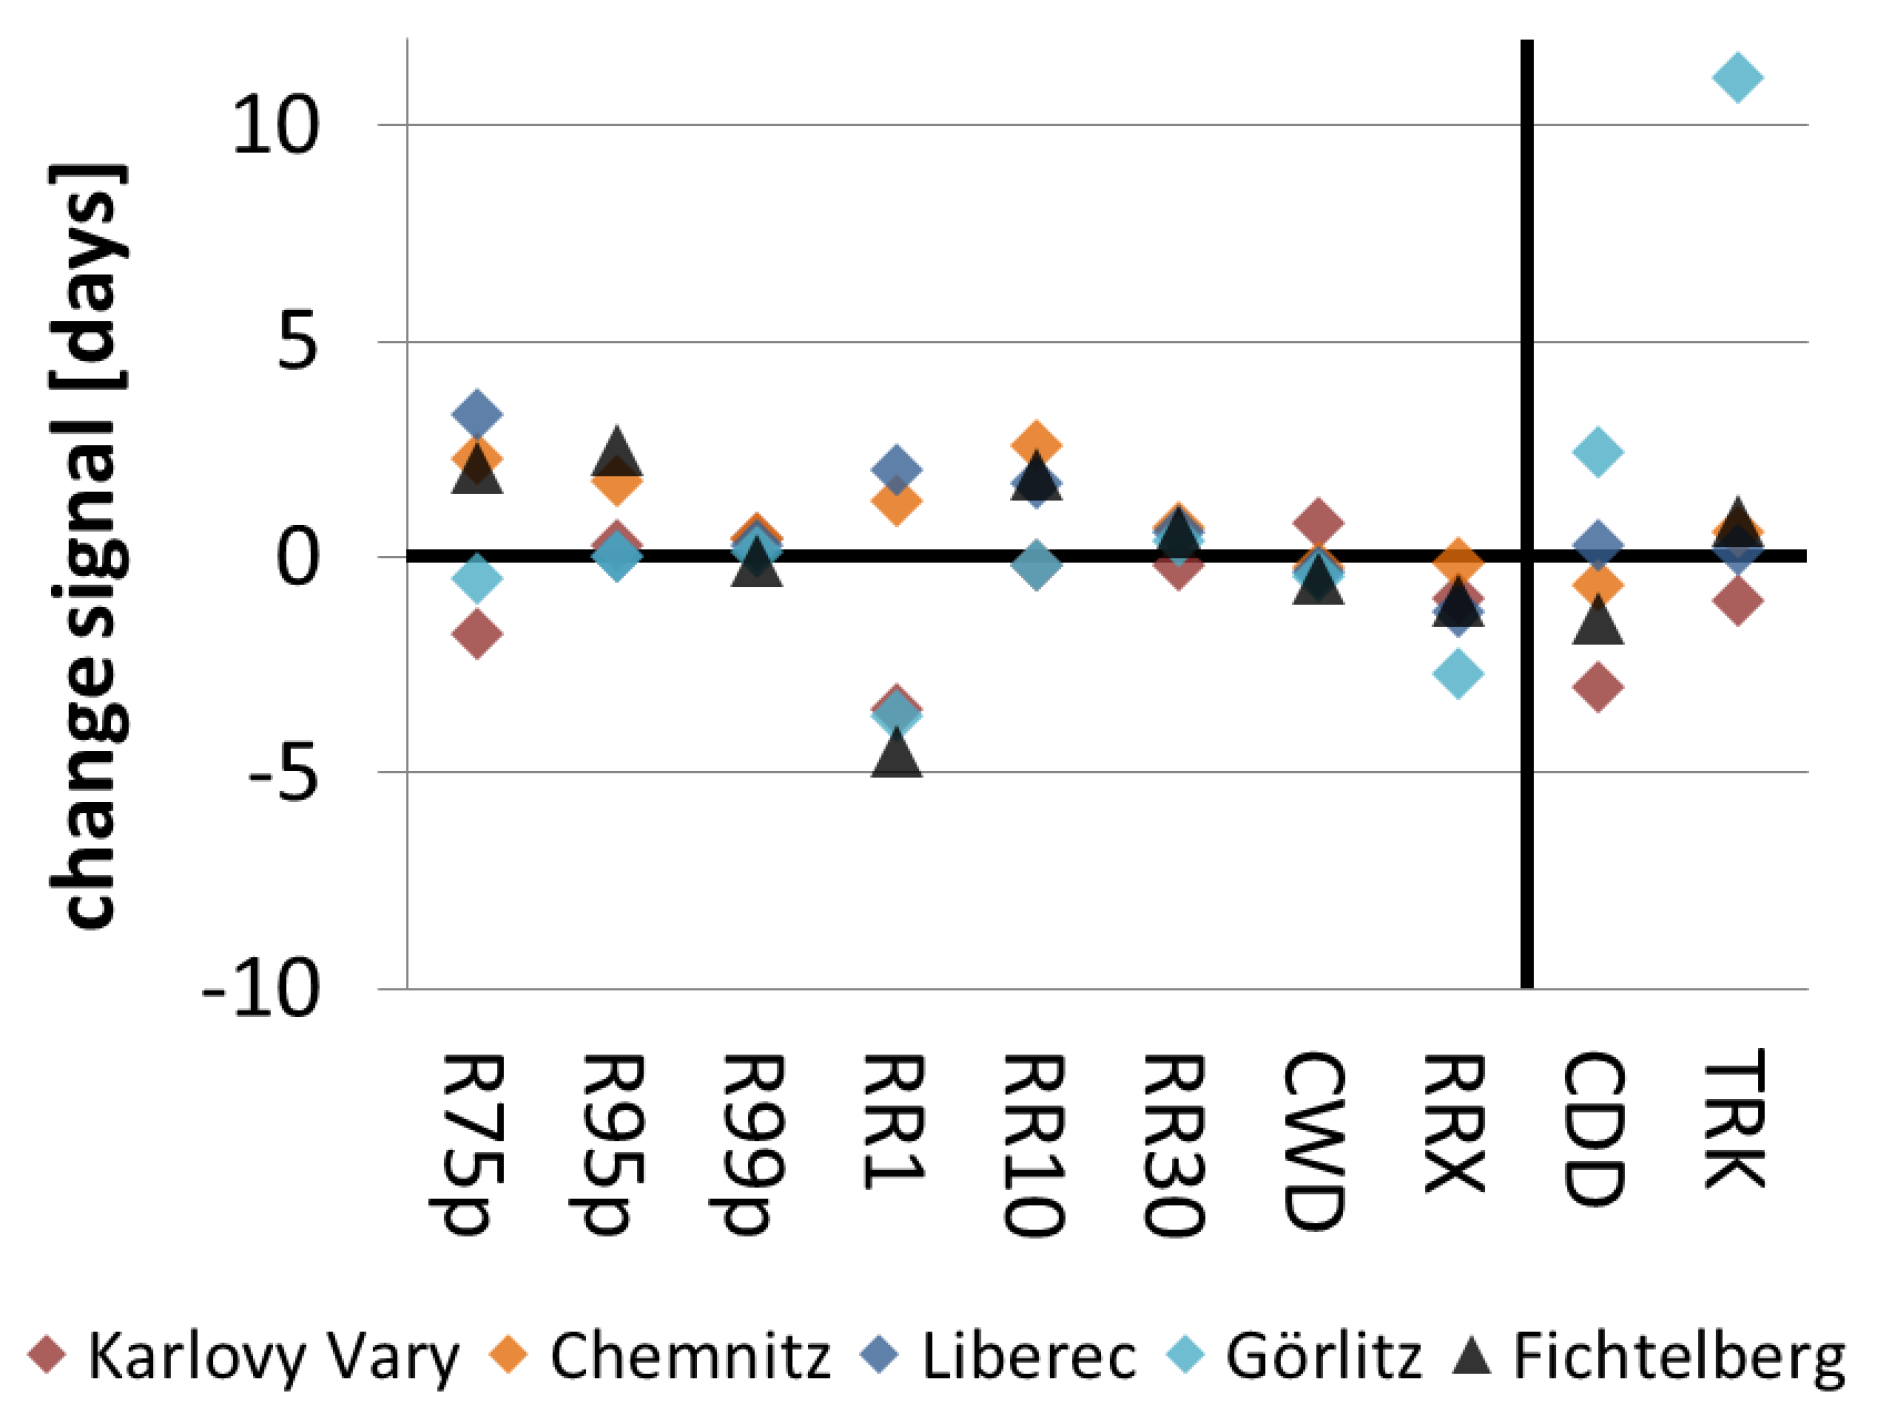
3.2. Precipitation
4. Relation of Climatic Changes to Weather Types
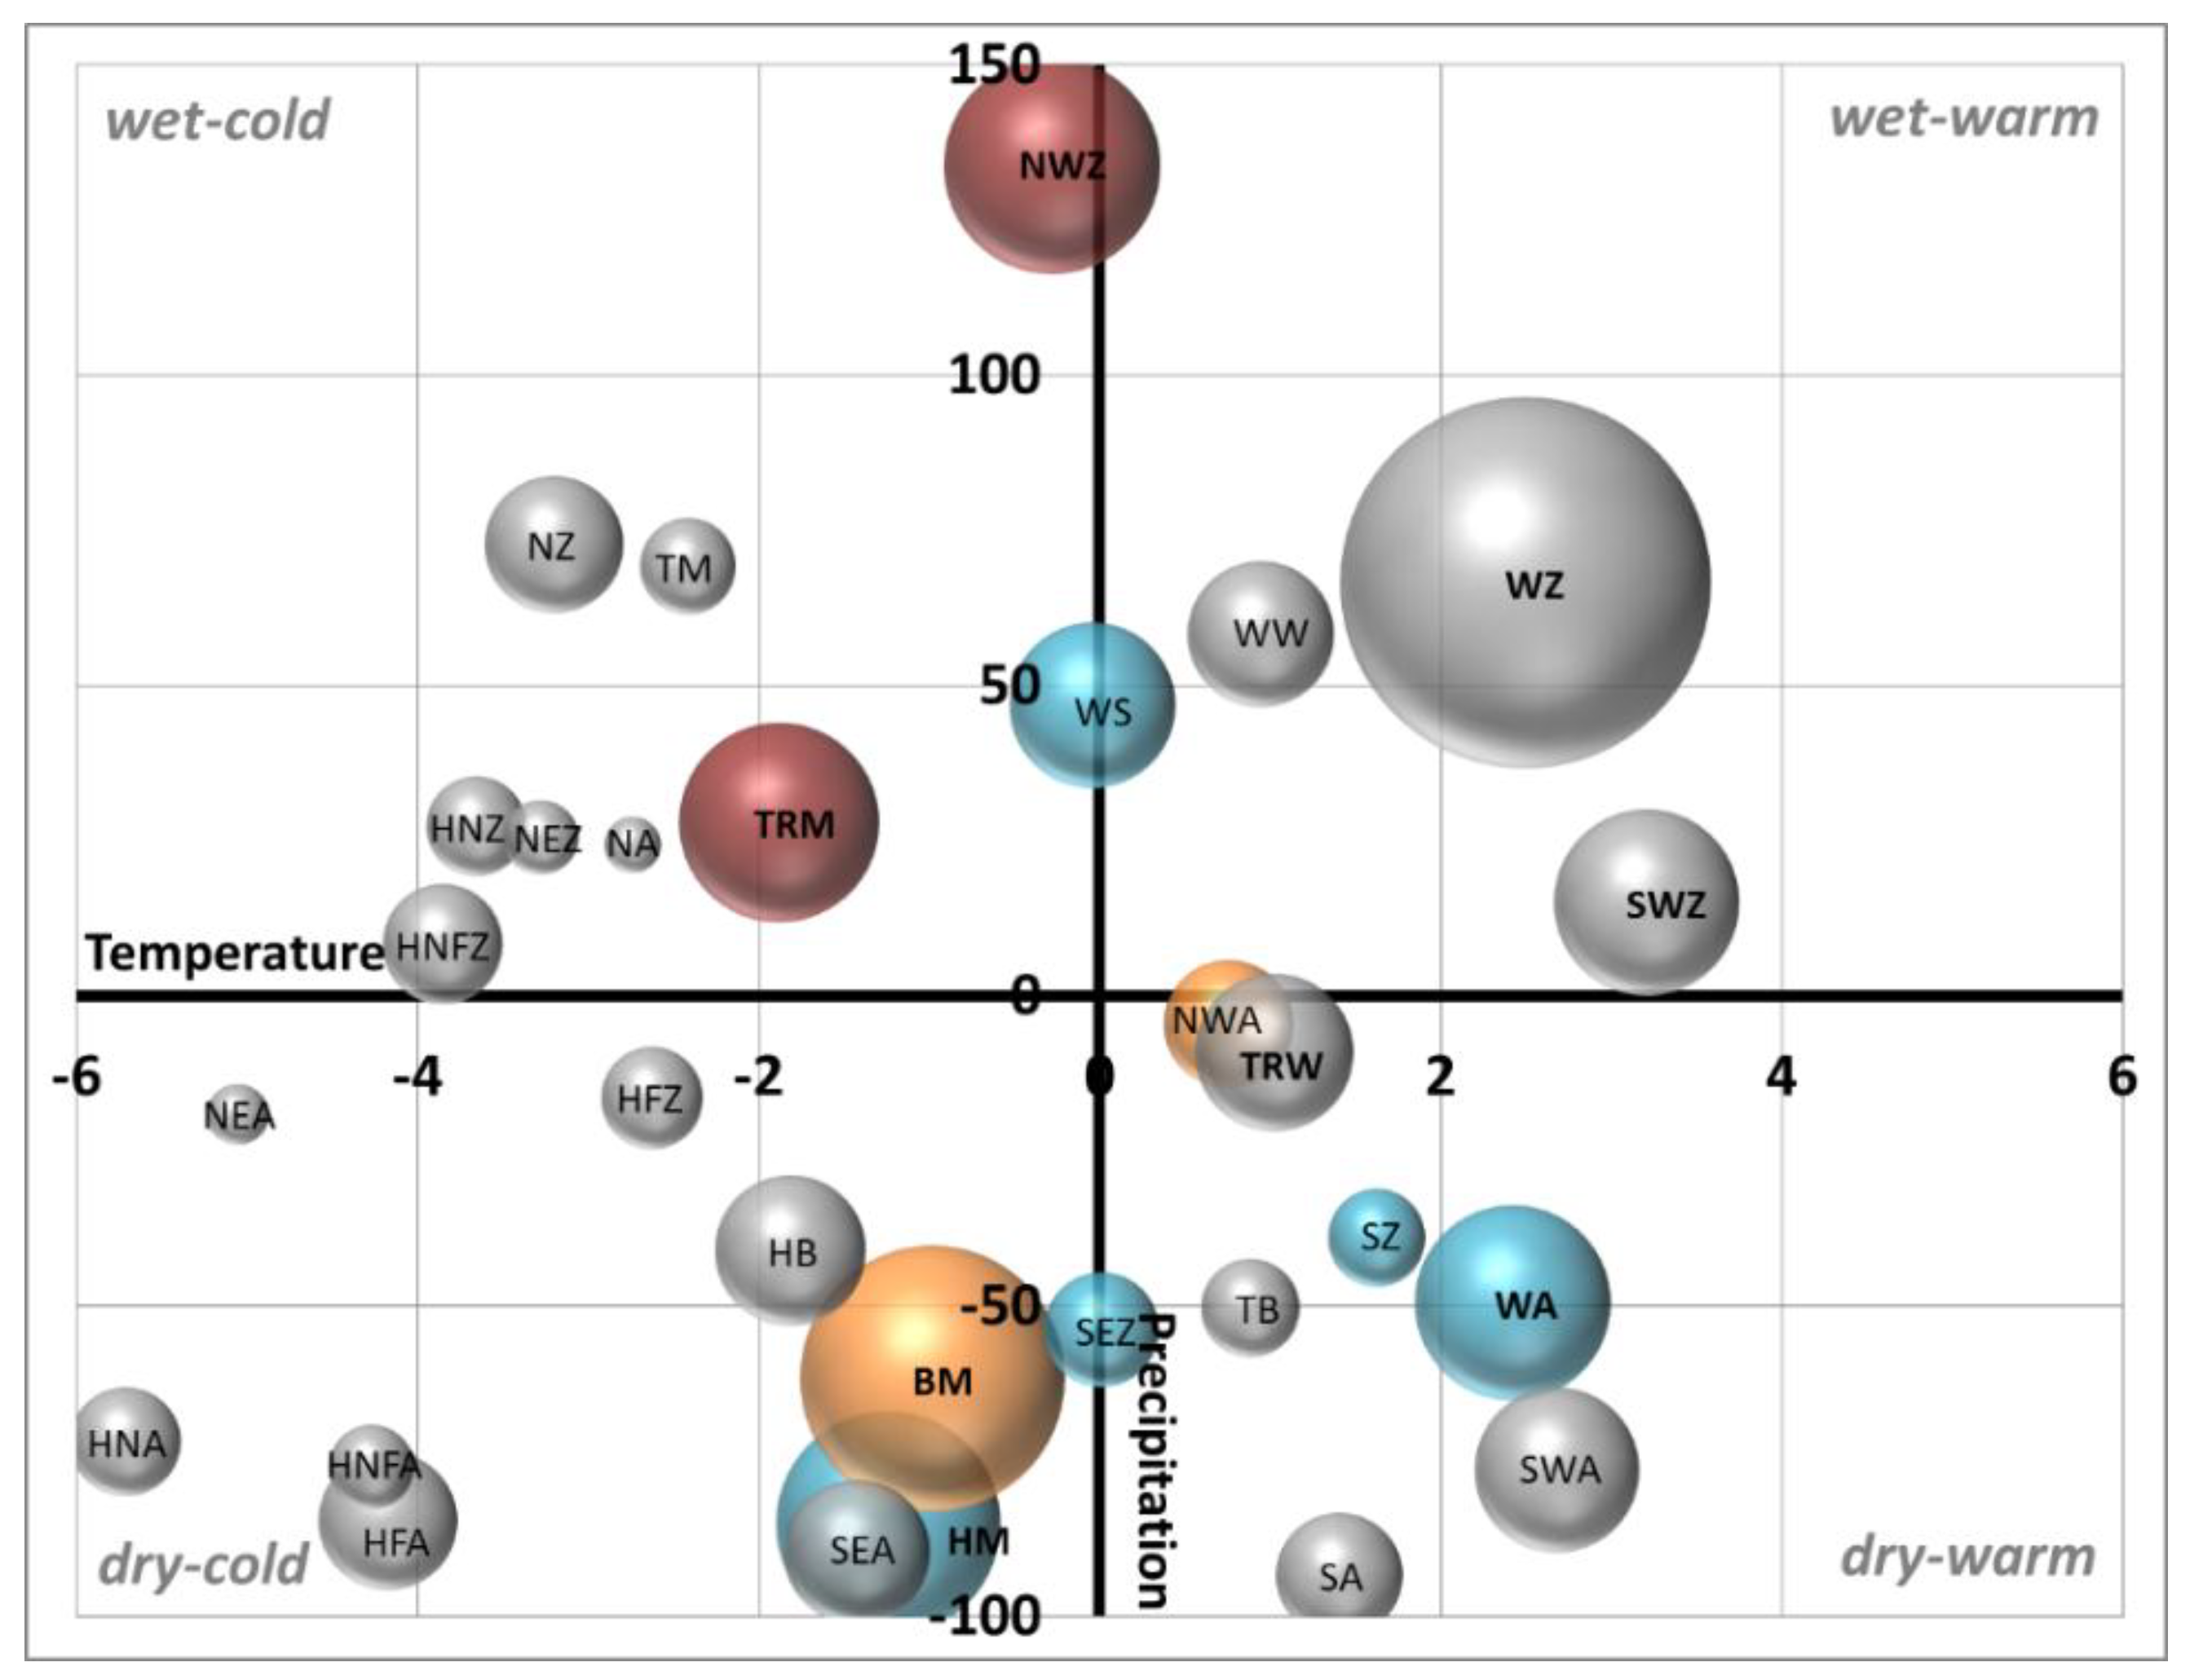
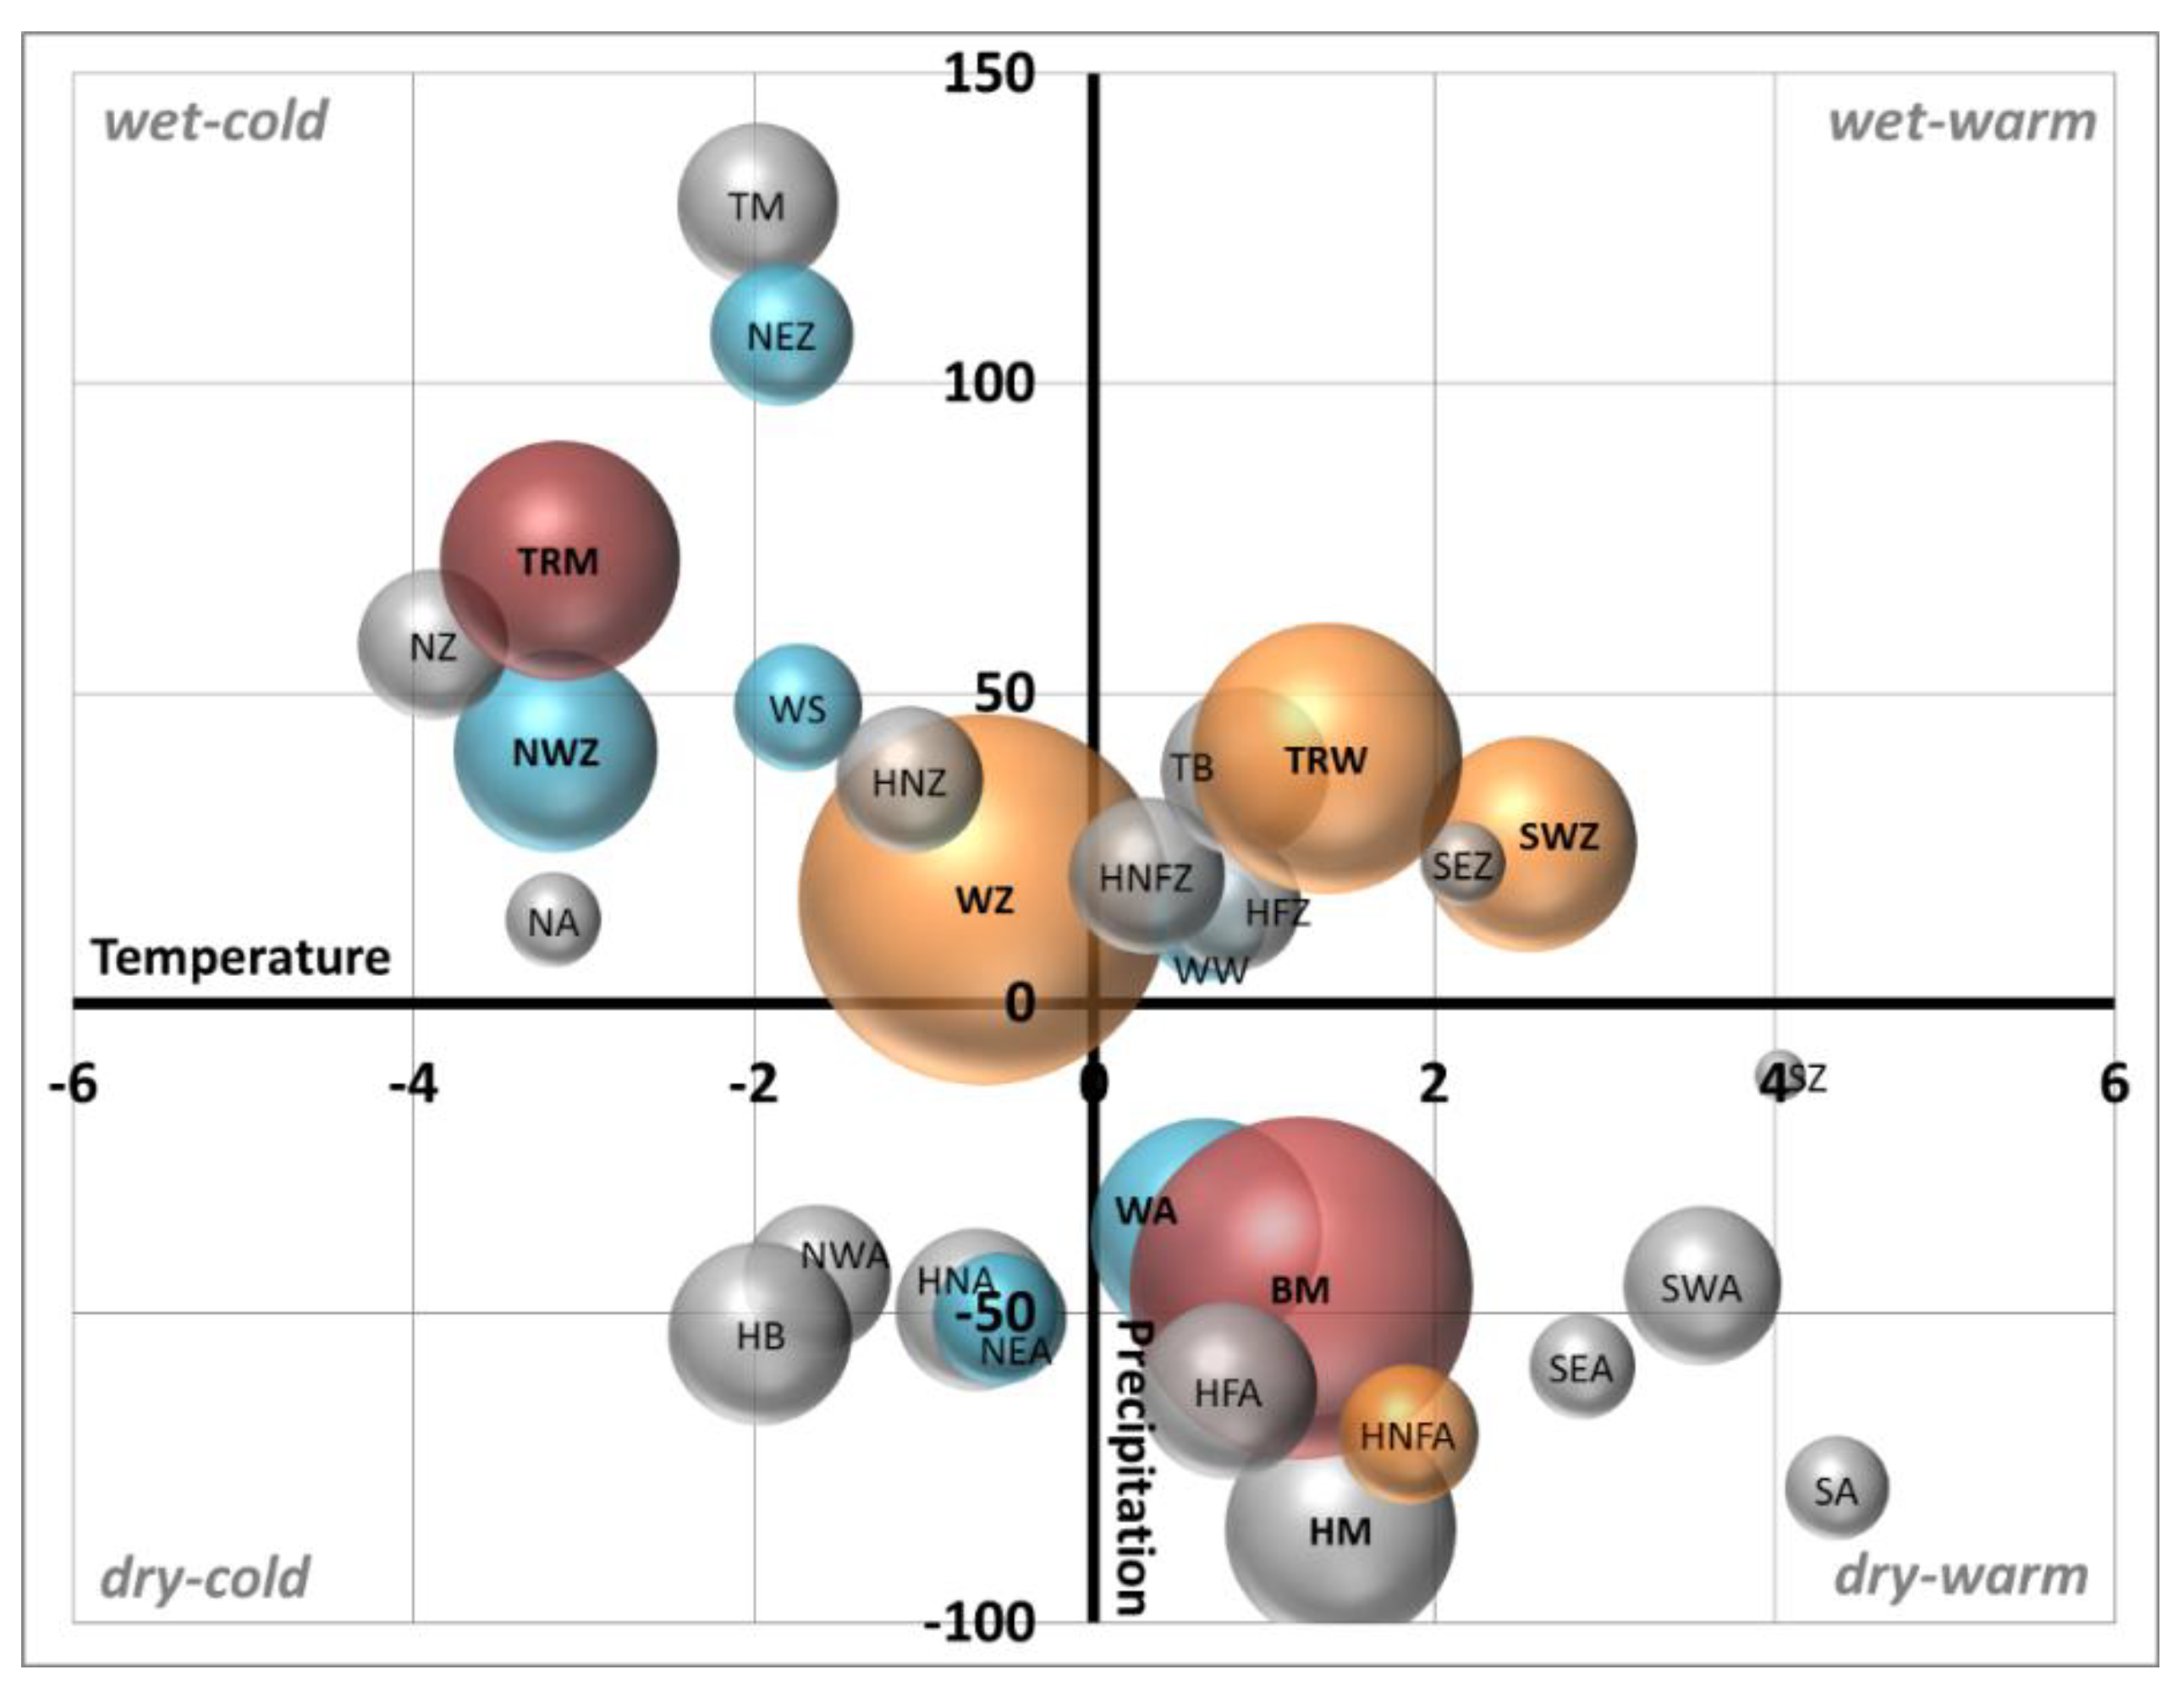
4.1. Character of Important Weather Types
4.2. Frequency Changes of Weather Patterns
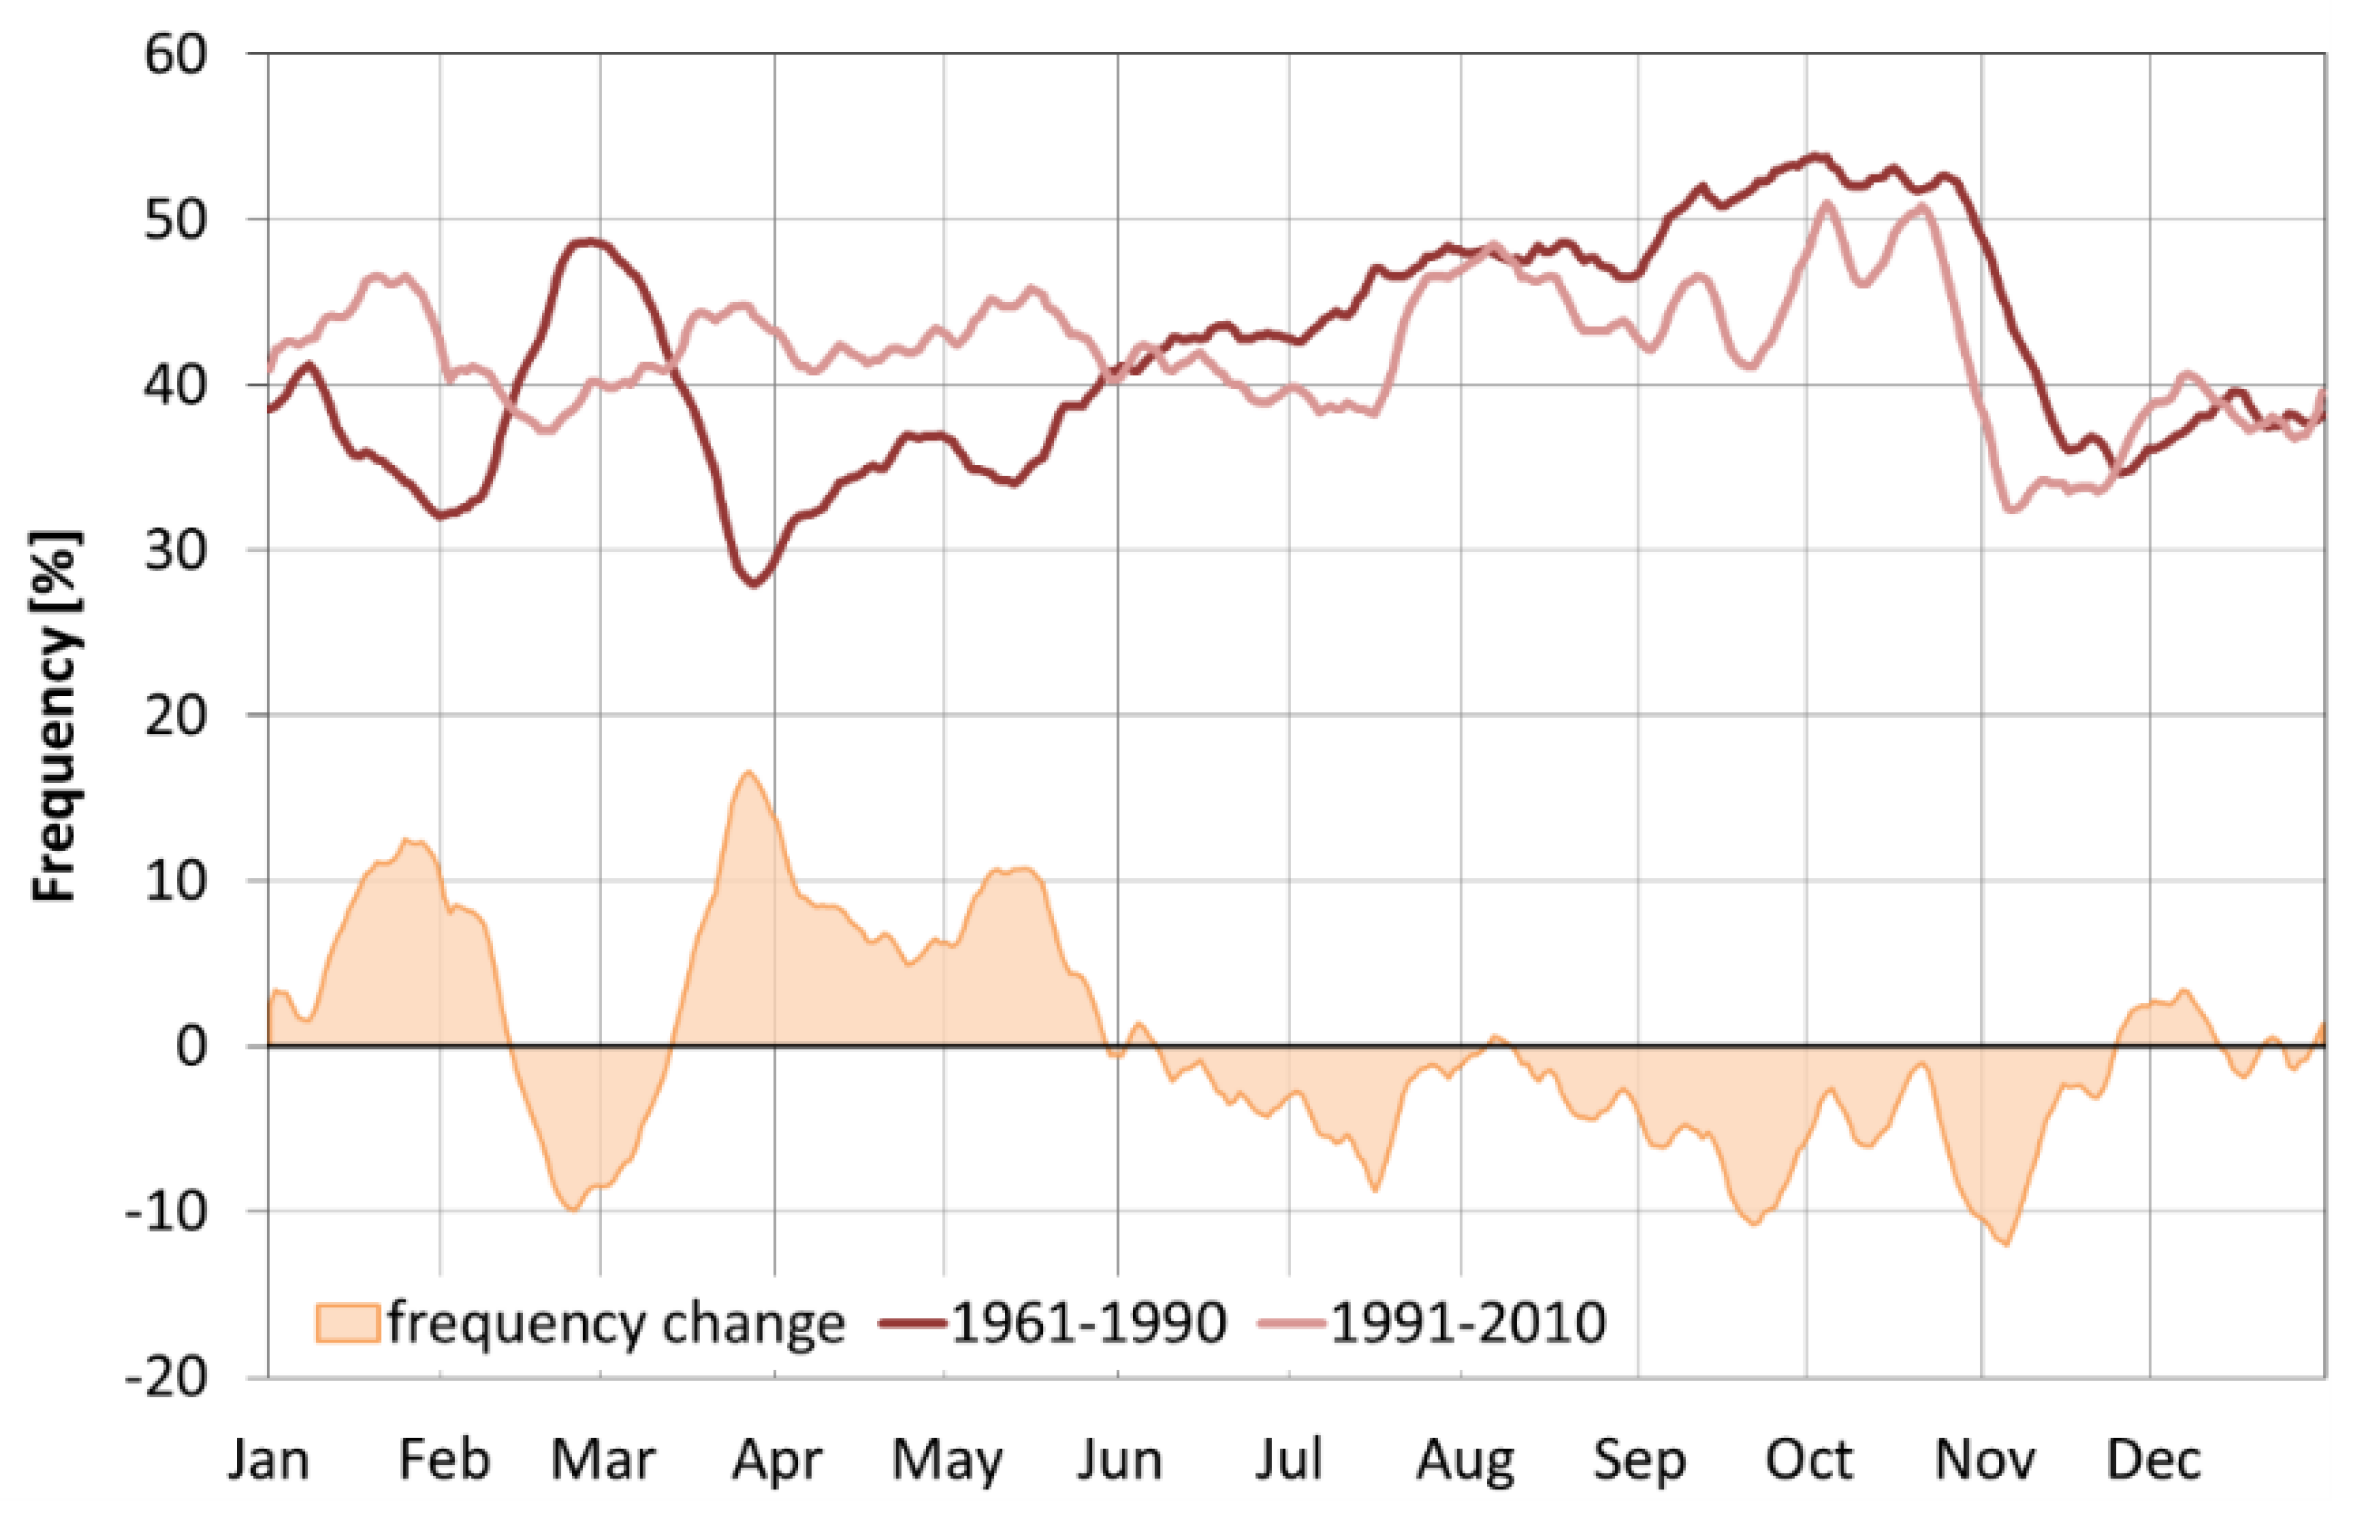
4.2.1. Winter Half Year
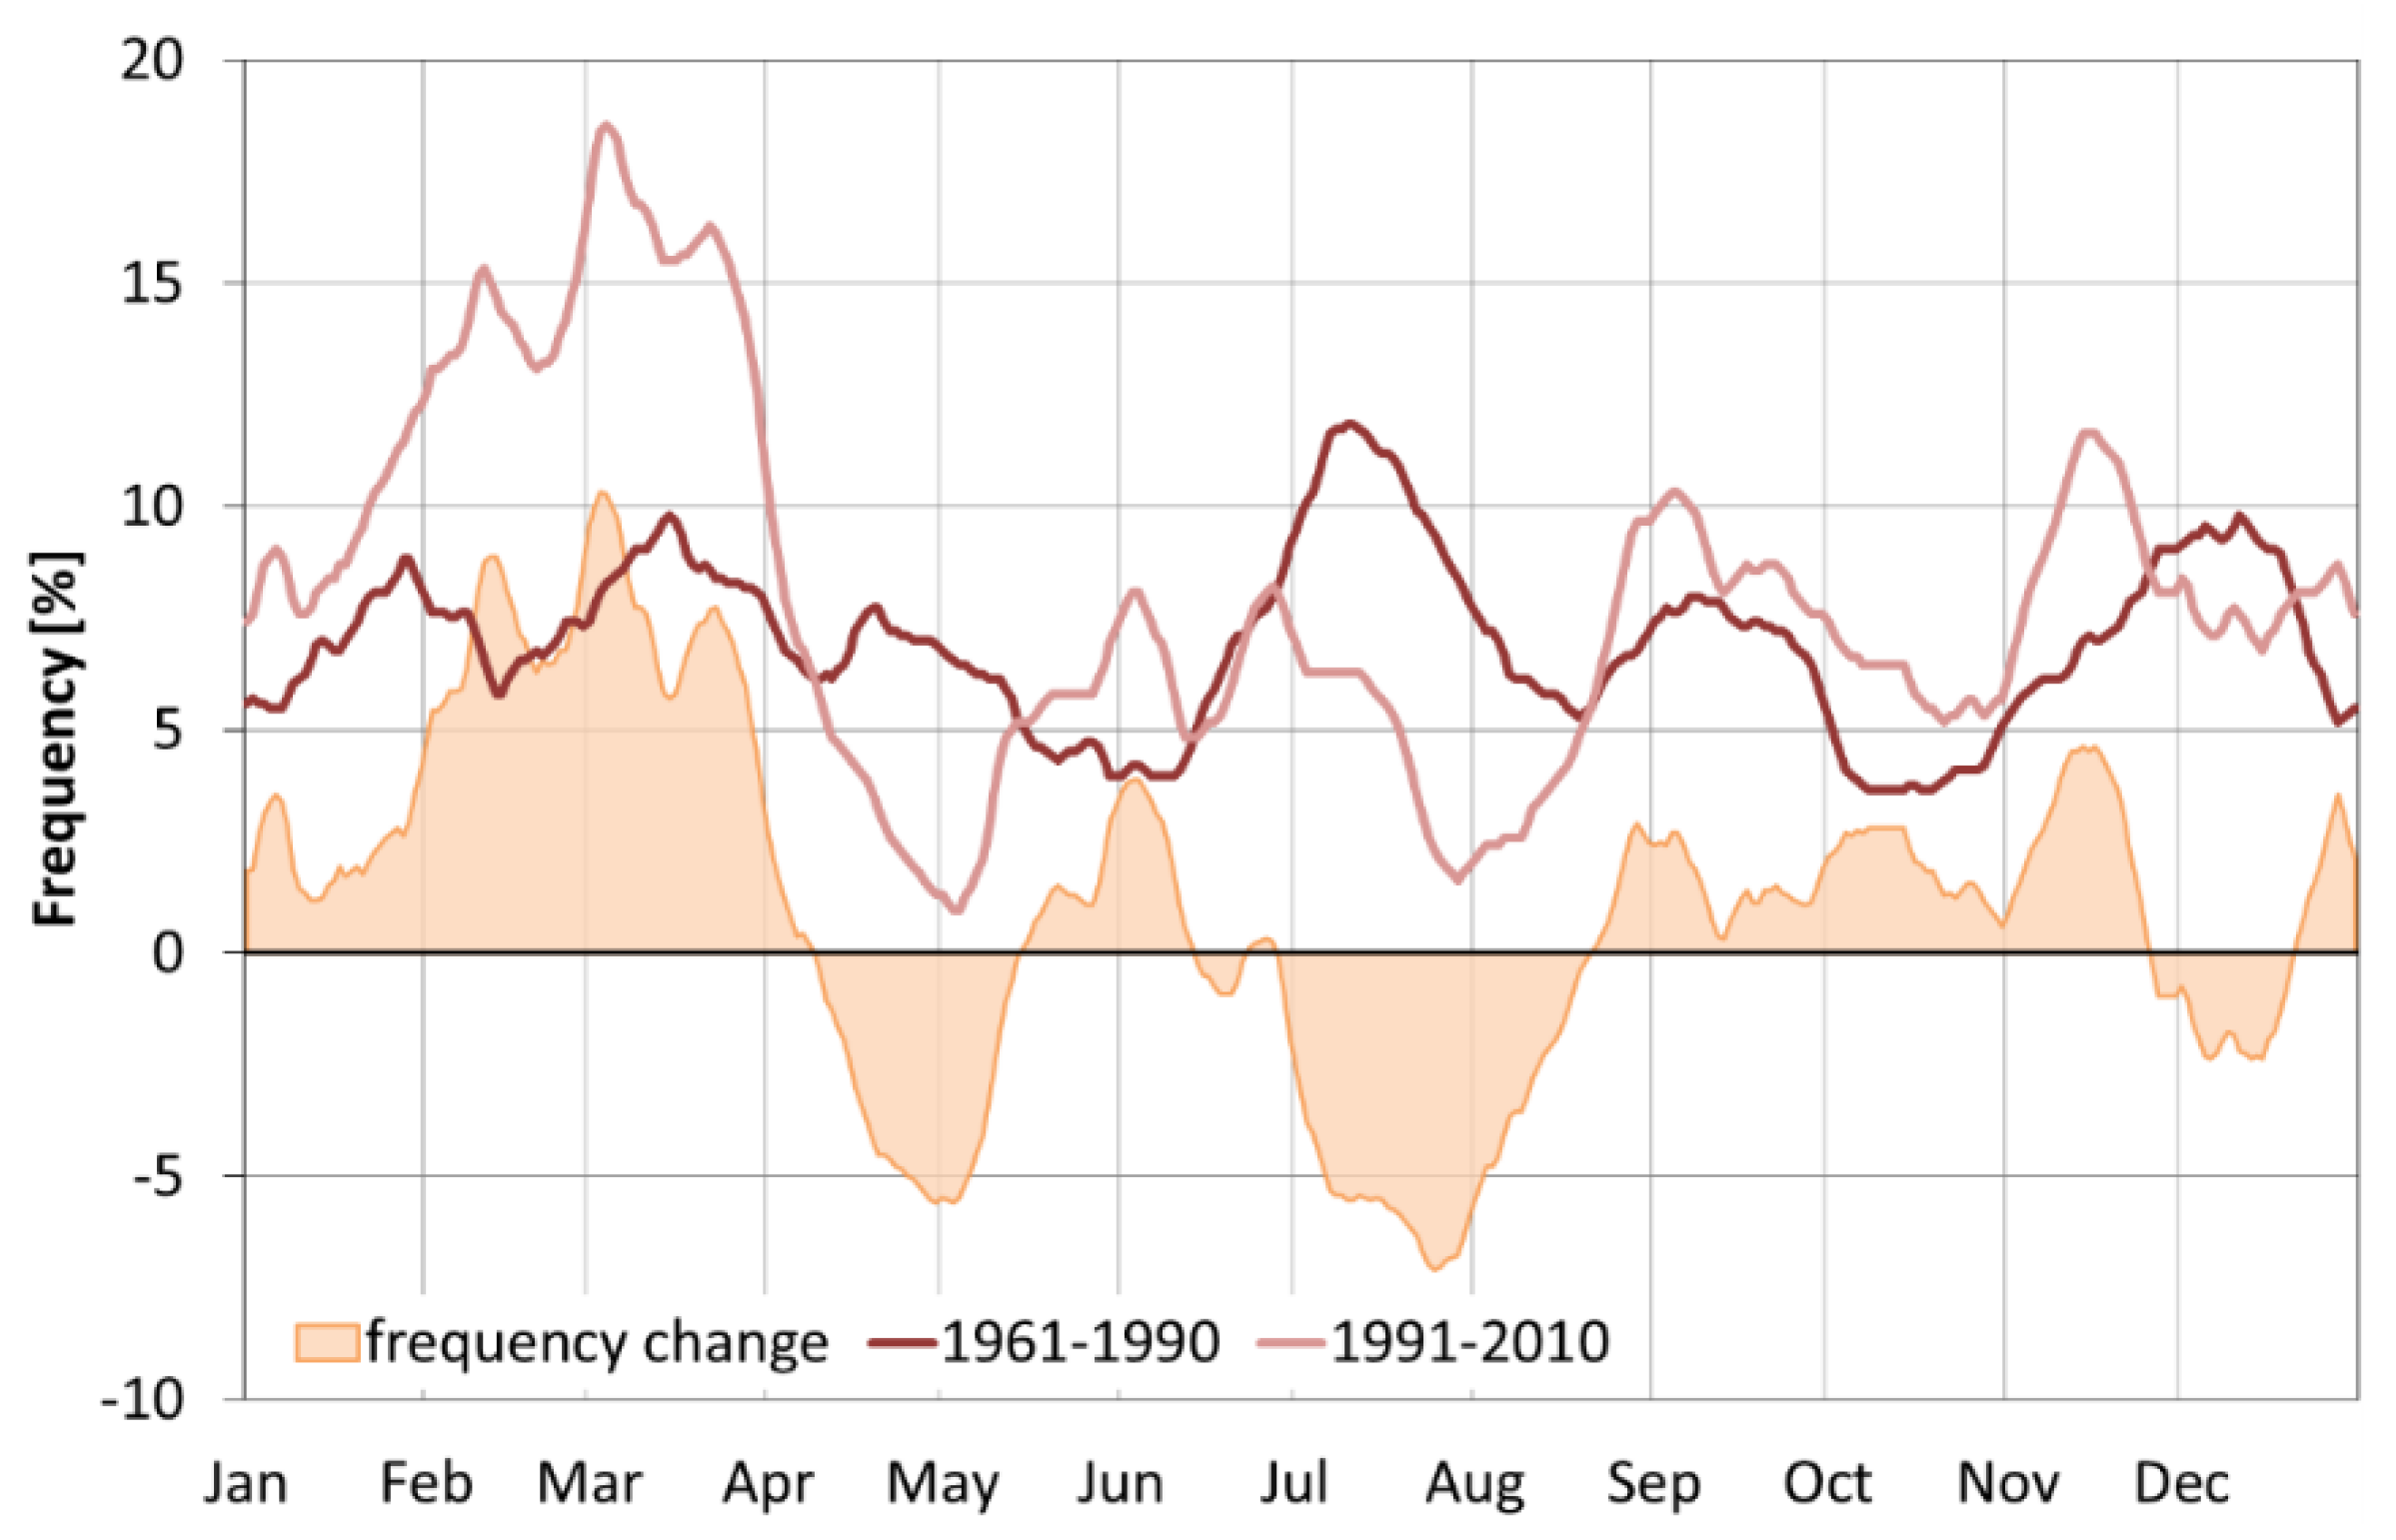
4.2.2. Summer Half Year
- The average annual temperature rose by 0.7 °C in the period 1991–2010 compared to 1961–1990. The last decade of the study period (2001–2010) was the warmest at 8.3 °C, the first (1961–1970) the coldest at 7.3 °C, while a stronger warming effect on warm than cold extremes was observed.
- Especially in the spring and in the summer, a steady increase of the mean temperatures was observed, both decadically and in the comparison of both investigation periods.
- The warming in the spring led to a premature start of vegetation by about 8 days, while the end of the vegetation period in autumn had no relevant changes.
- The average annual precipitation in the project area was about 766 mm in the period 1991–2010 and is thus about 7% higher than 1961–1990 (715 mm).
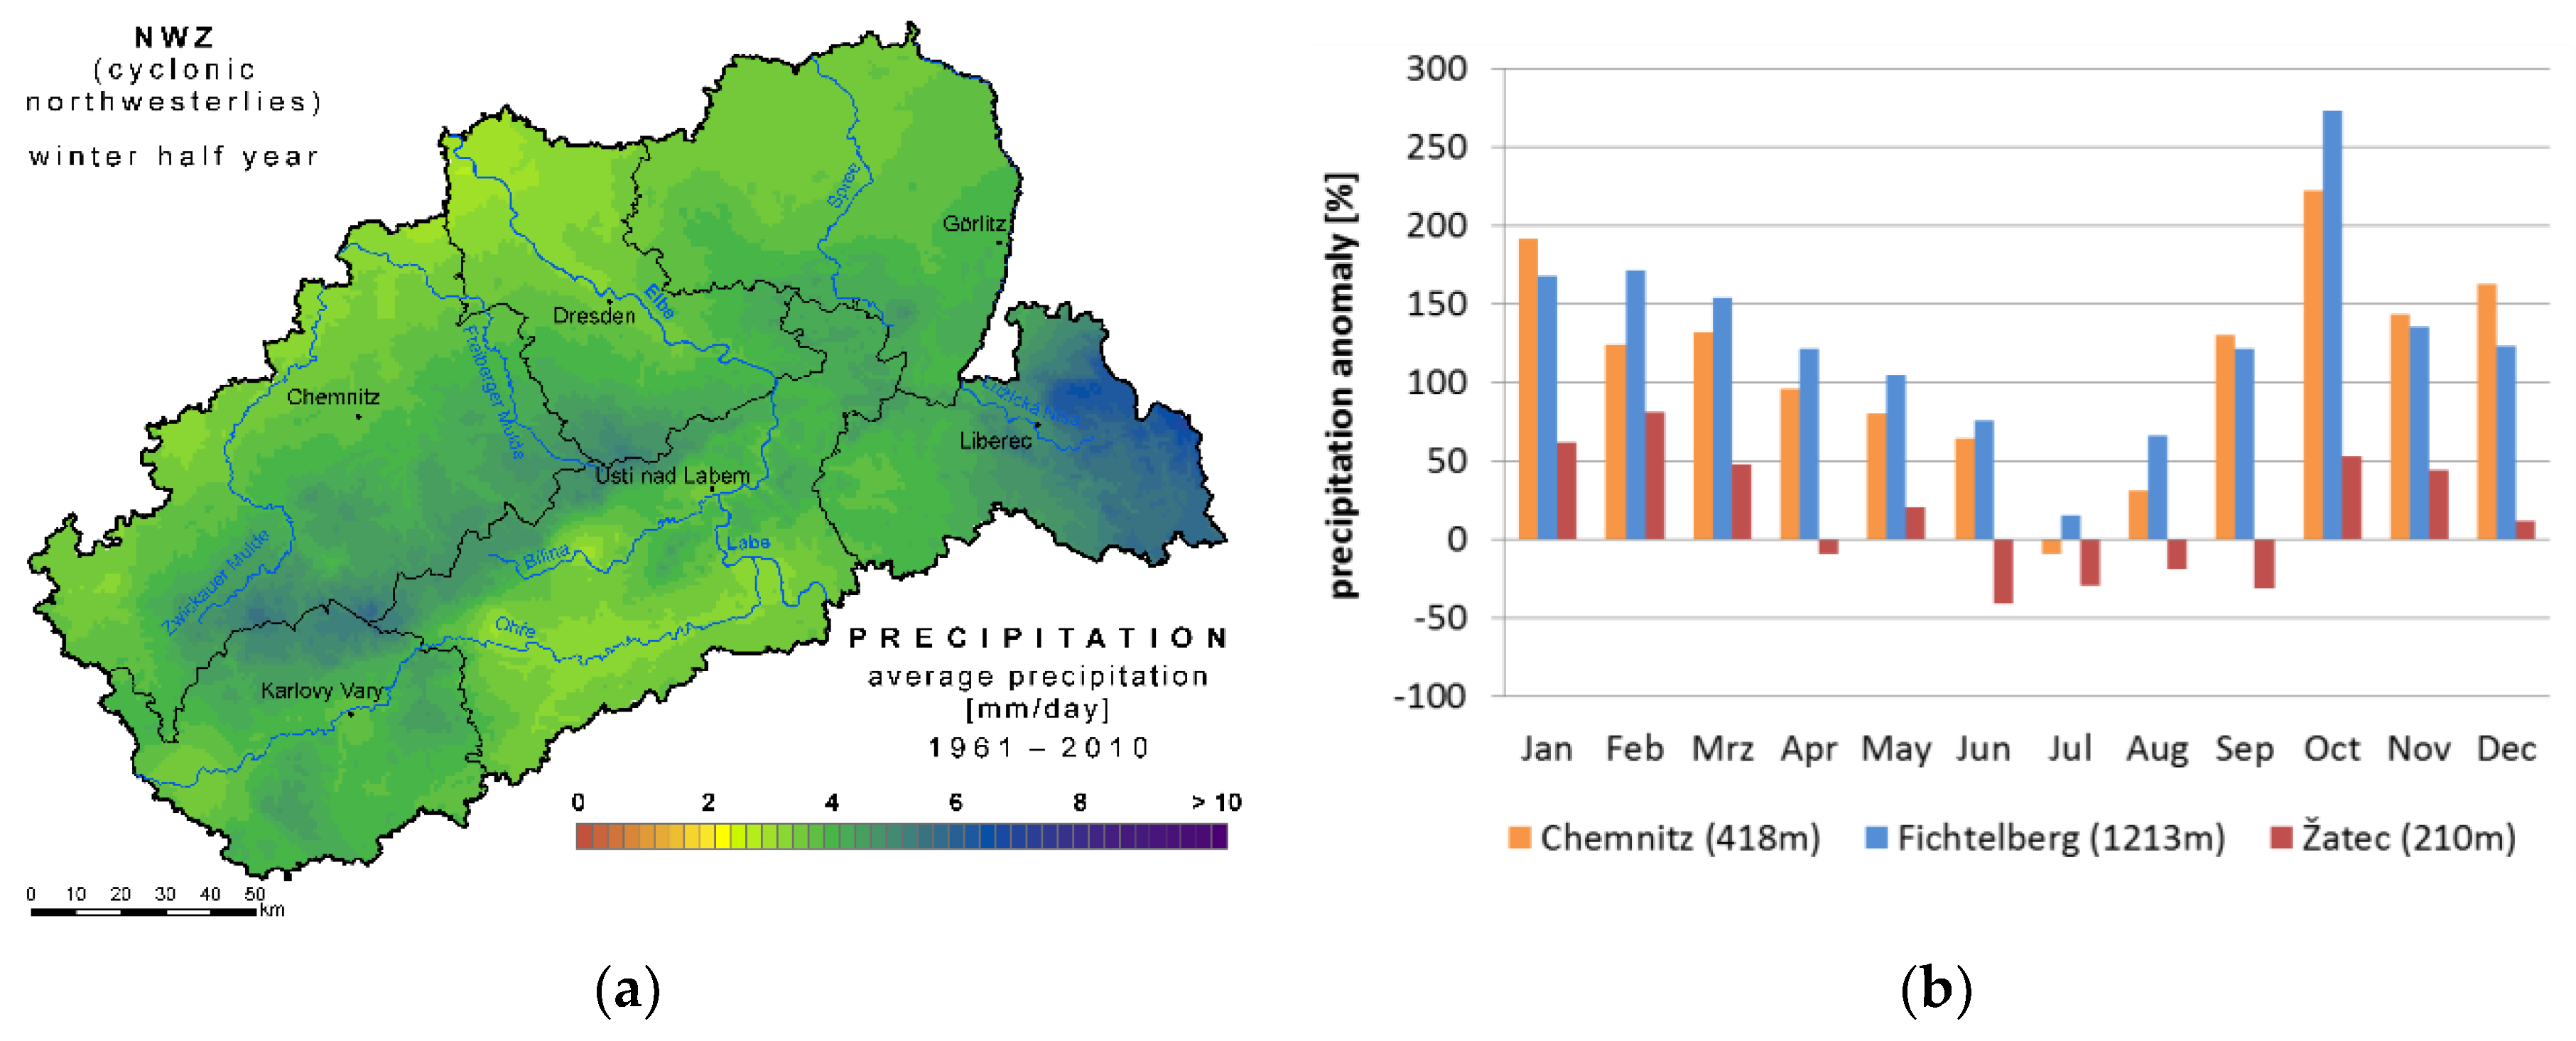
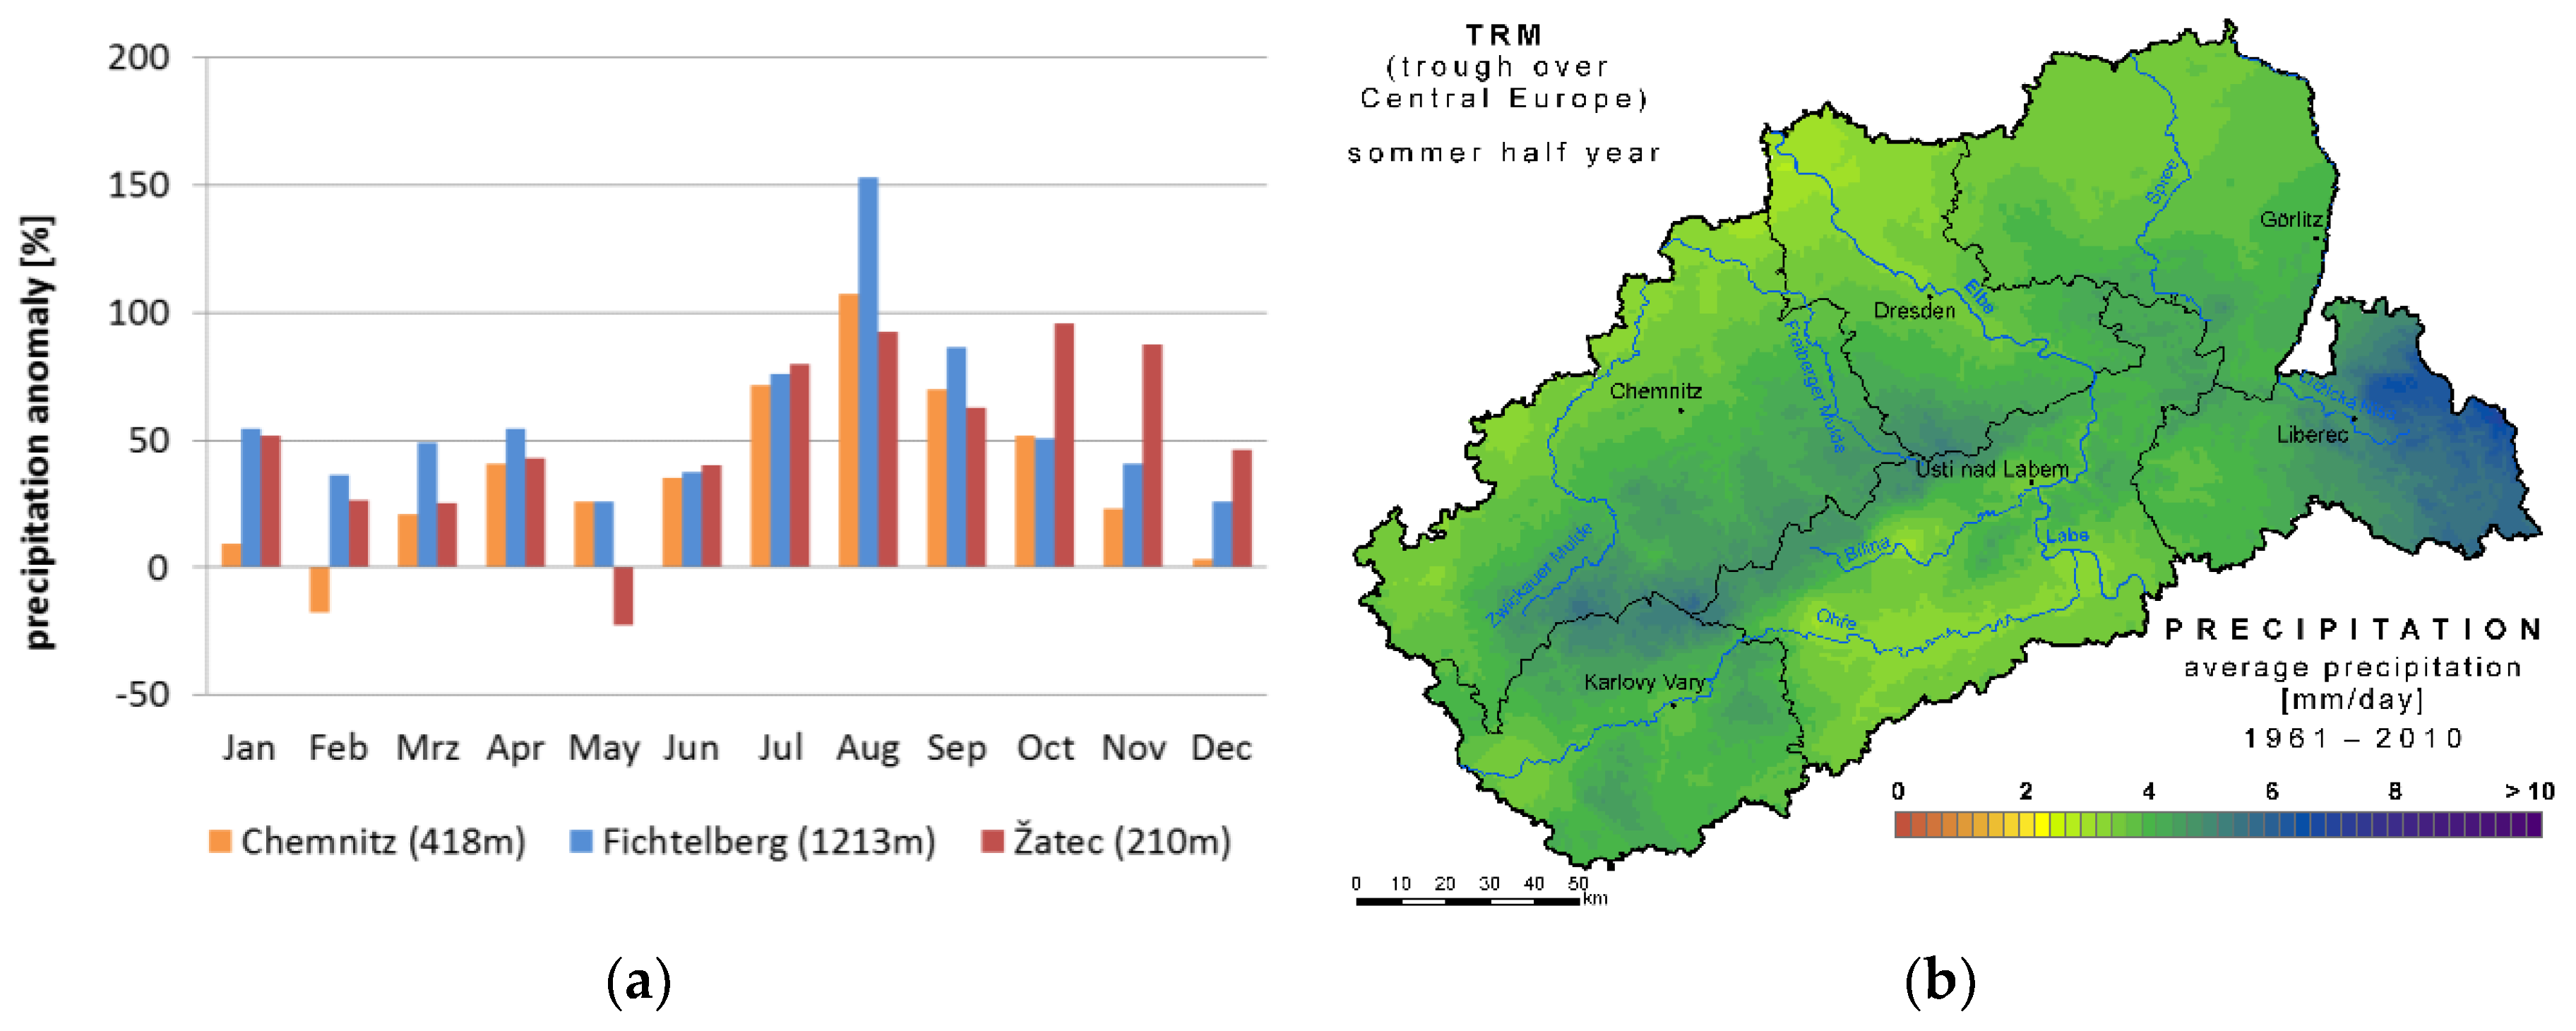
- Comparing 1991–2010 to 1961–1990, two Grosswetterlagen with high precipitation potential strongly increased in their frequency: NWZ and TRM.
5. Discussion
6. Conclusions
Supplementary Materials
Author Contributions
Acknowledgments
Conflicts of Interest
References
- Intergovernmental Panel on Climate Change (IPCC). Climate Change 2013: The Physical Science Basis. Contribution of Working Group I to the Fifth Assessment Report of the Intergovernmental Panel on Climate Change; Cambridge University Press: Cambridge, MA, USA; New York, NY, USA, 2013; p. 1535. ISBN 9781107661820. [Google Scholar]
- Tingley, M.P.; Huybers, P. Recent temperature extremes at high northern latitudes unprecedented in the past 600 years. Nature 2013, 496, 201–205. [Google Scholar] [CrossRef] [PubMed]
- Zhou, C.; Wang, K. Coldest Temperature Extreme Monotonically Increased and Hottest Extreme Oscillated over Northern Hemisphere Land during Last 114 Years. Sci. Rep. 2016, 6, 25721. [Google Scholar] [CrossRef] [PubMed] [Green Version]
- Fischer, E.M.; Knuttim, R. Anthropogenic contribution to global occurrence of heavy-precipitation and high-temperature extremes. Nat. Clim. Chang. 2015, 5, 560–564. [Google Scholar] [CrossRef]
- Donat, M.G.; Alexander, L.G.V.; Yang, H.; Durre, I.; Vose, R.; Dunn, R.J.H.; Willett, K.M.; Aguilar, E.; Brunet, M.; Caesar, J.; et al. Updated analyses of temperature and precipitation extreme indices since the beginning of the twentieth century: The HadEX2 dataset. J. Geophys. Res. Atmos. 2013, 118, 2098–2118. [Google Scholar] [CrossRef] [Green Version]
- Fischer, E.M.; Beyerle, U.; Knutti, R. Robust spatially aggregated projections of climate extremes. Nat. Clim. Change 2013, 3, 1033–1038. [Google Scholar] [CrossRef]
- Fischer, E.M.; Knutti, R. Observed heavy precipitation increase confirms theory and early models. Nat. Clim. Chang. 2016, 6, 686–991. [Google Scholar] [CrossRef]
- Anders, I.; Stagl, J.; Auer, I.; Pavlik, D. Climate Change in Central and Eastern Europe. In Managing Protected Areas in Central and Eastern Europe under Climate Change; Rannow, S., Neubert, M., Eds.; Springer: Dordrecht, The Netherlands, 2014. [Google Scholar]
- Fleig, A.K.; Tallaksen, L.M.; James, P.; Hisdal, H.; Stahl, K. Attribution of European precipitation and temperature trends to changes in synoptic circulation. Hydrol. Earth Syst. Sci. 2015, 19, 3093–3107. [Google Scholar] [CrossRef]
- Westra, S.; Fowler, H.J.; Evans, J.P.; Alexander, L.V.; Berg, P.; Johnson, F.; Kendon, E.J.; Lenderink, G.; Roberts, N.M. Future changes to the intensity and frequency of short-duration extreme rainfall. Rev. Geophys. 2014, 52, 522–555. [Google Scholar] [CrossRef] [Green Version]
- Caspary, H.J.; Hennegriff, W. The Development of Dry Grosswetterlagen Conditions Affecting the Southern German Region (In German), Klimaveränderung und Wasserwirtschaft, KLIWA-Berichte Heft 18. 2012. Available online: https://www.kliwa.de/_download/KLIWAHeft18.pdf (accessed on 4 May 2018).
- United Nations. Transforming our World: The 2030 Agenda for Sustainable Development. Available online: https://sustainabledevelopment.un.org/post2015/transformingourworld (accessed on 15 June 2018).
- Franke, J.; Goldberg, V.; Eichelmann, U.; Freydank, E.; Bernhofer, C. Statistical analysis of regional climate trends in Saxony, Germany. Clim. Res. 2004, 27, 145–150. [Google Scholar] [CrossRef] [Green Version]
- Sommer, W. Klimawandel in Sachsen—Sachstand und Ausblick; Küchler, W., Ed.; Saxon State Ministry for Environment and Agriculture: Dresden, Germany, 2005.
- SMUL (Saxon State Ministry of Environment and Agriculture). Sachsen im Klimawandel—Eine Analyse; Sächsisches Staatsministerium für Umwelt und Landwirtschaft: Meissen, Germany, 2008; ISBN 3932627164.
- LfULG (Saxon State Agency for Environment, Agriculture and Geology). Analyse der Klimaentwicklung in Sachsen; Schriftenreihe des LfULG: Dresden, Germany, 2015; Volume 3.
- Enke, W.; Spekat, A.; Kreienkamp, F. Untersuchung der Auswirkung der Stationarität globaler atmosphärischer Wellen und Interpretation von Transwetterlagen für Dürre- und Hochwasserereignisse in Sachsen: BLOCKWETT. In Final report for the Saxon State Agency for Environment, Agriculture and Geology; Available online: https://www.umwelt.sachsen.de/umwelt/download/1_blockwett_end.pdf (accessed on 15 June 2018).
- Spekat, A.; Enke, W.; Kreienkamp, F. Untersuchung der Zugbahnen barometrischer Minima: BLOCKWETT2. In Final Report for the Saxon State Agency for Environment, Agriculture and Geology; Available online: https://www.umwelt.sachsen.de/umwelt/download/2_Tracks_Sax_2008.pdf (accessed on 15 June 2018).
- Hoy, A. Wintertourismus in Sachsens Mittelgebirgen—Marketingstrategien zur Anpassung an die Folgen des Klimawandels; Diplomica Verlag GmbH: Hamburg, Germany, 2008; ISBN 9783836666206. [Google Scholar]
- Hoy, A. Atmospheric Circulation Variability and Relation to Climate. Ph.D. Thesis, TU Bergakademie Freiberg, Freiberg, Germany, 2013. [Google Scholar]
- Hänsel, S. Changes in Saxon precipitation characteristics—Trends of extreme precipitation and drought. Ph.D. Thesis, TU Bergakademie Freiberg, Freiberg, Germany, 2008. [Google Scholar]
- Hänsel, S.; Petzold, S.; Matschullat, J. Precipitation trend analysis for central eastern Germany. In Bioclimatology and Natural Hazards; Strelcova, K., Ed.; Springer Verlag: Berlin, Germany, 2009. [Google Scholar]
- Hänsel, S.; Schucknecht, A.; Böttcher, F.; Bernhofer, C.; Matschullat, J. Niederschlagsveränderungen in Sachsen von 1901 bis 2010—Starkniederschlags- und Trockenheitstrends; Berichte des Deutschen Wetterdienstes: Offenbach, Germany, 2015; pp. 210–246.
- Löser, R.; Schneider, P.; Gottschalk, N.; Ihling, H.; Kuhn, K. Wassertemperaturen und Klimawandel—Vorstudie zur Recherche, Homogenisierung und Plausibilisierung von Verfügbaren Daten zu Langzeit-Temperaturreihen von Oberflächen-, Boden-, Sicker- und Grundwasser in Sachsen; Schriftenreihe des LfULG: Dresden, Germany, 2011; ISBN 1867-2868.
- Schneider, P.; Löser, R.; Gottschalk, N.; Spänhoff, B. Klimawandel und Wasserwirtschaft—Auswertung und Darstellung der Zusammenhänge zwischen Klima- und Wassertemperaturdaten; Schriftenreihe des LfULG: Dresden, Germany, 2011; ISBN 1867-2868.
- Schucknecht, A.; Matschullat, J. Raum-Zeitliches Blitzaufkommen im Freistaat Sachsen—Ursachen, Phänomene, Risiken (BlitzSn); Schriftenreihe des LfULG: Dresden, Germany, 2014.
- Schneider, P.; Gottschalk, N.; Löser, R.; Scharbrodt, T. Integrated Climate Protection Program for the City of Chemnitz—Climate Diagnosis, Climate Change Prognosis and Conception of Adaptation Measures in the Urban Area. In Resilient Cities; Springer: Dordrecht, The Netherlands, 2011; pp. 299–310. [Google Scholar]
- Bernhofer, C.; Matschullat, J.; Bobeth, A. (Eds.) Das Klima in der REGKLAM-Modellregion Dresden; Rhombos-Verlag Dresden: Dresden, Germany, 2009; ISBN 9783941216228. [Google Scholar]
- Hoy, A.; Hänsel, S. Veränderungen der atmosphärischen Zirkulation und von Trockenheitsereignissen in Sachsen; Report for REGKLAM Project: Dresden, Germany, 2009. [Google Scholar]
- Hänsel, S.; Hoy, A. Atmosphärische Zirkulationsmuster sowie Trocken- und Nassphasen in regionalen Klimaprojektionen; Report for REGKLAM Project: Dresden, Germany, 2013. [Google Scholar]
- Tolasz, R.; Míková, T.; Valeriánová, A.; Voženílek, V. Climate Atlas of Czechia; Czech Hydrometeorological Institute: Olomouc, Czech Republic, 2007; ISBN 978-80-86690-1. [Google Scholar]
- Květoň, V. Normály Teploty na Území České Republiky v Období 1961–1990 a Vybrané Teplotní Charakteristiky v Období 1961–2000; Národní klimatický program ČR: Prague, Czech Republic, 2001; Volume 30. [Google Scholar]
- Míková, T.; Coufal, L. Tlak Vzduchu na Území České Republiky v Období 1961–1990; Národní klimatický program ČR: Prague, Czech Republic, 1999; Volume 28. [Google Scholar]
- Sobíšek, B. Rychlost a Směr Větru na Území České Republiky v Období 1961–1990; Národní klimatický program ČR: Prague, Czech Republic, 2000; Volume 29. [Google Scholar]
- Coufal, V.; Kott, I.; Možný, M. Teplota Půdy v Chladné Části roku v Období 1961–1990 na Území České Republiky; Národní klimatický program ČR: Prague, Czech Republic, 1993; Volume 12. [Google Scholar]
- Křivancová, S.; Vavruška, F. Základní Meteorologické Prvky v Jednotlivých Povětrnostních Situacích na Území České Republiky v Období 1961–1990; Národní klimatický program ČR: Prague, Czech Republic, 1997; Volume 27. [Google Scholar]
- Pretel, J.; Metelka, L.; Kalvová, J.; Novický, O.; Kašpárek, L.; Daňhelka, J.; Kulasová, B.; Řičicová, P.; Rožnovský, J.; Haberle, J.; et al. Zpřesnění Dosavadních Odhadů Dopadů Klimatické Změny v Sektorech Vodního Hospodářství, Zemědělství a Lesnictví a Návrhy Adaptačních Opatření, Technické Shrnutí Výsledků Projektu VaV SP/1a6/108/07 za Období 2007–2011; Czech Hydrometeorological Institute: Prague, Czech Republic, 2011. [Google Scholar]
- Hoy, A. Wintertourismus und Klimawandel. In Analyse der Klimaentwicklung in Sachsen; LfULG (Saxon State Agency for Environment, Agriculture and Geology), Ed.; Schriftenreihe des LfULG: Dresden, Germany, 2015; Volume 3, pp. 131–133. [Google Scholar]
- Hoy, A.; Hänsel, S.; Matschullat, J. How can winter tourism adapt to climate change in Saxony´s mountains? Reg. Environ. Change 2011, 11, 459–469. [Google Scholar] [CrossRef]
- Troll, C.; Paffen, K.H. Karte der Jahreszeitenklimate der Erde. Arch. Wiss. Geogr. 1964, 18, 5–28. [Google Scholar]
- Köppen, W. Versuch einer Klassifikation der Klimate, vorzugsweise nach ihren Beziehungen zur Pflanzenwelt. Geogr. Zeitschr. 1900, 6, 593–611. [Google Scholar]
- Geiger, R. Landolt-Börnstein—Zahlenwerte und Funktionen aus Physik, Chemie, Astronomie, Geophysik und Technik alte Serie Vol. 3; Springer: Berlin, Germany, 1954; pp. 603–607. [Google Scholar]
- Geiger, R. Überarbeitete Neuausgabe von Geiger, R.: Köppen-Geiger/Klima der Erde; Klett-Perthes: Gotha, Germany, 1961. [Google Scholar]
- LfULG (Saxon State Office for Environment, Agriculture and Geology). Der Klimawandel im böhmisch-sächsischen Grenzraum; Lausitzer Druckhaus GmbH: Hoyerswerda, Germany, 2014; p. 140. [Google Scholar]
- Štěpánek, P.; Zahradníček, P.; Skalák, P. Data quality control and homogenization of air temperature and precipitation series in the area of the Czech Republic in the period 1961–2007. Adv. Sci. Res. 2009, 3, 23–26. [Google Scholar] [CrossRef]
- Štěpánek, P.; Zahradníček, P.; Brázdil, R.; Tolasz, R. Metodologie Kontroly a Homogenizace Časových řad v Klimatologii; Czech Hydrometeorological Institute: Prague, Czech Republic, 2011; ISBN 978-80-86690-97-1. [Google Scholar]
- Štěpánek, P.; Zahradníček, P.; Huth, R. Interpolation techniques used for data quality control and calculation of technical series: An example of Central European daily time series. Időjárás 2011, 115, 87–98. [Google Scholar]
- Štěpánek, P. ProClimDB—Software for Processing Climatological Datasets. Available online: http://www.climahom.eu/ (accessed on 15 June 2018).
- Alexandersson, A. A homogeneity test applied to precipitation data. J. Climatol. 1986, 6, 661–675. [Google Scholar] [CrossRef]
- Alexandersson, A. Homogenity testing, multiple breaks and trends. In Proceedings of the 6th International Meeting on Statistical Climatology, Galway, Ireland, 19–23 June 1995; pp. 439–441. [Google Scholar]
- Potter, K.W. Illustration of a New Test for Detecting a Shift in Mean in Precipitation Series. Mon. Weather Rev. 1981, 109, 2040–2045. [Google Scholar] [CrossRef] [Green Version]
- Easterling, D.R.; Peterson, T.C. A new method for detecting undocumented discontinuities in climatological time series. Int. J. Climatol. 1995, 15, 369–377. [Google Scholar] [CrossRef]
- Data, C. Guidelines on Analysis of Extremes in a Changing Climate in Support of Informed Decisions for Adaptation; World Meteorological Organization: Geneva, Switzerland, 2009. [Google Scholar]
- European Climate Assessment & Dataset (ECA&D). Algorithm Theoretical Basis Document (ATBD). In European Climate Assessment & Dataset (ECA&D) Project Document, version 10.7; Royal Netherlands Meteorological Institute KNMI: De Bilt, Netherlands, 2013. [Google Scholar]
- Baur, F. Einführung in die Grosswetterforschung; Verlag BG Teubner: Leipzig/Berlin, Germany, 1937. [Google Scholar]
- Baur, F. Musterbeispiele Europäischer Grosswetterlagen; Dietrich´sche Verlagsbuchhandlung: Wiesbaden, Germany, 1947. [Google Scholar]
- Baur, F.; Hess, P.; Nagel, H. Kalender der Grosswetterlagen Europas 1881–1939; Deutscher Wetterdienst: Bad Homburg, Germany, 1944. [Google Scholar]
- Hess, P.; Brezowsky, H. Katalog der Grosswetterlagen Europas; Berichte des Deutschen Wetterdienstes: Offenbach, Germany, 1952; Voulme 33.
- Hess, P.; Brezowsky, H. Katalog der Grosswetterlagen Europas, 2nd ed.; Berichte des Deutschen Wetterdienstes: Offenbach, Germany, 1969; Volume 15.
- Huth, R. Synoptic-climatological applicability of circulation classifications from the COST733 collection: First results. Phys. Chem. Earth 2010, 35, 388–394. [Google Scholar] [CrossRef]
- James, P.M. An objective classification method for Hess and Brezowsky Grosswetterlagen over Europe. Theor. Appl. Climatol. 2007, 88, 17–42. [Google Scholar] [CrossRef]
- Werner, P.C.; Gerstengarbe, F.M. Katalog der Grosswetterlagen Europas, 7nd ed.; PIK Report 119; 2010; ISSN 1436-0179. Available online: https://www.pik-potsdam.de/research/publications/pikreports/.files/pr119.pdf (accessed on 15 June 2018).
- Schulla, J. Hydrologische Modellierung von Flussgebieten zur Abschätzung der Folgen von Klimaänderungen. Ph.D. Thesis, ETH-Zürich, Zürich, Switzerland, 1997. [Google Scholar]
- Schulla, J. Modell description WaSiM (Water balance Simulation Model). Available online: www.wasim.ch/downloads/doku/wasim/wasim_2013_en.pdf (accessed on 15 June 2018).
- Schulla, J. Interpolation of Meteorological Input Data. Technical Report. 2009. Available online: http://www.wasim.ch/downloads/doku/wasim/interpolation_meteodata_2009_en.pdf (accessed on 15 June 2018).
- Van Bebber, W.J. Die Zugstrassen der barometrischen Minima nach den Bahnenkarten der Deutschen Seewarte für den Zeitraum 1875–1890. METZ 1891, 8, 361–366. [Google Scholar]
- Vandentorren, S.; Suzan, F.; Medina, S.; Pascal, M.; Maulpoix, A.; Cohen, J.C.; Ledrans, M. Mortality in 13 French cities during the August 2003 heat wave. Am. J. Public Health 2004, 94, 1518–1520. [Google Scholar] [CrossRef] [PubMed]
- Martinez Navarro, F.; Simon-Soria, F.; Lopez-Abente, G. Evaluation of the impact of the heat wave in the summer of 2003 on mortality. Gac. Sanit. 2004, 18 (Suppl. 1), 250–258. [Google Scholar] [PubMed]
- Grize, L.; Huss, A.; Thommen, O.; Schindler, C.; Braun-Fahrlander, C. Heat wave 2003 and mortality in Switzerland. Swiss Med. Wkly. 2005, 135, 200–205. [Google Scholar] [PubMed]
- Garcia-Herrera, R.; Diaz, J.; Trigo, R.M.; Luterbacher, J.; Fischer, F.M. A Review of the European Summer Heat Wave of 2003. Crit. Rev. Environ. Sci. Technol. 2010, 40, 267–306. [Google Scholar] [CrossRef]
- Tomczyk, A.M. Impact of atmospheric circulation on the occurrence of heat waves in southeastern Europe. Idöjaras 2016, 120, 395–414. [Google Scholar]
- Muthers, S.; Laschewski, G.; Matzarakis, A. The Summers 2003 and 2015 in South-West Germany: HeatWaves and Heat-Related Mortality in the Context of Climate Change. Atmosphere 2017, 8, 224. [Google Scholar] [CrossRef]
- Auer, I.; Matulla, C.; Böhm, R.; Ungersböck, M.; Maugeri, M.; Nanni, T.; Pastorelli, R. Sensitivity of Frost Occurrence to Temperature Variability in the European Alps, Iinternational Journal of Climatology. Int. J. Climatol. 2005, 25, 1749–1766. [Google Scholar] [CrossRef]
- Fikfak, A.; Kosanovic, S.; Konjar, M.; Grom, J.P.; Zbašnik-Senegacnik, M. The Impact of Morphological Features on Summer Temperature Variations on the Example of Two Residential Neighborhoods in Ljubljana, Slovenia. Sustainability 2017, 9, 122. [Google Scholar] [CrossRef]
- Vuckovic, M.; Kiesel, K.; Mahdavi, A. The Extent and Implications of the Microclimatic Conditions in the Urban Environment: A Vienna Case Study. Sustainability 2017, 9, 177. [Google Scholar] [CrossRef]
- Schneider, P.; Gottschalk, N.; Kühnel, C.; Lehnert, H.; Scharbrodt, T. Bioclimatic Risk Assessment as Base for Resilient Urban Climate Adaptation Strategies: Case Study for the City of Chemnitz, Germany. In Proceedings of the European BfN/ENCA Conference “Biodiversity and Health in the Face of Climate Change”, Bonn, Germany, 27–29 June 2017. [Google Scholar]
- Kazak, J.K. The Use of a Decision Support System for Sustainable Urbanization and Thermal Comfort in Adaptation to Climate Change Actions—The Case of the Wrocław Larger Urban Zone (Poland). Sustainability 2018, 10, 1083. [Google Scholar] [CrossRef]
- Gerstengarbe, F.-W.; Welzer, H. Zwei Grad Mehr in Deutschland: Wie der Klimawandel Unseren Alltag Verändern Wird; Fischer Taschenbuch: Frankfurt, Germany, 2013; ISBN 978-3596189106. [Google Scholar]
- Lange, A.; Eggelsmann, F.; Bodnar, H. Auswirkungen des Globalen Temperaturanstiegs auf die Bewirtschaftung der Westharztalsperren, H2W Aktuell Ein Informationsblatt für Kunden und Mitarbeiter der Harzwasserwerke GmbH; 2007; Volume 3, Available online: http://talis.harzwasserwerke.de/images/h2w_3.pdf (accessed on 15 June 2018).
- Endler, C.; Matzarakis, A. Climate and tourism in the Black Forest during the warm season. Int. J. Biometeorol. 2011, 55, 173–186. [Google Scholar] [CrossRef] [PubMed]
- Lhotka, O. Long Term Variability of Heat Waves and Cold Spells in Central Europe, Ph.D. Thesis, Charles University, Prague, Czech Republic, 2016. [Google Scholar]
- Przybylak, R.; Majorowicz, J.; Brázdil, R.; Kejan, M. (Eds.) Precipitation Extremes and Disastrous Floods in Central Europe in July 1897. In The Polish Climate in the European Context: An Historical Overview; Springer Science & Business Media: Berlin, Germany, 2014; pp. 389–396. ISBN 978-90-481-3167-9. [Google Scholar]
- Niedzwiedz, T. The extreme precipitation in Central Europe and its synoptic background. Papers on Global Change IGBP, Polish National Committee of International Geosphere-Biosphere—Global Change Programme Polish Academy of Science. Warszawa 2003, 10, 15–29. [Google Scholar]
- Rudolf, B.; Rapp, J. Das Jahrhunderthochwasser der Elbe: Synoptische Wetterentwicklung und klimatologische Aspekte. DWD Klimastatusbericht 2002, 173–188. [Google Scholar]
- Ulbrich, U.; Brücher, T.; Fink, A.H.; Leckebusch, G.C.; Krüger, A.; Pinto, J.G. The Central European floods of August 2002: Part 1—Rainfall periods and flood development. Weather 2003, 58, 371–377. [Google Scholar] [CrossRef]
- Niedzwiedz, T. Rainfall characteristics in southern Poland during the severe flooding event of July 1997. Stud. Geomorphol. Carpatho-Balc. 1999, 33, 5–25. [Google Scholar]
- Ustrnul, Z.; Czekierda, D. Circulation background of the atmospheric precipitation in Central Europe (based on the Polish example). Meteorol. Z. 2001, 10, 103–111. [Google Scholar] [CrossRef]
- Ustrnul, Z.; Czekierda, D. Atlas of Extreme Meteorological Phenomena and Synoptic Situations in Poland; Instytut Meteorologii i Gospodarki Wodnej: Warszawa, Poland, 2009. [Google Scholar]
- Kundzewicz, Z.W. Extreme hydrological events: New concepts for security. NATO Sci. Ser. IV Earth Environ. Sci. 2007, 78, 97–110. [Google Scholar]
- Jelonek, L.; Wrzeszcz, L.; Zawislak, J.; Walther, P.; Winkler, U.; Wortha, S.; Srejber, J.; Petr, J. Gemeinsamer Polnisch-Deutsch-Tschechischer Bericht zum Hochwasser vom 07. bis 10. August 2010 an der Lausitzer Neisse als Bestandteil der Vorläufigen Risikobewertung Gemäss Artikel 4 der Hochwasserrisikomanagementrichtlinie (2007/60/EG); Prag: Wroclaw, Poland; Dresden, Germany, 2010. [Google Scholar]
- Bissolli, P.; Rapp, J.; Friedrich, K.; Ziese, M.; Weigl, E.; Nitsche, H.; Malitz, G.; Becker, A. Zur Rolle des Starkniederschlags am 7.-9. August 2010 im Dreiländereck Polen, Tschechien, Deutschland bei der Entstehung der Hochwasser von Neisse, Spree und Elbe; Deutscher Wetterdienst: Offenbach, Germany, 2010. [Google Scholar]
- Stein, C.; Malitz, G. Das Hochwasser an Elbe und Donau im Juni 2013; Selbstverlag des Deutschen Wetterdienste: Offenbach, Germany, 2013; Volume 242. [Google Scholar]
- Grams, C.M.; Binder, H.; Pfahl, S.; Piaget, N.; Wernli, H. Atmospheric processes triggering the central European floods in June 2013. Nat. Hazards Earth Syst. Sci. 2014, 14, 1691–1702. [Google Scholar] [CrossRef] [Green Version]
- Schaller, N.; Otto, F.E.; van Oldenborgh, G.J.; Massey, N.R.; Sparrow, S.; Allen, M.R. The heavy precipitation event of May-June 2013 in the upper Danube and Elbe basins. Bull. Am. Meteorol. Soc. 2014, 95, 69–72. [Google Scholar]
- Pendergrass, A.G.; Knutti, R.; Lehner, F.; Deser, C.; Sanderson, B.M. Precipitation varia-bility increases in a warmer climate. Sci. Rep. 2017, 7, 17966. [Google Scholar] [CrossRef] [PubMed]
- European Commission. Building a Green Infrastructure for Europe; Publications Office of the European Union: Luxembourg, 2013. [Google Scholar]
- National Agency for Nature Protection/Bundesamt für Naturschutz (BfN). Federal Green Infrastructure Concept—Nature Conservation Foundations for Plans Adopted by the German Federation. 2017. Available online: www.bfn.de/bkgi.html (accessed on 15 June 2018).


| Abbreviation | Designation | Description |
|---|---|---|
| TN10p | cold nights | count of days with a daily minimum temperature < 10th percentile of all days during 1961–1990, after removal of annual cycle |
| TX10p | cold days | count of days with a daily maximum temperature < 10th percentile of all days during 1961–1990, after removal of annual cycle |
| CSDI | cold periods | count of days in a span of ≥6 days with a daily minimum temperature < 10th percentile (see TN10p) |
| FD | frost days | count of days with a daily minimum temperature < 0.0 °C |
| ID | icing days | count of days with a daily maximum temperature < 0.0 °C |
| SF | days with severe frost | count of days with a daily minimum temperature ≤ −10.0 °C |
| TN90p | warm nights | count of days with a daily minimum temperature > 90th percentile of all days during 1961–1990, after removal of annual cycle |
| TX90p | warm days | count of days with a daily maximum temperature > 90th percentile of all days during 1961–1990, after removal of annual cycle |
| WSDI | warm periods | count of days in a span of at least six days with a daily maximum temperature > 90th percentile (see TX90p) |
| SU | summer days | count of days with a daily maximum temperature ≥ 25.0 °C |
| HD | heat days | count of days with a daily maximum temperature ≥ 30.0 °C |
| Abbreviation | Designation | Description |
|---|---|---|
| R75p | moderate wet days | count of days with precipitation sum on a wet day (RR1) > 75th percentile of daily amounts during 1961–1990 |
| R95p | very wet days | count of days with precipitation sum on a wet day (RR1) > 95th percentile of daily amounts during 1961–1990 |
| R99p | extremely wet days | count of days with precipitation sum on a wet day (RR1) > 99th percentile of daily amounts during 1961–1990 |
| RR1 | wet days | count of days with precipitation sum ≥ 1 mm |
| R10mm | heavy precipitation days | count of days with precipitation sum ≥ 10 mm |
| R30mm | extremely heavy precipitation days | count of days with precipitation sum ≥ 30 mm |
| CWD-a | consecutive wet days | annual maximum length of wet spell (count of days with precipitation sum ≥ 1.0 mm) |
| RRX | wet periods | count of days in a span of ≥ 3 days with daily precipitation sum ≥ 5.0 mm |
| CDD-a | consecutive dry days | annual maximum length of dry spell (count of days with precipitation sum < 1.0 mm) |
| TRK | drought periods | count of days in a span of ≥ 10 days with daily precipitation sum ≤ 0.5 mm |
| Großwettertypen (GWT) | Frequency [%] | Großwetterlagen (GWL) | Frequency [%] | ||||
|---|---|---|---|---|---|---|---|
| WHY | SHY | WHY | SHY | ||||
| W | West | 30 | 22 | WA | Anticyclonic Westerly | 5,1 | 5,4 |
| WZ | Cyclonic Westerly | 18,5 | 13,9 | ||||
| WS | South-Shifted Westerly | 3,7 | 1,6 | ||||
| WW | Westerly, Block Eastern Europe | 3,0 | 1,4 | ||||
| SW | Southwest | 8 | 7 | SWA | Anticyclonic South-Westerly | 3,6 | 2,5 |
| SWZ | Cyclonic South-Westerly | 4,6 | 4,7 | ||||
| NW | Northwest | 8 | 6 | NWA | Anticyclonic North-Westerly | 2,2 | 2,2 |
| NWZ | Cyclonic North-Westerly | 6,3 | 4,2 | ||||
| HME | Anticyclone over Central Europe | 16 | 17 | HM | High over Central Europe | 6,7 | 5,3 |
| BM | Zonal Ridge across Central Europe | 9,4 | 11,9 | ||||
| TME | 1 | 3 | TM | Low (Cut-Off) over Central Europe | 1,3 | 2,6 | |
| N | North | 14 | 17 | NA | Anticyclonic Northerly | 0,4 | 0,9 |
| NZ | Cyclonic Northerly | 2,5 | 2,3 | ||||
| HNA | Icelandic High, Ridge Central Europe | 1,5 | 2,6 | ||||
| HNZ | Icelandic High, Trough Central Europe | 1,3 | 2,2 | ||||
| HB | High over the British Isles | 3,0 | 3,4 | ||||
| TRM | Trough over Central Europe | 5,3 | 5,8 | ||||
| NE | Northeast | 1 | 4 | NEA | Anticyclonic North-Easterly | 0,5 | 1,8 |
| NEZ | Cyclonic North-Easterly | 0,8 | 2,0 | ||||
| E | East | 7 | 9 | HFA | Scandinavian High, Ridge Central Europe | 2,5 | 3,2 |
| HFZ | Scandinavian High, Trough Central Europe | 1,3 | 1,8 | ||||
| HNFA | High Scandinavia-Iceland, Ridge C. Europe | 1,0 | 1,9 | ||||
| HNFZ | High Scandinavia-Iceland, Trough C. Europe | 1,9 | 2,4 | ||||
| SE | Southeast | 5 | 2 | SEA | Anticyclonic South-Easterly | 2,8 | 1,1 |
| SEZ | Cyclonic South-Easterly | 1,8 | 0,7 | ||||
| S | South | 8 | 12 | SA | Anticyclonic Southerly | 2,0 | 1,1 |
| SZ | Cyclonic Southerly | 1,3 | 0,3 | ||||
| TB | Low over the British Isles | 1,5 | 2,8 | ||||
| TRW | Trough over Western Europe | 3,3 | 7,5 | ||||
© 2018 by the authors. Licensee MDPI, Basel, Switzerland. This article is an open access article distributed under the terms and conditions of the Creative Commons Attribution (CC BY) license (http://creativecommons.org/licenses/by/4.0/).
Share and Cite
Hoy, A.; Feske, N.; Štěpánek, P.; Skalák, P.; Schmitt, A.; Schneider, P. Climatic Changes and Their Relation to Weather Types in a Transboundary Mountainous Region in Central Europe. Sustainability 2018, 10, 2049. https://doi.org/10.3390/su10062049
Hoy A, Feske N, Štěpánek P, Skalák P, Schmitt A, Schneider P. Climatic Changes and Their Relation to Weather Types in a Transboundary Mountainous Region in Central Europe. Sustainability. 2018; 10(6):2049. https://doi.org/10.3390/su10062049
Chicago/Turabian StyleHoy, Andreas, Nils Feske, Petr Štěpánek, Petr Skalák, Andreas Schmitt, and Petra Schneider. 2018. "Climatic Changes and Their Relation to Weather Types in a Transboundary Mountainous Region in Central Europe" Sustainability 10, no. 6: 2049. https://doi.org/10.3390/su10062049