Research on Passenger’s Travel Mode Choice Behavior Waiting at Bus Station Based on SEM-Logit Integration Model

Key Laboratory of Traffic Engineering, College Metropolitan Transportation, Beijing University of Technology, Beijing 100124, China
*
Author to whom correspondence should be addressed.
Sustainability 2018, 10(6), 1996; https://doi.org/10.3390/su10061996
Submission received: 11 May 2018
/
Revised: 5 June 2018
/
Accepted: 11 June 2018
/
Published: 13 June 2018
(This article belongs to the Section Sustainable Transportation)
Abstract
:To improve the mode share of public transport and reduce the transition to private transport of passengers waiting at bus station, the mechanism of passengers’ decision-making procedure and influence factors of the travel mode choice were analyzed. Some latent variables such as safety, comfort, convenience, flexibility and economy were selected to reflect the satisfaction degree of passengers on the service level of public transport. Taking Jinan City as an example, the questionnaire of passengers’ travel choice behavior at bus station was designed and carried out. Based on the structure equation model (SEM), the relationship between the satisfaction degree and some latent variables such as safety and comfort was discussed. The SEM method analysis shows that, of the influence level of the latent variables to the service level of public transport, flexibility is the most significant variable affecting passenger’s satisfaction degree followed by safety, convenience, comfort and economy. Travel mode choice model of passengers waiting at bus station was established with an integration approach of SEM and nested logit (NL) model. The SEM-NL integration model results reveal that gender, monthly income, purpose of the trip, travel distance, safety and convenience service level have a significant effect on the choice of the upper model (public transport or private transport). Passenger’s age, vehicle ownership and bus ride frequency have great influence on the choice of the lower mode (ORB: original route bus; ARB: alternative route bus; Taxi; and Shared bike). Sensitivity analysis reveals that the transition probabilities from private transport to public transport can reach the highest point (respectively, 69.85%, 68.84% and 35.51%) when safety service reaches level 4, convenience service reaches level 3, or comfort service reaches level 2, indicating that the safety level equal to 4, convenience level equal to 3 and comfort level equal to 2 are the key threshold to increase the public transport mode share. Some proposals such as ensuring good accessibility of public transport, shortening the transfer distance of different routes, creating a comfortable travel environment and integrating bus ticket system have been put forward for the sustainable development of public transport system.
1. Introduction
The developed, safe, convenient and sustainable public transport is one of the important signs of urban modernization and civilization [1]. The satisfaction degrees of some bus routes are not high because of low bus service level such as long waiting time at bus station and high average capacity rate [2]. Some passengers waiting at bus station will transfer to other alternative bus routes or other travel modes such as taxi, shared bike, carpool, etc. Some passengers will choose to use private cars for their next trips, which reduces the mode share of public transport and aggravates the burden of road network in traffic peak time [3]. As a result, traffic congestion, environmental pollution and other external costs begin to emerge. To solve these problems in metropolis, it is necessary to take measures to improve attractions of public transport and reduce the loss of passengers, especially for those passengers waiting at bus station [4]. It is significant to understand passenger’ decision-making procedure and influence factors of travel mode choice behavior. The goal of the present study was to use a high-fidelity model to understand how different factors associated with passengers waiting at bus station influence travel mode behavior.
Thus, the questions are as follows: What factors can affect passenger’s travel mode choice behavior waiting at bus station? What kind of passengers will choose to transfer to other travel modes considering the satisfaction of bus service level? What kind of travel mode do they prefer? How should the sensitive variables be adjusted to increase the bus share to achieve the sustainable development of public transport?
Domestic and foreign scholars mainly analyze traveler’s mode choice behavior and passenger’s waiting behavior at bus station. Some studies about passengers waiting at bus station mainly focus on the passengers’ waiting location distribution, travel behavior and reaction under emergency situations such as vehicles breakdown and normal power supply failing of the subway system. Takada (2008) [5] used the SP survey to collect passengers’ behavior and reaction when the subway service was stopped and established the choice behavior model of passenger waiting on subway platform under emergency situations. The results show that some passengers chose to wait for the subway service to resume instead of transferring to another route even though the travel time of the new route was shorter than the current route. Zhang (2014) [6] studied the impact of the information released by the Passenger Information System (PIS) on passenger’s waiting behavior, and the results showed that the information such as passenger density on the platform, passenger density in the bus and travel distance have a significant effect on passengers’ waiting location distribution. WU (2016) [7] analyzed the relationship between waiting time and passenger’s satisfaction degree based on the characteristic of passenger’s waiting behavior. Eight factors such as trip purpose and frequency were selected to illustrate passenger’s satisfaction degree, and a multi-mode bus scheduling model with optimal satisfaction was established. Some studies have found that the bus station and its quality can affect passenger’s travel mode choice. It is necessary to develop innovative solutions (e.g., ensuring the best accessibility and safety measures for bus station infrastructures and vehicles, restoring the service level and creating attractive interchange stations) [8] to increase the attractiveness of public transport and to operate more environmentally-friendly vehicles. EBSF (European Bus System of the Future), 3iBS (the Intelligent, Innovative Integrated Bus Systems and ZeEUS (Zero Emission bus Systems) are research projects funded by the European Commission to continue striving for increased performance, accessibility and efficiency of urban bus systems [9].
Early research focused on the travel behavior and mode choice. Based on the random maximization utility theory, different kinds of discrete choice model such as MNL model, Nested Logit model, and Cross-Nested Logit model were established to describe the mode choice behavior of commuting traffic and tourism and daily family activities. Combining with data obtained from the investigation, parameter calibration, model testing and forecasting comparison can be conducted to make a more reasonable and scientific explanation for the travel behavior in reality. Abane (1993) [10] established MNL model to study commuter trip behavior in Accra, the capital of Ghana, and found that commuters’ age, gender and monthly income played an important role in travel mode choice. Yao (2010) [11] divided travel mode into public transport and private transport, and established the NL model of travel choice behavior. The results showed that the factors such as age, trip purpose, travel time significantly affected residents’ choice of travel mode. Zulqarnain (2017) [12] established a nested logit model to study the behavior of commuters to downtown Pittsburgh who use car, bus, light rail, walking, and biking. It can be seen that the trip characteristics (i.e., travel time, travel cost, and departure time) and travelers’ socioeconomic characteristics such as age, gender and monthly income, were considered in most of the traditional travel mode choice models.
In recent years, researchers found that traveler’s perceptions, attitudes, psychological factors and other internal factors often have a significant impact on choice behavior. In 2002, Ben-Akiva (2002) [13] realized that psychological factors had great effect on the travel behavior. Some latent variables which can describe the subjective psychological factors were considered and firstly introduced into the discrete choice model and Hybrid Choice Model (HCM) was constructed. Jahansson (2006) [14] found that some indicators such as flexibility, comfort, environmental friendliness convenience and safety would be considered by passengers when they chose travel mode among cars, trains and buses. The results showed that the first three factors had significant impacts on travel mode choice. Contrary to influencing factors such as the trip characteristics and travelers’ socioeconomic characteristics, traveler’s perceptions, attitudes and psychological factors also have a significant impact on choice behavior. However, those subjective and perceptive factors cannot be directly observed. Latent variables are proposed and the general method of dealing with latent variable is finding other significant variables (that is, observed variables) to measure it, which make it possible to make a quantitative study of travel behavior from the perspective of psychological activity, etc. Ji (2016) [15] defined six latent variables (such as convenience, reliability, comfort, safety, etc.) and considered the impact of potential variables on tram passenger satisfaction. It was found that passengers were more sensitive to time cost during the travel. Habib (2012) [16] demonstrated that discrete choice models with subjectively perceived latent variables can significantly improve the model’s explanatory ability to travel model choice.
Due to the relationship between latent variable and latent variable, explicit variable and latent variable, a complex hierarchical structure usually will be formed for the analysis of the travel mode choice behavior. It cannot be solved by traditional regression analysis method. SEM are used to describe and measure the relationship between the explicit variables and latent variables [17]. Yan (2015) [18] constructed SEM to explore the relationship between the various factors and the degree of impact on the bus travel willing by extracting parameters of personal characteristics and travel characteristics. To illustrate the travel mode choice behavior well, SEM and Logit model are combined and SEM-Logit integration model is constructed. Gan (2015) [19] developed a discrete choice model of SEM-Logit travel mode for migrant workers which considered traditional personal characteristics, travel characteristics and attitude perception potential variables. Chen (2012) [20] considered the travelers’ psychological factors and constructed the SEM-Logit integration model of travel choice behaviors. The goodness of the integrated model considering latent variables was 0.201 which is higher than that of the traditional Logit model. The results indicated that the SEM-Logit integrated model had higher accuracy and explanatory ability and latent variables had a significant impact on travel choice behavior [21]. Peng (2015) [22] quantitatively analyzed the influence of latent variables, such as parking convenience, safety and parking environment on the parking choice behavior in old residential areas, and developed the SEM-logit integration model with latent variables and explicit variables.
In summary, passenger’s travel mode choice behavior is a complex procedure influenced by multiple factors. For those passengers waiting at bus station, their psychological perception characteristics, travel modes limitations, waiting psychology and behavior are different from other travelers and those factors affect their travel mode choices, which have not been considered in the previous research. The object of the research mainly focuses on the resident, and there is less research on passengers’ travel behavior waiting at bus station. The results show that improving bus service level from its comfort, convenience, safety, comfort, flexibility and economy service is an effective way to increase passengers’ bus satisfaction and the mode share of public transport. Research on certain areas that some potential factors and individuals’ subjective factors have impact on travel mode choice needs to be deepened. There is hardly further elastic analysis of the key influencing factors of SEM-logit integration model in existing literature, which makes it difficult to provide decision-making basis for traffic demand management and policy making. In this paper, we consider different influence factors of the passengers waiting at bus station and establish a SEM-Logit integration model to understand how different factors, especially the subjectively perceived latent variables influence travel mode choice behavior.
The rest of the paper is organized as follows. Section 2 analyzes passenger’s decision-making procedure of travel mode choice behavior waiting at bus station and its influencing factors. Section 3 provides the methodology of developing and calculating a SEM-NL integration model. In Section 4, case introduction and description of survey data obtained from the public transport questionnaire in Jinan City are preliminary analyzed. Reliability of latent variables and further estimation results of the model are presented, and sensitivity analysis of the key variables are provided in Section 5. Conclusions and suggestions for future research and some proposals for sustainable development of public transport are given in Section 6.
2. Travel Mode Choice Behavior of Passenger Waiting at Bus station
2.1. Mechanism Analysis of Decision-Making Procedure
The cognition and travel decision-making of the bus passenger is a process of continuous learning and repeated adjustment. The travel process of bus passenger can be divided into five steps: (1) plan to travel at origin; (2) arrive at bus station; (3) wait at bus station; (4) get on the bus; and (5) get off the bus and go to the destination. The psychological expectation of passengers at each step is analyzed in Figure 1.
Based on consumer behavior theory, passenger’s choice behavior in bus station is rational, and the optimal travel mode will be chosen according to the utility maximization hypothesis. Before traveling, passengers will make their own travel plans mentally based on their existing experience, including selecting bus station, routes and departure times. On the way to the bus station, most of them have to make a decision about the bus route and bus station they plan to take. They hope to spend less time reaching their destination without transferring, and walking less from the bus station to the destination. When there is travel information provided, the passenger will further adjust their travel plans in conjunction with acquired information, such as canceling travel, changing departure time or bus routes.
Passengers’ waiting psychology and behavior affect their perceptions at bus station [23]. Passengers will have expectations on bus service level (such as waiting time, cabin environment, service value, etc.). The buses are usually operated on specified routes at scheduled time. When the bus service level become lower due to traffic congestion during rush hours, passengers cannot accurately predict the bus arrival time and have to wait before the bus arrival at station. They feel the waiting time at bus station become longer and feel more crowded which make their satisfactions degree lower than before. Passengers waiting at the bus station concentrate on each arrival of the bus. They judge whether it is the one and they have some expectations on each arrival. When the arrival is not the expected one, it will result in great loss and thus a psychological imbalance, which will give negative feelings to passengers. When this case happens repeatedly, the longer it lasts, the worse passengers’ negative feelings and mental performance. Eventually, some passengers waiting at the bus station will choose to end the waiting state.
Since there is a gap between the expectation and the reality of bus service level, when the expected value is higher than the actual value, passengers begin to have discomfort with the actual waiting state that leads to a psychological imbalance state, as shown in Figure 2. When this psychological imbalance state repeatedly occurs, passengers have the motives to change the unbalanced state and want to reach a psychological balance state [24]. When the waiting time exceeds the psychological expectations of the passengers, some of them will not only choose to transfer to other bus routes, but also choose to transfer to other travel mode such as taxi and carpool [25].
When the static and dynamic information of buses and road traffic were received, passengers will assess the waiting state according to their personal characteristics, lifestyle, habits and family preferences, as well as their attitude perceptions to waiting environment, psychological and group characteristics, etc. Passengers will intuitively form an intention, make a mode choice decision and update their plan. Hence, the question discussed has changed from bus route decision to mode choice decision. Based on the updated travel plan, the expected travel time was estimated and the next phase of activity was scheduled.
After the trip is completed, passengers will evaluate them based on the situation and update their experience by accumulating experience and further learning. On the next bus travel, passengers can accumulate new learning and experience with the help of travel information based on the updated travel experience.
2.2. Influence Factor and Preference Analysis
The travel mode choice is a complex decision-making procedure, which is affected by many factors, such as passengers’ individual characteristics, travel characteristics, and service level of different bus routes, and passengers may choose different travel modes under different situations [26]. It is a kind of commodity consumption and the travel mode choice behavior is essentially a consumer’s choice behavior [27]. The individual characteristics of each passenger have an influence on choice behavior, such as gender, education and occupation, which are caused by cultural differences. Passengers often have to face a lot of unknown or uncertain factors in waiting state, where stress emotion dominates, especially when passengers with different trip purposes have some limitations of travel time. It will be relatively obvious and increase their perceived waiting time, and then cause some negative emotions which can affect bus satisfaction degree and passengers’ waiting behavior.
In the theory of consumer choice behavior, the satisfaction degree of the consumers with different characteristics can affect their behavior [28]. Personal perception and attitudes are latent variables, which cannot be directly observed and need to be measured by related observed variables. For example, most passengers just judge bus convenience service level by their own satisfaction degree, while it can be described by some observed variables (i.e., departure frequency). Passengers may be satisfied when bus safety service level meets their psychological expectations [29]. Different passengers may have different expectations to the bus service level. Some may expect higher safety level than economy while others expect higher convenience level than comfort. In addition, passengers’ satisfaction degree can also be affected by objective environment, such as the weather, the waiting conditions and atmosphere of bus station and facilities.
It became more scientific and reasonable to explain the passenger’s travel mode choice in waiting state by introducing the latent variables into the decision-making process. The influence factors of mode choice are discussed in Figure 3.
In summary, the influence factors of travel mode choice mainly included passengers’ socioeconomic characteristics, family characteristics, travel characteristics and satisfaction degree for public transport service level. All the variables are classified into two parts: explicit variables that can be directly observed and latent variables that cannot be directly observed [30]:
- Explicit variables include passengers’ demographic and socioeconomic characteristics (i.e., gender, age, monthly income, education level, and vehicle ownership) and trip related characteristics (i.e., trip purpose, travel time, commute distance, frequency of taking a bus, and acceptable waiting time);
- Latent variables are mainly passengers’ satisfaction degree for public transport services level, and corresponding observational indexes are used to measure these latent variables [31], including safety (i.e., safety facilities, and personal and property safety), comfort (i.e., neat and tidy degree of the carriage, congestion degree of the carriage, seat comfort, and environment comfort), convenience (i.e., distance between home and bus station, distance between destination and bus station, and departure frequency), flexibility (i.e., waiting time, delay time, and bus operation speed) and economy (i.e., bus travel cost and cost rate in monthly income).
The consideration of the perspective of passengers’ needs in the influence factor analysis of travel modes will help us to understand and explain the differences in travel mode choices among passengers with different characteristics in the following text.
3. Methodology
Due to the complex relationship between latent variables and explicit variables, the travel mode choice usually forms a complex hierarchical structure. It is difficult to explain and analyze passengers’ attitudes, perceptions, psychology and the relationship between these latent variables [32]. It cannot be solved by traditional regression analysis method, which requires more accurate path-analysis tools and more parameters estimation and test in the model.
SEM is a very flexible linear-in-parameters multivariate statistical modeling technique, which has been widely used for research in transportation studies since the 1980s [33]. It is a statistical method that uses linear equations to represent the relationship between observed variables and latent variables, including measurement model and structural model. It. SEM is the combination of two types of statistical technique: factor analysis and simultaneous equation models, which can handle many exogenous and endogenous variables flexibly, as well as latent variables specified as linear combinations (weighted averages) of the observed variables [34]. The SEM model has some advantages in describing and measuring the correlation between one or several independent variables and dependent variables no matter it is continuous or not, so it was utilized to solve the mode choice behavior model waiting at bus station.
3.1. Framework of SEM-Nested Logit Integration Model (SEM-NL)
As discussed in the mechanism analysis of decision-making procedure, passengers waiting at bus station can choose city bus, shared bike and car-hailing services, taxis and so on. The travel mode choice set are divided into public transport and private transport mode. Public transport mode includes original route bus (ORB), alternative route bus (ARB), and private transport mode includes taxi (including taxi, car-hailing service, and carpool), and shared bike. The structure of integrated SEM-Nested Logit model in this paper is shown in Figure 4. The SEM is mainly used to describe the causal relationship between the latent variables and the corresponding observed variables. The Logit model is used to represent the nonlinear function relationship between the probability of an alternative and the variables that affect the decision.
In summary, when passengers choose their travel mode, they cannot be completely rational and unilaterally determined by some factors such as the comfort of bus facilities and passengers real waiting time. These two factors can be connected by bus service and the irrational qualitative factors indicating that passengers’ psychological feelings and expectations should be considered as significant variables into mechanism analysis of passengers’ decision-making procedure. Then, what aspect of the bus service level will affect passengers’ satisfaction in waiting state? How does it work? Which plays a role? What is the correlation between different aspects of bus satisfaction and passengers’ travel mode choice behavior? Next, we need to quantify the relationship among specific bus service situation, bus satisfaction and passengers’ travel mode choice.
3.2. Solution Method of SEM-NL Model
According to the factors affecting passengers’ travel mode choice behavior, the causal relationship between latent variables of passenger’s satisfaction degree and their measured variables is first depicted by SEM and the fitness value of latent variables can be obtained. Then, combined with the maximum utility theory, the utility function of the traditional Logit model is improved to develop a SEM-Logit integration model with latent variables. Finally, taking the survey data obtained from the public transport questionnaire in Jinan City as a case study, the influencing factors of passengers’ travel behavior under bus delay on bus station are analyzed. The key factors are used for elastic analysis with a view to enhance passengers’ satisfaction degree and the attraction of public transport, to guide passengers to continue to choose bus travel and increase the public transport mode share.
Step 1. Reliability analysis of latent variables
In practical research, many things and attitudes cannot be directly measured. Researchers often design a set of questions to indirectly reflect their actual conditions. However, whether these topics can achieve the research purpose requires further analysis through statistical means. The consistency of the questionnaire reflects the correlation among questions, which can be used to judge whether the questions measure the same content. In this paper, α-coefficient (Cronbach’s Alpha) as Equation (1) was used to measure the reliability of the survey data [35].
where s is the number of questions aimed at the same survey objective; is the variance of the total sample; and is the variance of the observed sample t.
Step 2. Calculation of the fitness value
SEM model contains measurement model and structural model. The measurement model mainly describes the relationship between latent variable and observed variable. The structural model is used to deal with the relationship between latent variables [36].
The load factors of latent variables can be obtained by constructing the measurement model of passenger’s satisfaction degree. The measurement model is as follows:
where Y is a vector of the observed variable or indicator of latent variable; is the matrix of the load factor for Y on ; is the latent variable, reflecting passengers’ satisfaction degree for public transport services level, including safety, comfort, convenience, flexibility and economy; and is the error vector of the observed variable y.
By converting the coefficient relationship between the latent variables and the observed variables, the fitness value of the satisfaction attribute based on the survey data of observed variables, together with passenger’s individual characteristics and trip related characteristics were added into the utility function of different travel mode choice as influencing factors [19]. The specific steps are as follows:
For the measurement model of SEM, taking a latent variable as an example, if it is expressed in vector form, Equation (2) can be converted to Equation (3):
The path coefficients , , …, of the latent variable are standardized and regarded as the weights of the observed variables, and the assigned weights are represented as ,,…,.
The fitness value of the latent variables such as safety and comfort in the satisfaction characteristics will be obtained after bringing the value of the observed variables as Equation (5).
All fitness value of latent variables in passenger’s satisfaction degree characteristics can be calculated in the same way.
Step 3. Estimation results of SEM-logit integration model
The theoretical basis of the disaggregate model is the utility maximization behavior hypothesis [37]. That is to say, an individual as a unit of behavior decision-making will choose the most effective one among a set of independent alternatives [38]. If the satisfaction characteristics are added to the fixed item of the utility function in logit model, then:
where is the kth characteristic variable for passenger n to choose the mth option branch; is an unobserved latent variable [39], which can be calculated as the Equation (5); are unknown parameters to be estimated; and l is the number of latent variables.
The derivation process and method of NL model remain unchanged in addition to seeing as a whole. Then, the up model is a Logit model with latent variables, and the probability for each choice is as given as Equation (7):
where is the fixed item of the utility obtained by choosing the low level alternative r under the condition that the passenger n choose the up level alternative m; is the fixed item of the utility that changes only with the up level alternative m, which is irrelevant to the low level alternative r; and is the inclusive value. It shows that a passenger will consider the total utility that can be obtained from the low level alternatives, ; is the inclusive value parameter, whose size can reflect the influencing degree of the low level alternatives’ utilities on the up level alternatives’ utilities.
4. Case Study
4.1. Case Introduction and Description
To obtain the basic information about the travel mode choice behavior of passengers waiting at bus station in China, a survey based on RP and SP method was designed and carried out at different bus stations in the downtown areas of Jinan, which was conducted three times for both peak and off-peak periods from 9 April to 11 April 2017. A total of 188 valid samples were completed with an 85.45% retention rate. The minimum sample size required for SEM is 100 [40], so it is reasonable to use SEM to analyze the relationship between variables. As shown in Table 1 and Table 2, the survey includes four parts:
- Passengers’ basic information on demographic and socioeconomic characteristics includes gender, age, monthly income, education level, and vehicle ownership [41];
- Travel characteristics include trip purpose, travel time, commute distance (the number of bus station), and frequency of taking the bus (daily, once 2–3 days, weekly, monthly and rarely) [42];
- Intention investigation includes passengers’ acceptable waiting time and travel choice in the case of bus delay [43];
- Evaluation of passenger satisfaction, the survey data covered five indicator variables reflecting the safety, comfort, convenience, flexibility and economy of bus operation characteristics and services using five-point Likert scale [44].
4.2. Data Analysis
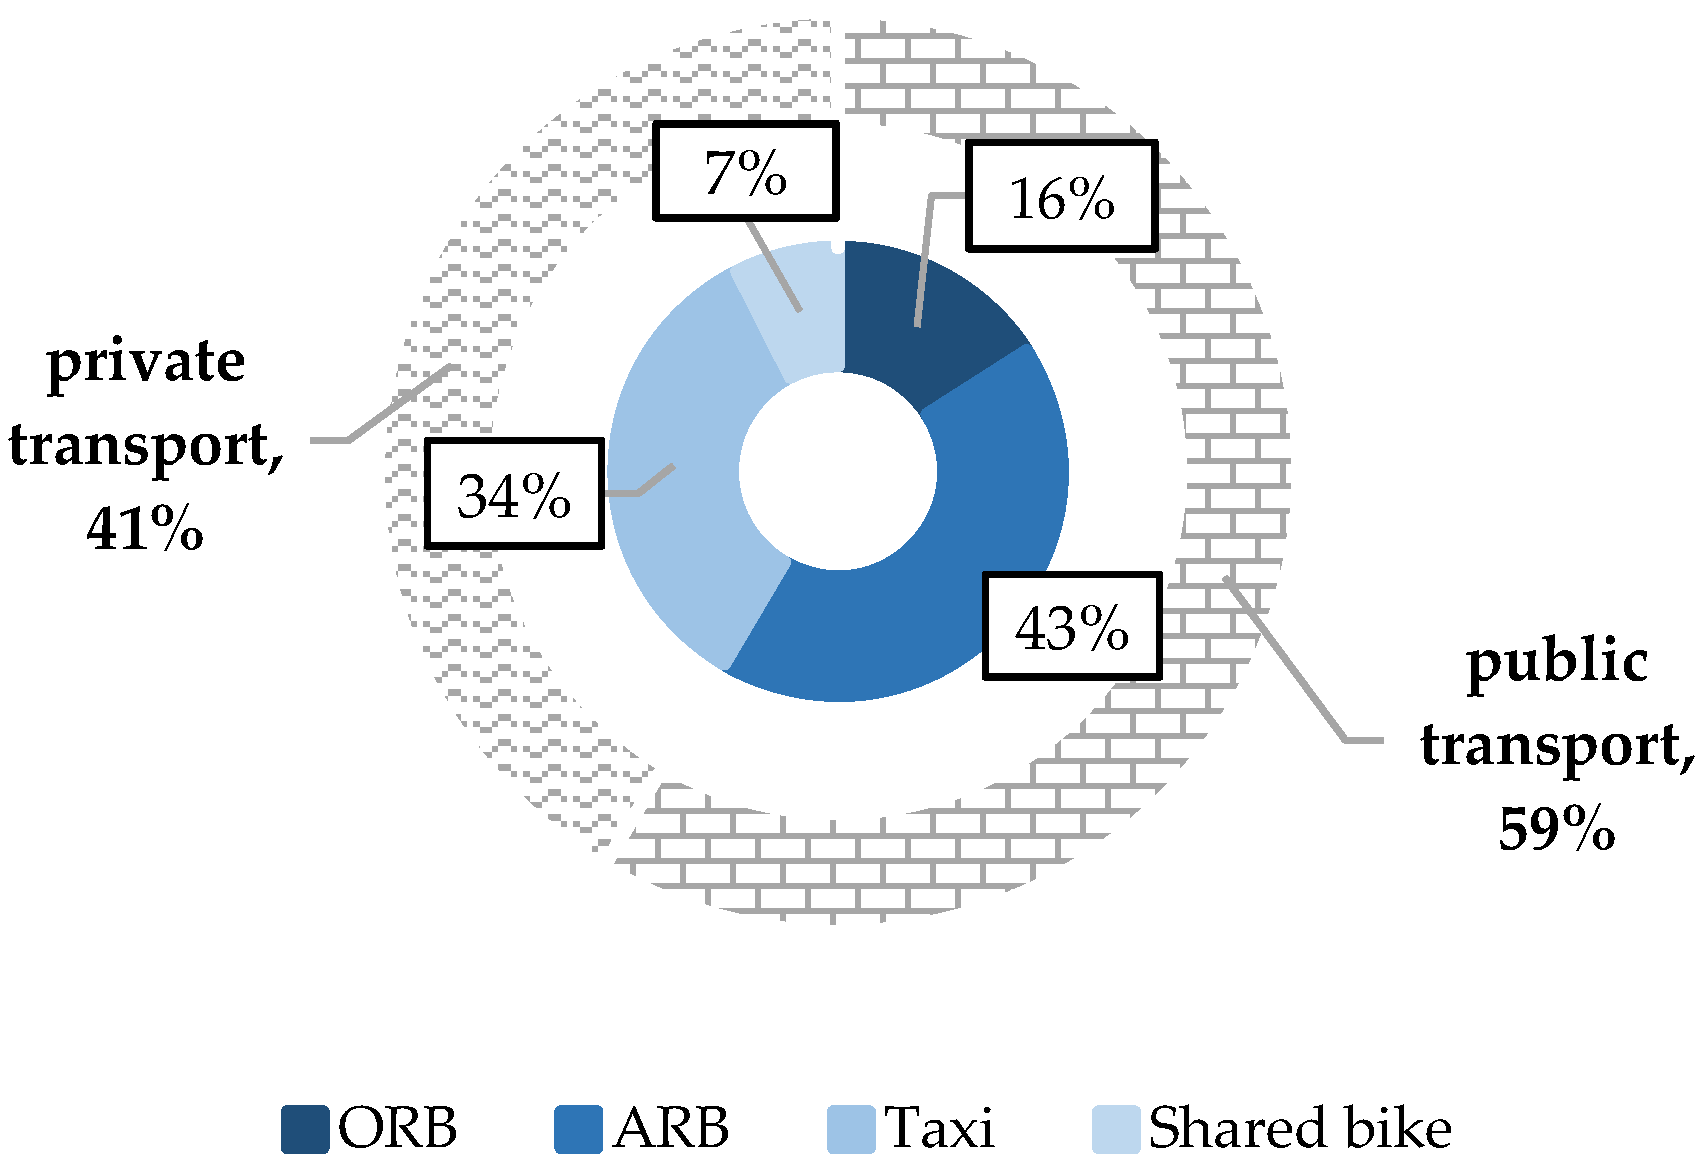
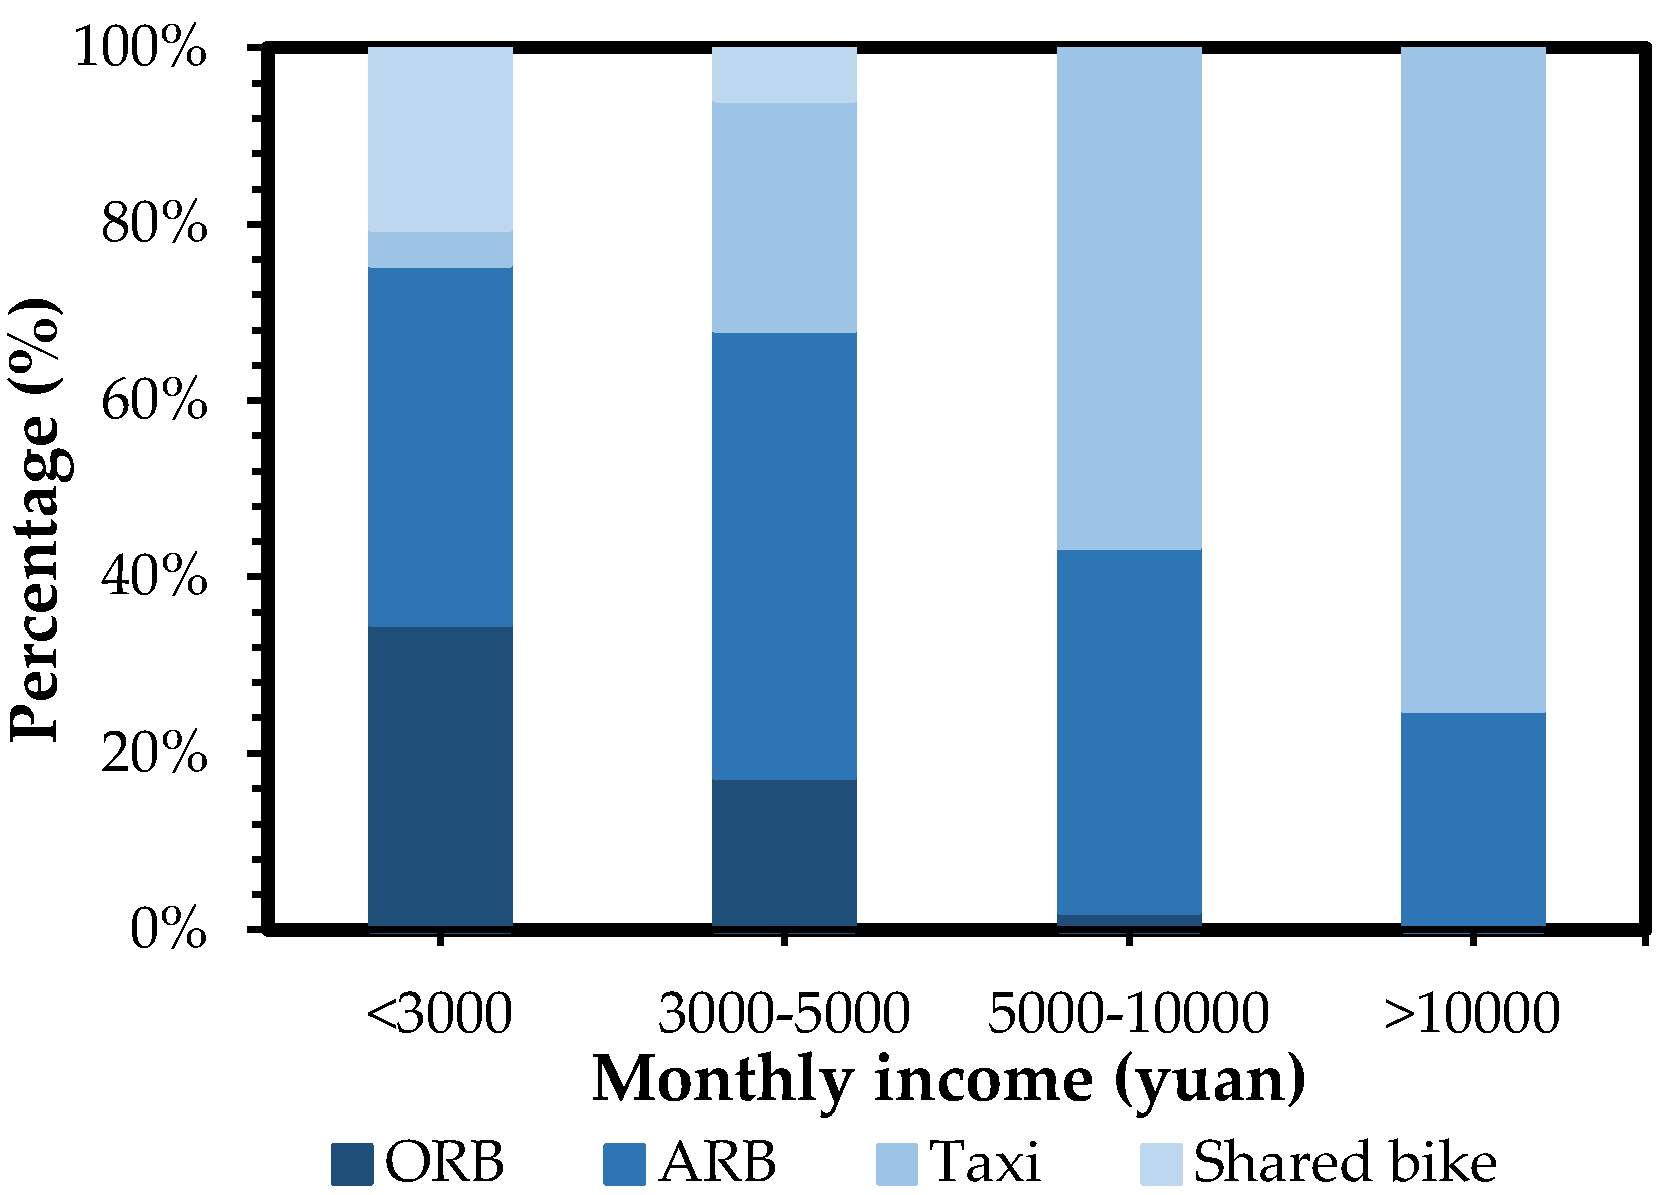
The travel mode choice of passengers’ waiting at bus station is shown in Figure 5. About 59% of the respondents chose to wait for public transport, only 16% of the respondents would wait for ORB, 43% of respondents change to other ARB, and 41% of the respondents will choose to use other private modes. For example, 34% of the respondents will take a taxi. Figure 6 shows the choice results of passengers with different monthly income. As the income increases from <3000 to >10,000, the proportion choosing ORB or shared bike gradually decreases from 34.69% to 0 and from 20.41% to 0, respectively, while taxi and car-hailing demand increases gradually from 4.08% to 75%. The possible reason is that passengers with higher monthly income pay more attention to time cost and travel comfort.
As listed in Figure 7, rigid trips such as commute or family obligations have higher time and cost requirements, and passengers focus on choosing a more economical and efficient way. For example, 20.83% and 45.83% chose ORB and ARB, respectively; other life trips such as shopping and leisure are more random and have higher comfort requirements, and the proportion of these passenger choosing taxi or shared bike is slightly higher than that of commuter passengers.
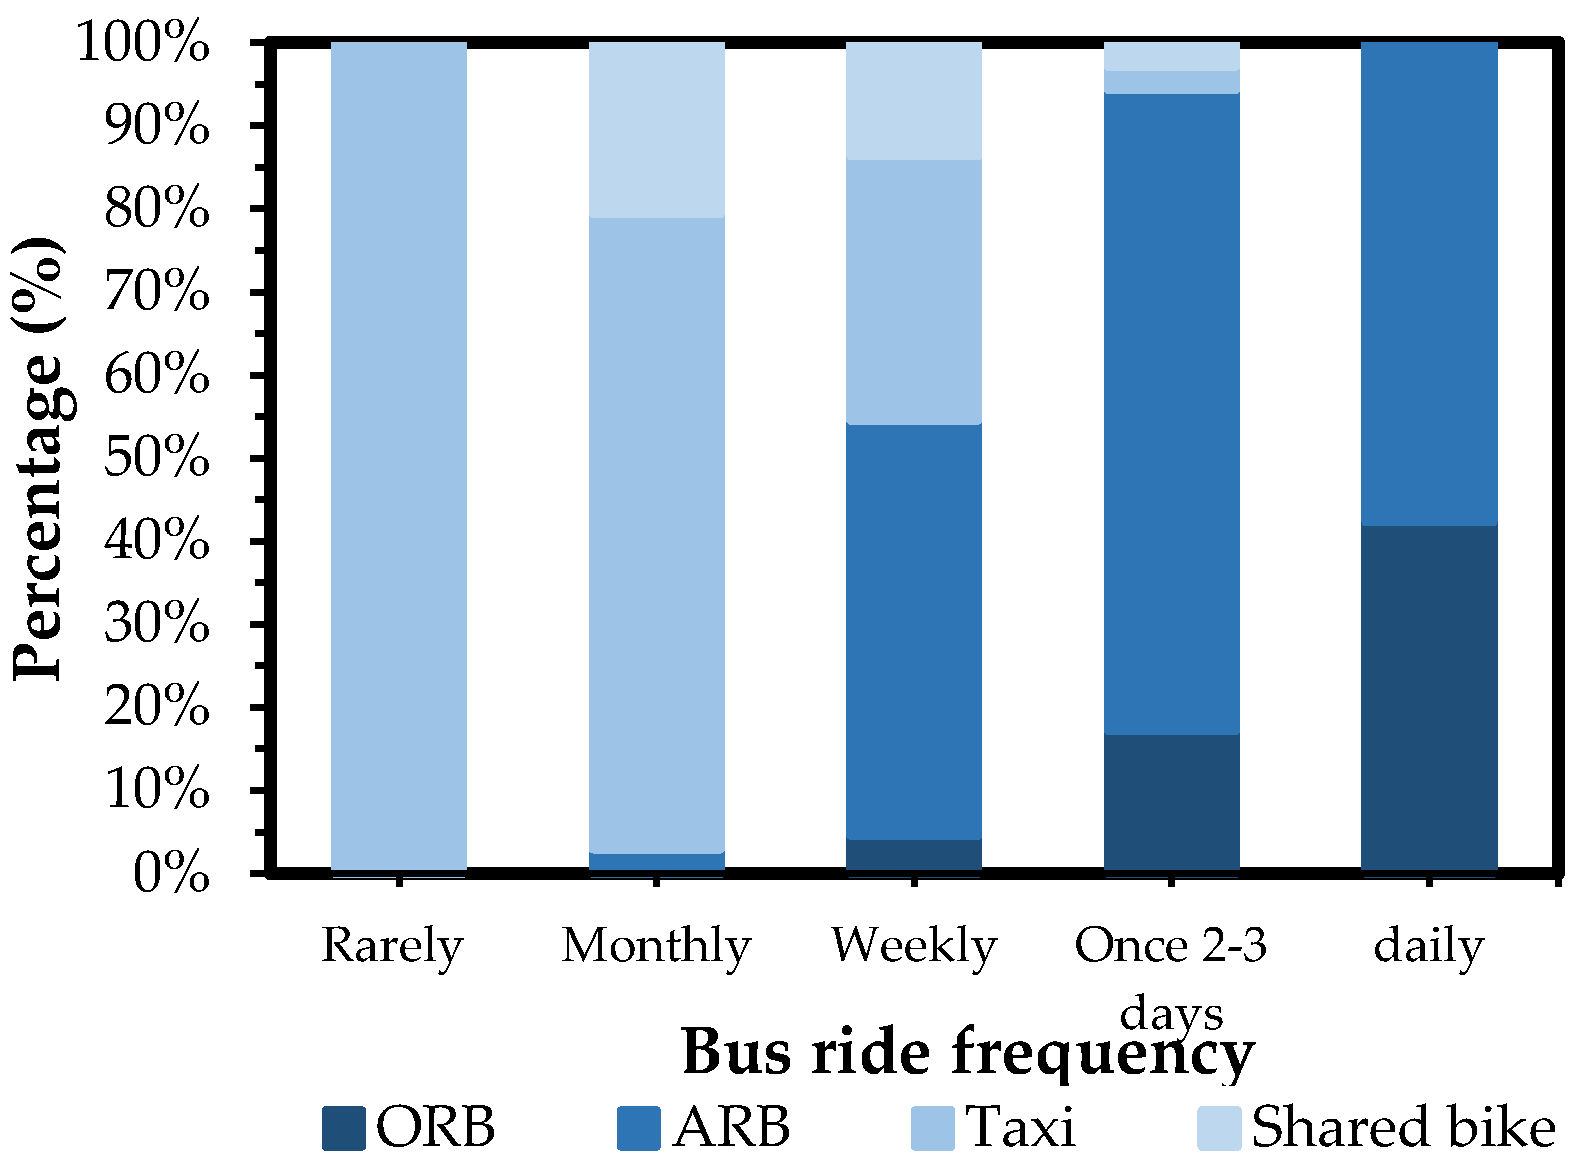
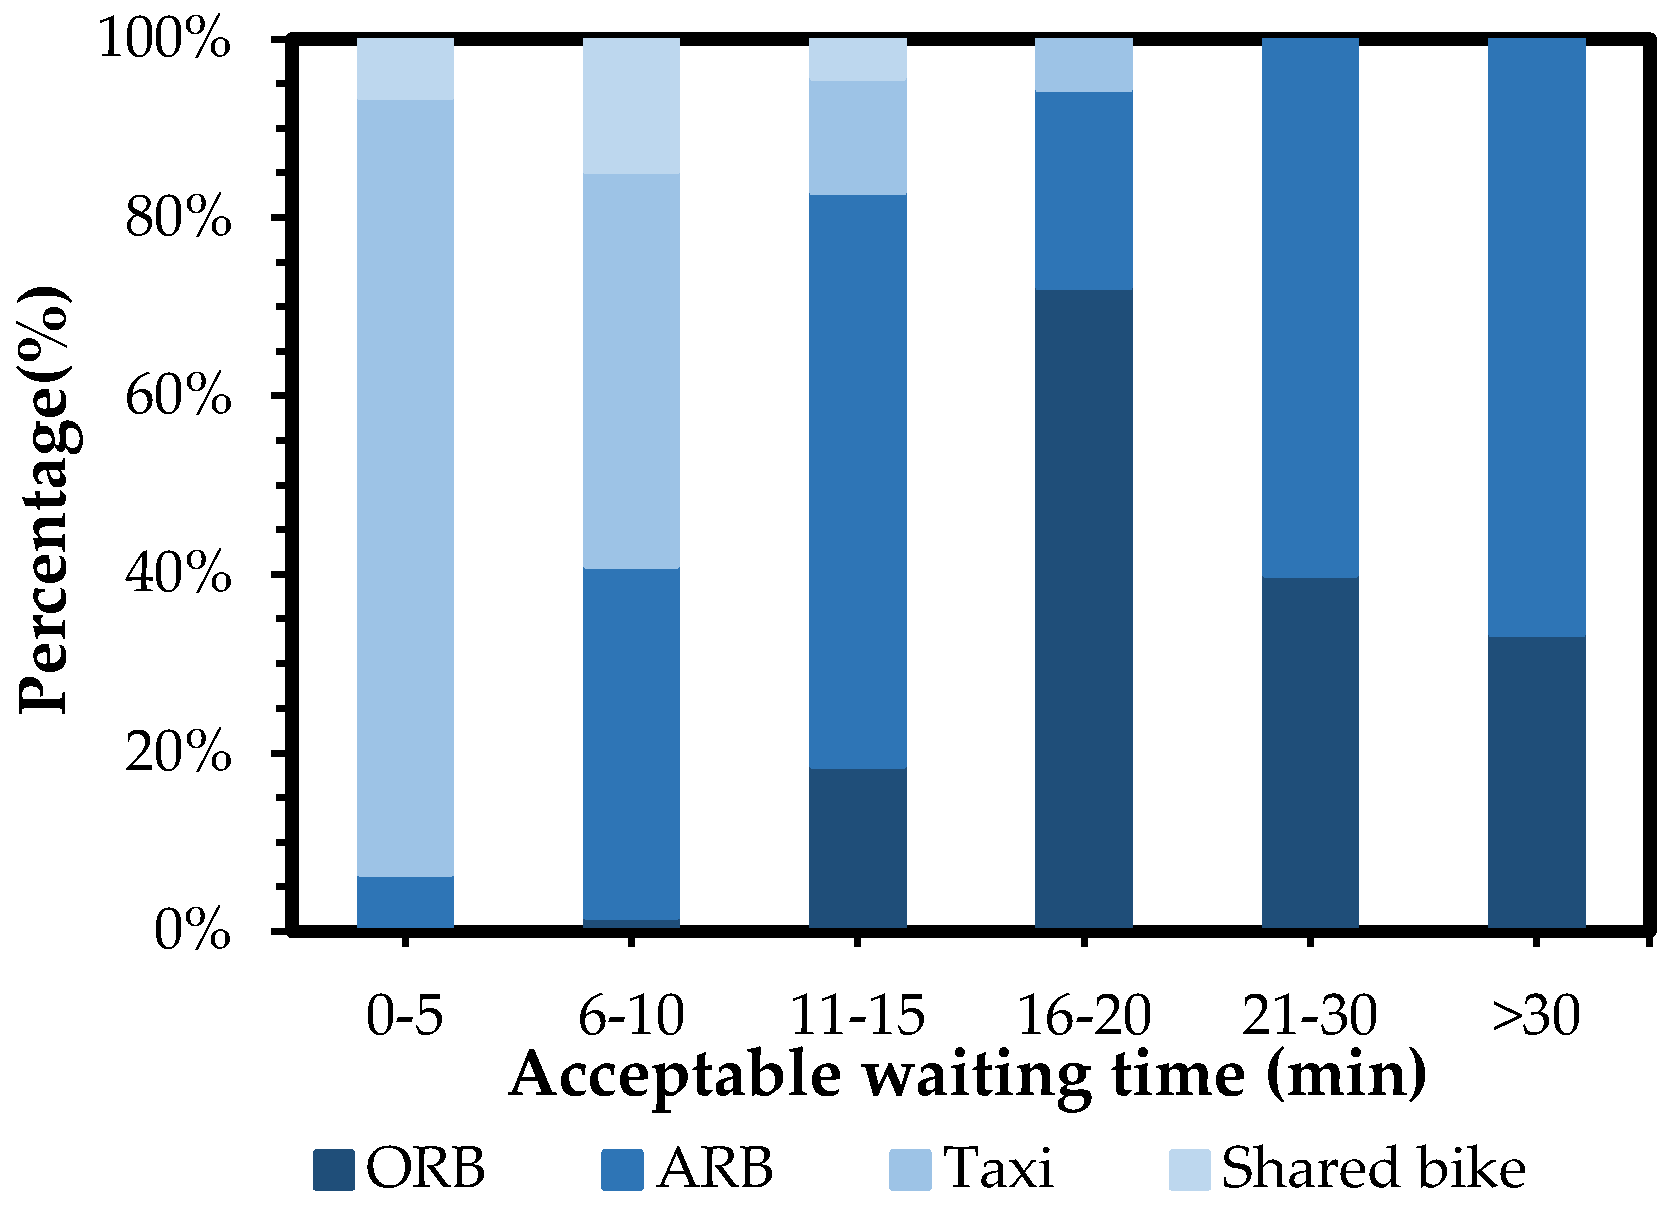
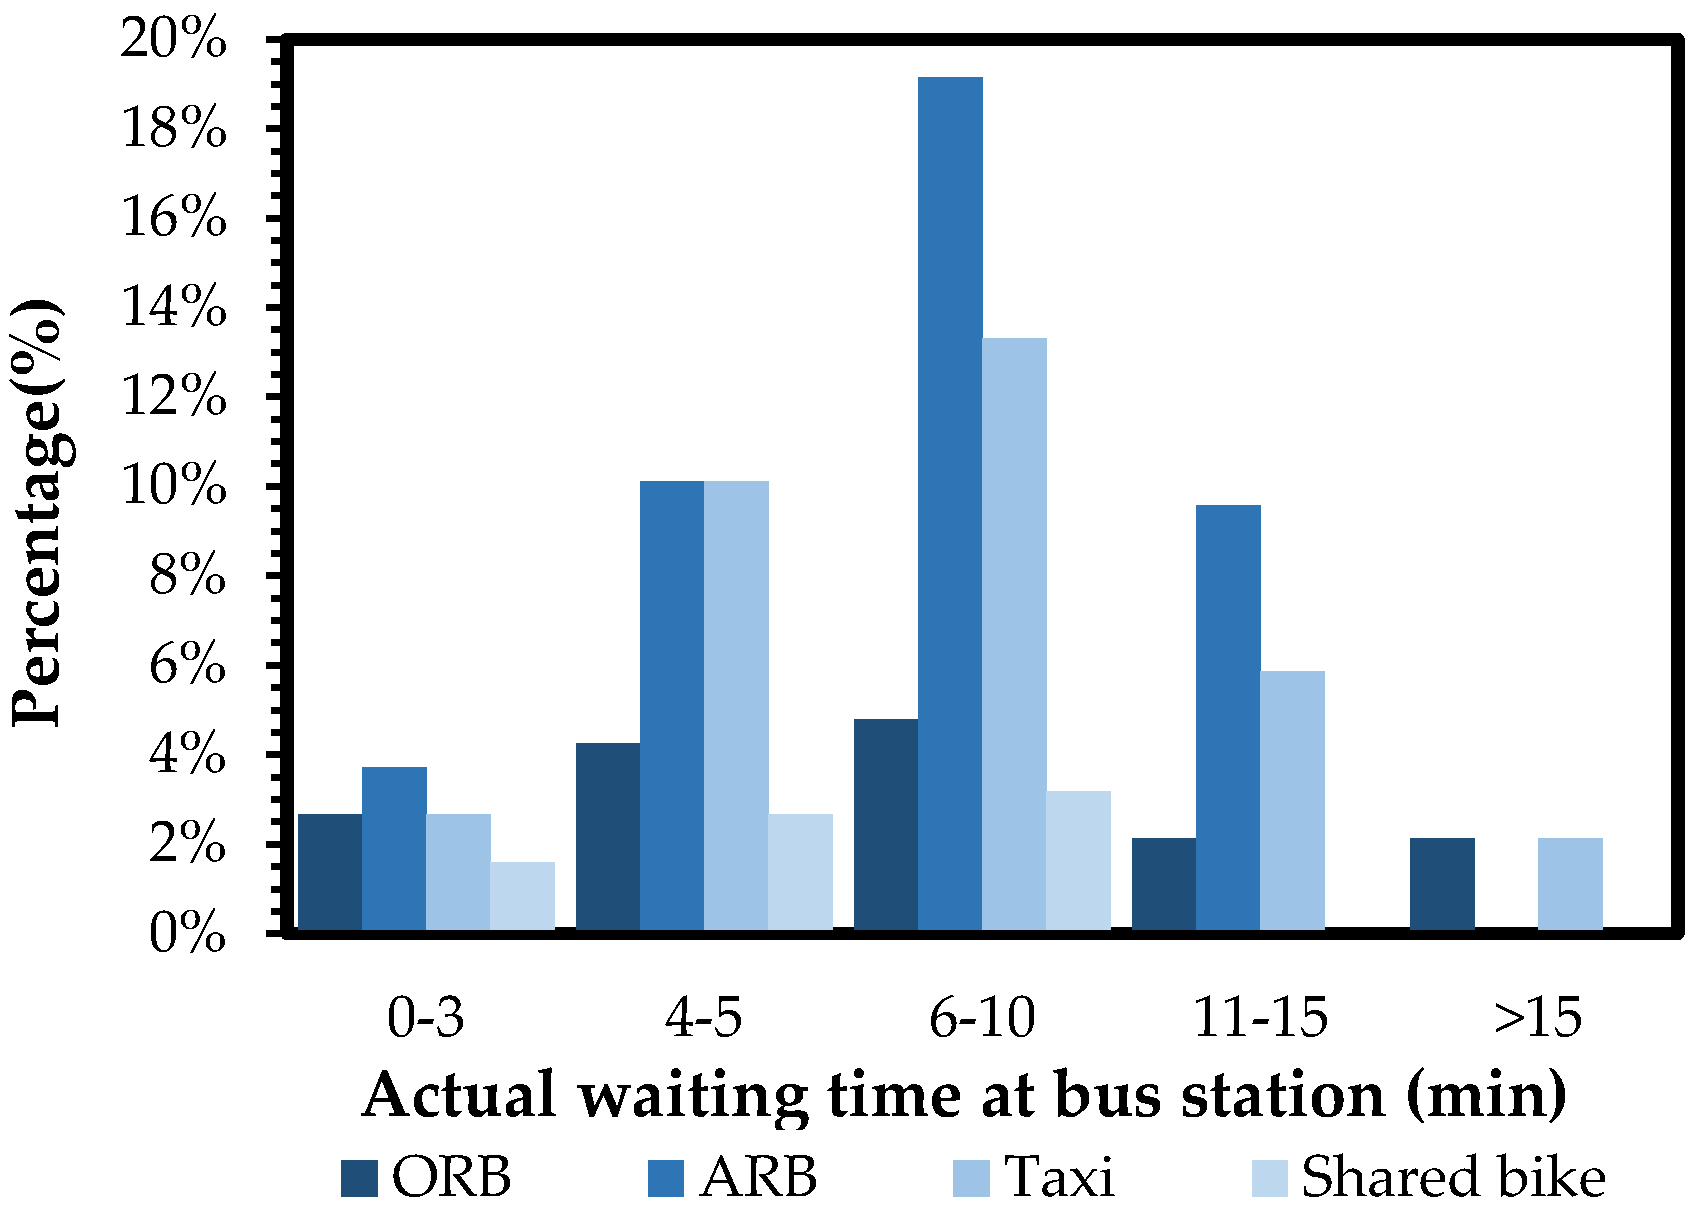
Passengers’ bus ride frequency and acceptable waiting time also have an influence on travel mode choice, as shown in Figure 8. The results show that the higher bus ride frequency, the greater probability of choosing public transport (ORB and ARB). It also can be seen in Figure 9 that passengers choosing private transport (such as taxi) have shorter acceptable waiting time than passengers choosing public transport. For example, for passengers whose longest acceptable waiting time is 5 or 10 min, 93.55% or more than 50% of the them will choose public transport. Bus travelers generally accept longer waiting times (even more than 30 min). As shown in Figure 10, 85.11% of passengers daily spend 4–15 min waiting at bus station. When the waiting time is 6–10 min, the proportion of passengers turn to choose the ARB reaches the highest.
When the overall bus satisfaction reached level 3, 56.32% of passengers (including 20.69% for ORB and 35.63% for ARB) continue waiting for buses as shown in Figure 11. When the comfort degree of waiting environment reaches level 4, the proportion is more than 50% in Figure 12. With the improvement of the overall bus satisfaction and comfort degree, the proportion of public transport gradually increases, showing passengers’ travel mode choice in waiting state will be affected by bus service level.
5. Results and Discussion
5.1. Reliability Analysis of Latent Variables
The -value of each index was calculated by SPSS 22.0 software, as shown in the Table 2.
In general, the higher the alpha coefficient is, the higher the reliability of the survey data is. When -value is within 0.6–0.7, it means the data reliability is acceptable; when it is within 0.7–0.8, it means the data reliability is high; and, when it is within 0.8–0.9, it means the data reliability is extremely high. The -value of each variable is greater than 0.7 and the total -value is 0.910, which indicate that the survey data is reliable [45].
5.2. Estimation Results of Passenger’s Satisfaction Degree Based on SEM Model
The load factor value of SEM was calculated using AMOS software. The output is listed in Figure 13, as well as the corresponding test results in Table 3.
Based on the load factor coefficients, the influence degree of latent variable on overall satisfaction degree can be ranked as flexibility, safety, convenience, comfort and economy, from highest to lowest.
The flexibility has the greatest impact on passenger’s overall satisfaction degree for service level of public transport, while it scores the lowest in Table 2, indicating that flexibility is badly in need of improvement in the satisfaction importance matrix. Combined with its specific observed variables, that means delay time during the trip, operation speed of the bus and the waiting time at bus station will significantly affect flexibility service level, and the standardized load factors are 0.761, 0.845 and 0.845 respectively, showing passengers pay more attention to the travel time cost and are more concerned on the extra time loss in travel process. Bus routes should be set as consistent as possible with the passengers’ travel routes, and the input of different capacity should also match the travel demand of the route to improve the overall operation efficiency of the ground bus system, and reduce the free-distance and uneconomical passenger-carrying mileage.
Passenger’s satisfaction degree and the attractiveness of public transport can be increased by improving the level of convenience, which can be mainly reflected by distance between home and bus station, distance between destination and bus station, and bus departure frequency. The standardized load factors are 0.673, 0.664 and 0.715, respectively. It reveals that long transfer distance and the resulting long transfer time are main factors preventing passenger’ willingness to transfer by public transport. Bus hub should be set up in the better location with direct lines to avoid making a detour, and the transfer distance and bus departure frequency can be shortened by reasonable organization design at the same time.
It is necessary to investigate whether the estimated parameters of the model are statistically significant during the model evaluation. Statistical significance tests were given to the load factors of the latent variable. Taking the second line and the last line in Table 3 as examples:
- The load factor of the latent variable “safety” to the observed variable “safety facilities” is 0.746, and the C.R. value is 10.948. The corresponding p value is less than 0.001, thus it can be considered that the factor has a significant difference with 0 at 99% confidence level.
- The load factor of the latent variable “economy” to the observation variable “overall satisfaction degree” is 0.152, and the C.R. value is 2.498. The corresponding p value is 0.013, thus it can be found that the probability of which the factor equals 0 is 1.3% at 95% confidence level.
All other load factors of the latent variables have passed the statistical significance tests except the latent variable “comfort”. The significance level of “comfort” on “overall satisfaction degree” is slightly higher, but the p value is 0.095 which is less than the significance level of 10%.
It is necessary to not only test the significance of each load factor, but also to analyze the whole fit accuracy [46]. The main fix indexes have reached compatible standards which indicates a better fit. Common goodness-of-fit [47] measures for a single model are shown in Table 4. Most SEM programs provide these measures together with their confidence intervals. Generally, the value of RMSEA and RMR for a good model should be less than 0.05 while the CFI, AGIF, CFI, NFI, IFI and TLI should be more than 0.90.
The analysis of path coefficients between each latent variable and overall satisfaction shows that they have a positive effect on overall satisfaction. The overall satisfaction can be formulated as Equation (8).
Each latent variable of SEM can be calculated according to the Equations (2)–(5). The equations of fitness values are given as follows:
5.3. Estimation Results of SEM-Logit Integration Model
According to the survey data and previous assumptions, the fitness value of each latent variable obtained in Equations (9)–(13), together with passenger’s individual characteristics and trip related characteristics, were substituted into the Logit model. Cross-contingency table and correlation analysis were used to filter the survey data [48]. The data are statistically related when r ≥ 0.6, and the data are highly correlated when r ≥ 0.8. The SEM-Nested Logit model was calibrated by Trans CAD software. Table 5 shows the estimation results and related test values.
The goodness of fit is the index of evaluation of disaggregate model, ranging from 0 to 1. The larger the value is, the higher the accuracy of the model is. In practice, it indicates an accurate model when is within 0.2–0.4 [49]. The of the models in Table 4 are 0.527, 0.853 and 0.854, respectively, which shows the accuracy of the model is high and the model can be used to describe the travel mode choice behaviors of passengers waiting at bus station.
For the up level model, the gender factor has a significant impact on mode choice. The ratio of continuing to choose public transport is EXP (1.126083) = 3.083555 times as that of private transport for a male passenger in the case of unpredictable bus arrival time. The coefficient of monthly income and education level is negative which indicates that the passenger with higher monthly income and education level has greater tendency to private transport. When the bus arrival time is unpredictable, passengers traveling for commute or family obligations are more willing to take a taxi or ride a bike compared with passengers for shopping and leisure. The coefficient of acceptable waiting time is positive, which indicates the longer acceptable waiting time is, the more likely to substitute a public transport. The coefficient of safety, comfort and convenience service level are positive, revealing that higher bus satisfaction degrees including safety, comfort and convenience show a higher tendency to choose public transport when traveling.
For the low level model, the vehicle ownership has a significant impact on the results. The ratio of choosing taxi or car-hailing service is EXP (4.233176) = 68.93583 times that of other travel modes for a passenger with private cars in that case. The coefficient of monthly income is positive which indicates that high-income passengers prefer to choose a taxi instead of continue waiting for public transport or cycling to shared bike compared with low-income passengers. The coefficient of trip purpose is positive which means the probability of commuters considering a taxi is EXP (2.820997) = 16.79359 times as that of other modes.
5.4. Sensitivity Analysis of Variables
To quantitatively analyze the impact of various factors on the probability of passengers’ mode choices, sensitivity analysis of the variable was developed assuming that other factors in the model remain unchanged. It is usually expressed by the elastic coefficient E, which measures the relative degree of change of the dependent variable caused by the unit change of an explanatory variable, which equals to the ratio of the change rates of these two variables.
For the MNL model, the point elasticity equation is shown in Equation (14).
For the NL model, the point elasticity Equation is shown in Equation (15) according to Equation (8).
In the up level model, the point elasticity values and probabilities of public transport were calculated with Equation (14), with the changing level of safety and convenience while the other variables remained unchanged [50]. The results show that the public transport probability is increasing with the rise of both safety and convenience level in Figure 14 and Figure 15.
When the safety satisfaction is below level 4, the probability of choosing public transport is less than 50%, as shown in Figure 14, indicating passengers are more willing to choose private transport. The point elasticity value is bigger than 1, which means the probability of choosing public transport is elastic for safety level. When it is above level 4, the probability change of choosing public transport is tiny and the probability of choosing public transport is more than 98%. The point elasticity value is less than 1, which means the probability is inelastic for safety level. When the convenience satisfaction improves from level 2 to level 3, as shown in Figure 15, the probability of choosing public transport increases rapidly from 16.19% to 85.02%, and the point elasticity decreases from 2.83 to 0.76, indicating that the probability of public transport is elastic for level 2, and then becomes inelastic for level 3. The probability changes little and the point elasticity value is less than 1 from level 3 to level 5 of convenience, indicating it is inelastic.
Figure 16 shows the transition probability of the passengers transferring from private transport to public transport with the increasing by one level of bus safety, convenience, and comfort service. It can be seen that the transition probabilities reach the highest point, respectively, as 69.85%, 68.84% and 35.51% when safety service reaches level 4, or convenience service reaches level 3, or comfort service reaches level 2, indicating that the safety level equals to 4, convenience level equals to 3 and comfort level equals to 2 are the key threshold to increase the public transport mode share. There are some proposals for sustainable development of the public transport:
- Establish an effective and timely network prevention system. It is necessary to strengthen the construction of information sharing platform between public security organization and public transport enterprises, which can timely predict and accurately handle all types of emergencies.
- Provide more safety facilities (e.g., safety hammers, fire extinguishers, and emergency escape devices) and meet the travel needs of disadvantage group. The path analysis of the SEM model shows that the fitness value for Y1 on η1 is 0.305 in Equation (9), which reveals that passengers’ travel mode choice behavior can be influenced by safety facilities service level of the public transport.
- Integrate bus ticket system. Additional charges for transfer also affects the attractiveness of public transport. Passengers’ bus travel costs can be reduced through the integration of fares in transition operation design, which is also conducive to multi-level bus routes optimization.
- Create a comfortable bus travel environment, including waiting environment at bus station (i.e., comfort sheltering design, abundant passenger information system and necessary waiting hardware facilities), carriage environment (i.e., comfort seats, handrails and overloading is strictly forbidden) and road operating environment (e.g., increase the bus exclusive -roads and improve bus operation speed). The mode share of public transport can be effectively increased by improving its comfort service level.
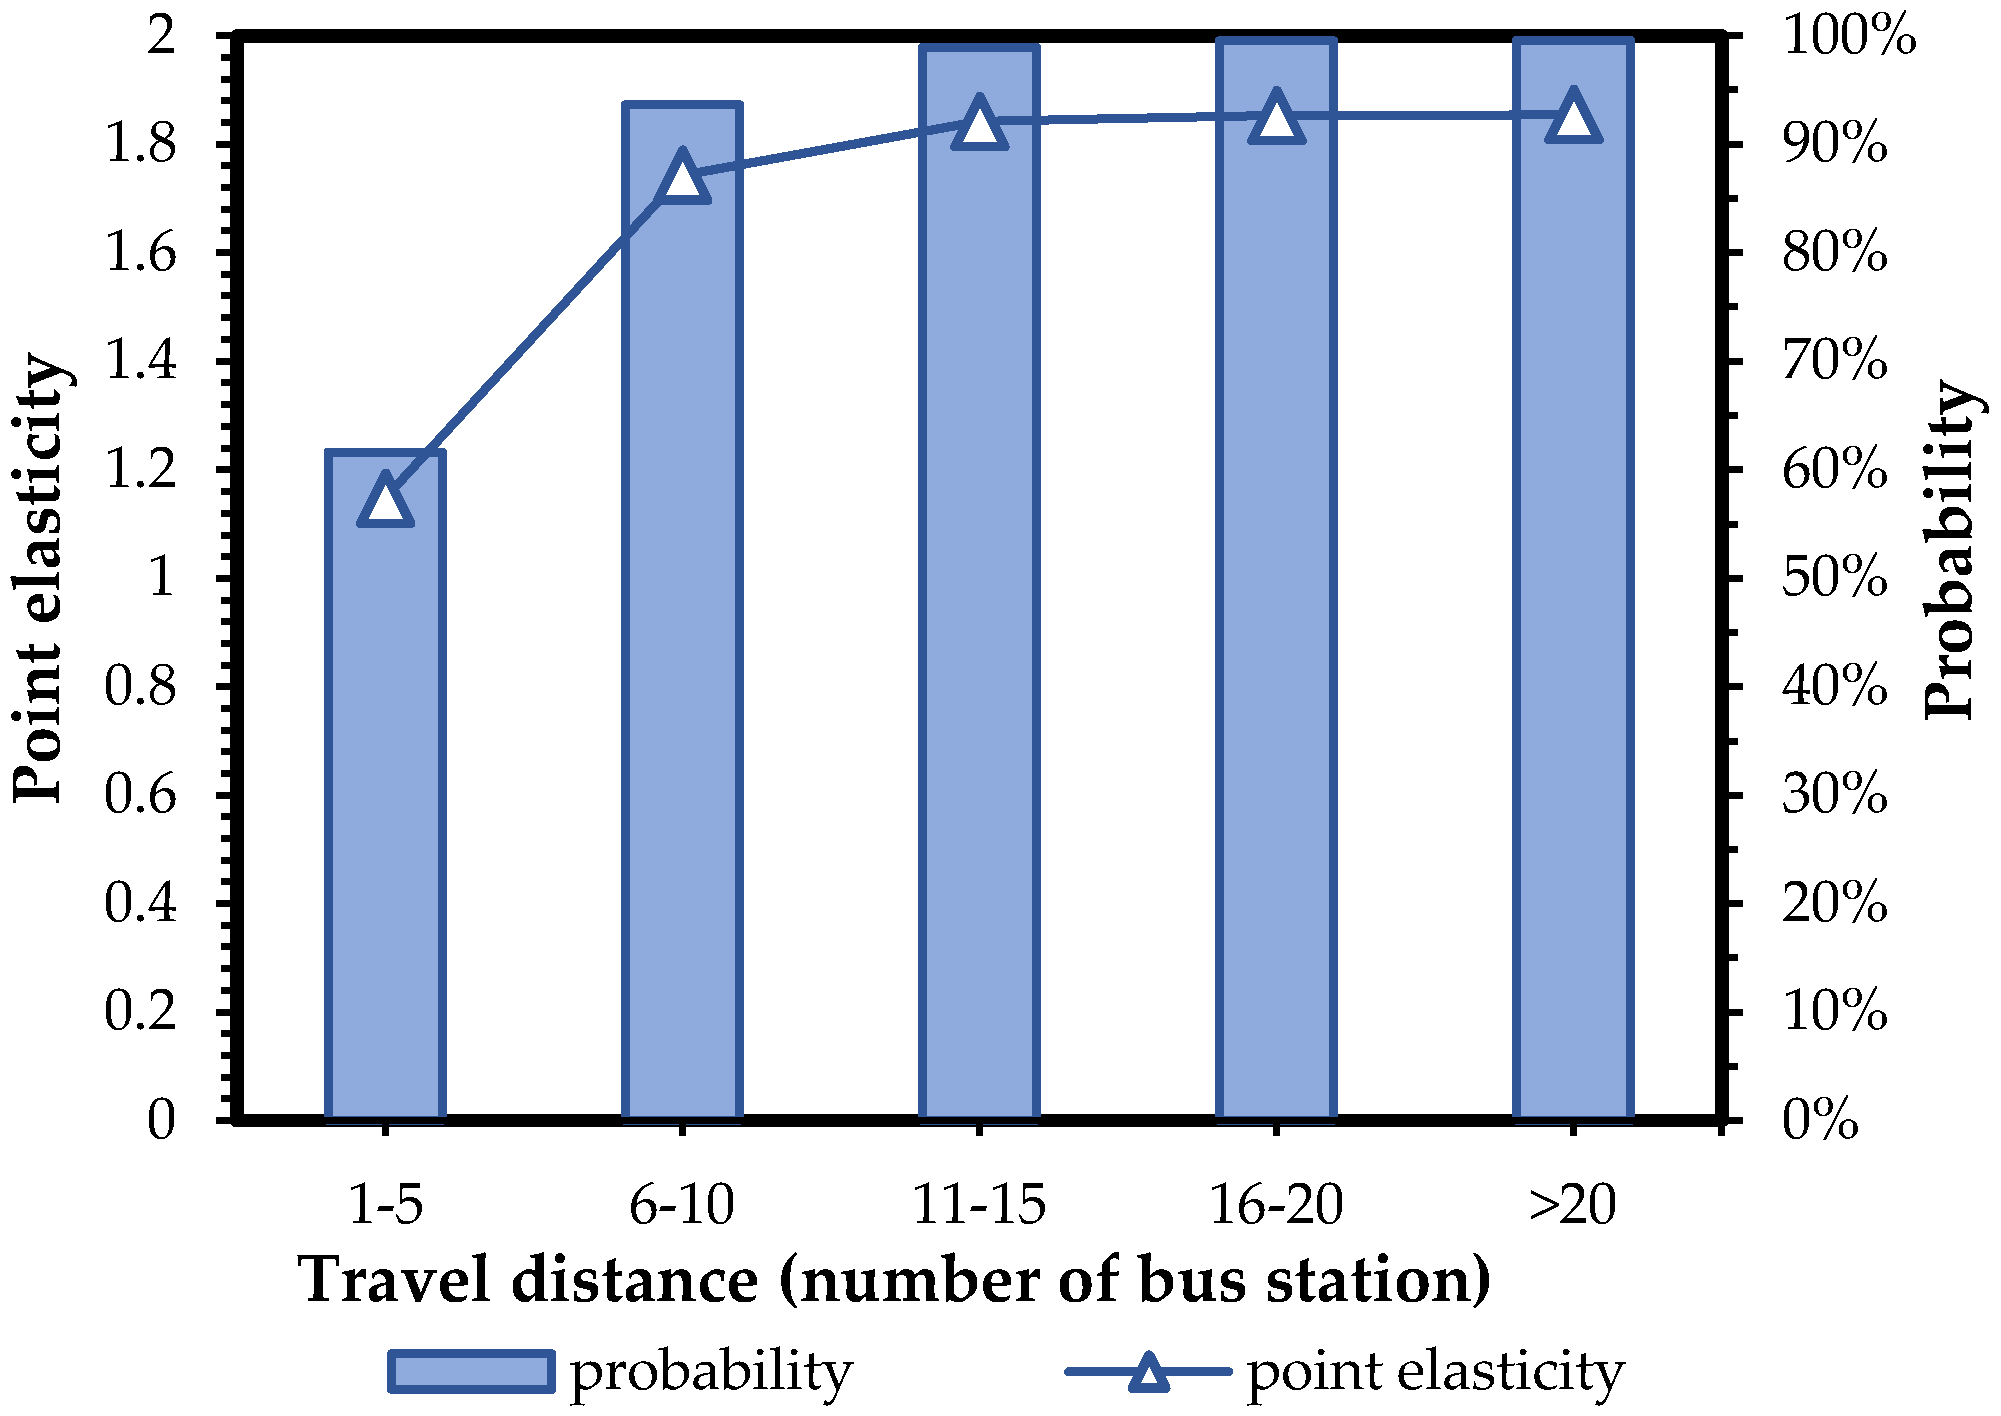
In the low level model, the influence of travel distance on the probability of choosing ARB was analyzed. The corresponding point elastic value and choice probability value were calculated, respectively, by Equation (15), as shown in Figure 17. The point elasticity value is always larger than 1 no matter how travel distance changes. The probability of choosing ARB is elastic for the travel distance and its increase has a great impact on that travel mode. The possible reason is that the longer travel distance, the higher the economic cost. Passengers choosing to transfer to other routes bus can relatively both save some travel costs and time cost in the case of bus delays.
6. Conclusions
This study explored the possible causal relationships among the personal waiting behavior, attitudes to bus service satisfaction and travel mode choice of passengers waiting at bus station. The mechanism of passengers’ decision-making procedure of travel mode choice waiting at bus station was analyzed. A questionnaire was designed and carried out and the data were analyzed using a SEM-NL methodology. Whether explicit and latent influencing factors have significant impact on passengers’ travel mode choice behavior based on the SEM-Logit integration model was verified. SEM method analysis showed that the influence level of the latent variables to the service level of public transport, and the flexibility was the most significant variable affecting bus service satisfaction followed by safety, convenience, comfort and economy.
The results of SEM-NL model reveal that some variables such as gender, monthly income, trip purpose, travel distance, and bus safety and convenience significantly influence the choice of up model (public transport or private transport); some variables such as age, vehicle ownership, and bus ride frequency have great influence on the choice of low level model (ORB, ARB, Taxi and Shared bike). Specifically, for variable characteristics, some important findings have been obtained: Firstly, passengers with higher monthly income and education level are obviously more likely to choose private transport, especially taxi or car-hailing. Secondly, higher bus satisfaction degree including safety, comfort and convenience shows a higher tendency to choose public transport when traveling. Then, the vehicle ownership has a significant impact on choice results. The ratio of choosing taxi or car-hailing service is approximately 69 times as that of other travel modes for a passenger with private cars in that case. Finally, travel distance was sensitive to ARB, while passengers with longer travel distance would more likely choose ARB. Sensitivity analysis reveals that the more passengers were satisfied with the service level of public transport, the more likely they would be to choose them. It can be seen that the transition probabilities from private transport to public transport reach the highest point (respectively, 69.85%, 68.84% and 35.51%) when safety service reaches level 4, convenience service reaches level 3, or comfort service reaches level 2, indicating that the safety level equal to 4, convenience level equal to 3 and comfort level equal to 2 are the key threshold to increase the public transport mode share.
According to the results of path analysis and sensitivity analysis, public transport must provide a higher service quality to ensure its dominance in transportation and avoid the loss of passenger flow caused by various reasons. Some proposals for sustainable development of the public transport have been proposed considering safety, convenience, comfort, flexibility and economy of bus service level. For example, the mode share of public transport can be effectively increased by ensuring good accessibility of public transport, shortening the transfer distance of different bus routes, and creating a comfortable bus travel environment, including waiting environment at bus station, carriage environment and road operating environment; it is practicable to increase the number of safety facilities on carriage and meeting the travel needs of disadvantage group to enhance passenger’s sense of security; and optimizing the public transport network and integrate bus ticket system from the needs of passengers is also indispensable for establishing a better sustainable public transport.
The application of integration model in further examples and practical effects remains to be studied. In the next step, it is practical and reasonable to consider from the charging prices of different travel modes, the weather condition and other latent variables in traveling.
Author Contributions
The individual responsibilities and contribution of the authors are listed as follows: Y.H. designed the research, developed the model and wrote the paper; W.L. collected and analyzed the data, conducted the model validation, and guided the research process; S.W. revised the manuscript, provided some comments, and helped edit the manuscript; and T.Z. edited the manuscript and gave some comments on the case study.
Acknowledgments
This research was supported by the National Natural Science Foundation of China (Grant No. 51308015), Project of Science and Technology Plan of Beijing Municipal Education Commission (No. KM201510005023), the Exploration Project of BJUT’s Traffic Engineering Research (Base2017BJUT-JTJD001) and National Natural Science Foundation of China (Key Program, Grant No. 513300088). The authors are very grateful for the comments from the anonymous reviewers. The authors would like to thank one anonymous referee for his or her helpful comments and suggestion, which improved the content and composition substantially. The authors are also grateful for the editor’s and the anonymous reviewers’ comments and time.
Conflicts of Interest
The authors declare no conflict of interest.
References
- Bhouri, N.; Mayorano, F.J.; Lotito, P.A.; Salem, H.H.; Lebacque, J.P. Public Transport Priority for Multimodal Urban Traffic Control. Cybern. Inf. Technol. 2015, 15, 17–36. [Google Scholar] [CrossRef] [Green Version]
- Wu, J.; Yang, M. Assessment of Passenger Satisfaction with Urban Bus Service Quality Using Bayesian Networks. J. Southeast Univ. 2017, 47, 1042–1047. [Google Scholar]
- Wang, Y.; Yan, X.; Zhou, Y.; Xue, Q. Influencing Mechanism of Potential Factors on Passengers’ Long-Distance Travel Mode Choices Based on Structural Equation Modeling. Sustainability 2017, 9, 1943. [Google Scholar] [CrossRef]
- Gruyter, C.D.; Currie, G.; Rose, G. Sustainability Measures of Urban Public Transport in Cities: A World Review and Focus on the Asia/Middle East Region. Sustainability 2016, 9, 43. [Google Scholar] [CrossRef]
- Takada, K.; Kobayashi, M. Analysis on Choice behavior of railway passengers when railway service stops. Infrastruct. Plan. Rev. 2010, 25, 763–768. [Google Scholar] [CrossRef]
- Zhang, Y. Influence of PIS on Passengers Waiting Behavior in Urban Rail Platform. Master’s Thesis, Beijing Jiaotong University, Beijing, China, 2014. [Google Scholar]
- Wu, H. Research of Multi-Modal Transit Scheduling Model Based on Passengers’ Waiting Behavior. Master’s Thesis, Harbin Institute of Technology, Harbin, China, 2016. [Google Scholar]
- Abane, A. Mode Choice for the Journey to Work among Formal Sector Employees in Accra, Ghana. J. Transp. Geogr. 1993, 1, 219–229. [Google Scholar] [CrossRef]
- Maria, V.C.; Umberto, G.; Antonio, M.; Michele, T. A European Vision for More Environmentally Friendly Buses. Transp. Res. Part D 2016, 45, 48–63. [Google Scholar]
- Maria, V.C.; Umberto, G.; Antonio, M.; Michele, T. A New Generation of Buses to Support More Sustainable Urban Transport Policies: A Path towards “Greener” Awareness among Bus Stakeholders in Europe. Res. Transp. Econ. 2016, 55, 20–29. [Google Scholar]
- Yao, L.; Sun, L.; Guan, H. Study on Modal Split Method Based on Nested Logit Model. J. Wuhan Univ. Technol. 2010, 34, 738–741. [Google Scholar]
- Zulqarnain, H.K.; Mark, J.M.; John, S.M.; Michael, D.F. Using New Mode Choice Model Nesting Structures to Address Emerging Policy Questions: A Case Study of the Pittsburgh Central Business District. Sustainability 2017, 9, 2120. [Google Scholar] [Green Version]
- Ben-Akiva, M.; Mcfadden, D.; Train, K.; Walker, J.; Bhat, C.; Bierlaire, M. Hybrid Choice Model: Progress and Challenge. Mark. Lett. 2002, 13, 163–175. [Google Scholar] [CrossRef]
- Johansson, M.V.; Heldt, T.; Johansson, P. The Effects of Attitudes and Personality Traits on Mode Choice. Transp. Res. Part A 2006, 40, 507–525. [Google Scholar] [CrossRef]
- Ji, Y.; Zhou, Y.; Gao, L.; Hu, B. Evaluation of Passenger Satisfaction Based on Structural Equation Modeling Approach. J. Transp. Eng. Inf. 2016, 14, 7–12. [Google Scholar]
- Habib, K.M.N.; Zaman, H. Effects of Latent and Attitudinal Information in Mode Choice Models. Transp. Plan. Technol. 2012, 35, 561–576. [Google Scholar] [CrossRef]
- Ekstrom, E.; Lotstedt, P.; Tysk, J. Boundary Values and Finite Difference Methods for the Single Factor Term Structure Equation. Appl. Math. Financ. 2009, 16, 253–259. [Google Scholar] [CrossRef]
- Yan, H.; Wang, X.; Liang, W.; Kong, L. Commute Traffic Mode Choice Based on Structural Equation Model. J. Beijing Univ. Technol. 2015, 41, 590–596. [Google Scholar]
- Gan, Z. Travel Mode Choice Behavior Analysis for Migrant Workers. Master’s Thesis, Chang’an University, Xi’an, China, 2015. [Google Scholar]
- Cheng, J. Research on Theory and Application of Travel Behavior and Urban Public Transit Pricing. Ph.D. Thesis, Southwest Jiaotong University, Chengdu, China, 2012. [Google Scholar]
- Cheng, J.; Yan, Q.; Yang, F.; Hu, J. Timing Optimization of Traffic Signals for Emergency Evacuation in Sudden-0nset Disasters. J. South China Univ. Technol. 2013, 41, 51–57. [Google Scholar]
- Peng, K. Research on Setting Method of Stereoscopic Parking Facilities in the Older Residential Areas. Master’s Thesis, Chongqing Jiaotong University, Chongqing, China, 2015. [Google Scholar]
- Bielen, F.; Demoulin, N. Waiting Time Influence on The Satisfaction-Loyalty Relationship in Services. Manag. Serv. Qual. 2007, 17, 174–193. [Google Scholar] [CrossRef]
- Butcher, K.; Kayani, A. Waiting for Service: Modeling the Effectiveness of Service Interventions. Serv. Bus. 2008, 2, 153–165. [Google Scholar] [CrossRef]
- Geng, J.; Long, R.; Chen, H.; Yue, T.; Li, W.; Li, Q. Exploring Multiple Motivations on Urban Residents’ Travel Mode Choices: An Empirical Study from Jiangsu Province in China. Sustainability 2017, 9, 136. [Google Scholar] [CrossRef]
- Xue, Y.; Guan, H.; Corey, J.; Wei, H.; Yan, H. Quantifying a Financially Sustainable Strategy of Public Transport: Private Capital Investment Considering Passenger Value. Sustainability 2017, 9, 269. [Google Scholar] [CrossRef]
- Train, K.E. Discrete Choice Methods with Simulation; Cambridge University Press: Cambridge, UK, 2009. [Google Scholar]
- Louviere, J.J.; Hensher, D.A.; Swait, J.D. Stated Choice Methods: Analysis and Applications; Cambridge University Press: Cambridge, UK, 2000. [Google Scholar]
- Cao, X.; Liang, F.; Chen, H.; Liu, Y. Circuity Characteristics of Urban Travel Based on GPS Data: A Case Study of Guangzhou. Sustainability 2017, 9, 2156. [Google Scholar] [Green Version]
- Yanez, M.F.; Raveau, S.; de D Ortuzar, J. Inclusion of Latent Variables in Mixed Logit Models: Modeling and Forecasting. Transp. Res. Part A Policy Pract. 2010, 44, 744–753. [Google Scholar] [CrossRef]
- Woo, J.; Jang, J.; Moon, H.; Lee, J. Analyzing Public Preference and Willingness to Pay for Spent Nuclear Fuel Facilities in South Korea: A Latent Class Approach. Prog. Nucl. Energy 2017, 100, 255–265. [Google Scholar] [CrossRef]
- Golob, T.F. Structural Equation Modeling for Travel Behavior Research. Transp. Res. Part B Methodol. 2003, 37, 1–25. [Google Scholar] [CrossRef]
- Okan, B.; Qi, Q.; Mark, J.G. A Structural Equation Modeling Approach for Examining Position Effects in Large-Scale Assessments. Large-Scale Assess. Educ. 2017, 5, 8. [Google Scholar]
- Roorda, M.J.; Ruiz, T. Long- and Short-Term Dynamics in Activity Scheduling: A Structural Equations Approach. Transp. Res. Part A 2008, 42, 545–562. [Google Scholar] [CrossRef]
- Shi, L. SPSS19.0 Statistical Analysis: From Introduction to Mastery; Tsinghua University Press: Beijing, China, 2013. [Google Scholar]
- Jia, X.; Liu, L. Comparing the Structural Equation Model with the Simultaneous Equation Model. Appl. Stat. Manag. 2008, 27, 439–446. [Google Scholar]
- Guan, H.Z. The theoretical foundation of disaggregate model. In Disaggregate Model—A Tool for Traffic Behavior Analysis; China Communication Press: Beijing, China, 2004; pp. 16–17. [Google Scholar]
- McFadden, D. Conditional Logit Analysis of Qualitative Choice Behavior. In Frontiers of Econometrics; Zarembka, P., Ed.; Academic Press: New York, NY, USA, 1974; pp. 105–142. [Google Scholar]
- Ling, S. Structural Equation Model Theory and AMOS Application; Central China Normal University Press: Wuhan, China, 2008. [Google Scholar]
- Wu, M.L. Structural Equation Model: Operation and Application of AMOS, 2nd ed.; Chongqing University Press: Chongqing, China, 2010. [Google Scholar]
- Georggi, N.L.; Pendyala, R.M. Analysis of Long-Distance Travel Behavior of the Elderly and Low Income. Transp. Res. Circ. 2012, E-C026, 121–150. [Google Scholar]
- Kim, S.; Ulfarsson, G.F. Travel Mode Choice of the Elderly: Effects of Personal, Household, Neighborhood, and Trip Characteristics. Transp. Res. Rec. 2004, 1894, 117–126. [Google Scholar] [CrossRef]
- Santos, G.; Maoh, H.; Potoglou, D.; von Brunn, T. Factors Influencing Modal Split of Commuting Journeys in Medium-Size European Cities. J. Transp. Geogr. 2013, 30, 127–137. [Google Scholar] [CrossRef]
- Shen, W.; Xiao, W. Passenger Satisfaction Evaluation Model for Urban Rail Transit: A Structural Equation Modeling Based on Partial Least Squares. J. Wuhan Univ. Technol. 2015, 37, 48–56. [Google Scholar] [CrossRef]
- Zhang, B.; Zeng, M.H.; Chen, Q.Y.; Hu, Q.Z. Study of Urban Public Transport the Service Quality-Satisfaction-Loyalty Based on Structural Equation Modeling. J. Appl. Stat. Manag. 2016, 35, 198–205. [Google Scholar]
- Steiger, J.H.; Lind, J.C. Statistically Based Tests for the Number of Common Factors. Available online: http://ci.nii.ac.jp/naid/10011513263/ (accessed on 5 May 2018).
- Tanaka, J.S. How Big is Big Enough? Sample Size and Goodness of Fit in Structural Equation Models with Latent Variables. Child Dev. 1987, 58, 134–146. [Google Scholar] [CrossRef]
- Duan, M.; Yang, Z.; Zhang, L.; Yu, D. Residential Parking Spaces Shared Capability Assessment Model. J. Transp. Syst. Eng. Inf. Technol. 2015, 15, 106–117. [Google Scholar]
- Qin, H.; Gao, J.; Zhang, G.; Chen, Y.; Wu, S. Nested Logit Model Formation to Analyze Airport Parking Behavior Based on Stated Preference Survey Studies. J. Air Transp. Manag. 2017, 58, 164–175. [Google Scholar] [CrossRef]
- Wu, W.; Shuai, B.; Yin, H.; Wu, P. Study of Travel Behavior by Car Based on BL Model. J. Transp. Eng. Inf. 2012, 10, 71–74. [Google Scholar]
Figure 1.
Passengers’ psychological fluctuations in waiting state.
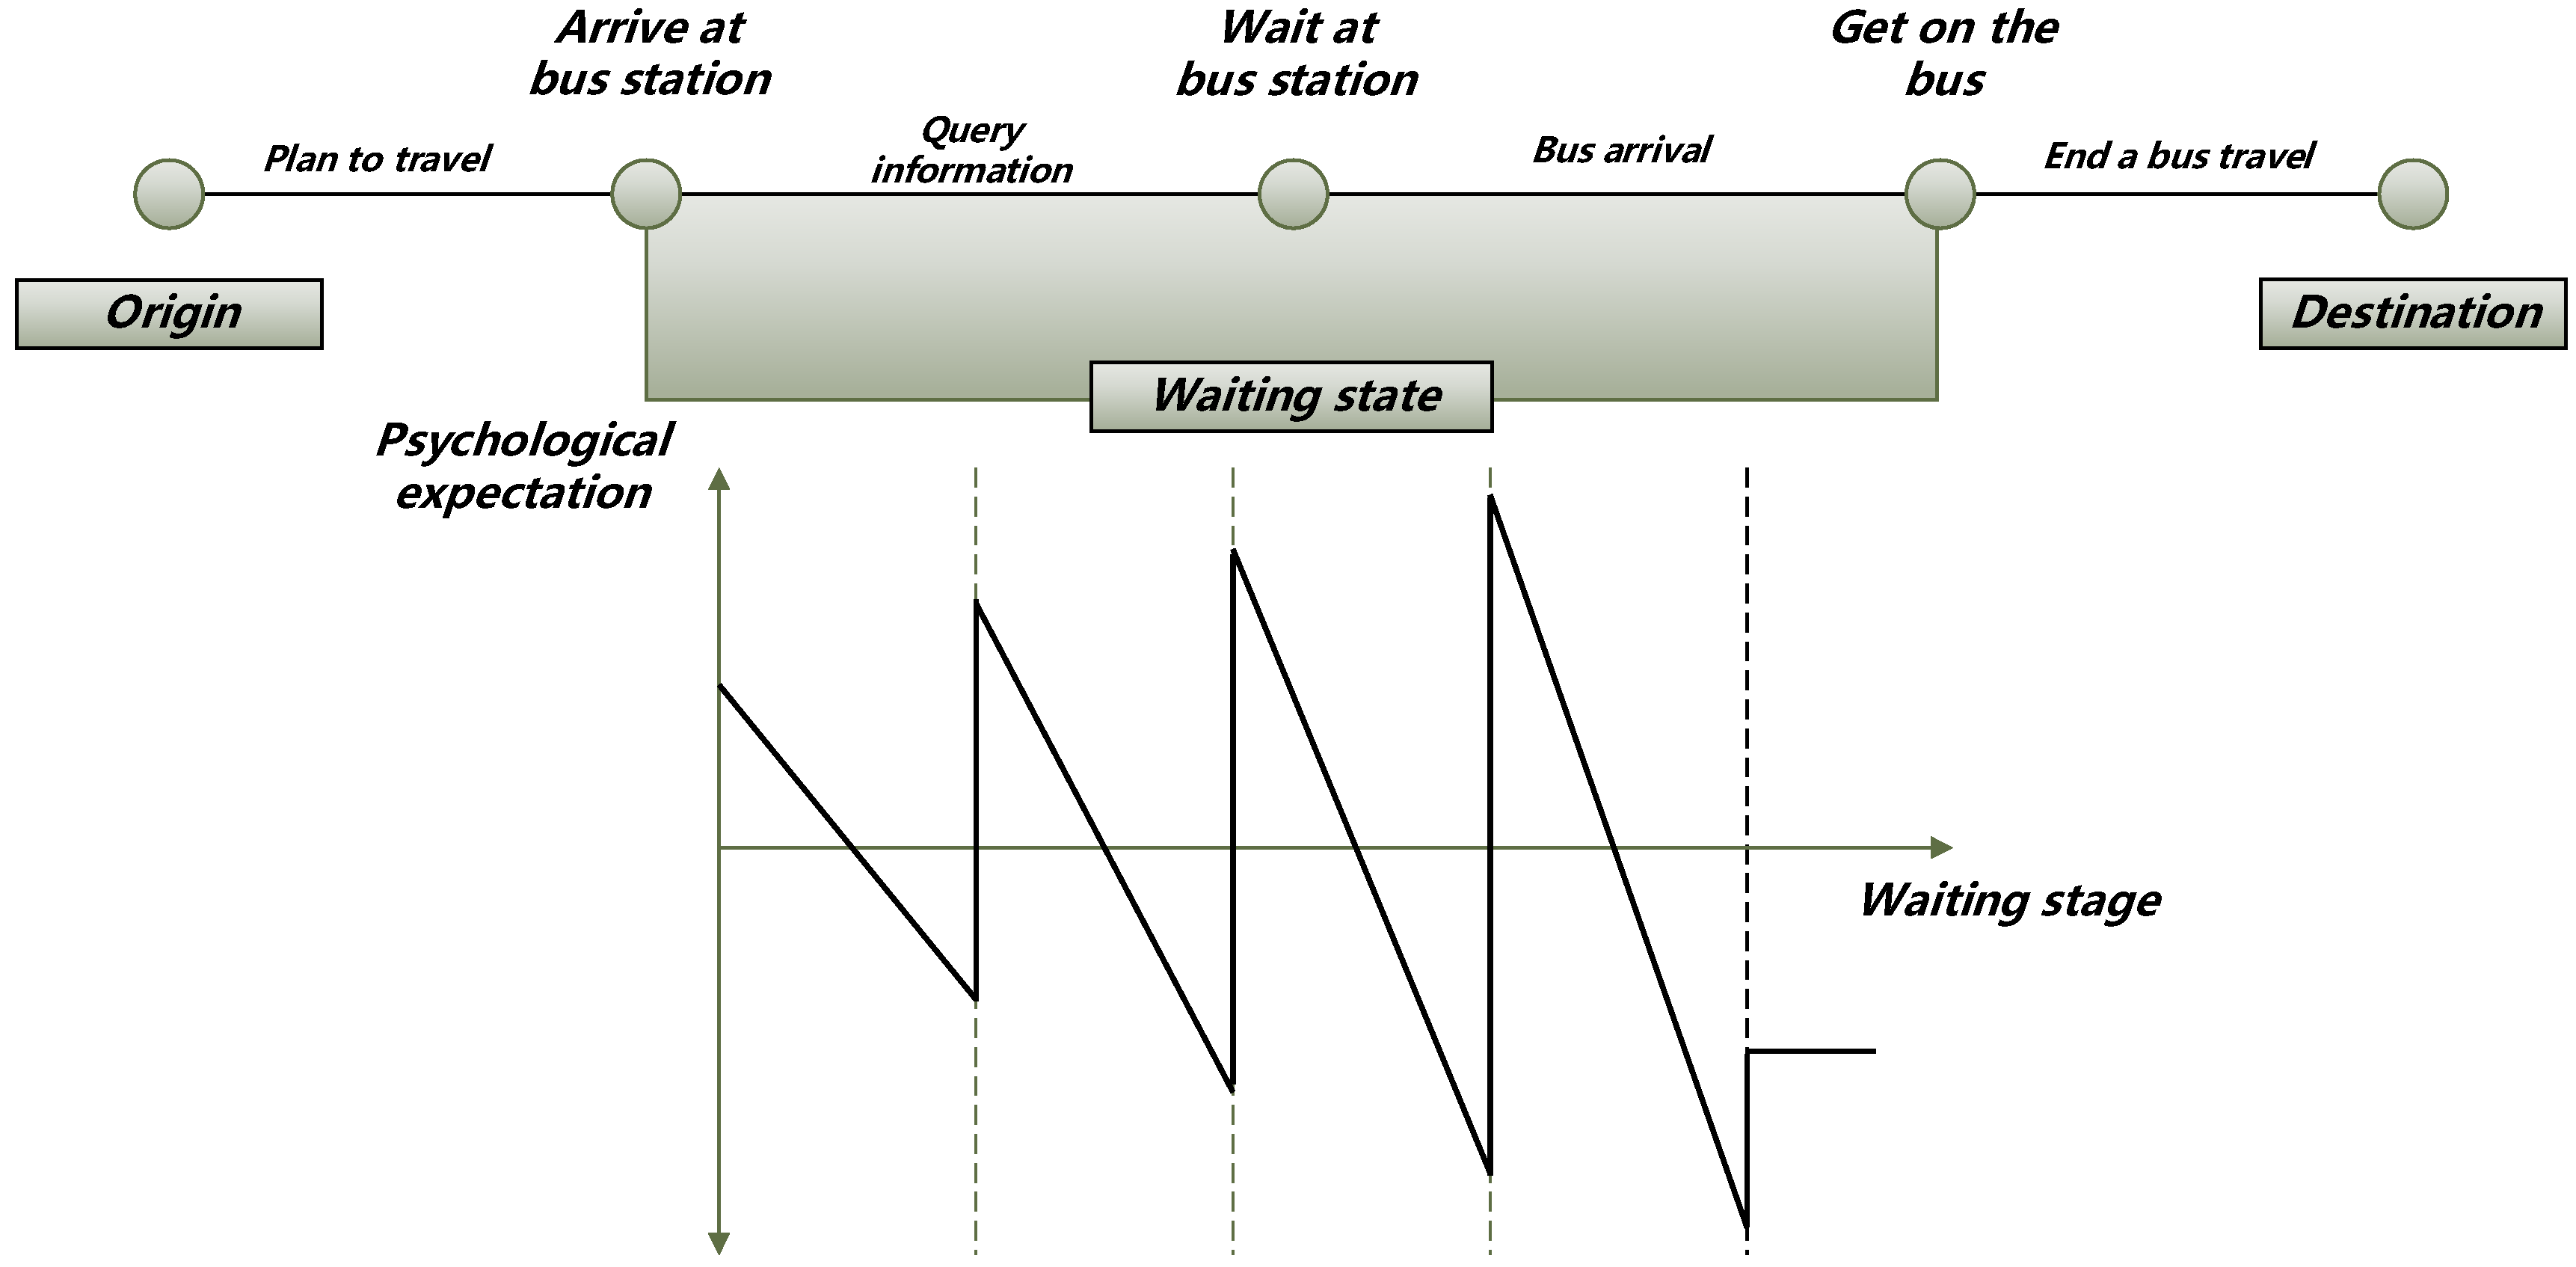
Figure 2.
Mechanism analysis of passengers’ decision-making procedure.

Figure 3.
Influence factors of travel mode choice behavior.
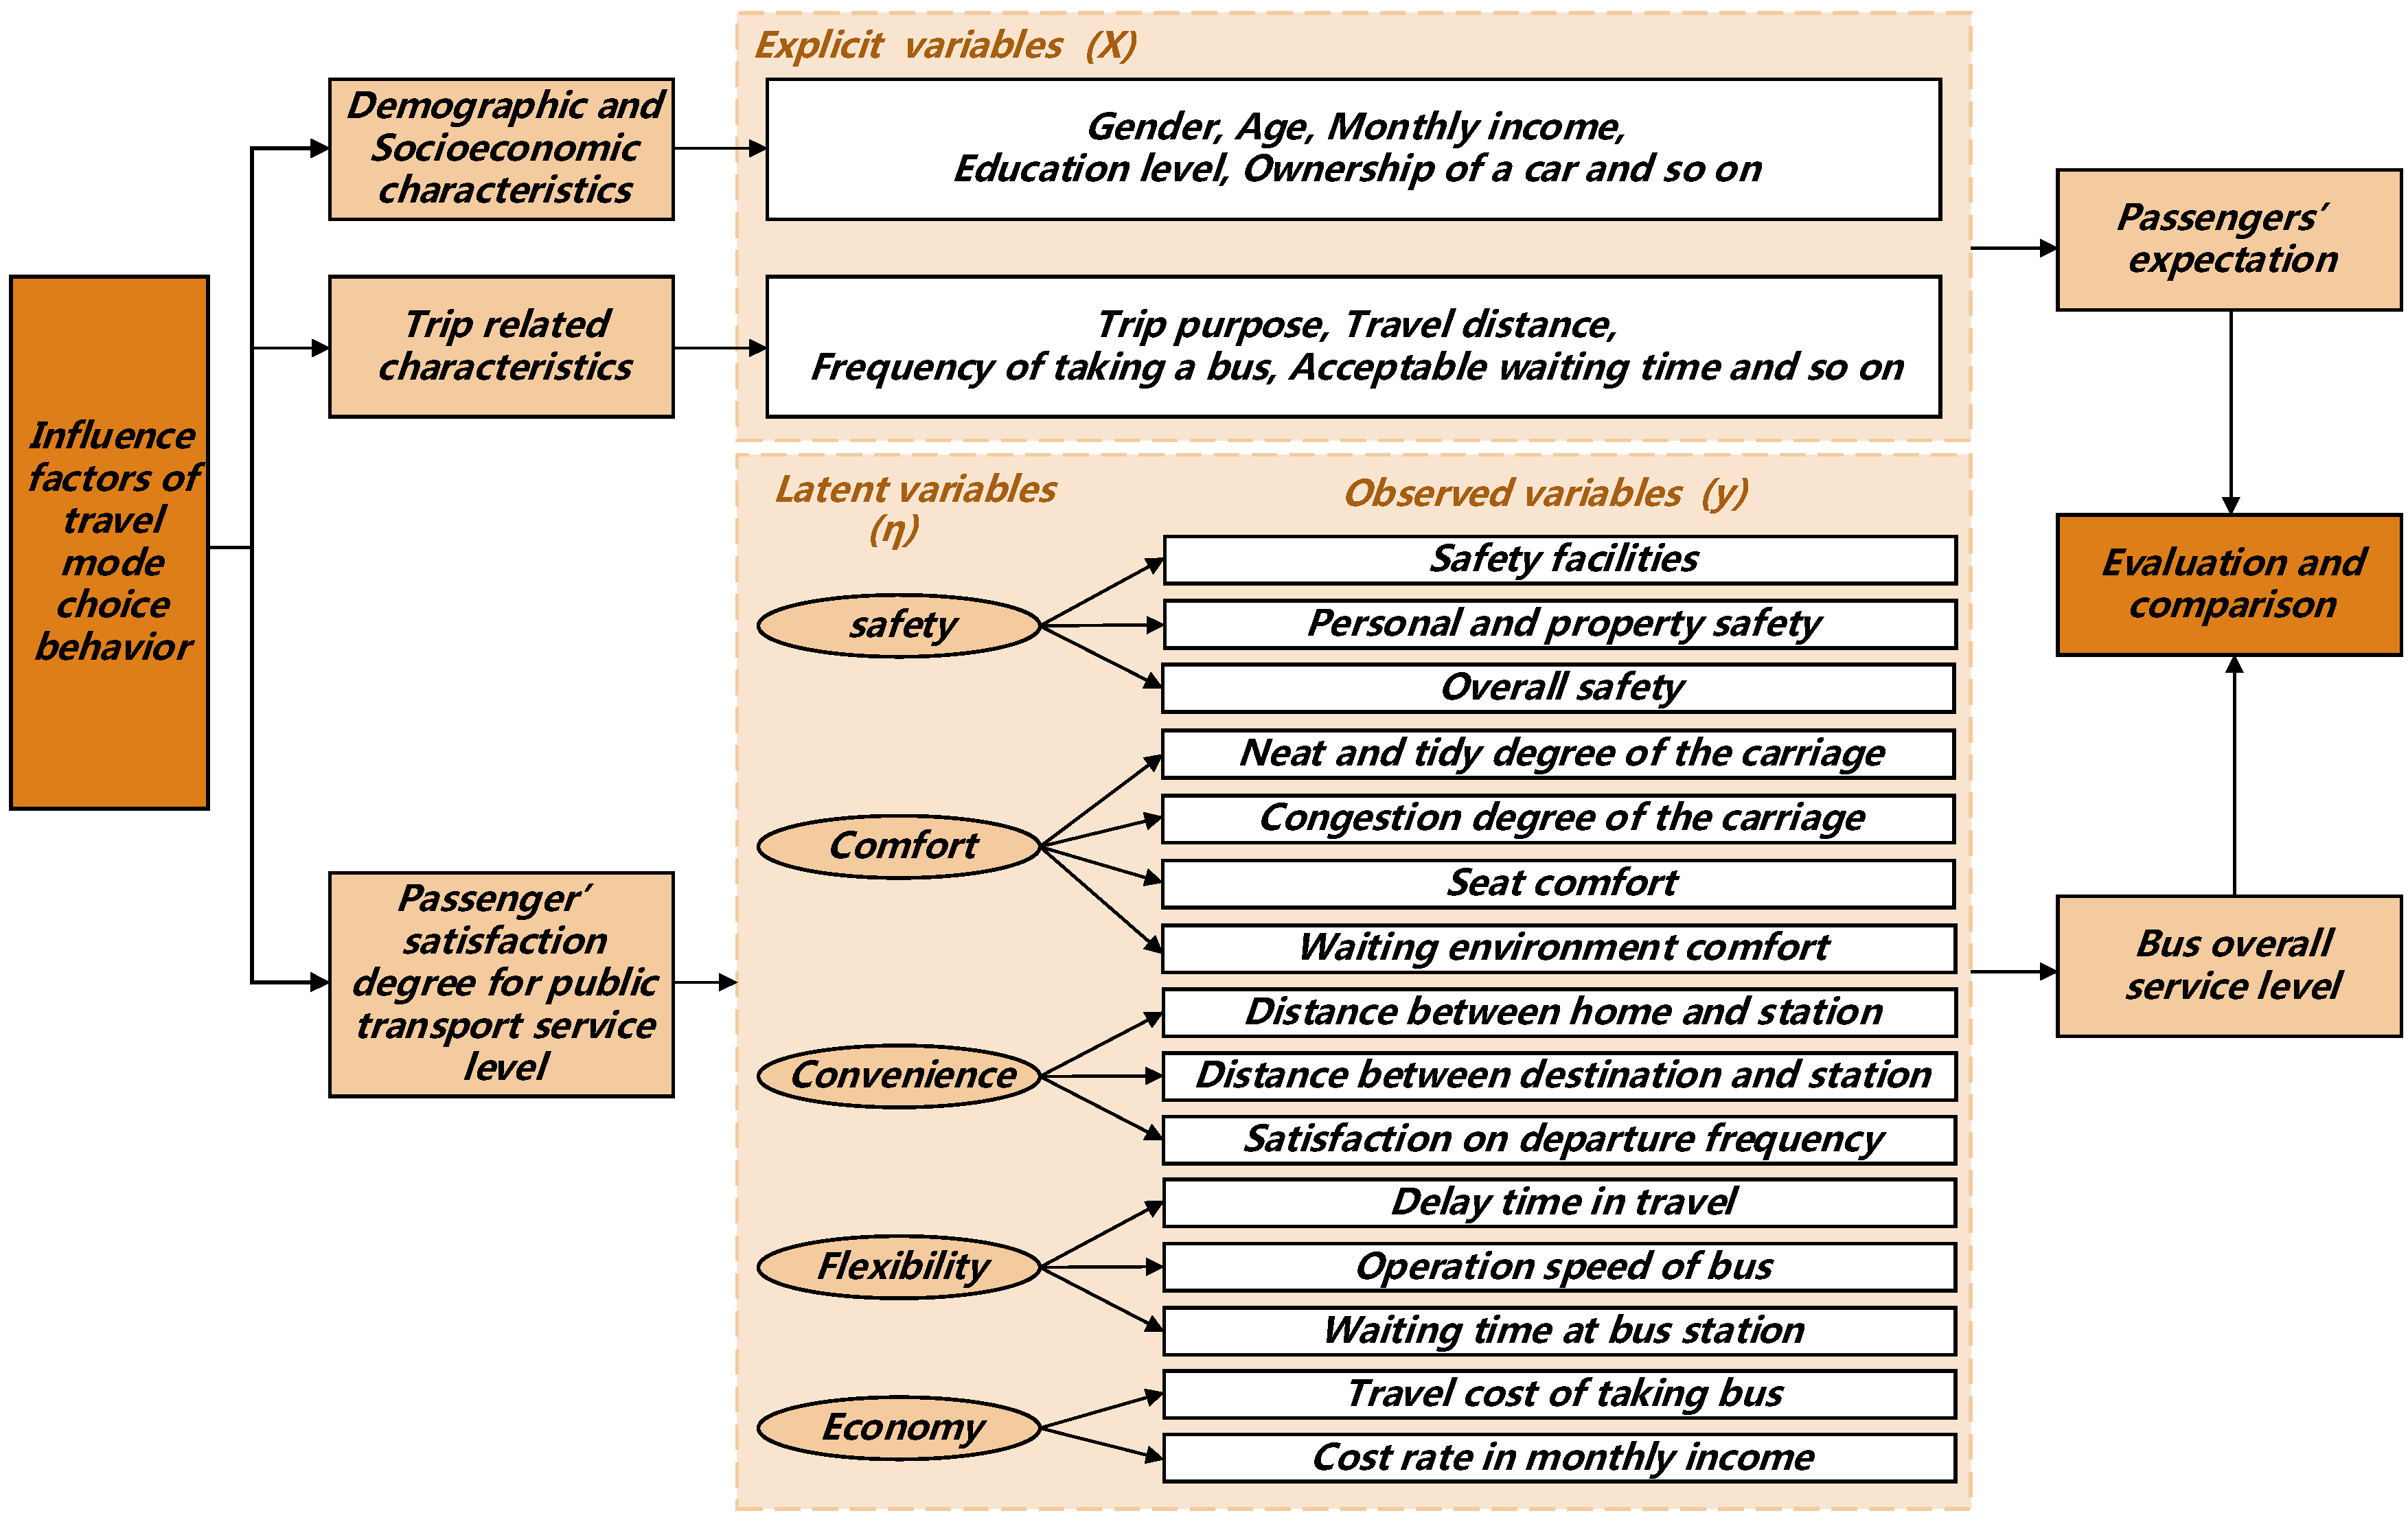
Figure 4.
Framework of SEM-NL integration model.
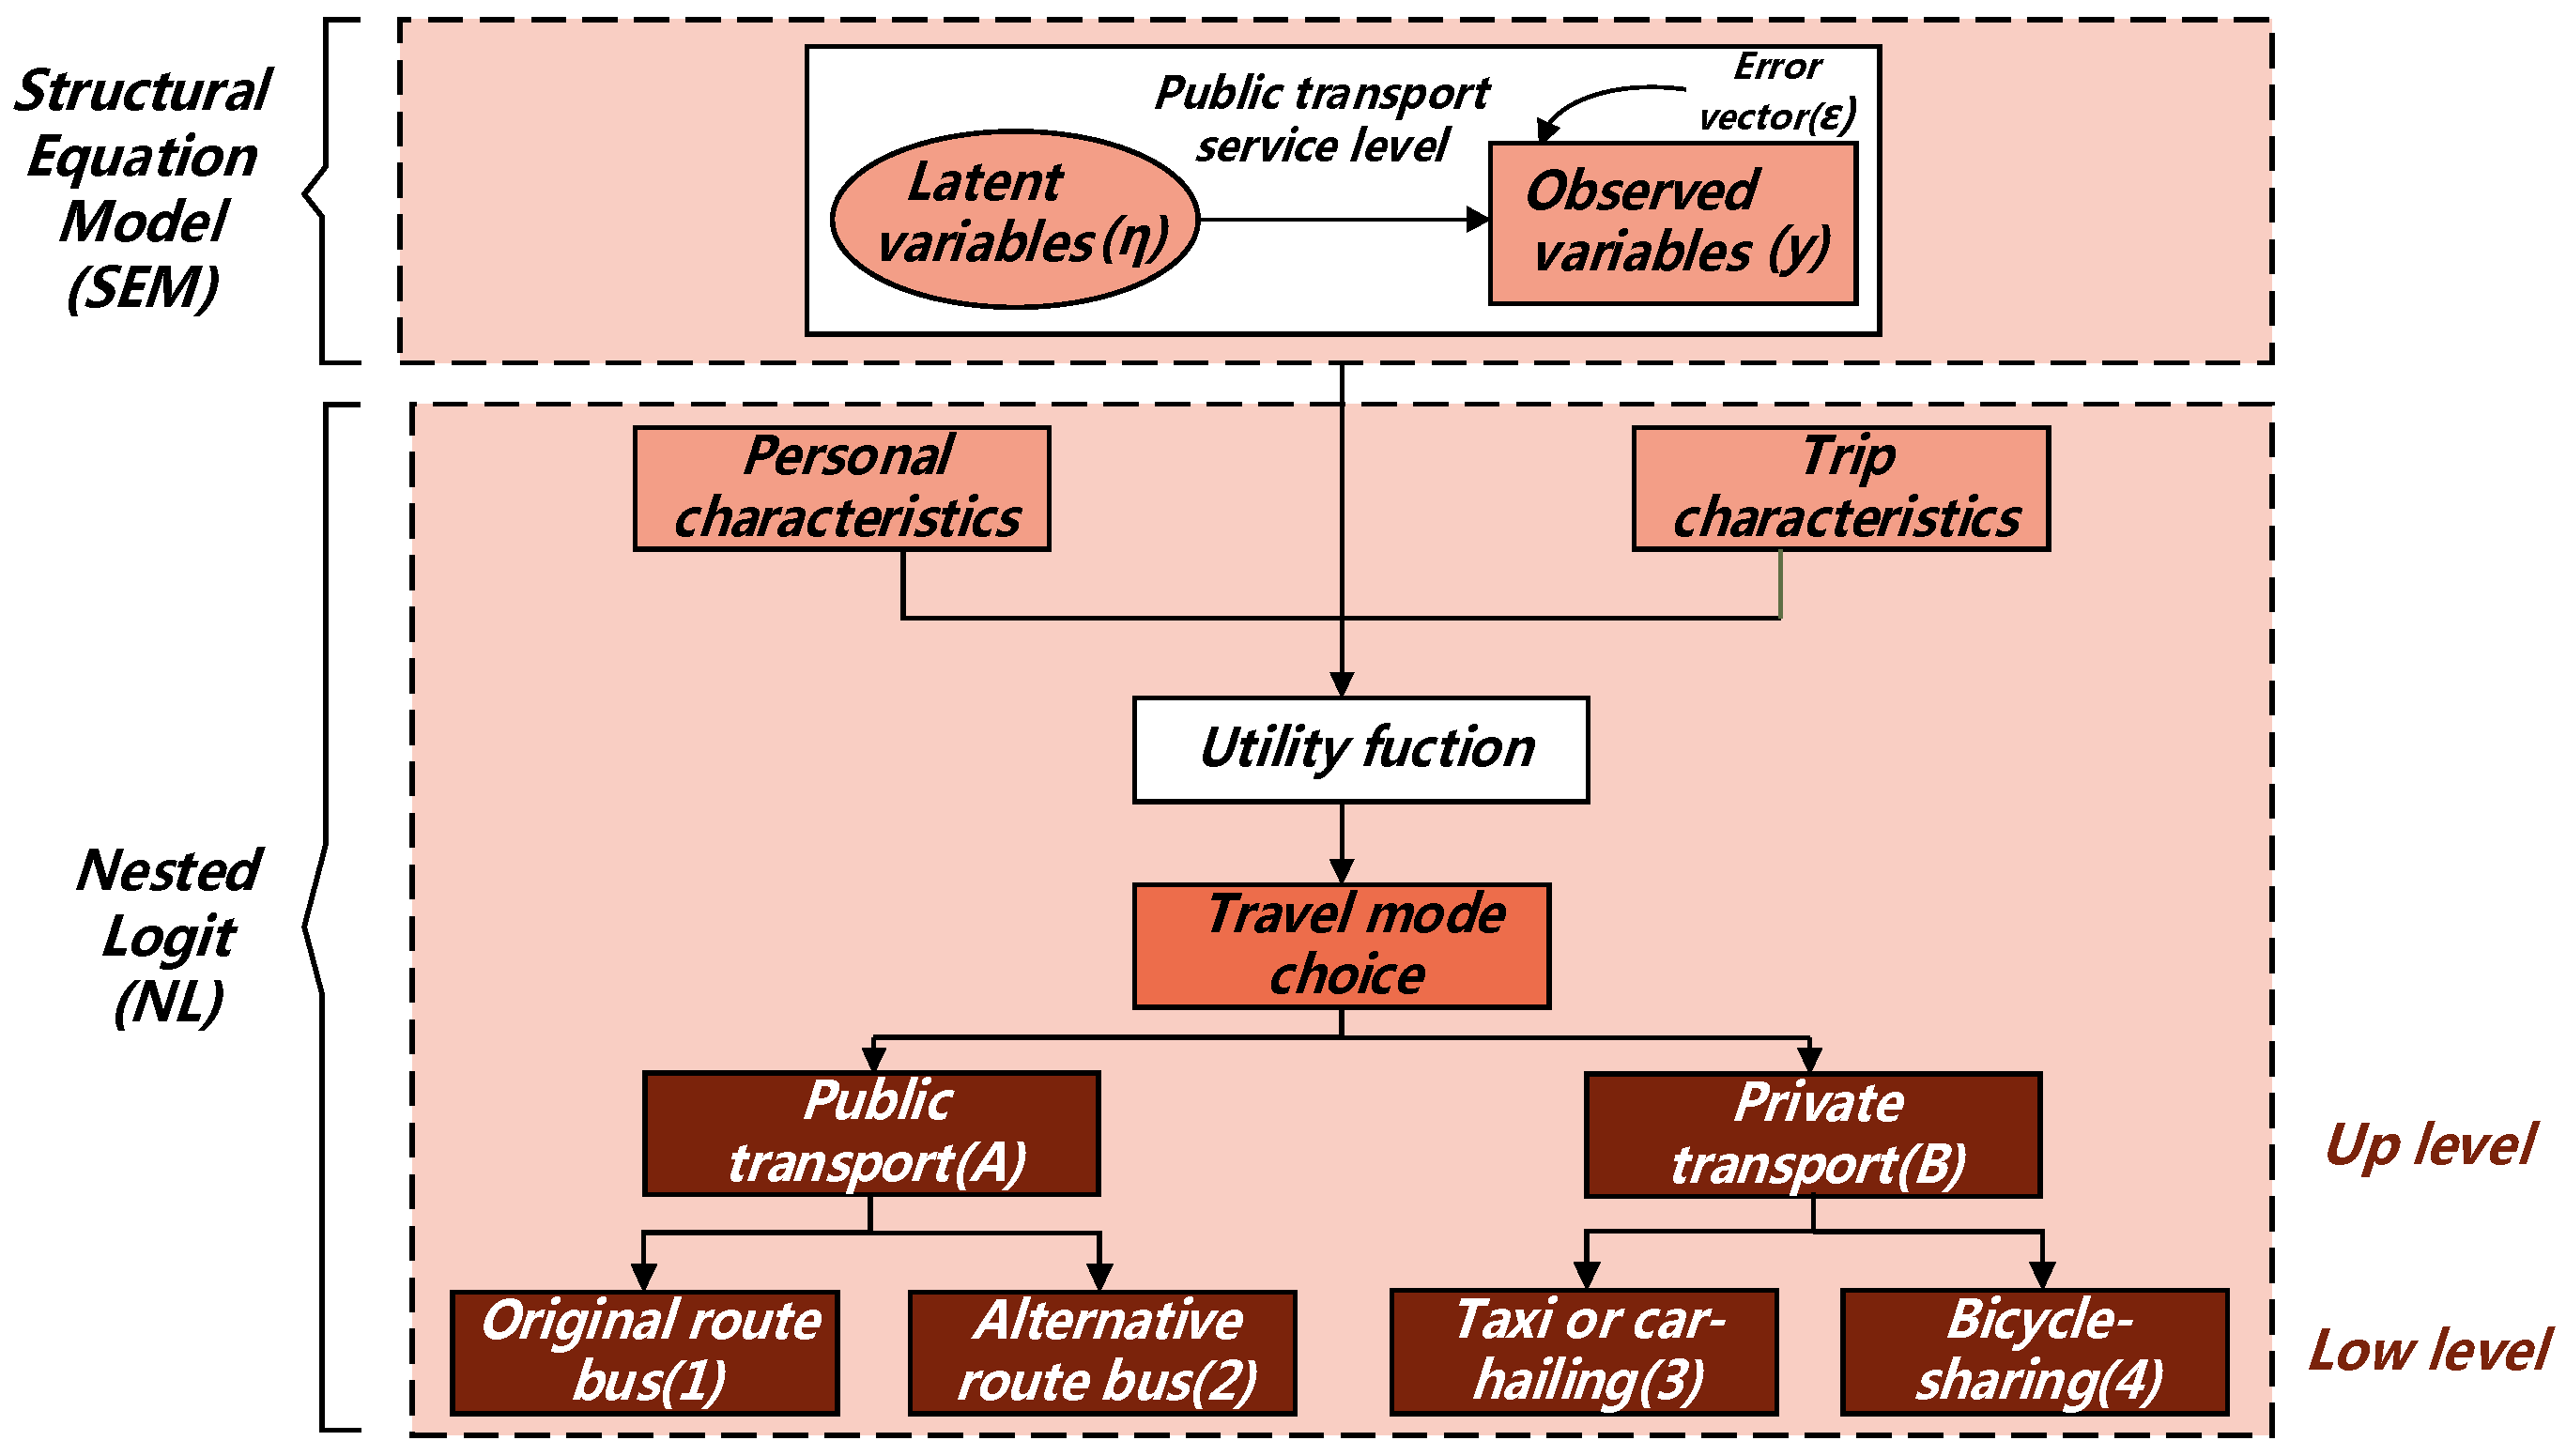
Figure 5.
Statics of travel mode choice.

Figure 6.
Travel mode choice in different income.

Figure 7.
Travel mode choice in different purposes.

Figure 8.
Travel mode choice in different frequency.

Figure 9.
Travel mode choice in different acceptable waiting time.

Figure 10.
Travel mode choice in different actual waiting time.

Figure 11.
Travel mode choice in different service.
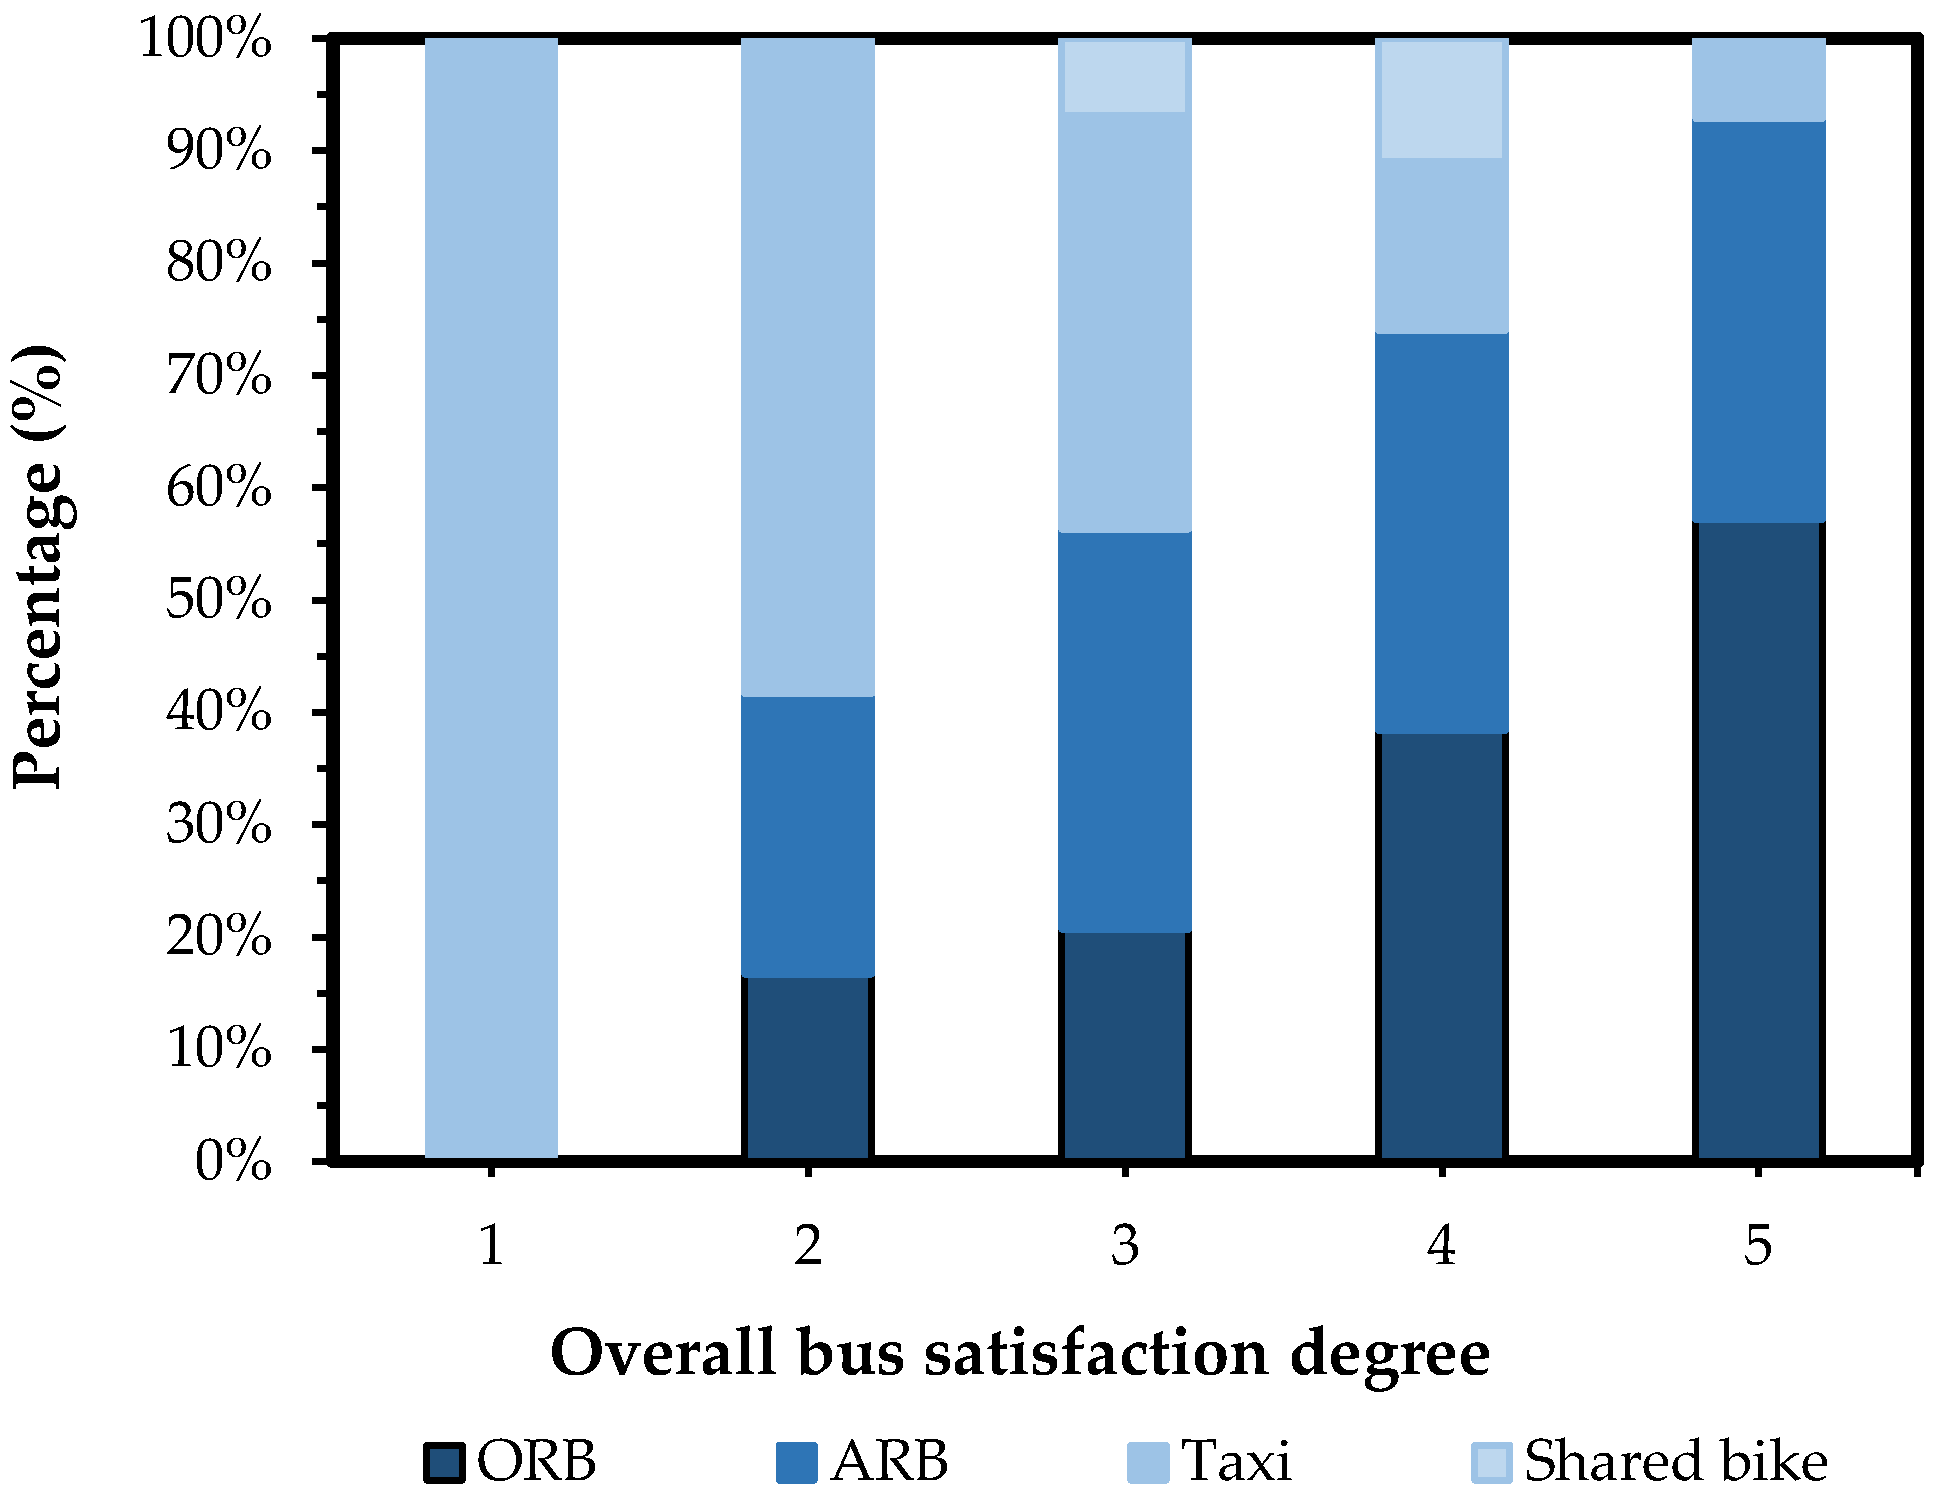
Figure 12.
Travel mode choice in different comfort.
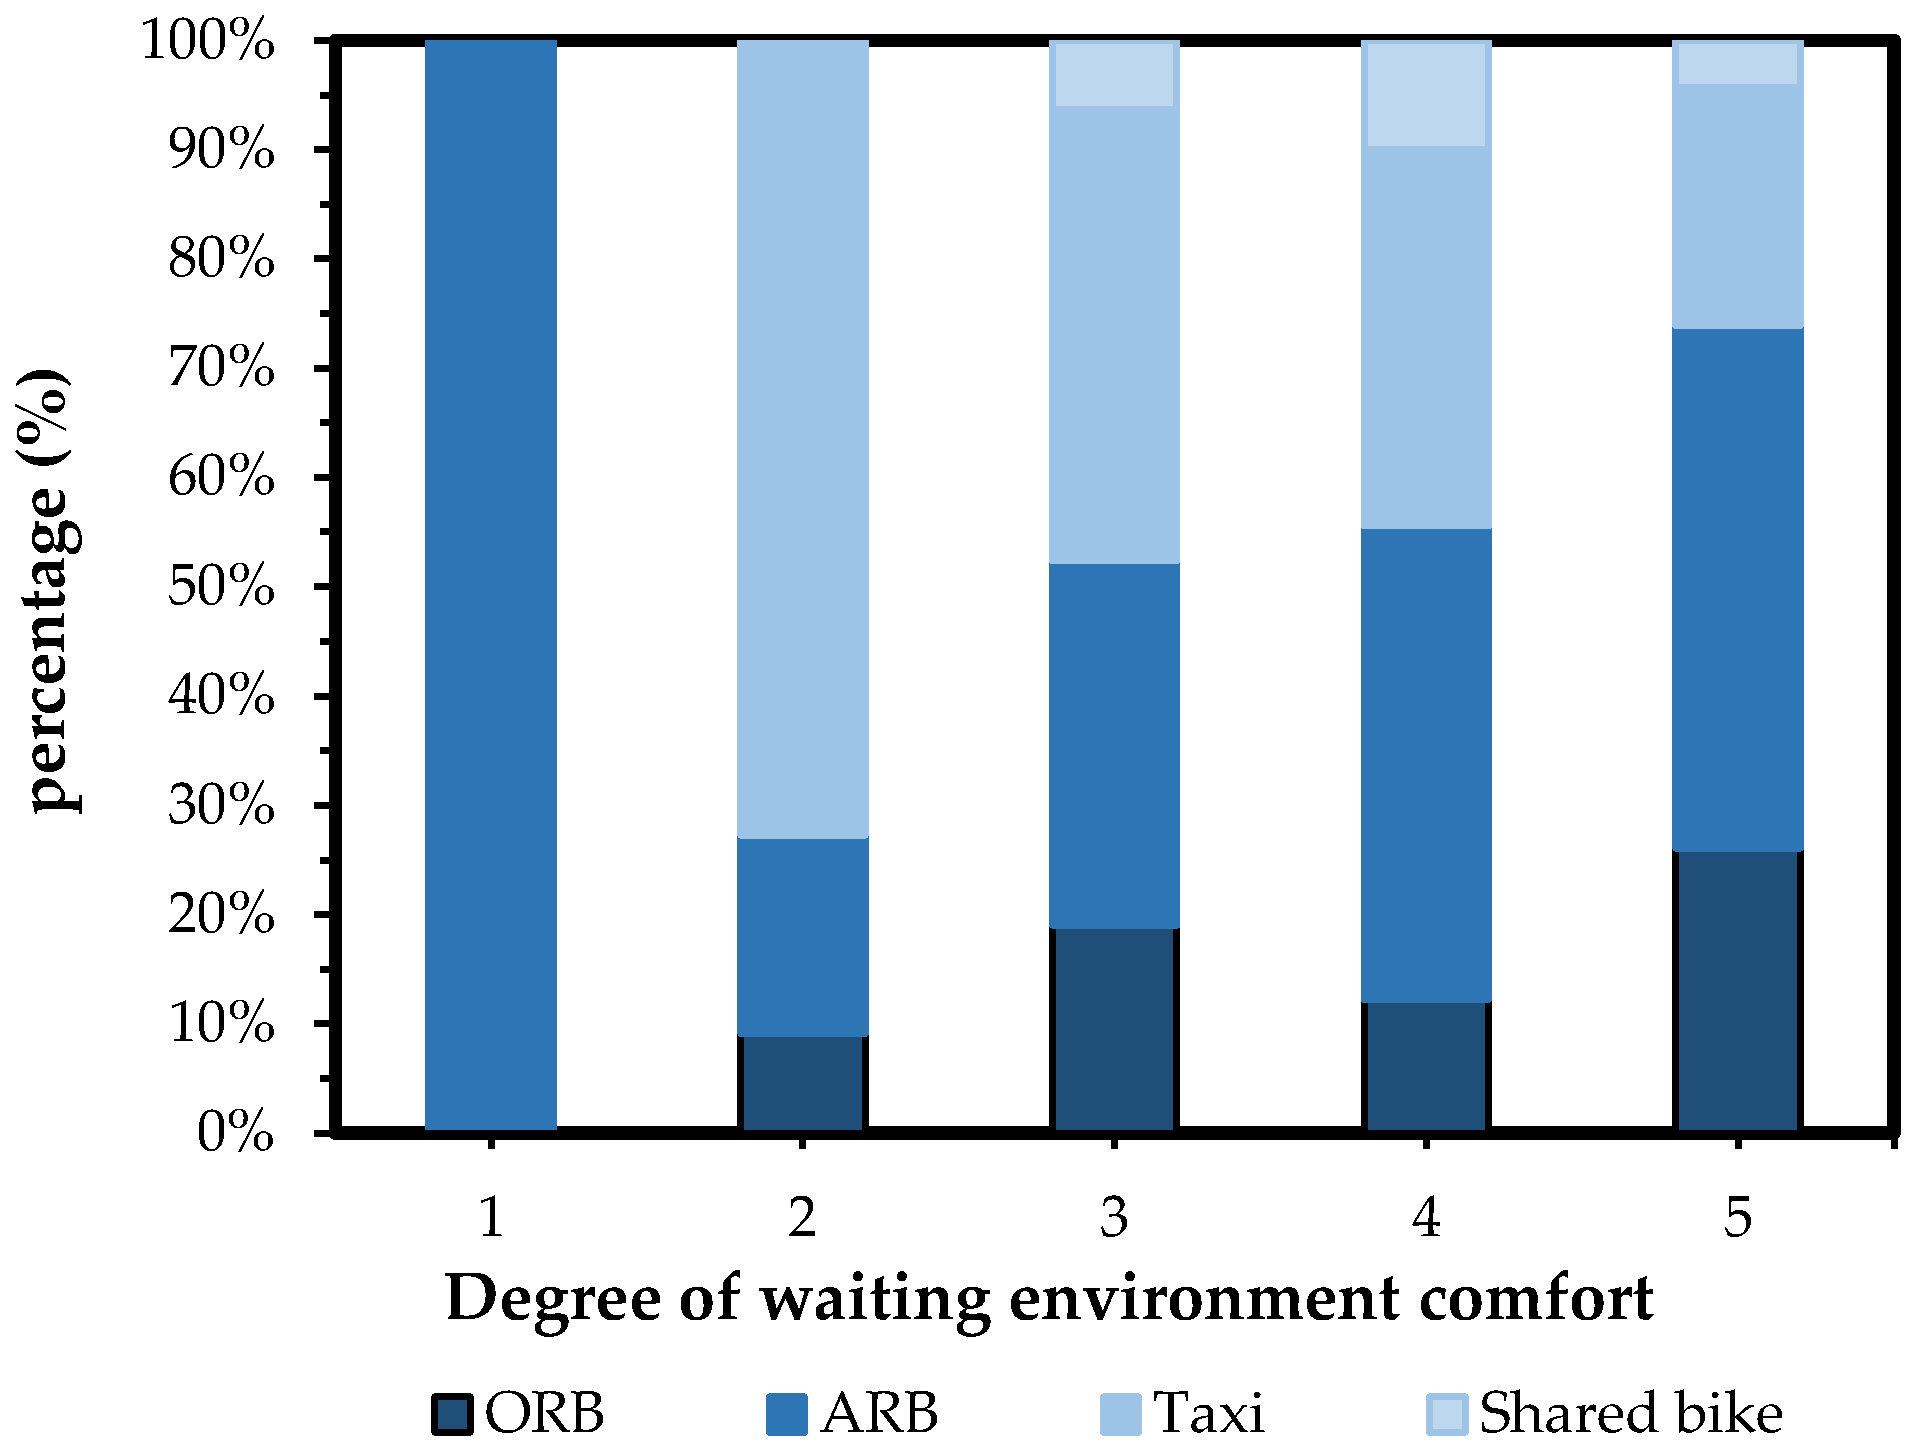
Figure 13.
Path analysis of SEM.
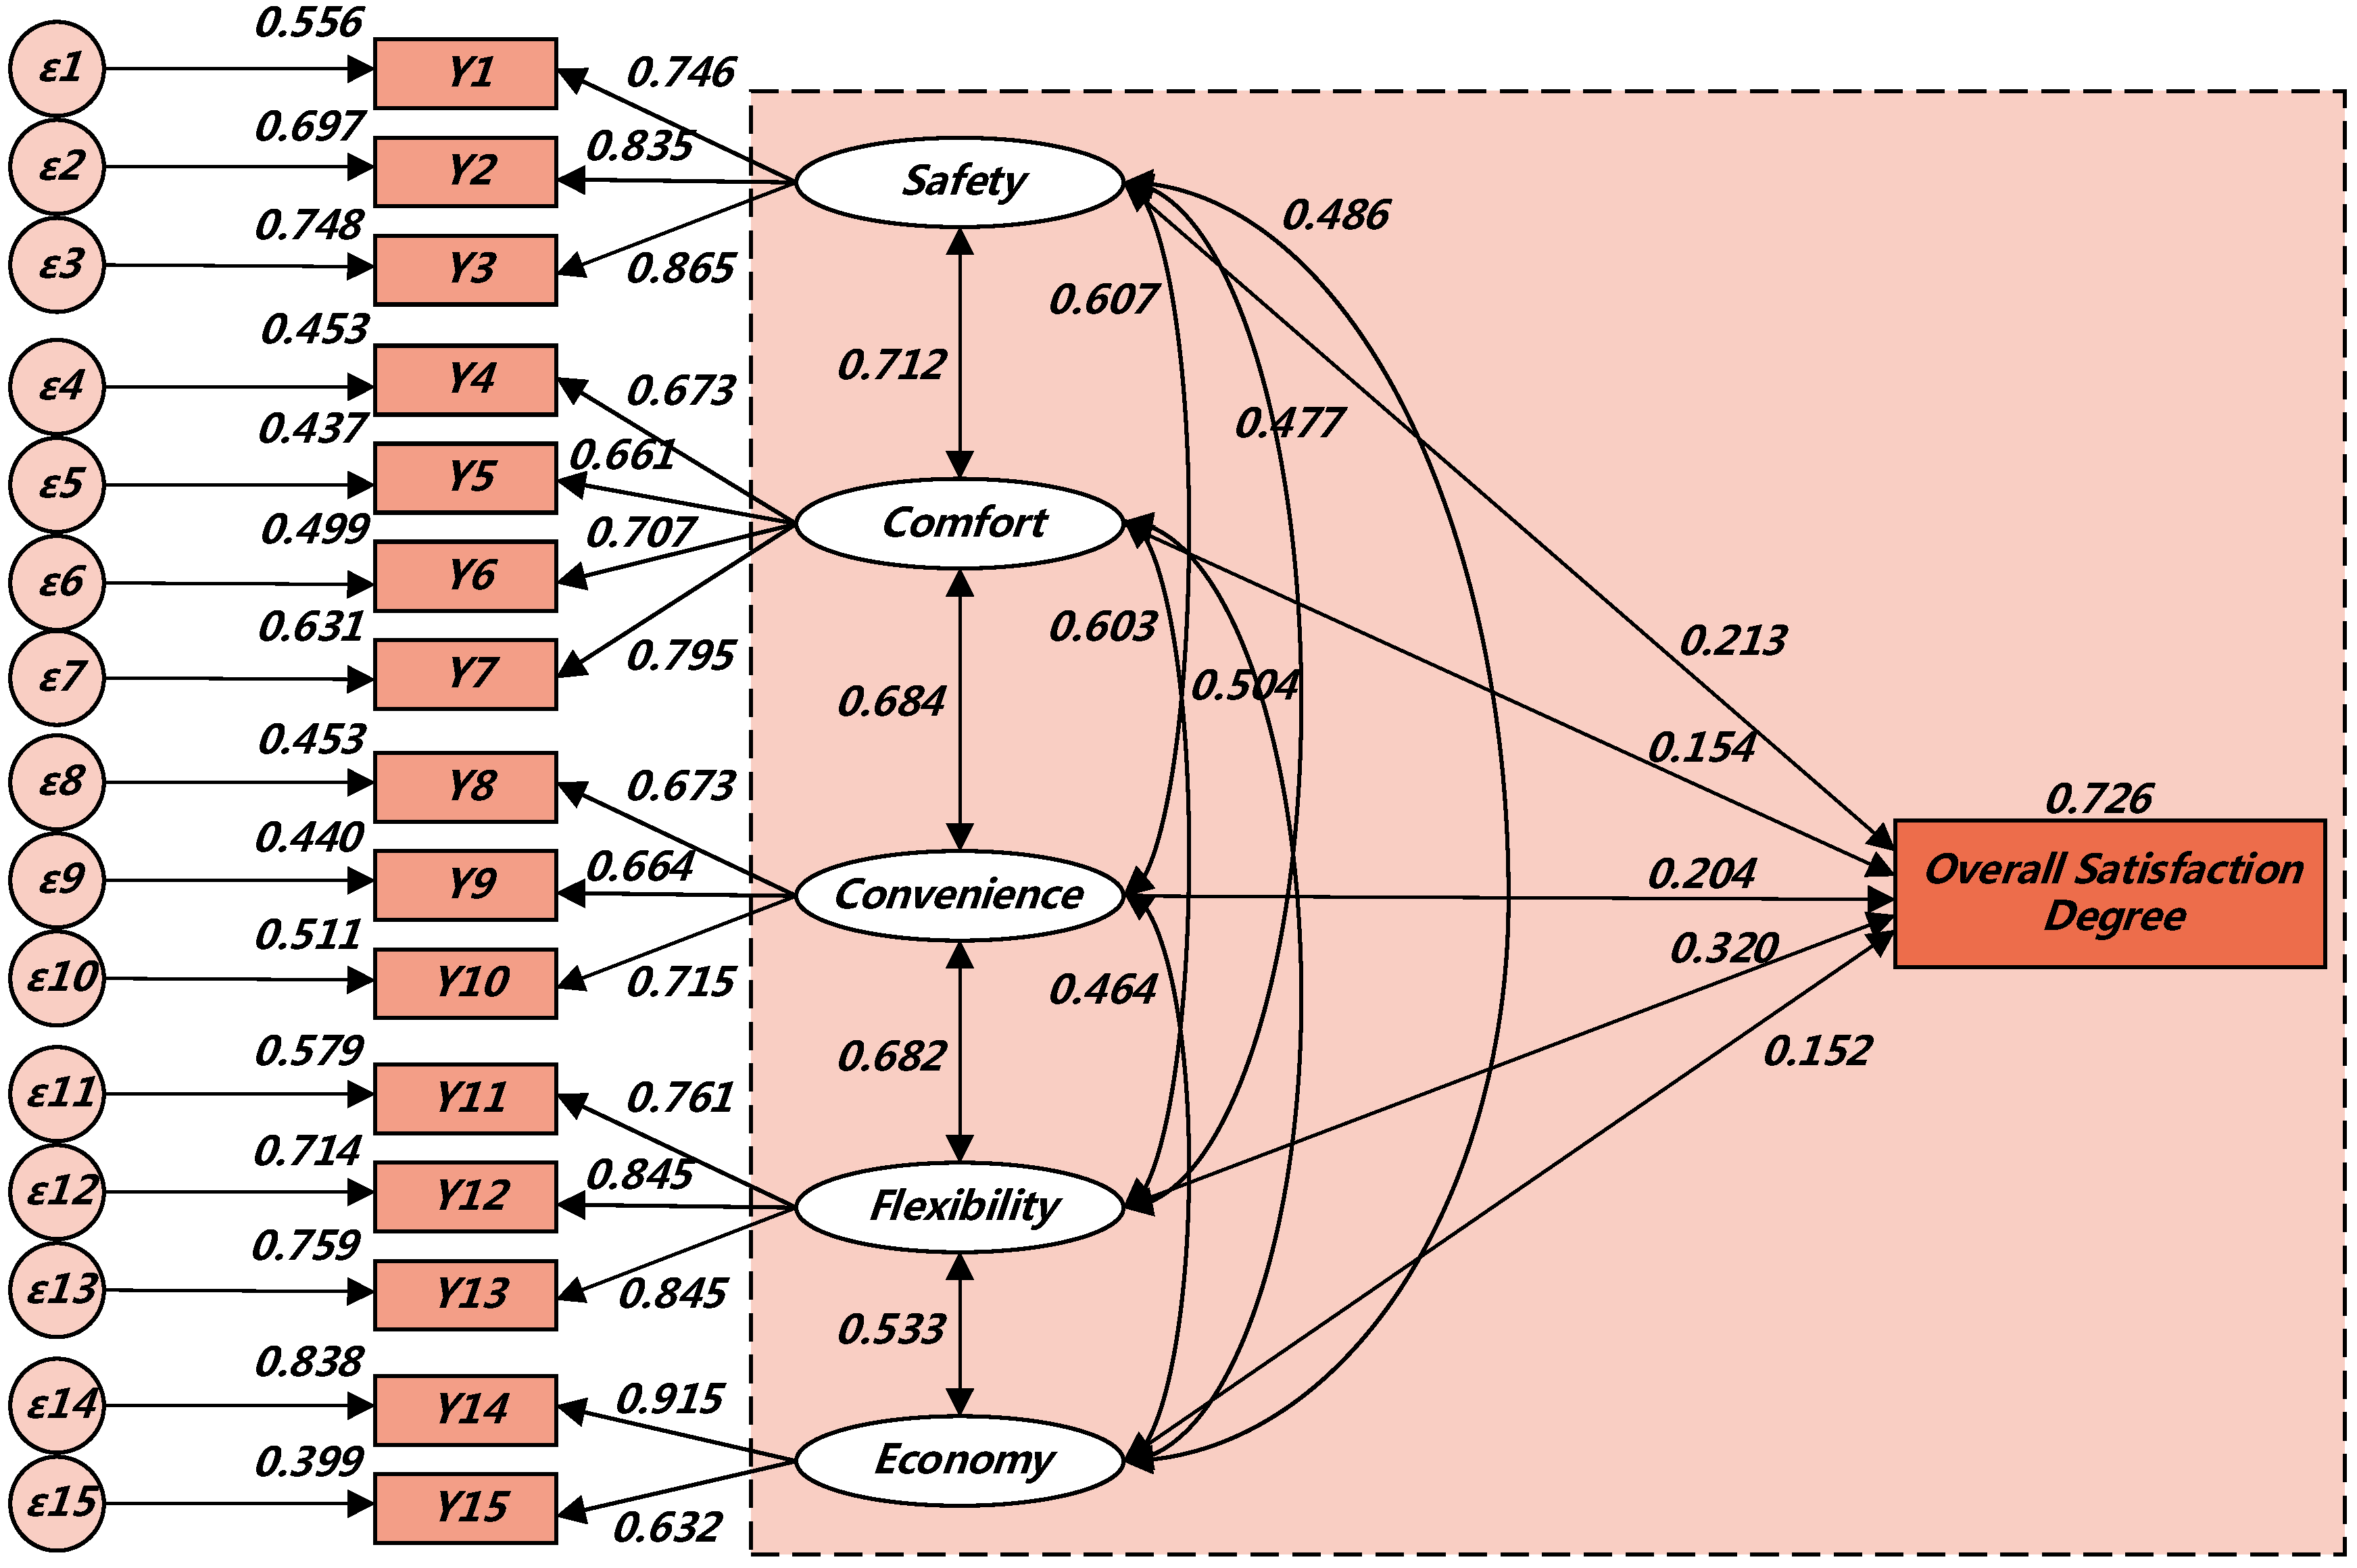
Figure 14.
Probability and point elasticity of public transport on safety service level.
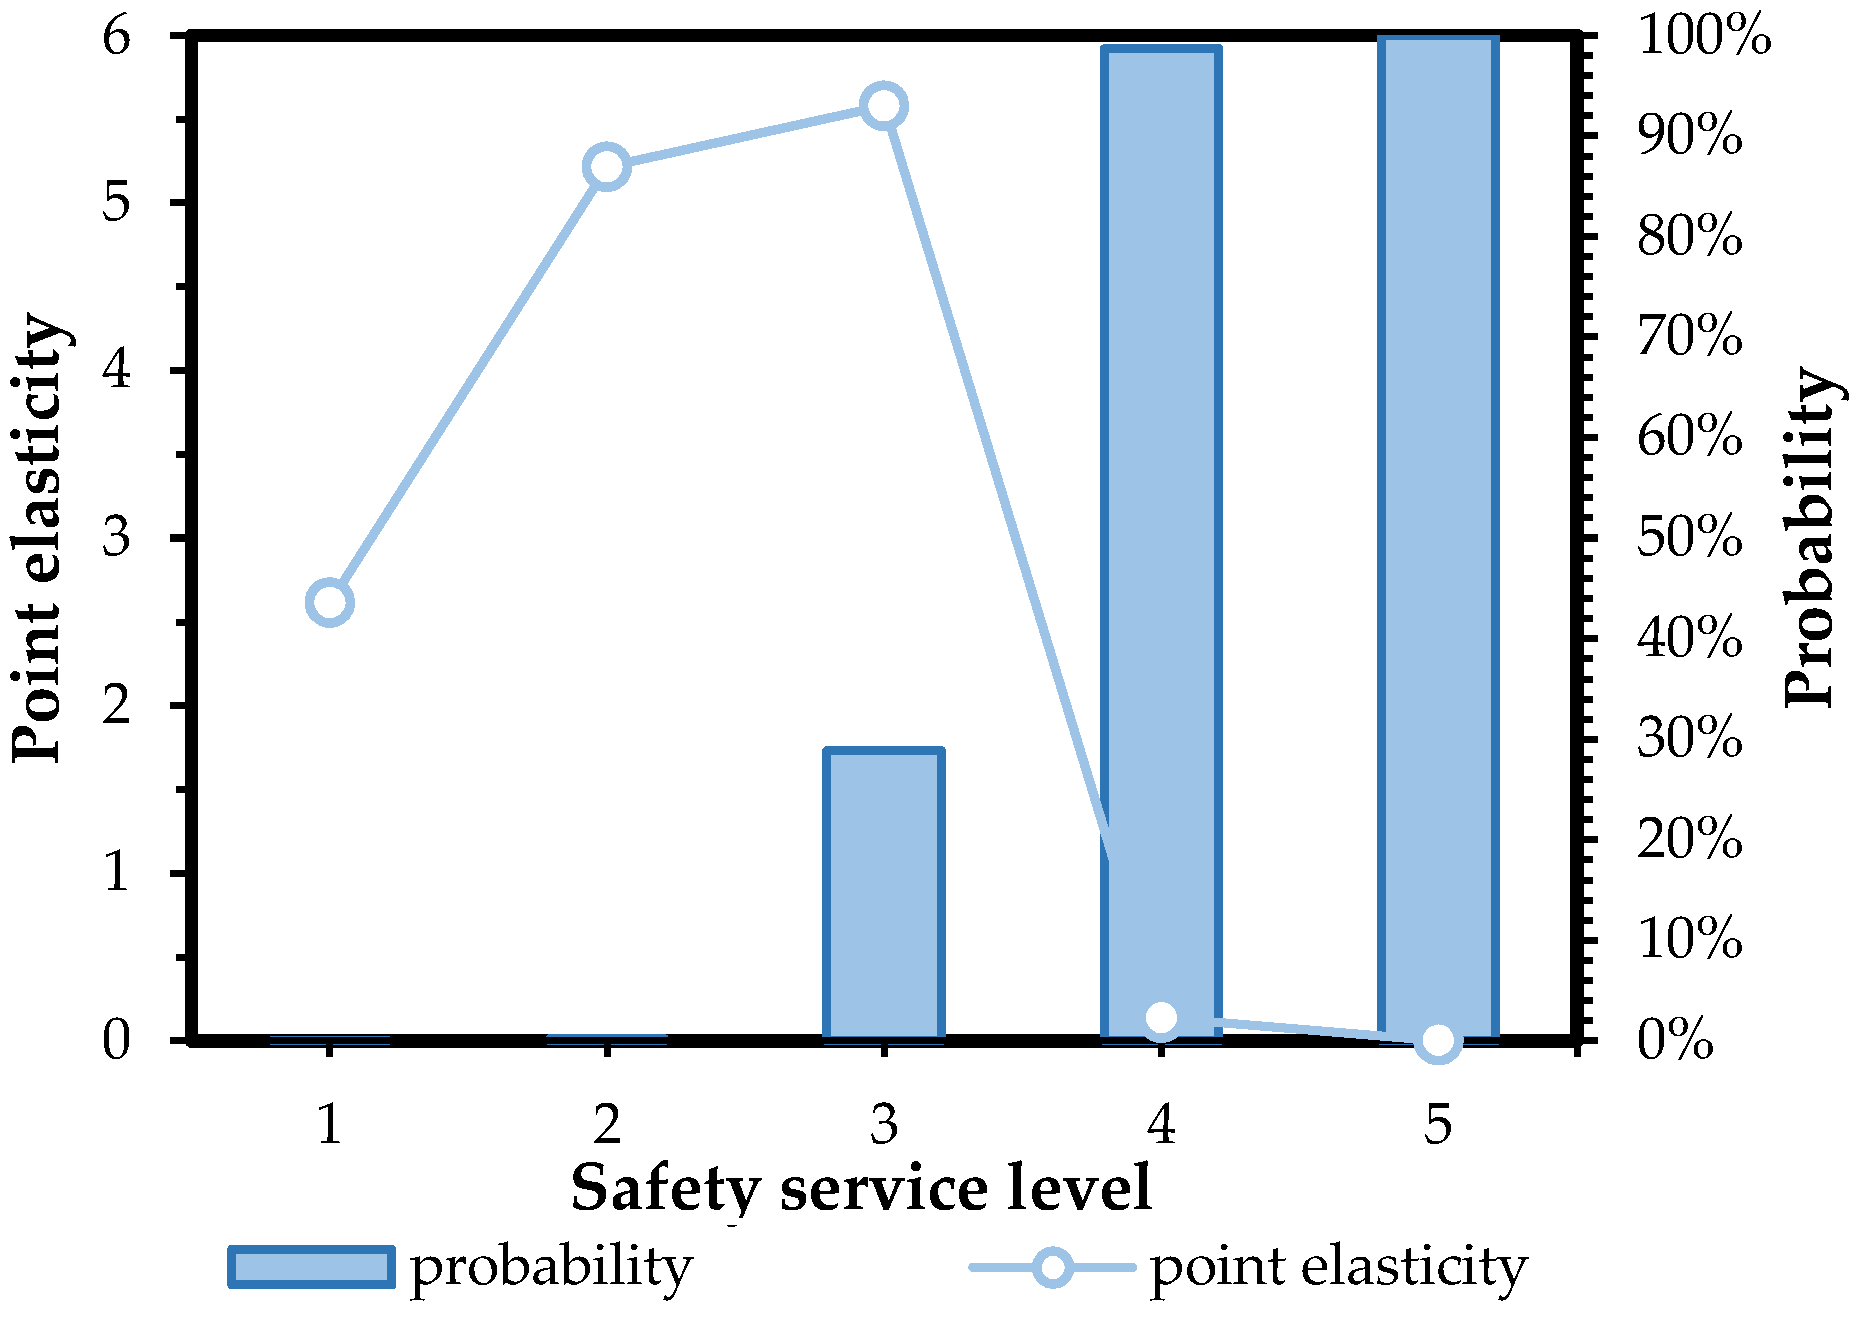
Figure 15.
Probability and point elasticity of public transport on convenience service level.
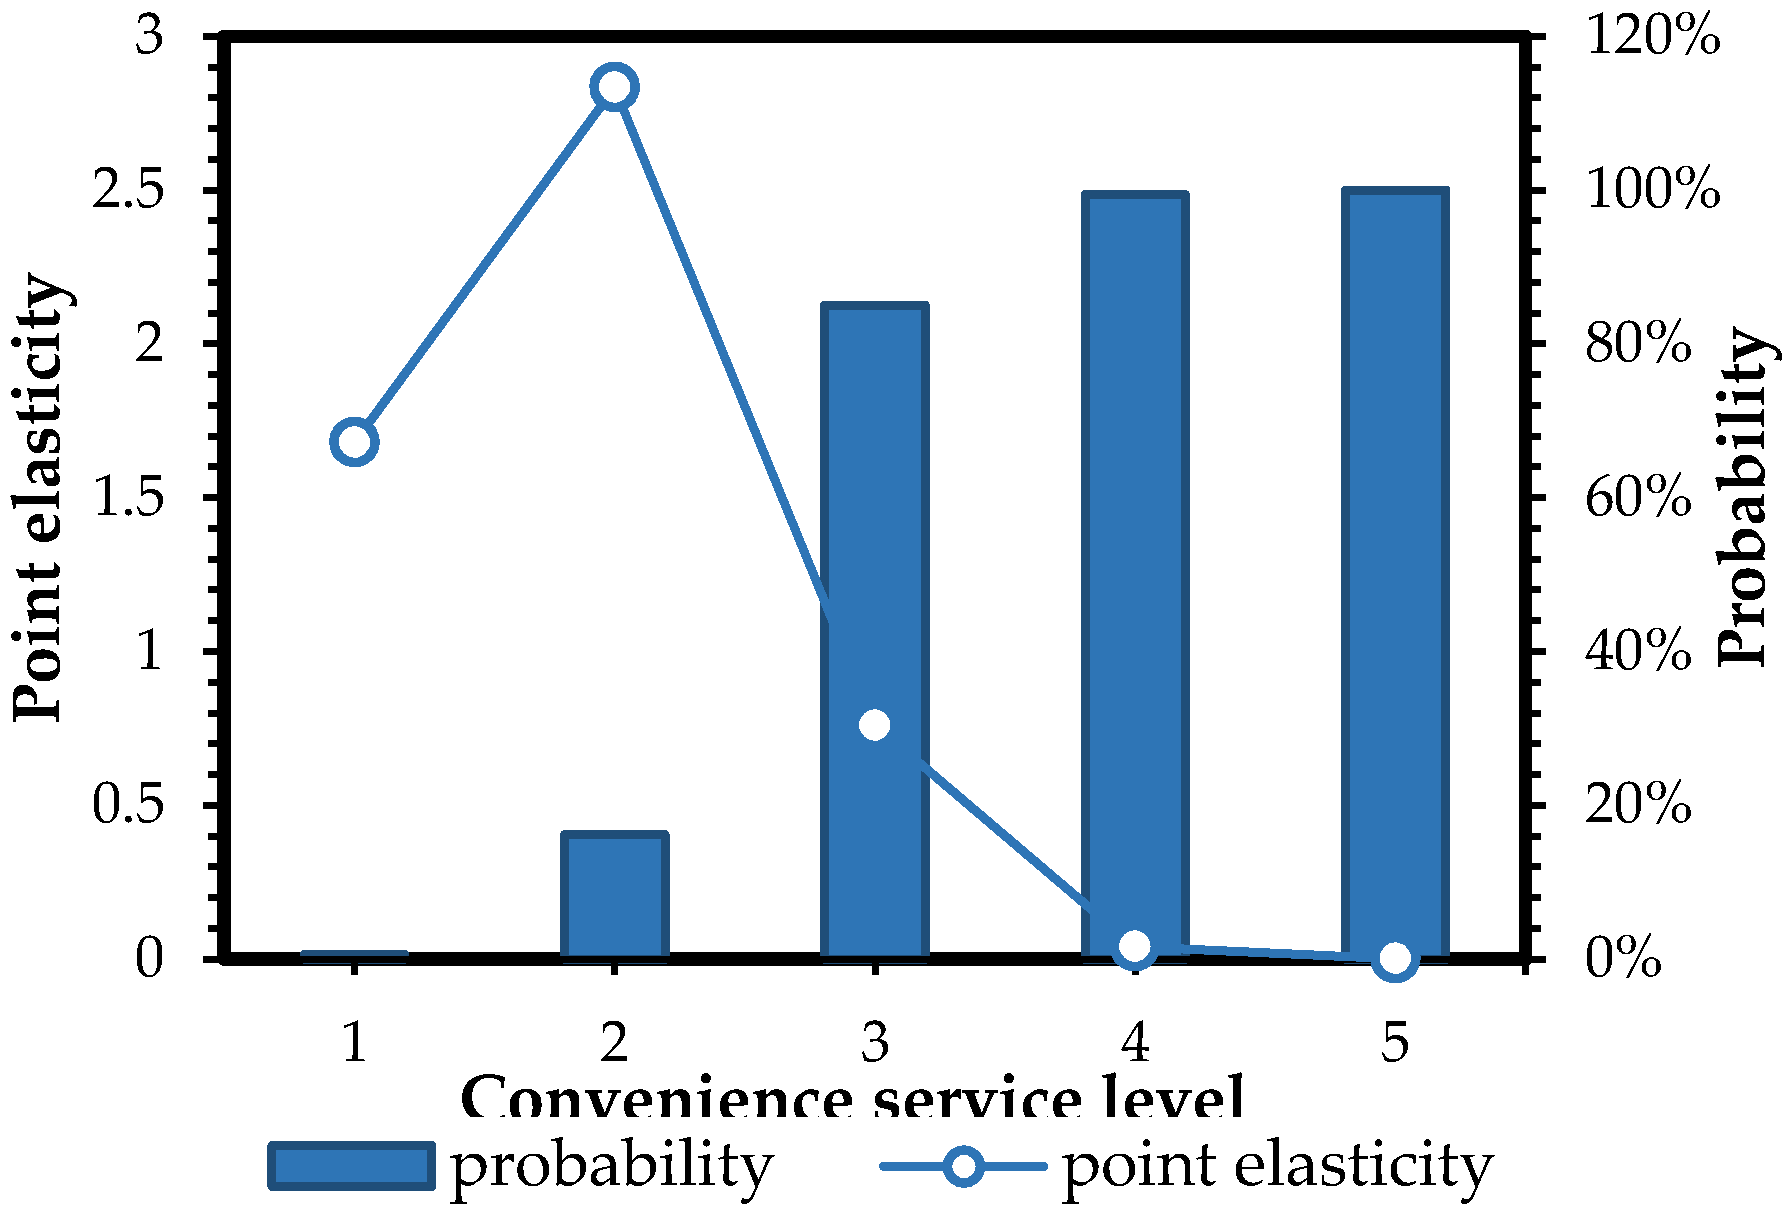
Figure 16.
Transition probability on different service level.
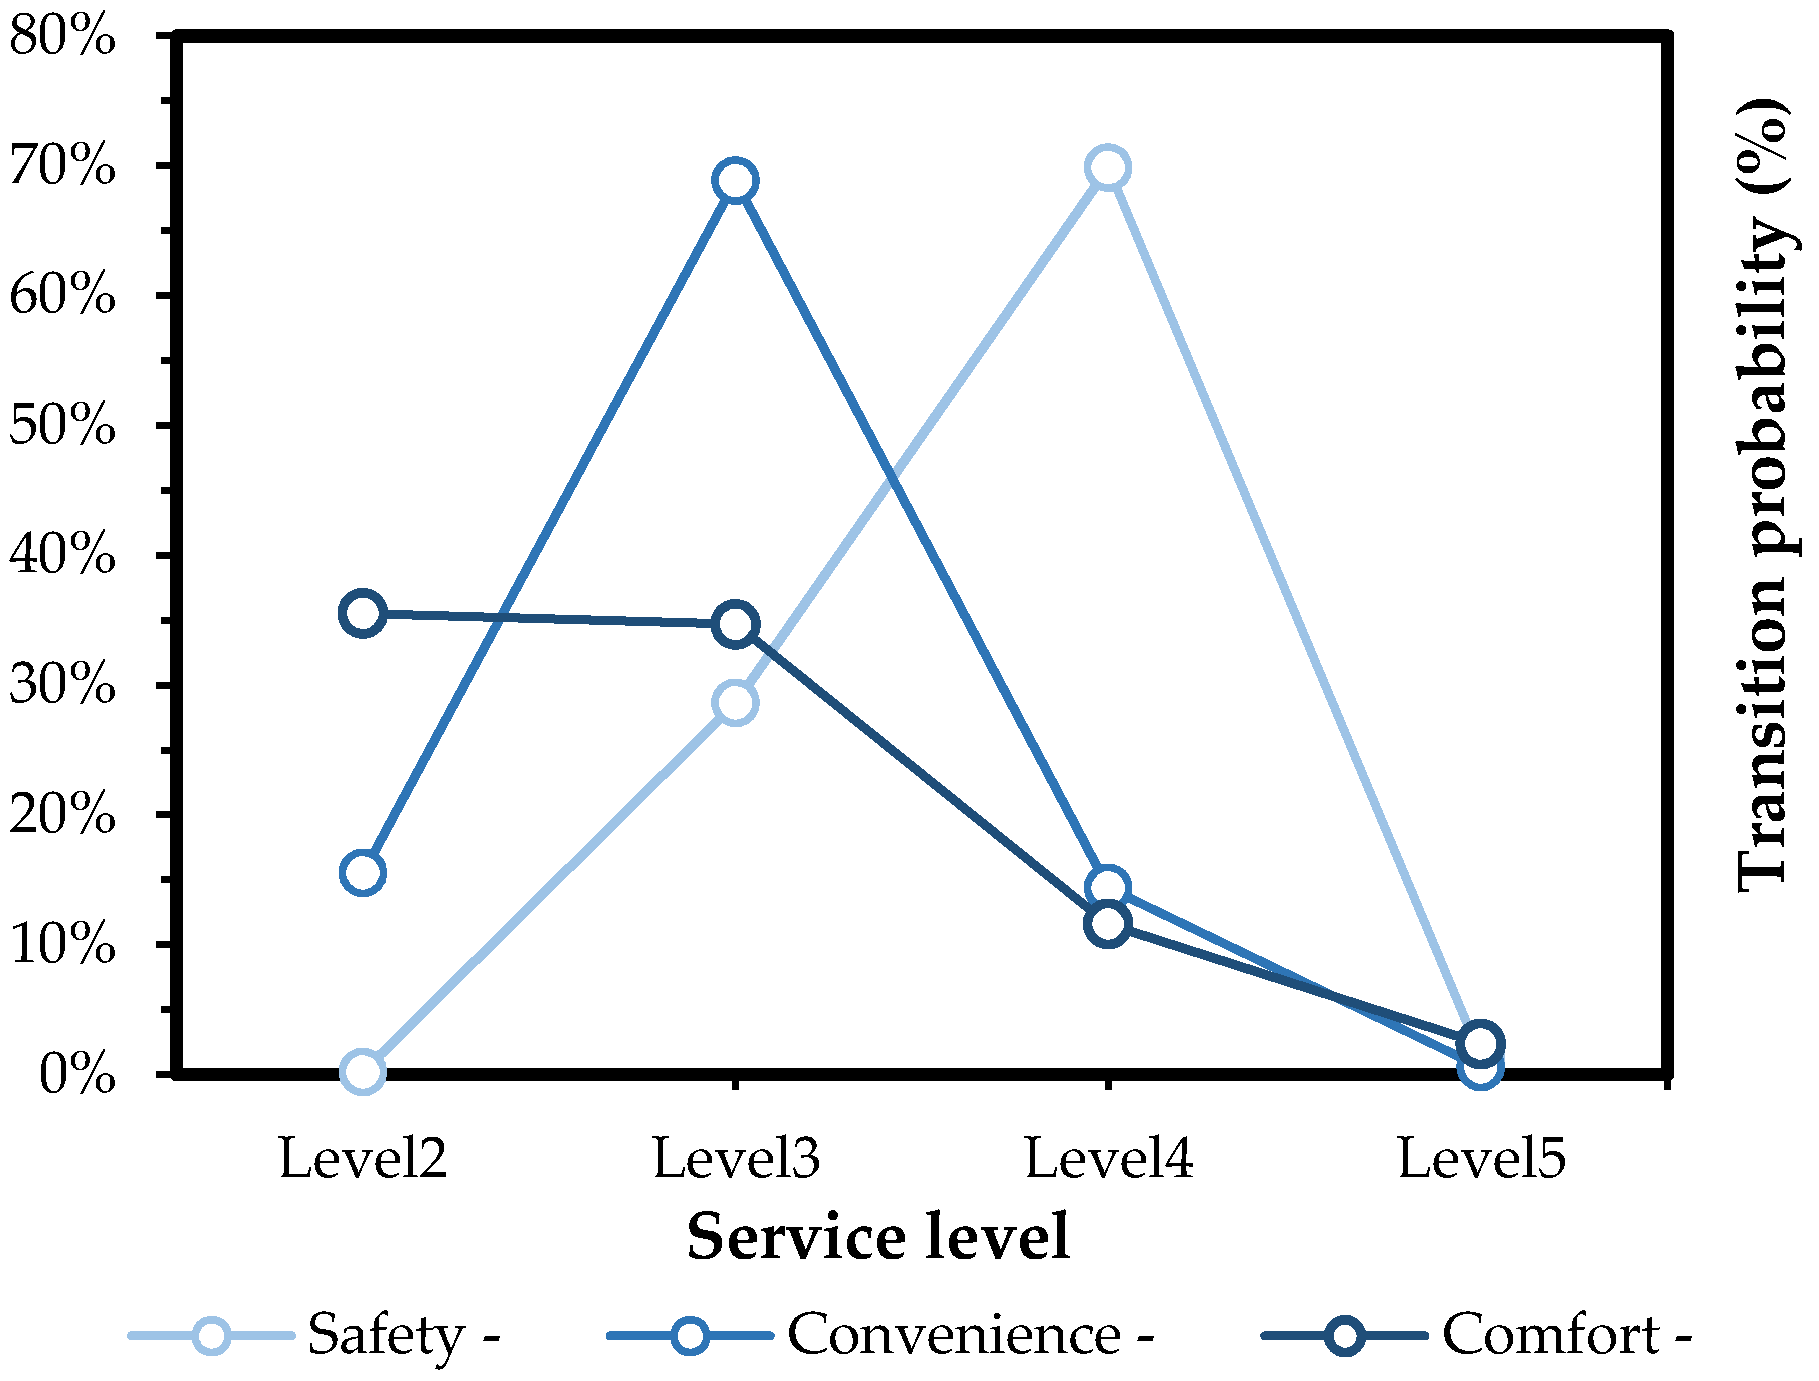
Figure 17.
Probability and point elasticity of ARB on travel distance.


Table 1.
Descriptive analysis of the index of passenger’s individual characteristics.
| Variable Description | Illustration | Percentage (%) | |
|---|---|---|---|
| Demographic and Socioeconomic | |||
| Variable for gender | Gender 1 | Male | 51.06 |
| Gender 2 | Female | 48.94 | |
| Variable for age | 34.49 (Average Age) | ||
| Variable for monthly income(yuan) | Income 1 | <3000 | 26.06 |
| Income 2 | 3000–5000 | 36.70 | |
| Income 3 | 500–10,000 | 24.47 | |
| Income 4 | >10,000 | 12.77 | |
| Variable for Education level | Level 1 | High school or below | 23.93 |
| Level 2 | Junior college | 33.51 | |
| Level 3 | Bachelor degree | 37.77 | |
| Level 4 | Master and doctor degree | 4.79 | |
| Variable for a private car | Car 1 | With a private car | 54.25 |
| Car 2 | Without a private car | 45.75 | |
| Trip related characteristics | |||
| Variable for trip purpose | Purpose 1 | Commute or family obligations 1 | 51.06 |
| Purpose 2 | Shopping and leisure, visiting relatives, and tourism | 48.94 | |
| Variable for commute distance (the number of bus station) | Distance 1 | 1–5 | 5.32 |
| Distance 2 | 6–10 | 30.32 | |
| Distance 3 | 11–15 | 40.96 | |
| Distance 4 | 16–20 | 17.55 | |
| Distance 5 | >20 | 5.85 | |
| Variable for frequency of taking buses | Frequency 1 | Rarely | 12.23 |
| Frequency 2 | Monthly | 18.08 | |
| Frequency 3 | Weekly | 23.40 | |
| Frequency 4 | Once 2–3 days | 18.62 | |
| Frequency 5 | daily | 27.67 | |
| Variable for acceptable waiting time (min) | Time 1 | 0–5 | 16.48 |
| Time 2 | 6–10 | 32.44 | |
| Time 3 | 11–15 | 37.23 | |
| Time 4 | 16–20 | 9.57 | |
| Time 5 | 21–30 | 2.66 | |
| Time 6 | >30 | 1.62 | |
1 Note: Family obligations means picking up children from daycare or school.
Table 2.
Descriptive analysis of the index of passenger’s satisfaction degree.
| Latent Variables | Observed Variables | Number of Observed Variables | α Coefficient | Average Score |
|---|---|---|---|---|
| : Safety | Y1: Safety facilities | 3 | 0.852 | 4.088 |
| Y2: Personal and property safety | 3.758 | |||
| Y3: Overall safety | 3.948 | |||
| : Comfort | Y4: Neat and tidy degree of the carriage | 4 | 0.785 | 4.026 |
| Y5: Congestion degree of the carriage | 3.407 | |||
| Y6: Seat comfort | 3.897 | |||
| Y7: Waiting environment comfort at bus station | 3.644 | |||
| : Convenience | Y8: Distance between home and bus station | 3 | 0.729 | 3.613 |
| Y9: Distance between destination and bus station | 3.629 | |||
| Y10: Satisfaction on departure frequency | 3.490 | |||
| : Flexibility | Y11: Waiting time at bus station | 3 | 0.860 | 3.196 |
| Y12: Delay time in travel | 3.340 | |||
| Y13: Operation speed of bus | 3.464 | |||
| : Economy | Y14: Travel cost of taking a bus | 2 | 0.733 | 3.665 |
| Y15: Cost rate in monthly income | 3.526 | |||
| Overall satisfaction degree | 3.433 | |||
Table 3.
Standardized regression coefficient and sensitivity test.
| Path | Estimate | Standard Error (S.E.) | Critical Ratio (C.R.) | p-Value | ||
|---|---|---|---|---|---|---|
| Y2 | << | 1.000 | - | - | - | |
| Y1 | << | 0.746 | 0.081 | 10.948 | *** | |
| Y3 | << | 0.865 | 0.077 | 13.659 | *** | |
| Y5 | << | 1.000 | - | - | - | |
| Y4 | << | 0.673 | 0.109 | 7.651 | *** | |
| Y6 | << | 0.707 | 0.113 | 7.937 | *** | |
| Y7 | << | 0.795 | 0.097 | 9.158 | *** | |
| Y9 | << | 1.000 | - | - | - | |
| Y8 | << | 0.673 | 0.140 | 7.803 | *** | |
| Y10 | << | 0.715 | 0.155 | 7.183 | *** | |
| Y12 | << | 1.000 | - | - | - | |
| Y11 | << | 0.761 | 0.087 | 11.830 | *** | |
| Y13 | << | 0.871 | 0.075 | 14.197 | *** | |
| Y15 | << | 1.000 | - | - | - | |
| Y14 | << | 0.915 | 0.221 | 6.392 | * | |
| Overall Satisfaction Degree | << | 0.213 | 0.074 | 2.734 | 006 ** | |
| Overall Satisfaction Degree | << | 0.154 | 0.095 | 1.668 | 095 * | |
| Overall Satisfaction Degree | << | 0.204 | 0.117 | 2.123 | 0.034 ** | |
| erall Satisfaction Degree | << | 0.320 | 0.077 | 4.069 | *** | |
| Overall Satisfaction Degree | << | 0.152 | 0.078 | 2.498 | 0.013 ** | |
Note: *** means p < 0.01, ** means p < 0.05, and * means p < 0.1; p-value is the statistical test probability of C.R., and the statistical significance of load factors can be tested based on p-values.
Table 4.
Fit statistics for structural equation models.
| Fix Index | SEM Models | Criteria of Acceptable Fit |
|---|---|---|
| (Chi-Square) | 141.989 | Smaller values |
| CMIN/DF (Likelihood-Ratio Chi-Square/degrees of freedom) | 1.578 | <3 |
| GFI (goodness-of-fit index) | 0.915 | >0.9 |
| AGFI (adjusted goodness-of-fit index) | 0.872 | >0.9 |
| RMSEA (root mean square error of approximation) | 0.055 | <0.05(good fit) <0.08(reasonable fit) |
| RMR (root mean square residual) | 0.035 | <0.05 |
| NFI (normed fit index) | 0.914 | >0.9 |
| IFI (incremental fit index) | 0.967 | >0.9 |
| TLI (Tacker–Lewis index) | 0.955 | >0.9 |
| CFI (comparative fit index) | 0.966 | >0.9 |
Table 5.
Estimation result of models.
| Model | Variable | Value | S.E | t-Test |
|---|---|---|---|---|
| Up level model | ASC1 | −14.695915 | 4.689069 | −3.134080 |
| Gender | 1.126083 | 0.904913 | 1.244410 | |
| Monthly income | −2.340057 | 0.702414 | −3.331449 | |
| Education level | −1.089239 | 0.470627 | −2.314443 | |
| Trip purpose | −1.514132 | 0.735206 | −2.059466 | |
| Travel distance | −1.609863 | 0.812251 | −1.981978 | |
| Acceptable waiting time | 1.124283 | 0.538017 | 2.089681 | |
| Safety | 2.613647 | 0.888649 | 2.941145 | |
| Comfort | 0.871234 | 0.585514 | 1.487981 | |
| Convenience | 1.690252 | 0.590711 | 2.861384 | |
| Logsum | 0.823712 | 0.297657 | 2.767317 | |
| LL(0): −130.311670 LL(): −26.104927 −2LL(0)–2LL(): 208.413486 : 0.799673 : 0.715260 | ||||
| Variable | Value | S.E | t-Test | |
| Low level model | ASC1 | 0.280311 | 0.499432 | 0.561259 |
| ASC2 | 0.883488 | 0.394253 | 2.240918 | |
| ASC4 | 6.535504 | 2.275361 | 2.872293 | |
| Monthly income | 0.290596 | 0.158166 | 1.837283 | |
| Education level | −0.490799 | 0.222063 | −2.210175 | |
| Private car | 4.233176 | 1.194679 | 3.543358 | |
| Trip purpose | 2.820997 | 0.837977 | 3.366437 | |
| Travel distance | 2.260247 | 0.587686 | 3.846011 | |
| Bus ride frequency | 1.176485 | 0.395064 | 2.977963 | |
| Acceptable waiting time | 0.853989 | 0.517879 | 1.649015 | |
| LL(0): −260.623340 LL(): −200.429774 −2LL(0)–2LL(): 120.387133 : 0.230960 : 0.192590 | ||||
Note: ASC means alternative specific constant.
© 2018 by the authors. Licensee MDPI, Basel, Switzerland. This article is an open access article distributed under the terms and conditions of the Creative Commons Attribution (CC BY) license (http://creativecommons.org/licenses/by/4.0/).
Share and Cite
MDPI and ACS Style
Han, Y.; Li, W.; Wei, S.; Zhang, T. Research on Passenger’s Travel Mode Choice Behavior Waiting at Bus Station Based on SEM-Logit Integration Model. Sustainability 2018, 10, 1996. https://doi.org/10.3390/su10061996
AMA Style
Han Y, Li W, Wei S, Zhang T. Research on Passenger’s Travel Mode Choice Behavior Waiting at Bus Station Based on SEM-Logit Integration Model. Sustainability. 2018; 10(6):1996. https://doi.org/10.3390/su10061996
Chicago/Turabian StyleHan, Yan, Wanying Li, Shanshan Wei, and Tiantian Zhang. 2018. "Research on Passenger’s Travel Mode Choice Behavior Waiting at Bus Station Based on SEM-Logit Integration Model" Sustainability 10, no. 6: 1996. https://doi.org/10.3390/su10061996
Note that from the first issue of 2016, this journal uses article numbers instead of page numbers. See further details here.