Measurements of Pedestrian Friendliness of Residential Area: A Case Study in Hexi District of Nanjing


School of Architecture, Nanjing Tech University, Nanjing 211800, China
*
Author to whom correspondence should be addressed.
Sustainability 2018, 10(6), 1993; https://doi.org/10.3390/su10061993
Submission received: 14 May 2018
/
Revised: 7 June 2018
/
Accepted: 10 June 2018
/
Published: 13 June 2018
(This article belongs to the Section Sustainable Urban and Rural Development)
Abstract
:As part of urban transportation, walking plays an important role in promoting the development of urban green transportation systems. Through the analysis of resident travel preference and the influence factors on travel choice of land use and related effects, this paper puts forward the walking accessibility, pedestrian route directness (PRD), street walking popularity and the ratio of green interface as a quantitative index of the measurement system of pedestrian friendliness, to evaluate the effect of land use and urban space on the residents’ walking. Based on this, this paper takes Nanjing Hexi District as an example, using ArcGIS software to quantify the city residents’ travel purpose. Two-dimensional space characteristic analysis verifies that the high density and high degree of mixing, high accessibility blocks with good street environmental quality and open environment on the pedestrian block has a good role in promoting walking, and then puts forward optimization suggestions to promote the pedestrian friendliness in Hexi District.
1. Introduction
Walking is of great significance to the development of low-carbon cities. Advocating walking in cities is also a good policy to ease urban problems such as traffic congestion and environmental pollution. Since the 1990s, many countries have made great efforts to promote walking in urban development. For example, Germany has set up a central pedestrian zone in all cities and a vast majority of towns with populations of over 50,000; and in the United States, Portland has reduced the per capita number of kilometers traveled by cars by controlling the growth of urban boundaries, integrated development of transport and land use and by encouraging walking and cycling trips [1]. Some local governments and research institutes in the world are also pushing forward the evaluation research on the development of walking trips and setting the city’s pedestrian friendliness as the standard for assessing the livability of cities. For example, the Scottish Walkability Assessment Tool has been used to evaluate the city’s pedestrian friendliness level [2]. In 2007, American scholars put forward the “Walk Score”, a city walk friendliness score system, which has been widely accepted internationally and has been practiced in many countries [3].
Many scholars have conducted extensive research on the pedestrian friendliness of cities. The commonality of these studies is to build a suitable walking environment in the city, thus promoting more walking behavior.
Some scholars believe that land use patterns often affect the choice of residents’ travel mode. High-density mixed land use patterns can significantly promote pedestrian trip. Generally, the higher the density means the smaller the distance the public travel for different purposes such as living, working and leisure shopping. Cervero found that higher density, diverse land use and pedestrian-oriented design could reduce motor vehicle trips and encourage non-motorized trips [4]. Ewing believed that residents living in compact communities walked more [5]; Lu and Ding et al. advocated high-intensity development and encouraged public transport and believed that it would effectively reduce the total demand for travel and shorten the residents travel distance, thereby promoting residents to walk and use other forms of green travel [6]. Many theoretical studies and empirical analyses show that the intensive land development and the spatial pattern of compact growth can reduce people’s travel distance, thereby reducing their dependence on car travel and promoting the pedestrian trip.
The overall purpose of the above study is to reduce the distance of daily travel behavior, optimize the urban construction environment, improve the quality of walking travel, and ultimately improve the proportion of people walking in daily travel. Therefore, this paper takes Hexi District in Nanjing as an example to study the influence of land use and the spatial pattern of neighborhoods on pedestrian travel and conducts a quantitative analysis on the relevant indicators by establishing a model, so as to provide effective reference for the study on improving the city’s pedestrian friendliness.
2. The Impact Factors of Built Environment Based on Flexible Trip Perspective
Travel behavior can be divided into the necessary travel and flexible travel. The former one refers to commuting travel behavior, which is characterized by fixed travel time, routes and ways and is often related with the distance between office location, residence and urban transportation. The flexible travel is characterized by shopping, fitness, leisure and communication, etc. Its travel time, route and way are more flexible, and the behavior itself will be influenced by the travel distance, travel time, the built environmental quality, street popularity and many other factors. In order to explore which factors affect the flexible travel of residents, the author selected the Hexi District of Nanjing as the research area and studied the travel preferences and travel mode choice of residents’ flexible travel behavior. Based on the study, the impact factors were selected for analysis.
2.1. Overview of Research Area
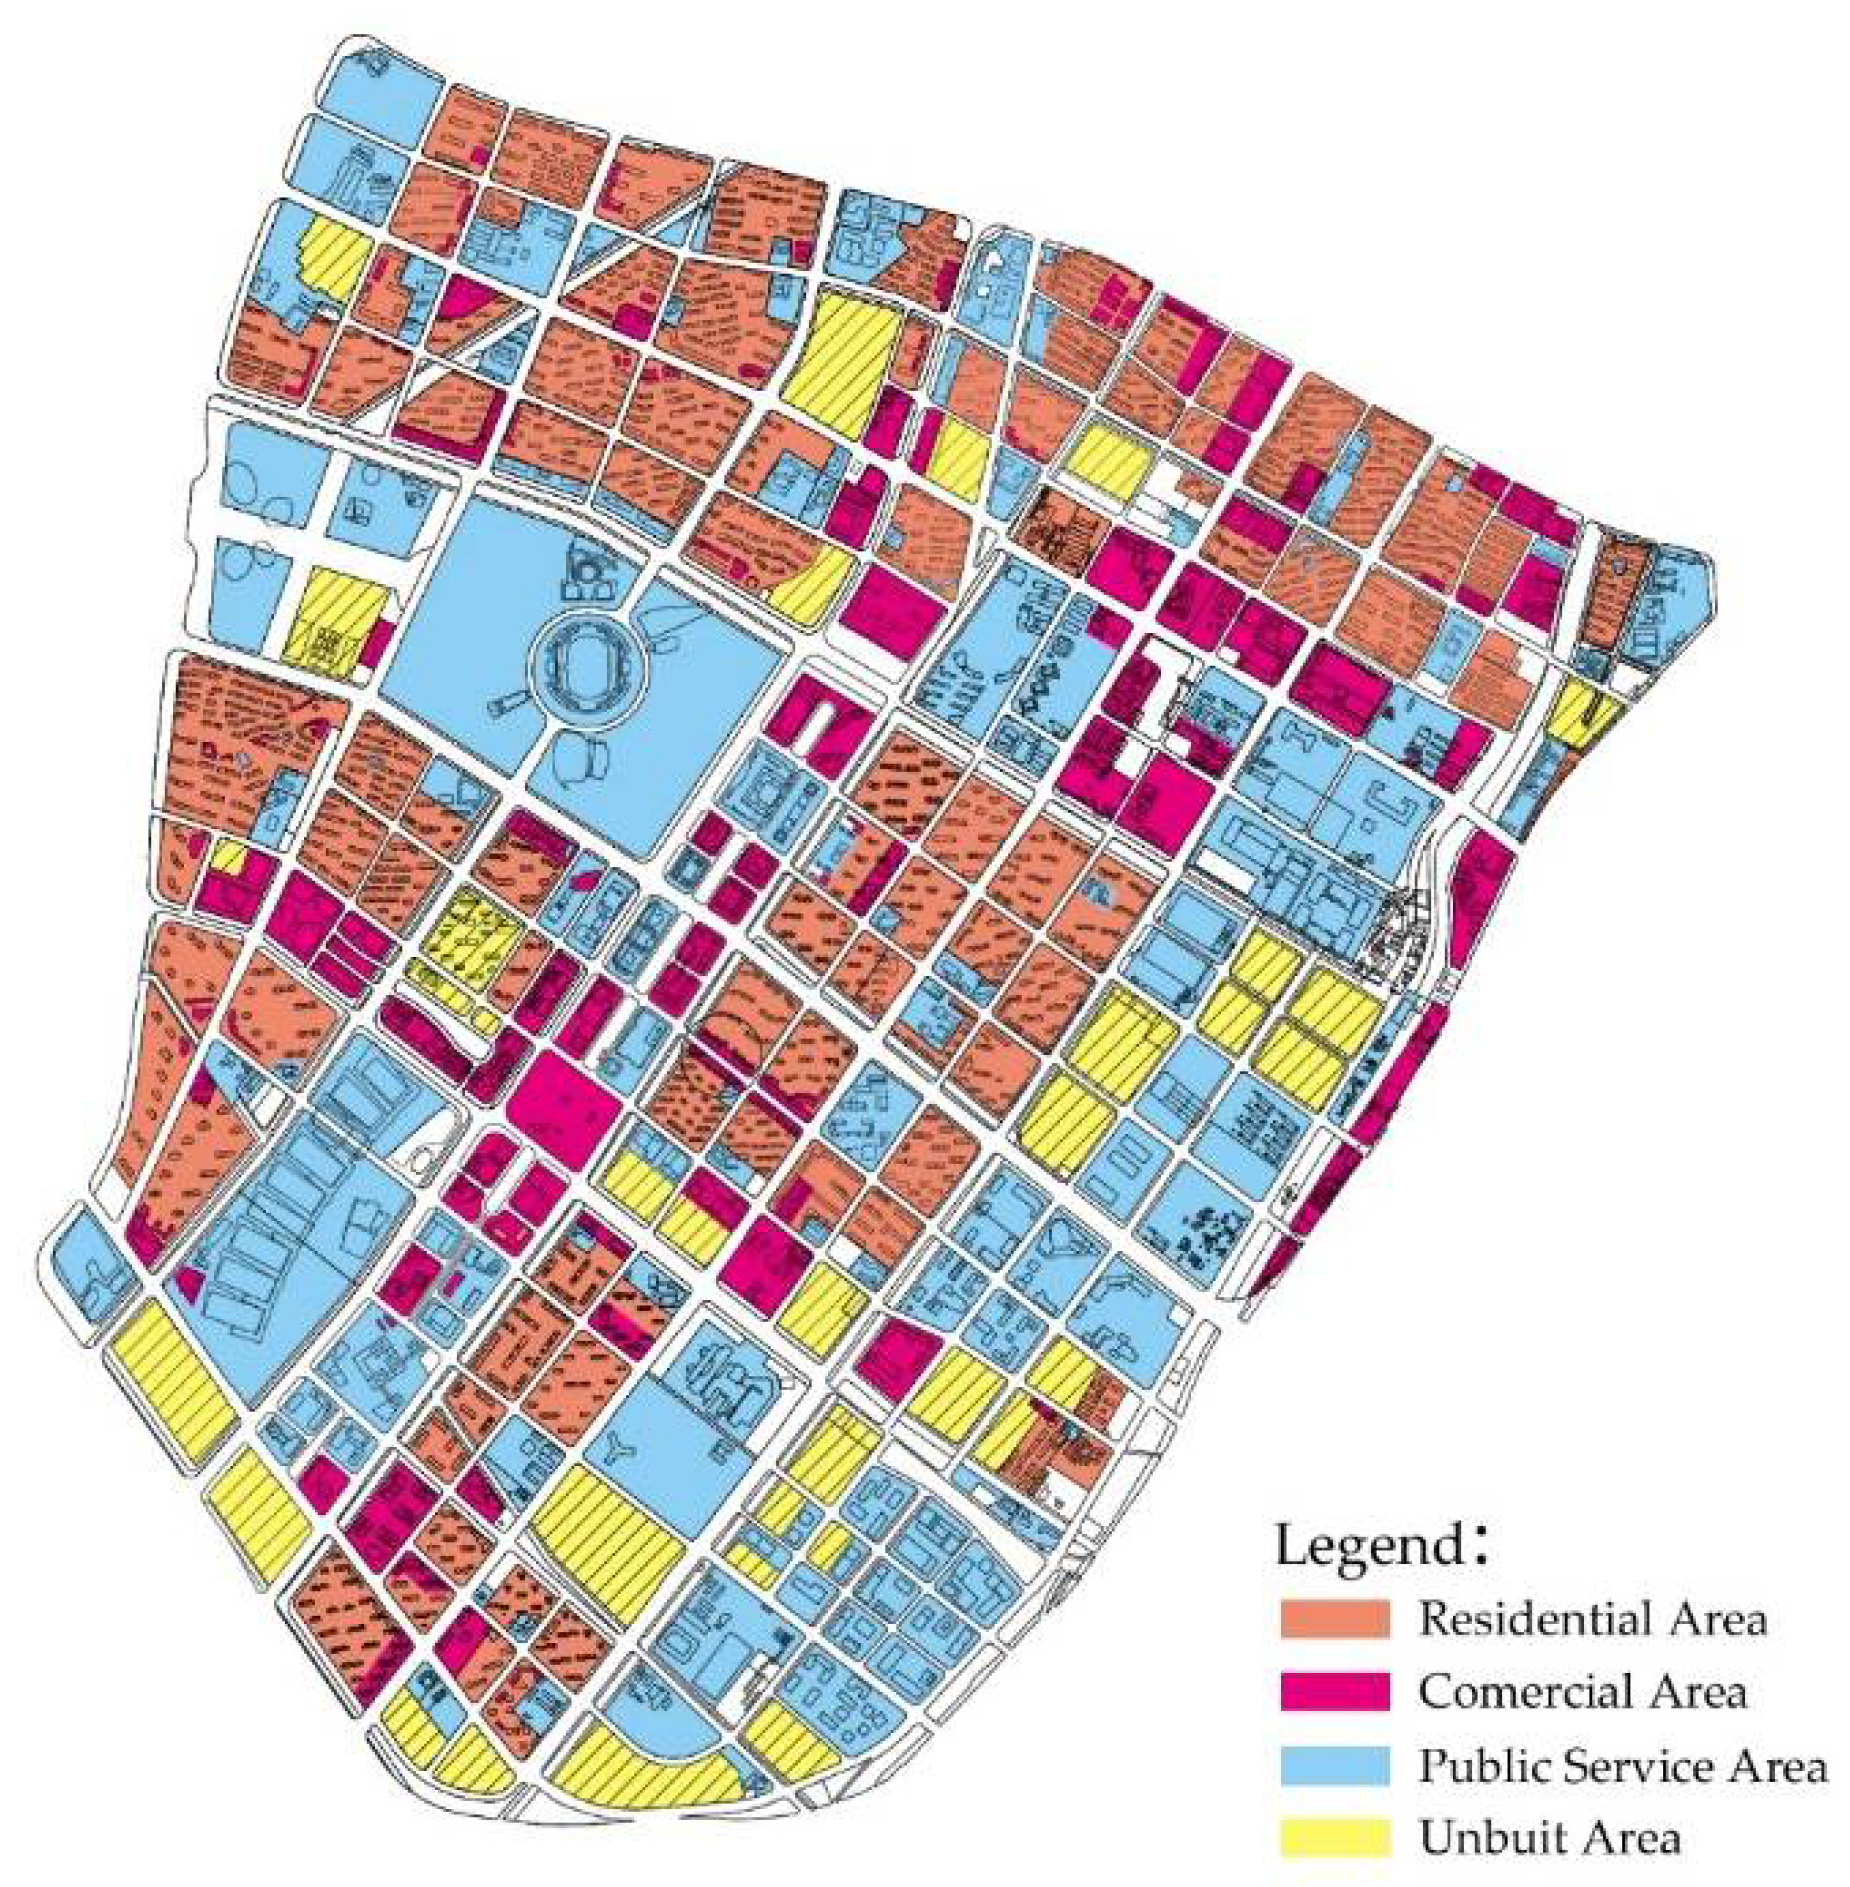
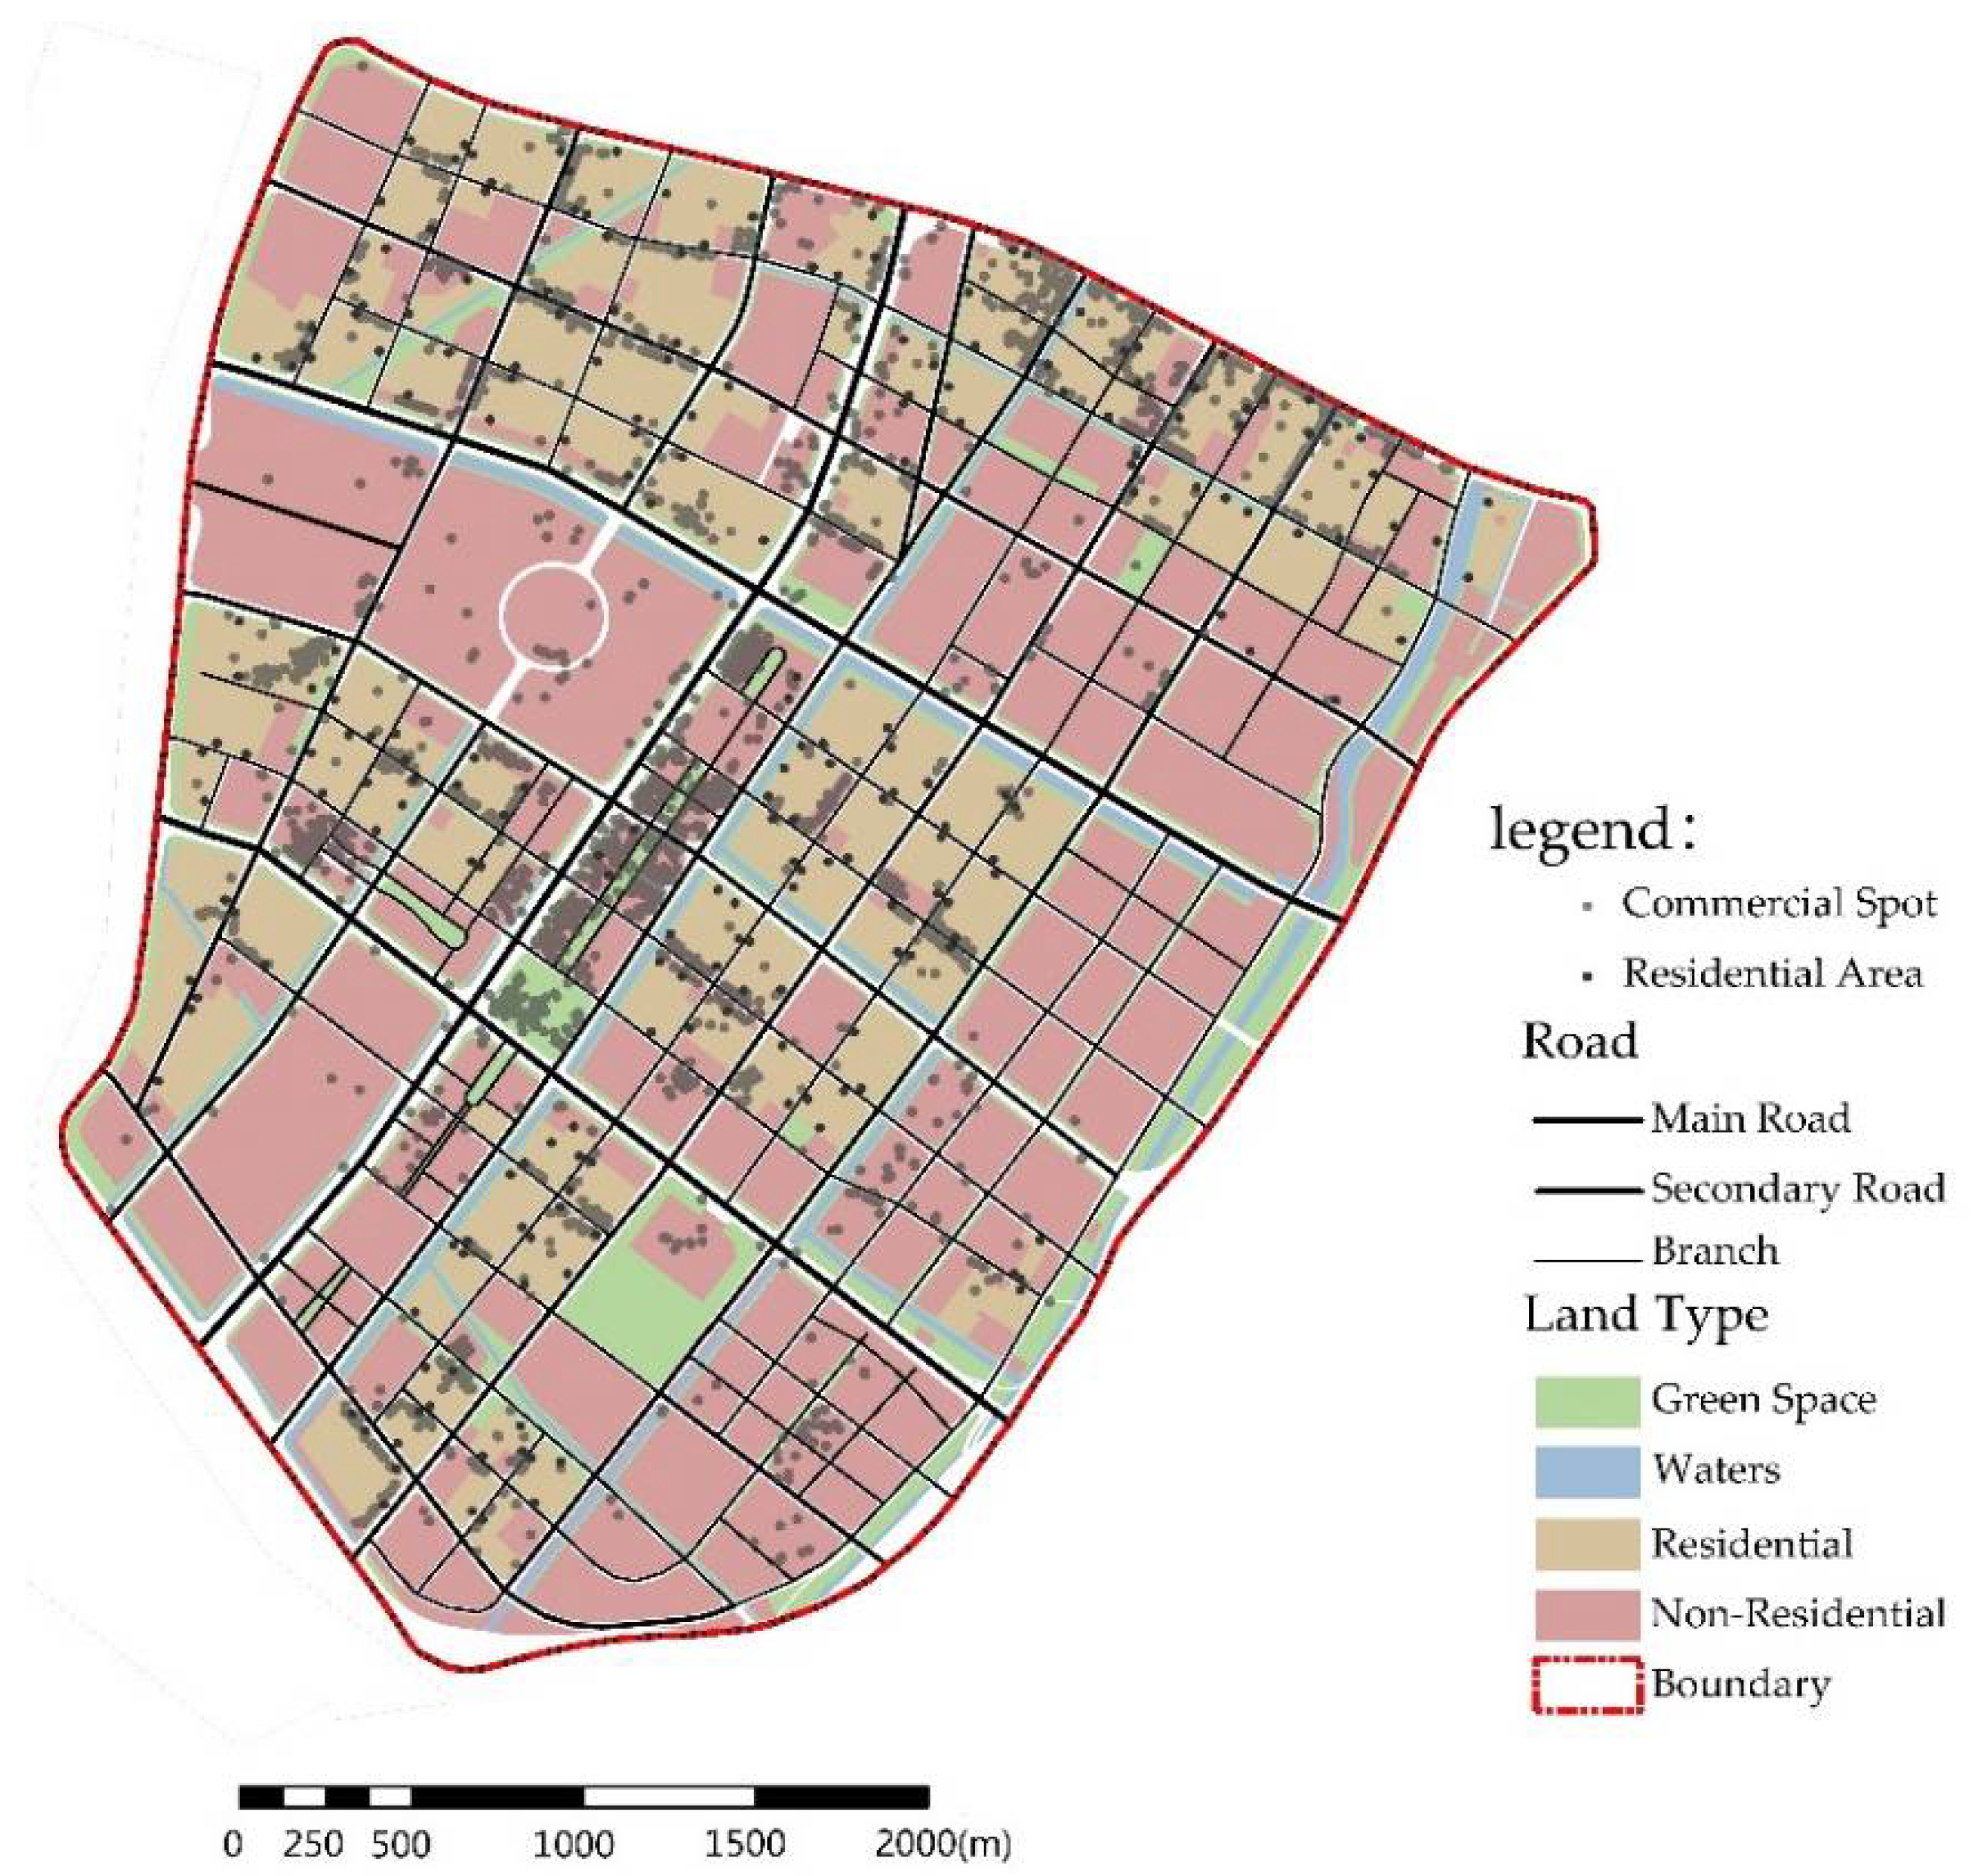
The study area is the central part of the Hexi District of Nanjing, the provincial capital of Jiangsu Province. As the center of the new city, the Hexi District of Nanjing has gathered many urban functions such as business, residence, exhibition, culture and sports. The study area is the central part of the Hexi District, with Fengtai South Road in the east, Yangzijiang Avenue in the west, Yingtian Street in the north, and Jiangshan Street in the south, all surrounded by urban expressways. Since 2000, after more than 10 years of construction, the district has formed a relatively complete urban spatial form and infrastructure, which is mainly divided into four types including residential lands, commercial lands, public service lands, and areas to be built (Figure 1). To note here, in recent years, China’s real estate development has mostly adopted the construction mode of gated residential blocks. The residential blocks adopting this development mode are often surrounded by streets and roads. Most of them are isolated from the outside by fences and gates. The internal roads of these blocks are not open to the public, only for the use of the owner. Therefore, the roads within the block are not concerned as urban public roads.
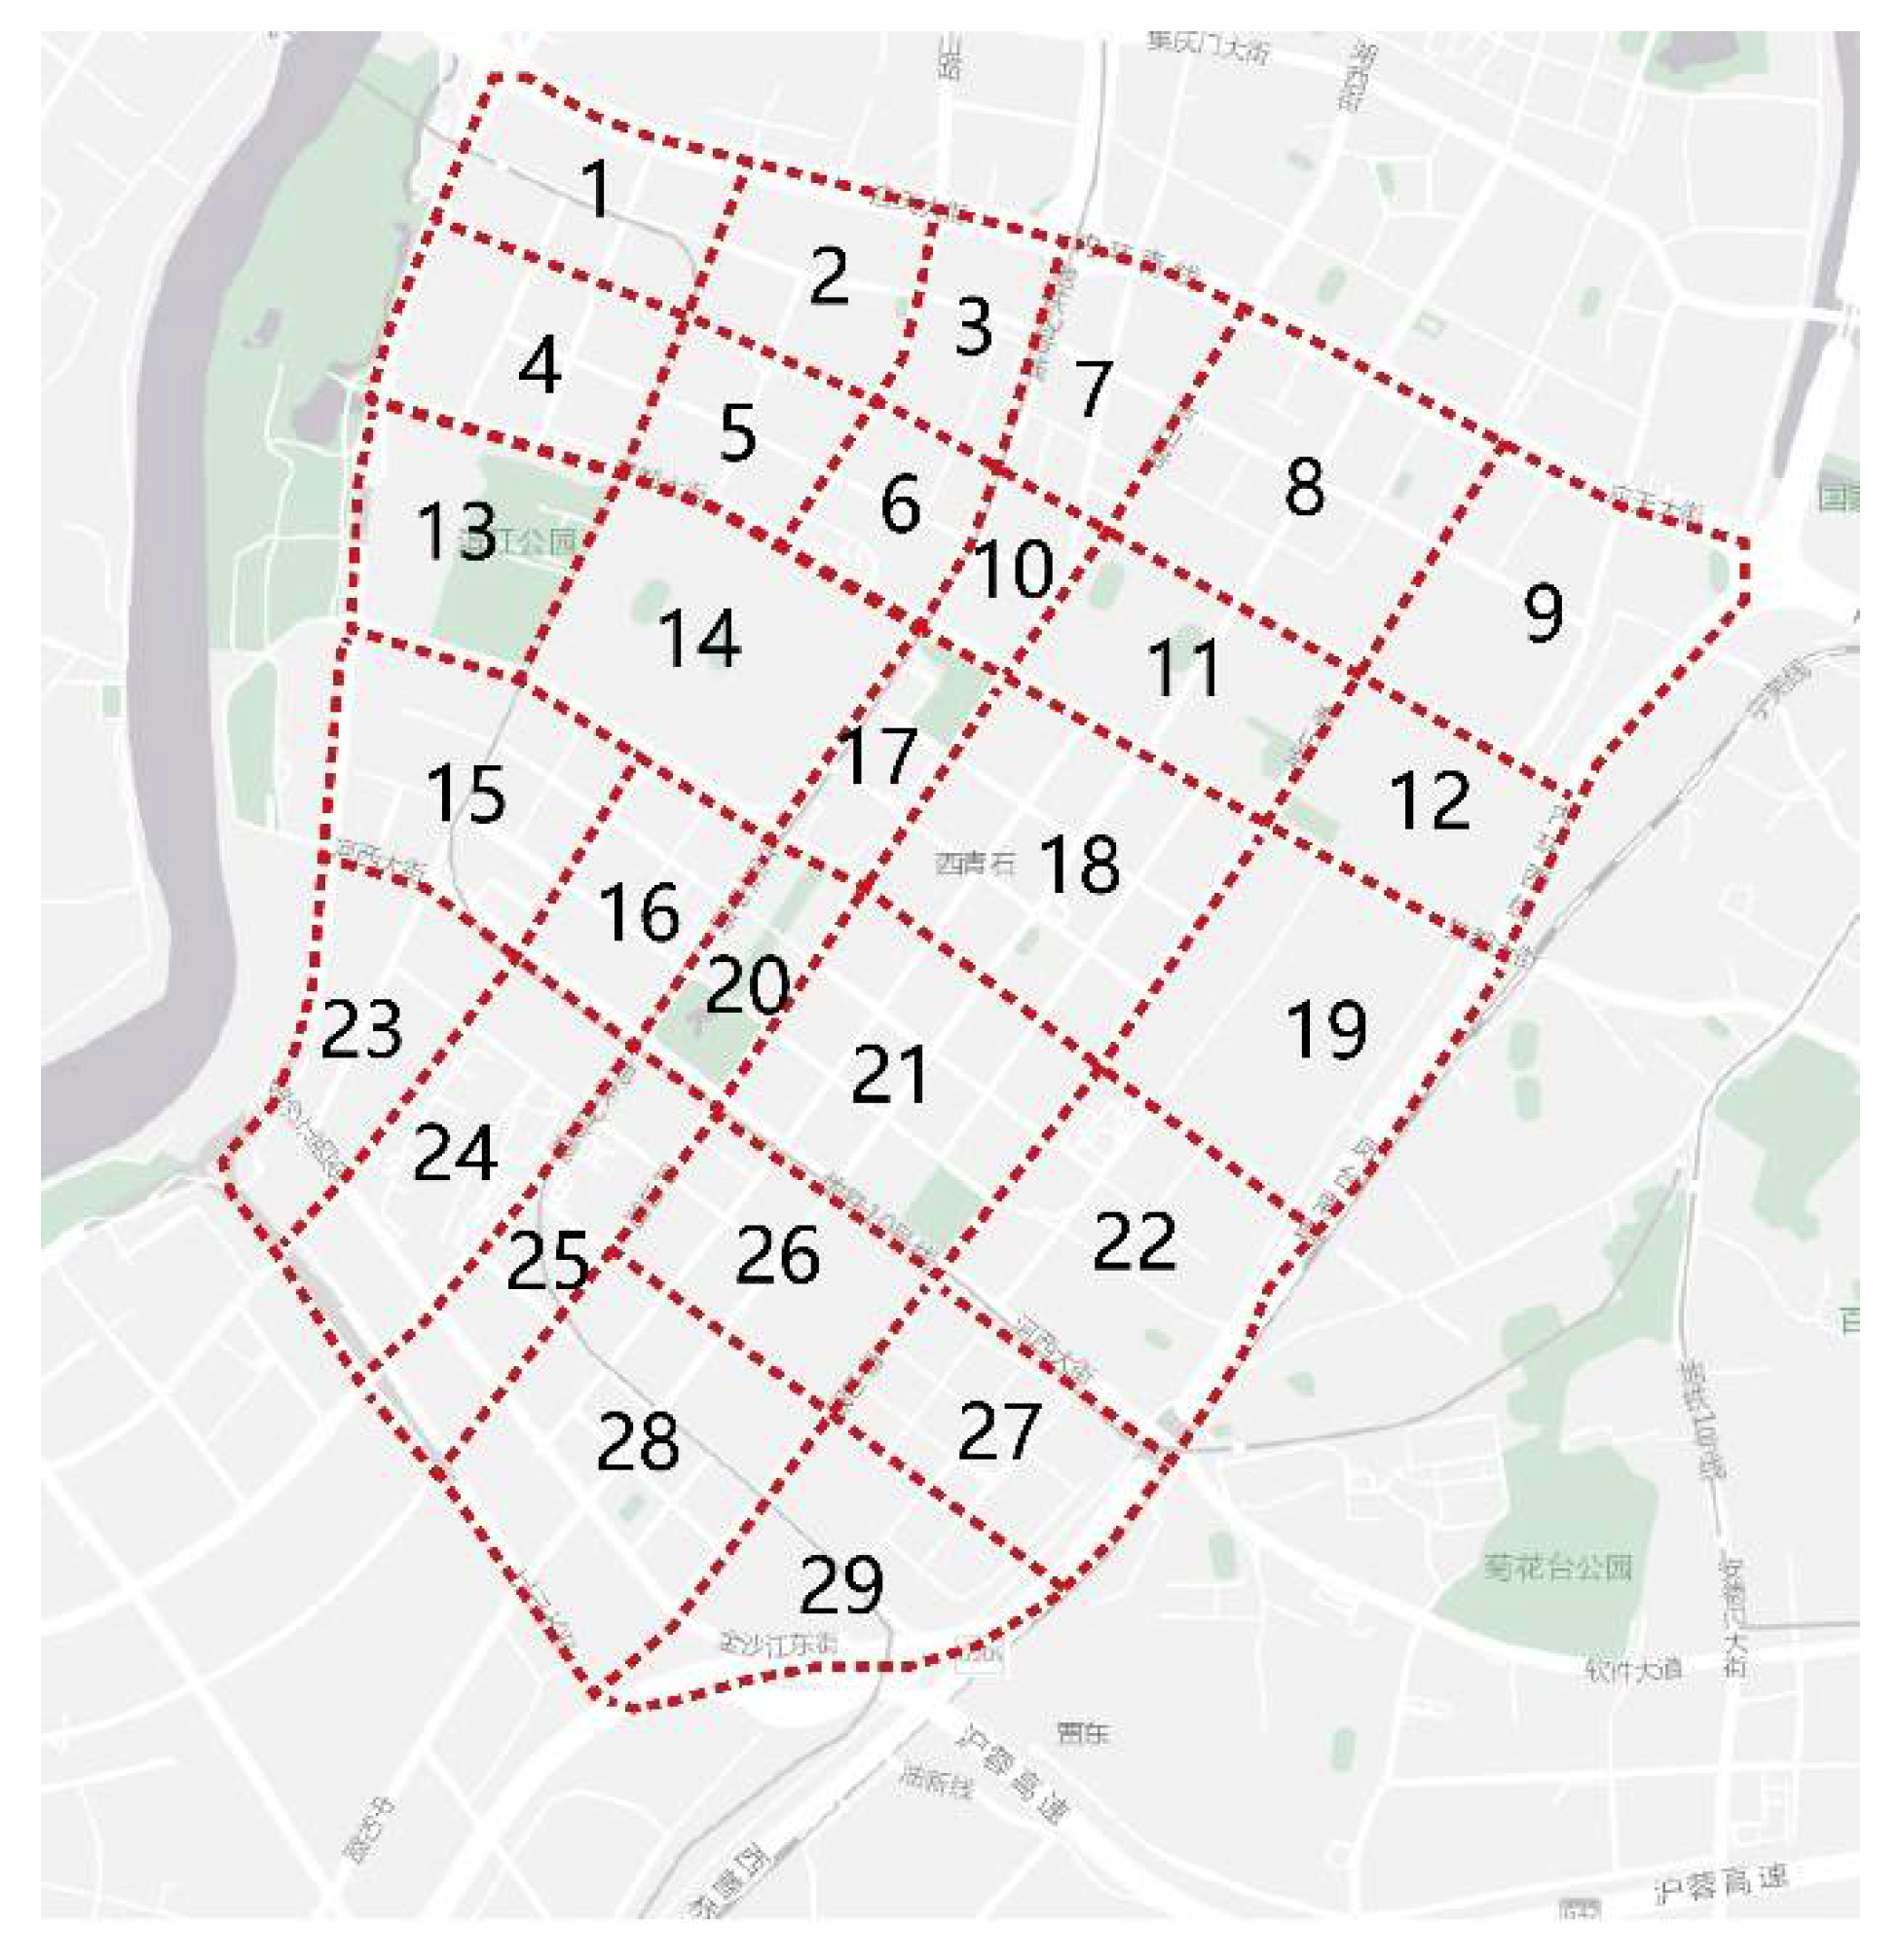
The author divides the research area into 29 traffic analysis zones (TAZ) using the public urban main roads as the standard of division (Figure 2).
2.2. Impact Factors of Pedestrian Travel Based on Residents’ Travel Preference
The preliminary data collection of this study is mainly divided into two parts: A survey of residents’ travel preferences and travel concern factors and a survey of residents’ travel mode choice.
2.2.1. Data Collection
• Survey on Residents’ Travel Preferences and Travel Concern Factors
This survey is mainly aimed at surveying the three types of travel behaviors of residents in the Hexi District, including daily commuter traffic, shopping and consumption travel, and leisure and entertainment travel. The questionnaires were sent to residents to investigate their preferred travel mode among the above three types of travel behaviors, as well as the factors that are of concern when travelling on a daily basis and scoring the factors that they think affect their travel experience. At the same time, a personal attribute survey was set up in the questionnaire to exclude non-local residents’ questionnaires. The main contents of the investigation include:
① Survey of residents’ travel preferences: According to the purpose of travel, it is divided into three categories: commuting, daily shopping and consumer travel and leisure and entertainment travel. The frequency and transportation modes of residents in the above mentioned three kinds of travel are recorded, among which the alternative modes of transportation include walking, non-motor vehicles, public transportation and motor vehicles.
② The survey of residents’ travel concern factors: Through the questionnaire, the investigated individuals selected their concern factors that have an impact on their walking travel and rated the satisfaction of these factors between 1 and 10 points, so as to obtain the satisfaction of residents on the built environment of Hexi District.
• Survey of Residents’ Travel Mode Choice
In order to obtain the actual measurement data of residents’ travel behavior in Hexi, this study used camera counting to record residents’ non-commuting travel. It can be seen from Section 2.1, that currently China adopts the model of gated residential block to construct residential land. Therefore, in this study, in order to effectively distinguish between local residents and outsiders and also because it is convenient to explore the relationship between the amount of travel behavior and the resident population, 46 residential blocks were selected for survey of residents’ travel mode in the 14 main residential TAZs of NO. 1, NO. 2, NO. 4, NO. 5, NO. 7, NO. 8, NO. 9, NO. 10, NO. 15, NO. 18, NO. 21, NO. 23, NO. 26, and NO. 28.
On a fine weather day, the author selected 9:30–16:30 and 18:00–20:00 to set up a fixed camera to record the residents’ trips in the area and obtain residents’ videos during non-commuting hours, using OpenCV and Matlab software to track and count the moving objects in the video. Because this study uses a fixed camera to collect residents’ travel data, the background changes little, so the moving objects are identified and counted by using the inter-frame difference method and the background difference method. The specific process includes: ① Firstly, Frame processing is performed on the original video; ② Select several frames without moving objects to compose a static reference background frame; ③ Performed grayscale processing on each frame so as to reduce the amount of computation; ④ Set different target-scale adaptive algorithms for moving objects; ⑤ Eliminate boundary effects; ⑥ Use the inter-frame difference method and the background difference method to identify the features of moving objects, so that the moving objects are tracked and identified.
2.2.2. Data Analysis
• Analysis of Residents’ Travel Preferences and Travel Concern Factors
After sorting out the collected questionnaires, a total of 1099 valid questionnaires were obtained. From the perspective of residents’ travel preferences (Figure 3), in non-communicative transportation, 56.41% of residents preferred to walk. In the two main types of non-commuting traffic behaviors, the residents’ preference for walking in leisure and entertainment travel is 58.66%, which is slightly higher than 54.13% in shopping and consumption travel. It can be seen that walking is absolutely dominant in the flexible trip. More than half of the residents will choose to walk in non-commuting travel. There are also some respondents who declared that in addition to outings or vacations, almost all of the daily flexible trip is walking, it can be seen that walking has almost become a “rigid demand” in non-commuting traffic for residents.
In the survey of the concern factors, the author summarized the factors that concern residents during walking. It is mainly divided into five categories: street landscape planting, street leisure facilities, garbage cans and billboards and other facilities, public transportation station layout and convenience of stores along the street.
By summarizing the scores of residents rated on the above factors (Figure 4), it can be seen that residents have a good overall evaluation of the built environment quality of Hexi District. Only TAZ No. 10 and No. 23 have residents scoring less than 6 points on the street leisure facilities, while all other TAZs have scored more than 6 points, and many zones have scored more than 8 points on the factors.
• Analysis of Survey Data of Residents’ Travel Mode Choice
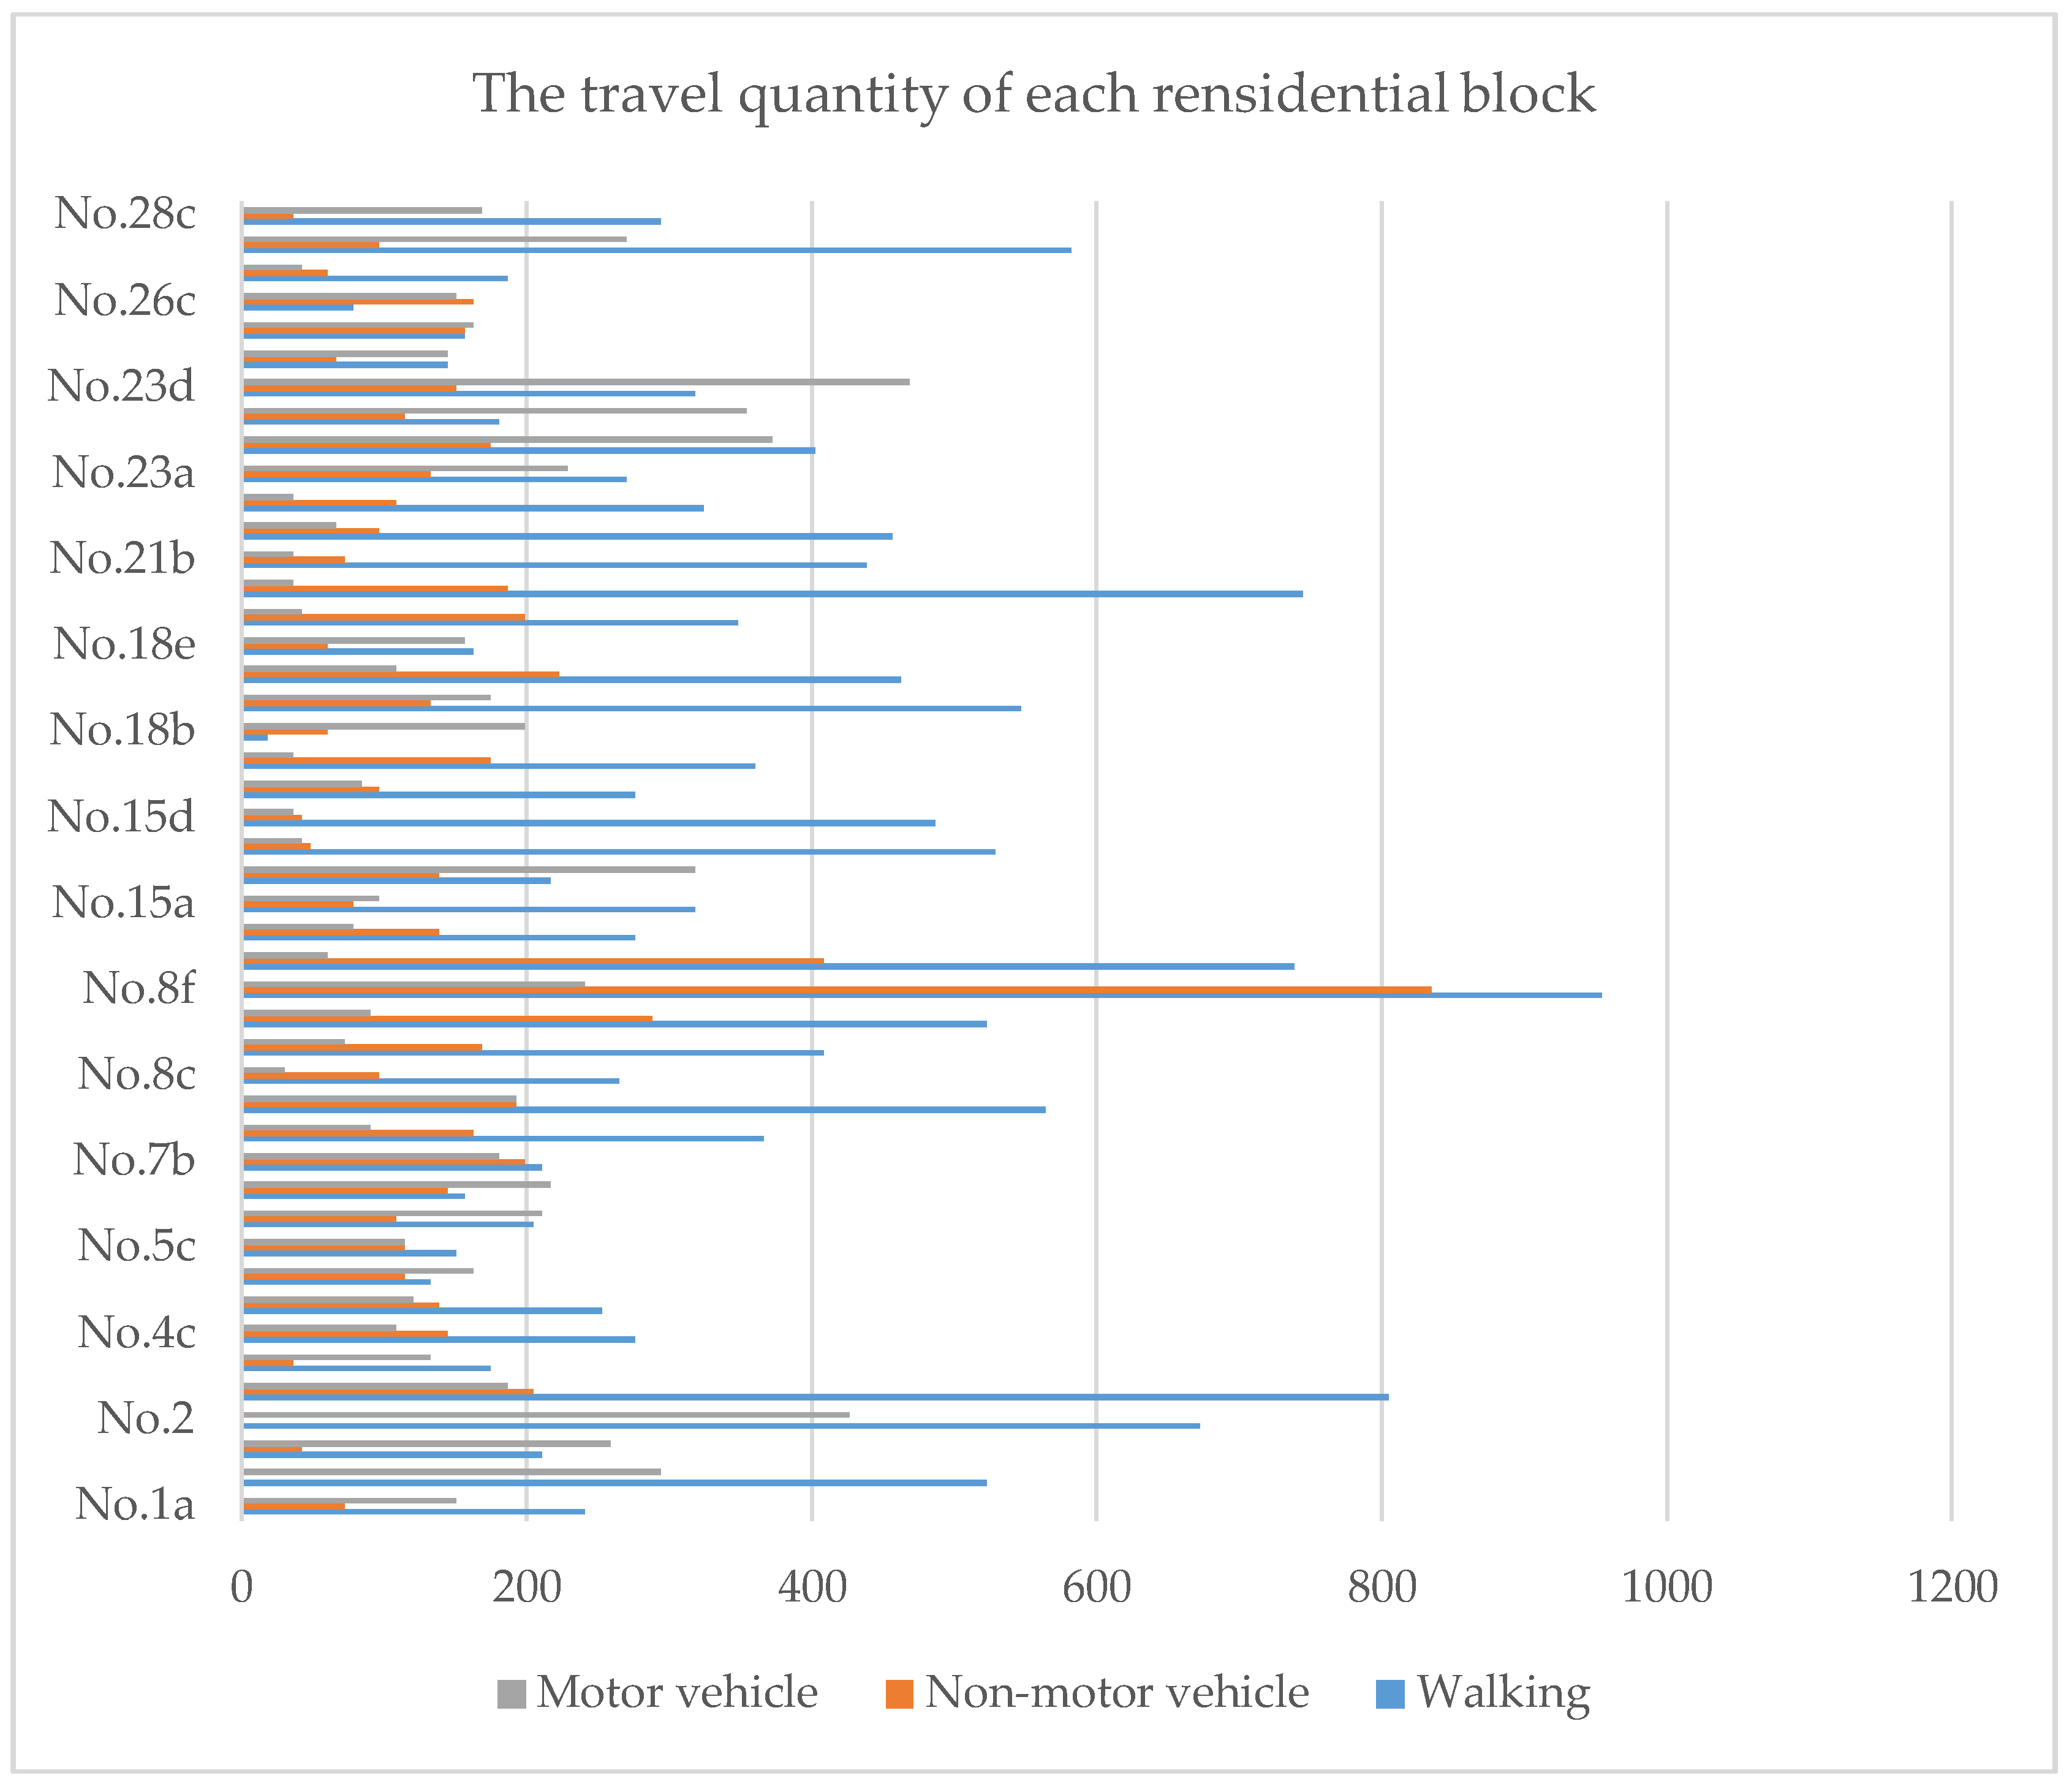
A total of 23,760 samples of travel behavior have been obtained by using the above algorithm in Section 2.2.1. Through the summary of the travel quantity of each residential block in the study area, the author obtained the resident trip data (Figure 5). It can be seen from Figure 5 that the difference of absolute number of travel amount between each residential block is huge. The maximum number of pedestrian trips in these blocks exceeded 900 people per day, and the minimum number is less than 20 people. By comparing with the size of the block and the total travel amount, the absolute value of walking travel is influenced by the popularity of each residential block and the surrounding environment.
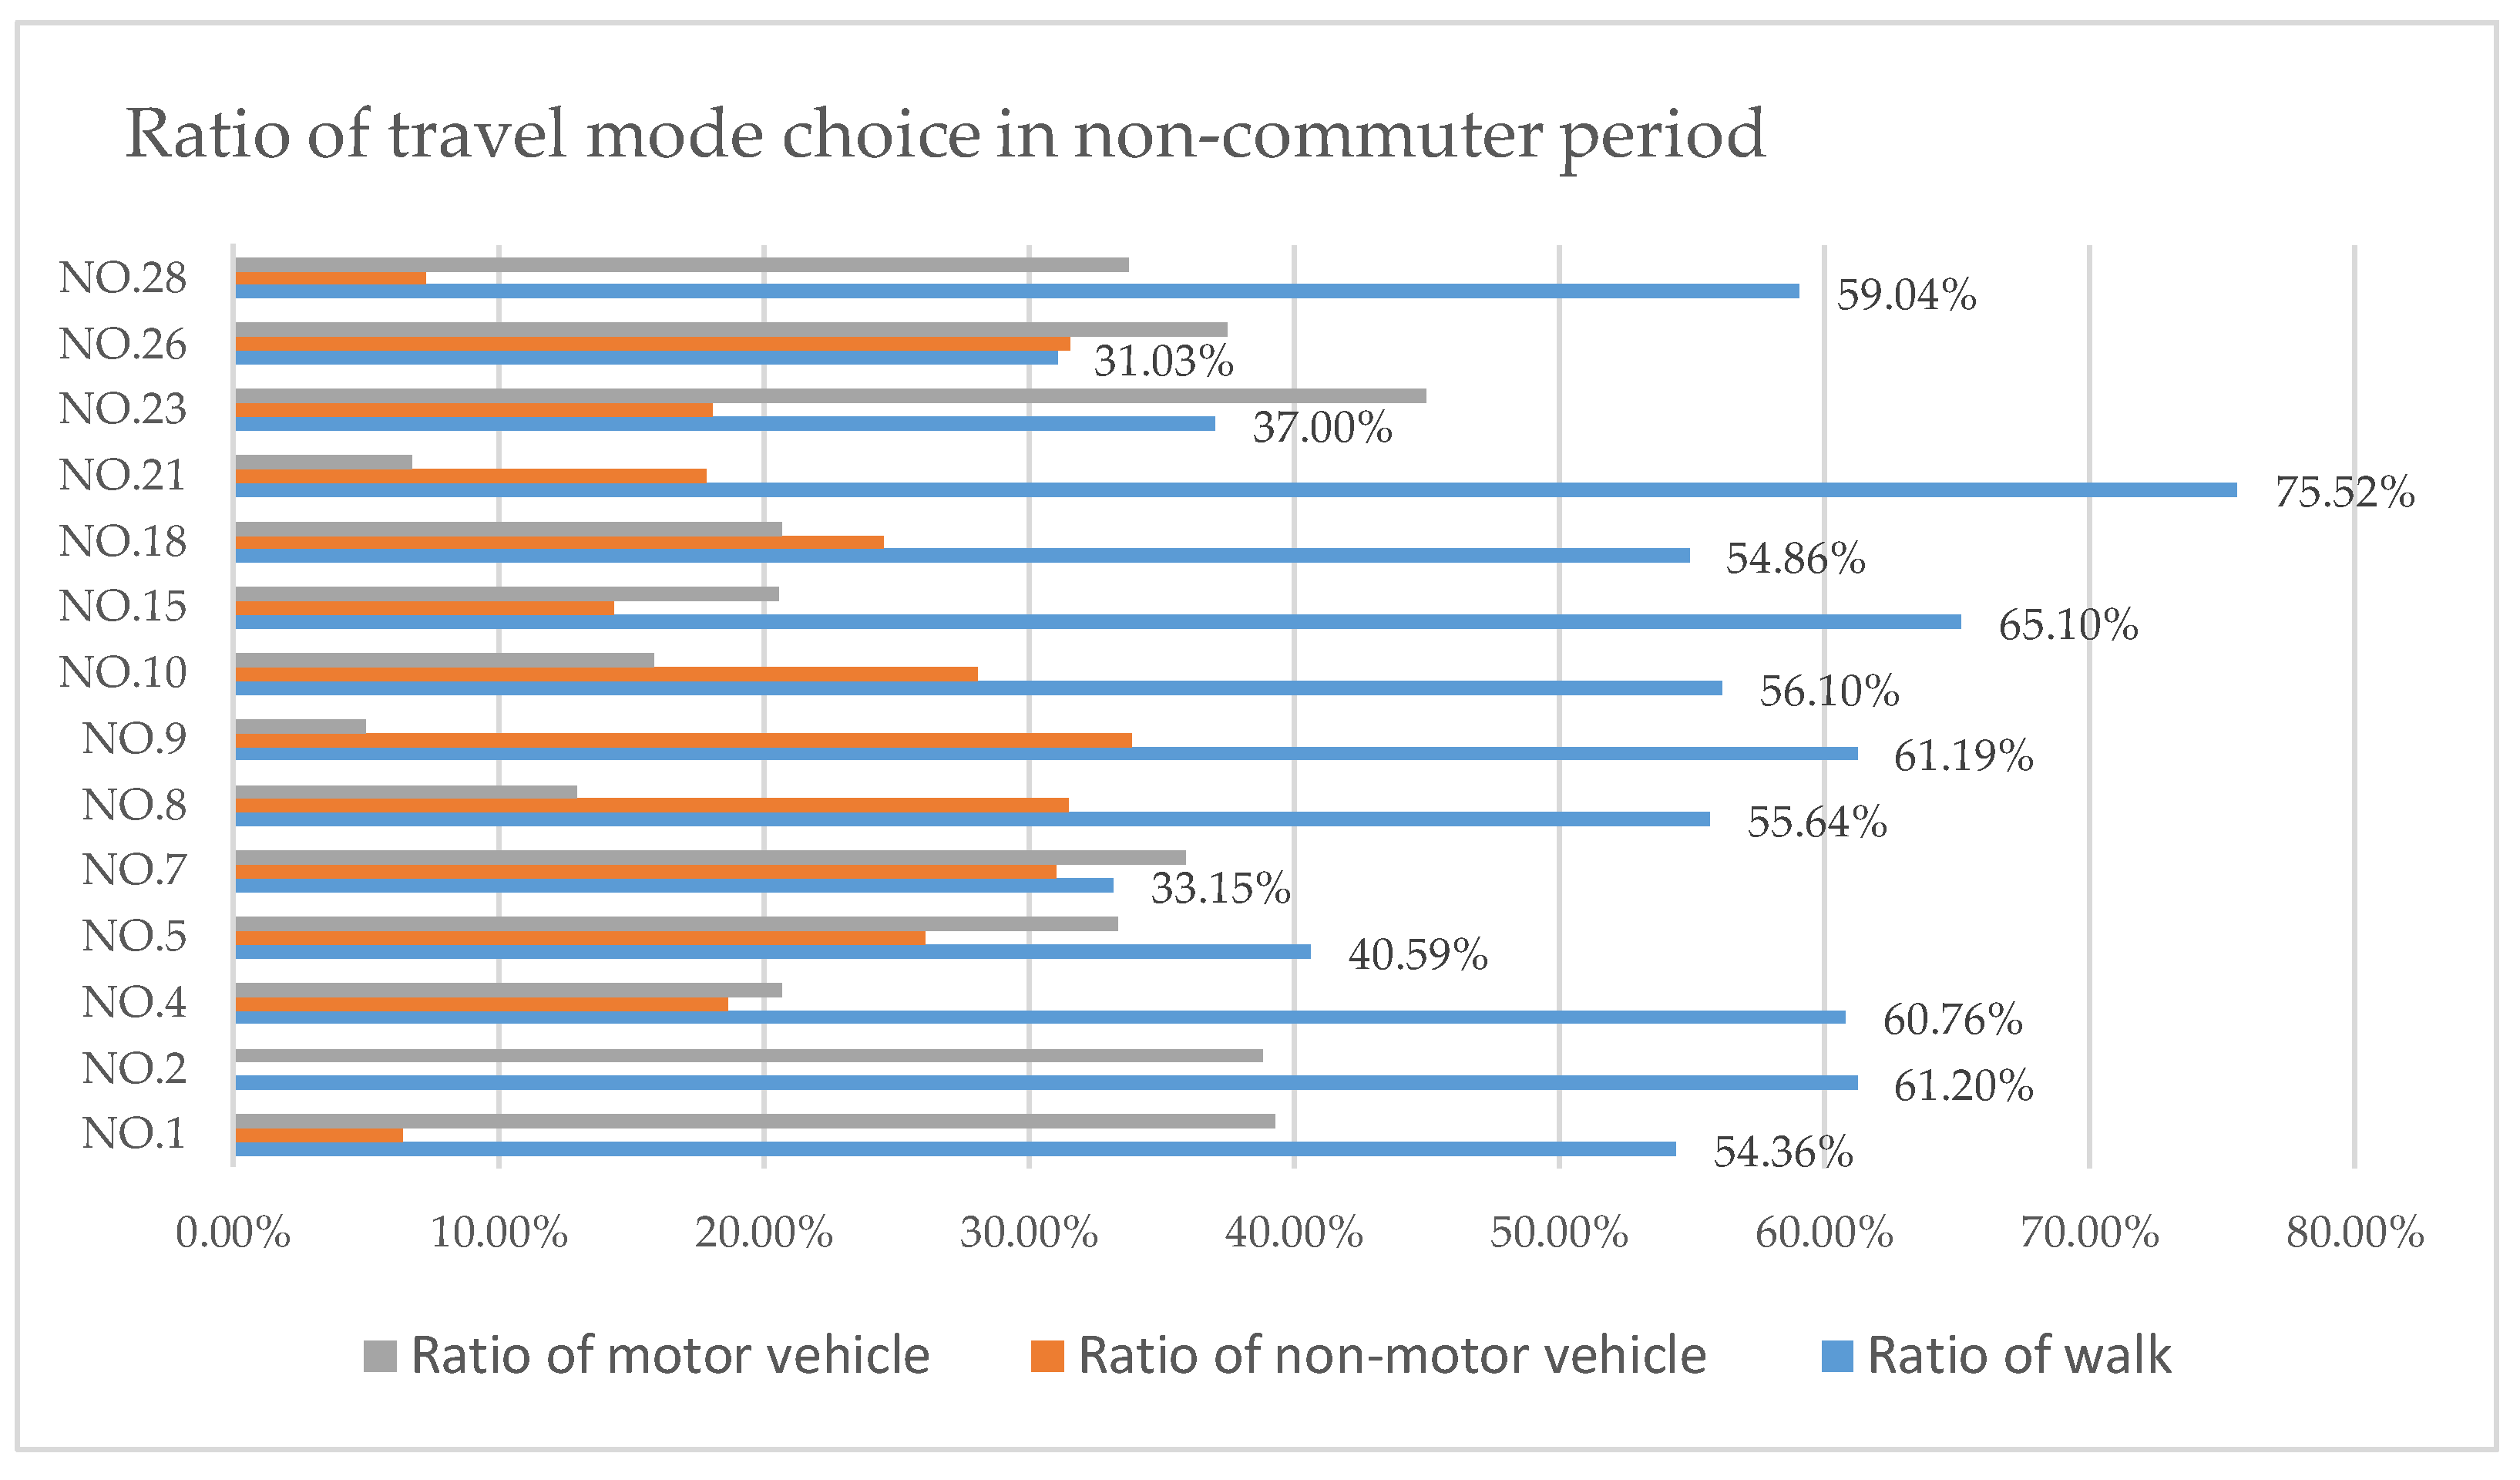
In order to further understand the choice of each traffic mode in daily life, the author summarizes the above survey data and obtains the ratio of travel mode choices in the non-commuter period of the main residential TAZs. From Figure 6, it can be seen that the proportion of actual walking trips in most TAZs meets or is close to the proportion of walk (56.41%) in the survey of residents’ preferences to travel. Among them, the highest percentage of walking in TAZ No. 21 reaches 75.52%; however, TAZ No. 5 (40.59%), No. 7 (33.15%), No. 23 (37.00%) and No. 26 (31.03%) were significantly lower than the walking ratio of 56.41% in the residents’ preference survey.
From this it indicates that although the actual walking ratio in most areas has reached or exceeded the pedestrian ratio in the residents’ preference survey, there are still some issues in some TAZs that have hindered residents’ willingness to travel by walk, resulting in a substantial proportion of their actual trips being far below the expected value.
2.2.3. Correlation Analysis of Residents’ Concern Factors and Residents’ Flexible Trip Mode Choice
Using the data collected above, the author used the SPSS statistical software to analyze the correlation between the residents’ travel preference data and the residents’ non-commuting travel mode choices; the Spearman correlation analysis about the residents’ travel selection data separately along with the scoring of street greening, street leisure facilities, trash cans and billboards, the convenience of layout of public transportation, and the convenience of shops along the street, was conducted to identify variables that have an impact on residents’ flexible trip.
Through the correlation analysis of the residents’ preference to travel and the residents’ choice of flexible trip mode selection data, we can see (Table 1) that the urban construction variables that are significantly related to residents’ choices of flexible trip modes include street landscape planting and convenience of stores. Three items of street rest facilities: Garbage can, billboards and public transportation station layout did not have a significant correlation with the choice of residents’ mode of flexible trip. The higher the convenience of business along the street and degree of satisfaction with greening along the street, the more residents choose to travel by walking. It can be inferred that residents are more concerned about whether they can easily obtain commercial and public services in non-commuting traffic, and whether there is good landscaping to ensure the quality of walking.
3. Quantitative Indicators Affecting Flexible Walking Travel
In the study above, the factors related to the choice of flexible travel mode are determined. From the perspective of flexible travel behavior, the author considered that the flexible travel can mainly be divided into purposeful, flexible travel behavior and non-purposeful, flexible travel behavior. The former includes shopping, going to the gym or restaurant, etc., and the latter includes strolls, walking the dog, etc. Therefore, the author discusses the influence on flexible travel from four aspects of travel time, travel distance, street popularity and the built environmental quality. The author will discuss the influence on flexible travel from four aspects of travel time, travel distance, street popularity and the built environmental quality. This chapter will further quantify the above factors so as to obtain indicators that can measure the pedestrian friendliness.
3.1. Travel Time
In terms of travel cost, the cost of money and the cost of time are the main factors that affect the travel mode choices of residents. Through quantitative research on transportation cost, Pan found in his research that the most influential factor to travel cost was travel time [7]. Since walking is a human-driven mode of transportation, walking duration is often related to the feeling of the pedestrian. Horning found in her study that within 5 min, it was the best time for residents to walk [8]. In most studies based on walking, the walking distance of 5 min (400–600 m) is often taken as the reference for the suitable walking distance. However, for different travel behaviors, there are also differences in residents’ travel habits. Lu found in his research that residents have different tolerable limit travel times for different travel purposes, with a commuting time of 45 min, shopping of 35 min and leisure and entertainment time of 85 min [9]. Yang and Xu use time cost accessibility to evaluate the level of public services in different residential areas. They believe that the purpose of facility planning is to ensure equitable access to different classes of residents (with equal results), rather than to satisfy the fairness of geographical space (with equal forms) [10].
Through the analysis in Section 2.2.3, for the purpose of flexible travel, the convenience of stores down the street was significantly associated with residents’ travel mode choices, which indicates that the accessibility of stores and public service facilities around the community is an important factor influencing residents’ choice of flexible travel. Considering the effect of time cost on walking travel, the weighted average travel time based on the potential model is taken as the measurement index. The potential model was first proposed by Lagrange by referring to Newton’s law of gravity, and then developed into a classical model to study the interaction between urban spaces [11]. Hansen also introduced the potential model when analyzing the relationship between urban population activities and residential land development, he defined accessibility as the potential to obtain interaction opportunities [12]. The analytical model used in this article is based on Geertman’s formula of the potential model [13], which takes time as an expression for accessibility, so that it is easy to understand the meaning of the accessibility value.
The potential model is regarded as the basis for the analysis to describe the relationship between supply and demand and spatial relations between two locations in urban space. By quantizing the characteristics of the two-dimensional streets and classifying the departure and destination of residents’ walking trips, an analysis model is established, coupled with the space resistance surface, to simulate the walking behavior in the area. Therefore, the model can better reflect the situation of considering travel destinations in actual traffic trips. The specific formula is shown as follows:
represents the weighted average travel time of the demand point; is the probability distribution function of the spatial strength of the resource provided by the supply point j to the demand point i; is the transit time between the demand point i and the supply point j; is the spatial intensity between demand point I and the supply point j; is the supply intensity of supply point j; is the spatial distance between point i and point j, The distance in this paper is the actual shortest path distance. f () is the distance attenuation function; is the supply intensity of all points to demand point i in the calibration range; and k is the number of supply points.
3.2. Travel Distance
Absolute distance to the destination is the most influential factor that affects pedestrian travel; the importance of travel distance is much greater than factors such as weather, the body situation and the fear of crime [14]. The travel distance is not only an expression of the spatial relationship between the origin and the destination in the actual physical environment, but also a reflection of the personal willingness of residents in their travel behaviors.
Generally speaking, travel behavior is dependent on urban road network and road facilities, the length of most routes is often greater than the space linear distance between the corresponding origin and destination. Daff’s study finds that only 27 percent of walkers are willing to make long detours to use the crossing street facilities [15]. It was observed in the study by Jan Gehl that the majority of pedestrians prefer to take a risk from the ground directly to get over the street and are unwilling to use underground access [16]; Considering that walking behavior is greatly influenced by the physical strength of walkers, most walkers prefer more direct paths. Therefore, many scholars have introduced the Pedestrian Route Directness (PRD) to describe the ratio of the path length and the spatial linear distance between origin and destination, so as to express the extra distance required for walkers to reach their destination.
In order to further consider the effect of travel distance on the purposeful flexible travel, the author introduces the relationship between the supply and demand of the origin and destination in the above potential model in the traditional pedestrian route directness to get the integrated pedestrian route directness of the area. That means to calculate the ratio of the straight-line distance to the actual shortest walking distance in the space based on the spatial relationship of origin and destination in the potential model, it is necessary take the attraction probability function of the supply point to the demand point as the weight of the segment path and then obtain the integrated pedestrian route directness of a region by weighting the pedestrian route directness of all the starting and ending points.
is the integral pedestrian route directness of demand point i. is the probability distribution function in the above potential model. is the pedestrian route directness between the demand point i and supply point j. In summary, the integral pedestrian route directness in this paper is a pedestrian route directness that takes into account the service of the travel destinations for different travel destinations. This factor can not only evaluate the linear coefficients of a road network in a certain area of the city, but also explore the influence of the spatial distribution of travel destinations on the pedestrian route directness.
3.3. Street Popularity
As a slow mode traffic in an open environment, walking is not only a kind of urban traffic mode, but also a part of urban life. Communicative activities and social activities will also stimulate the generation of walking behaviors, especially the generation of non-purposeful walking behaviors (that is, the travel itself is the purpose). Good street popularity can effectively improve the pedestrian density of streets, thus promoting the generation of Communicative activities and social activities.
Studies have shown that there are many links between street popularity and walking behavior. As the origin-destination for most traffic behaviors in cities, the residential area is the most important urban function to hold the population, and it is also the most direct source of street popularity. Agrawal and Schimek believe that when the population density reaches 9700 people per km2, the residents have more trips [17]; Mouden found through their studies that when the density of living exceeded 21.7 households per acre, residents had the longest walking travel time [18]. Therefore, the number of the resident population in the city is also an important measure of walking travel behavior.
In order to verify the relationship between the residents’ walking travel and the street popularity, the author established the index of street walking popularity according to the relevant research, and the calculation formula is as follows.
Among them, represents the potential pedestrian popularity in the region, indicates the residence density of area (unit: Household/square kilometer), and indicates the ratio of daily average pedestrian travel amount and resident population of plot .
3.4. Built Environment Quality
The built environmental quality of streets also has many influences on residents’ travel. A superior walking environment not only attracts people to participate in walking, but also enables people to accept longer walking distance. According to the research in Section 2.2.3 of this paper, landscape planting along the street is an influential factor that residents in Hexi District generally pay attention to and it has a significant correlation with residents’ flexible travel. Chen Yong believed that the density of a public green space and the ratio of transparent (green) interface have influences on residents’ travel [19]. Considering that most of the landscape greening layout forms in the study area are attached to roads, there is basically no current situation of greening groups and parks, so this paper uses the index of the ratio of greening interface along the street to quantify the variable of greening along the street; the specific formula is as follows:
Among them, represents the proportion of green interface along the street in the area; represents the greening interface length in the area; represents the total length of the street in the area.
4. Case Study in Hexi District
The impact factors and quantitative indicators related to residents’ walking trips of flexible travel have been basically determined in the above article. This chapter will measure the current status of pedestrian friendliness in Hexi District through the above-mentioned quantitative indicators and verify the reliability of the model based on the actual survey data of residents’ travel.
4.1. Analysis of Travel Time Based on Potential Model
4.1.1. Acquisition of Research Data
This paper studies the impact of land use and urban spatial morphology on residents’ flexible travel. Therefore, the author obtained the travel destination data through the POI retrieval. POI means “Points of Interest” and is a variety of living, entertainment and service facilities that are attractive to residents’ activities and trips. Each POI data includes sub-data such as name, category, latitude and longitude. It is the open-source data based on location services and has been widely applied in today’s electronic map services for its high timeliness. The spatial clustering and density of POI coordinate data on the 2D map can reflect the type and degree of mixing of urban land to some extent (as is shown in Figure 7).
At the same time, the author obtains the coordinate data of the main residential area through the online map software and transforms the urban road network into two-dimensional plane vector data that can be quantitatively analyzed through the AutoCAD software. Lastly, the author uses the open information of housing rental websites to estimate the resident population data in the study area.
4.1.2. Overview of Facilities Distribution Based on Kernel Density
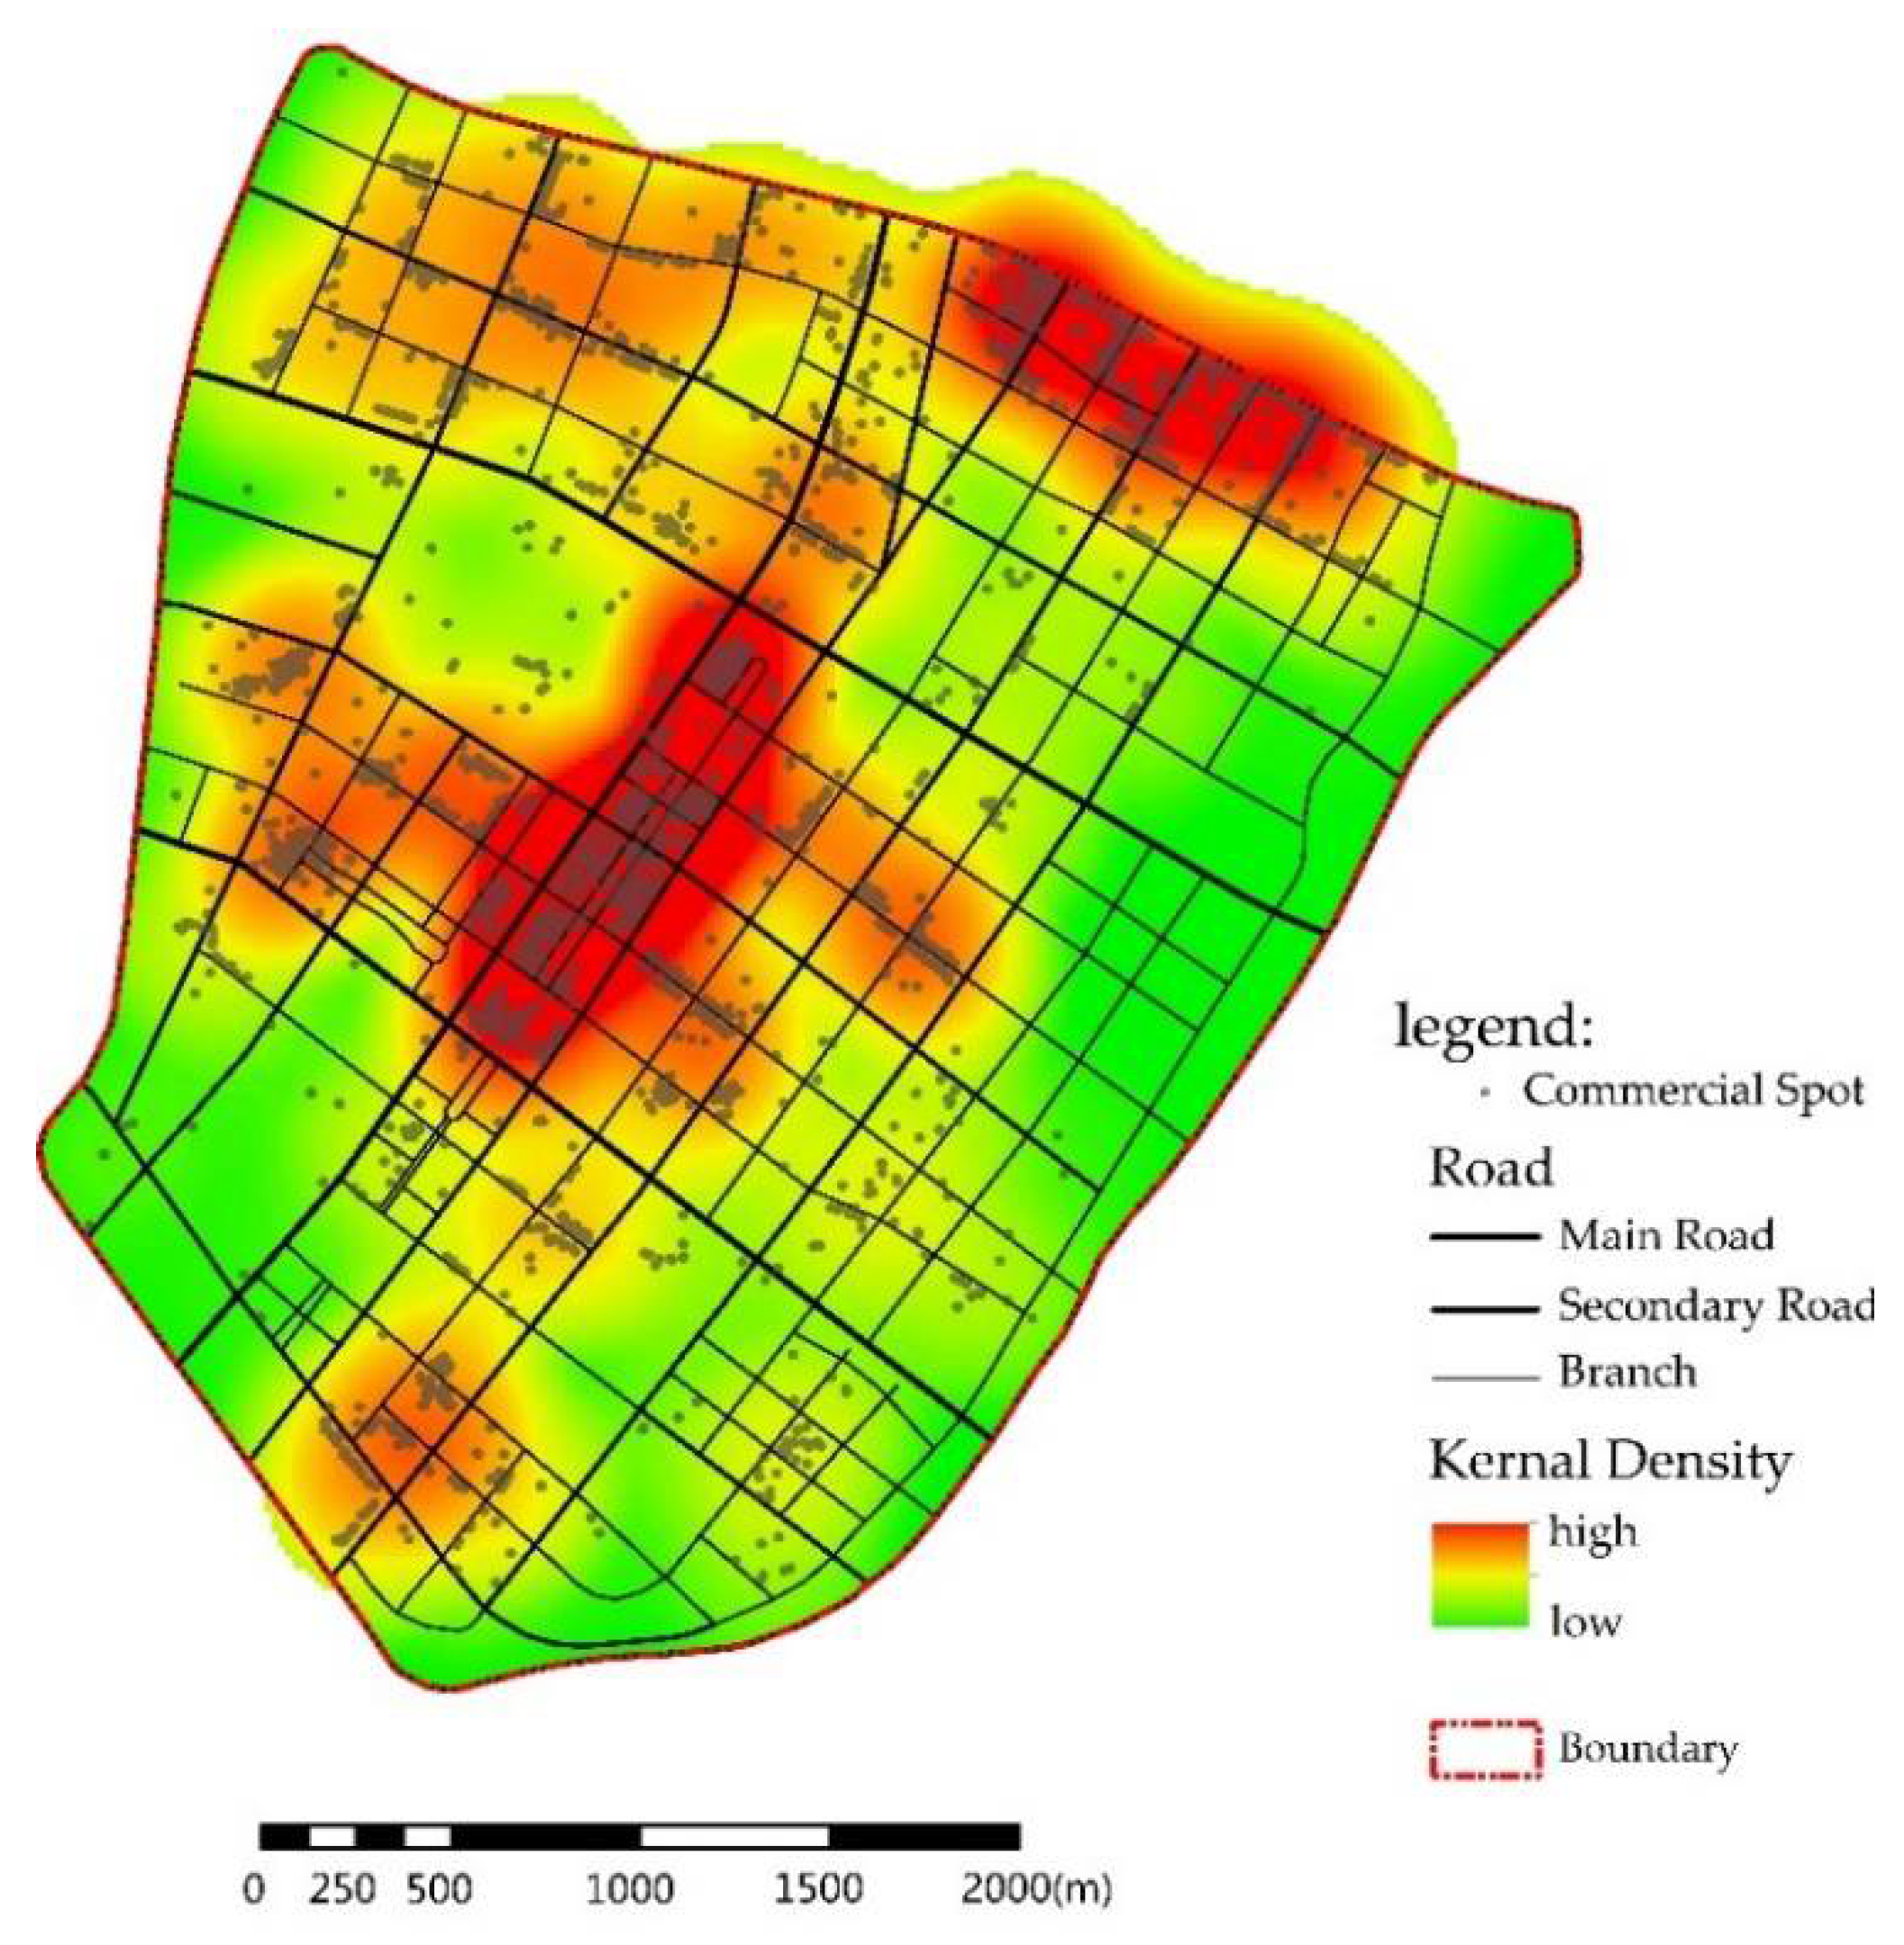
As is acquired from the above POI data, the author has retrieved a total of 4142 facilities including food, entertainment, shopping, living services and public facilities in this research area. The author carried out a kernel density analysis by ArcGIS software to study the spatial distribution of these commercial facilities. Kernel density analysis is based on the kernel function of Silverman [20]. This study considers the spatial distribution between facilities. Therefore, the Population fields of each point are set to None. Because this paper takes walking travel as the research object, the walk advantage travel distance 500 m is used as the bandwidth. According to the kernel density analysis of the coordinate points of these facilities (as is shown in Figure 8), the TAZ No. 17 and No. 20 in the central area is the central business district, with a strikingly obvious combined effect of the facilities. The facilities in other TAZs mainly depend on the distribution of residential areas, of which the main residential TAZ No. 8 has a large number of commercial service facilities, with an obvious combined effect. TAZ No. 23 has very few internal facilities; the rest of the residential zones have a fair number of internal facilities, with heterogeneous distribution, relatively loose overall layout and a small-scale combined effect generating in some zones; other non-residential TAZs also have low facilities density.
4.1.3. Data Processing Based on Accessibility Models
The above kernel density analysis has made a preliminary study on the spatial distribution of commercial and public service facilities in Hexi District, so the following is further simulated and analyzed for the relationship between commercial and public service facilities and residents’ travel.
The author uses the existing CAD road network vector data, which stores the status quo of road traffic network, road length, road intersections and other information. With ArcGIS 10.2 software, the following steps can be followed to compare the accessibility of the domain values:
(1) First, add the existing CAD data in ArcGIS, export the “dwg polyline” data and store it in the feature class in the new personal geodatabase; re-import the shape file in the above database and add the field of “walking time” and use the “field computer” function to calculate the walking time (refer to the average adult walking speed 75 m/min).
(2) Create a new network dataset under the data set and establish a traffic network dataset based on this area. Create a new OD cost matrix through Network Analyst and load the position information with the gate entrances of all the communities as the starting point of the network. Meanwhile, load the location information with commercial and public service facilities as the destination point for the traffic network, set the impedance as the travel time (Min), and run the current analysis. The analytical model defines the parameters in the above formula and outputs the average traffic travel time based on each starting point (or destination point) by establishing a spatial analysis network. After considering the travel probability, the weighted average time (average travel time * travel probability) and weighted average rounding coefficient (average rounding coefficient * travel probability) are regarded as the standard of pedestrian friendliness.
(3) The ArcCatalog is used to establish Spatial Topological Relations by solving the network structure, and topology information such as traffic routes and road network are calculated, and logic associated information of traffic routes and road locations are obtained based on travel time. Then, based on the current situation of land and space development and utilization, select the reasonable pedestrian friendliness to calculate the source points according to the comprehensive situation of urban economic trade, employment distribution, construction and population density, public service facilities and so on.
(4) The ArcGIS Spatial Analyst Tools, grid computing module, inverse distance weighting method (IDW) and spline function method in interpolation analysis (use two-dimensional minimum curvature spline method to interpolate data points into grid surface domain-like data) and other functions are used to stretch and display the residents’ traffic accessibility at each traffic network point according to the weighted average time of each starting point as well as the current situation of road traffic in the source area. Then a visual grid graph is generated, followed by the quantitative analysis (subarea averaging).
4.1.4. Analysis of Accessibility of Commercial and Public Service Facilities Based on Weighted Average Travel Time
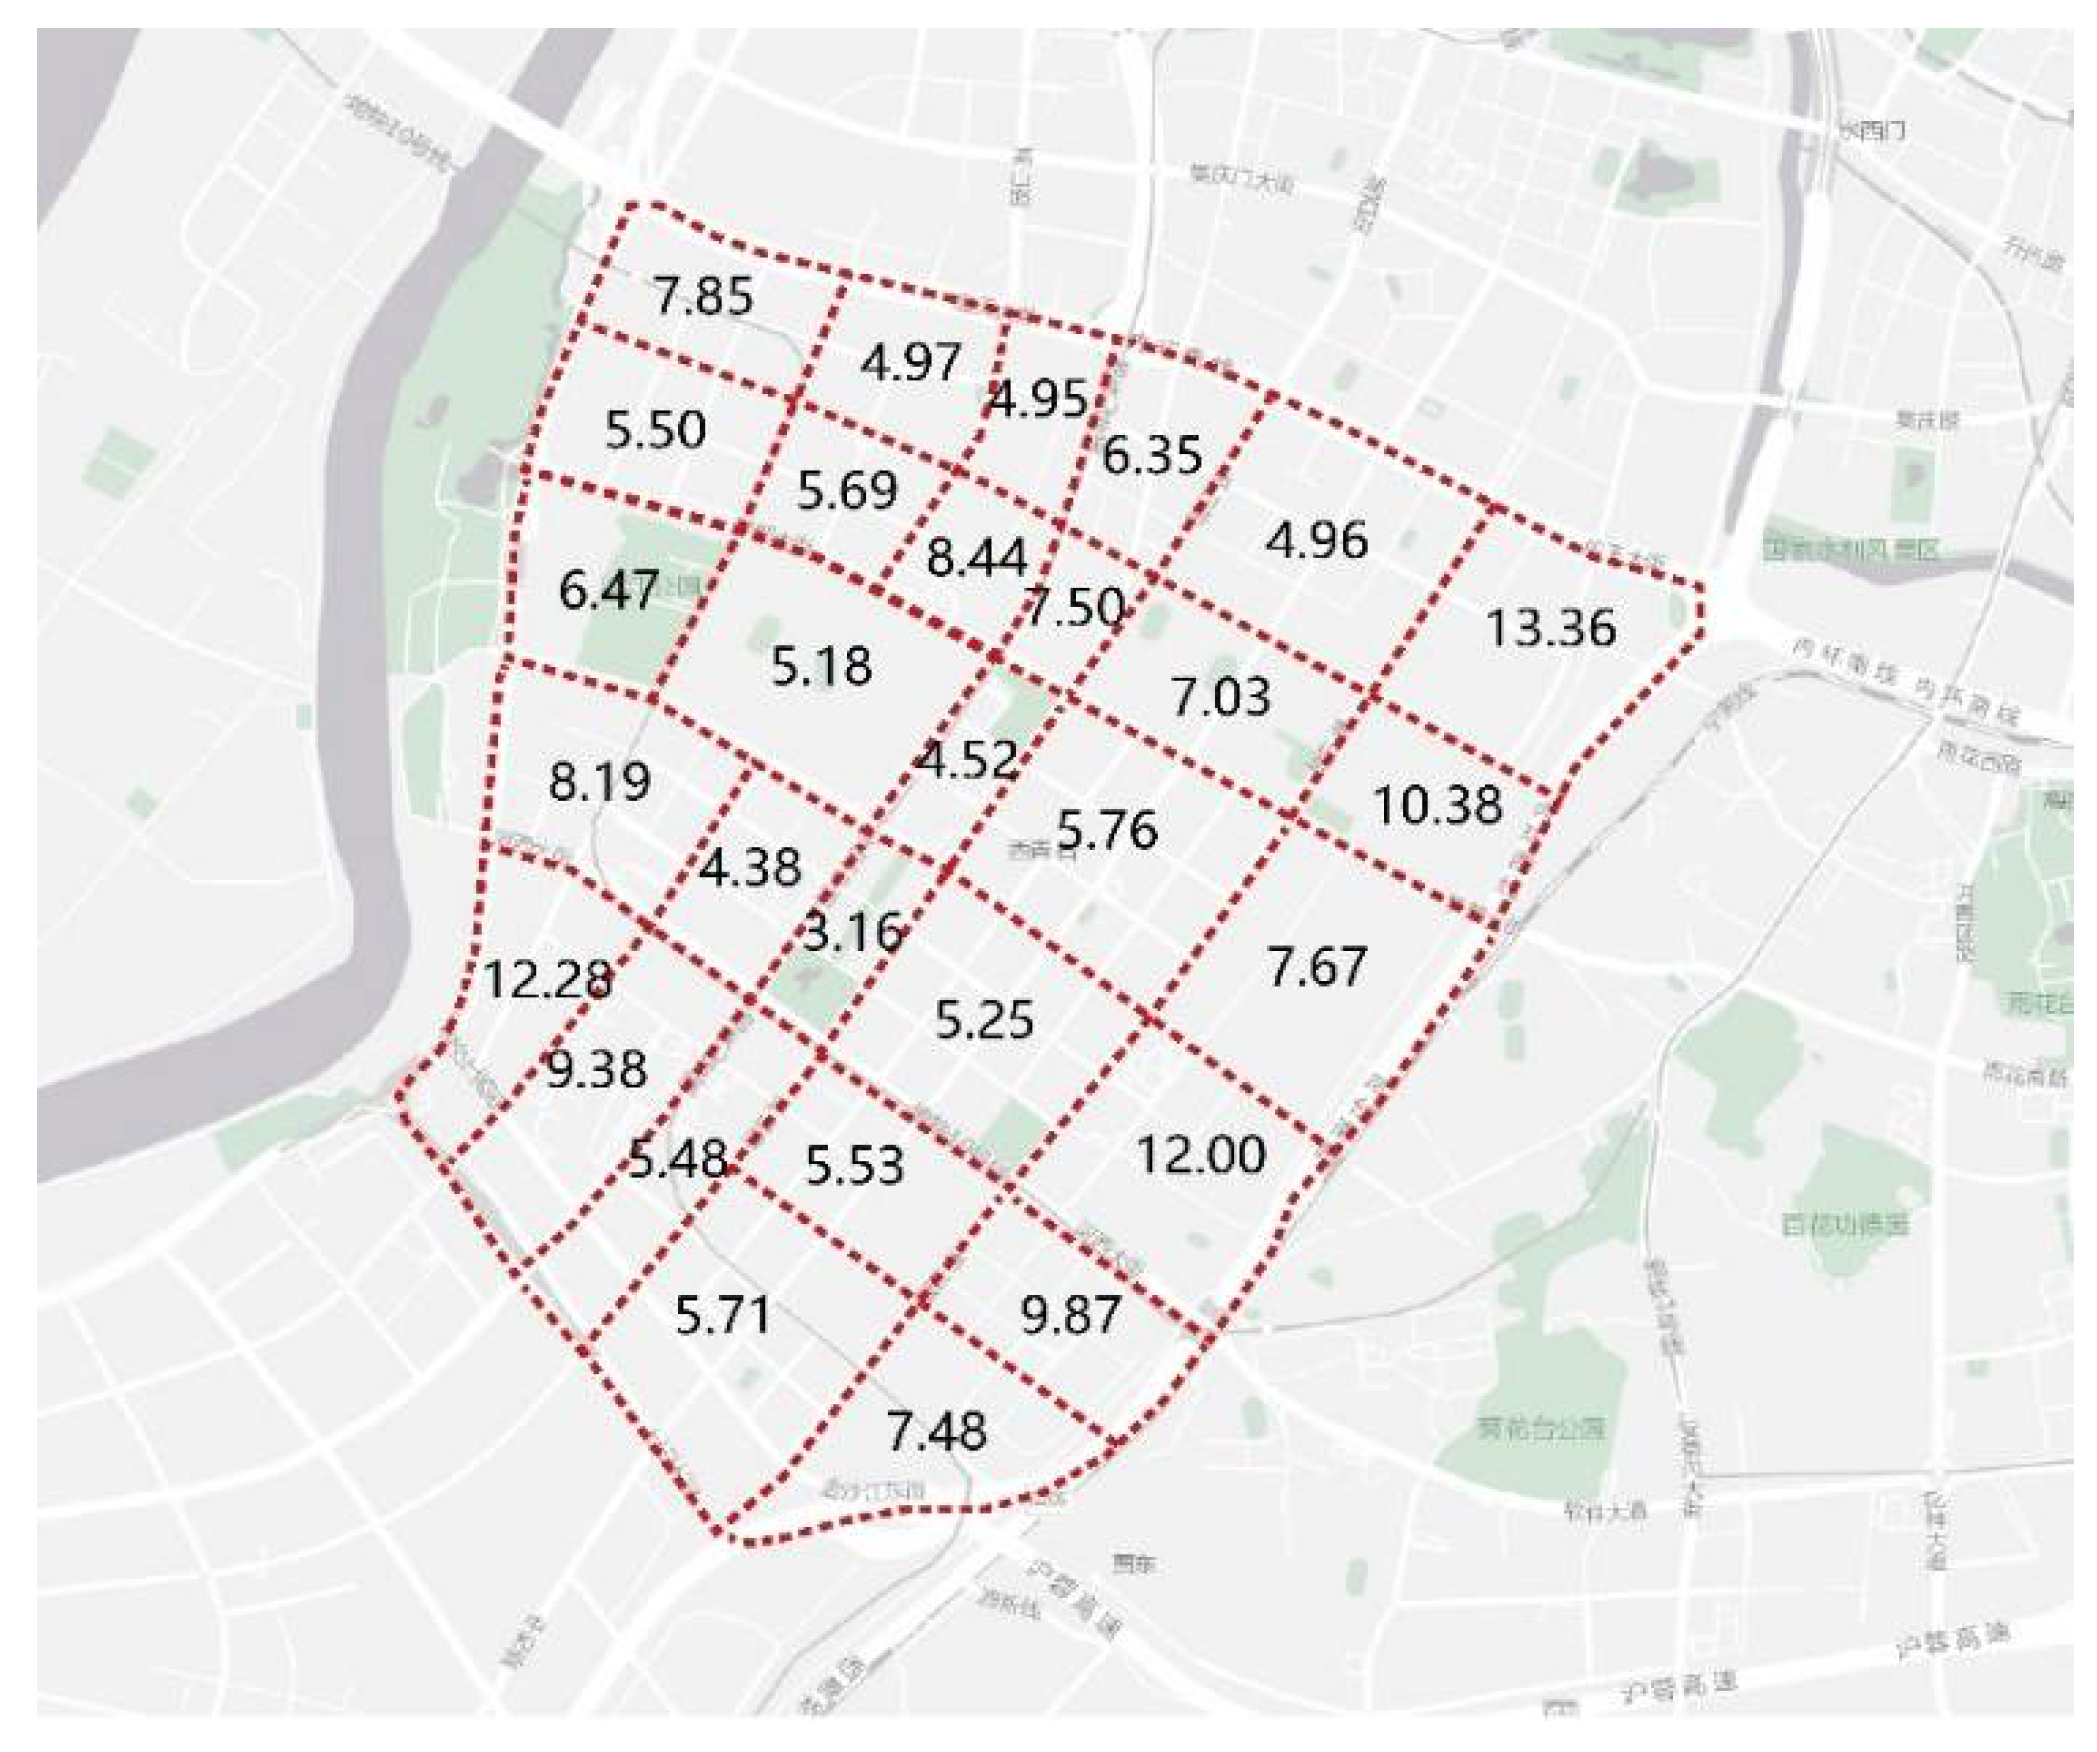
As we can see from Figure 9, the dark blue areas with very low accessibility are mainly distributed in TAZ No. 9, No. 22, No. 23, and No. 27, and are located in the peripheral area of the research area; A small amount of the light blue areas with low accessibility also appeared on the TAZ No. 1, No. 2, No. 15 and No. 28; the rest of the TAZs have better accessibility. The author calculated the weighted average travel time in the study area according to the average value of the divided zones. According to Figure 10, it can be seen that:
Overall, the weighted average travel time values of TAZ No. 7 and No. 20 as the CBD are the smallest; and the TAZ No. 9 (13.36 min) and No. 23 (12.28 min) with the less internal commercial and service facilities are the highest. Among them, lots of lands in No. 9 zone are still under construction. Therefore, there is still the possibility of optimization; with the kernel density analysis, we can see that all the lands with a weighted average travel time below 5 min are located with a high kernel density.
By comparing the accessibility value with the current land use situation in the site, it can be found that the spatial distribution characteristics of commercial service facilities and the urban spatial structure have a significant impact on accessibility:
TAZ No. 8 has the smallest scale and high development intensity. The internal commercial and public service facilities are characterized by various types, high density, and wide distribution. Therefore, the weighted average travel time is 4.96 min.
TAZ No. 7 and No. 20 are located in the center of the entire area and are the main commercial land in the Hexi area. All kinds of commercial and public service facilities are complete, and the density of commercial and public service facilities is also the highest. The accessibilities of the adjacent TAZs ((No. 14, No. 16, No. 18 and No. 21,) to No. 7 and No. 20 are better than the TAZs (No. 13, No. 15, No. 19, No. 22) farther away from the central area, indicating that the influence of high-density commercial facilities in the central area began to gradually decline. Therefore, the author believes that within a reasonable walking range, high-density commercial land development has a certain impact on pedestrian accessibility.
TAZ No. 1, No. 2, No. 3, No. 4, No. 5, and No. 6 located at the north, and the No. 18 located at the south are far away from the central business area. The impact of high-density commercial service facilities on these three regions has been significantly reduced. At the same time, the streets within these three regions have more street-level businesses, and accessibility has the tendency to develop inwards within the neighborhood.
TAZ No. 23 has a large number of residential areas, but the low commercial density leads to low internal accessibility, and the larger block size also blocks the impact of external commercial service facilities on internal residential areas.
4.2. Analysis of Walking Distance Based on Integral Pedestrian Route Directness
Many scholars studied the reasonable recommended value of the PRD. Hess argued that pedestrians were reluctant to bypass on circuitous and discontinuous sidewalks and that his recommended PRD values were generally 1.2–1.7 and those that are greater than 1.8 may find the road too tortuous [21]; Randell and Baetz found in their study that the PRD coefficient tends to be between 1.4 and 1.5 for the roads with the grid-pattern network and the street-side with the shorter side. That for more curvilinear roads and end-of-the-road streets is usually 1.6–1.8 [22]. In Portland of the United States, the PRD coefficient has been regarded as the main reference for the design of the maximum length of the block, and it should be controlled at 1.2–1.5, and 1.6–1.8 can be considered as detour roads [23].
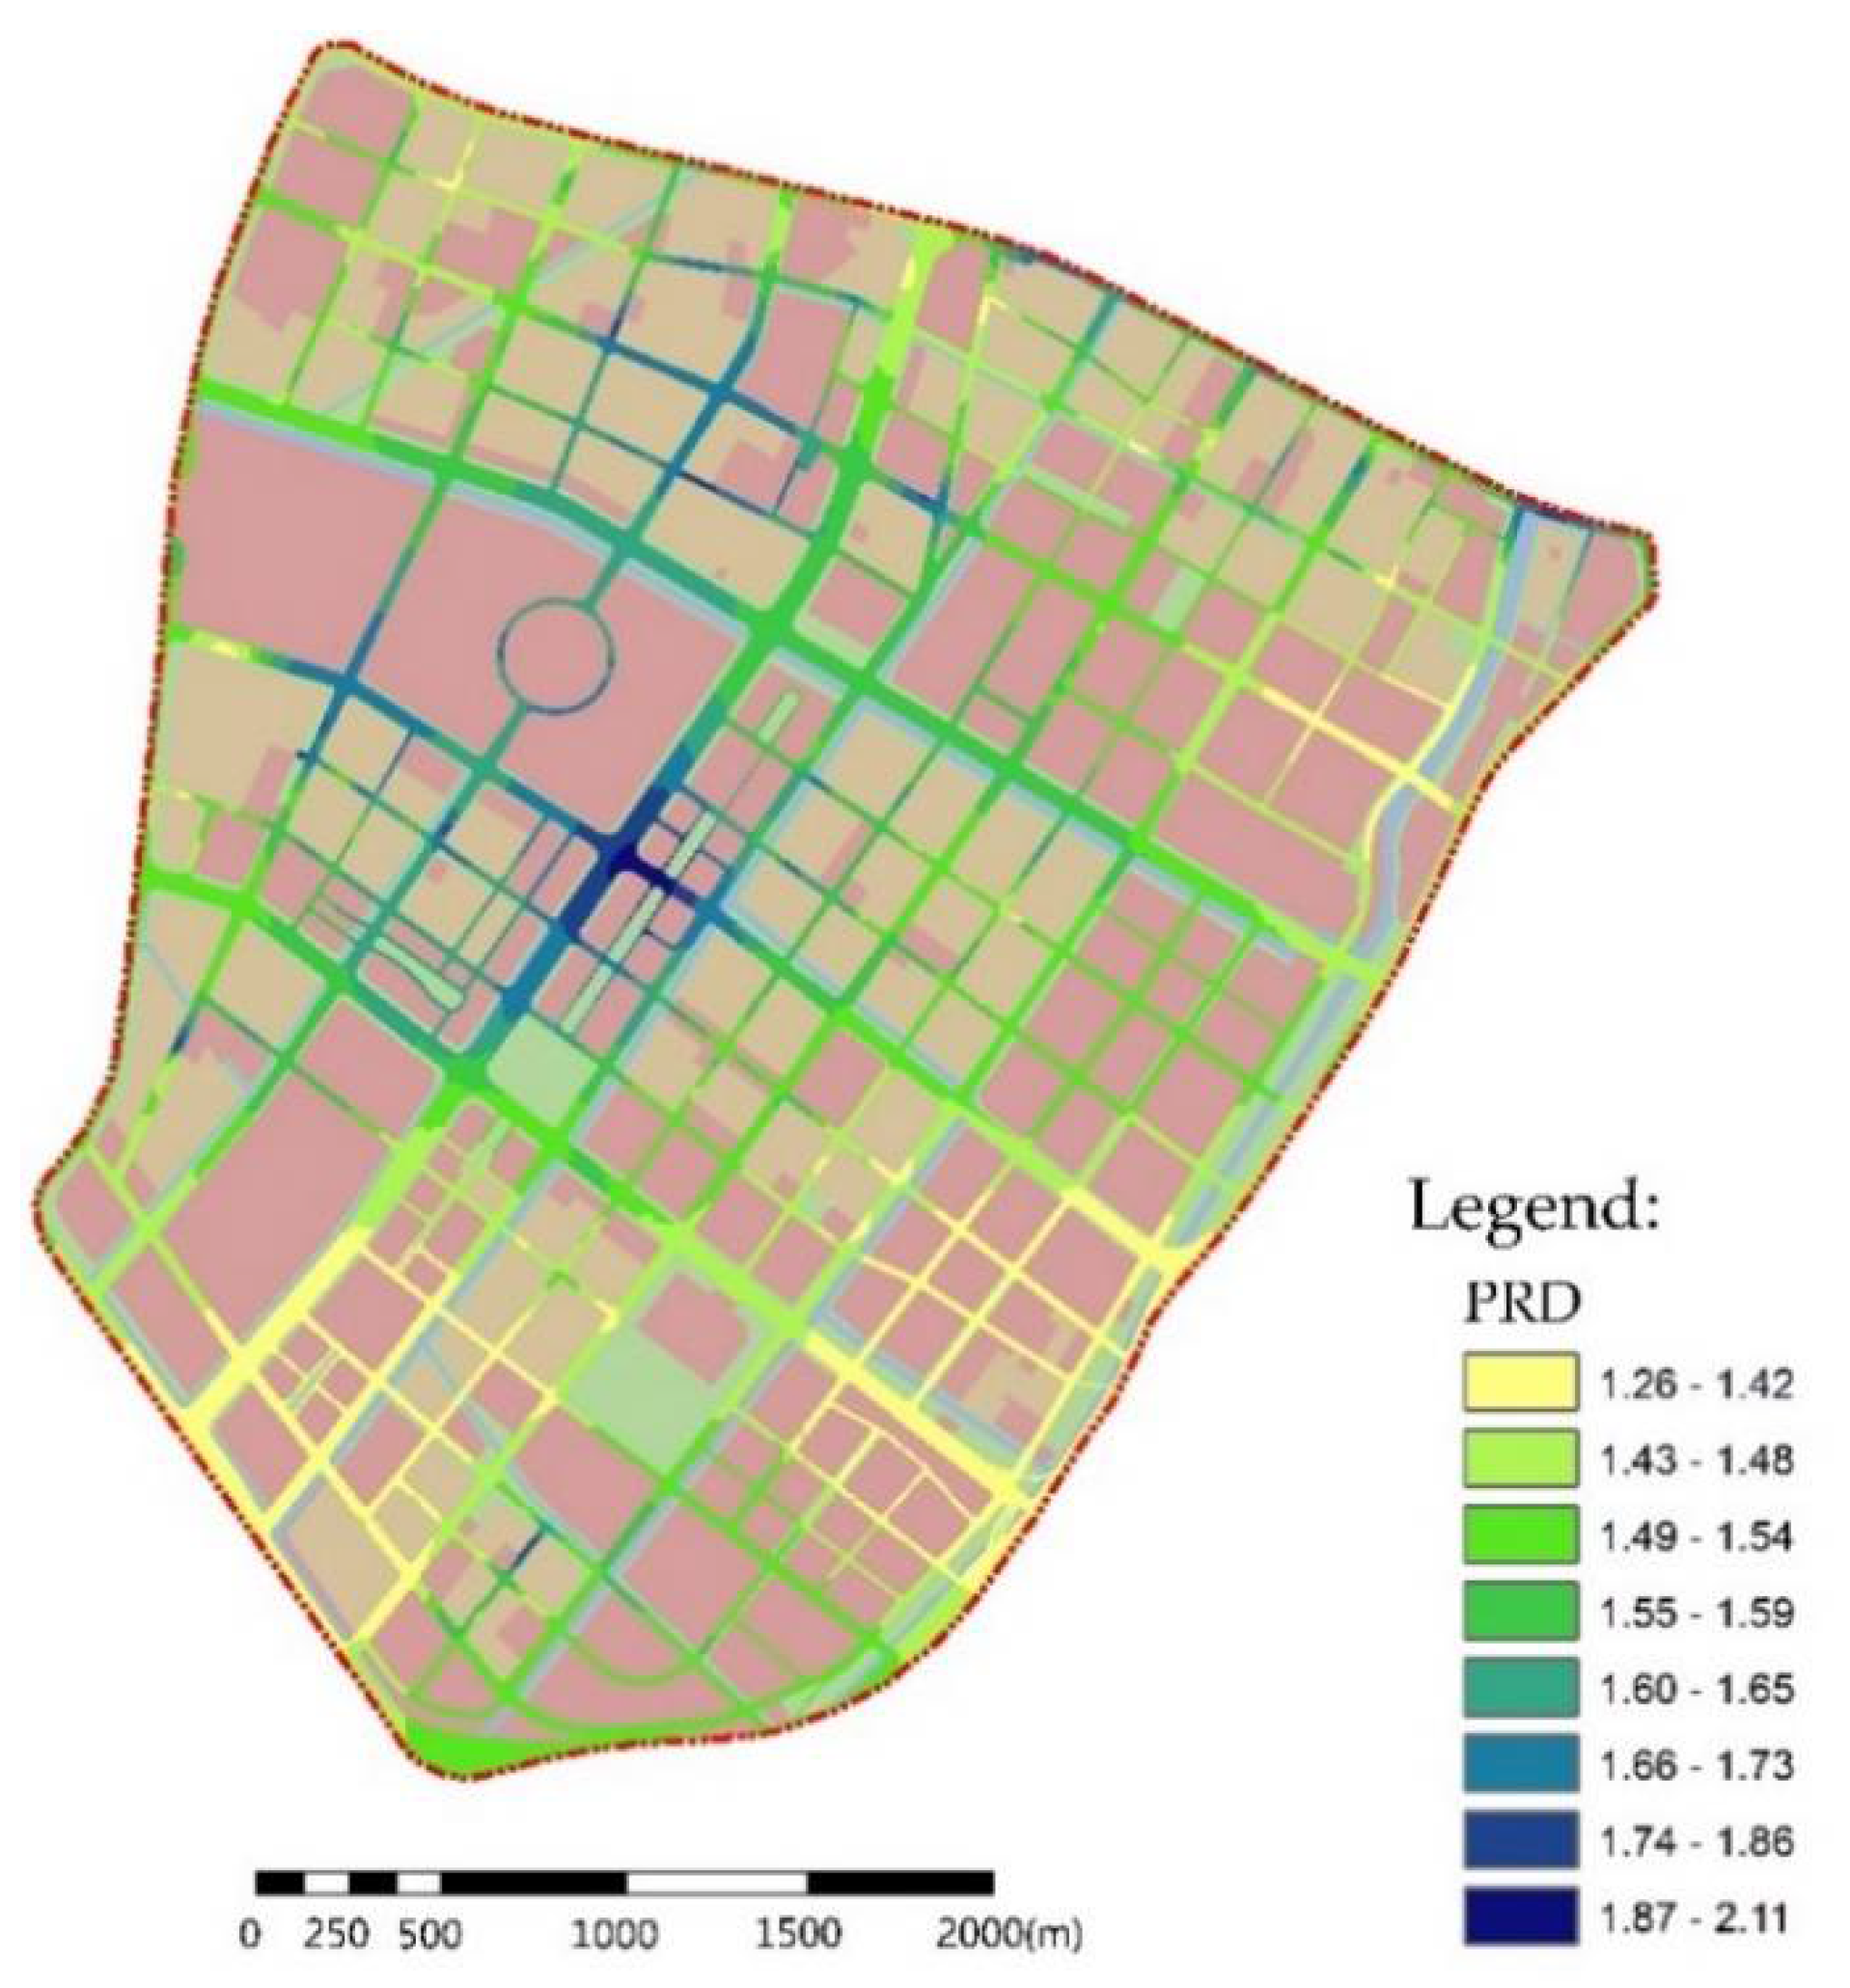
From Figure 11, it can be seen that the minimum value of the Pedestrian Route Directness in each section is 1.26, and the maximum value of the Pedestrian Route Directness is 2.11. Among them, the Pedestrian Route Directness around the center of the Olympic sports center is the highest, and there are a large number of road sections with a Pedestrian Route Directness exceeding 1.66. It indicates that the super-scale blocks like the Olympic Sports Center have a great influence on the Pedestrian Route Directness between the origin-destination. Through the statistics of the average integrated Pedestrian Route Directness within the given area (Figure 12), we found that the integral Pedestrian Route Directness of all residential zones in the Hexi District with a grid-pattern road system basically meets the above recommended value of the Pedestrian Route Directness 1.5, but the distribution of comprehensive Pedestrian Route Directness in different regions has certain differences and connections:
(1) As a whole, the Pedestrian Route Directness of the zones adjacent to the TAZ No. 14 are generally higher than the Pedestrian Route Directness of the zones far away from the No. 14, which indicates that the Olympics center within TAZ No. 14 is a huge scale construction and has a greater impact on the Pedestrian Route Directness, resulting in an increase in the Pedestrian Route Directness of the surrounding area. As a public service facility, the Olympic Sports Center has less internal functions and lacks commercial vibrancy along the street and cannot provide more travel options for nearby residents.
(2) The Pedestrian Route Directness in commercial land is generally high. There are six zones exceeding the recommended value of 1.5, and the highest is TAZ No. 20, which has reached 1.67. It can be seen by comparison with the current road network, like the shape of the pedestrian road network inside TAZ No. 16, No. 17 and No. 20 is mostly a rectangle with a high ratio of length to width. When the origin-destination is located on the two long sides of a rectangular block with such a block pattern, it is easy to form a winding path around a single neighborhood when the route directness of the path will be high.
(3) In the residential areas, the Pedestrian Route Directness of TAZ No. 8 is significantly lower than that of other zones. It can be found by comparison with the kernel density maps of commercial and public services and the status map (Figure 8), that although there are many road network types and they are not regular squares, its high-density internal coverage of a wide range of businesses can provide a wealth of travel options within a reasonable distance within the area; so the author believes that a good commercial and public service facilities layout has a certain impact on shortening the residents Pedestrian Route Directness and improving accessibility in neighborhoods.
4.3. Analysis of Street Popularity
In the main residential zones in this study, the TAZ No. 9 is still under construction, so it is excluded from the calculation of the street walking popularity value. Through the statistics of the residential land in the area, combined with the data provided by the housing rental website, the street walking popularity in the main residential area is estimated based on the formulas in the Section 3.3. As shown in the Figure 13, TAZ No. 15 has the highest street walking popularity value, and the average daily pedestrian population density has reached 839.61 people/km2, followed by TAZ No. 8 (743.73 people/km2), and No. 2 (636.61 people/km2) is third; the average daily walking population density of the No. 23 block is the lowest, only 117.28 people/km2; the value of highest zone is 7.16 times that of No. 23, while the remaining street values are within the range 240–540 people per km2.
4.4. Analysis of Ratio of Green Interface
Through the formulas in Section 3.4, the author calculates the percentage of the green interface along the street in the main residential area (Figure 14). The area with the lowest ratio of greening along the street is TAZ No. 8, which is only 17.20%; the proportion of the greening interface in the TAZ No. 23 is preliminary. The calculated result is 44.1%, which is the highest in all zones. We found that the Yangtze River Avenue on the west side of TAZ No. 23 could not meet the requirements of pedestrian traffic after the field research. Therefore, the author excluded the green interface of the road as it cannot be used by pedestrians from the calculation of the ratio of the green interface; the adjusted proportion of the green interface in the TAZ No. 23 is only 17.30%; the TAZ with the highest proportion of green interfaces is No. 10 area, reaching 38.84% and TAZ No. 15 is followed by 32.53%; the green interface of the remaining area has a smaller proportional gap and is concentrated in the range of 17–26%.
4.5. Correlation Analysis
In the above chapter, the pedestrian friendliness in Hexi District was analyzed by four quantitative indicators: weighted average travel time, the Pedestrian Route Directness, street walking popularity and the ratio of green interface. In order to verify the credibility of the above indicators and the model constructed by the author, the Spearman correlation analysis was conducted on the above indicators and the choice of residents’ travel mode data for flexible trip by using SPSS statistical software.
4.5.1. Process of Correlation Analysis
The author carried out a Spearman correlation analysis of the average value of the above indicators and the data of the residents’ travel mode choice in non-commuting periods according to the survey in Section 2.2 in each TAZ, so as to test the validity of the model, and verify whether the evaluation indicators in the model established by the author have a significant relationship with the residents’ flexible travel.
4.5.2. Results of Analysis
As it can be seen from Table 2, the weighted average travel time, the Pedestrian Route Directness, the street walking popularity and the ratio of green interface are all significantly correlated to the ratio of walking of residents’ flexible travel. The weighted average travel time and Pedestrian Route Directness are significantly negatively correlated with the ratio of walking. This shows that the lower the Pedestrian Route Directness in the area and the higher the accessibility to commercial and public service facilities, the more residents choose to walk. The ratio of green interface, street walking popularity, and the ratio of pedestrian travel showed a significant positive correlation, indicating that the higher resident population in the area, the higher the street popularity and the more landscape green along the street, the more conducive it is to stimulating the production of walking behavior.
At the same time, it can be seen from the correlation analysis of the ratio of motor vehicle trips, apart from the ratio of green interfaces, the remaining indicators are significantly correlated to the ratio of motor vehicle trips. Among them, the weighted average travel time and the Pedestrian Route Directness are positively related to the ratio of motor vehicle trips, which indicates that in the area with high Pedestrian Route Directness and low accessibility to commercial and public service facilities, residents prefer to use motor vehicles to travel. The street walking popularity and motor vehicles trips showed a significant negative correlation, indicating that residents in areas with higher popularity are more likely to abandon motor vehicle travel. The reason for this is that high street popularity also represents a possibility of congestion for motor vehicles.
It is concluded from the above correlation analysis that there are significant correlations between the four quantitative indicators in this study and the residents’ walking behavior in the flexible trip. Therefore, the walking friendliness index of this study has high credibility and scientificity. Through the correlation analysis of the residents’ choices of walking and motor vehicle travel modes and the above indicators, we can see that walking as a human-driven open transportation mode has been affected by many aspects of the current state of the urban construction environment; the accessibility requirements of the function to the city are even higher than other traffic modes, meanwhile, they are more sensitive to the linearity of the route. A good street-built environment can also stimulate the residents’ pedestrian travel behavior; at the same time, as part of the communication and urban life, high street popularity is obviously a generation of pedestrian travel behavior. Therefore, the above indicators should be used as a reference in building a pedestrian-friendly neighborhood.
5. Optimization Suggestions for Hexi District Based on Pedestrian Friendliness
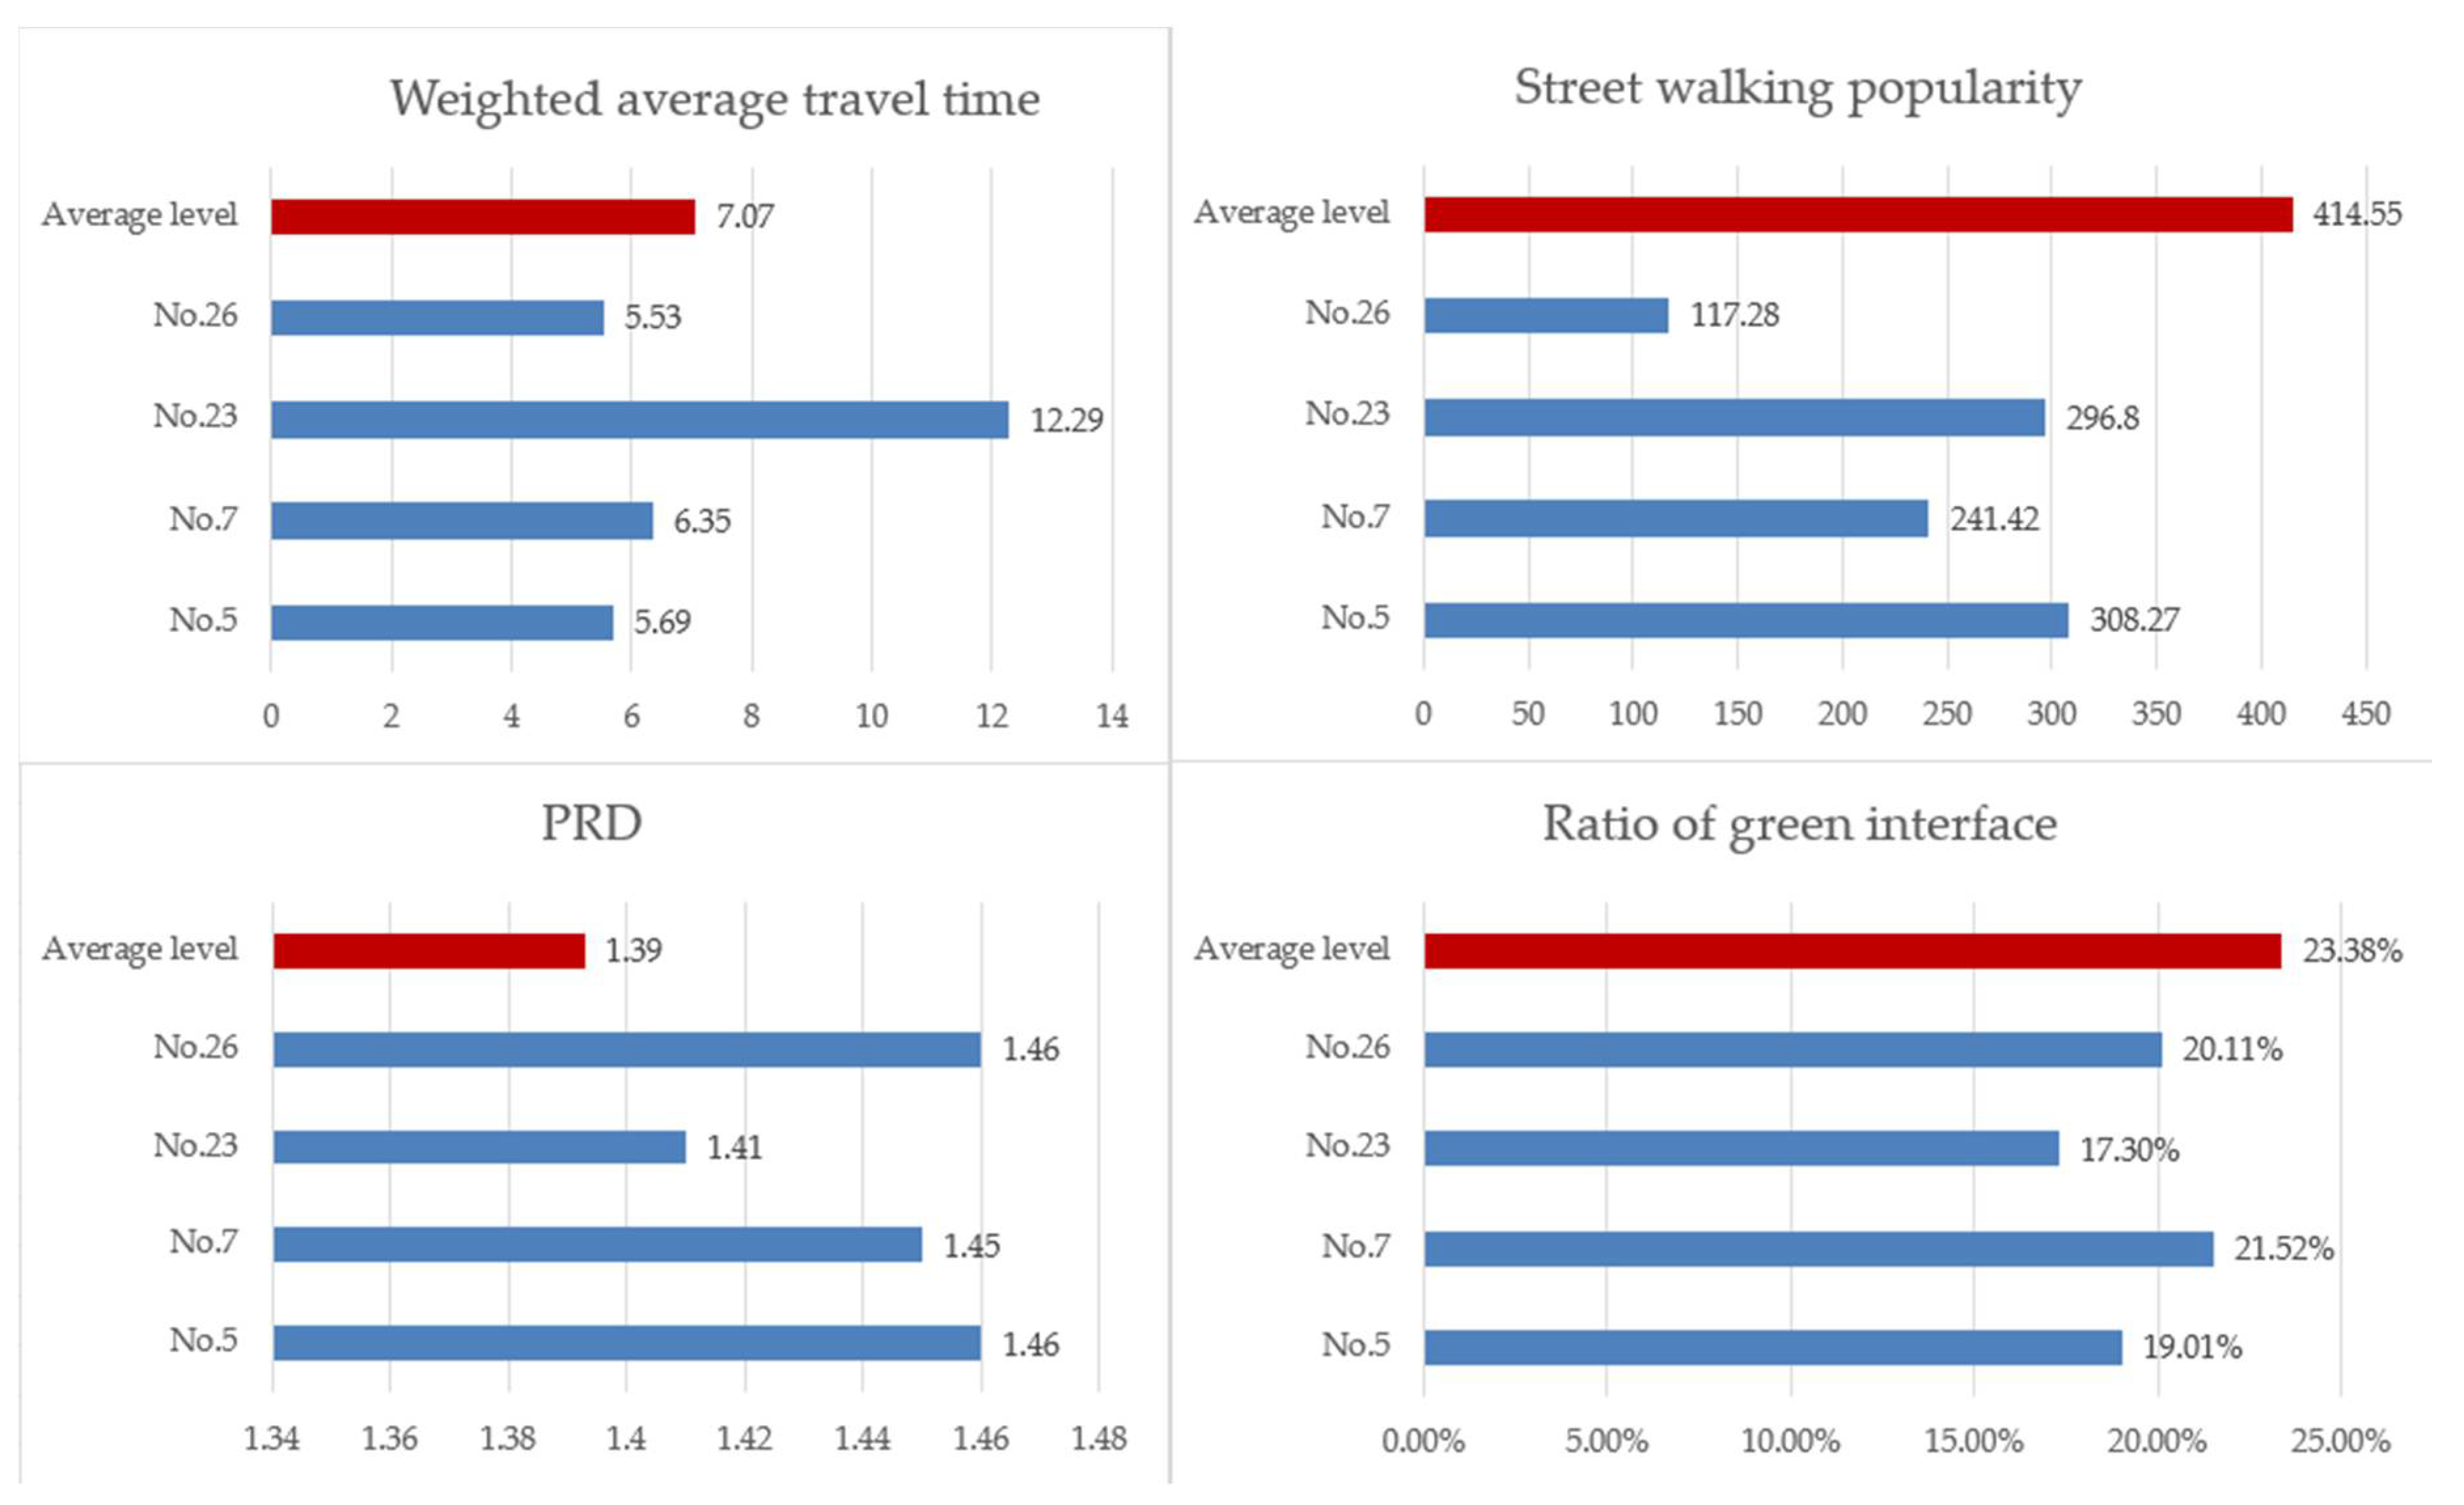
In Section 2.2.2, we found that the proportion of pedestrians in the flexible trip of residents in TAZ No. 5, No. 7, No. 23, and No. 26 is significantly lower than the proportion of pedestrians’ travel preferences. By comparing the above indicators of these four zones with the average of other residential areas, we can see from Figure 15 that there are three indicators in TAZ No. 5, No. 7 and No. 26 that do not reach the average level, and all four indicators in TAZ No. 23 do not reach the average level. Therefore, based on the data obtained in this study, the author put forward optimization proposals for the Hexi District.
5.1. Optimization of Land Use Patterns
Scholars believe that the high density and high degree of mixed use of land use patterns in the neighborhood is conducive to the formation of a high accessibility pedestrian neighborhood. This study found that high density residential function can provide fine support for travel, and high density commercial and public service land can improve the accessibility of residents to various urban functions. For urban residential functions, reasonable commercial layout along the street can greatly shorten the travel time and distance of residents in non-commuting trips. At the same time, high density commercial facilities such as commercial complexes also have a certain attraction for residents’ trip. Therefore, for the land use within the neighborhood, attention should be directed to the high-density development in both horizontal and vertical directions to promote the concentration of different urban functions in space, which will shorten the travel distance of residents effectively and provide residents with more urban functions in reasonable walking range.
In the spatial layout of facilities, high-density commercial and public service facilities need to focus on fairness and accessibility. It is suggested that they should be arranged in the core area of the neighborhood. At the same time, it should be integrated with rail services and equipped with community-level service facilities to provide services including the daily life function such as shopping, catering, education and medical care, culture and sports, postal and financial services, and the administration and utilities sectors, thus forming an accessible community center by walking. The survey results show that the main pedestrian entrances and exits of residential areas should be arranged for convenience stores, housing rental, convenience services, restaurants and other food businesses along the streets, thereby reducing the daily travel distance of residents. Therefore, the author proposes to adjust and optimize the layout of commercial and service facilities around TAZ No. 23 so as to better meet the functional requirements of residents’ walking.
5.2. Moderate Adjustment of Neighborhood Scales and Road Network Morphology
The author believes that the rational scale of the neighborhood division can not only increase the choices of walking path, but also can reduce the walking distance, thereby enhancing the accessibility within the district; at the same time, a small neighborhood scale can lead to a high road intersection density and reduce the speed of motor vehicles inside the neighborhood, which is more conducive to the safety of pedestrians. In addition, it can also provide more commercial capacity along the streets in the area, which helps to create a continuous business climate and enhance the popularity of walking.
According to the analysis in Section 4.1 and Section 4.2, it can be seen that large-scale public buildings such as stadiums and convention centers can easily have a negative impact on the walking of residents, and the neighborhood morphology with too large an aspect ratio can also cause high pedestrian route directness. Therefore, the author proposes to increase the branch network for walking according to the actual situation in the area, trying to keep the distance between walking roads within 200 m and adopting a street shape with an aspect ratio close to 1 to reduce the route directness.
5.3. Promoting the Formation of an Open Neighborhood Type
Although it is more difficult to adjust the scale of the built-up neighborhood, the internal roads of some areas are in an open state for the pedestrians in later use. Therefore, by increasing the degree of openness of the inner roads to pedestrians in residential areas, the density of pedestrian roads can be increased, which can shorten the distance traveled by residents and increase the ratio of pedestrians in the area. In the survey, the author finds that in Hongyuan New Apartment located in TAZ No. 8, it only restricts the passage of motor vehicles, not pedestrians not living here and non-motor vehicles using the internal roads, although it is equipped with an access control system. As a result, the internal roads have become public sidewalkd, resulting in a significantly higher percentage of walking and non-motor vehicles trips in the area than in other areas.
This proves that the degree of opening up of residential areas and the scale of the neighborhood are equally important. Therefore, the author suggests opening some of the internal roads to pedestrians on a conditional basis, especially in the residential areas located in the central part of the neighborhood or public buildings, to improve the internal pedestrian friendliness.
5.4. Strengthening the Construction of Street Greening Interface
A good street environmental quality has a certain impact on the residents’ walking travel, and the good green interface has a significant role in promoting the residents’ walking behavior in flexible travel. As far as the current situation of the Hexi District is concerned, besides the road isolation belt, the main urban greening is attached to the urban landscape construction, and the continuous green footpath has not been formed. For the urban residential function land in Hexi District, there are few greening group and public green spaces for leisure and entertainment. Therefore, the author suggests that the construction of public green space can be strengthened by the existing unbuilt land, so as to strengthen the quality of walking travel. It can be seen from Figure 14 that the proportion of green interface of all the zones that reach the proportion of pedestrians’ travel preferences in this study is between 20.83% and 38.84%. Therefore, the author believes that the ratio of greening interface construction of the zones with less walking behavior in Hexi District should be strengthened and promoted to a reasonable range so as to create a good and fair environment for residents’ walking behavior.
5.5. Promote the Formation of Better Street Popularity
As for street popularity, it basically stems from the number of the resident population in the neighborhood. However, urban construction in China has controlled the volume ratio of residential land in the initial stage of planning. We found through investigation that, for example, residential buildings in the No. 23 area, most of them are 150 m2 or even 250 m2 per household, and the number of houses in the No. 8 area with the earlier building is mostly 60 m2 per household, which also causes a huge difference in street popularity between the two. Therefore, developers should also weigh the relationship between residents’ requirements for living space and the urban environment.
6. Conclusions
This paper, with Hexi District in Nanjing as a case study, analyzes the influence of the quantitative indexes of land use and urban spatial morphology on residents’ choices of travel means, and puts forward the optimization suggestions based on the pedestrian friendliness. It can be found from the study that there is an important influence among the above-mentioned construction environment variables. In the study, we found that there are many factors affecting the walking travel, such as the traffic location in the city, the feature of the block, the road paving and so on. Because it is difficult to quantify or lack of data, this paper did not carry out analysis. The author will make further improvements in the follow-up study on these issues.
Author Contributions
C.Q. designed the analytical framework and revised the paper. D.Z. constructed the model, analyzed the data and co-wrote the paper. Y.Z. co-wrote the paper and revised the paper. J.C. carried out the video counting process.
Acknowledgments
This study is supported by National Natural Science Foundation of China (No. 51578282 and No. 51508265); Natural Science Foundation of Jiangsu Province, China (No. BK20151538); Science and Technology Project of Ministry of Housing and Urban-Rural Development of China (2016-K2-027); and Foundation of the “333 High-Level Talents” of Jiangsu Province (No. BRA2016417); Postgraduate Research & Practice Innovation Program of Jiangsu Province (KYCX17_0910).
Conflicts of Interest
The authors declare no conflict of interest.
References
- Wei, D.H.; Shen, L.; Yang, Y.Z. Experience and Implications of Livable City Construction Practice in Portland, Oregon, the USA. Urban Plan. Int. 2016, 31, 20–25. [Google Scholar] [CrossRef]
- Millington, C.; Thompson, C.W.; Rowe, D.; Aspinall, P.; Fitzsimons, C.; Nelson, N.; Mutrie, N.; SPARColl—the Scottish Physical Activity Research Collaboration. Development of the Scottish Walkability Assessment Tool (SWAT). Health Place 2009, 15, 474–481. [Google Scholar] [CrossRef] [PubMed]
- The Official Website of Walk Score. Available online: https://www.walkscore.com (accessed on 12 June 2018).
- Cervero, R. The Transit Metropolis: A Global Inquiry; Island Press: Washington, DC, USA, 1998. [Google Scholar]
- Ewing, R.; Schmid, T.; Killingsworth, R.; Zlot, A.; Raudenbush, S. Relationship between urban sprawl and physical activity, obesity, and morbidity. Health Place 2014, 26, 118–126. [Google Scholar] [CrossRef] [PubMed]
- Lu, H.P.; Ding, Y.; Zhang, Y.B. Urban Job-Housing Balance in China: Empirical Analysis and Countermeasures. Urban Transp. China 2013, 3, 1–6. [Google Scholar]
- Pan, H.X. Multi-Model Urban Transport System and Intermodality. Urban Plan. Forum 2013, 6, 84–88. [Google Scholar]
- Horning, J.; El-Geneidy, A.; Krizek, K.J. Perceptions of walking distance to neighborhood retail and other public services. In Proceedings of the Transportation Research Board 87th Annual Meeting, Washington, DC, USA, 13–17 January 2008; Volume 8, pp. 357–363. [Google Scholar]
- Lu, J.; Wang, W. Study of Resident Trip Time Consumption Characteristic. J. Highw. Transp. Res. Dev. 2004, 21, 102–104. [Google Scholar]
- Yang, Q.Y.; Xu, J.G. An Analysis Model of Public Service Facilities Based on Attraction Accessibility. Planners 2015, 7, 96–101. [Google Scholar]
- Yang, W.Y. Advanced Economic Geography; Peking University Press: Beijing, China, 2000. [Google Scholar]
- Hansen, W.G. How Accessibility Shapes Land Use. J. Am. Plan. Assoc. 1959, 25, 73–76. [Google Scholar] [CrossRef]
- Geertman, S.M.; Eck, J.R.V. GIS and models of accessibility potential: An application in planning. Int. J. Geogr. Inf. Sci. 1995, 9, 67–80. [Google Scholar] [CrossRef]
- Peng, L. Study on Residential Districts Walkability in Wuhan. Ph.D. Thesis, Huazhong University of Science and Technology, Wuhan, China, 2015. [Google Scholar]
- Daff, M.; Cramphorn, B. Pedestrian behaviour near signalised crossings. In Proceedings of the 1994 Australian Pedestrian and Bicyclist Safety and Travel Workshop, Melbourne, Australia, 19–21 April 1994. [Google Scholar]
- Gehl, J. Cities for People; Island Press: Washington, DC, USA, 2010. [Google Scholar]
- Agrawal, A.W.; Schimek, P. Extent and Correlates of Walking in the USA. Transp. Res. Part D Trans. Environ. 2007, 8, 548–563. [Google Scholar] [CrossRef]
- Moudon, A.W.; Lee, C.; Cheedle, A.D.; Garvin, C.; Johnson, D.; Schmid, T.L.; Weathers, R.D.; Lin, L. Operational Definitions of Walkable Neighborhood: Theoretical and Empirical Insights. J. Phys. Act. Health 2006, 3, 99–117. [Google Scholar] [CrossRef] [PubMed]
- Chen, Y.; Wang, Q.Y.; Xi, W.Q. Influence of Spatial Form on Pedestrian. Planners 2017, 33, 74–80. [Google Scholar]
- Silverman, B.W. Density Estimation for Statistics and Data Analysis; Chapman and Hall: New York, NY, USA, 1986. [Google Scholar]
- Hess, P.M. Measures of Connectivity [Streets: Old Paradigm, New Investment]. Places 1997, 11, 58–65. [Google Scholar]
- Randall, T.A.; Baetz, B.W. Evaluating Pedestrian Connectivity for Suburban Sustainability. J. Urban Plan. Dev. 2001, 127, 1–15. [Google Scholar] [CrossRef]
- Criterion Planners Engineers. INDEX Plan Builder User Notebook; Criterion Planners: Portland, OR, USA, 2007. [Google Scholar]
Figure 1.
Status map of land use in Hexi District.

Figure 2.
Zoning map of Hexi District.

Figure 3.
Ratio of travel mode choice preference of residents.
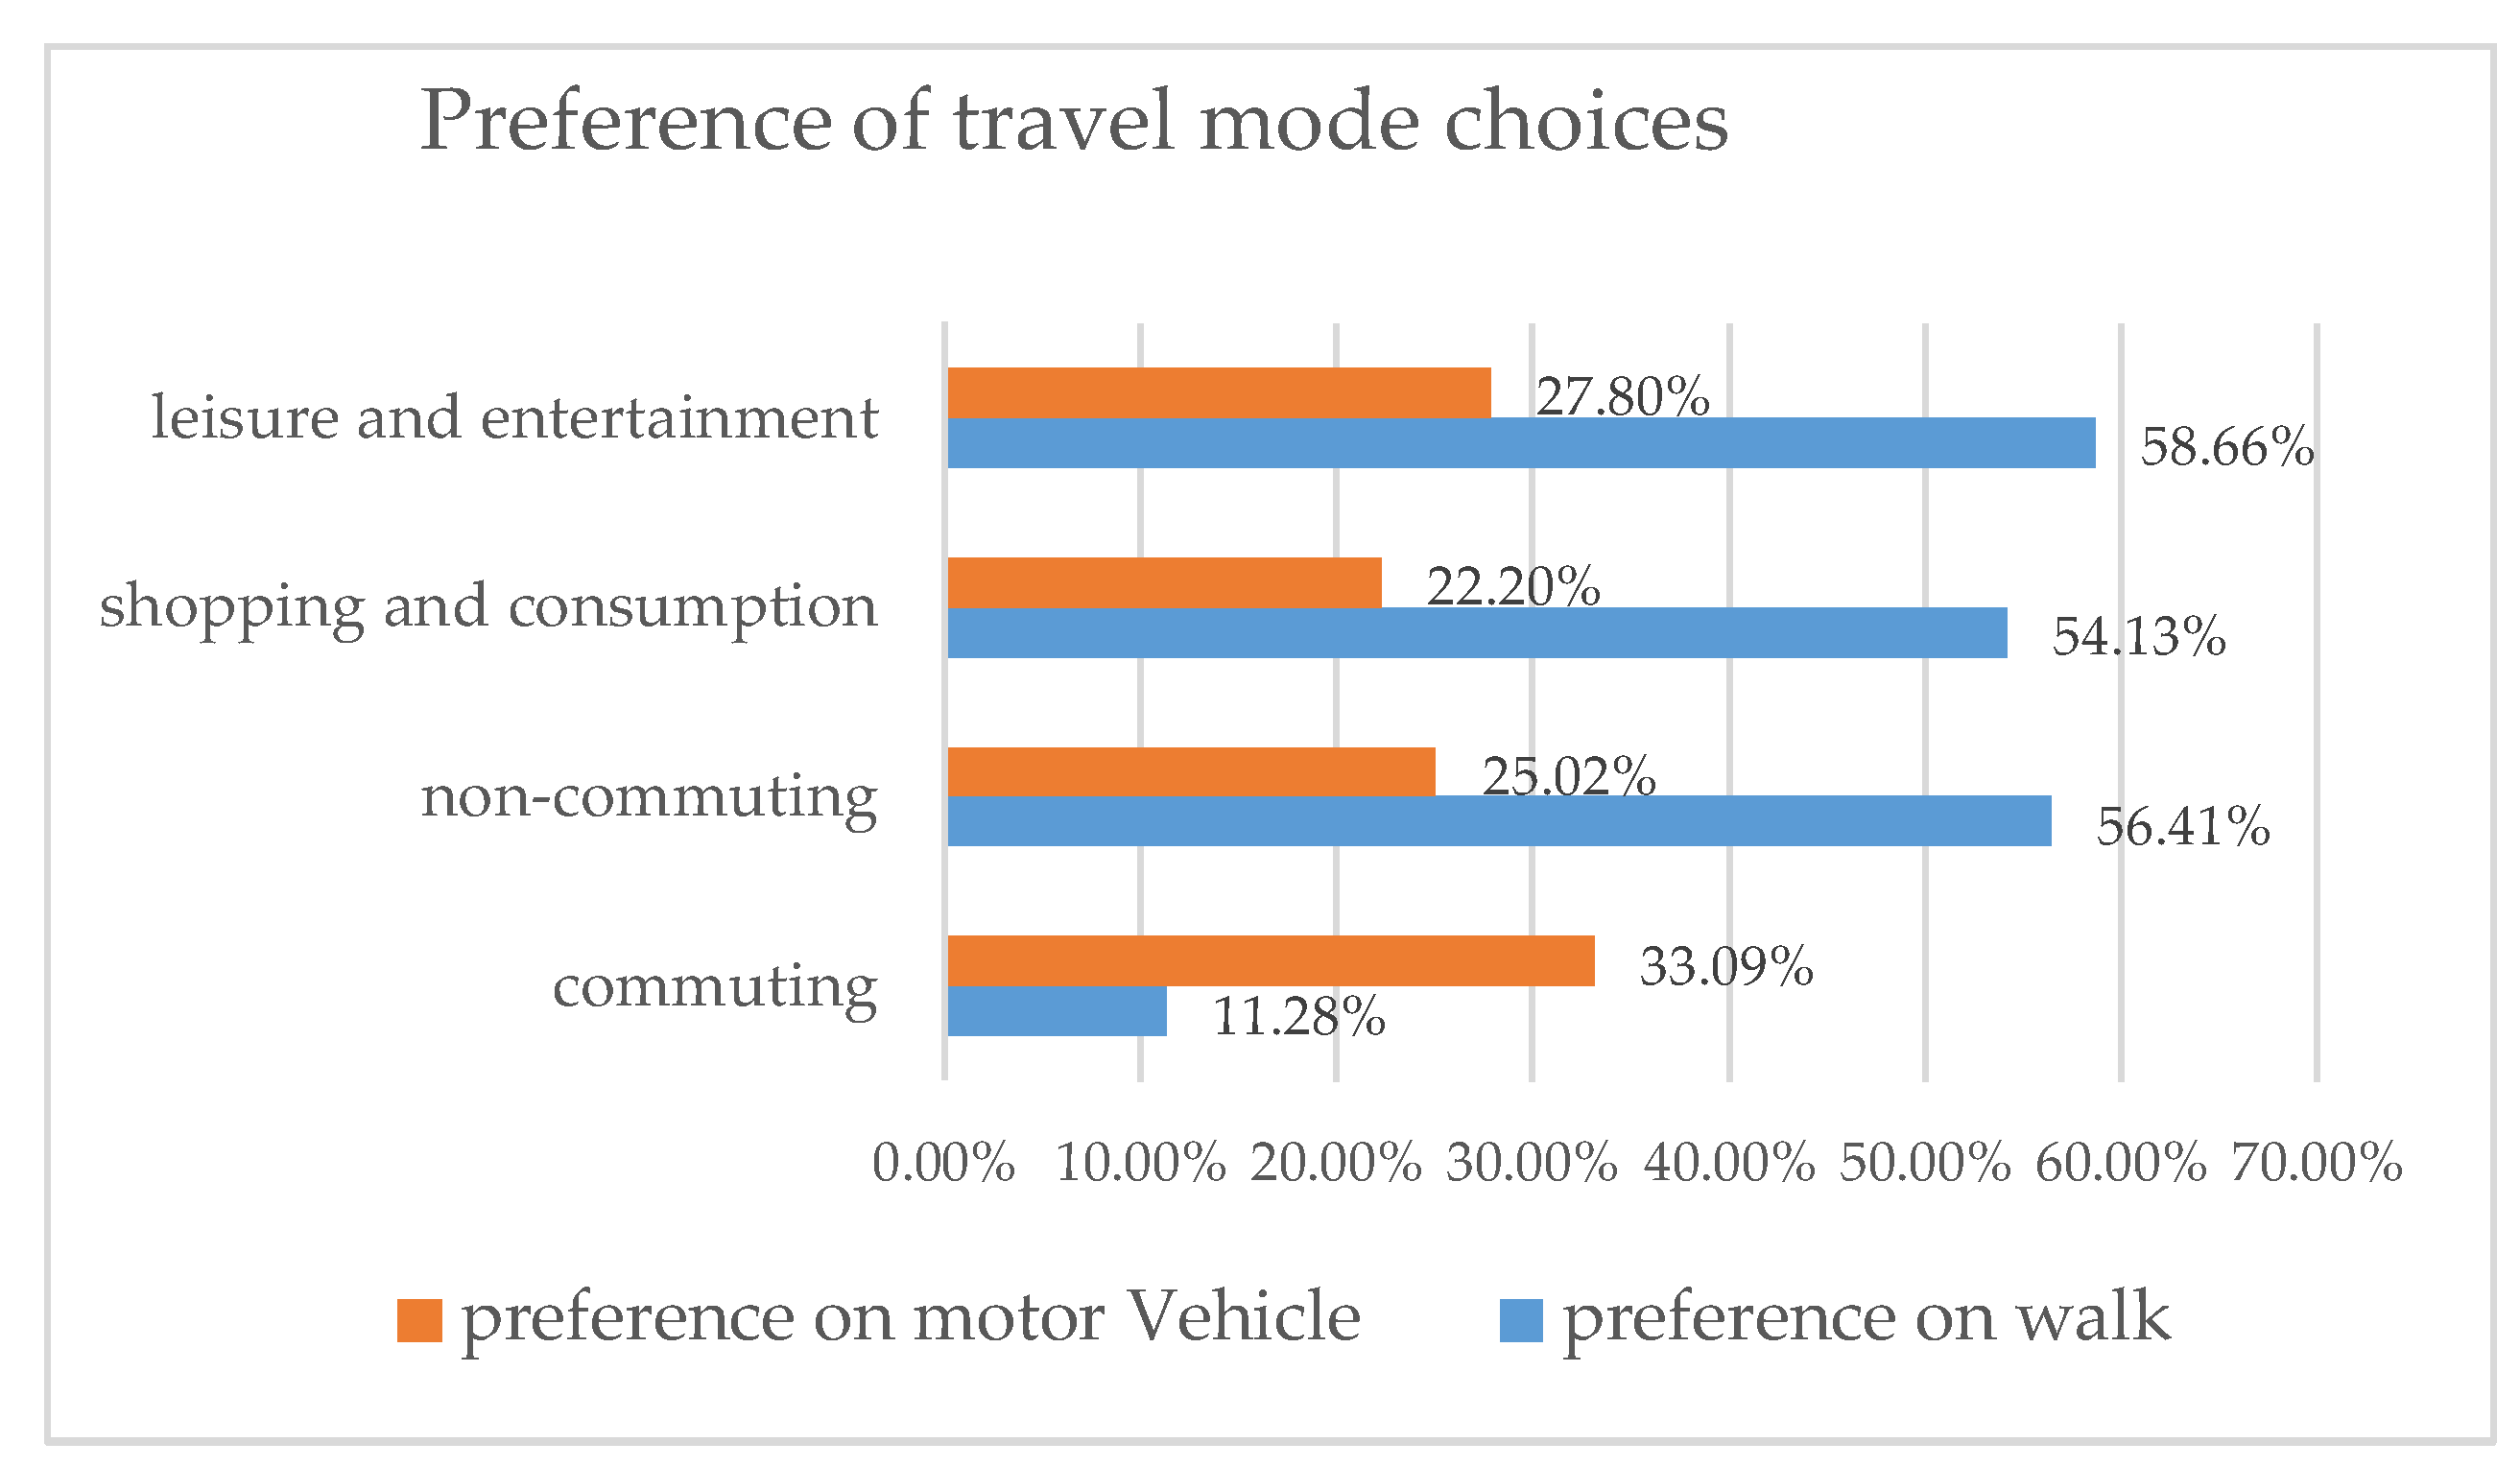
Figure 4.
Score of concern factors of residents’ walking behavior.
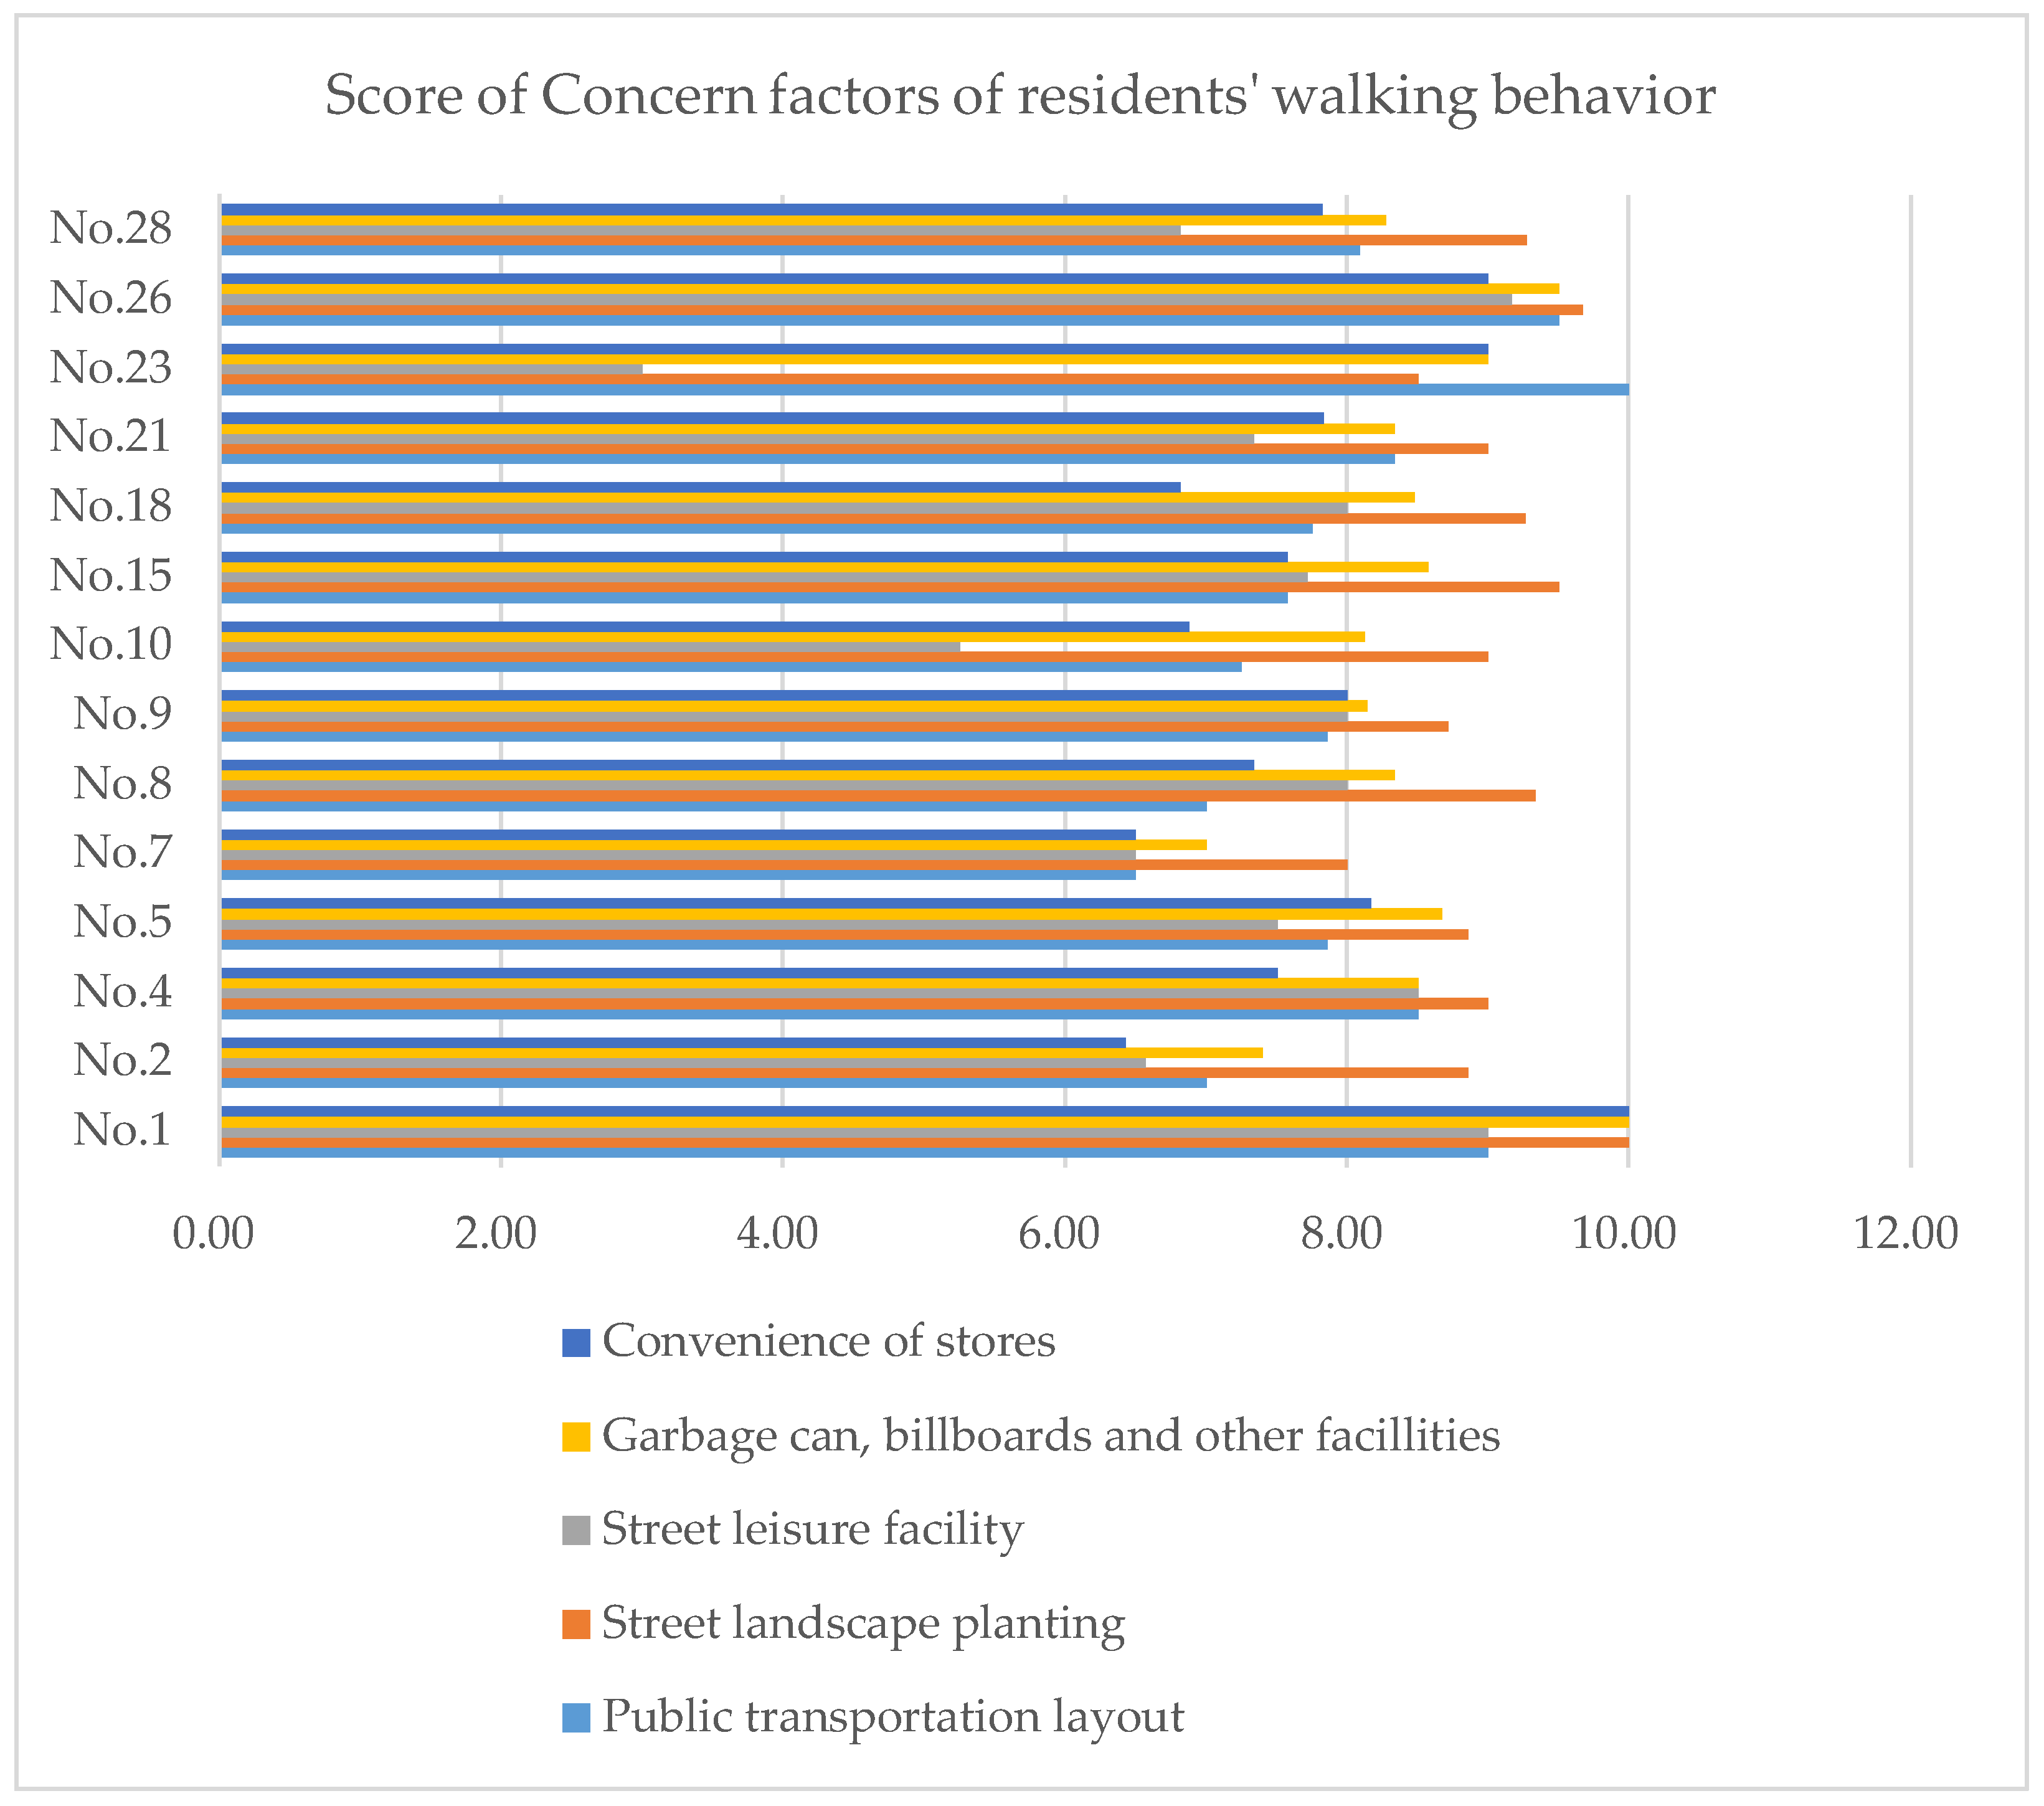
Figure 5.
The travel quantity of each residential block.

Figure 6.
Ratio of travel mode choice in non-commuter period.

Figure 7.
Status quo of Hexi District, Nanjing.

Figure 8.
Kernel density map of the distribution of service facilities in Hexi District, Nanjing.

Figure 9.
Thermodynamic diagram of accessibility in Hexi District, Nanjing.
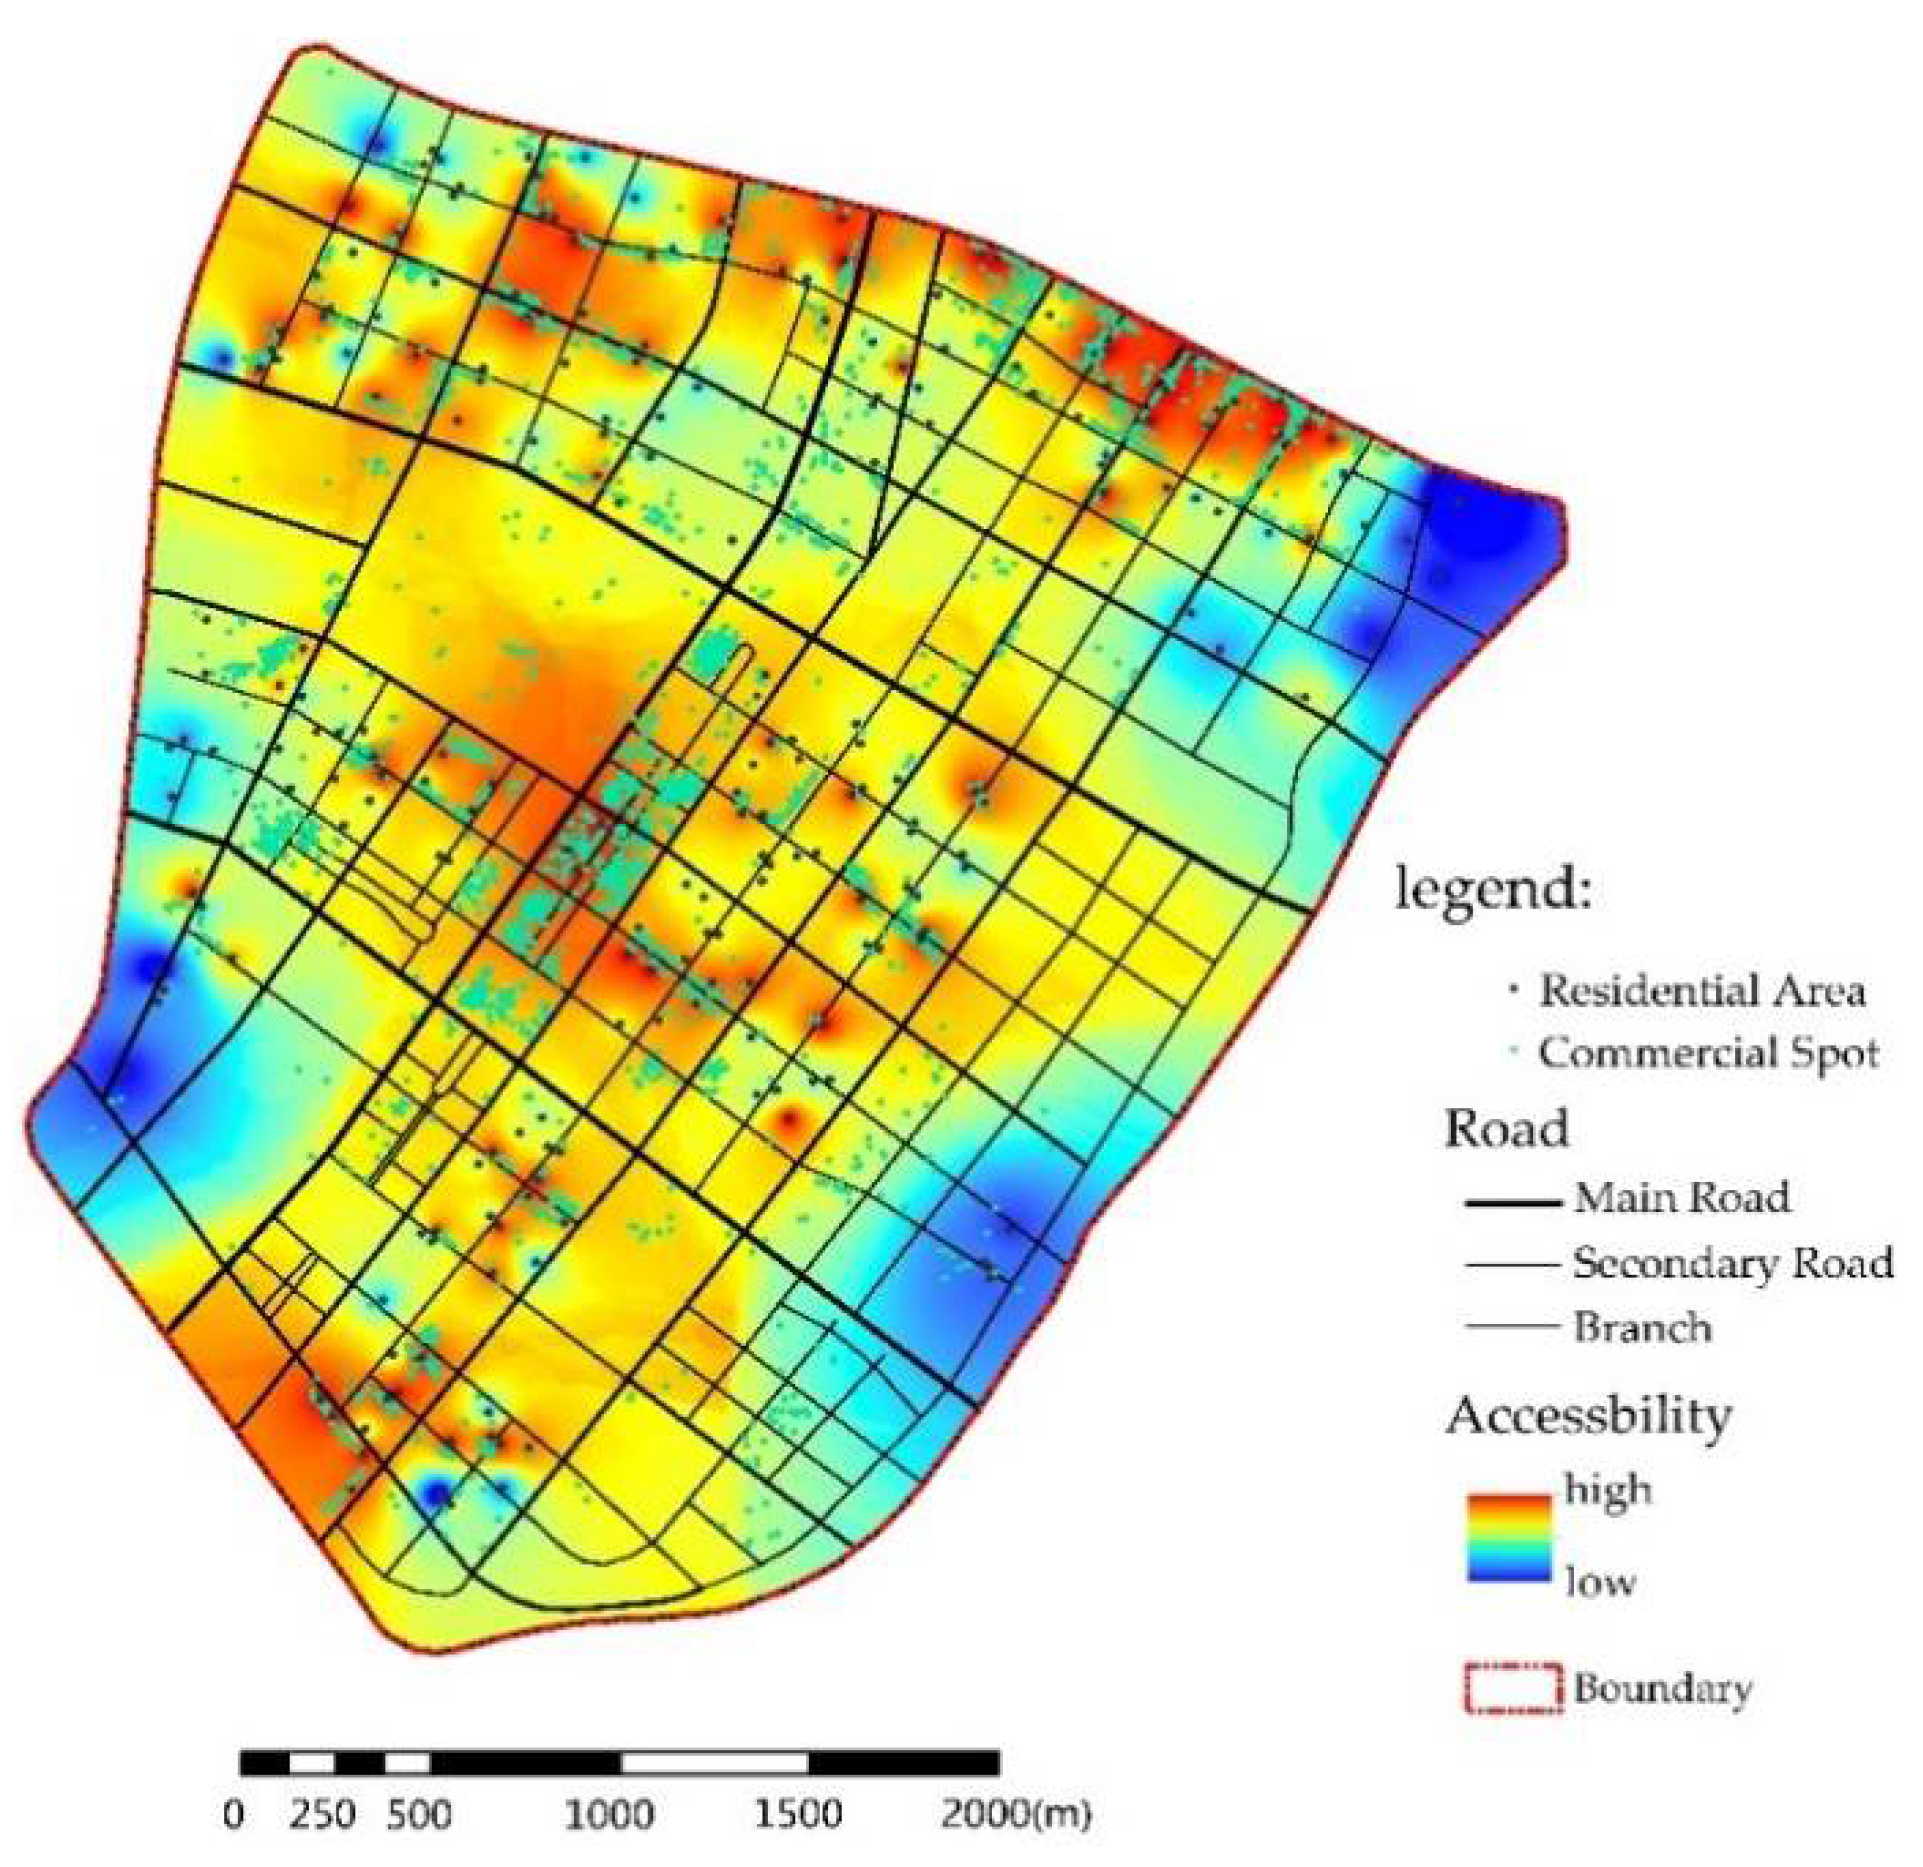
Figure 10.
Accessibility zoning map of Hexi District, Nanjing.

Figure 11.
Thermodynamic diagram of pedestrian route directness in Hexi District, Nanjing.

Figure 12.
Zoning map of pedestrian route directness of Hexi District, Nanjing.
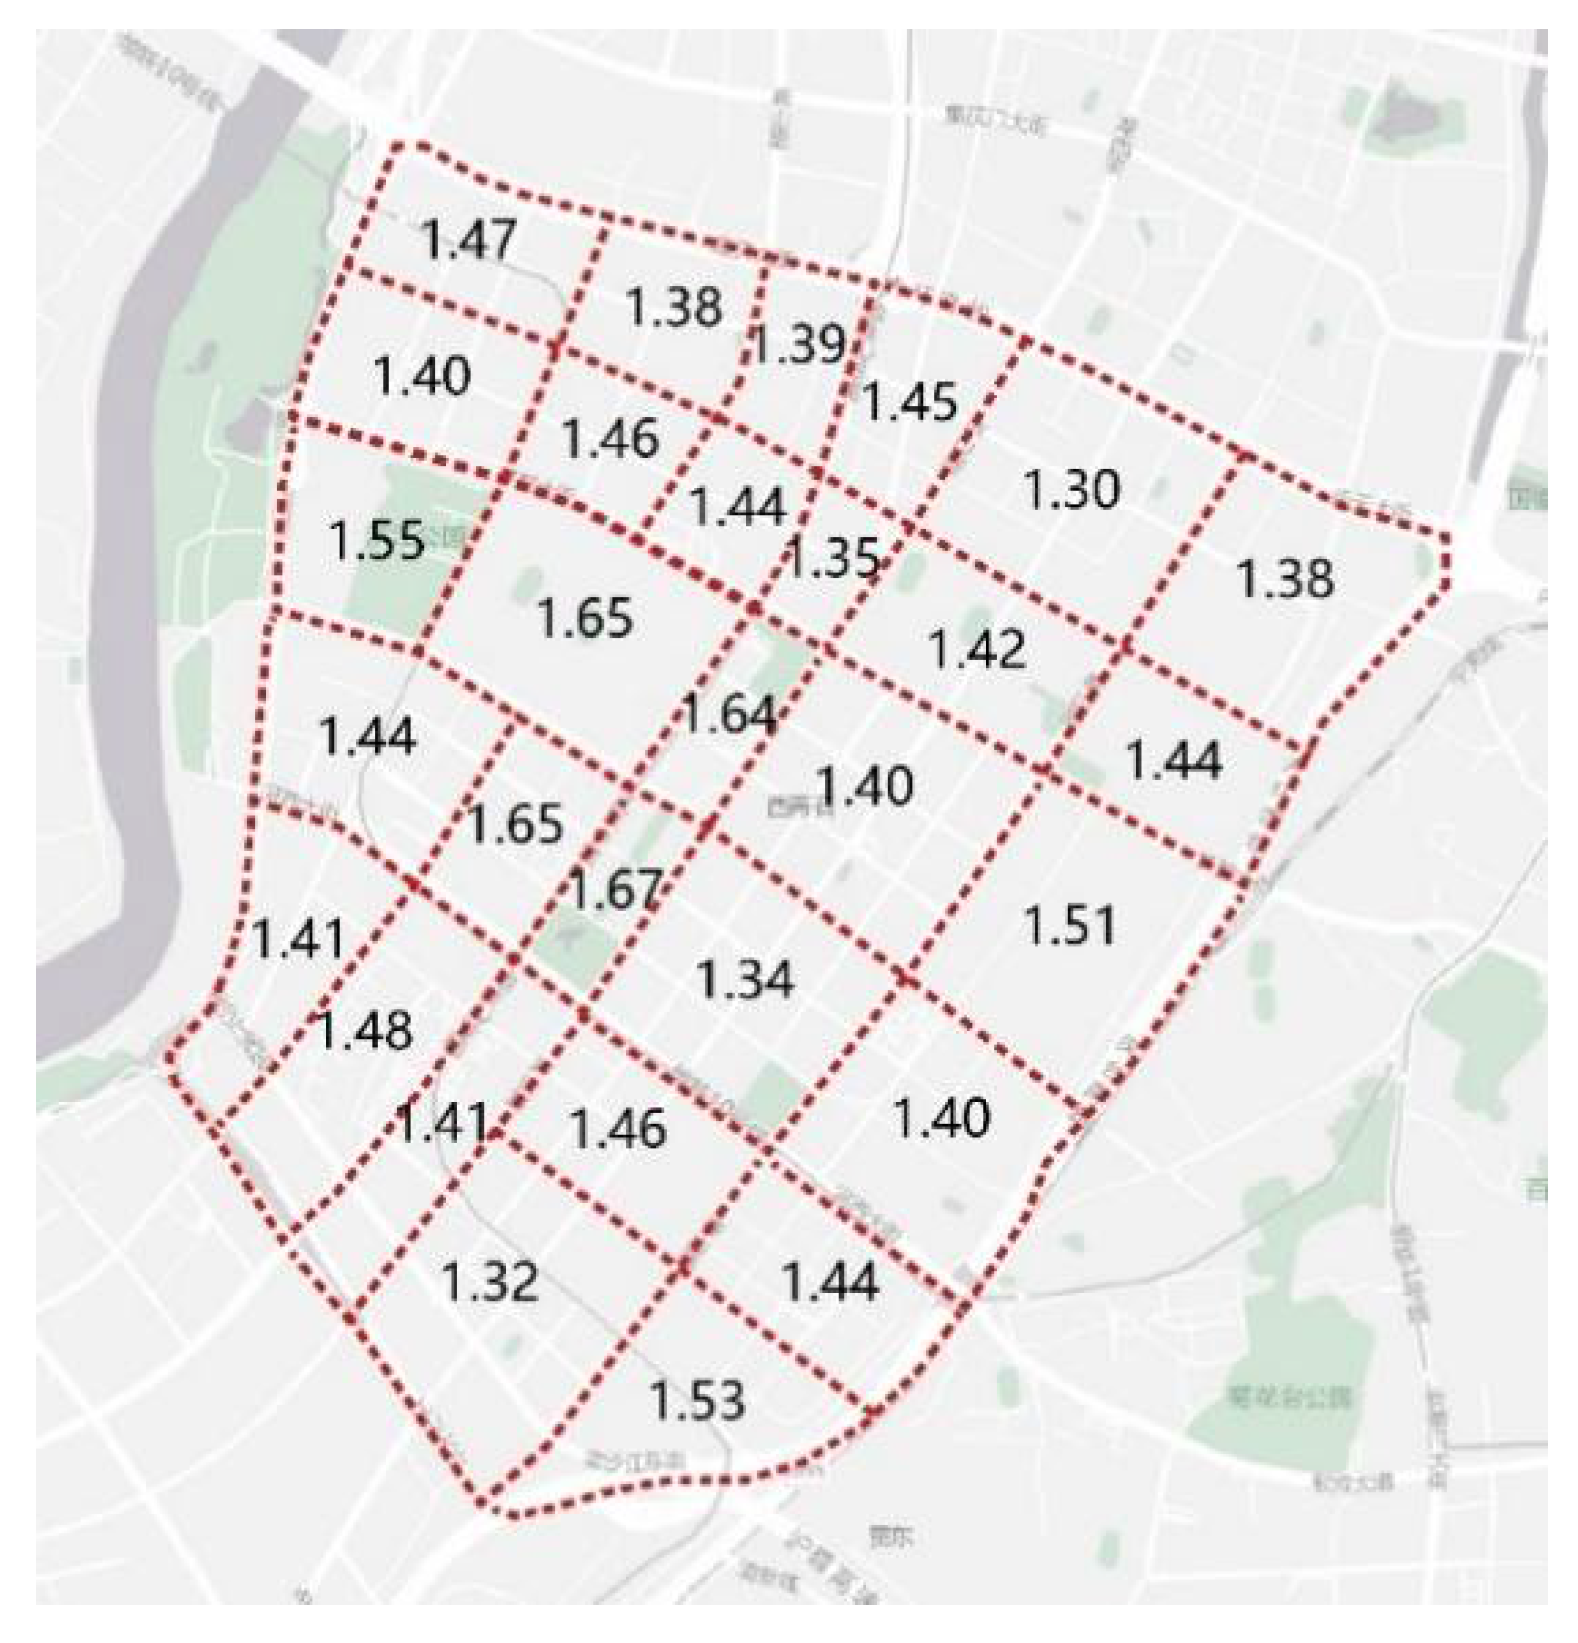
Figure 13.
Street walking Popularity of Hexi District, Nanjing.
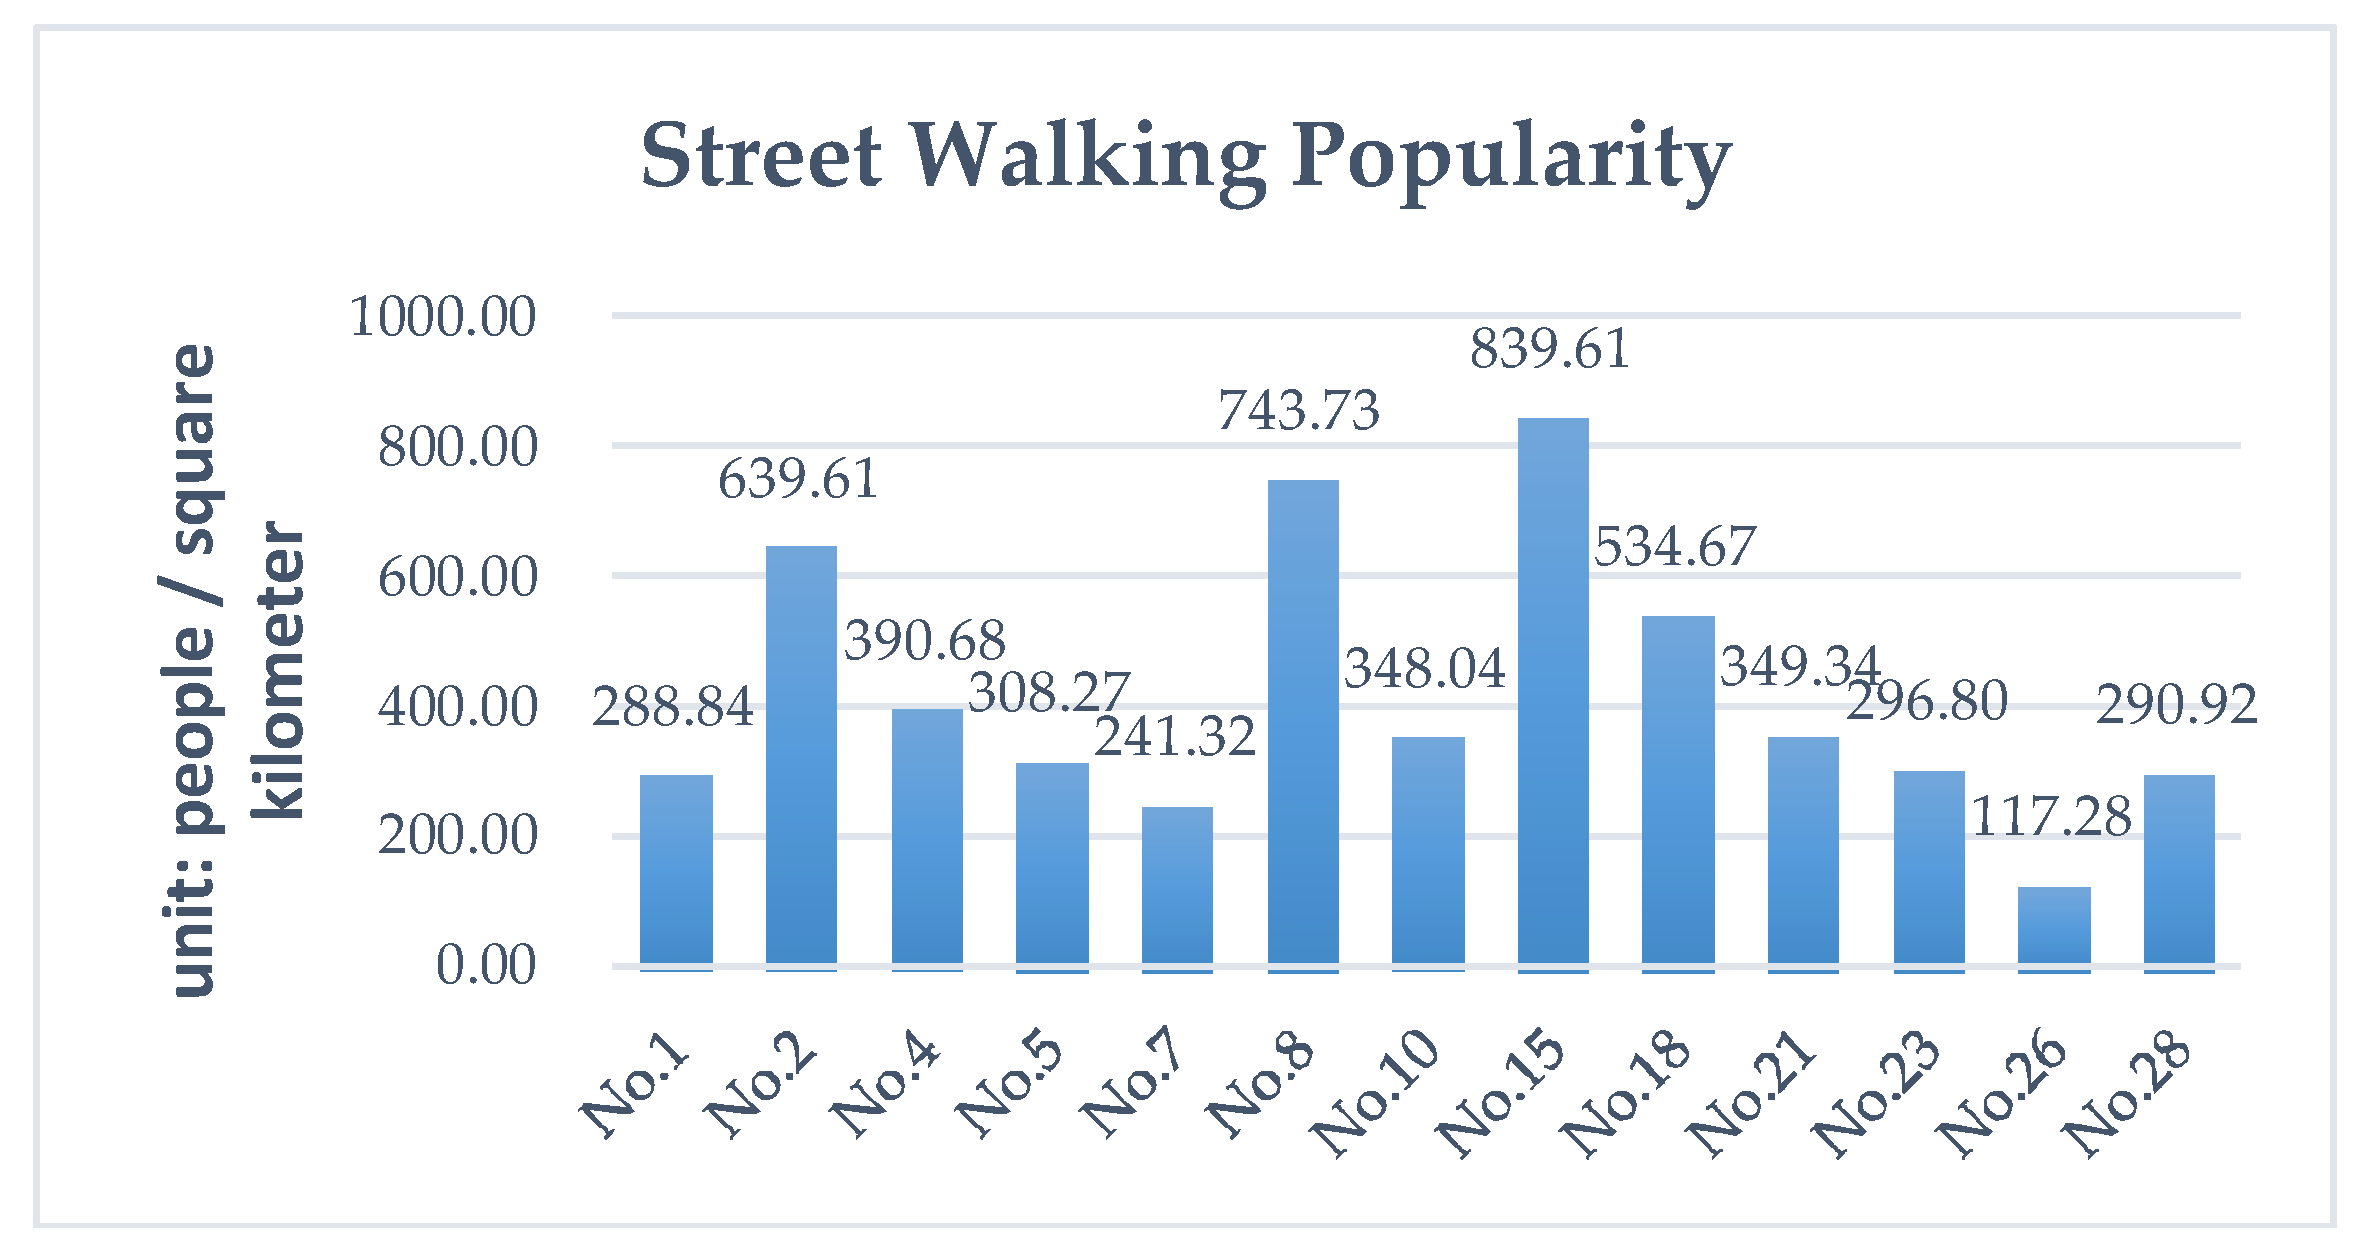
Figure 14.
Ratio of green interface of Hexi District, Nanjing.
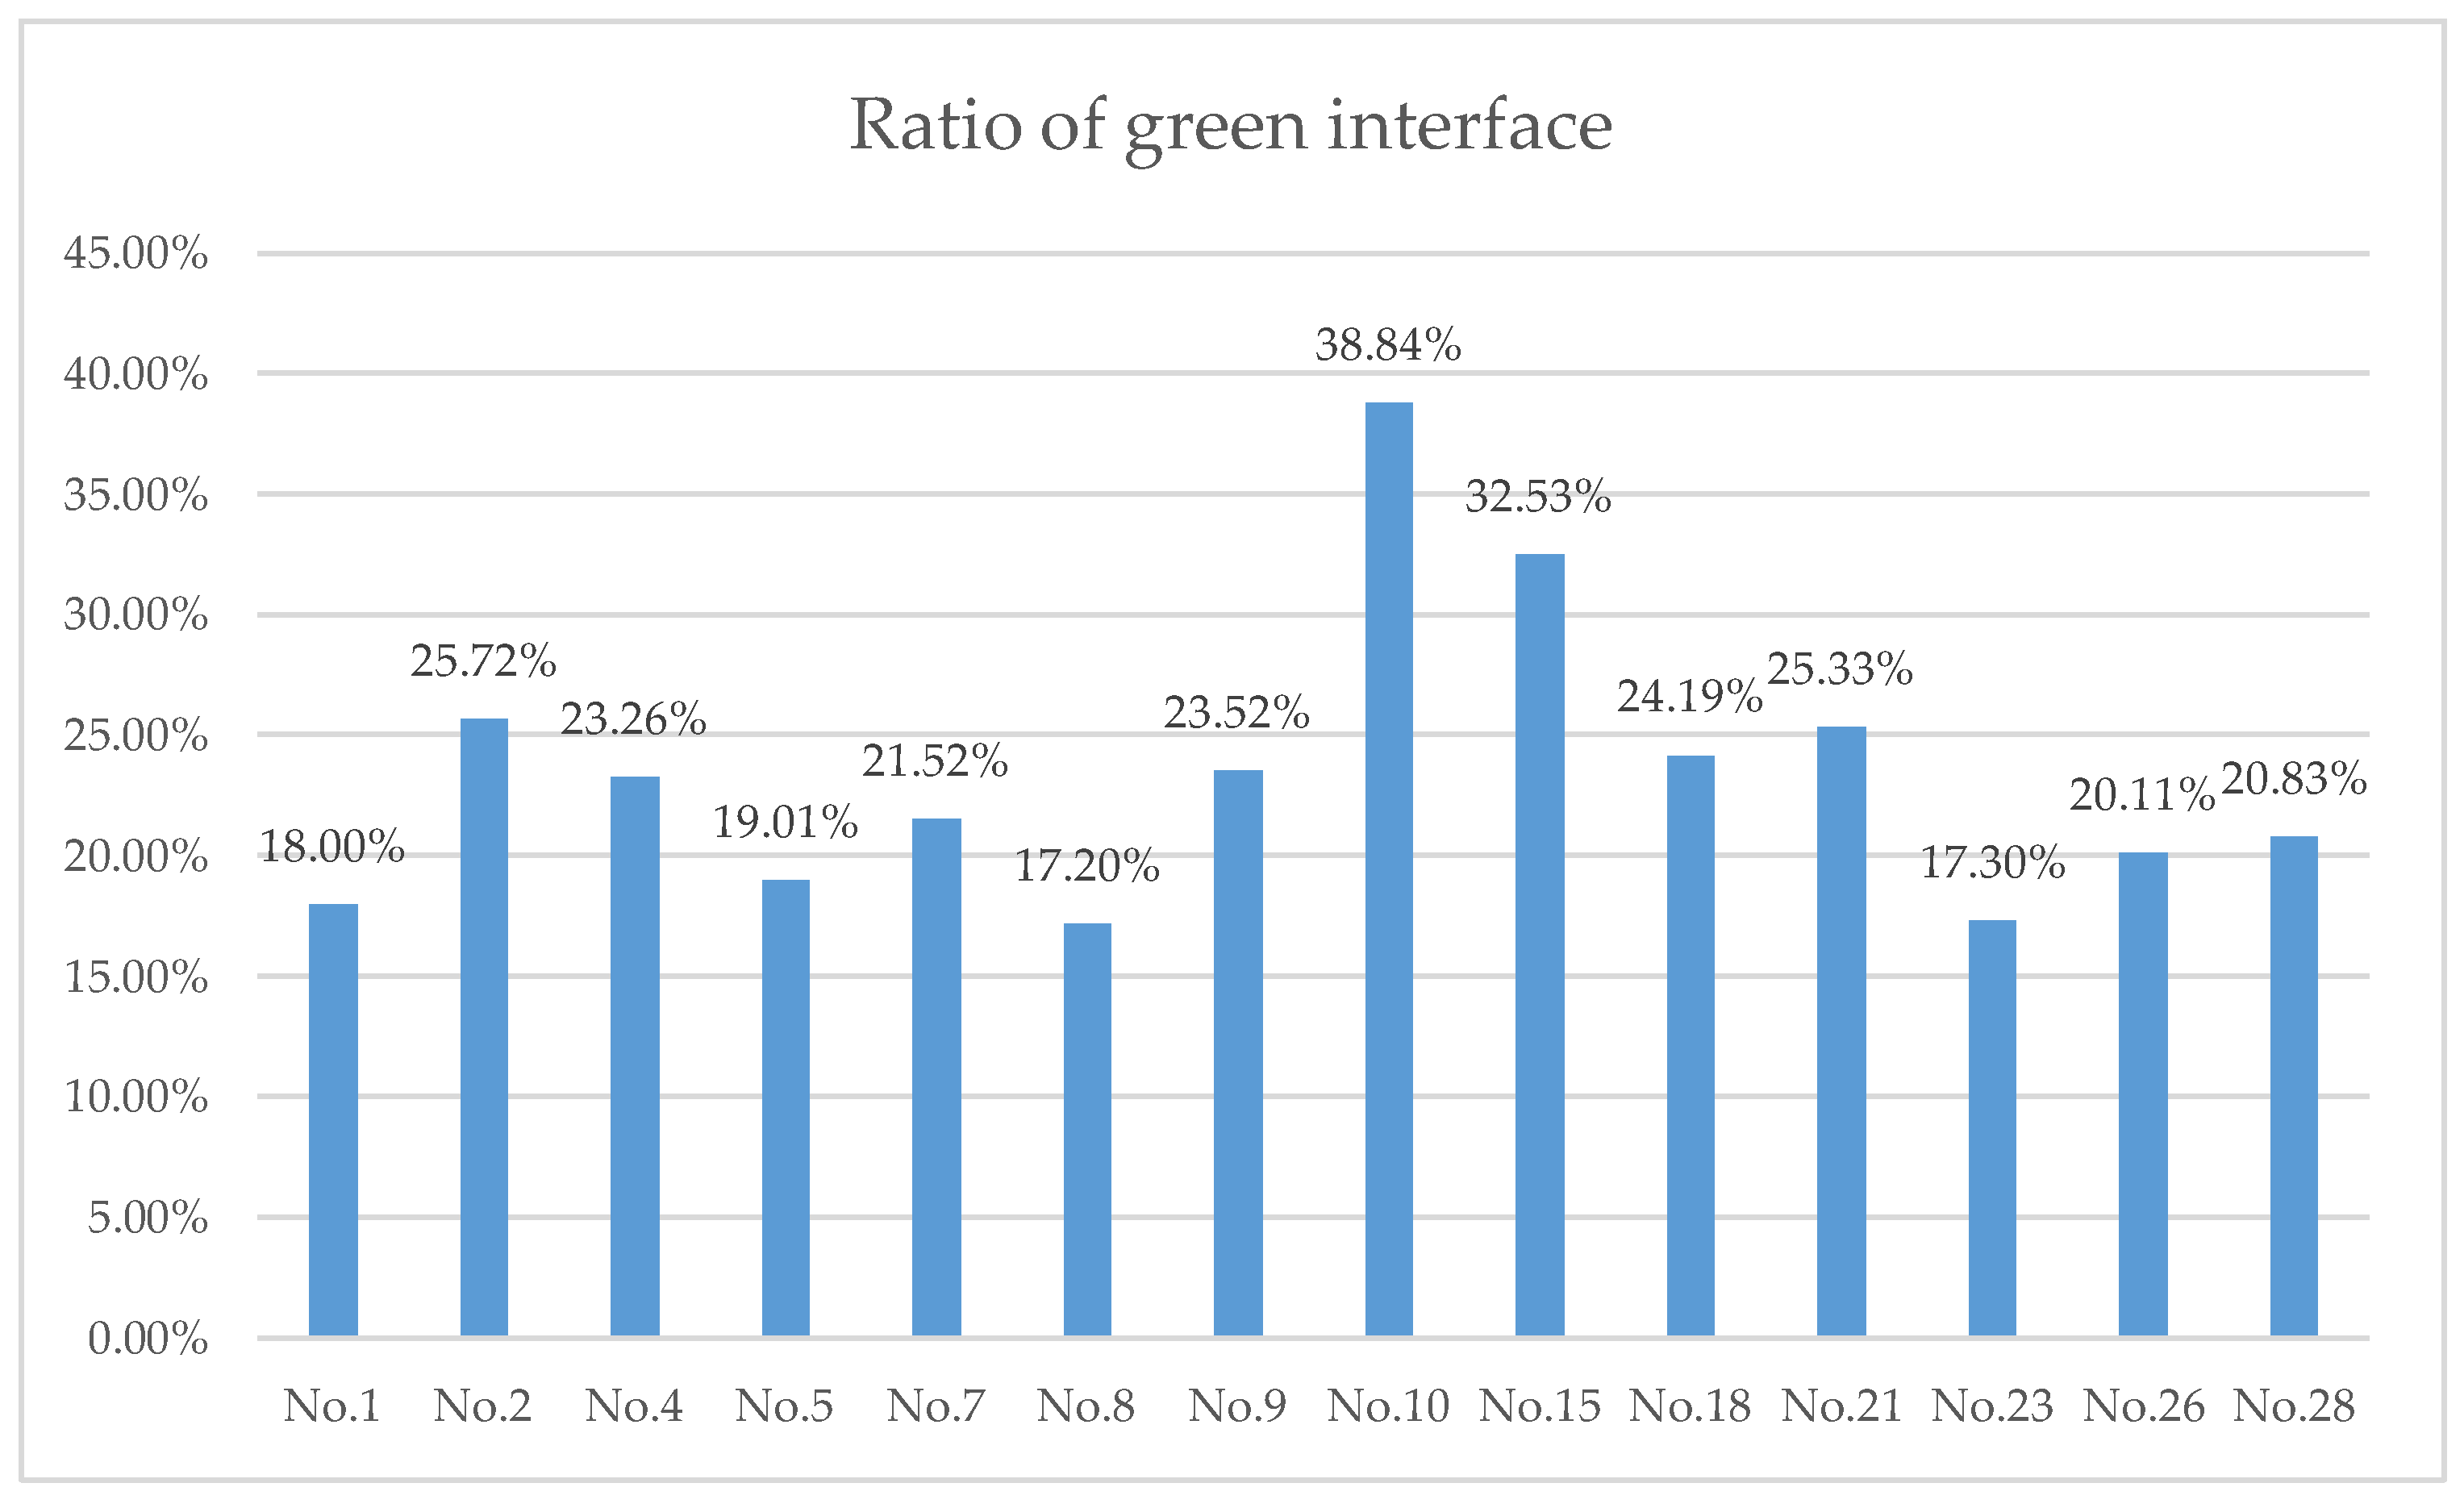
Figure 15.
Comparison with average value.


Table 1.
Correlation of residents’ preference and travel mode choice.
| Travel Mode Choices | Street Landscpe and Planting | Street Leisure Facilities | Garbage Can, Billboards and Other Facilities | Public Transportation Station Layout | Convenience of Stores | Street Popularity | |
|---|---|---|---|---|---|---|---|
| Ratio of Walking | Correlation | 0.642 * | −0.080 | −0.347 | −0.215 | 0.747 ** | 0.709 ** |
| Significance | 0.018 | 0.796 | 0.246 | 0.481 | 0.003 | 0.007 | |
| Ratio of Motor Vehicle | Correlation | −0.591 * | 0.083 | 0.322 | 0.360 | −0.416 | −0.566 * |
| Significance | 0.033 | 0.789 | 0.284 | 0.226 | 0.157 | 0.044 |
** Correlation is significant at the 0.01 level (2 tailed); * Correlation is significant at the 0.05 level (2 tailed).
Table 2.
Correlation of pedestrian friendliness indicators and residents’ travel mode choice.
| Travel Mode Choices | Average Weighted Travel Time | Travel Mode Choices | Walking Popularity | Ratio of Street Greening | |
|---|---|---|---|---|---|
| Ratio of Walking | Correlation | −0.306 * | −0.444 ** | 0.487 ** | 0.381 ** |
| Significance | 0.039 | 0.002 | 0.001 | 0.009 | |
| Ratio of Motor Vehicle | Correlation | 0.466 ** | 0.465 ** | −0.499 ** | −0.240 |
| Significance | 0.001 | 0.001 | 0.000 | 0.108 |
** Correlation is significant at the 0.01 level (2 tailed).; * Correlation is significant at the 0.05 level (2 tailed).
© 2018 by the authors. Licensee MDPI, Basel, Switzerland. This article is an open access article distributed under the terms and conditions of the Creative Commons Attribution (CC BY) license (http://creativecommons.org/licenses/by/4.0/).
Share and Cite
MDPI and ACS Style
Qian, C.; Zhu, D.; Zhou, Y.; Chen, J. Measurements of Pedestrian Friendliness of Residential Area: A Case Study in Hexi District of Nanjing. Sustainability 2018, 10, 1993. https://doi.org/10.3390/su10061993
AMA Style
Qian C, Zhu D, Zhou Y, Chen J. Measurements of Pedestrian Friendliness of Residential Area: A Case Study in Hexi District of Nanjing. Sustainability. 2018; 10(6):1993. https://doi.org/10.3390/su10061993
Chicago/Turabian StyleQian, Caiyun, Difei Zhu, Yang Zhou, and Jiadeng Chen. 2018. "Measurements of Pedestrian Friendliness of Residential Area: A Case Study in Hexi District of Nanjing" Sustainability 10, no. 6: 1993. https://doi.org/10.3390/su10061993
Note that from the first issue of 2016, this journal uses article numbers instead of page numbers. See further details here.