The Effects of Perceived Barriers on Innovation Resistance of Hydrogen-Electric Motorcycles


1
Department of Health Diet and Industry Management, Chung Shan Medical University, Taichung City 40201, Taiwan
2
Graduate Institute of Bio-Industry Management, National Chung Hsing University, Taichung City 40227, Taiwan
3
International Bachelor Program of Agribusiness, National Chung Hsing University, Taichung City 40227, Taiwan
*
Author to whom correspondence should be addressed.
Sustainability 2018, 10(6), 1933; https://doi.org/10.3390/su10061933
Submission received: 24 April 2018
/
Revised: 28 May 2018
/
Accepted: 5 June 2018
/
Published: 9 June 2018
(This article belongs to the Special Issue Hydrogen Production and Utilization)
Abstract
:As environmental awareness among the public gradually improves, it is predicted that the trend of green consumption will make green products enter the mainstream market. Hydrogen-electric motorcycles, with eco-friendly and energy-efficient characteristics, have great advantages for development. However, as a type of innovative product, hydrogen-electric motorcycles require further examination with regard to consumer acceptance and external variables of the products. In this study, consumer behavioral intention (BI) for the use of hydrogen-electric motorcycles and its influencing factors are discussed, using innovation resistance as the basis and environmental concern as the adjusting variable. Consumers’ willingness-to-pay (WTP) for hydrogen-electric motorcycles is estimated using the contingent valuation method (CVM). The results found that (1) perception barriers, viz., usage barrier, value barrier, risk barrier, tradition barrier, and price barrier are statistically significant, whereas image barrier is not; (2) a high degree of environmental concern will reduce the consumers’ innovation resistance to the hydrogen-electric motorcycles; (3) up to 94.79% of the respondents of the designed questionnaire suggested that the promotion of hydrogen-electric motorcycles requires a subsidy of 21.9% of the total price from the government. The mean WTP of consumers for the purchase of hydrogen-electric motorcycles is 10–15% higher than that of traditional motorcycles.
1. Introduction
With the impact of global environmental protection, energy conservation, and emission reduction, the trend of green consumption is expected to bring green products to the mainstream market. Compared to gasoline and lead-acid cells, hydrogen fuel cells have multiple strengths, including zero pollution, high efficiency, low noise, low vibration, quick start, and long lifetime, making hydrogen-electric motorcycles a promising product with both eco-friendly and energy-efficient characteristics. As shown in the relevant statistics (2017) [1] by the Ministry of Transportation and Communications, R.O.C., the number of motorcycles in 2017 reached 14.844 million in Taiwan. This means, on an average, every two individuals have a motorcycle, indicative of the highest motorcycle density in Asia. However, the enormous number of motorcycles have not only generated the problem of traffic jams, but also led to air pollution and environmental burden [2]. Since the energy supply for motorcycles mainly relies on petroleum products, carbon dioxide emissions generated by the transportation sector are remarkably high, second only to those of the industrial sector in Taiwan. In order to efficiently reduce the contamination produced by traditional motorcycles, the government passed the Electric Motorcycle Industrial Development and Promotion Plan in July 2009, announcing that individuals would be subsidized with up to 11,000 TWD on the purchase of electric scooters and 8000 TWD on the purchase of light e-scooters. Moreover, in order to solve the problems of unpopularized charging facilities in Taiwan, with overweight and inconvenient lead-acid batteries, the Industrial Development Bureau provided certain subsidies and rewards for the charging facilities of electric motorcycle manufacturers [3].
As a type of innovative product, hydrogen-electric motorcycles are expected to experience innovation resistance. When conflicts exist between the innovation and the consumer’s belief, the product value, and the specifications, innovation resistance occurs. The concept of innovation resistance was initially proposed by Ram and Sheth in 1989 [4], who suggested that consumers would exhibit behaviors of innovation resistance during the process of accepting innovative products due to perception barriers. In the existing studies of innovation resistance theory, innovation resistance drew little attention from researchers in the field of consumer behaviors, with only a few researchers [5,6,7,8,9] engaging in relevant studies. Most researchers focused on the discussions of innovation influences [10,11,12,13,14,15], innovation diffusion [16,17,18,19] and the characteristics and behaviors, as well as the relationship between these two, among early adopters [20,21]. Dedehayir et al. [22] suggested that understanding the consumers’ willingness and unwillingness to adopt innovations were equally important. Exploring the reasons for consumers’ unwillingness to adopt innovations could not only help enterprises develop more smoothly in the initial stages, but also further modify the innovations, so as to meet the genuine requirements of consumers who did not adopt the innovations. Barrier factors related to innovation resistance are expected to occur in certain links. Therefore, this study investigates the factors that affect the perception barriers of consumers’ innovation resistance to hydrogen-electric motorcycles based on the theoretical innovation resistance model proposed by Ram and Sheth [4].
When purchasing a product, consumers base their decision to buy on more factors than simply their interest in the product. Under the impact of consumption behavior variation derived from the booming environmental awareness, environmentally conscious consumers will buy green products to protect the earth’s ecological environment, even if the products are expensive and inconvenient to use to a certain extent, reducing innovation resistance. Yuriev et al. [23], Prakash and Pathak [24] and Tung et al. [25] indicated that a more positive environmental concern would generate a higher possibility of an individual displaying eco-friendly behavior. Based on their research, Junior et al. [26] proposed that an individual’s concern for the environment would impact his/her willingness to buy green products. Hence, environmental concern is considered as the adjusting variable in this study, in order to discuss the influence of environmental concern on innovation resistance. Previous studies have employed the contingent valuation method (CVM) to assess the benefits of green products [27,28,29]. Moreover, Costa et al. [30] and Arega and Tadesse [31] suggested that consumers are likely to pay more for green products, with their willingness to consume green products depending on whether the willingness-to-pay (WTP) exceeds the price of the green products. Therefore, the extra price that consumers will pay for hydrogen-electric motorcycles is also considered to determine their willingness for purchasing the motorcycles in this study.
Overall, the application of hydrogen fuel cells in hydrogen-electric motorcycles is still in the initial stages, where consumer acceptance and external variables of this innovative product require further clarifications. In this study, based on innovation resistance, the consumers’ behavioral intention (BI) for the use of hydrogen-electric motorcycles and its influencing factors will be discussed. This can be regarded as an initial attempt to study hydrogen fuel cells, as one of this study’s contributions. Results of this study are expected to provide a more complete information regarding consumer behaviors to relevant researchers for product development and marketing strategy planning.
This paper primarily contains the following dimensions: (1) discussing the relationship between hydrogen-electric motorcycles and green consumption, while exploring how to evaluate consumers’ innovation resistance and environmental concern, based on literature review; (2) introducing the empirical model of this study; (3) analyzing the regression results and estimating the willingness of consumers to buy hydrogen-electric motorcycles in various areas; and (4) presenting the conclusions and suggestions of this study.
2. Methods
2.1. Conceptual Model
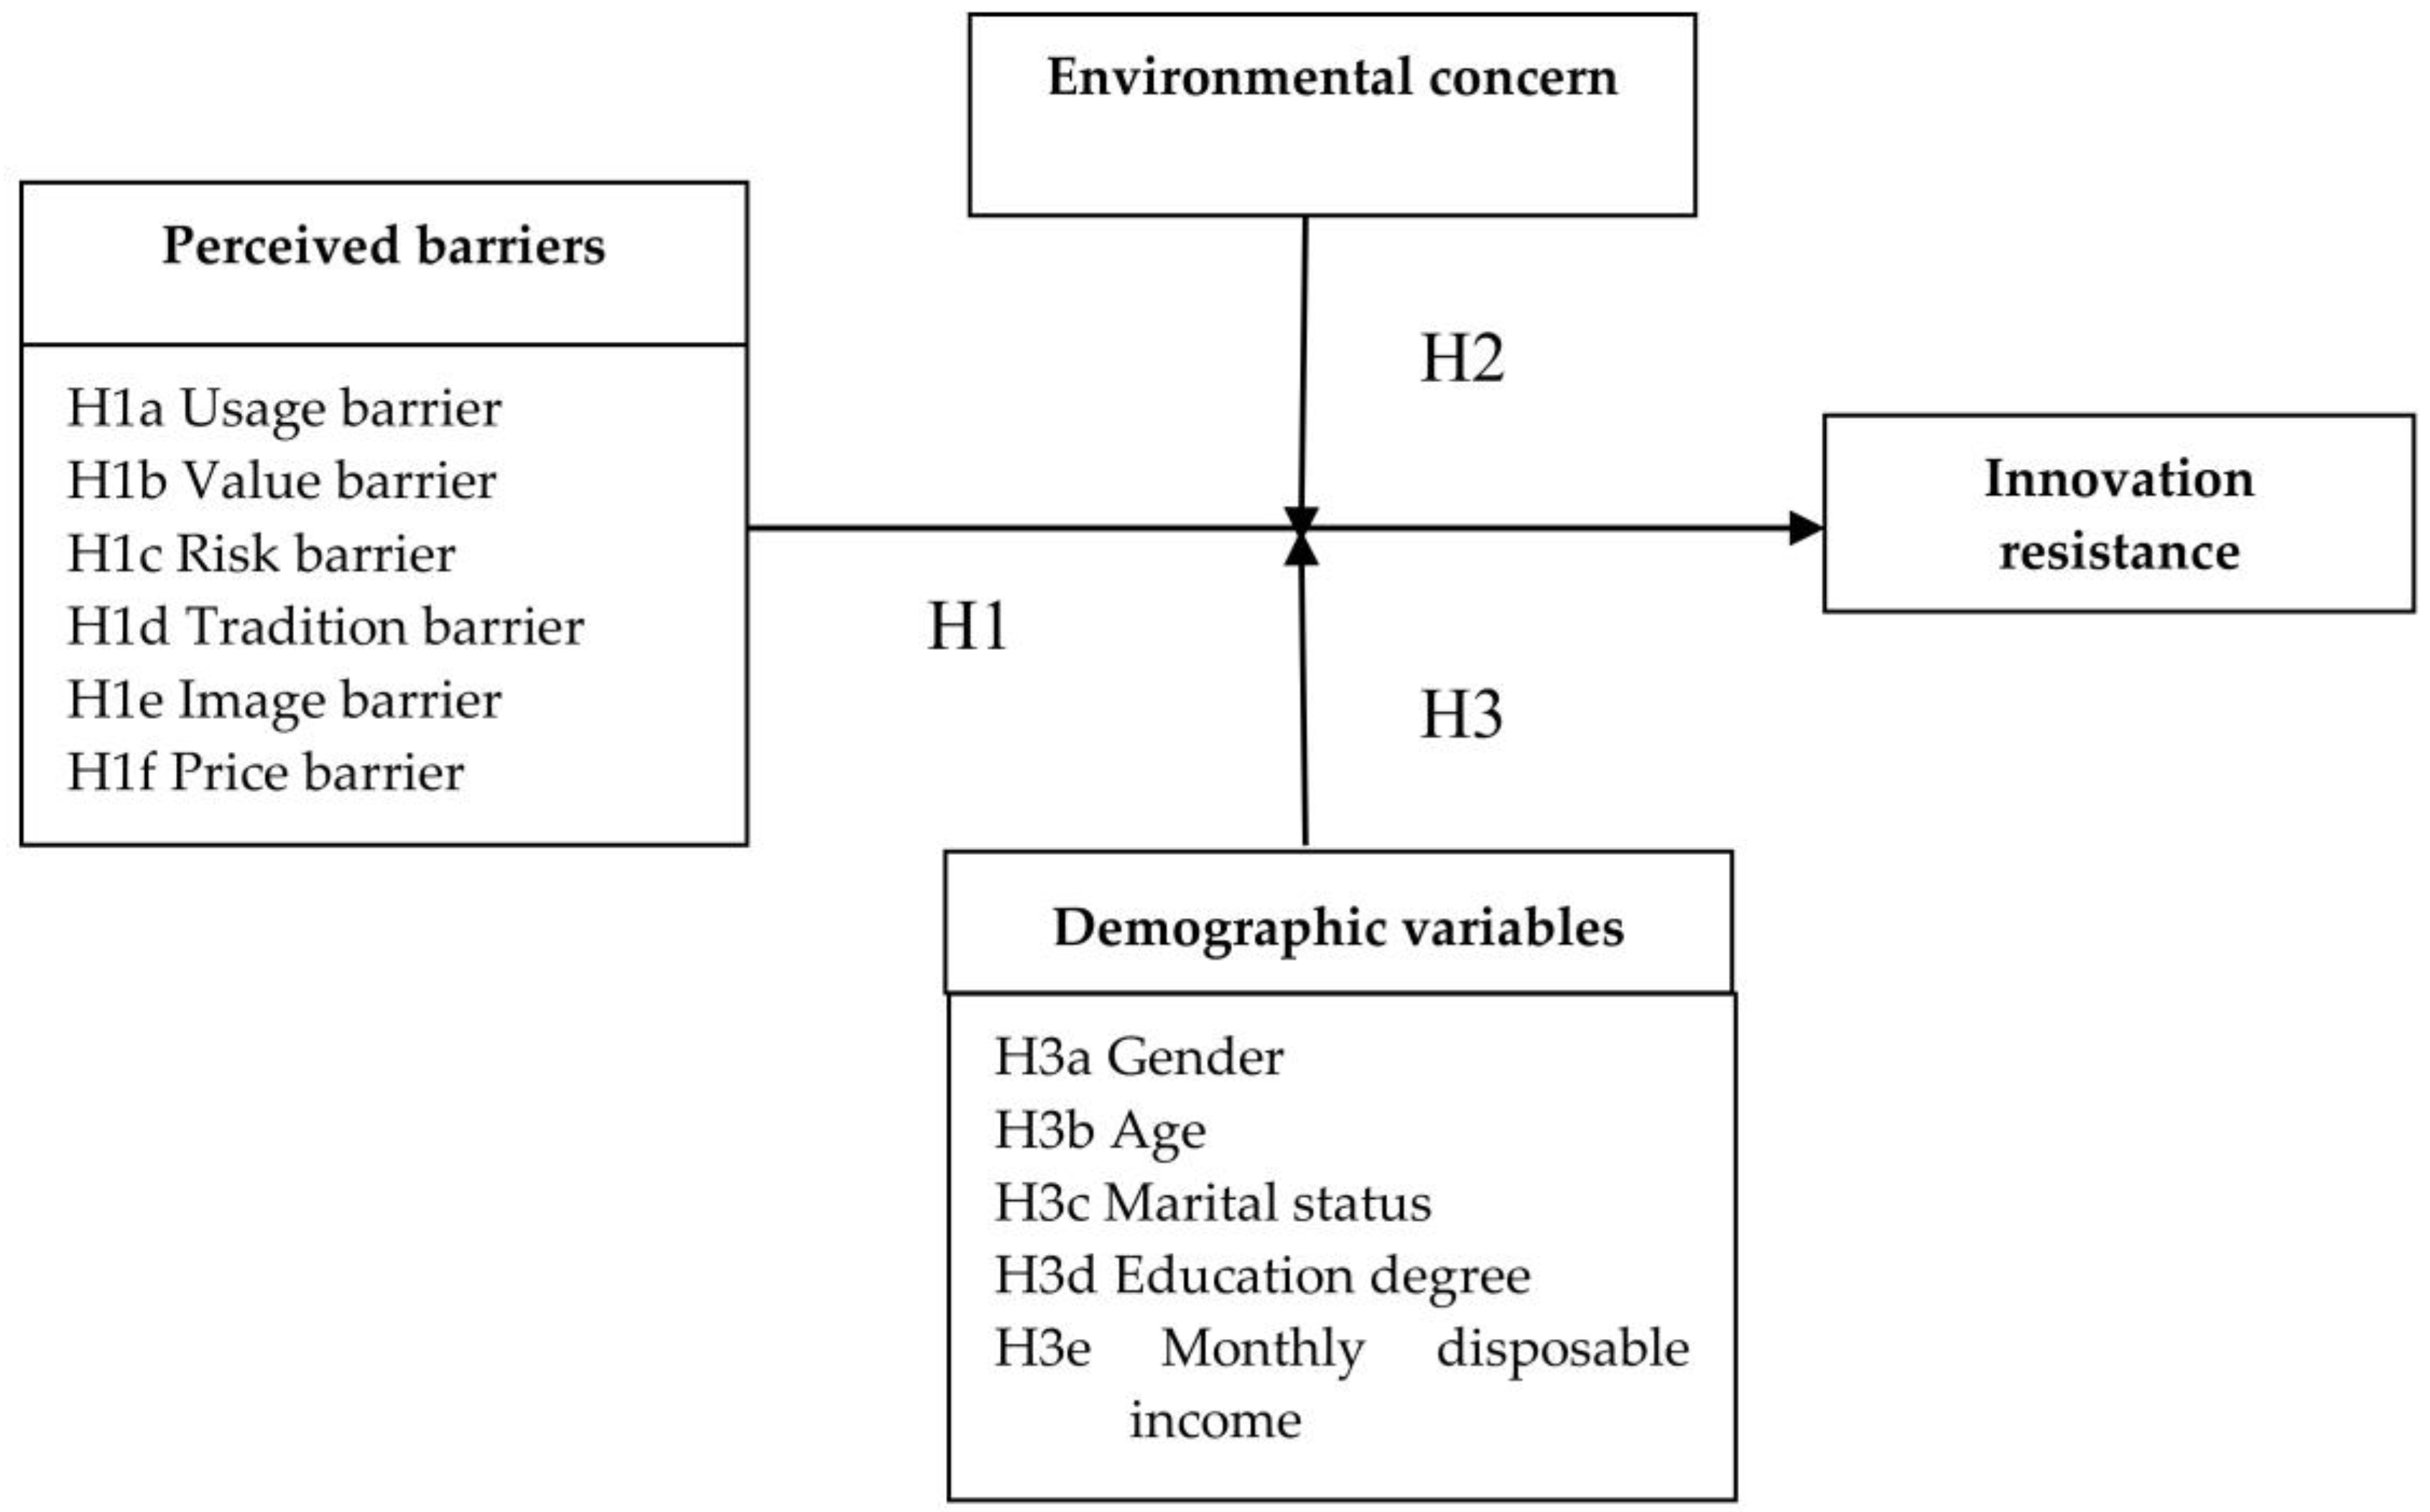
This study was conducted based on the theory of innovation resistance proposed by Ram and Sheth [4]. In this theory, perception barriers involve six innovation resistance source variables in five aspects: usage barrier, value barrier, risk barrier, tradition barrier, image barrier, and price barrier. Moreover, environmental concern has been considered as the adjusting variable to explore its influence on innovation resistance. Demographic variables have also been taken into consideration for the analysis of consumer behaviors. The research framework is shown in Figure 1.
2.2. Research Hypothesis
In the theory of innovation resistance developed by Ram and Sheth [4], perception barriers include five aspects, viz., usage barrier, value barrier, risk barrier, tradition barrier, and image barrier. Usage barrier refers to the perception barrier of consumers, concerned that they may not be able to apply an innovative product or service smoothly when the utilization of the innovation is not compatible with their existing workflows, practices, and habits. Consumers would adopt an innovative product only when the value of the innovation is higher than the previous product being replaced. If the innovative product is unable to provide a higher value to consumers, value barrier would develop, causing the consumers to refuse the adoption of the innovative product without sufficient incentives. Generally, consumers would be aware of the uncertainty and unpredictability existing in any innovation, potentially causing them to postpone the adoption pending an in-depth insight into the innovations. This is called risk barrier. Tradition barrier is a type of perception barrier that causes innovation resistance in consumers due to the deviation of innovations from traditionally perceived concepts. Image barrier occurs when consumers reject an innovation if they attach stereotypes to the innovative product, inhibiting the promotion of innovation. As discussed by Lian and Yen [6] and Ram and Sheth [4], price is also an important factor for consumers considering innovative products, which may lead to price barrier. On this basis, Hypothesis 1 of this study is established as shown below.
Hypothesis 1 (H1).
The stronger the perception barrier for consumers regarding an innovative product, the higher the innovation resistance.
Environmental concern indicates “the degree to which people are aware of problems regarding the environment and support efforts to solve them or indicate the willingness to contribute personally to their solution” [32]. An individual’s concern for the environment is fundamental to environmental research, having a direct relationship to the environmental friendly behavior [33]. Pagiaslis and Krontalis [34] have also mentioned that environmental concern has a direct and a positive impact on consumers’ intention to buy eco-friendly products. Newton et al. [35] suggested through their research that while environmental concern would not directly affect consumers’ willingness to buy, it could help them understand the impact of their purchase on the environment. Arisal and Artalar [36] pointed out that collectivists are more concerned about environment-related topics, indicating that environmental concern would influence an individual’s willingness to buy. New ecological paradigm scale (NEP scale) is a method to measure an individual’s attitude to the environment [37,38,39]. Yadav and Pathak [40] indicated that environmental concern is an index for predicting people’s willingness to buy green products.
The hydrogen-electric motorcycles discussed in this study are a type of innovative product, which can conserve energy and reduce emissions. For these motorcycles, consumers would modify their adoption degree of eco-friendly innovative products and the degree of innovation resistance in accordance with their environmental concern. They are even likely to pay more for the hydrogen-electric motorcycles. Therefore, Hypothesis 2 is developed based on environmental concern as the adjusting variable.
Hypothesis 2 (H2).
Correlation between perception barriers and innovation resistance can be adjusted through environmental concern. A higher degree of environmental concern will result in a weaker positive correlation between the two.
Claudy et al. [5] suggested that the perception of innovation will generate varying degrees of innovation resistance among consumers with different characteristics, where the three demographic variables, viz., age, education level, and income, will regulate the relationship with innovation resistance to various extents. Dagsvik et al. [41] investigated the potential market demands for alternative fuel vehicles in Norway. Results indicated that, compared to traditional fuel vehicles, alternative fuel vehicles are more competitive, with male consumers showing a higher acceptance to this innovative product than female consumers. Haan et al. [42] discovered that the preference of hybrid vehicles is essentially the characteristic of individuals with high income and education levels. Based on the research results described above and the research objective of this study, Hypothesis 3 was developed to explore the relationship between perception barriers and innovation resistance that is regulated through five demographic variables, viz., gender, age, marital status, education level, and monthly disposable income.
Hypothesis 3 (H3).
Relationship between perception barriers and innovation resistance may be regulated through demographic variables.
2.3. Questionnaire Design and Data Analysis Methods
In this study, the questionnaire was designed on the basis of literature discussions. The questionnaire included five sections: (1) Twenty-one questions about perception barriers (six measuring aspects), i.e., usage barrier, value barrier, tradition barrier, risk barrier, image barrier, and price barrier, mainly based on the studies of Heidenreich and Handrich [7] and Lian, and Yen [6]; (2) four questions about innovation resistance, developed and modified from the research by Kleijnen et al. [43]; (3) fifteen questions about environmental concern, derived from the research of Fleury-Bahia et al. [38] on the new ecological paradigm scale (NEP scale), involving five measuring aspects, viz., the balance of nature, ecological crisis, rejection of exemptionalism, limits to growth, and anti-anthropocentrism (questions 1–3 were evaluated using five-point Likert scales); (4) Two-choice questions about willingness-to-pay, to investigate whether respondents are willing to pay a higher price for hydrogen-electric motorcycles compared to the traditional ones. If they answered yes, they were asked about the amount of extra money (in percentage) they will spend, to determine their acceptance degree; (5) Basic information on respondents, including socio-economic variables and demographic variables such as gender, marital status, age, education degree, and monthly disposable income, were obtained to further understand the characteristics of the respondents.
In order to ensure the content validity of the research scales, three experts were invited to test the appropriateness of the questions and survey content. A questionnaire pretest was conducted in August 2017, after the narrative pattern of twelve questions was modified. A total of 100 pretesting questionnaires were distributed, with 62 effective ones being collected. In this study, reliability and construct validity were used to inspect the resolving ability and internal consistency of the research scales. The reliability test results of the questionnaire scales show that the Cronbach’s α-value of the summary scale for perception barriers is 0.850, indicative of high reliability. Cronbach’s α of the sub-scales for usage barrier, value barrier, risk barrier, tradition barrier, image barrier, and price barrier are 0.783, 0.727, 0.892, 0.716, 0.790, and 0.798, respectively. Cronbach’s α of the innovation resistance scale is 0.759. Cronbach’s α of the environmental concern scale is 0.893. Therefore, the reliabilities of various variables and aspects of research remain within an acceptable range. Respondents of this survey mainly comprised consumers in the five metropolitan areas of Taiwan, viz., Taipei, New Taipei, Taichung, and Tainan. A total of 400 questionnaires was distributed, with 307 being successfully collected. After the elimination of 75 questionnaires with missing answers, 232 questionnaires were considered effective, achieving an effective questionnaire response rate of 58%.
3. Results
3.1. Specimen Structure Description
For the statistical analysis results of the respondent’s socio-economic characteristics, with regard to gender, male and female respondents accounted for 52.2% and 47.8%, respectively. In terms of marital status, married and single people accounted for 57.8% and 42.2%, respectively. In terms of age, people between 31 and 40 years of age accounted for the highest percentage (45.8%), while those between 21 and 30 accounted for the second highest (28.6%). In terms of education level, people with high school education accounted for the highest percentage (34.5%), followed by those with college (28.9%) and graduate-level education (14.7%). In terms of monthly disposable income, respondents with income in the range of 10,000–30,000 TWD constituted the highest percentage (40.1%), followed by those with income below 10,000 TWD (20.7%), those with income in the range of 30,000–50,000 TWD (16.8%), and those with income in the range of 50,000–70,000 TWD (10.3%). In terms of survey district, people from various districts accounted for varying percentages, in the following order: New Taipei (25%), Taipei (21.1%), Kaohsiung (19.8%), and Tainan (16.8%).
As shown in the survey of respondents expecting government subsidy for the promotion of hydrogen-electric motorcycles, 233 respondents (accounting for 96.12% of all the respondents) indicated that the promotion of hydrogen-electric motorcycles requires government subsidies. Among the 223 respondents, people expecting a government subsidy of >30%, 26–30%, 21–25%, 11–15%, 16–20%, 6–10%, and 1–5% constituted 48.7%, 17.83%, 14.35%, 7.83%, 6.96%, 3.04%, and 1.30%, respectively. Only nine respondents (3.88% of all the respondents) believed that the promotion of hydrogen-electric motorcycles requires no subsidy from the government. Male and female respondents who stated the necessity of government subsidy constituted 50.00% and 46.12% of the total number of respondents, respectively. Male and female respondents who stated that government subsidy is unnecessary constituted 2.16% and 1.72% of the total number of respondents, respectively. The percentage of subsidy for the purchase of hydrogen-electric motorcycles proposed by male and female respondents was 28.14% and 29.11%, respectively. The overall mean value was 28.64%.
In terms of the respondents’ WTP for hydrogen-electric motorcycles, the average extra price that they would pay is 10.67% of the regular price. The WTP of the male respondents was higher than that of the females. Respondents between 31 and 40 years of age showed the highest WTP, whereas those under 20 showed the lowest. WTP of married individuals was higher than that of the single ones. The higher the education level, the higher the WTP. The higher the monthly disposable income, the higher the WTP.
3.2. Independent Sample t-Test
In this study, independent sample t-test was adopted to evaluate the significance of correlations between various perception barriers (including usage barrier, value barrier, risk barrier, tradition barrier, image barrier, and price barrier), innovation resistance, environmental concern, and WTP by using the variables of gender and marital status.
3.2.1. Impact of Gender on Various Aspects
Results indicate that the risk barrier for the two genderes demonstrates a significant difference (t = 2.316, p < 0.05). The mean risk barrier perceived by male respondents (M = 4.03) is obviously higher than that of the female respondents (M = 3.95). Respondents of the two genderes exhibit a price barrier value with a significant difference (t = 2.628, p < 0.01). The mean price barrier perceived by male respondents (M = 4.07) was dramatically higher than that of females (M = 4.06). Respondents of different genderes exhibited an innovation resistance value with a significant difference (t = 3.368, p < 0.01). The mean innovation resistance perceived by males (M = 3.85) was dramatically higher than that of females (M = 3.80). The rest of the data showed no significant difference.
3.2.2. Impact of Marital Status on Various Aspects
As presented in the research results, the environmental concern values of respondents with different marital status were significantly different (t = 1.975, p < 0.05). The mean environmental concern perceived by married people (M = 4.45) was dramatically higher than that of single people (M = 4.23). The rest of the data showed no significant difference.
3.3. One-Way Analysis of Variance
In this study, one-way analysis of variance (one-way ANOVA) was used to determine whether there are statistically significant relationships between perception barriers (usage barrier, value barrier, risk barrier, tradition barrier, image barrier, and price barrier), innovation resistance, environmental concern, and WTP by using the variables of education level, age, and monthly disposable income.
3.3.1. Impact of Education Level on Various Aspects
Results indicate that different education levels show significant differences in barrier perception, innovation resistance perception, environmental concern perception, and WTP perception (usage barrier perception, F = 2.952, p = 0.024 < 0.05; innovation resistance perception, F = 3.156, p = 0.002 < 0.01; environmental concern perception, F = 4.262, p = 0.001 < 0.01; WTP perception, F = 4.327, p = 0.001 < 0.01).
3.3.2. Impact of Age on Various Aspects
Results indicate that different age groups showed significant differences in risk barrier perception, tradition barrier perception, price barrier perception, innovation resistance perception, and environmental concern perception (risk barrier perception, F = 3.92, p = 0.002 < 0.01; tradition barrier perception, F = 6.651, p = 0.000 < 0.01; price barrier perception, F = 4.527, p = 0.001 < 0.01; innovation resistance perception, F = 9.528, p = 0.000 < 0.01; environmental concern perception, F = 2.998, p = 0.002 < 0.05). The rest of the data showed no significant difference.
3.3.3. Impact of Monthly Disposable Income on Various Aspects
As demonstrated in the research results, different monthly disposable incomes showed significant differences with regard to usage barrier perception, risk barrier perception, tradition barrier perception, image barrier perception, innovation resistance perception, environmental concern perception, and WTP perception (usage barrier perception, F = 6.593, p = 0.000 < 0.01; risk barrier perception, F = 2.684, p = 0.046 < 0.05; tradition barrier perception, F = 5.551, p = 0.033 < 0.05; image barrier perception, F = 5.385, p = 0.001 < 0.01; innovation resistance perception, F = 17.781, p = 0.000 < 0.01; environmental concern perception, F = 5.863, p = 0.001 < 0.01; WTP perception, F = 8.563, p = 0.000 < 0.01). The rest of the data showed no significant difference.
3.4. Multiple Regression Analysis
In this study, multiple regression analyses were conducted between various variables and innovation resistance. It was observed from the results of the initial multiple regression analysis that the balance of nature and limits to growth showed no significance. Therefore, a second multiple regression analysis was conducted subsequent to the elimination of these two independent variables. The analytical results are shown in Table 1. The constant (t = 3.559, p = 0.000), perception barriers (t = 27.447, p = 0.000), ecological crisis (t = 3.705, p = 0.000), rejection of exemptionalism (t = 4.076, p = 0.000), and anti-anthropocentrism (t = 3.217, p = 0.000) present some significance with regard to innovation resistance. The variance inflation factor (VIF) of collinearity statistics for the independent variables after the elimination of the constant was 1.058, 2.255, 2.128, and 2.146, respectively, being consistently lower than 10. Hence, it can be determined that the multiple regression model of this study involves no multicollinearity. Durbin-Watson = 1.851, which demonstrates that the errors of the independent variables are mutually independent.
The unstandardized coefficients were 0.812, 0.108, 0.139, and 0.093. Standardized β coefficients were 0.753, 0.148, 0.159, and 0.126 after the elimination of the constant. Therefore, it can be determined from these coefficients of the multiple regression model that perception barriers, ecological crisis, rejection of exemptionalism, and anti-anthropocentrism are positively correlated to innovation resistance due to the positive value of their coefficients. This means the higher the barriers mentioned above, the higher the innovation resistance. Moreover, according to the multiple regression analysis statistics, unstandardized and standardized multiple regression equations of innovation resistance to hydrogen-electric motorcycles can be obtained as shown below.
1. Unstandardized multiple regression equation
Innovation resistance = 5.45 + 0.812 × Perception barriers + 0.108 × Ecological crisis + 0.139 × Rejection of exemptionalism + 0.093 × Anti-anthropocentrism
2. Standardized multiple regression equation
Innovation resistance = 0.753 × Perception barriers + 0.148 × Ecological crisis + 0.159 × Rejection of exemptionalism + 0.126 × Anti-anthropocentrism
Based on R2 = 0.839, it can be determined that the multiple regression equations derived in this study have 83.9% explanatory and predictive power with regard the innovation resistance to hydrogen-electric motorcycles.
It can be seen from the multiple regression analysis between the two independent variables, i.e., respondents’ expectation of government subsidy (a certain percentage of the vehicle price) for hydrogen-electric motorcycles and their WTP, and the dependent variable of innovation resistance, that both price subsidy percentage and the consumers’ WTP, have a negative adjustment on innovation resistance, showing some significance, as illustrated in Table 2. The constant (t = 31.078, p = 0.000), WTP (t = −8.131, p = 0.000), and subsidy percentage (t = −9.263, p = 0.000) have some significance. VIF of collinearity statistics for the independent variables after the elimination of the constant are 1.060 and 1.060, which are lower than 10. Hence, it can be determined that the multiple regression model involves no multicollinearity. Durbin-Watson = 1.455, which demonstrates that the errors of the independent variables are mutually independent. Based on R2 = 0.709, it can be determined that the multiple regression equations describing the relationship between WTP, subsidy percentage, and innovation resistance to hydrogen-electric motorcycles have 83.9% explanatory and predictive power.
A summary can be drawn based on the statistical analysis results described above, as shown in Table 3. Usage barrier has significant differences in terms of education level and disposable income. Value barrier showed no significant difference in terms of demographic variables. Risk barrier exhibited significant differences in terms of gender, age, and disposable income. Tradition barrier showed significant differences in terms of age and disposable income. Image barrier showed significant differences in terms of disposable income. Price barrier presented significant differences in terms of gender and age. Environmental concern showed significant differences in terms of marital status, education level, age, and disposable income. WTP showed significant differences in terms of education level and disposable income. Innovation resistance showed significant differences in terms of gender, education level, age, and disposable income. Moreover, perception barriers, including usage barrier, value barrier, risk barrier, tradition barrier, and price barrier, are obviously correlated to environmental concern and innovation resistance to hydrogen-electric motorcycles, with some predictive power. The consumers’ environmental concern, value barrier, government subsidy percentage, and WTP showed negative adjusting power on the innovation resistance to hydrogen-electric motorcycles.
4. Discussion
A summary of the verification of the hypotheses made in this study is shown in Table 4. A detailed analysis is provided below. Our results show that the usage, value, risk, tradition, and price barriers are statistically significant, whereas image barrier is not.
4.1. Positive Impact of Usage Barrier on Innovation Resistance
The respondents expressed concern regarding the range of the hydrogen-electric motorcycles. However, the power system of hydrogen-electric motorcycles primarily relies on the traditional internal combustion engine, with the electric motor as the supplemental power. Even when the fuel cell is not able to supply power to the electric motor, the engine continues to work, preventing range issues. Therefore, due to this perceived discrepancy, the greater the usage barrier, the stronger the innovation resistance, indicating a significantly positive relationship.
4.2. Negative Impact of Value Barrier on Innovation Resistance
Due to the product value of hydrogen-electric motorcycles in terms of energy conservation and emission reduction, respondents commonly believed that this type of purchase is not a waste of money, suggesting a negative adjusting function for innovation resistance. More specifically, the higher the consumer-perceived value of the product in energy-saving and emission reduction, the lower the innovation resistance.
4.3. Positive Impact of Risk Barrier on Innovation Resistance
Respondents perceived a remarkable risk barrier with regard to hydrogen-electric motorcycles. In particular, concerns were expressed regarding the competence/experience of regular auto repair shops in case of motorcycle malfunction, as well as battery lifespan. Other risks mentioned by the respondents included safety, product quality, and potentially frequent repairs. This suggests that the respondents experienced a significant risk barrier in terms of actual product quality and safety, which has a positive impact on the innovation resistance to the hydrogen-electric motorcycles. This means the higher the perceived risks, the stronger the innovation resistance.
4.4. Positive Impact of Tradition Barrier on Innovation Resistance
Most respondents have the negative impression that hydrogen-electric motorcycles cannot replace traditional motorcycles and that someone purchasing a hydrogen-electric motorcycle would be considered a guinea pig. Regardless of the awareness regarding high electricity rates and environmental protection, there exists an inertia with regard to the consumers’ long-lasting habits of using traditional motorcycles, making it difficult for them to change their traditional belief. More specifically, the stronger the perceived tradition, the stronger the innovation resistance.
4.5. Nonsignificant Effect of Image Barrier on Innovation Resistance
Results show that image barrier has no significant impact on innovation resistance, mainly because the respondents have a positive impression of hydrogen-electric motorcycles, as they can ensure a better planet for the future generations, help reduce carbon emissions, and establish the image of personal environmental care for individual consumers. Therefore, the perceived image of the hydrogen-electric motorcycles has no significant impact on innovation resistance.
4.6. Positive Impact of Price Barrier on Innovation Resistance
Most respondents believed that the prices of the hydrogen-electric motorcycles are excessively high and that more promotion activities should be conducted, indicating a general price barrier that has a positive impact on innovation resistance. In other words, the higher the perceived price, the stronger the innovation resistance to hydrogen-electric motorcycles.
4.7. Negative Regulating Effect of Environmental Concern on Innovation Resistance
Generally, consumers with high environmental consciousness are willing to pay a relatively high price for green products and try environment-friendly innovative products or services. Erdem et al. [44] discovered that consumers paying significant attention to global warming are willing to pay a relatively high price for hybrid vehicles. We can see from the results of this study that the respondents’ environmental concern has a negative regulating effect on innovation resistance to hydrogen-electric motorcycles. A higher perception of the respondents’ environmental concern could reduce the innovation resistance to hydrogen-electric motorcycles more significantly.
In this study, analysis was conducted from the perspectives of perception barriers, environmental concern, and innovation resistance to hydrogen-electric motorcycles. On this basis, characteristics and impacts of various aspects were explored using demographic variables. Results of the statistical analysis are shown below.
4.8. Relationship between Demographic Variables and Perception Barriers
Gender has a significant impact on risk barrier and price barrier, among the perception barriers. The perceptual sensitivity of male respondents to the implicit differences in the risk and price of hydrogen-electric motorcycles was higher than that of the females. Marital status has no significant impact on perception barriers. Education level has some significance with regard to usage barrier. The usage barrier perceived by graduates was clearly higher than that by postgraduates. Therefore, it is known that a higher education level will result in lower usage barrier. Age shows some significance with respect to risk barrier, tradition barrier, and price barrier. Respondents between 21 and 30 years of age showed a relatively high value of risk barrier, tradition barrier, and price barrier. Monthly disposable income has some significance with regard to usage barrier, tradition barrier, and image barrier. Respondents with an income of 10–30 thousand and 30–50 thousand have a relatively high usage barrier, risk barrier, tradition barrier, and image barrier.
4.9. Relationship between Demographic Variables and Environmental Concern
Gender showed no significant difference in terms of environmental concern, whereas marital status, education level, age, and monthly disposable income did. Environmental concern among married people was higher than that among single people. High education levels correspond to high environmental concern values. Respondents between 31 and 40 years of age showed the strongest environmental concern, which was remarkably higher than that of respondents between 41 and 50. The higher the monthly disposable income, the stronger the environmental concern. Results of this study indicate that individuals with a high level of environmental concern generally demonstrate characteristics of high education level and high income, with most of them being between 31 and 40 years of age.
4.10. Relationship between Demographic Variables and Innovation Resistance
Marital status has no significance with regard to innovation resistance, whereas gender, education level, age, and monthly disposable income do. Innovation resistance to hydrogen-electric motorcycles among male respondents was higher than that of females. Respondents with a higher education level showed a lower level of innovation resistance. A higher age level presents lower innovation resistance. A higher monthly disposable income contributes to lower innovation resistance. However, individuals with a high education level and high income are more likely to accept the hydrogen-electric motorcycles, considering the high returns, i.e., a high image value with regard to energy conservation and emission reduction, exhibiting a lower innovation resistance to the innovative motorcycles. Among these individuals, female respondents showed lower innovation resistance than males.
4.11. Respondents’ Expectation of Government Subsidy on Hydrogen-Electric Motorcycles and WTP’s Negative Regulating Effect on Innovation Resistance
Results of the research indicate that the percentage of respondents who state the necessity of government subsidy for the promotion of hydrogen-electric motorcycles is up to 94.79%. Moreover, their expectation of the government subsidy is 21.9% of the price. From the perspective of WTP, the respondents’ mean WTP for the purchase of hydrogen-electric motorcycles is 10–15% higher than that of traditional motorcycles.
It can be observed from the analysis of price barrier that respondents generally think that the price of hydrogen-electric motorcycles is excessively high, requiring a reasonable price for consumer acceptance. It is also known from the multiple regression analysis of innovation resistance in terms of government subsidy (a percentage of the motorcycle price) and consumers’ WTP that both government subsidy percentage and consumers’ WTP, have a negative regulating effect on innovation resistance. This means, when respondents perceive that the percentage of price subsidized by the government is high, their innovation resistance to the products will be reduced. However, the higher the WTP, the lower the innovation resistance to the motorcycles.
Overall, in order to implement the environmental protection policies of energy conservation and emission reduction, while accelerating the promotion and popularization of hydrogen-electric motorcycles, the government should offer certain subsidies for people buying the innovative motorcycles. In this way, the consumers’ WTP for the motorcycles could be effectively improved, while reducing the innovation resistance to the motorcycles, thus enhancing the promotion of the motorcycles for energy conservation and emission reduction.
5. Conclusions
5.1. Conclusions
Using the innovation resistance theory proposed by Ram and Sheth [4], the current study observed that the innovation resistance to hydrogen-electric motorcycles features barriers in usage, value, risk, traditional, and price, with price being the most prominent one. Consumers’ environmental concern, product value, government price subsidy percentage, and their WTP influence the degree of innovation resistance. Moreover, according to this theory, simply eliminating the antecedent innovation barriers facing the customers can accelerate the dissemination of the innovation, so that it is accepted and used by customers in a cost-effective and efficient manner.
5.2. Management Implications
Based on our research results, the following suggestions are offered for future marketing and business development strategies of hydrogen-electric motorcycles.
5.2.1. Use of Marketing Promotion Strategies for Eliminating Perception Barriers and Mediating Innovation Resistance
Customer perception barriers are generated due to the difference between the information/function of the innovative products and their previous status/belief. In order to gradually mediate or even eliminate these barriers, conversations with customers must be initially established using marketing tools, to help customers sense and perceive the information to be conveyed, allowing them to change their previous perception. Therefore, marketing of the hydrogen-electric motorcycles has to rely on extensive advertisements to inform the customers of the safety and performance of the products, as well as the reliability and durability of the fuel cell to alleviate the perception barriers on use risk. In the meantime, the high environmental protection value of the products should be emphasized to minimize the degree of customer innovation resistance. We suggest the following: (1) using the experimental marketing strategy, offer a value-pack, short-term lease to attract users to try and experience the product; (2) offer purchase or long-term lease discounts for government departments and environmental protection organizations; (3) engage renowned environmentalists and experts for endorsement or offer them free trials; and (4) proactively participate in activities held by environmental protection organizations. Once a significant number of customers experience and recognize the benefits of hydrogen-electric motorcycles, their tradition barrier can be mediated. In addition, the risk and price barriers can be addressed by providing fuel cell lease service or extending the cell warranty.
5.2.2. Promotion of Economy of Scale to Reduce Production Costs
According to our analysis, customer resistance to hydrogen-electric motorcycles mostly stems from price barrier. The most significant barriers are related to costs of consumption in this study. Due to the high-end technologies involved and the additional costs of fuel cells, the production costs of hydrogen-electric motorcycles are relatively high. Thus, it could help reduce customers’ concerns if there is a reduction in manufacturing costs. Lowering the production costs might be possible if economy of scale can be achieved through part standardization, upstream–downstream supply chain integration, and industrial alliance. Consequently, companies in this industry can use more reasonable pricing strategies to strengthen the market scale and the degree of customer acceptance. The results in this study show that consumers are willing to pay an extra 10–15% compared to the price of traditional motorcycles for a hydrogen-electric counterpart. Consistent with prior studies, most consumers are willing to make the switch to electric vehicle which could reduce energy costs, or even be willing to pay a higher cost for the vehicle [45]. This is in line with the global trend to adopt a zero-emission vehicle such as hydrogen-powered scooters. The above results could provide a pricing and promotion reference for the industry. This study has limitations concerning the scope and boundaries such as urban–rural differences of participants’ residences. For those who live in the countryside, they may have more barriers on innovation resistance of hydrogen-electric motorcycles because of longer distances than the residents of the city. Future researchers may wish to include a wider scope of the residence of participants.
Author Contributions
Three co-authors had together contributed to the completion of this article. H.-S.C. analyzed the data and drafted the manuscript; Bi-Kun Tsai had reviewed the manuscript and revised the results and conclusions; and C.-M.H. acted as corresponding author on their behalf throughout the revision and submission process.
Acknowledgments
Financial support for this work was provided by the Ministry of Science and Technology (Republic of China, Taiwan; grant number: NSC 101-3113-P-006-019). This funding source had no role in the study design; the collection, analysis, and interpretation of data; the writing of the report; or the decision to submit the article for publication.
Conflicts of Interest
The authors declare no conflict of interest.
References
- Motc.gov.tw. Statistical Data from the Ministry of Transportation and Communications R.O.C.; c2000-01. Available online: http://www.motc.gov.tw/ (accessed on 30 January 2018).
- Chen, H.-S.; Tsai, B.-K.; Hsieh, C.-M. Determinants of Consumers’ Purchasing Intentions for the Hydrogen-Electric Motorcycle. Sustainability 2017, 9, 1447. [Google Scholar] [CrossRef]
- Council for Economic Planning and Development, Taiwan; c2000-01. Available online: http://www.cepd.gov.tw/ (accessed on 16 December 2015).
- Ram, S.; Sheth, J.N. Consumer resistance to innovations: The marketing problem and its solutions. J. Consum. Mark. 1989, 6, 5–14. [Google Scholar] [CrossRef]
- Claudy, M.C.; Garcia, R.; O’Driscoll, A. Consumer resistance to innovation—A behavioral reasoning perspective. J. Acad. Mark. Sci. 2015, 43, 528–544. [Google Scholar] [CrossRef]
- Lian, J.W.; Yen, D.C. To buy or not to buy experience goods online: Perspective of innovation adoption barriers. Comput. Hum. Behav. 2013, 29, 665–672. [Google Scholar] [CrossRef]
- Heidenreich, S.; Handrich, M. What about Passive Innovation Resistance? Investigating Adoption-Related Behavior from a Resistance Perspective. J. Prod. Innov. Manag. 2015, 32, 878–903. [Google Scholar] [CrossRef]
- Heidenreich, S.; Kraemer, T. Passive innovation resistance: The curse of innovation? Investigating consequences for innovative consumer behavior. J. Econ. Psychol. 2015, 51, 134–151. [Google Scholar] [CrossRef]
- Kowalska-Pyzalska, A. What makes consumers adopt to innovative energy services in the energy market? A review of incentives and barriers. Renew. Sustain. Energy Rev. 2017, 82 Pt 3, 3570–3581. [Google Scholar] [CrossRef]
- Im, S.; Mason, C.H.; Houston, M.B. Does innate consumer innovativeness related to new product/service adoption behavior? The intervening role of social learning via vicarious innovativeness. J. Acad. Mark. Sci. 2007, 35, 63–75. [Google Scholar] [CrossRef]
- Heidenreich, S.; Spieth, P. Why innovations fail—The case of passive and active innovation resistance. Int. J. Innov. Manag. 2013, 17, 1350021. [Google Scholar] [CrossRef]
- Tellis, G.J.; Yin, E.; Bell, S. Global consumer innovativeness: Cross-country differences and demographic commonalities. J. Int. Mark. 2009, 17, 1–22. [Google Scholar] [CrossRef]
- Chao, C.W.; Reid, M.; Mavondo, F.T. Consumer innovativeness influence on really new product adoption. Australas. Mark. J. 2012, 20, 211–217. [Google Scholar] [CrossRef]
- Weng, H.H.R.; Chen, J.S.; Chen, P.C. Effects of Green Innovation on Environmental and Corporate Performance: A Stakeholder Perspective. Sustainability 2015, 7, 4997–5026. [Google Scholar] [CrossRef] [Green Version]
- Chen, Y.S.; Chang, T.W.; Lin, C.Y.; Lai, P.Y.; Wang, K.H. The influence of proactive green innovation and reactive green innovation on green product development performance: The mediation role of green creativity. Sustainability 2016, 8, 966. [Google Scholar] [CrossRef]
- Hyysalo, S.; Johnson, M.; Juntunen, J.K. The diffusion of consumer innovation in sustainable energy technologies. J. Clean. Prod. 2017, 162, s70–s82. [Google Scholar] [CrossRef]
- Nieuwenhuijsen, J.; de Almeida Correia, G.H.; Milakis, D.; van Arem, B.; van Daalen, E. Towards a quantitative method to analyze the long-term innovation diffusion of automated vehicles technology using system dynamics. Transp. Res. Part C Emerg. Technol. 2018, 86, 300–327. [Google Scholar] [CrossRef]
- Zhang, G.; Xu, Y.; Zhang, J. Consumer-Oriented Policy towards Diffusion of Electric Vehicles: City-Level Evidence from China. Sustainability 2016, 8, 1343. [Google Scholar] [CrossRef]
- Franceschinis, C.; Thiene, M.; Scarpa, R.; Rose, J.; Moretto, M.; Cavalli, R. Adoption of renewable heating systems: An empirical test of the diffusion of innovation theory. Energy 2017, 125, 313–326. [Google Scholar] [CrossRef] [Green Version]
- Vassileva, I.; Campillo, J. Adoption barriers for electric vehicles: Experiences from early adopters in Sweden. Energy 2017, 120, 632–641. [Google Scholar] [CrossRef]
- Hardman, S.; Shiu, E.; Steinberger-Wilckens, R.; Turrentine, T. Barriers to the adoption of fuel cell vehicles: A qualitative investigation into early adopters attitudes. Transp. Res. Part A Policy Pract. 2017, 95, 166–182. [Google Scholar] [CrossRef]
- Dedehayir, O.; Ortt, R.J.; Riverola, C.; Miralles, F. Innovators and early adopters in the diffusion of innovations: A literature review. Int. J. Innov. Manag. 2017, 21, 1–27. [Google Scholar] [CrossRef]
- Yuriev, A.; Boiral, O.; Francoeur, V.; Paillé, P. Overcoming the barriers to pro-environmental behaviors in the workplace: A systematic review. J. Clean. Prod. 2018, 182, 379–394. [Google Scholar] [CrossRef]
- Prakash, G.; Pathak, P. Intention to buy eco-friendly packaged products among young consumers of India: A study on developing nation. J. Clean. Prod. 2017, 141, 385–393. [Google Scholar] [CrossRef]
- Tung, T.T.Y.; Koenig, H.F.; Chen, H.L. Effects of Green Self-Identity and Cognitive and Affective Involvement on Patronage Intention in Eco-Friendly Apparel Consumption: A Gender Comparison. Sustainability 2017, 9, 1977. [Google Scholar] [CrossRef]
- Junior, S.S.B.; da Silva, D.; Gabriel, M.L.D.; de Oliveira Braga, W.R. The effects of environmental concern on purchase of green products in retail. Procedia-Soc. Behav. Sci. 2015, 170, 99–108. [Google Scholar] [CrossRef]
- Garces-Voisenat, J.P.; Mukherjee, Z. Paying for green energy: The case of the Chilean Patagonia. J. Policy Model. 2016, 38, 397–414. [Google Scholar] [CrossRef]
- Hinnen, G.; Hille, S.L.; Wittmer, A. Willingness to Pay for Green Products in Air Travel: Ready for Take-Off? Bus. Strategy Environ. 2017, 26, 197–208. [Google Scholar] [CrossRef]
- Kirmani, M.D.; Khan, M.N. Decoding willingness of Indian consumers to pay a premium on green products. South Asian J. Bus. Stud. 2018, 7, 73–90. [Google Scholar] [CrossRef]
- Costa, E.; Montemurro, D.; Giuliani, D. Consumers’ willingness to pay for green cars: A discrete choice analysis in Italy. Environ. Dev. Sustain. 2018, 1–18. [Google Scholar] [CrossRef]
- Arega, T.; Tadesse, T. Household willingness to pay for green electricity in urban and peri-urban Tigray, northern Ethiopia: Determinants and welfare effects. Energy Policy 2017, 100, 292–300. [Google Scholar] [CrossRef]
- Newman, T.P.; Fernandes, R. A re-assessment of factors associated with environmental concern and behavior using the 2010 General Social Survey. Environ. Educ. Res. 2016, 22, 153–175. [Google Scholar] [CrossRef]
- Kristensson, P.; Wästlund, E.; Söderlund, M. Influencing consumers to choose environment friendly offerings: Evidence from field experiments. J. Bus. Res. 2017, 76, 89–97. [Google Scholar] [CrossRef]
- Pagiaslis, A.; Krontalis, A.K. Green consumption behavior antecedents: Environmental concern, knowledge, and beliefs. Psychol. Mark. 2014, 31, 335–348. [Google Scholar] [CrossRef]
- Newton, J.D.; Tsarenko, Y.; Ferraro, C.; Sands, S. Environmental concern and environmental purchase intentions: The mediating role of learning strategy. J. Bus. Res. 2015, 68, 1974–1981. [Google Scholar] [CrossRef]
- Arisal, İ.; Atalar, T. Exploring relationships between environmental concern, collectivism and ecological purchase intention. Procedia-Soc. Behav. Sci. 2016, 235, 514–521. [Google Scholar] [CrossRef]
- Shephard, K.; Smith, N.; Deaker, L.; Harraway, J.; Broughton-Ansin, F.; Mann, S. Comparing different measures of affective attributes relating to sustainability. Environ. Educ. Res. 2011, 17, 329–340. [Google Scholar] [CrossRef]
- Fleury-Bahia, G.; Marcouyeux, A.; Renard, E.; Roussiau, N. Factorial structure of the new ecological paradigm scale in two French samples. Environ. Educ. Res. 2015, 21, 821–831. [Google Scholar] [CrossRef] [Green Version]
- Pienaar, E.F.; Lew, D.K.; Wallmo, K. The importance of survey content: Testing for the context dependency of the new ecological paradigm scale. Soc. Sci. Res. 2015, 51, 338–349. [Google Scholar] [CrossRef] [PubMed]
- Yadav, R.; Pathak, G.S. Young consumers’ intention towards buying green products in a developing nation: Extending the theory of planned behavior. J. Clean. Prod. 2016, 135, 732–739. [Google Scholar] [CrossRef]
- Dagsvik, J.K.; Wennemo, T.; Wetterwald, D.G.; Aaberge, R. Potential demand for alternative fuel vehicles. Transp. Res. Part B-Methodol. 2002, 36, 361–384. [Google Scholar] [CrossRef] [Green Version]
- De Haan, P.; Peters, A.; Scholz, R.W. Reducing energy consumption in road transport through hybrid vehicles: Investigation of rebound effects, and possible effects of tax rebates. J. Clean. Prod. 2007, 15, 1076–1084. [Google Scholar] [CrossRef]
- Kleijnen, M.; Lee, N.; Wetzels, M. An exploration of consumer resistance to innovation and its antecedents. J. Econ. Psychol. 2009, 30, 344–357. [Google Scholar] [CrossRef]
- Erdem, C.; Şentürk, İ.; Simsek, T. Identifying the factors affecting the willingness to pay for fuel-efficient vehicles in Turkey: A case of hybrids. Energy Policy 2010, 38, 3038–3043. [Google Scholar] [CrossRef]
- Zhang, X.; Wang, K.; Hao, Y.; Fan, J.; Wei, Y. The impact of government policy on preference for NEVs: The evidence from China. Energy Policy 2013, 61, 382–393. [Google Scholar] [CrossRef]
Figure 1.
Conceptual model. H: hypothesis.


Table 1.
Statistics of multiple regression analysis for various aspects.
| Aspect | Unstandardized Coefficient | Standardized Coefficient | t | Significance | Collinearity Statistics | ||
|---|---|---|---|---|---|---|---|
| Estimated Value of B | Standard Error | Beta Distribution | Allowance | VIF | |||
| (Constant) | 5.450 | 1.126 | 3.559 | 0.000 *** | |||
| Perception barriers | 0.812 | 0.030 | 0.753 | 27.447 | 0.000 *** | 0.945 | 1.058 |
| Ecological crisis | 0.108 | 0.029 | 0.148 | 3.705 | 0.000 *** | 0.443 | 1.255 |
| Rejection of exemptionalism | 0.139 | 0.034 | 0.159 | 4.076 | 0.000 *** | 0.470 | 1.128 |
| Anti-anthropocentrism | 0.093 | 0.029 | 0.126 | 3.217 | 0.001 ** | 0.466 | 1.146 |
| Notes | Dependent variable: innovation resistance; R = 0.916; R2 = 0.839 (explanatory power is 83.9%); After the adjustment, R2 = 0.836; Durbin-Watson = 1.860 (a value within the range of 1.5–2.5 represents mutual independence of various independent variables); VIF of various aspects is always lower than 10 (demonstrating no multicollinearity). | ||||||
** p < 0.01, *** p < 0.001.
Table 2.
Statistics of multiple regression analysis for the relationship between subsidy percentage, WTP, and innovation resistance.
Table 2.
Statistics of multiple regression analysis for the relationship between subsidy percentage, WTP, and innovation resistance.
| Aspect | Unstandardized Coefficient | Standardized Coefficient | t | Significance | Collinearity Statistics | ||
|---|---|---|---|---|---|---|---|
| Estimated Value of B | Standard Error | Beta Distribution | Allowance | VIF | |||
| (Constant) | 24.174 | 0.779 | 31.078 | 0.000 *** | |||
| WTP | −0.097 | 0.012 | −0.363 | −8.131 | 0.000 *** | 0.943 | 1.060 |
| Subsidy percentage | −0.231 | 0.103 | −0.381 | −9.263 | 0.000 *** | 0.943 | 1.060 |
| Notes | Dependent variable: innovation resistance; R = 0.842; R2 = 0.709 (explanatory power is 70.9%); After the adjustment, R2 = 0.704; Durbin-Watson = 1.455 (a value within the range of 1.5–2.5 represents mutual independence of various independent variables); VIF of various aspects is always lower than 10 (demonstrating no multicollinearity). | ||||||
*** p < 0.001.
Table 3.
Summary sheet of statistical analysis results.
| Aspect | Usage Barrier | Value Barrier | Risk Barrier | Tradition Barrier | Image Barrier | Price Barrier | Environmental Concern | WTP | Innovation Resistance |
|---|---|---|---|---|---|---|---|---|---|
| Gender | √ | √ | √ | ||||||
| Marital status | √ | ||||||||
| Education level | √ | √ | √ | √ | |||||
| Age | √ | √ | √ | √ | √ | ||||
| Disposable income | √ | √ | √ | √ | √ | √ | √ | ||
| Government subsidy (%) | √ | ||||||||
| Innovation resistance | √ | √ | √ | √ | √ | √ | √ |
Table 4.
Summary of hypothesis verification.
| Hypothesis | Content | Verification |
|---|---|---|
| H1 | The stronger the perception barrier for the product, the higher the degree of innovation resistance among the respondents. | Accepted |
| H1-a | The stronger the usage barrier for the product, the higher the degree of innovation resistance among the respondents. | Accepted |
| H1-b | The stronger the value barrier for the product, the higher the degree of innovation resistance among the respondents. | Accepted |
| H1-c | The stronger the usage and risk barriers for the product, the higher the degree of innovation resistance among the respondents. | Accepted |
| H1-d | The stronger the tradition barrier for the product, the higher the degree of innovation resistance among the respondents. | Accepted |
| H1-e | The stronger the image barrier for the product, the higher the degree of innovation resistance among the respondents. | Rejected |
| H1-f | The stronger the price barrier for the product, the higher the degree of innovation resistance among the respondents. | Accepted |
| H2 | Environmental concerns regulate the relationship between perception barriers and innovation resistance. This means, the higher the environmental concern, the weaker the positive relationship between the two. | Accepted |
| H3 | Demographic variables adjust the relationship between perception barriers and innovation resistance. | Partly accepted |
| H3-a | Consumer innovation resistance to hydrogen-electric motorcycles differs based on gender. | Accepted |
| H3-b | Consumer innovation resistance to hydrogen-electric motorcycles varies based on age. | Accepted |
| H3-c | Consumer innovation resistance to hydrogen-electric motorcycles varies based on marital status. | Rejected |
| H3-d | Consumer innovation resistance to hydrogen-electric motorcycles varies based on education level. | Accepted |
| H3-e | Consumer innovation resistance to hydrogen-electric motorcycles varies based on monthly disposable income. | Accepted |
© 2018 by the authors. Licensee MDPI, Basel, Switzerland. This article is an open access article distributed under the terms and conditions of the Creative Commons Attribution (CC BY) license (http://creativecommons.org/licenses/by/4.0/).
Share and Cite
MDPI and ACS Style
Chen, H.-S.; Tsai, B.-K.; Hsieh, C.-M. The Effects of Perceived Barriers on Innovation Resistance of Hydrogen-Electric Motorcycles. Sustainability 2018, 10, 1933. https://doi.org/10.3390/su10061933
AMA Style
Chen H-S, Tsai B-K, Hsieh C-M. The Effects of Perceived Barriers on Innovation Resistance of Hydrogen-Electric Motorcycles. Sustainability. 2018; 10(6):1933. https://doi.org/10.3390/su10061933
Chicago/Turabian StyleChen, Han-Shen, Bi-Kun Tsai, and Chi-Ming Hsieh. 2018. "The Effects of Perceived Barriers on Innovation Resistance of Hydrogen-Electric Motorcycles" Sustainability 10, no. 6: 1933. https://doi.org/10.3390/su10061933
Note that from the first issue of 2016, this journal uses article numbers instead of page numbers. See further details here.