Semantic Analysis of Learners’ Emotional Tendencies on Online MOOC Education


Department of Computer Technology, School of Information Engineering, Northeast Electric Power University, Jilin 132000, China
*
Author to whom correspondence should be addressed.
Sustainability 2018, 10(6), 1921; https://doi.org/10.3390/su10061921
Submission received: 2 April 2018
/
Revised: 11 May 2018
/
Accepted: 5 June 2018
/
Published: 8 June 2018
(This article belongs to the Special Issue The Future of Education for Sustainable Development – Between the Power of Technology and the Need for Responsible Citizenship)
Abstract
:As a new education product in the information age, Massive Open Online Courses (MOOCs) command momentous public attention for their unexpected rise and flexible application. However, the striking contrast between the high rate of registration and the low rate of completion has put their development into a bottleneck. In this paper, we present a semantic analysis model (SMA) to track the emotional tendencies of learners in order to analyze the acceptance of the courses based on big data from homework completion, comments, forums and other real-time update information on the MOOC platforms. Through emotional quantification and machine learning calculations, graduation probability can be predicted for different stages of learning in real time. Especially for learners with emotional tendencies, customized instruction could be made in order to improve completion and graduation rates. Furthermore, we classified the learners into four categories according to course participation time series and emotional states. In the experiments, we made a comprehensive evaluation of the students’ overall learning status by kinds of learners and emotional tendencies. Our proposed method can effectively recognize learners’ emotional tendencies by semantic analysis, providing an effective solution for MOOC personalized teaching, which can help achieve education for sustainable development.
1. Introduction
The arrival of Industry 4.0 has brought great changes to society and scientific development, which strongly affect the way people learn, teach, and understand knowledge and education. New technology, such as data mining, machine learning, artificial intelligence, and massive open online courses (MOOCs), are increasingly applied to optimize teaching and learning [1,2,3]. As a mode for digital practice, MOOCs arouse great public concern due to their unexpected rise and great propulsion in education sustainable development [4]. Semantic analysis [5,6,7], one of the most important branches of artificial intelligence (AI), supports more flexible information management and deeper learning behavior mining than that offered by current MOOC platforms. Semantic analysis of courses, video lectures, assignments, students, teachers, etc. builds foundations for more efficient information discovery [8] and learner assessment [9] in MOOC platforms.
In fall 2012, edX, a nonprofit startup from Harvard and the Massachusetts Institute of Technology, had 370,000 students in its first official courses. Coursera, founded in January 2011, has reached more than 1.7 million registrants and is growing “faster than Facebook”, said Andrew Ng, on leave from Stanford University to run his for-profit MOOC provider [4]. A course on artificial intelligence, CS221, at Stanford was offered in fall 2011 for free and online, and attracted 160,000 registered students [10]. In Canada, the digital practice of the MOOC model responds to the “Building Digital Skills for Tomorrow” section of a consultation paper, “Improving Canada’s Digital Advantage: Strategies for Sustainable Prosperity by Synthesizing the Current State of Knowledge”. “MOOCs, or similar open transparent learning experiences that foster the development of citizens confidence engage and create collaboratively, are important for Canada’ s future as a leader in the digital economy”, says Prof. Alexander McAuley [11]. One commentator contends “Nothing has more potential to lift more people out of poverty–by providing them an affordable education to get a job or improve in the job they have. Nothing has more potential to unlock a billion more brains to solve the world’s biggest problems” [12]. “If MOOCs can be developed to the point whereby learners can complete full degrees and gain qualifications it may impact on enrolment at traditional institutions and contribute to a reshaping of the HE (higher education) market in the future”, says educationist Stephen Powell [13]. Furthermore, it helps to achieve personalized education, which is considered to have great potential for promoting sustainable development [5].
Even so, at present, it has not provided sufficient evidence to support its sustainable development capacity. More specifically, learner attrition is the main limiting factor affecting its development [14]. The Introduction to Computer Science course that Harvard University offered in fall 2012 had 150,349 students registered, while only 1388 students actually received diplomas, for a graduation rate of only 0.923% [15]. Circuits and Electronics was offered by MITx in March 2012 and by edX in September 2012. The first run had 154,763 registered participants, of whom 7157 completed the course (4.6%). The later edX delivery had 46,000 enrolments and 3008 completions (6.5%) [15]. The strong contrast between the registration rate and dropout rate raises skepticism of the sustainability of the MOOC education mode. How to improve the graduation rate is a key issue in the sustainable development of this education mode.
For course structure optimization and personalized teaching, it is important to know learners’ opinions about courses. Mining learner sentiment [16] could be a critical dimension of educational data mining to inform educators about how learners learn over time. Furthermore, sentiment analysis [17] can be used to capture most learners who are likely to drop out in the near future and take necessary actions specific to those learners to prevent them from dropping out.
As is well known, different sentiments often represent different mental states. As such, it is possible that learners will show sentiments in discussions and comments when attending MOOCs. Wen et al. [18] reported that learners who always have positive comments have a lower risk of dropping out of the course, and there is a significant correlation between sentiment change and the number of students who drop from MOOCs on a daily basis. Therefore, detecting learners’ emotional tendencies can provide an effective solution for predicting their likelihood of graduating. On this basis, there can be effective intervention during critical periods of emotional volatility so as to reduce dropout risk.
Although text data can directly reflect an individual’s subjective emotions, the difficulty of natural language processing makes it difficult to carry out the work. Recent advances in education show that methods of text processing [19,20] are becoming increasingly important to sentiment analysis, such as on Facebook, MOOCs, and other social networks. A lot of surveys [17,18] and reports show that the emotional tendencies of learners tend to be reflected in their comments. Sentiment polarity analysis, one of the most important natural language processing techniques, is widely used in sentiment analysis at present.
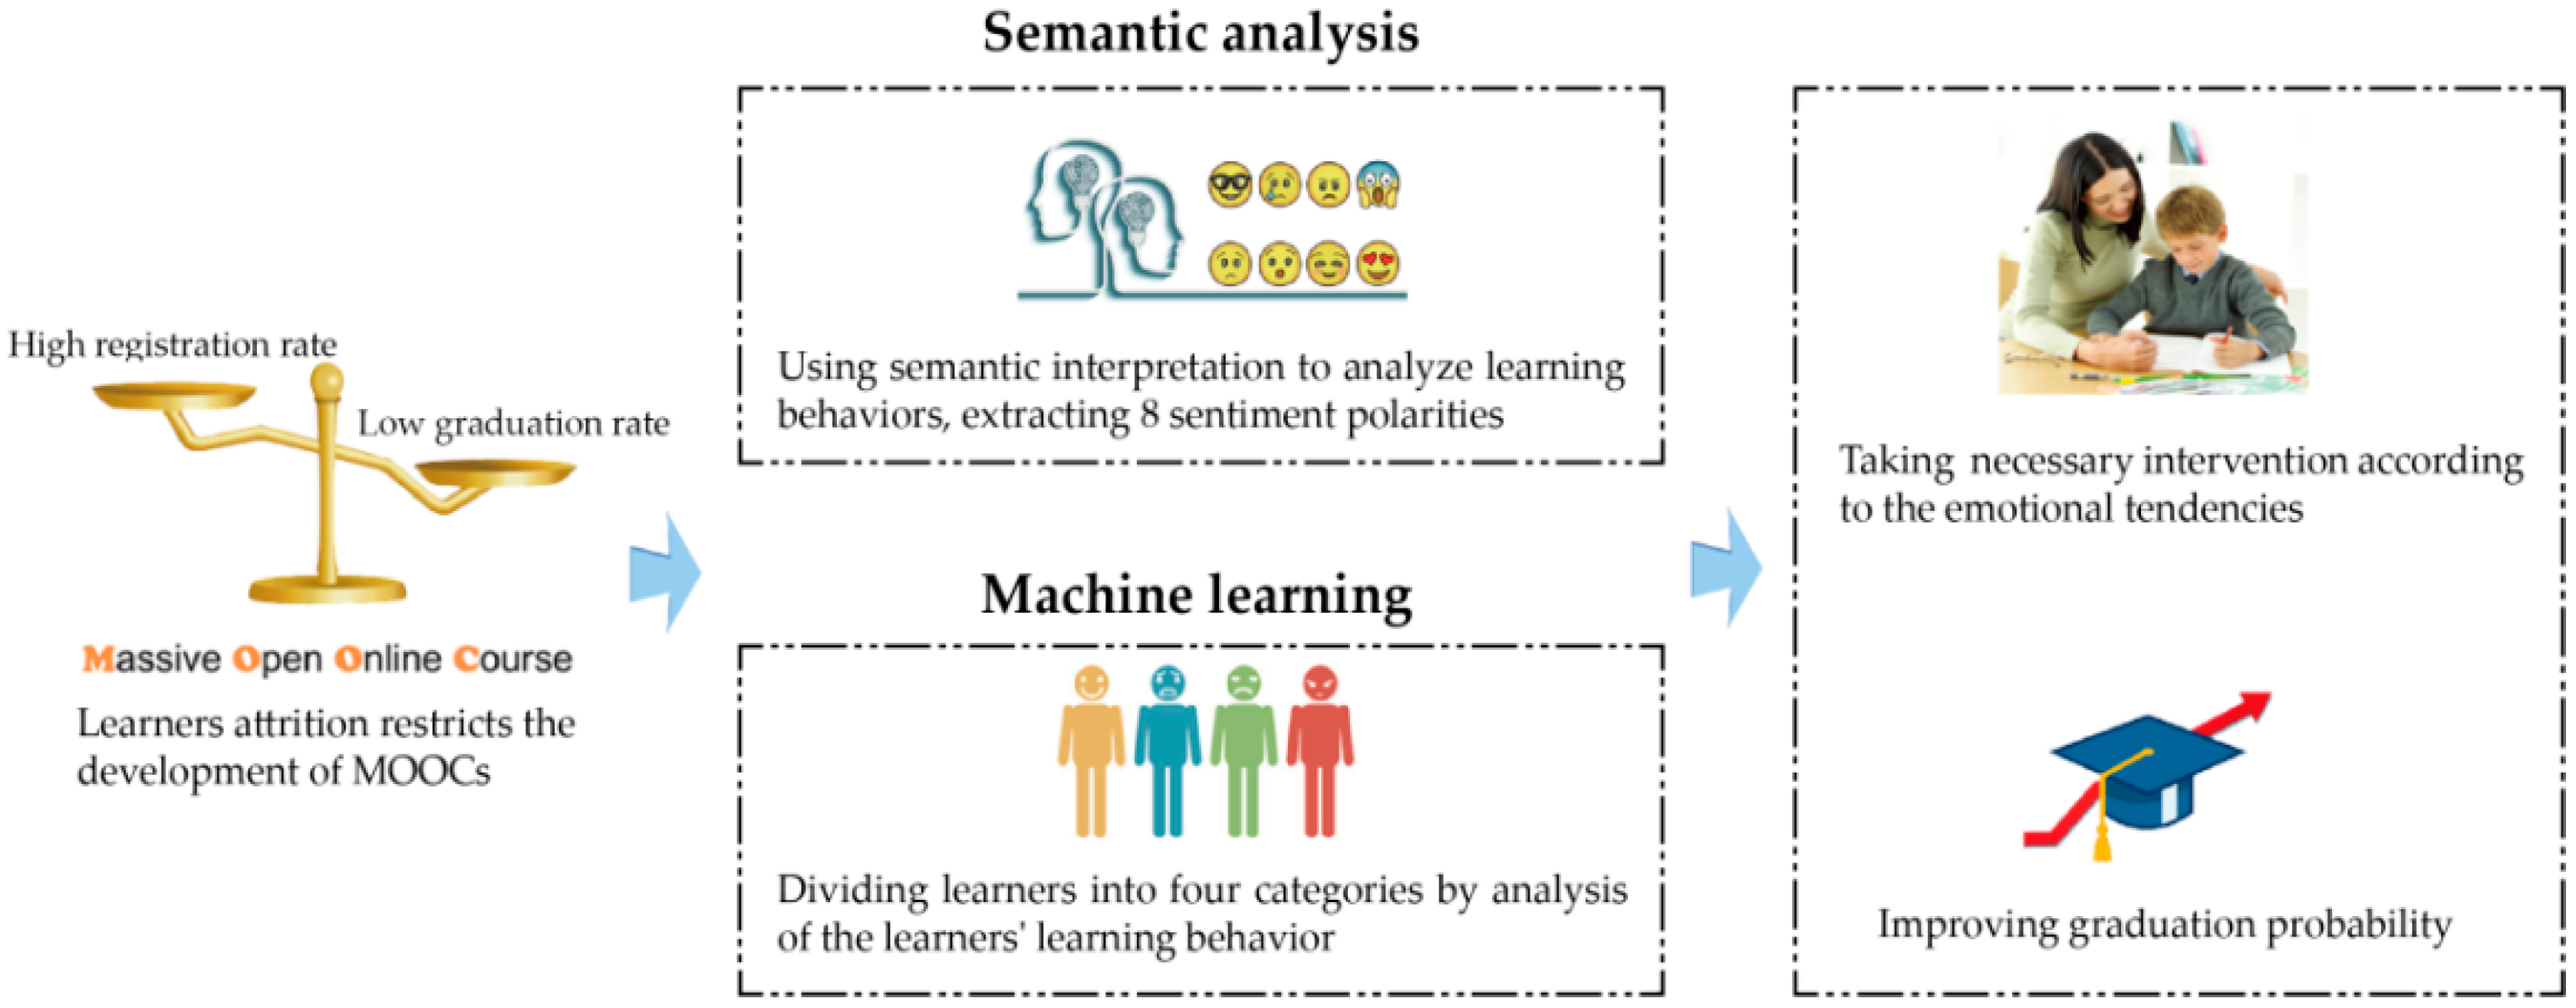
Therefore, we propose a semantic analysis model to analyze learners’ emotional tendencies and explore the differences among learners with different learning behaviors and provide a method to predict graduation probability at different times for each learner. By monitoring emotional volatility, there can be effective intervention when graduation probability is significantly reduced, which can help to improve the graduation rate of MOOCs, as shown in Figure 1.
Contributions
- We propose a semantic analysis model (SMA) to detect learners’ multipolarity sentiments, which is more conducive to monitoring emotional fluctuations to analyze the general rules of sentiment change.
- According to the characteristics of learning behaviors in MOOCs, we divided the learners into four categories and investigated the relationship between their emotional tendencies and learning effect.
- To address the problem of low graduation rates, we propose a method that can predict graduation probability in real time by analyzing learners’ sentiment changes, which can help to increase graduation probability by taking necessary interventions.
- Our experiment proves that detection of learners’ sentiment changes can predict graduation probability in real time.
2. Related Work
“Education can, and must, contribute to a new vision of sustainable global development”, the United Nations Educational, Scientific, and Cultural Organization (UNESCO) declared in 2015 [21]. In order to create a more sustainable world, change-makers of sustainable development need knowledge, skills, attitudes, and values so that they can contribute to sustainable development. Therefore, education for sustainable development (ESD) is essential for global sustainable development. However, not all kinds of education support sustainable development that is why higher education institutions have been experimenting with new teaching modes [22,23,24,25] in recent years. The traditional “infusion teaching” mode does not fully consider the individual differences of learners, making it difficult for learners with different abilities to exert their own advantages, which affects the sustainable development of traditional education [26].
With the wide application of new technology, humans’ living habits, ways of thinking, and values gradually change, strongly impacting traditional higher education. The emergence of new technology enables students to learn a lot of knowledge outside the classroom. MOOCs provide a platform for personalized learning, which enables learners to select courses according to their interests and needs [27,28]. However, further studies found that many learners were out of the courses after two weeks, making graduation rates much lower than those of higher learning institutions [29,30].
Many surveys and reports have investigated why learners dropped out or failed [31]. The results of the surveys show that the most significant factors causing the high attrition rate are lack of time, lack of motivation, feelings of isolation, lack of interactivity, and insufficient background or skills. While MOOCs provide selective learning opportunities, this is not enough to achieve targeted guidance.
Investigation teams at Duke University found that the correlation between learning behavior and eventual graduation rate is very high, and learners can be divided into four categories according to different learning behaviors or habits [32] (list in Table 1). The research concludes that learners have different learning behaviors because of different learning environments, abilities or conditions.
With the introduction of natural language processing technology, some scholars want to deeply analyze the learning behavior of MOOC learners by sentiment analysis. There are currently three kinds of methods in sentiment polarity analysis: statistical methods, knowledge-based approaches, and hybrid methods.
Statistical methods commonly extract latent semantic information by using machine learning, such as support vector machine (SVM) [33], “bag-of-words” [34] and semantic orientation-pointwise mutual information [35].
Knowledge-based approaches detect categories of text based on the presence of unambiguous sentiment polarity words. Hoy [36] not only listed obvious emotional words, but also assigned each word with an “affinity” to a particular emotion. Gordon et al. [37] detected the holder of a sentiment (i.e., the person who maintains the emotional state).
Hybrid methods use both machine learning and semantic network to analyze the semantics of a statement. Wilson et al. [38] analyzed the sentiment polarity of different emotional words in different contexts by fusion algorithm. Veletsianos et al. [39] used tree traversal rules to syntactically parse tree to extract the topicality of sentiment in an open domain setting.
In recent years, some open source software tools [40,41,42,43,44,45] have been developed to automate sentiment analysis of collections of texts, including web pages, Internet discussion groups, blogs, and social media. Dr. Christopher Healey [46] built one of the most robust and highly functional free tools for Twitter sentiment analysis, the Tweet Visualizer. It addresses the temporal relations task consisting of four related subtasks, and takes a supervised machine-learning technique using Markov logic in combination with rich lexical relations beyond basic and syntactic features. Stanford’s CoreNLP [47] integrates many tools for natural language processing in a cohesive library. CoreNLP provides a part-of-speech tagger, a named entity recognizer, a parser, sentiment analysis, and bootstrapped pattern learning tools.
However, analyses of the emotional tendencies of learners are usually coarse-grained at present, and the effect of sentiment change on graduation rate has not been analyzed in depth [48]. Therefore, it is necessary to propose a more fine-grained semantic analysis model to analyze sentiments expressed by learners in forums of courses. It is helpful to understand the relationship between emotion and graduation rate, so as to take personalized instructional interventions based on sentiment analysis results.
3. Motivation
MOOCs attract a large number of learners, but the dropout rate is high, up to 90% [14,15]. By analyzing learning behavior, we find that learners are in a state of spontaneous learning, which lacks specific guidance. Learners are more prone to negative emotions when they encounter difficulties in learning, which leads them to lose interest in the course. This tends to lead to absenteeism or withdrawal, which results in a high dropout rate. In order to further investigate the influence of learning emotion on learning effect, this paper divides learners into four categories according to the characteristics of learning behaviors, and does a statistical analysis of their learning effect.
For example, learners originally select some courses based on interest, but they gradually lose interest and enthusiasm due to their weak learning base and misunderstanding of basic concepts. The multiple negative emotions generated during the learning process affect the full learning of the course, which ultimately leads them to leave the course. This paper proposes a method to predict graduation probability by monitoring emotional volatility and to detect the periods when graduation probability significantly declines. Based on our method, necessary personalized instructional interventions (e.g., recommending basic courses or illustrating relevant concepts through examples) can be made at critical periods so as to stimulate interest in studying, thus achieving the purpose of effective teaching and reducing the dropout rate.
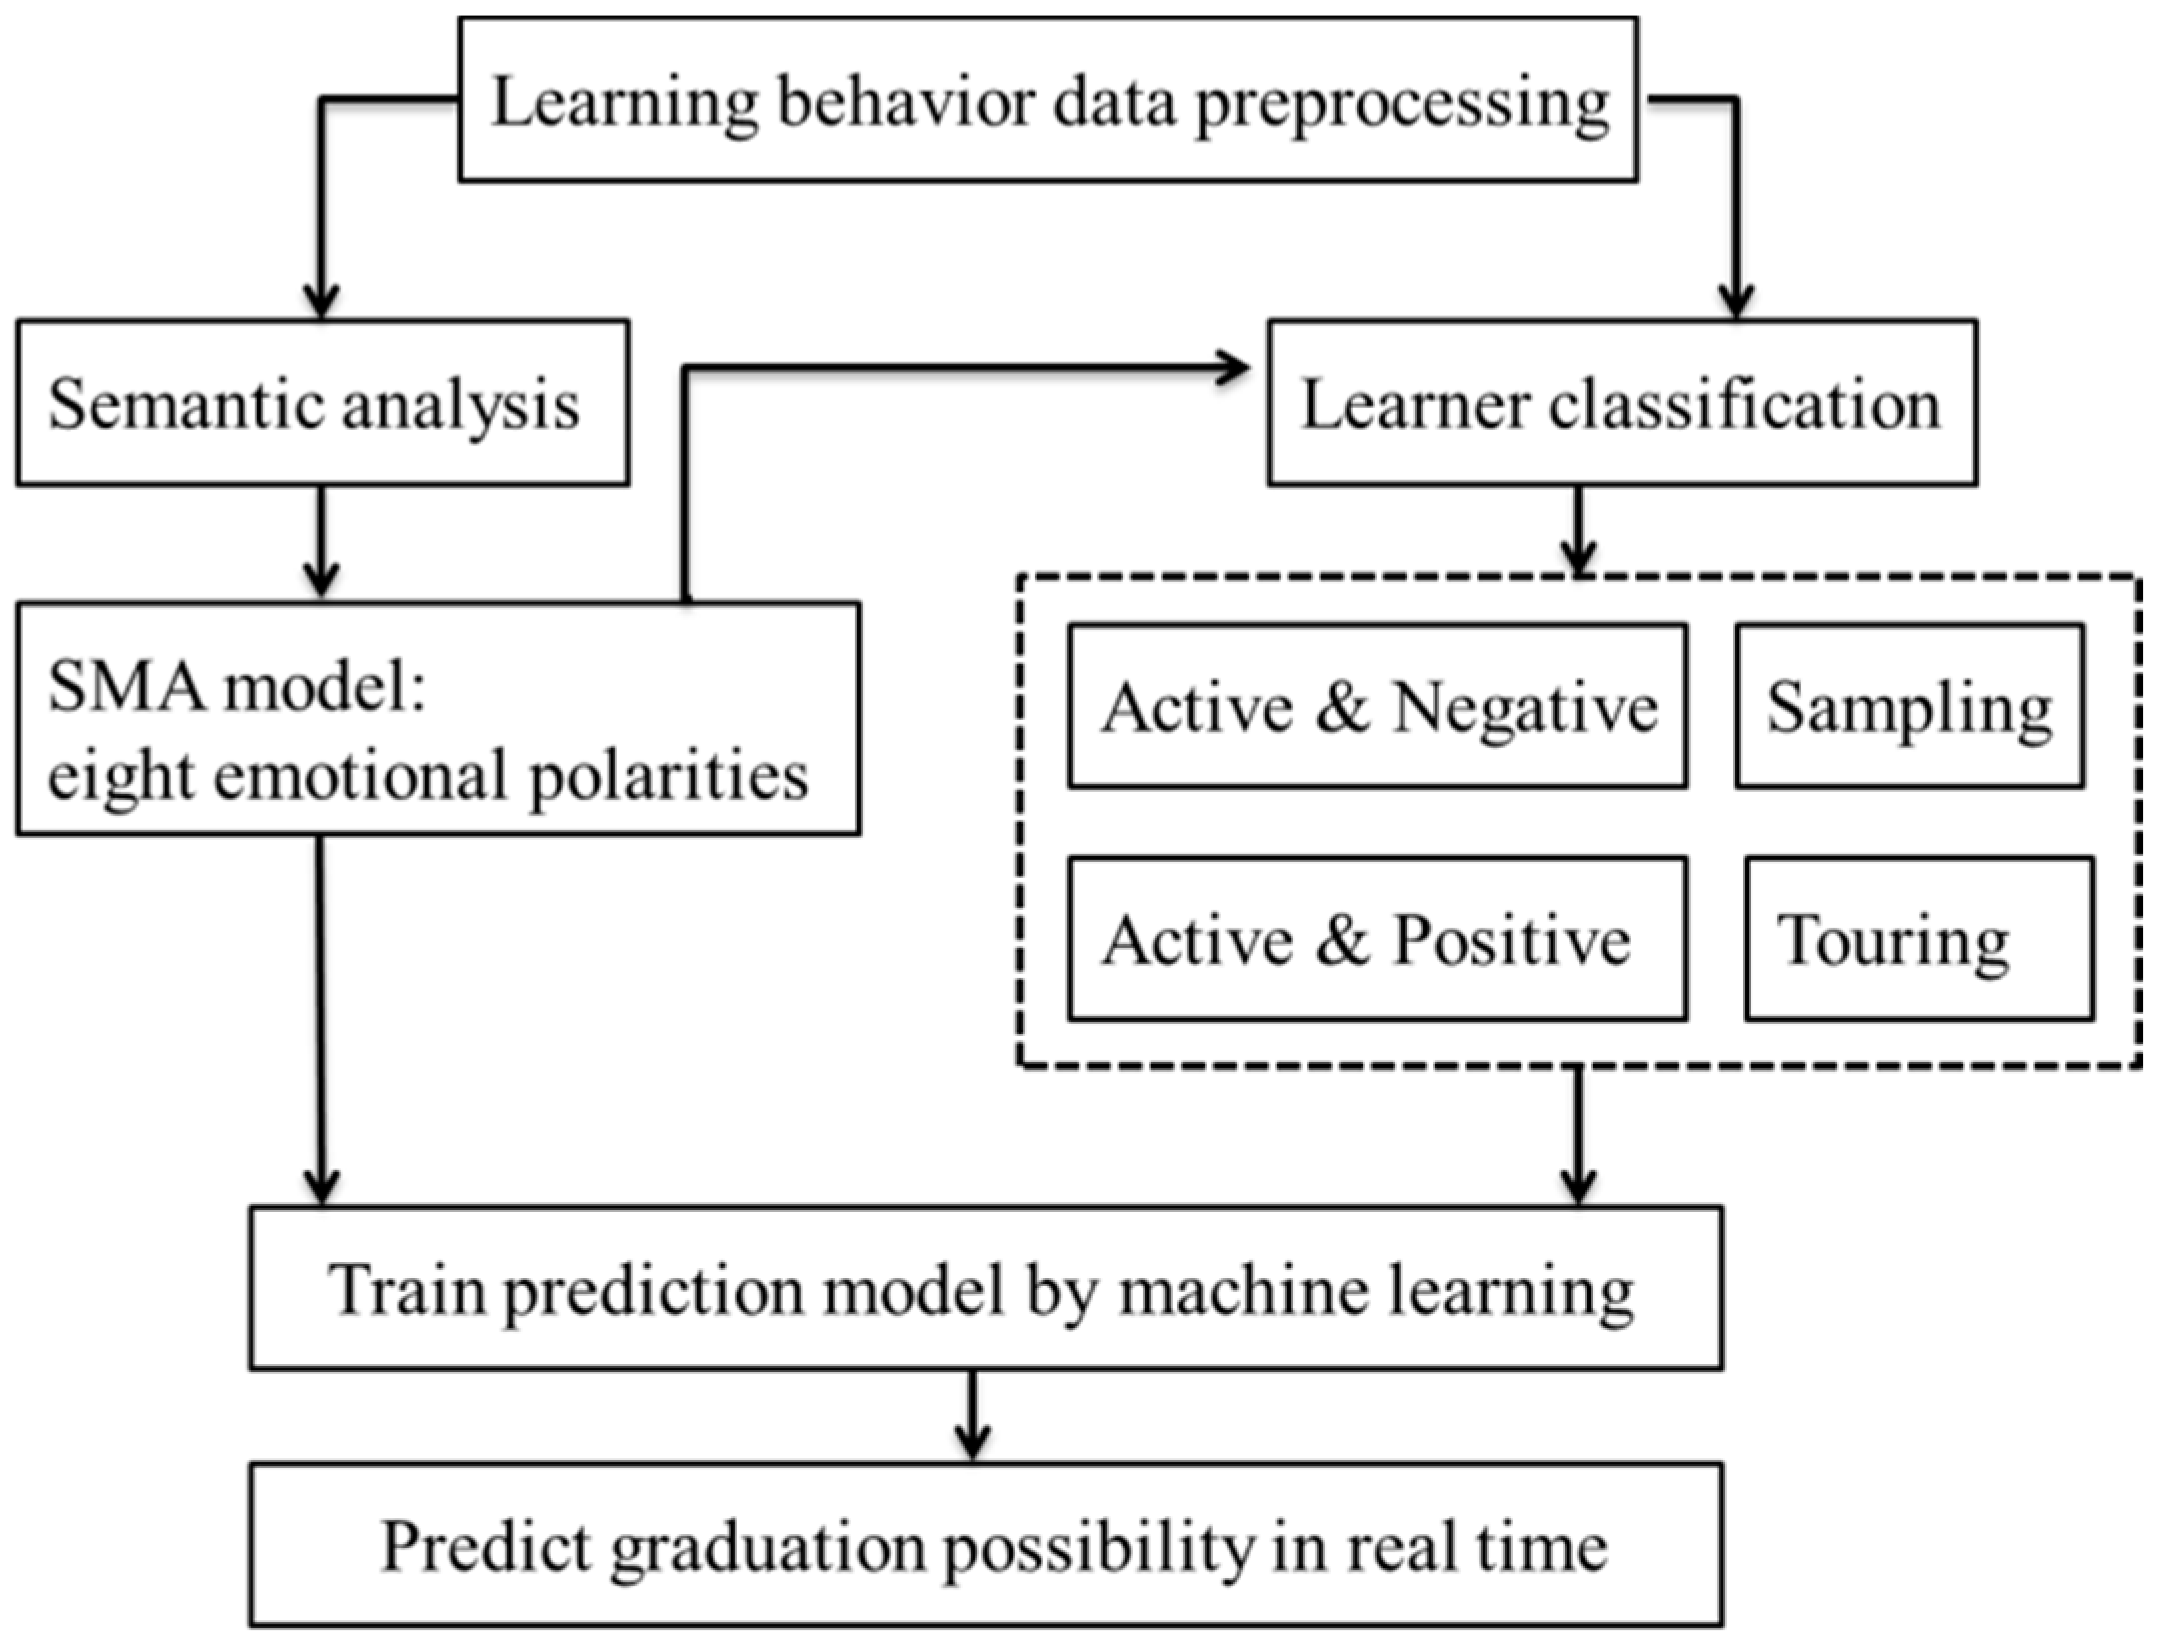
Our proposed SMA can efficiently discover learners’ multipolarity sentiments by analyzing the sentiment polarity of their comments. Through semantic and learning behavior analysis, the probability of graduation can be predicted in real time. Our model takes a semantic interpretation of learning behavior and divides sentiment polarity into eight categories. On this basis, learners can be divided into four categories by analysis of their learning behavior (two have obvious emotional characteristics), and we do a statistical analysis to show the results of learning (in Section 5.1.2). Finally, graduation probability can be predicted in real time in order to make timely, effective interventions, as shown in Figure 2.
4. Semantic Analysis Model
In this section, we propose a semantic analysis model to automatically assess the multipolarity sentiment state of each period, which is important to discover learners’ emotional tendencies.
4.1. Sentiment Quantification
In order to improve the accuracy of sentiment analysis, we refine the traditional dichotomy of sentiment analysis into an eight-polarity sentiment analysis. Moreover, we adjust the affect intensity of the NRC Affect Intensity Lexicon and design sentiment word affect intensity proximity rules for degree adverb, negative adverb, adversative, emotional punctuation and emoticon. Finally, learners’ emotional characteristic vectors can be obtained by calculating the quantification value of each sentiment. Table 2 lists the main symbols and their definitions.
4.1.1. Emotional Expression Rules
One key issue of semantic analysis is to establish emotional expression and grammar rules between sentiment words and qualifiers.
First, we adjust the affect intensity of the NRC Lexicon wj from 0 to 1.
Second, we adjust the degree of adverb weight to 0–2 depending on the affect intensity of the degree adverb, which has the effect of enhancing or weakening sentiment words. For example, in the two sentences, “It is very interesting” and “It is a little interesting”, the corresponding affect intensity of “very” and “little” is 0.5 and 1.5, respectively.
Similarly, emotional punctuation and emoticons have effects on enhancing or weakening sentiment words. The difference is that emotional punctuation and emoticons have weaker affect intensity compared with degree adverbs. Thus, we multiply on degree adverbs and add on emotional punctuation and emoticons. Furthermore, we adopt the method of single emotional punctuation and emoticon extension to add new emotional punctuation and emoticons, which can reduce the computation complexity of the algorithm to a certain extent.
Finally, we set −1 as the weight of negative adverbs, and take the sentiment transition effect of adversatives into account so that we unify a weight of 1.5 weights to the emotional segment; more specifically, a weight of 1.5 will be assigned to clauses that come after the adversative.
4.1.2. Emotional Vectorization
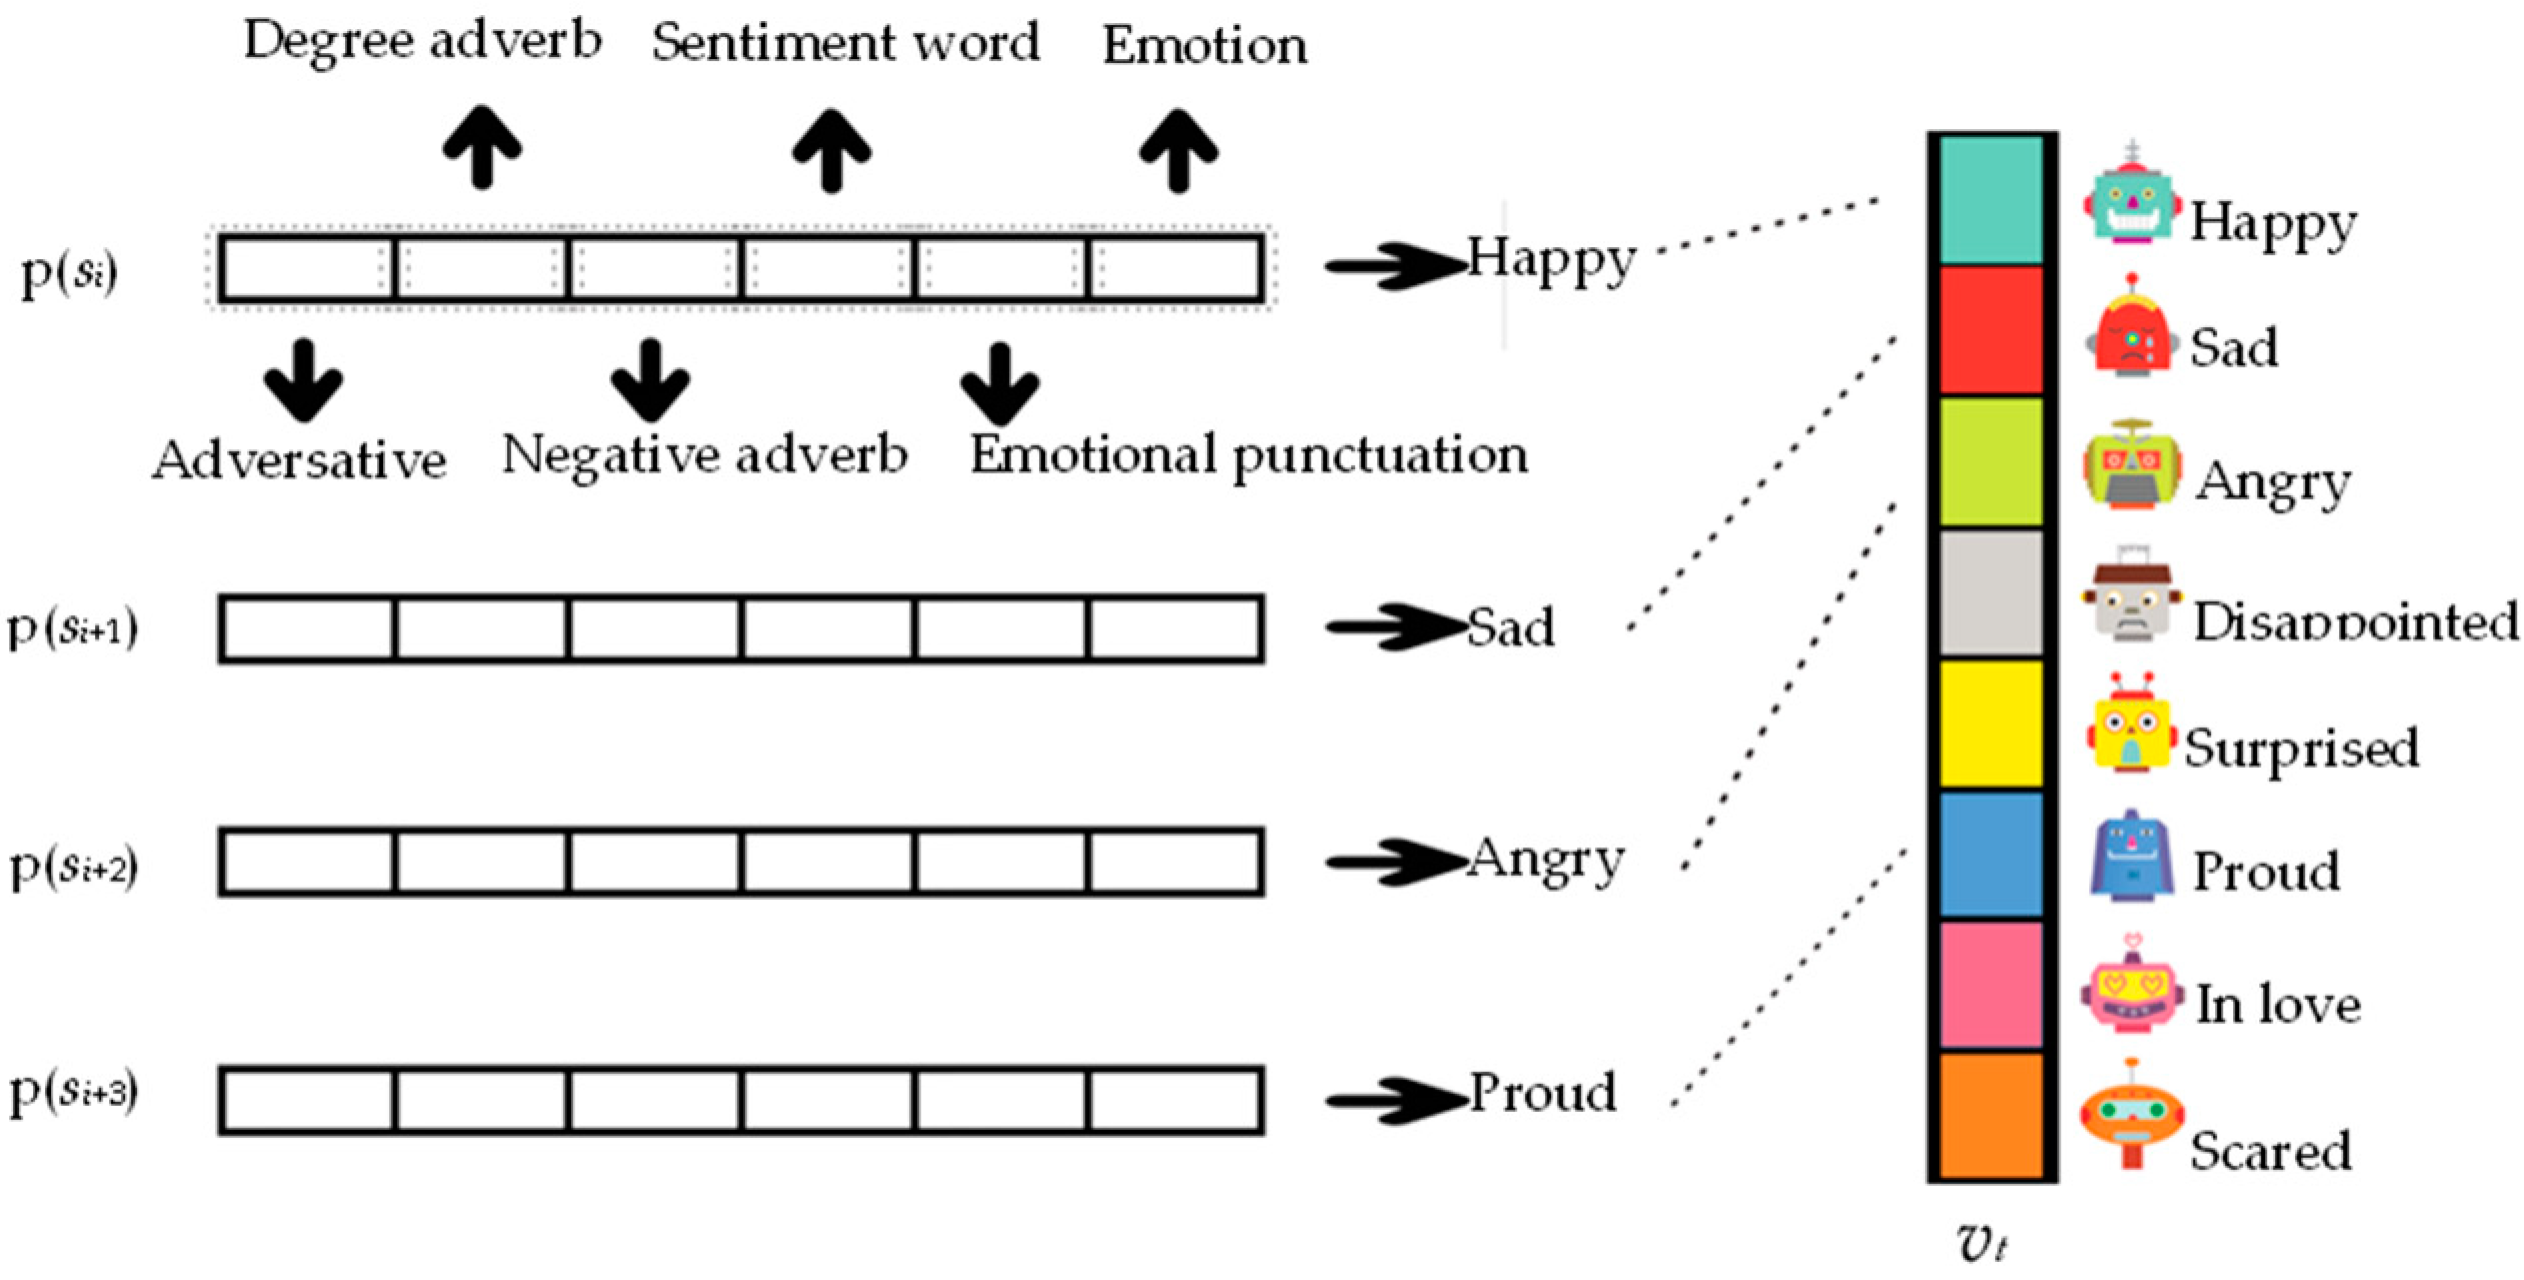
Traditional sentiment analysis methods such as probabilistic soft logic only focus on finding positive and negative emotions, which has much ambiguity in sentiment analysis. Two polarized emotions can be further refined by semantic analysis. In this section, we quantify the learners’ sentiment of each time node into an eight-dimensional emotional feature vector by a semantic scoring system as follows:
Step 1: Sentence segmentation preprocessing. We gather the text of “comments”, “Q&A”, “@teacher” and “@other learners” of each time node t, which need to be divided into n sentences.
Step 2: Word segmentation. We take the IKAnalyzer Word Segmentation toolkit (version, Manufacturer, City, US State abbrev. if possible, Country) to process every sentence, marking the location of each word.
Step 3: Sentiment word matching. In a general context, the degree adverb, negative adverb, adversative, emotional punctuation and emoticon of each sentiment word are closest to it. We search sentiment words in the sentiment word dictionary, so we can take each sentiment word as a benchmark to count and seek the closest degree adverb, negative adverb, adversative, emotional punctuation and emoticon.
Step 4: Emotional quantification. To quantify the sentiment of each sentence, we calculate its emotional quantification value by a scoring system, as follows:
where si denotes the i’th sentence, p(si) denotes the result of sentiment quantification for the sentence, wj denotes the jth sentiment word of sentence si, εk denotes the kth degree adverb, μ denotes negative adverb, σ denotes adversative, ω denotes emotional punctuation, δ denotes emoticon, n* denotes the number of sentiment words, and m denotes the number of adverbs.
Step 5: Emotion vectorization. To get emotion vectorization of time node t, we can calculate the eight-dimensional emotional feature vector as follows:
where vt denotes the emotional feature vector of time node t, and p(si) denotes the jth polarization emotion quantification value.
In this way, eight kinds of sentiment polarity values of a paragraph can be transformed into an eight-dimensional emotional feature vector, as shown in Figure 3.
4.1.3. Prediction of Graduation Probability with Emotional Change Analysis
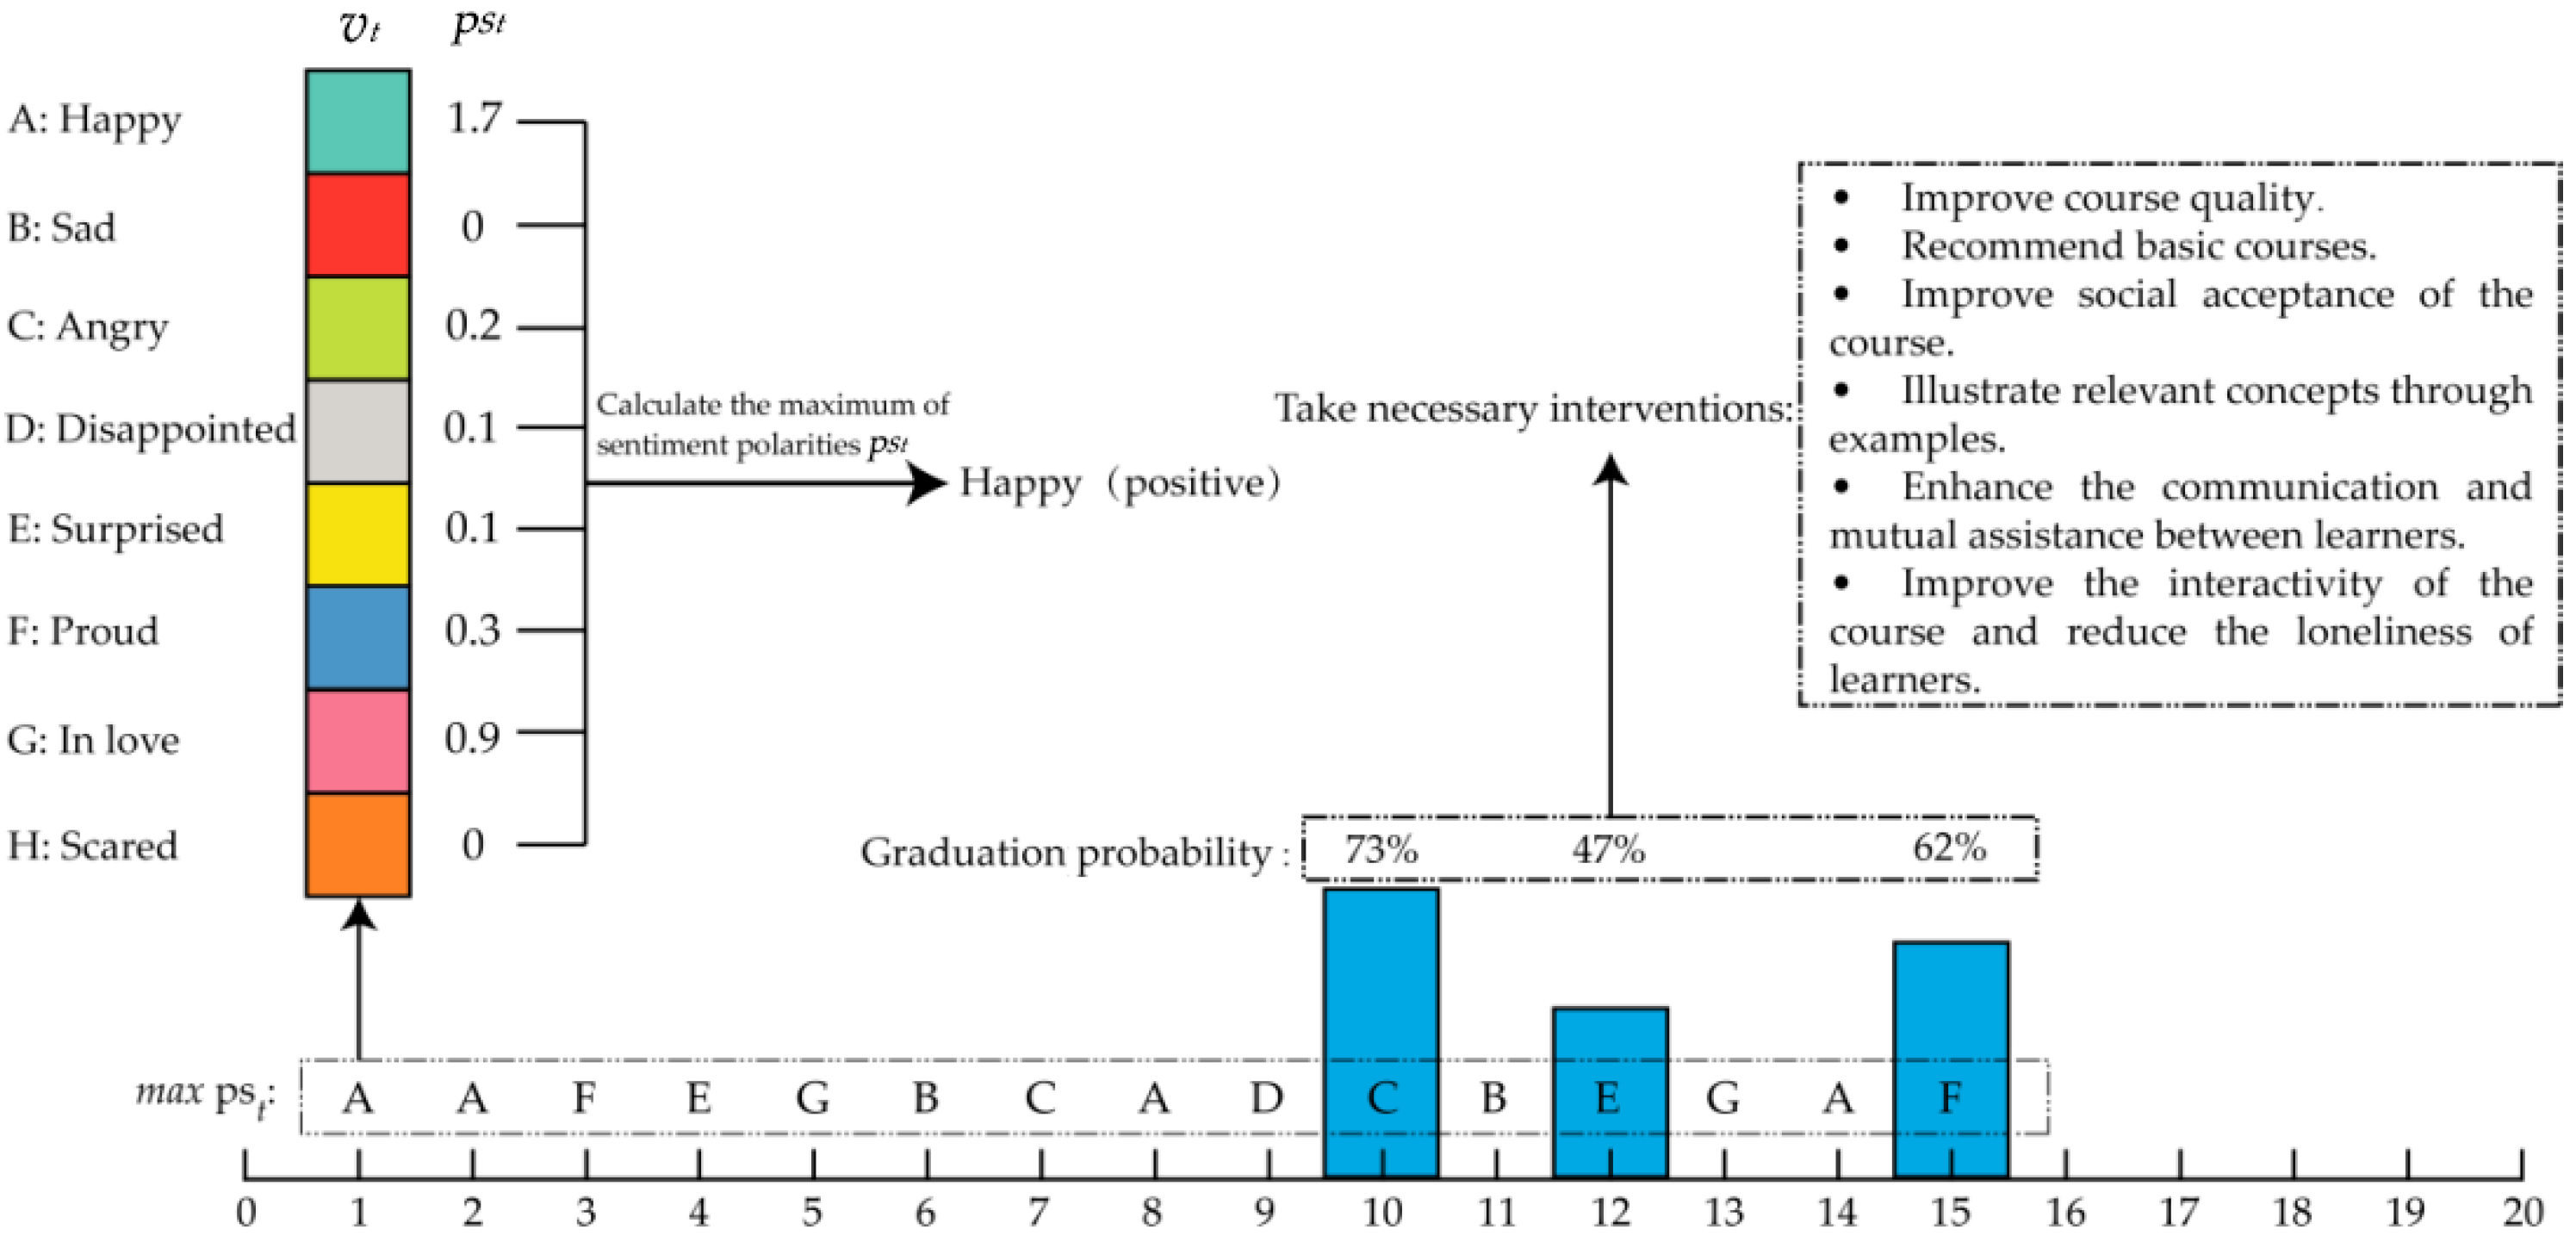
Semantic interpretation of learners’ behavior is meaningful because the emotional changes for learners during the process of study can reflect their reception of the learning content, and can also predict future probable graduate success at different time intervals. Although there is no direct relationship between emotional change and graduation rates, they potentially have mutual influence through our experimental verification (Section 5.2.2). For example, if there is a course containing 20 lessons in the MOOC platform, we can track real-time information such as homework completion, comment area, discussion area, etc., and this textual information can be used to explore emotional changes. As shown in Figure 4, there are six kinds of sentiment appearance: A, C, D, E, F and G, for the learner’s sentiment state vt during the first class period; B: Sad and H: Scared are not sentiment appearances because the emotional quantification value pst is equal to 0. Furthermore, the main sentiment polarity max pst can be calculated by the emotional quantification value functions in Section 4.1.1. In this example, A: Happy is the main sentiment appearance that represents the sentiment state of the first class period because Happy has the highest value (1.7) in the emotional quantification calculation among all sentiment appearances. In this way, the sentiment state for each class period can be presented as eight sentiment appearances including A: Happy, B: Sad, C: Angry, D: Disappointed, E: Surprised, F: Proud, G: In love and H: Scared, and the emotional change for 15 lessons can be presented as A–A–F–E–G–B–C–A–D–C–B–E–G–A-F.
In fact, our main idea is to predict the graduation probability in real time before the end of all the lessons so as to take some interventions when graduation probability significantly decline. Generally speaking, some learners lose their chances of graduation for some reason, such as losing interest in learning. We analyze their emotional changes, and give some guidance and advice during the learning process to help them successfully pass the course. Therefore, through quantitative analysis of emotional changes to predict graduation probability at each class period, learners could be given guidance and advice in time to prevent them from leaving the course. For example, we calculate graduation probability by using machine learning for students just before they finish the tenth lesson, and, if the value is higher, it shows that acceptance for this course is better. Otherwise, graduation probability is lower, such as in the twelfth lesson in this example, where the curve makes a marked significantly decline and the value is only 47%, so some interventions should be taken in time to increase graduation success.
4.2. Classification of Four Categories of Learners
We find that learners can be distinguished according to their learning behavior characteristics, which are listed in Table 3. “Active & Negative” represents active and negative learners, who attend courses with negative emotional tendencies. Learners with negative emotional tendencies are always in “Active & Negative”, so we can discover their negative emotional tendencies by applying our semantic analysis method. “Active & Positive” represents positive and active learners, who can complete courses successfully with optimistic emotions. These two groups have great research value because they tend to comment on forums, which provide a lot of text data with sentiment characteristics. “Touring” represents learners who appear only at the first or second lesson, and rarely comment or take an exam. “Sampling” represents learners with a definite purposes, who only watch lessons that are useful for them or that they are interested in.
4.2.1. Active & Negative and Active & Positive Analysis
To separate “Active & Negative” and “Active & Positive”, we need to analyze the emotions presented in text by SMA. Therefore, we divide eight sentiments into positive and negative. Positive emotions are happy, surprised, proud, and in love; negative emotions are sad, angry, disappointed, and scared.
We can mark off “Active & Negative” and “Active & Positive” by statistics for the most emotional polarity of learners in all time nodes. The reason we determine learners’ emotional tendencies by counting most of the polarity emotions in all time nodes instead of combining all of the text data to calculate the highest sentiment polarity values is to avoid misjudging excessive emotions (short-term or periodic overreactions) in the judgment of emotional tendencies. Therefore, we take the sentiment of each time node as a basis, and analyze learners’ emotional tendencies by gathering statistics on sentiments of all time nodes.
To discover a learner’s emotional tendency Et, we calculate the maximum of sentiment polarities pst of vt in all time nodes:
where Et denotes the learner’s ultimate emotional tendency, t denotes the t-th time node, n’ denotes the total number of course time nodes, and max pst denotes the maximum sentiment polarity pst of vt.
Based on Equation (3), we can separate “Active & Negative” and “Active & Positive” by confirming if the learner’s emotional tendency Et belongs to a positive or negative emotion.
Definition 1.
(Active & Negative): A learner is determined to be “Active & Negative” when Et belongs to a negative emotion.
Definition 2.
(Active & Positive): A learner is determined to be “Active & Positive” when Et belongs to a positive emotion.
4.2.2. Touring and Sampling Analysis
Through a combination analysis of the following conditions, the learners can be effectively divided into two characteristic groups “Touring” and “Sampling”:
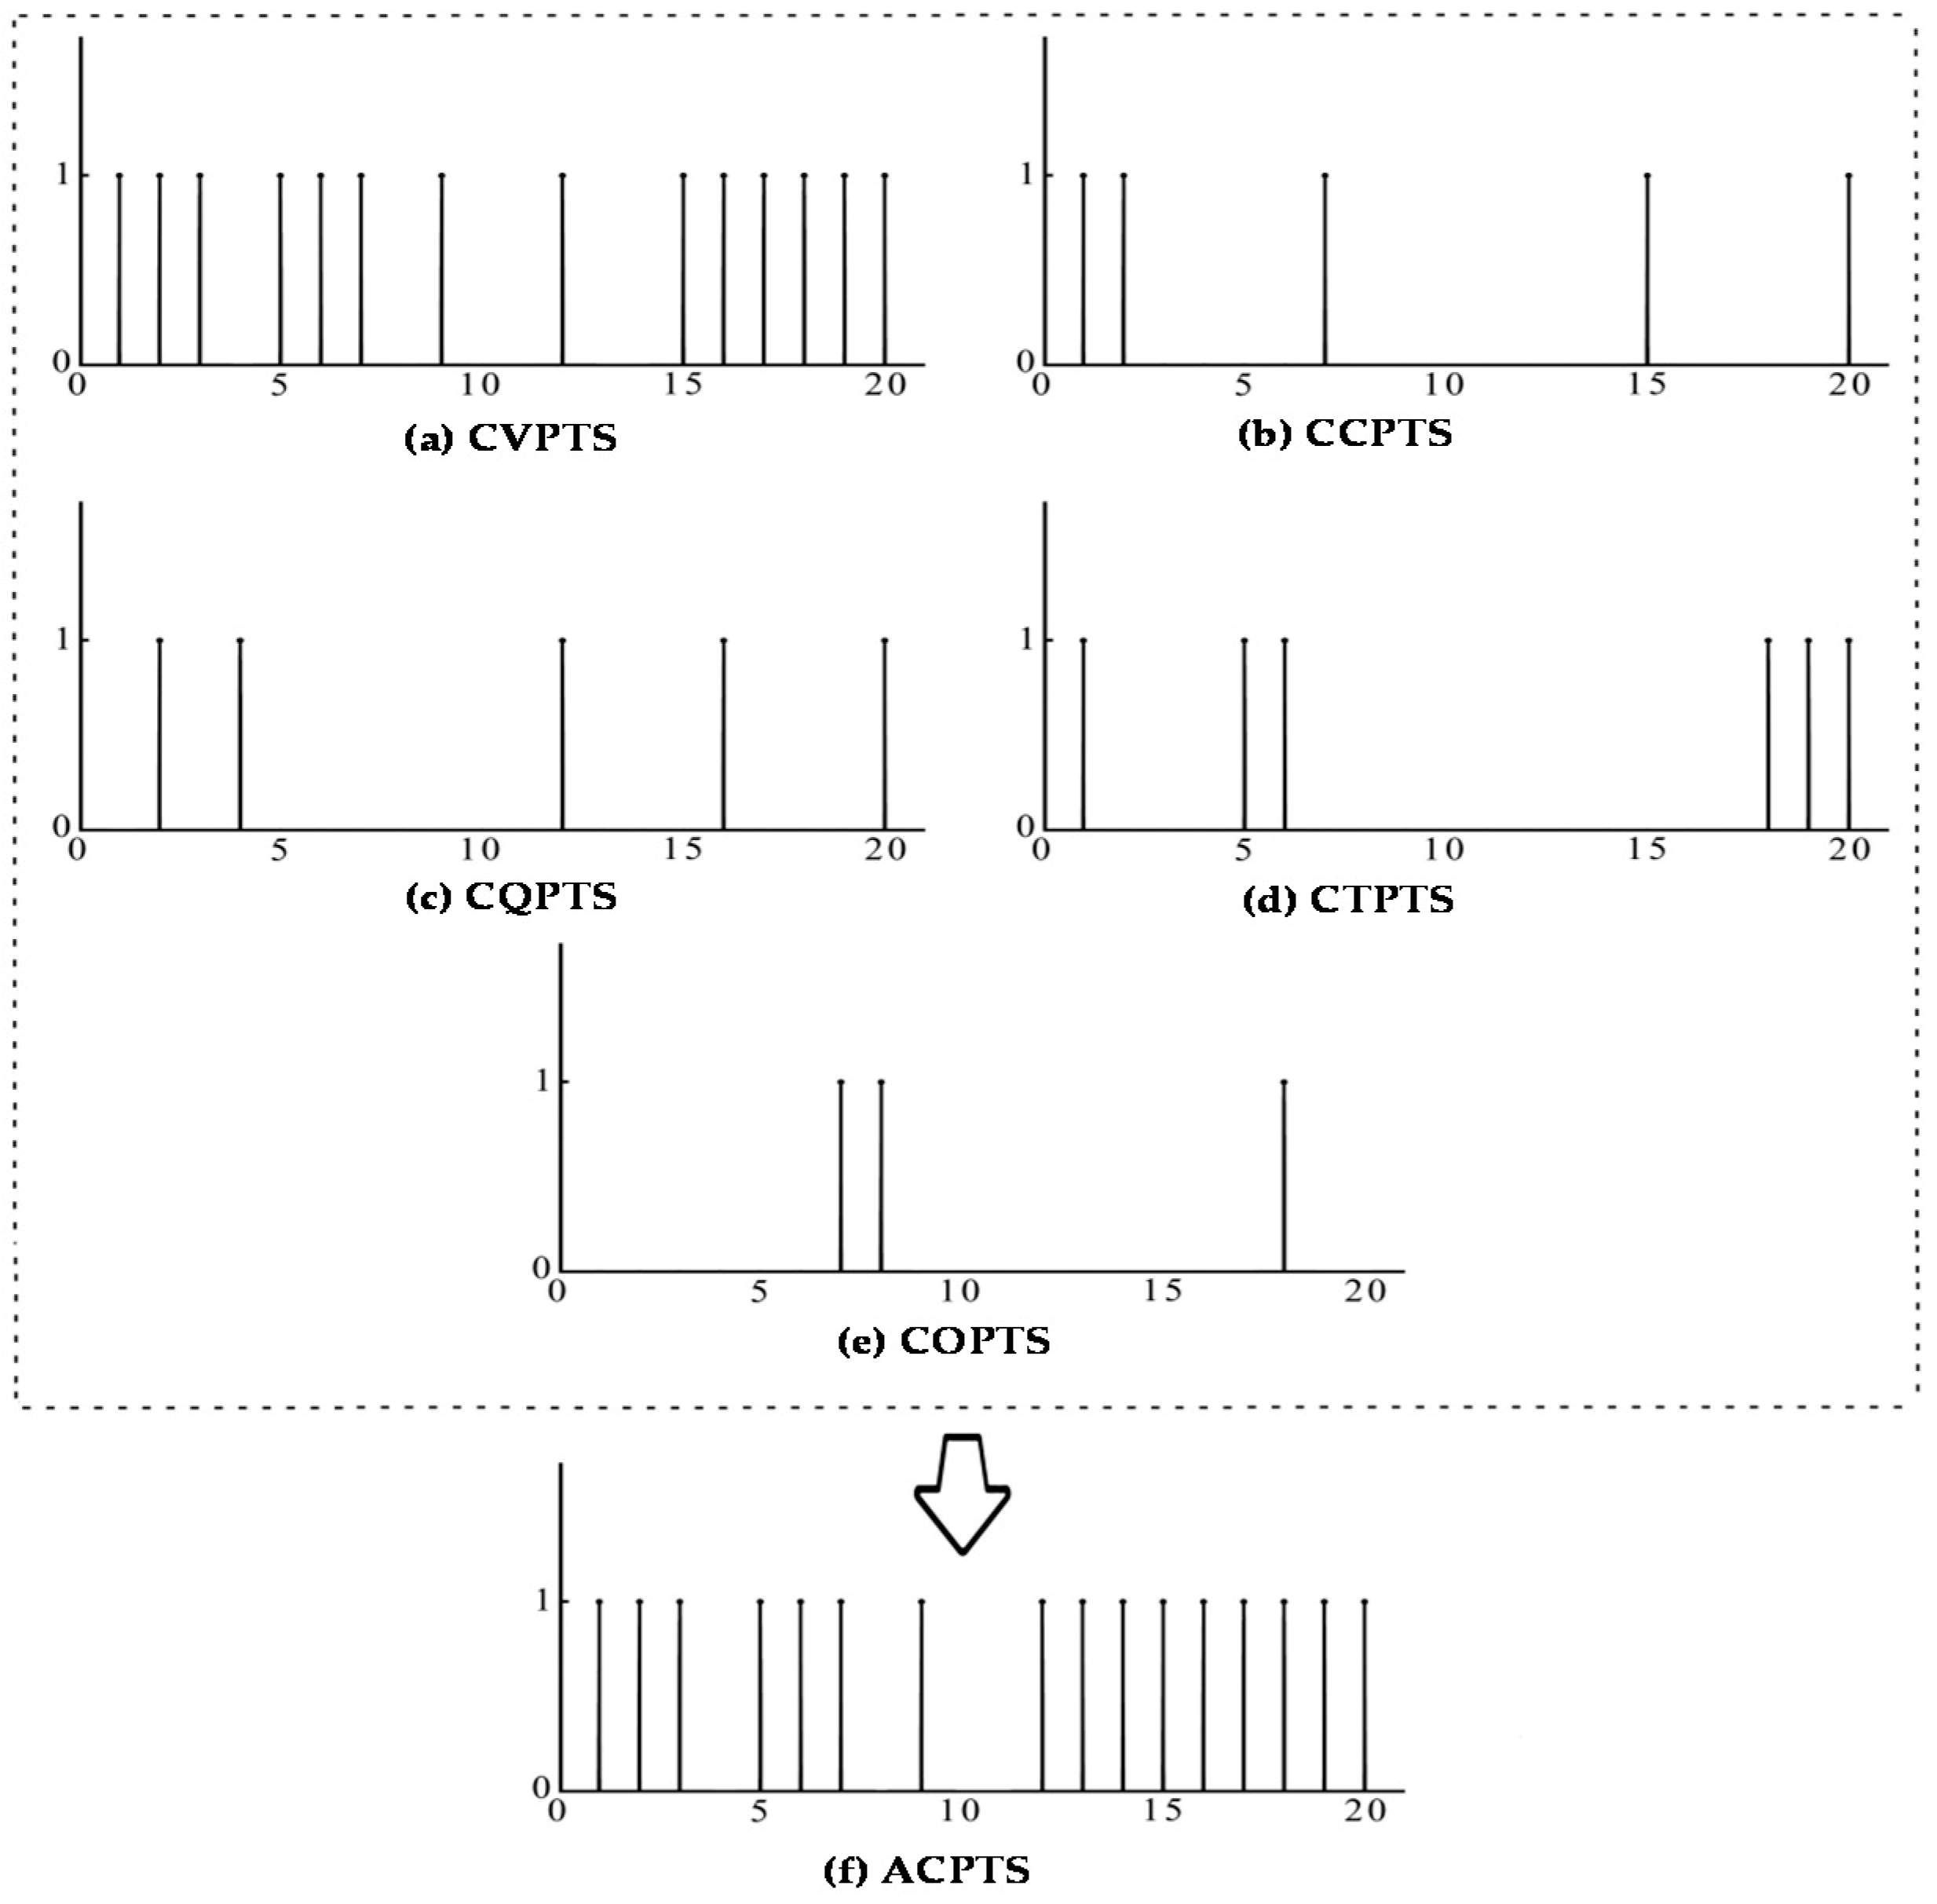
- Course viewing participation time series (CVPTS) as a time series of participation in course viewing.
- Course comments participation time series (CCPTS) as a time series of participation in course comments.
- Course question and answer participation time series (CQPTS) as a time series of participation in course question and answer.
- Course @teacher participation time series (CTPTS) as a time series of participation in course @teacher.
- Course @other learners participation time series (COPTS) as a time series of participation in course @other learners.
- AND-logic course participation time series (ACPTS) as an AND-logic operating course participation time series in “course viewing”, “comments”, “Q&A”, “@teacher” and “@other learners”.
Therefore, we normalize each participation situation to the nearest time node to obtain course participation time series of “course viewing”, “comments”, “Q&A”, “@teacher” and “@other learners”. We can get the AND-logic course participation time series by AND-logic operation. The term of AND-logic operation is AND-logic operation of participation in “course viewing”, “comments”, “Q&A”, “@teacher” and “@other learners” at time node t. As shown in Figure 5, ACPTS is determined by combining five participation time series. The abscissa axis is the lesson series, and the vertical axis is participation state; 1 means participated at this time node and 0 means did not participate.
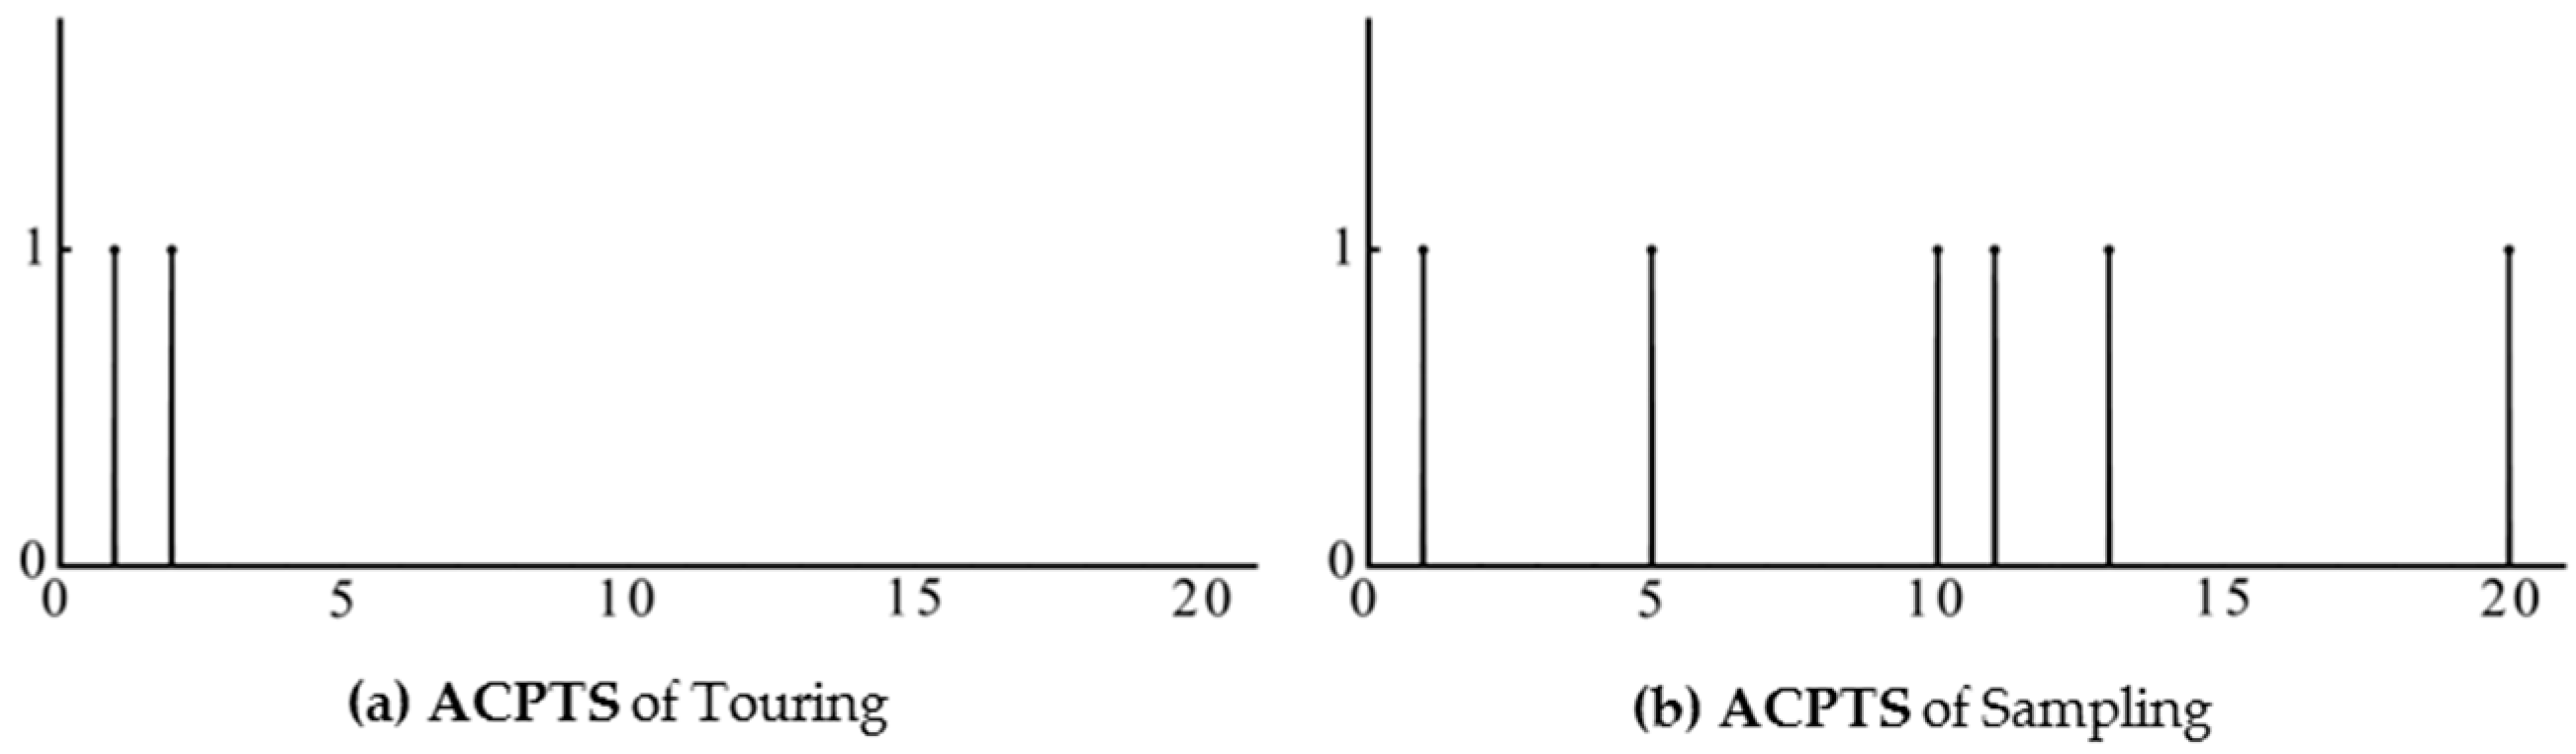
“Touring” and “Sampling” can be detected in terms of different ACPTS, so we visualize the ACPTS of different learners in Figure 6, where the abscissa axis is course number t and the vertical axis is participation state; 1 means participated at this time node and 0 means did not participate.
Definition 3.
(Touring): Course participation of time node t is represented by Pc(t), and a learner is determined as “Touring” iff ACPTS[Pc(t)] ≤ 2 and Pc(t) ≠ 1 when t ≥ 3.
Definition 4.
(Sampling): Regional vacancies of ACPTS is represented by rv; a learner is determined as“Sampling” iff rv ≥ 3 and CCPTS ∩ ACPTS = CQPTS ∩ ACPTS = CTPTS ∩ ACPTS = COPTS ∩ ACPTS =∅.
4.3. Subsection
We can effectively discover learners’ emotional tendencies based on semantic and statistical analysis. The pseudo-code of SMA is given in Algorithm 1.
| Algorithm 1. SMA. |
| Input: D = (Li’, ACPTS). Output: Learner categories and emotional tendency Et. |
| 1: Begin 2: U = D, B = ∅ 3: while U ≠ ∅ do 4: for i’ = 0, i’< n*, B = B + Li’; 5: if t = 0, t < n’ 6: for i = 0 do 7: Calculate p(si), vt, Et by Equations (1)–(3); 8: end for 9: Switch(ACPTS, Et) 10: Case 1: Et belongs to negative emotions 11: Li’ is determined as Active & Negative break 12: Case 2: Et belongs to positive emotions 13: Li’ is determined as Active & Positive break 14: Case 3: ACPTS[Pc(t)] ≤ 2, and Pc(t) ≠ 1 when t ≥ 3 15: Li’ is determined as Touring break 16: Case 4: rv ≥ 3, 17: CCPTS ∩ ACPTS = CQPTS ∩ ACPTS = CTPTS ∩ ACPTS = COPTS ∩ ACPTS = ∅ 18: Li is determined to be Sampling break 19: end if 20: end for 21: U = U\B; 22: end while 23: return Et |
5. Experiments
In this section, we firstly do a statistical analysis of learning statistical magnitude. We next do a statistical analysis of emotional learners’ learning statistical magnitude to show the difference in graduation rates and other aspects of learners with emotional tendencies, providing important support for the of graduation rate prediction. We then compare the effectiveness of the three models, our proposed SMA, LSTM [49] and SeNTU [50], and show the accuracy of our model.
All experiments were conducted on a Windows10.0.15063 server with one CPU (i7-7700k 4.20 GHz) and 1_T of main memory. SMA, LSTM and SeNTU were implemented in Java as single-threaded programs. In addition, we used IKAnalyzer as a word segmentation tool. The experiments used Chinese university MOOCs text data of “comments”, “Q&A”, “@teacher” and “@other learners”.
5.1. Evaluation of MOOCs
5.1.1. Learning Statistical Magnitude
In order to demonstrate and classify learners’ state in MOOCs, we choose a course on circuit foundation and analog electronic technology, Electrotechnics(018234), at Chinese university MOOCs was offered by Harbin Institute of Technology (HIT) in June 2017 for free, and did a statistical analysis on the course.
In Table 4, the course completion rate is the ratio of the viewed lessons to all lessons, the homework completion rate is the ratio of the homework completed to all homework, the comments is the number of times to comment, the question participation is the number of times to question and answer, the @teacher is the number of times that send messages to teacher, the @other learners is the number of times to send messages to other learners, the discussion initiating is the number of times to initiate discussion, and the discussion replying is the number of times to reply discussion. We calculated average of course completion rate, homework completion rate, comments, question participation, @teacher, @other learners, discussion initiating and discussion replying as follows:
As can be seen from Table 4, the average course completion rate is 43%, which is comparatively higher than that of other courses. The average homework completion rate is lower than the course completion rate, which potentially means that learners prefer watching the courses than doing homework. The average graduation certificate rate is extremely low because learners need to pay 100 RMB to the MOOC platform to get a paper graduation certificate, which most learners do not think is significant for their career, so their buying intention is low. Accordingly, we find that MOOC learners lack interactivity, because their comment, discussion initiating, discussion replying, @teacher and @other learners times are low.
5.1.2. Emotional Learners’ Learning Statistical Magnitude
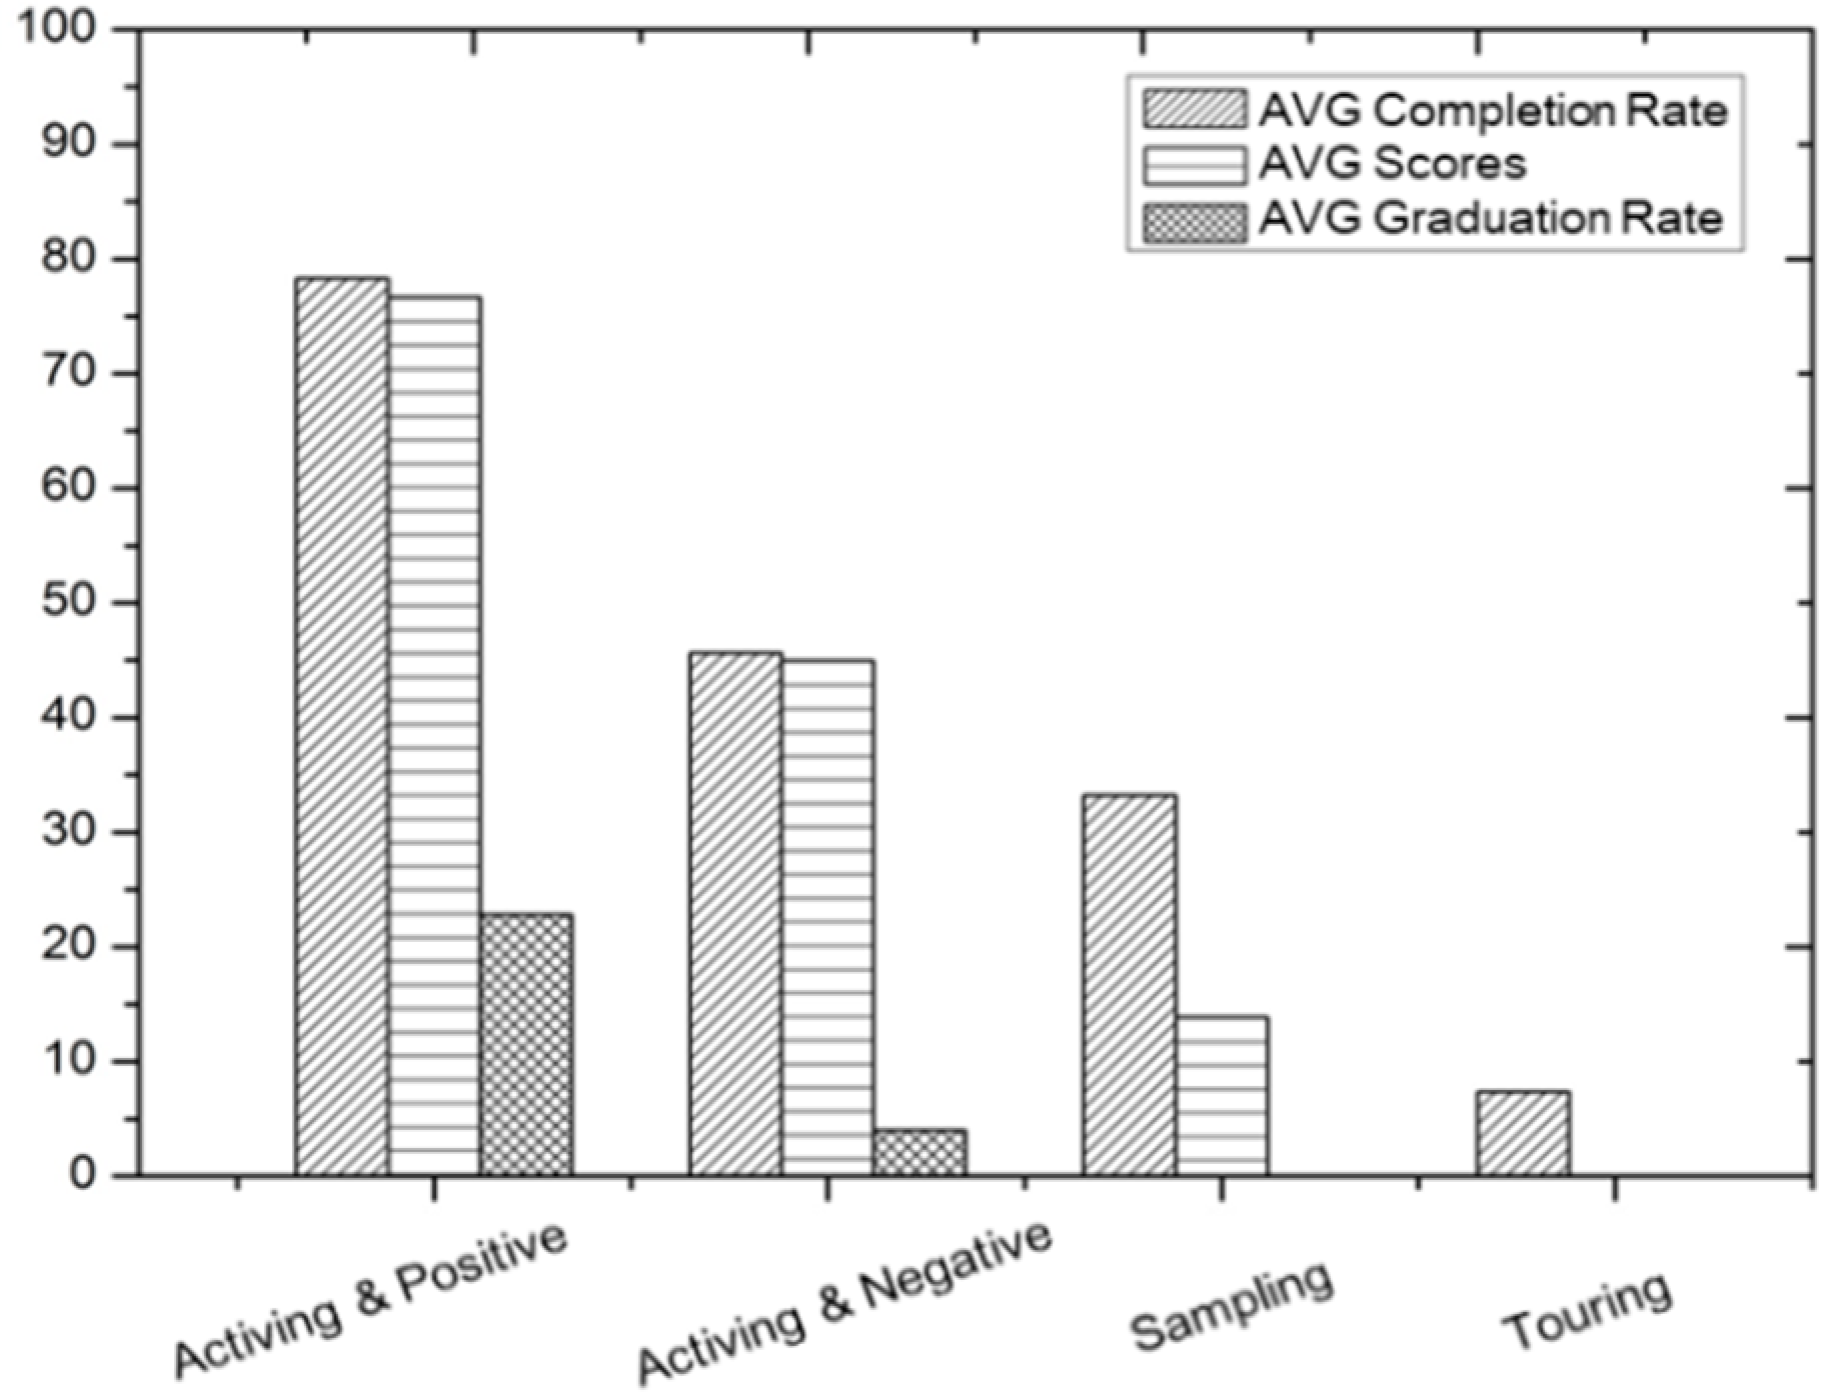
The term of “emotional learners” refers to learners who have emotional tendencies. We analyzed the four kinds of learning statistically, including average completion rate, average score, average graduation and proportion, which are listed in Table 5.
As shown in Table 5, the “Active & Positive” group has the highest average completion rate, average score and average graduation. In contrast, the “Active & Negative” group has lower average completion rate, average score and average graduation. The reason why the “Active & Negative” group has higher rates than the “Sampling” and “Touring” groups is that “Active & Negative” learners are more active than “Sampling” and “Touring” learners. Although we find that they have more negative emotional tendencies, we believe that being active is helpful in improving learners’ performance in some aspects. Therefore, it is meaningful and possible to undertake sentiment analysis to predict learners’ course completion rates, scores, and graduation rates.
On the other hand, “Sampling” and “Touring” groups account for over 60%, far more than “Active & Positive” and “Active & Negative”. The lowest average scores is 0, because “Touring” learners do not tend to take the exams. Similarly, the “Touring” and “Sampling” groups’ average graduation rate is 0%, because these learners do not tend to pay for paper diplomas. Fifteen percent of learners failed to be filtered by our filter model. We found that in these learners’ text data, such as comments or questions, usually did not have any emotion.
In general, there were more than 6.7% negative learners, most of them hidden in the “Sampling” and “Touring” groups, which makes it difficult to find them by sentiment analysis. In spite of this, it is still valuable to improving graduation rates to detect the negative learners in order to provide personalized instructional, considering the large MOOC learner base.
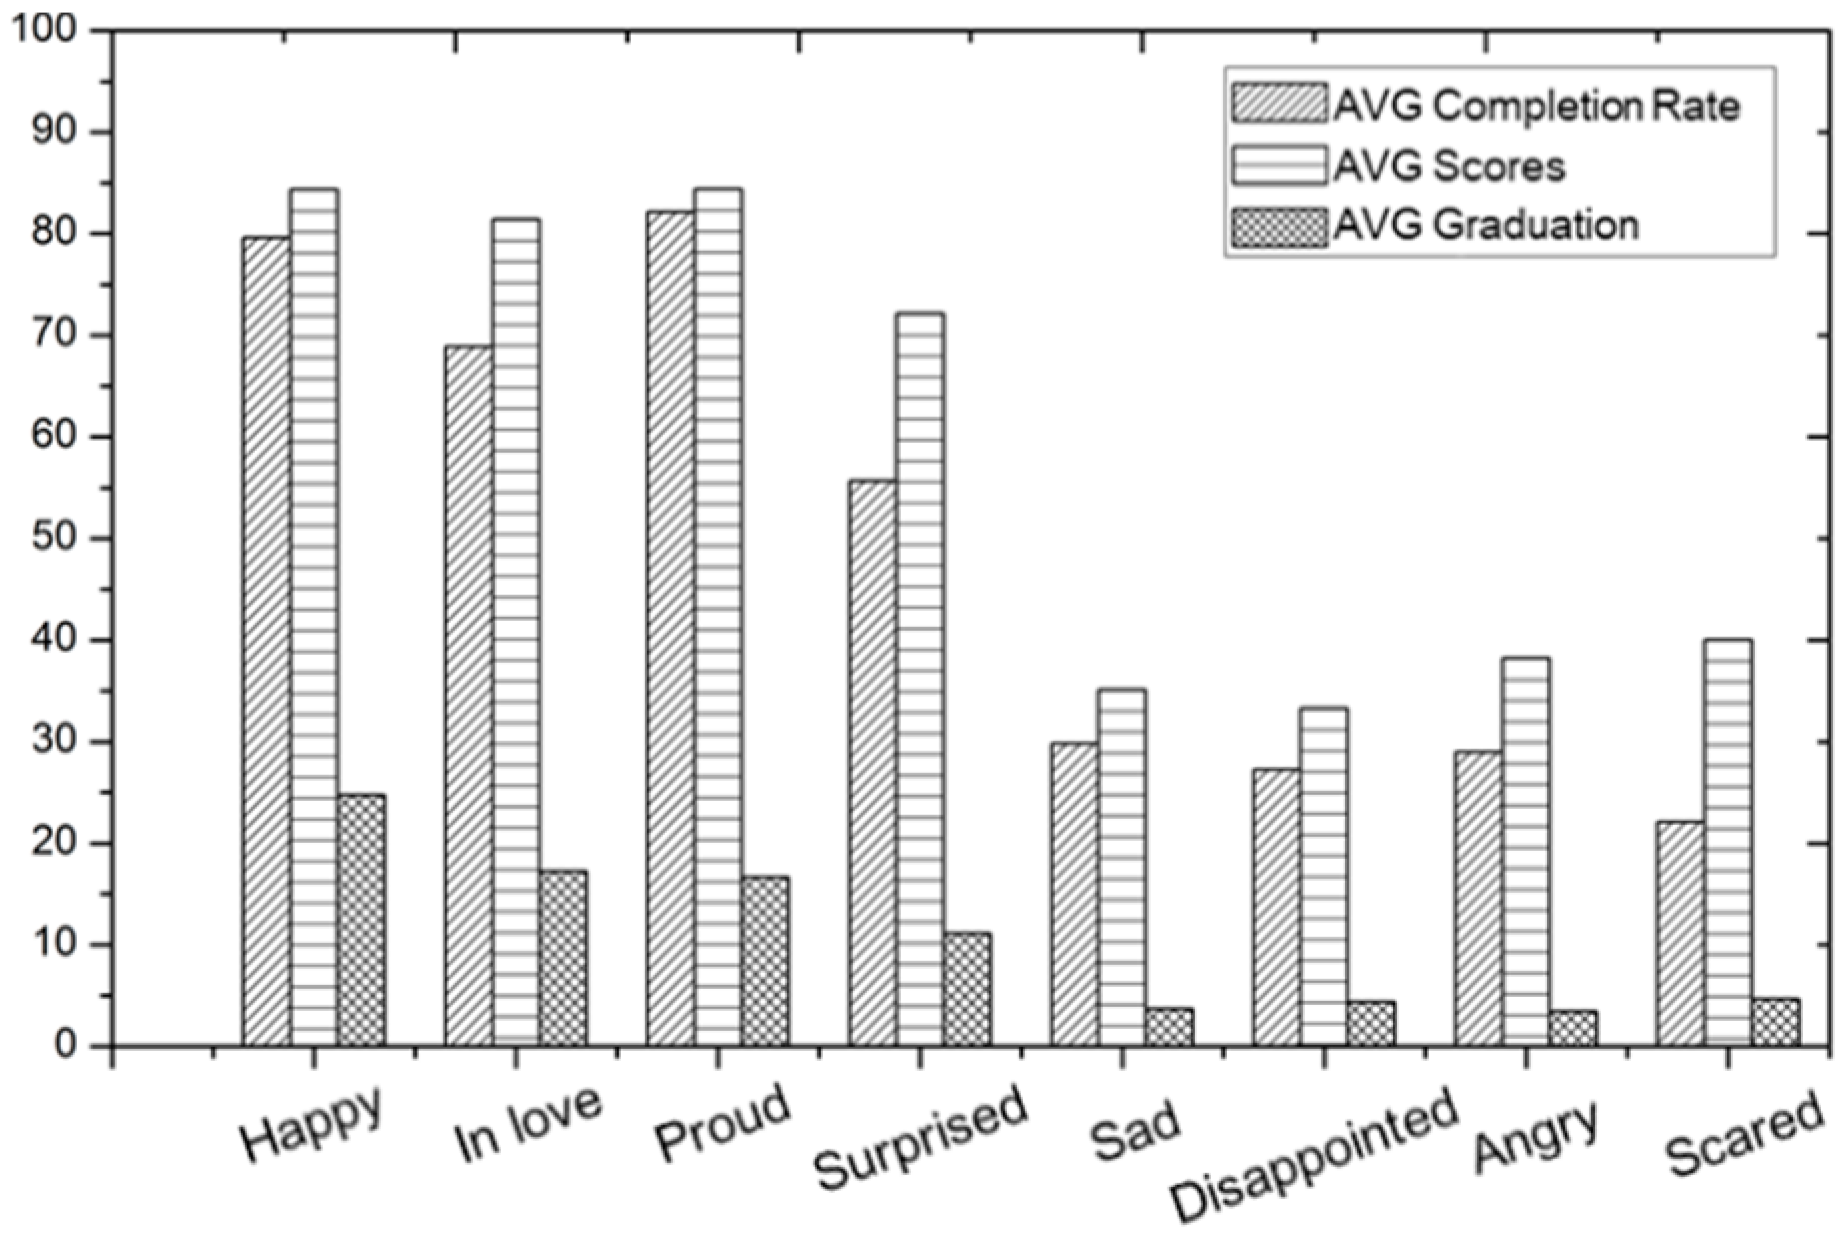
We also refined the learners’ learning statistical magnitude by eight emotional tendencies, according to average completion rate, average score and proportion, listed in Table 6.
As can be seen from Table 6, proud learners have the highest average completion rate and average score, but low proportion and average graduation rate. Thus, we think that learners with a sense of pride tend to have little aspiration for paper graduation certificates. Learners who have an emotional tendency to be surprised have the lowest proportion of all positive emotions, so we think that there are fewer learners who are likely to be surprised. Learners with a tendency to be happy have the second highest average score and average completion. They account for the largest proportion of all learners, so we conclude that most learners who choose this course have a happy emotional tendency, which can also be used as an evaluation criterion of courses.
Learners with a tendency to be scared have the highest average score and average completion of all negative learners, but they only account for a small percentage of all negative learners. Similarly, we think that fewer learners are likely to be scared. Learners with a tendency to be sad and disappointed account for a larger percentage of all negative learners, so we believe that negative learners usually have a tendency to be sad and disappointed.
In order to show the characteristics of different learners visually, we took the four kinds of learners’ average completion rate, average score and average graduation rates to draw a bar graph, shown in Figure 7, and a bar graph of learners with the eight kinds of emotional inclination according to average completion rate, average score, and average graduation rate in Figure 8; the unit of completion and graduation rates is percent, and the unit of scores is centesimal.
As can be seen from Figure 7, of the four groups, “Active & Positive” has the highest average score and average completion rate, while “Touring” has the lowest average completion rate and average graduation rate. Furthermore, it is thought-provoking that learners “Active & Negative” learners have a higher average completion rate but lower average graduation rate.
MOOCs mode is different from the general education mode that has a systematic learning scheme and guidance of teachers. Learners of MOOCs are always trying to discover their interest or need in some courses and build their own learning scheme. However, learning with interest or need alone does not result in good learning outcomes, many reasons such as learning foundation, cross-disciplinary course and the connection between the previous course and the course will cause them to gradually appear negative emotions. We infer that these rates (average completion rate, average scores and average graduation rate) for “Active & Negative” learners are due to negative emotions arising from certain causes in learning, which lead to low graduation rates. Thus, it makes sense to predict their emotional tendencies based on their emotional characteristics, and the completion rate and graduation rate can be improved.
As can be seen from Figure 8, learners who tend to be happy have the highest average completion rate, average scores and average graduation rate, while learners who tend to be negative always have lower average completion rate, average score and average graduation rate. However, the negative learners still have higher graduation rates than the “Touring” and “Sampling” learners, so we deduce that being more active is also beneficial for graduation.
5.2. Performance Evaluation
5.2.1. Sentiment Analysis Accuracy
In this section, we show the sentiment analysis accuracy of our proposed SMA. To evaluate the sentiment analysis performance, we used precision, recall and F1_measure, which emphasizes the performance of the algorithm on analysis capability and degree of confidence respectively, listed in Table 7.
As shown in Table 7, our proposed SMA has higher precision, recall and F1_Measure, which proves its accuracy. Our method can overcome the ambiguity of emotion analysis to some extent because we fully consider the language environment’s emotional expression rules. In addition, we carry out more precise weight distribution of the synonyms for emotion words, degree adverbs, emotional punctuation, and emoticons, which improved the accuracy of emotional analysis to some extent. We also take into account the emotional center transfer effect of adversatives. As shown in Table 7, our model has the highest precision, the highest recall and the highest F1_measure, which prove the accuracy of our algorithm.
5.2.2. Graduation Probability and Graduation Rate Comparison
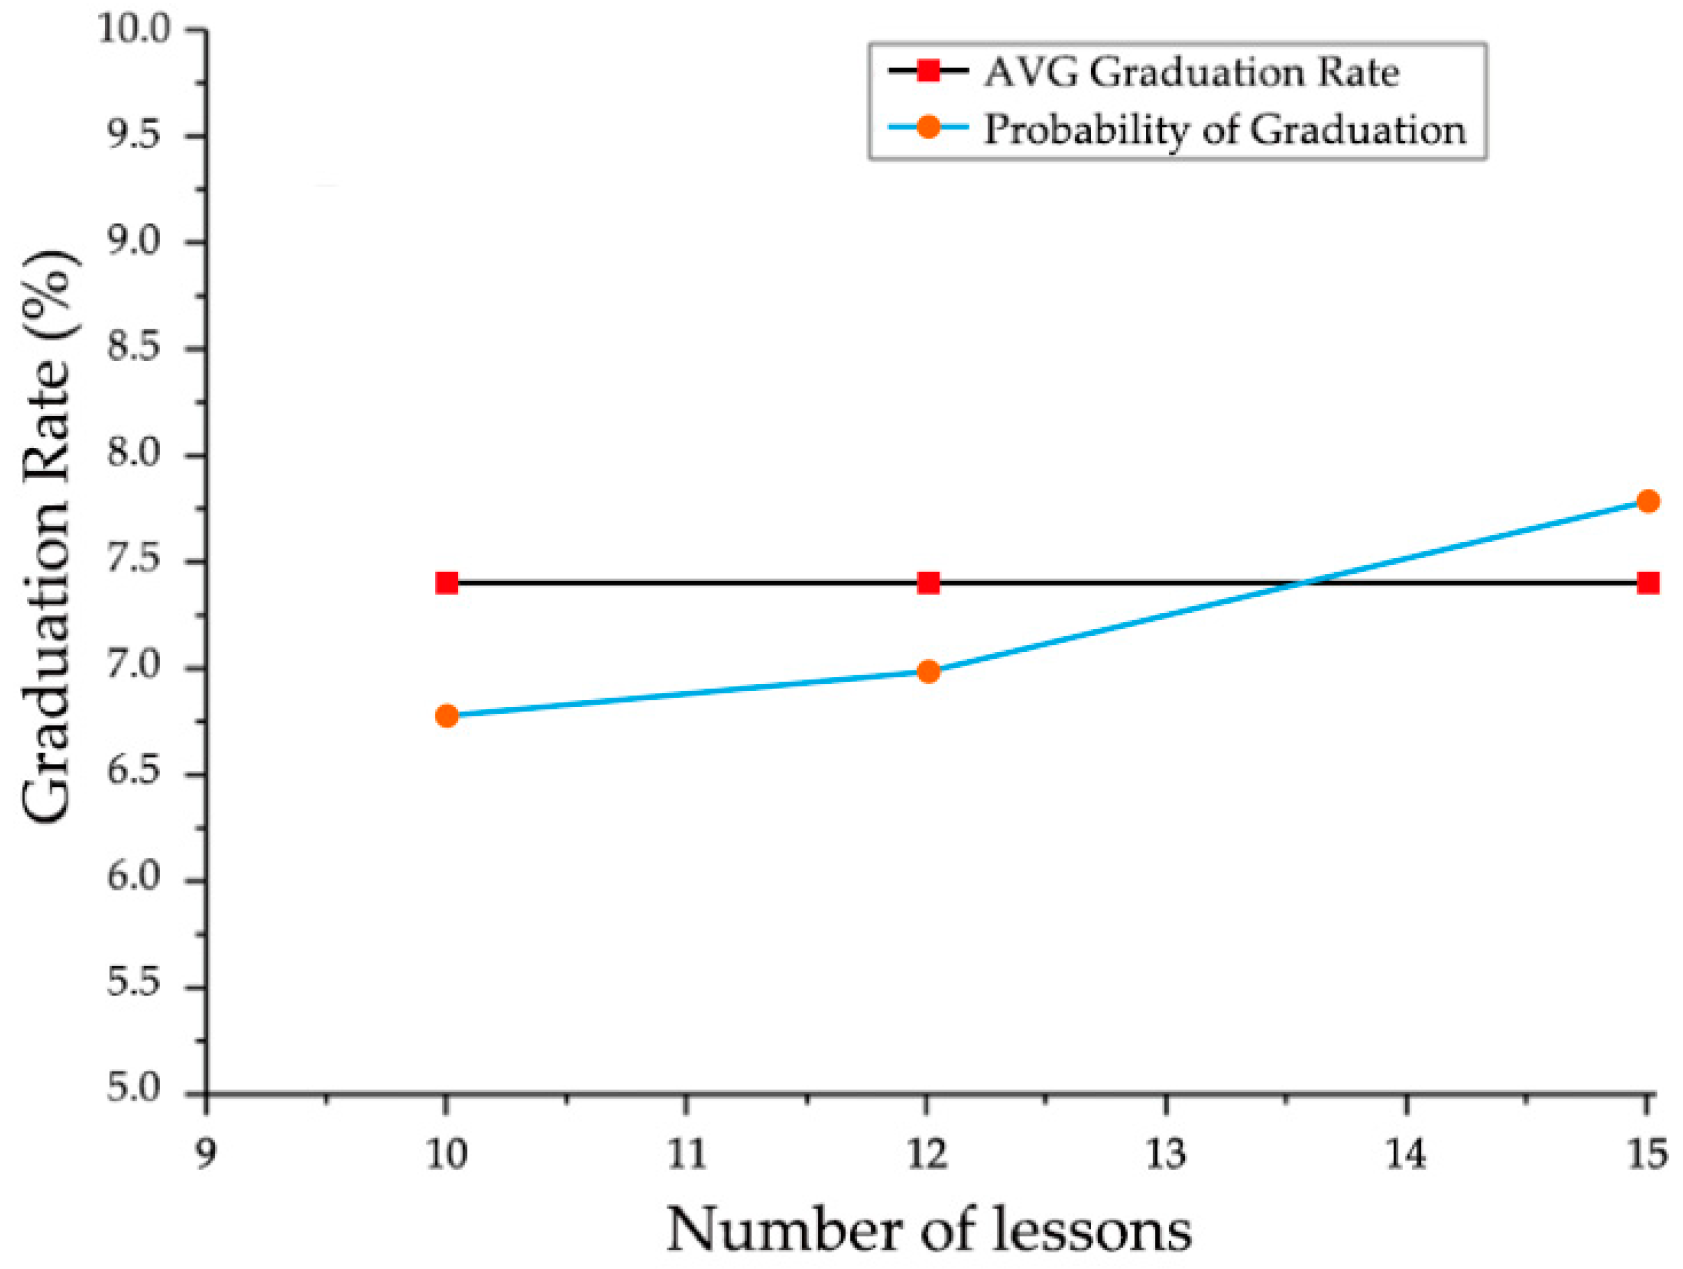
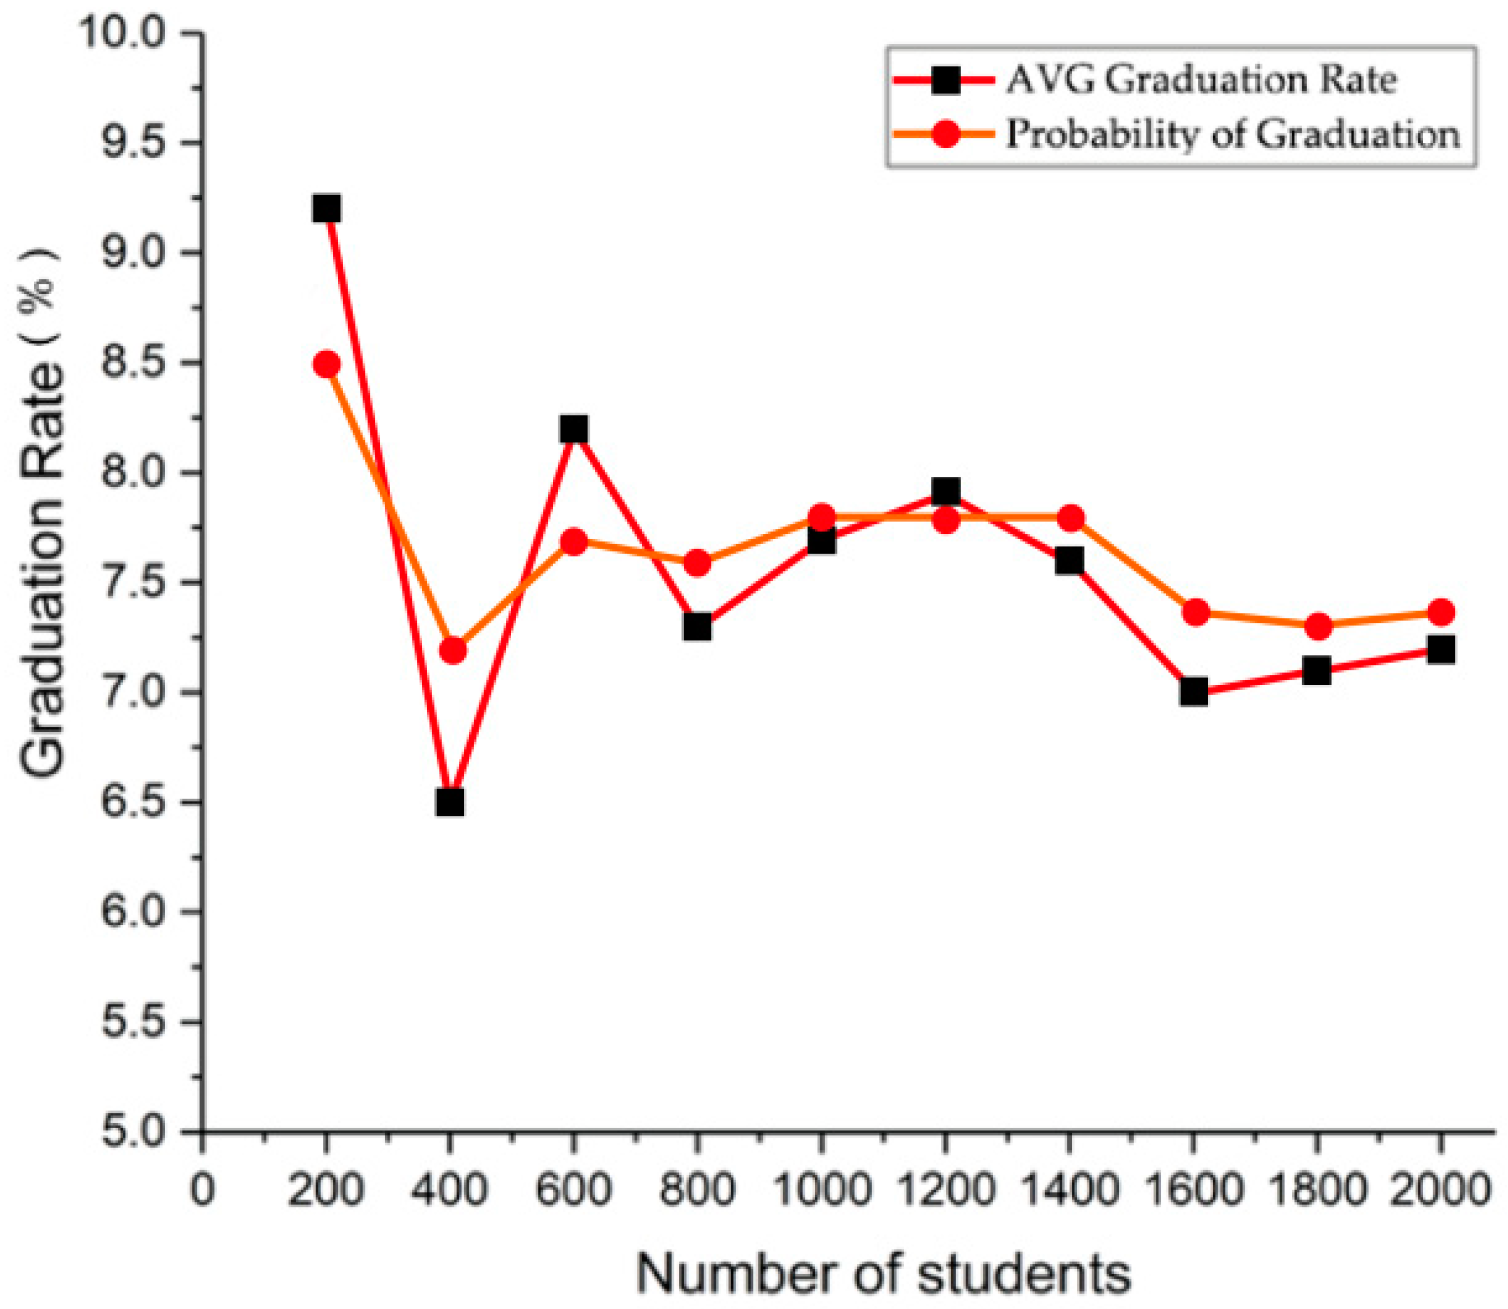
In this section, the learners’ graduation probability is calculated by machine learning functions and statistics on the ratio of positive and negative emotion are qualified. Then, we predict the graduation probability during the 10th, 12th and 15th lessons to compare prediction accuracy with the real graduation rate. As shown in Figure 9, the predictions of graduation probability are almost consistent with the real graduation rate, as shown in Figure 10. Therefore, we can infer that it is feasible to predict the graduation probability of learners by sentiment analysis. Furthermore, it is meaningful to improve MOOCs’ graduation rate by semantic analysis.
On the one hand, the real-time prediction of learners’ graduation probability by sentiment analysis is beneficial in order to provide the necessary interventions at the time when graduation probability significantly declines, which helps to improve graduation probability. On the other hand, supplying corresponding teaching guidance according to the differences of emotional tendencies provides crucial support to realize personalized teaching (for example, learners who tend to be disappointed need to be provided with basic courses, and learners who tend to be sad need to have enhanced communication and mutual assistance with others).
5.3. Analysis of MOOC Sustainable Development
It is undeniable that the quality education or traditional education mode provides students with a platform for learning and development, contributing greatly to social and scientific progress. However, learners hope to have more choices to learn or to receive personalized education with the progress of society and thirst for free development. Curriculum-based teaching that is centered on the educators and the books makes learners lack initiative in learning, which hardly achieves individual teaching and efficient learning. There are various signs suggesting that the traditional education model needs new technology to adapt to the sustainable development of education.
The emergence of MOOCs provides learners with more selective learning opportunities; they can choose courses according to their own interests. Thus, learners have a real sense of autonomy in learning and can develop individual learning plans according to their interests and their own development needs. From this point of view, it is undoubtedly successful because it provides a platform for mass learners to receive free education.
Even so, the low completion and graduation rates limit the sustainable development of MOOCs. How to keep learners’ interest and enthusiasm in learning, create an interactive and efficient online learning environment, and assist learners according to their individual differences are key issues affecting sustainable development. Therefore, it is important to take necessary measures in order to enhance MOOCs’ applicability and serviceability.
Statistical analysis shows that, although some learners with negative emotional tendencies are active in the courses, their average course completion and graduation rates are only 35.6% and 3.97%, respectively, much less than those of learners with positive emotional tendencies. Among active learners, 25.84% show sad and disappointed emotional tendencies in text data, constituting a large proportion, but their average graduation rate is far below average. Therefore, we believe that effective monitoring and customized instruction of these learners will be important in improving graduation probability.
Effective and accurate learner behavior monitoring and forecasting methods are conducive to developing a reasonable improvement of curriculum plans, and providing targeted intervention for learners, who have different learning environments, conditions, and needs. Furthermore, accurately predicting learners’ behaviors and graduation rates has benefits for teachers to grasp the overall applicability of courses in time, laying the foundation for the sustainable development of MOOCs.
6. Conclusions
In this paper, we proposed an SMA to detect learners’ multipolarity sentiments that is more conducive to monitoring emotional fluctuations to analyze the general rules of sentiment changes. We found that learners can be distinguished in terms of their emotional tendencies and course participation time series, and investigated the relationship between their emotional tendencies and learning effects. It was thought-provoking that “Active & Negative” learners had a higher course completion rate, but a lower course graduation rate, which established our research objectives. Reasonable personalized guidance for this group could improve the completion rate of MOOCs and graduation rates as a whole.
For the problem of low graduation rate, we proposed a method that can predict graduation probability in real time by analyzing learners’ sentiment changes, which can help to improve graduation probability by taking necessary interventions, and the experiment proved the availability of predicting by detecting learners’ sentiment changes.
Furthermore, many exciting new directions stem from this study. For example, we could predict learners’ emotional swings based on their emotional changes and offer negative learners a combination of courses to stimulate their enthusiasm for learning, which could help them complete the course. Thus, we are actively exploring adapting the techniques used in predicting learning behavior and offering combinations of courses they may be interested in, in order to provide reliable technical power for sustainable development.
Author Contributions
All authors contributed extensively to the work presented in this paper. L.W. developed the concept and drafted the manuscript. L.W. and G.H. designed and performed experiments and analysed data, and the revisions and case-study of this paper were led by T.Z.
Acknowledgments
This work was supported by the 2016 annual scientific research subject of the Higher Education Academy of Jilin Province (No. JGJX2016B13), by the National Natural Science Foundation of China (No. 61701104), and by the Science Research of Education Department of Jilin Province (No. JJKH20170108KJ).
Conflicts of Interest
The authors declare that there is no conflict of interest regarding the publication of this paper.
References
- Gruszka, K.; Rammel, C. Engaging Stakeholders in Education for Sustainable Development at University Level, 1st ed.; Springer: Cham, Switzerland, 2016; pp. 177–189. ISBN 9783319267340. [Google Scholar]
- Mader, C. How to assess transformative performance towards sustainable development in higher education institutions. J. Educ. Sustain. Dev. 2012, 6, 79–89. [Google Scholar] [CrossRef]
- Bañegil-Palacios, T.M.; Sánchez-Hernández, M.I. The Challenge to Foster Foreign Students’ Experiences for Sustainable Higher Educational Institutions. Sustainability 2018, 10, 495. [Google Scholar] [CrossRef]
- Pappano, L. The Year of the MOOC. The New York Times, 2 November 2012. [Google Scholar]
- Zhuhadar, L.; Kruk, S.R.; Daday, J. Semantically enriched massive open online courses (MOOCs) platform. Comput. Hum. Behav. 2015, 51, 578–593. [Google Scholar] [CrossRef]
- Miranda, S.; Mangione, G.R.; Orciuoli, F.; Gaeta, M.; Loia, V. Automatic generation of assessment objects and Remedial Works for MOOCs. In Proceedings of the 2013 International Conference on Information Technology Based Higher Education and Training (ITHET), Antalya, Turkey, 10–12 October 2013; pp. 1–8. [Google Scholar]
- Bansal, S.K.; Kagemann, S. Integrating big data: A semantic extract-transform-load framework. Computer 2015, 48, 42–50. [Google Scholar] [CrossRef]
- Piedra, N.; Chicaiza, J.A.; López, J.; Tovar, E. An Architecture based on Linked Data technologies for the Integration and reuse of OER in MOOCs Context. Open Praxis 2014, 6, 171–187. [Google Scholar] [CrossRef]
- Del Mar Sánchez-Vera, M.; Prendes-Espinosa, M.P. Beyond objective testing and peer assessment: Alternative ways of assessment in MOOCs. Int. J. Educ. Technol. Higher Educ. 2015, 12, 119–130. [Google Scholar] [CrossRef]
- Li, C.; Zhou, H. Enhancing the Efficiency of Massive Online Learning by Integrating Intelligent Analysis into MOOCs with an Application to Education of Sustainability. Sustainability 2018, 10, 468. [Google Scholar] [CrossRef]
- McAuley, A.; Stewart, B.; Siemens, G.; Cormier, D. The MOOC Model for Digital Practice; University of Prince Edward Island: Charlottetown, PE, Canada, 2010. [Google Scholar]
- Friedman, T. Revolution hits the universities. The New York Times, 26 January 2013. [Google Scholar]
- Yuan, L.; Powell, S. MOOCs and Open Education: Implications for Higher Education; JISC CETIS: Bolton, UK, 2013. [Google Scholar]
- Eriksson, T.; Adawi, T.; Stöhr, C. “Time is the bottleneck”: A qualitative study exploring why learners drop out of MOOCs. J. Comput. High. Educ. 2017, 29, 133–146. [Google Scholar] [CrossRef]
- Rai, L.; Chunrao, D. Influencing factors of success and failure in MOOC and general analysis of learner behavior. Int. J. Inf. Educ. Technol. 2016, 6, 262–268. [Google Scholar] [CrossRef]
- Tucker, C.; Pursel, B.K.; Divinsky, A. Mining student-generated textual data in MOOCs and quantifying their effects on student performance and learning outcomes. Comput. Educ. J. 2014, 5, 84–95. [Google Scholar]
- Chaplot, D.S.; Rhim, E.; Kim, J. Predicting Student Attrition in MOOCs using Sentiment Analysis and Neural Networks. In Proceedings of the AIED 2015 Fourth Workshop on Intelligent Support for Learning in Groups, Madrid, Spain, 22–26 June 2015. [Google Scholar]
- Wen, M.; Yang, D.; Rose, C. Sentiment Analysis in MOOC Discussion Forums: What does it tell us? In Proceedings of the Educational Data Mining, London, UK, 4–7 July 2014. [Google Scholar]
- Emanuel, E.J. Online education: MOOCs taken by educated few. Nature 2013, 503, 342. [Google Scholar] [CrossRef] [PubMed]
- Guo, X.; Sun, H.; Zhou, T.; Wang, L.; Qu, Z.; Zang, J. SAW Classification Algorithm for Chinese Text Classification. Sustainability 2015, 7, 2338–2352. [Google Scholar] [CrossRef] [Green Version]
- Janhonen-Abruquah, H.; Topp, J.; Posti-Ahokas, H. Educating Professionals for Sustainable Futures. Sustainability 2018, 10, 592. [Google Scholar] [CrossRef]
- Vettori, O.; Rammel, C. Sustainable Development and Quality Assurance in Higher Education, 1st ed.; Palgrave Macmillan: London, UK, 2014; pp. 49–65. ISBN 9781137459145. [Google Scholar]
- Mader, C.; Scott, G.; Abdul Razak, D. Effective change management, governance and policy for sustainability transformation in higher education. Sustain. Account. Manag. Policy J. 2013, 4, 264–284. [Google Scholar] [CrossRef]
- Salvioni, D.M.; Franzoni, S.; Cassano, R. Sustainability in the Higher Education System: An Opportunity to Improve Quality and Image. Sustainability 2017, 9, 914. [Google Scholar] [CrossRef]
- Brito, R.M.; Rodríguez, C.; Aparicio, J.L. Sustainability in Teaching: An Evaluation of University Teachers and Students. Sustainability 2018, 10, 439. [Google Scholar] [CrossRef]
- Zheng, M.; Chu, C.-C.; Wu, Y.J.; Gou, W. The Mapping of On-Line Learning to Flipped Classroom: Small Private Online Course. Sustainability 2018, 10, 748. [Google Scholar] [CrossRef]
- Sun, G.; Cui, T.; Beydoun, G.; Chen, S.; Dong, F.; Xu, D.; Shen, J. Towards Massive Data and Sparse Data in Adaptive Micro Open Educational Resource Recommendation: A Study on Semantic Knowledge Base Construction and Cold Start Problem. Sustainability 2017, 9, 898. [Google Scholar] [CrossRef]
- Lozano, R.; Merrill, M.Y.; Sammalisto, K.; Ceulemans, K.; Lozano, F.J. Connecting Competences and Pedagogical Approaches for Sustainable Development in Higher Education: A Literature Review and Framework Proposal. Sustainability 2017, 9, 1889. [Google Scholar] [CrossRef]
- Ong, B.S.; Grigoryan, A. MOOCs and universities: Competitors or partners? Int. J. Inf. Educ. Technol. 2015, 5, 373. [Google Scholar] [CrossRef]
- Raffaghelli, J.E.; Cucchiara, S.; Persico, D. Methodological approaches in MOOC research: Retracing the myth of Proteus. Br. J. Educ. Technol. 2015, 46, 488–509. [Google Scholar] [CrossRef]
- Sandeen, C. Integrating MOOCs into traditional higher education: The emerging “MOOC 3.0” era. Chang. Mag. High. Learn. 2013, 45, 34–39. [Google Scholar] [CrossRef]
- Kizilcec, R.F.; Piech, C.; Schneider, E. Deconstructing disengagement: Analyzing learner subpopulations in massive open online courses. In Proceedings of the Third International Conference on Learning Analytics and Knowledge, Leuven, Belgium, 8–12 April 2013; pp. 170–179. [Google Scholar]
- Margaryan, A.; Bianco, M.; Littlejohn, A. Instructional quality of massive open online courses (MOOCs). Comput. Educ. 2015, 80, 77–83. [Google Scholar] [CrossRef]
- Zhou, T.H.; Wang, L.; Ryu, K.H. Supporting Keyword Search for Image Retrieval with Integration of Probabilistic Annotation. Sustainability 2015, 7, 6303–6320. [Google Scholar] [CrossRef] [Green Version]
- Alshuwaikhat, H.M.; Abubakar, I.R.; Aina, Y.A.; Adenle, Y.A.; Umair, M. The Development of a GIS-Based Model for Campus Environmental Sustainability Assessment. Sustainability 2017, 9, 439. [Google Scholar] [CrossRef]
- Hoy, M.B. MOOCs 101: An introduction to massive open online courses. Med. Ref. Serv. Q. 2014, 33, 85–91. [Google Scholar] [CrossRef] [PubMed]
- Gordon, N.; Brayshaw, M. Requirements capture analysis for MOOCS in higher education. In Furthering Higher Education Possibilities through Massive Open Online Courses; IGI Global: Hershey, PA, USA, 2015; pp. 107–124. [Google Scholar]
- Wilson, T.; Wiebe, J.; Hoffmann, P. Recognizing contextual polarity: An exploration of features for phrase-level sentiment analysis. Comput. Linguist. 2009, 35, 399–433. [Google Scholar] [CrossRef]
- Veletsianos, G.; Collier, A.; Schneider, E. Digging deeper into learners’ experiences in MOOCs: Participation in social networks outside of MOOCs. Notetaking and contexts surrounding content consumption. Br. J. Educ. Technol. 2015, 46, 570–587. [Google Scholar] [CrossRef]
- Turney, P.D.; Littman, M.L. Measuring praise and criticism: Inference of semantic orientation from association. ACM Trans. Inf. Syst. (TOIS) 2003, 21, 315–346. [Google Scholar] [CrossRef]
- Stevenson, R.A.; Mikels, J.A.; James, T.W. Characterization of the Affective Norms for English Words by discrete emotional categories. Behav. Res. Methods 2007, 39, 1020–1024. [Google Scholar] [CrossRef] [PubMed] [Green Version]
- Kumar, A.; Teeja, M.S. Sentiment analysis: A perspective on its past, present and future. Int. J. Intell. Syst. Appl. 2012, 4, 1–14. [Google Scholar] [CrossRef]
- Dey, L.; Haque, S.M. Opinion mining from noisy text data. Int. J. Doc. Anal. Recognit. (IJDAR) 2009, 12, 205–226. [Google Scholar] [CrossRef]
- Pang, B.; Lee, L. Opinion mining and sentiment analysis. Found. Trends Inf. Retr. 2008, 2, 1–135. [Google Scholar] [CrossRef]
- Lee, H.; Chang, A.; Peirsman, Y.; Chambers, N.; Surdeanu, M.; Jurafsky, D. Deterministic coreference resolution based on entity-centric, precision-ranked rules. Comput. Linguist. 2013, 39, 885–916. [Google Scholar] [CrossRef]
- Kim, D.S.; Kim, J.W. Public opinion sensing and trend analysis on social media: A study on nuclear power on Twitter. Int. J. Multimed. Ubiquitous Eng. 2014, 9, 373–384. [Google Scholar] [CrossRef]
- Nagao, M. Special Issue: “Collection of Best Annual Papers” Organized for the 20th Anniversary of the Association for Natural Language Processing. J. Nat. Lang. Process. 2014, 21, 617–618. [Google Scholar] [CrossRef] [Green Version]
- Martínez-Cámara, E.; Martín-Valdivia, M.T.; Urena-López, L.A. Sentiment analysis in Twitter. Nat. Lang. Eng. 2014, 20, 1–28. [Google Scholar] [CrossRef]
- Tai, K.S.; Socher, R.; Manning, C.D. Improved Semantic Representations from Tree-Structured Long Short-Term Memory Networks. Comput. Sci. 2015, 5, 36–37. [Google Scholar] [CrossRef]
- Tai, C.H.; Tan, Z.H.; Chang, Y.S. Systematical approach for detecting the intention and intensity of feelings on social network. IEEE J. Biomed. Health Inform. 2016, 20, 987–995. [Google Scholar] [CrossRef] [PubMed]
Figure 1.
Application of semantic analysis and machine learning.

Figure 2.
Flowchart of semantic analysis model and prediction.

Figure 3.
Eight-dimensional emotional feature vectors.

Figure 4.
Graduation probability prediction for different time intervals.

Figure 5.
(a) course viewing participation time series (CVPTS); (b) course comments participation time series (CCPTS); (c) course Q&A participation time series (CQPTS); (d) course @teacher participation time series (CTPTS); (e) course @other learners participation time series (COPTS); (f) AND-logic course participation time series (ACPTS) in course viewing, comments, Q&A, @teacher and @other learners.

Figure 6.
(a) ACPTS of touring; (b) ACPTS of sampling.

Figure 7.
The four kinds of learners’ average completion rate, average scores and average graduation rate.
Figure 7.
The four kinds of learners’ average completion rate, average scores and average graduation rate.

Figure 8.
The four kinds of learners’ average completion rate, average scores and average graduation rate.
Figure 8.
The four kinds of learners’ average completion rate, average scores and average graduation rate.

Figure 9.
Predict graduation probabilities by 10th, 12th and 15th lessons, and graduation rate comparison.
Figure 9.
Predict graduation probabilities by 10th, 12th and 15th lessons, and graduation rate comparison.

Figure 10.
Graduation probability and graduation rate comparison.


Table 1.
Classification of learners.
| Classification | Characteristic |
|---|---|
| Auditing | Taking course, but hardly participated in discussion and comments |
| Completing | Watching most courses and participating in most assignments |
| Disengaging | Appearing only at the beginning of the course |
| Sampling | Using course only at different stages of the course |
Table 2.
Definition of main symbols.
| Symbol | Definition |
|---|---|
| U | Set of untreated learners |
| B | Set of treated learners |
| Li’ | The i’th learner |
| t | Time node up to n’ |
| Pc(t) | Course participation situation of time node t |
| ACPTS | Course participation AND-logic operating on time series |
| rv | Regional vacancies of ACPTS |
| p(si) | Emotional quantification value of sentence si |
| wj | jth sentiment word of sentence si |
| εk | kth adverb of degree |
| μ | Negative adverb |
| σ | Adversative |
| ω | Emotional punctuation |
| δ | Emoticon |
| vt | Emotional feature vector |
| pst | Maximum of some polarity emotion pst of vt |
| Et | Learners’ emotional tendency |
Table 3.
Classification of MOOC learners.
| Classification | Characteristic |
|---|---|
| Active& Negative | Attend course; participate in discussions, comments, and examinations; and perform more negatively; complete studying most lessons of the course |
| Active& Positive | Attend course; participate in discussions, comments, and examinations; and perform more positively; complete studying most lessons of the course |
| Touring | Appear only at the beginning of the course |
| Sampling | Attend course at different stages; rarely participate in discussions, comments, and examinations |
Table 4.
Learning statistical magnitude.
| Index | Average | Unit |
|---|---|---|
| Course completion rate | 43% | percent |
| Homework completion rate | 23% | percent |
| Comments | 4.92 | times |
| Question participation | 7.16 | times |
| @teacher | 0.35 | times |
| @other learners | 0.77 | times |
| Discussion initiating | 3.33 | times |
| Discussion replying | 5.24 | times |
| Exam grade | 65.78 | centesimal |
| Graduation certificate | 0.07 | times |
Table 5.
Emotional learners’ learning statistical magnitude.
| Learners Group | Average Completion | Average Score | Average Graduation | Proportion |
|---|---|---|---|---|
| Active & Positive | 78.32% | 76.84 | 22.81% | 12.65% |
| Active & Negative | 35.60% | 44.94 | 3.97% | 6.70% |
| Sampling | 33.22% | 13.84 | 0% | 39.95% |
| Touring | 7.34% | 0 | 0% | 24.90% |
Table 6.
Refined learners’ learning statistical magnitude.
| Learners Group | Average Completion | Average Score | Average Graduation | Proportion |
|---|---|---|---|---|
| Happy | 79.62% | 84.34 | 24.73% | 50.90% |
| In love | 68.88% | 81.42 | 17.24% | 7.49% |
| Proud | 82.13% | 84.41 | 16.66% | 4.65% |
| Surprised | 55.67% | 72.14 | 11.11% | 2.33% |
| Sad | 35.78% | 35.21 | 3.70% | 13.95% |
| Disappointed | 38.96% | 33.25 | 4.35% | 11.89% |
| Angry | 36.96% | 38.23 | 3.45% | 5.68% |
| Scared | 42.13% | 40.05 | 4.66% | 3.10% |
Table 7.
Semantic analysis accuracy.
| Method | Precision | Recall | F1_Measure |
|---|---|---|---|
| SMA | 0.76 | 0.94 | 0.84 |
| SeNTU | 0.71 | 0.87 | 0.78 |
| LSTM | 0.69 | 0.82 | 0.75 |
© 2018 by the authors. Licensee MDPI, Basel, Switzerland. This article is an open access article distributed under the terms and conditions of the Creative Commons Attribution (CC BY) license (http://creativecommons.org/licenses/by/4.0/).
Share and Cite
MDPI and ACS Style
Wang, L.; Hu, G.; Zhou, T. Semantic Analysis of Learners’ Emotional Tendencies on Online MOOC Education. Sustainability 2018, 10, 1921. https://doi.org/10.3390/su10061921
AMA Style
Wang L, Hu G, Zhou T. Semantic Analysis of Learners’ Emotional Tendencies on Online MOOC Education. Sustainability. 2018; 10(6):1921. https://doi.org/10.3390/su10061921
Chicago/Turabian StyleWang, Ling, Gongliang Hu, and Tiehua Zhou. 2018. "Semantic Analysis of Learners’ Emotional Tendencies on Online MOOC Education" Sustainability 10, no. 6: 1921. https://doi.org/10.3390/su10061921
Note that from the first issue of 2016, this journal uses article numbers instead of page numbers. See further details here.