Next Article in Journal
Diffusion of Corporate Philanthropy in Social and Political Network Environments: Evidence from China
Next Article in Special Issue
Coordinating the Dynamic Development of Energy and Industry in Composite Regions: An I-SDOP Analysis of the BTH Region
Previous Article in Journal
Mapping Satellite Inherent Optical Properties Index in Coastal Waters of the Yucatán Peninsula (Mexico)
Previous Article in Special Issue
Dynamic Economic Analysis of Subsidies for New and Renewable Energy in South Korea
 
 
Erratum published on 21 March 2019, see Sustainability 2019, 11(6), 1710.
Article

Evaluating Consistency in Environmental Policy Mixes through Policy, Stakeholder, and Contextual Interactions

1
Science Policy Research Unit (SPRU), Brighton BN1 9SL, UK
2
Department of Industrial Management and Technology, University of Piraeus, 18534 Piraeus, Greece
3
JIN Climate and Sustainability, 9711 BB Groningen, The Netherlands
4
Joanneum Research, 8010 Graz, Austria
5
Climate Policy Group, ETH Zürich, 8092 Zürich, Switzerland
*
Author to whom correspondence should be addressed.
Sustainability 2018, 10(6), 1896; https://doi.org/10.3390/su10061896
Submission received: 16 April 2018 / Revised: 22 May 2018 / Accepted: 28 May 2018 / Published: 6 June 2018

Abstract

:
This paper introduces a method to analyse and explore consistency within policy mixes in order to support the policymaking cycle and applies it to energy and climate change policies in the United Kingdom (UK) biofuels policy context. The first part of the paper introduces a multi-level method to evaluate consistency within policy mixes implemented over a period of time. The first level explores consistency across policy design features in policy mixes. The second level evaluates how stakeholders, and their interactions with policy instruments and each other, can impact consistency within a given context. These interactions influence the implementation of policies and can lead to unintended outcomes that fail to meet the overarching goals. In the second part of the paper, we apply our method to the UK biofuels policy mix, to explore a sector that cuts across the policy areas of transportation, energy, land-use, air, and climate change. Our analysis demonstrates how, by overlooking complex interactions in the design and implementation of policies in the biofuels sector, policy mixes have conflicted with the development of a potential low-carbon technology.

1. Introduction

Particular challenges that policy makers face when designing policies to solve complex problems, are that policy instruments (PI) do not exist in isolation; they are instead, part of a wider context, interacting with other PIs through the responses of targeted stakeholders. In some policy areas, such as energy and climate policy, interactions will become even more important as an increasing diversity of stakeholders, including citizens, need to be involved. Although these aspects may be acknowledged, there are limited methods applied that account for complex policy and human interactions in the policy making and implementation process [1,2]. Policies are often designed and implemented in isolation by a government body to address a specific issue, without sufficiently considering how the proposed PI could interact with an existing policy mix. The existing policy mix is, in turn, comprised of many policies that have been designed by various government bodies, across a number of sectors that typically do not consciously consider the policy interactions [3]. Attention is usually given to understanding policy interactions after policies are implemented and unintended negative outcomes have begun to emerge [4,5].
These unintended outcomes are usually a result of contradicting policy objectives, or PIs that have not sufficiently accounted for how they impact stakeholders within a dynamic context. Newly proposed PIs usually consider how they impact those stakeholders that are directly targeted by the PI; however, few PIs are designed to take into account how directly targeted stakeholders may interact with other policies in the existing policy mix, as well as other stakeholder groups (in society, government, businesses, etc.) [6,7].
This paper aims to help policy researchers and policy makers to improve their knowledge base and to better support the policy making process. Assessing the whole policy mix rather than individual policies helps to understand the unintended policy impacts in real-world situations. In order to meet overarching goals, policy mixes need to be consistent in terms of their policy objectives and impact on stakeholders. However, there is a lack of practical methods and tools that are available to assess the consistency of policy mixes implemented in reality [6,8]. Current methods primarily focus on a theoretical analysis of policy design features [9,10,11,12,13]. We introduce a multi-level method to address the seldomly studied area of evaluating policy and stakeholder interactions in policy mixes within a dynamic context. Lessons from evaluating the consistency in policy mixes can contribute to the policy redesign phase for both ex-ante and ex-post policy applications. This learning can support the design of more consistent and effective policies that achieve the overarching policy goals.
This paper begins by introducing the concept of consistency and describes the role of stakeholders and the context in a policy mix. The second section presents the key contributions of the study in relation to the policy making cycle and it provides key definitions for the study. The third section carried out a literature review on policy interactions analysis and it identifies gaps in the literature that we address in this paper. The forth section presents a multi-level method for evaluating consistency in policy mixes, whilst the fifth section describes how the boundaries of the UK biofuels policy mix have been defined for this study. The sixth section applies the multi-level method for evaluating policy consistency to the United Kingdom (UK) biofuels policy mix, by exploring the interactions between policy design features and assessing the interactions resulting from policies, stakeholders and the context. The case study intends to demonstrate the application of the proposed method, rather than providing an in-depth analysis of UK biofuels policies. The final section concludes with a summary, updates on the biofuels sector, and reflections on broader policy implications.

2. Understanding the Policy Making Process, Consistency, and Stakeholders in a Context

This study presents a method for evaluating the outcomes of policy mixes that were implemented within the policy making cycle. The policy making cycle broadly consists of several key stages, including: problem definition and agenda setting, policy implementation, and policy evaluation [14]. Although the policy process is often depicted as a one-directional cycle, in practice, processes can move in multiple directions and sometimes take shortcuts, especially if the policy builds on previous efforts. We propose an additional stage in the policy process, ‘policy redesign’, which explicitly considers the policy mix and learning feedback loops between stages of the policy making process (see Figure 1).
We introduce a multi-level method to assess consistency in policy mixes with a focus on two core aspects of the policy making cycle: policy evaluation and policy redesign. The first level theoretically assesses the interactions of policy design features for overall consistency in the policy mix. The second level evaluates the consistency of implemented policies while considering interactions between stakeholders, policies, and the given context. The results can inform and support the design of new policies that have higher prospects of achieving their desired goals. Additionally, knowledge gained from the consistency analysis can also help to improve existing policies that have not been performing as expected through policy redesign.
Policy mixes are defined as complex institutional configurations with multiple goals and means. Policy instruments (PIs) are the units of analysis within a policy mix and evolve as they are implemented over time [15]. PIs are designed to directly promote a specific innovation (e.g., biofuels technologies), or are designed for other purposes, but they indirectly impact the innovation outcomes (e.g., higher air quality standards indirectly promote biofuels).
Successful policies depend mainly on the ability of policy makers and stakeholders from the public and private sectors, to reach and to enforce consistent agreements across all policy domains. The Organisation for Economic Co-operation and Development (OECD) describes ‘the agreement’ as policy coherence that is associated with public policy processes. Policy coherence can include harmonization, coordination, and cooperation procedures across government departments and agencies. From a sustainability perspective, policy coherence aims to align incentives with sustainability objectives, working both vertically across levels of government and horizontally across different actors and governance levels [3].
Policy consistency, on the other hand, is considered to be the absence of contradiction between individual policy objectives and PI goals [16]. Thus, when considering the OECD definition in the context of sustainability, policy consistency reflects the extent to which an environmental policy objective and a PI goal is in line within wider policy priorities, and is therefore compatible with sustainability goals. This paper will focus on policy consistency rather than coherence, as coherence explores the harmonisation of institutions and procedure in public policy processes. We propose that policy consistency can first be explored in the PI mix, which then can further inform policy coherence in the public policy process.
In this study, consistency is referred to as the state of the policy design elements within a policy mix [17]. The design of a policy can include the policy objectives, scope, technologies, and target stakeholder groups. Consistency analysis explores how a policy instrument and its design elements can interact with other policies and their design elements, which can change over time, but remains aligned with overarching policy strategies. Understanding policy interactions in a policy mix requires the consideration of aspects, such as targets, timing, operation, and implementation processes [1].
Exploring stakeholder responses that are induced by policy mixes is crucial for understanding interactions between stakeholders and policies. Stakeholders’ responses can determine the outcomes of PIs and the overall consistency of the mix, and here, this paper adds to existing knowledge. We define stakeholders in a policy mix based on three stakeholder categories defined by Albu and Griffith’s [8] market map concept. The first group of stakeholders are ‘supply chain stakeholders’ and include the chain of economic stakeholders from primary producers to final consumers. The next group are ‘service providers’ and include the business services that support the market operations (e.g., banks, legal advisors). The last group are ‘enabling/inhibiting environment stakeholders’ and comprise of organisations or institutions that are involved in the policy processes that shape the market environment [18,19].
When responding to a policy mix, stakeholders may be confronted by multiple PIs, thus their responses to a policy mix may be different from the intended response to a single PI [2]. Overlooking stakeholders’ response as well as the context and policy processes could result in policy mixes that are theoretically consistent in terms of policy design, but are inconsistent in practice [6,7]. Additionally, understanding the policy context and identifying the uncertainties that are involved in the economic, environmental, technological, and political contextual background of a country is crucial for the effective implementation of climate change policies [20,21,22].

3. Review of Literature on Policy Interactions and Policy Context Analysis

Policy interactions have been studied since the early 1950s as part of research on policy mixes and methods of assessing how the co-existence of policy instruments can be used to improve social welfare [23,24]. Analysis on policy mixes and the interactions of PIs was largely applied in economics. The focus was primarily on understanding the interactions between fiscal and monetary policies and how these interactions would change in regimes with fixed or flexible exchange rates [25,26]. During the 1970s and 1980s, research on interactions between policy instruments was developed further, by, among others, Wildavsky [27] and Majone [4]. Wildavsky described the internal interactions of PIs within a policy mix as an important means of policy development. Majone used the term ‘congestion’ to illustrate the internal impacts and problems resulting from “policy overlaps, jurisdictional conflicts and unanticipated consequences” [4,5]. Yet, despite the growing recognition of policy interactions, up until the 1990s, most research focused on how policy interactions would affect the effectiveness of individual PIs, rather than the performance of the policy mix as a whole [5].
Since the 1990s, there has been an increasing research focus on interactions between environmental policies [1]. The INTERACT project (2001–2003) (INTERACT (Interaction in European Union (EU) Climate Policy) was funded by the EU 5th Framework Programme) drew greater attention to environmental policy interaction studies by examining interactions between the EU Emissions Trading Scheme and other climate and energy PIs in Member States [1]. Since then, there have been other studies examining policy interactions within the energy and climate area [28,29,30]. For instance, several studies analyse the theoretic interactions that could occur between PIs [9,10,11], while some studies explore policy interactions between policy measures using network analysis and multi-criteria decision analysis [31].
Other studies first examine policy interactions, and subsequently examine how the policy interactions impact stakeholders [32,33]. Policy interactions also need to explicitly consider the context rather than evaluating policy mixes in a theoretical vacuum. In essence, PIs are introduced through plans and strategies grounded in the context that policy makers are required to act [6]. Additionally, the variation of implementation styles in PI mixes reveal that policy selection and implementation are characterised by historical developments and procedural elements [34,35].
Most policy interaction studies focus on an analysis of policy instrument’s (PI’s) design features to identify overlaps among them that may lead to policy interactions [12,13], but only a few consider interactions within and across different stakeholder groups [8]. One of the major aims of this paper is to gain a better understanding of the potentially enabling or inhibiting factors of the policy mix given complex stakeholder interactions and the responses to policies.

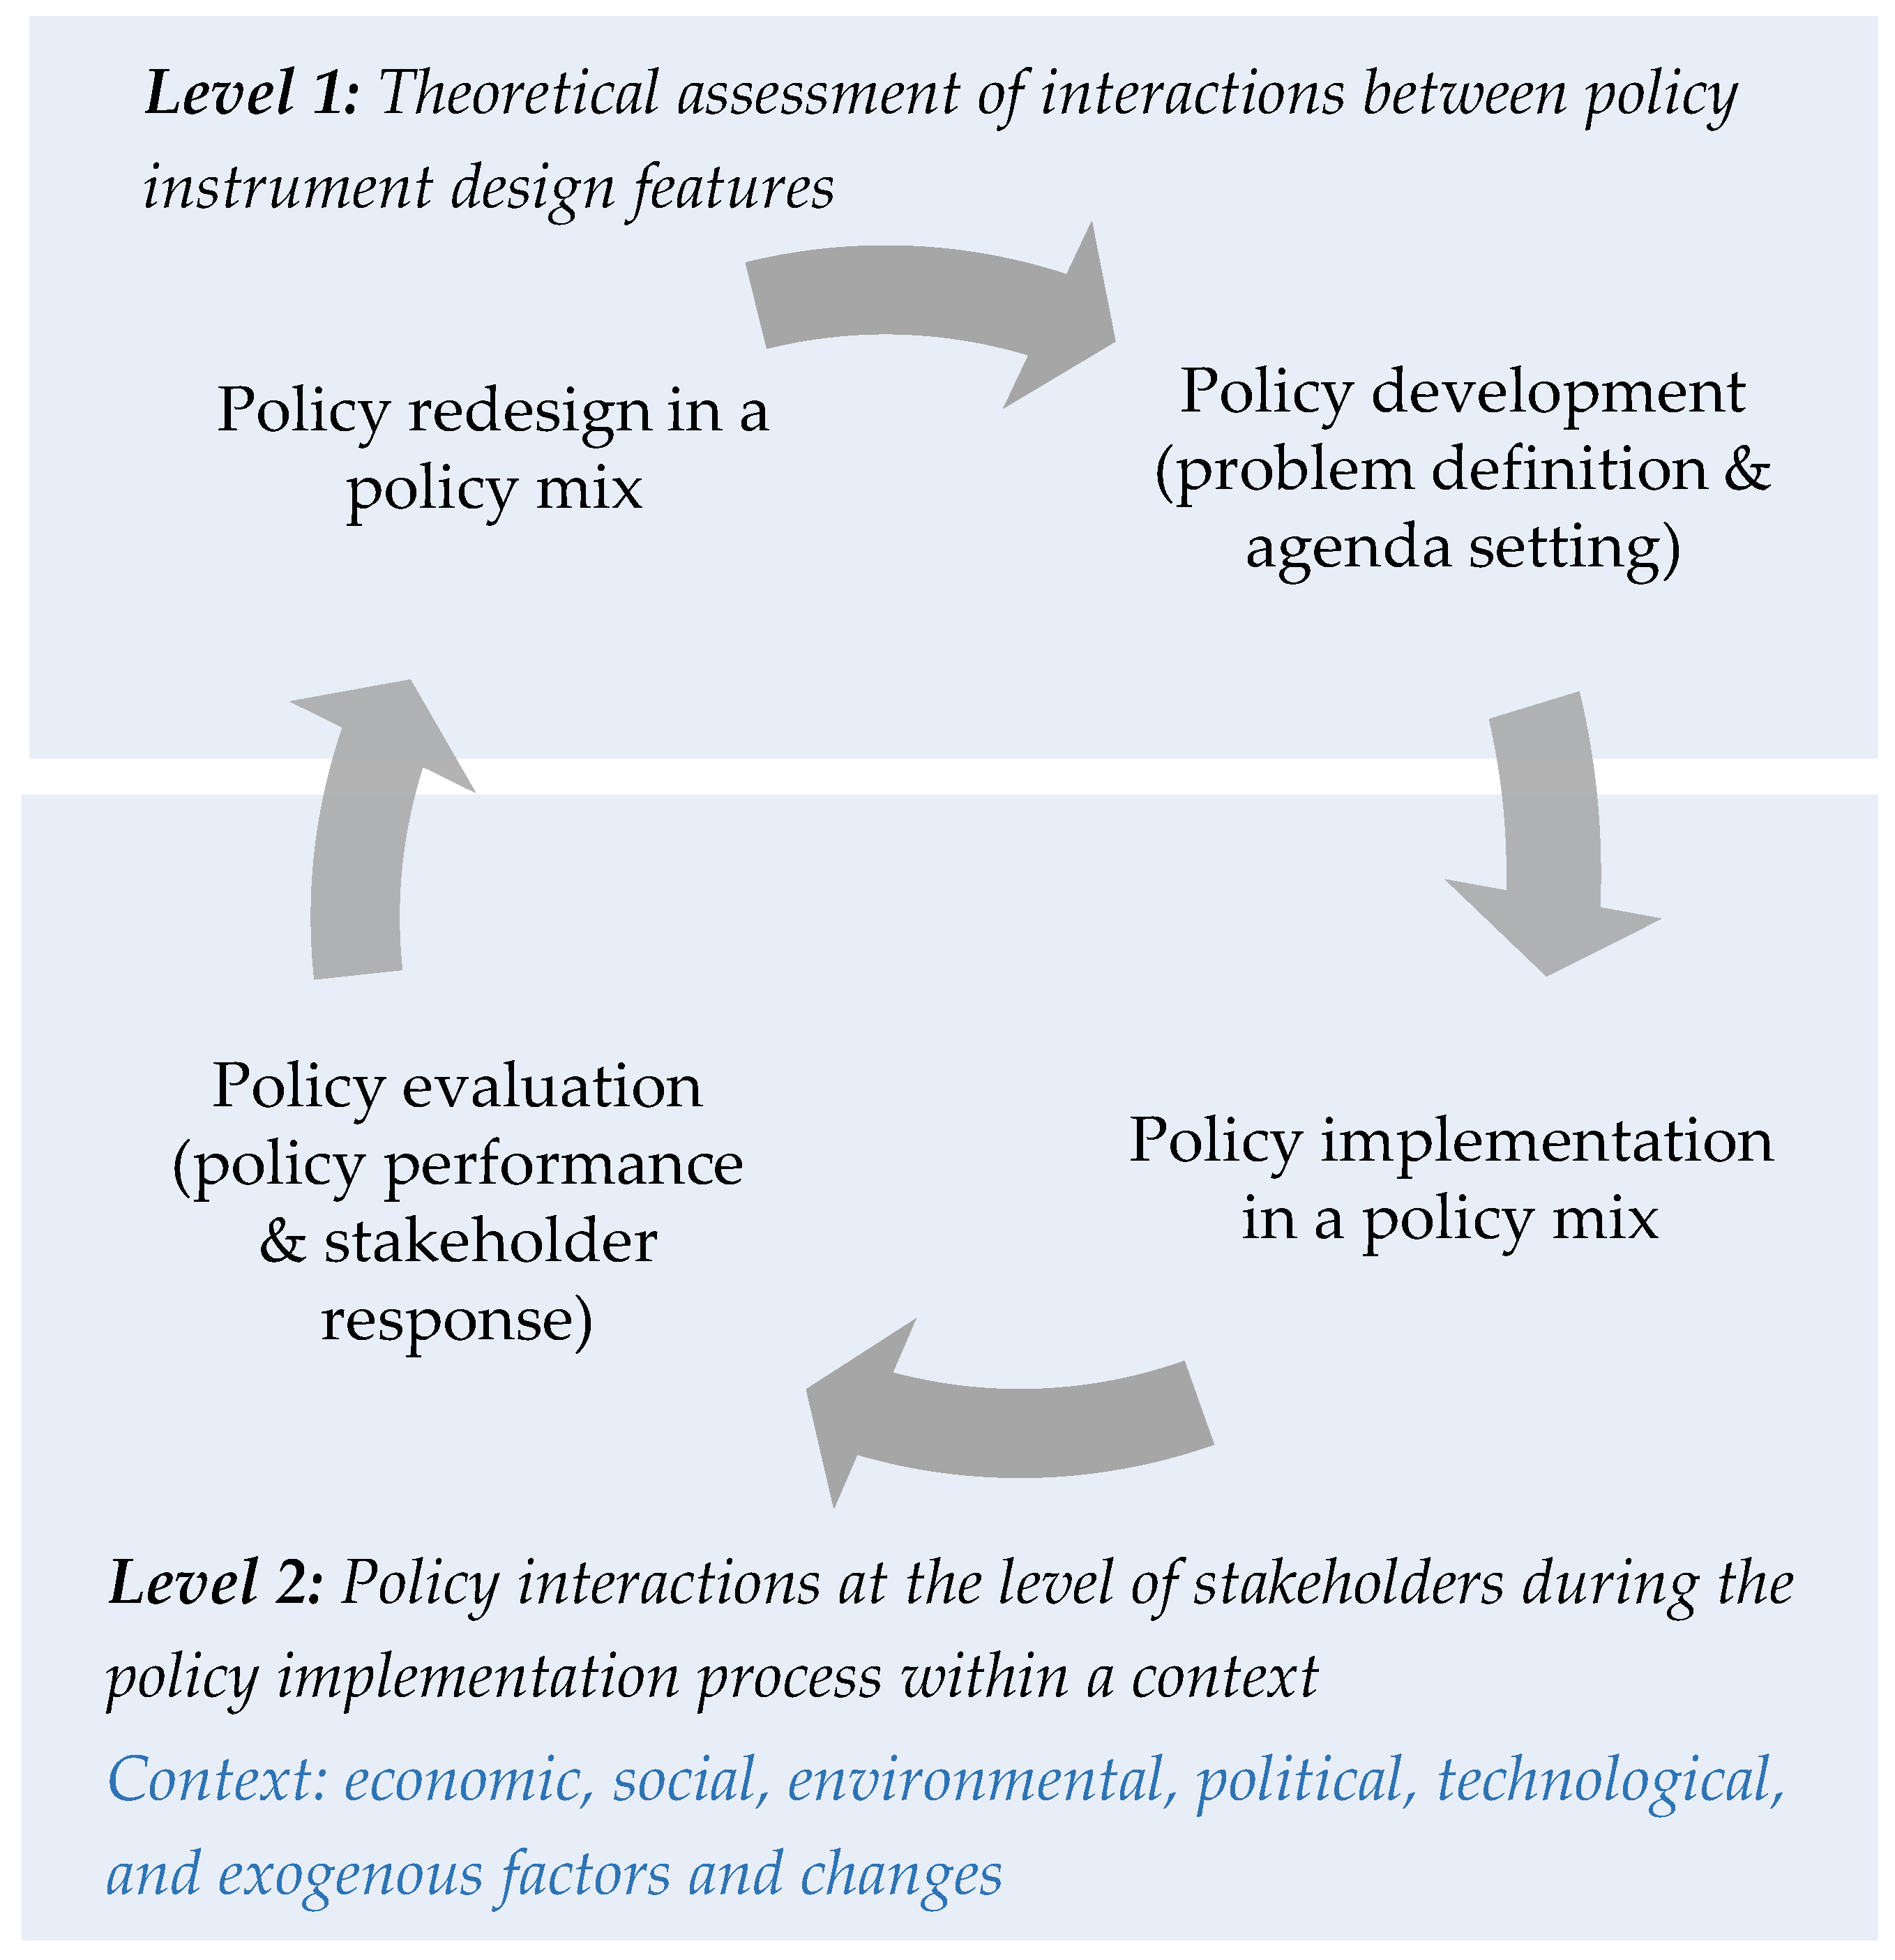
4. Introducing a Multi-Level Methodology for Evaluating Consistency in Policy Mixes

Most studies evaluating policy mixes discuss interactions between policy design elements [9,10,11], but do not explore in depth policy interactions with varied stakeholder groups and the broader context. Our study examines both the design features of policy interactions as well as the interactions that occur between implemented policies and stakeholder interactions within a real-life context through applying the multi-level policy mix method. The method was developed in the APRAISE project (Assessment of Policy Interrelationships and Impacts on Sustainability in Europe, 2011–2013) (see [36] for details).
Figure 2 provides a framing to study how policy and stakeholder interactions impact consistency in policy mixes (see Figure 2).

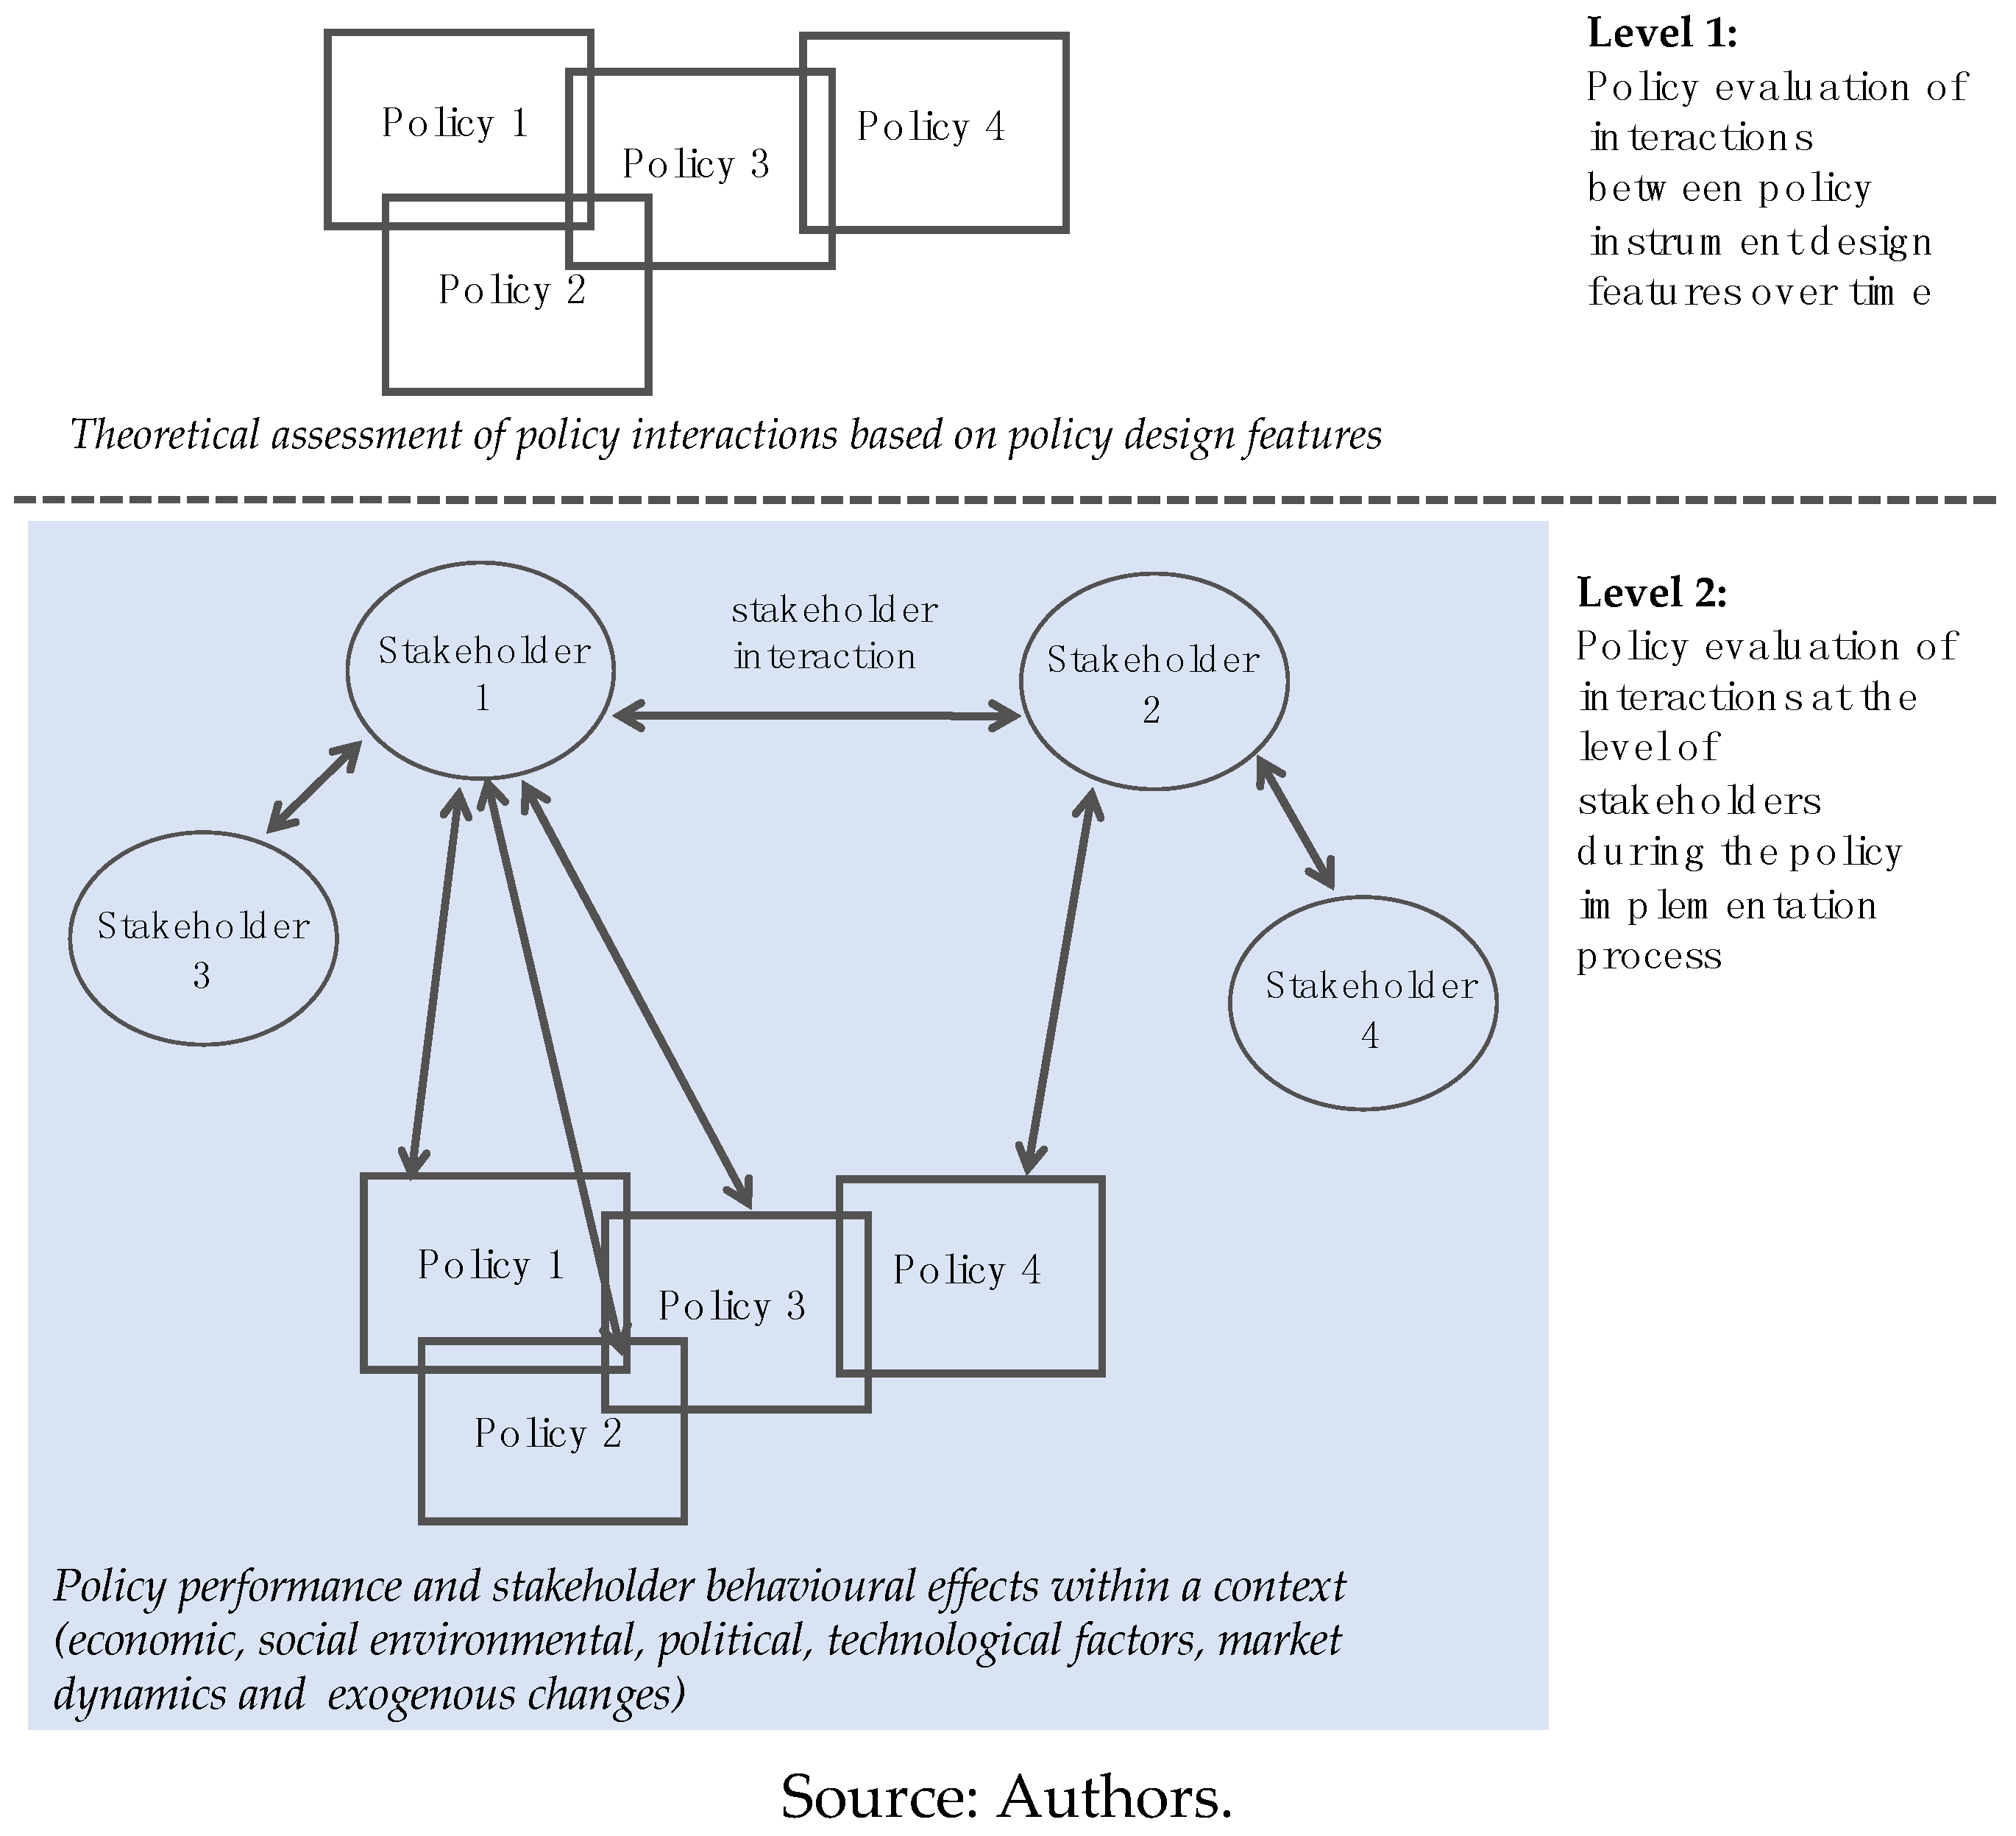
4.1. Level 1: Policy Interactions: Focus on Policy Design Interactions OVER Time

Interactions at the first level in the policy mix occur when policy instrument (PI) objectives, goals, or design features may impact the operation or outcome of another PI. PI design features can include the activity scope of the instrument, the implementation timeframe of a PI, and the type of PI. However, the assessment of PIs and how they interact in the present or past is of limited use if the lessons from ex-post analysis are not considered for redesigning policy mixes (as seen in Figure 1, Policy making cycle). Redesigning policies can include incremental changes, which are known as ‘policy patching’ [35]. Policy patching refers to “restructur[ing] existing policy elements” [35], as opposed to creating new policies or radically reforming the policy mix, particularly if only specific elements need adjusting. In this paper, we will focus on policy patching within the policy mix, which can occur in response to changes in the (inter)national context or to learning from stakeholder reactions to PIs.
By collecting ex-post observations on the policy mix elements and their amendments (i.e., policy patching) over a fixed time period, the performance of the policy mix can be assessed in terms of its consistency in meeting intended targets. In order to manage the complex interactions in a policy mix with three or more policies, we propose to cluster PIs into smaller mixes that are based on their policy area (e.g., energy, waste, air, etc.) and intended outcomes that (in)directly impact specific stakeholders (discussed further in Section 5). Clustering the policy mix into smaller sets helps to systematically carry out an in-depth analysis in stages, without being overwhelmed by the numerous interactions occurring between all PIs at the same time. The design features in each smaller policy mix can be evaluated for contradictions/inconsistencies (−), synergies/consistencies (+), or unknown/neutral (0).

4.2. Level 2: Interactions at the Level of Targeted Stakeholders in a Context

In this second level of analysis, we evaluate consistency by including stakeholder interactions and their responses to policy interactions in the policy mix, while considering the broader context. Including stakeholder response within a dynamic context helps us to understand the effects of inconsistencies, and therefore, the need for policy adjustments.

4.2.1. Stakeholder Interactions with Other Stakeholder Groups

Stakeholders from a group that is targeted by PI could interact with stakeholders from other groups not intentionally targeted by the PI. Stakeholders may not necessarily act and optimise their behaviour in isolation, but will also consider the expected strategic behaviour of other stakeholders that are (in)directly targeted by policies.
A ‘system map’ can help to visualise the interactions between stakeholders and PIs in the policy mix. This tool focuses on different types and categories of stakeholder groups (as defined by Albu and Griffith [18]). We do not demonstrate how we applied system maps in this paper, but only refer to the method as part of the analytical process for evaluating policy mixes (see Nikas et al., 2017 for system mapping methodology [19]). System maps can be developed through desk research and stakeholder consultation, to identify: key players in the supply chain, the enabling/inhibiting environment, and the facilitating service providers. The most important interactions between these stakeholders can then be identified, along with interactions between PIs in a context (see Section 6.2).

4.2.2. Stakeholder Interactions with the Policy Mix in a Context

Policy interactions through stakeholder behaviour can occur when stakeholder groups may be targeted by at least two or more PIs, to which they are obliged to comply at a given point in time. The targeted stakeholders are assumed to optimise their activities at the lowest cost in order to meet policy targets. If properly designed, a PI will provide a direct incentive for the targeted stakeholder to achieve the policy objective. However, when a targeted stakeholder is faced with multiple policies, the stakeholder must balance activities to optimise benefits, given their available resources. This implies that stakeholder groups may not react to the PI as intended. Consequently, assessing the expected and the actual change in behaviour of the targeted stakeholder, with one or several policy instruments, is much more complex. Once the policy design has been considered, and the stakeholders’ impacts in the policy mix identified, the extent or level of consistency in the mix can be evaluated.
In Table 1, we provide criteria to assess the consistency level of a policy mix. The criteria are based on policy design interaction principles and policy implementation, where stakeholders respond to each other and to PIs in a context.
The outcomes of the consistency evaluation can improve the performance of the policy mix, by feeding into a redesign of existing policies or the introduction of new policies into the existing mix. The next section discusses how the boundaries of the UK biofuel policy mix were defined in the study.

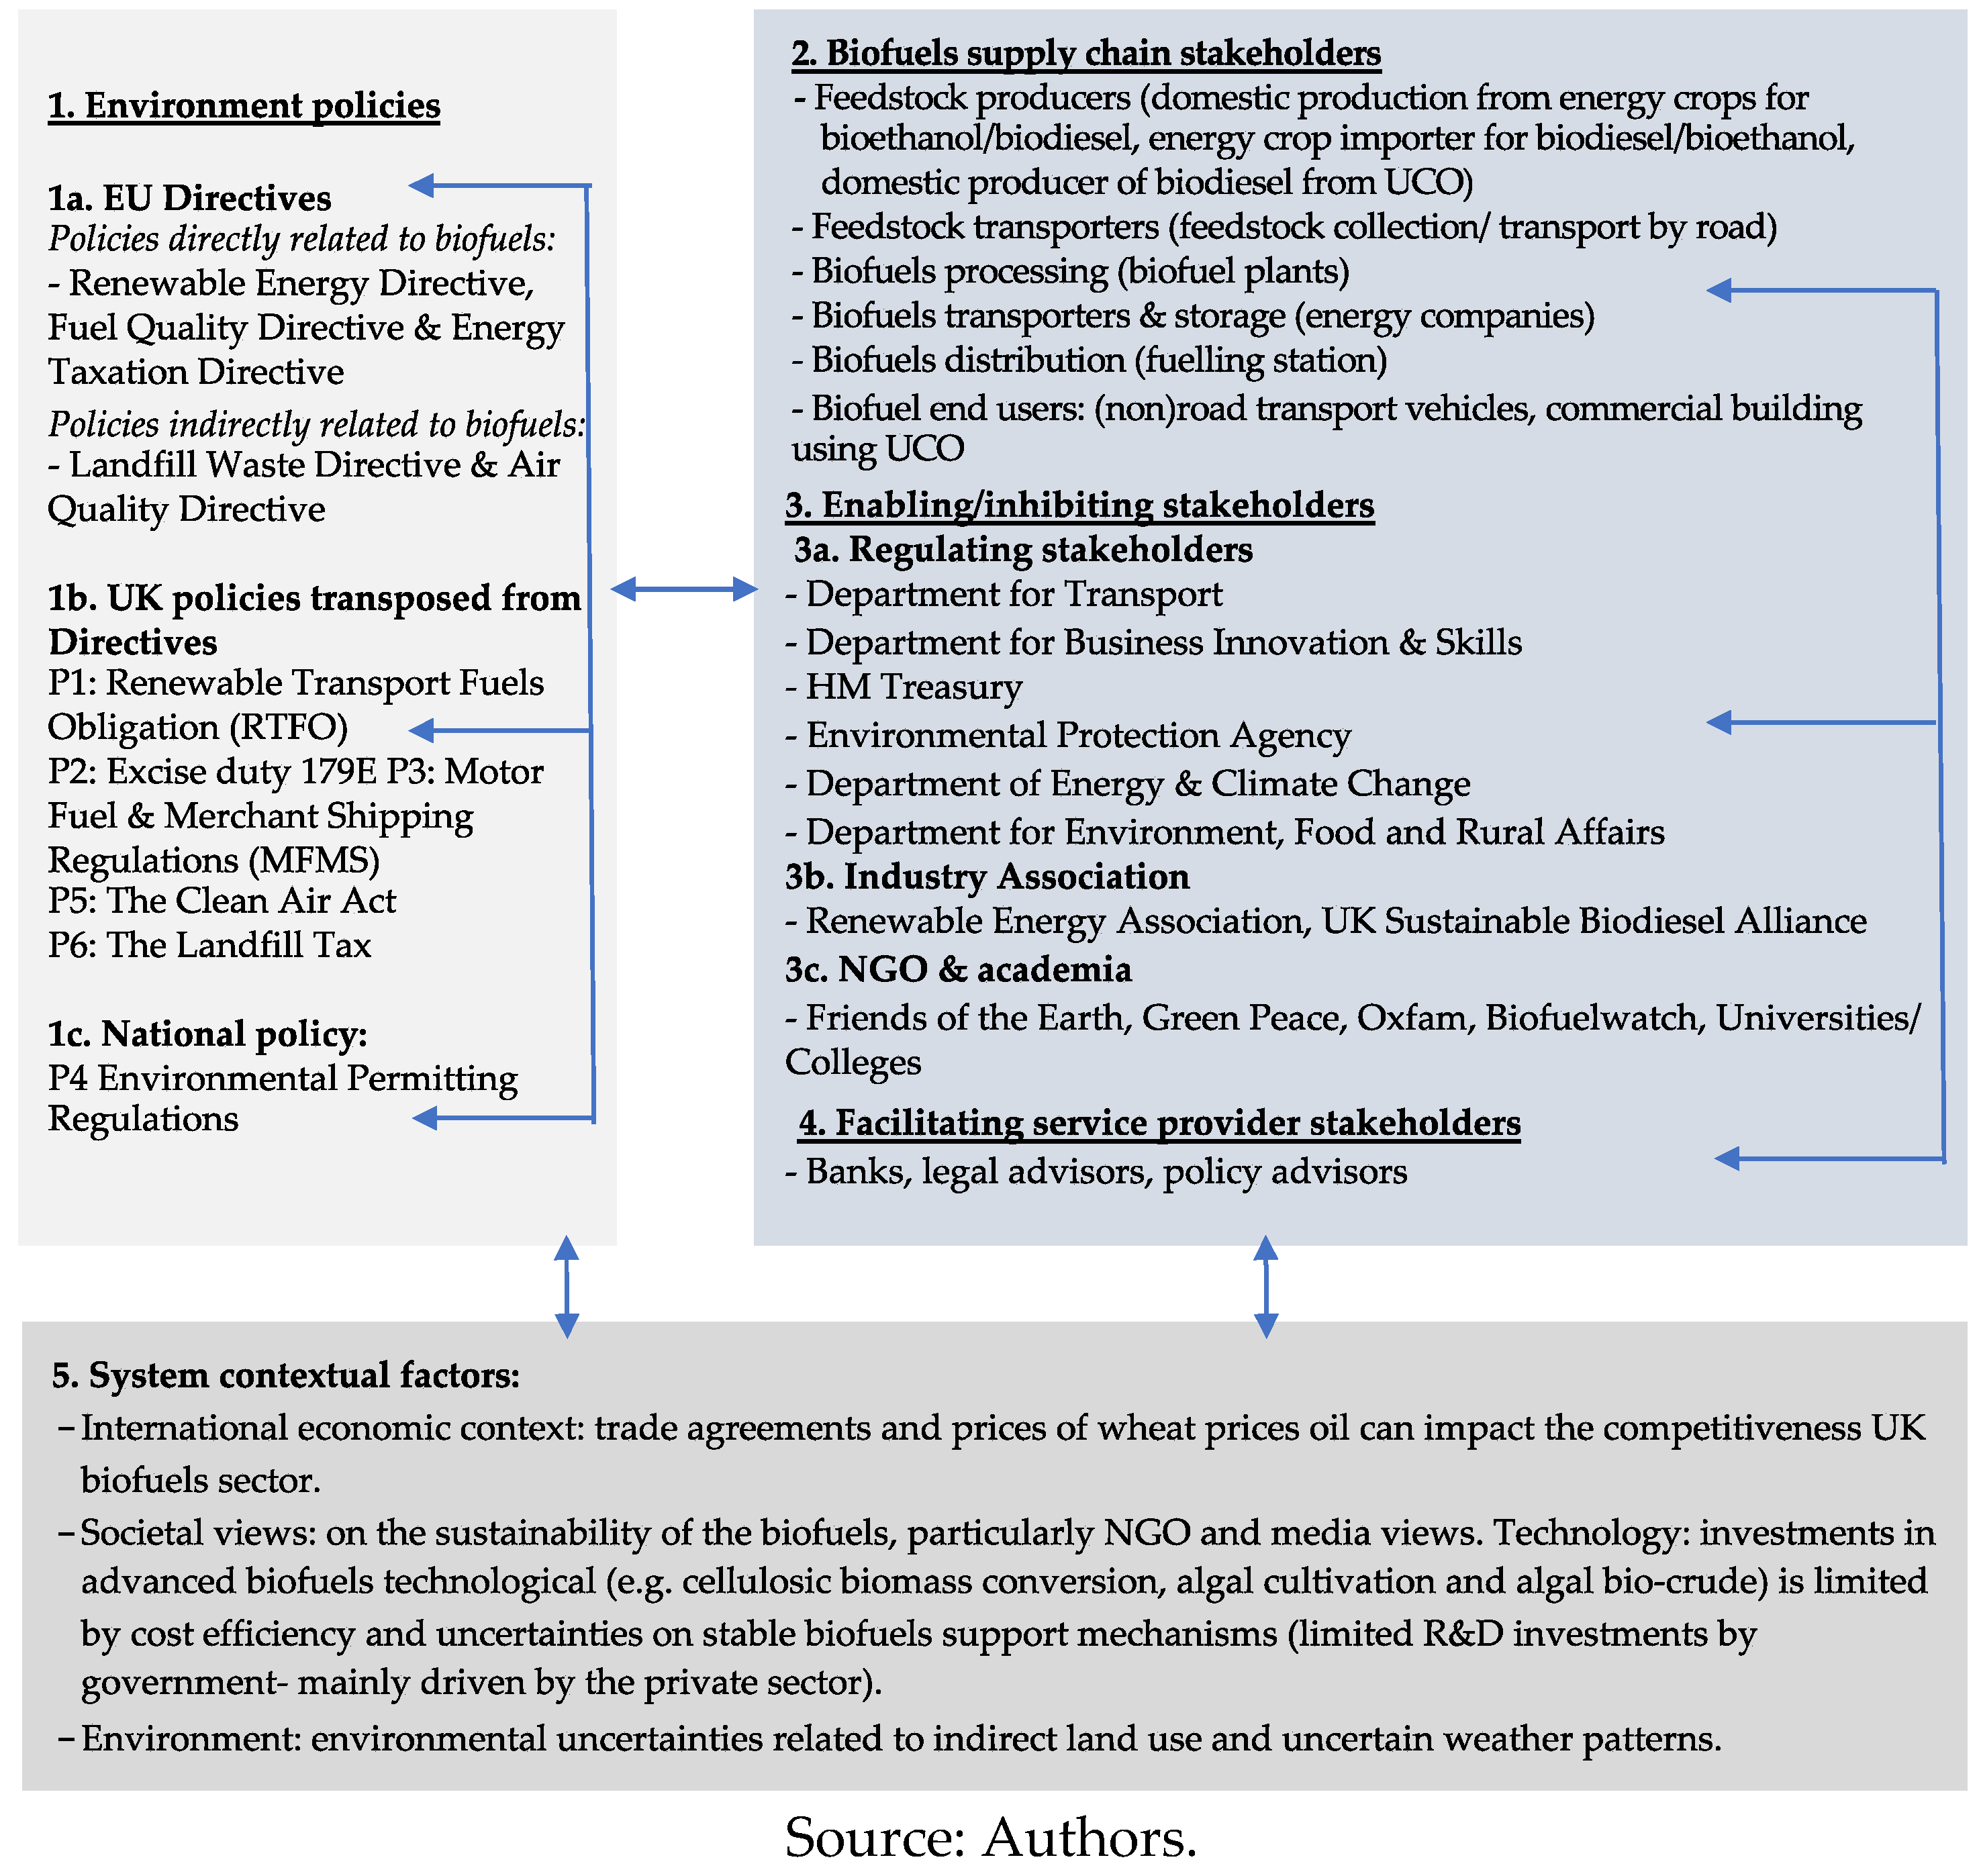
5. Drawing the Policy Mix Boundaries

We applied the multi-level policy mix method in an ex-post evaluation of European countries in the APRAISE project. The countries studied include: Austria, Estonia, Germany, Greece, The Netherlands, and the United Kingdom [36,37]. We chose the UK biofuels sector as a case study to apply our proposed method, because the implementation of UK biofuels policy mixes was not consistent in reaching their overarching policy targets over the period of study from 2007–13. This was in contrast to the Austrian biofuels case study, which demonstrated a more consistent biofuels policy mix that was effective in meeting their biofuels targets [38].
The data and information used for the UK case study was gathered through desk research and stakeholder consultation. Stakeholder insights were included from a Low Carbon Fuels Stakeholder Workshop (Organised by the Department of Transport) (2013) and twelve in-depth interviews (2012–13) with academics, biofuels companies, consultants, non-profit organisations, government bodies, industry organisations, and specialised farming academic institutions [37].

5.1. Drawing Boundaries for Policy Mixes

Before evaluating the policy mix, we will discuss how the policy mix boundaries were defined in this research using the ‘PRISMA Flow’ steps [39]. The PRISMA Flow steps help to explain how a systemic review is carried out in research. Here, we describe how we screened and selected policies for the UK biofuels policy mix from a larger set of EU and national policies.
Step 1: Identifying Relevant Policies in the Biofuels Supply Chain at the EU and UK Level
We first identified the overarching EU policies relating to the biofuels supply chain through desk research. The policy areas surveyed included: energy, climate, agriculture, air, waste and resource use, water, and biodiversity. Through this exercise, we identified thirteen EU Directives across these policy areas that could potentially impact the biofuel supply chain. We then searched for the corresponding national regulations that transposed the EU Directives (as listed in Table 2). During this exercise, we also came across three national policies that were not directly driven by the thirteen EU Directives (see rows 14–16 of Table 2).
Step 2: Screening out policies
After the drafting the initial list of policies, we excluded EU Directives (Table 2, rows 12–13) that did not have a clear corresponding national policy. We also screened out national policies that did not appear to have a significant impact on the development of the biofuels sector, or only indicated nominal changes to the biofuels sector (Table 2, rows 15–16).
Step 3: Eligible policies for consideration
The screening exercise reduced the number of potential policies to eleven EU Directives (Table 2, rows 1–11). We then selected the national policies that corresponded to the eleven EU Directives, as well as one strictly national policy (row 14). These twelve UK policies were shortlisted as eligible policies to evaluate within the UK biofuels sector (see Table 3).
We acknowledge that the EU Directives are crucial to understanding the UK biofuels sector, but we primarily focused on national policies in this study and refer to EU Directives where relevant.
Step 4: Included policies in the policy mix analysis
With the help of stakeholder interviews, the shortlisted policies were further reduced to include the six most relevant policies that impacted the biofuels sector (see Table 3, bolded borders, P1–P6). We evaluated these selected policies for the time period between 2007–13, when UK biofuels policies were implemented in response to a mix of energy and environmental European Directives (A directive is a legislative act that sets out a goal that all EU countries must achieve. However, it is up to the individual countries to devise their own laws on how to reach these goals” [40]). Policies were not evaluated beyond 2013 in this paper, as 2013 represents the end of the research study period for the APRAISE project [37]. We provide a brief update of UK biofuels policies in Section 7 as a follow-up to the research.

5.2. European Union Policy Context

The majority of key UK policies driving the development of biofuels were policies that were transposed from EU Directives; thus, the UK biofuels policy mix needs to be discussed in reference to EU level policy, roadmaps, action plans, and directives. The European Commission Roadmap to a Resource Efficient Europe (2011) [41] specifically identifies the interlinkages between sectors (e.g., energy, food, buildings, mobility), resources (e.g., fossil fuels, materials and minerals, water, air, land, soils, and ecosystems), and EU policy initiatives to promote resource efficiency. The recognition of policy interactions demonstrates efforts at the EU level to promote consistency across different policy areas, particularly in the biofuels sector, which cuts across food and energy domains.
Additionally, the Seventh Environmental Action Plan (2014–20) provides direction for environmental policy until 2020, to help achieve climate change goals. Four key environmental priorities recognised in the Action Plan are linked to biofuels that include: “prevent[ing] climate change” and “maintain[ing] and restor[ing] biodiversity” (addressed by the-Renewable Energy Directive and the Fuel Quality Directive); “substantially reduc[ing] natural resource use” (Energy Taxation Directive and Landfill Waste Directive); and, “mak[ing] the EU region a healthy place to live” (Air Quality Directive).
As part of the Action Plan drafted in 2013, the “European Union’s Environment Action Programme to 2020” [42] promotes energy and resource security as one of its priority objectives. It also encourages the integration of environment issues into other policies (i.e., energy and agriculture) in its transformation to a sustainable, inclusive economy. More specifically, the Action Plan addresses the need for policy coordination and calls for: “an appropriate mix of policy instruments [that] would enable businesses and consumers to improve their understanding of the impact of their activities on the environment and to manage that impact” [42].
There are also several key directives and strategies that specifically support the development of biofuels in Europe and the UK. The Renewable Energy Directive (RED) (2009/28/EC), which was implemented in 2009, superseded the Biofuel Directive (2003/30/EC) as the key policy to promote renewable energy in the transport sector. The RED set a biofuel target of 10% by 2020, specifying the sustainability criteria, which required biofuels to be produced from sustainable feedstock. The RED is also part of the “EU Energy and Climate Change Package” (CCP), which was adopted by the European Council in 2009. The CCP sets the “20/20/20” goals to be achieved by 2020, including: a 20% reduction in greenhouse gas (GHG) emissions compared to 1990; a 20% improvement in energy efficiency; and a 20% share of renewable energy in energy consumption (including a 10% minimum target for renewables in the transport sector). The Fuel Quality Directive (FQD) (2009/30/EC) is a complementary directive to the objectives that were set in the CCP and the RED. The FQD aims to reduce GHG emissions by 10% from the production, transportation, and use of biofuels by 2020.
The EU strategies, roadmaps, and directives indicate an effort at the EU level to consider coordinating policies across sectors. However, the transposition of these EU Directives at the national level has not always been consistent, as we observed in the UK biofuels context. The next section provides an overview of the UK biofuels policy mix.

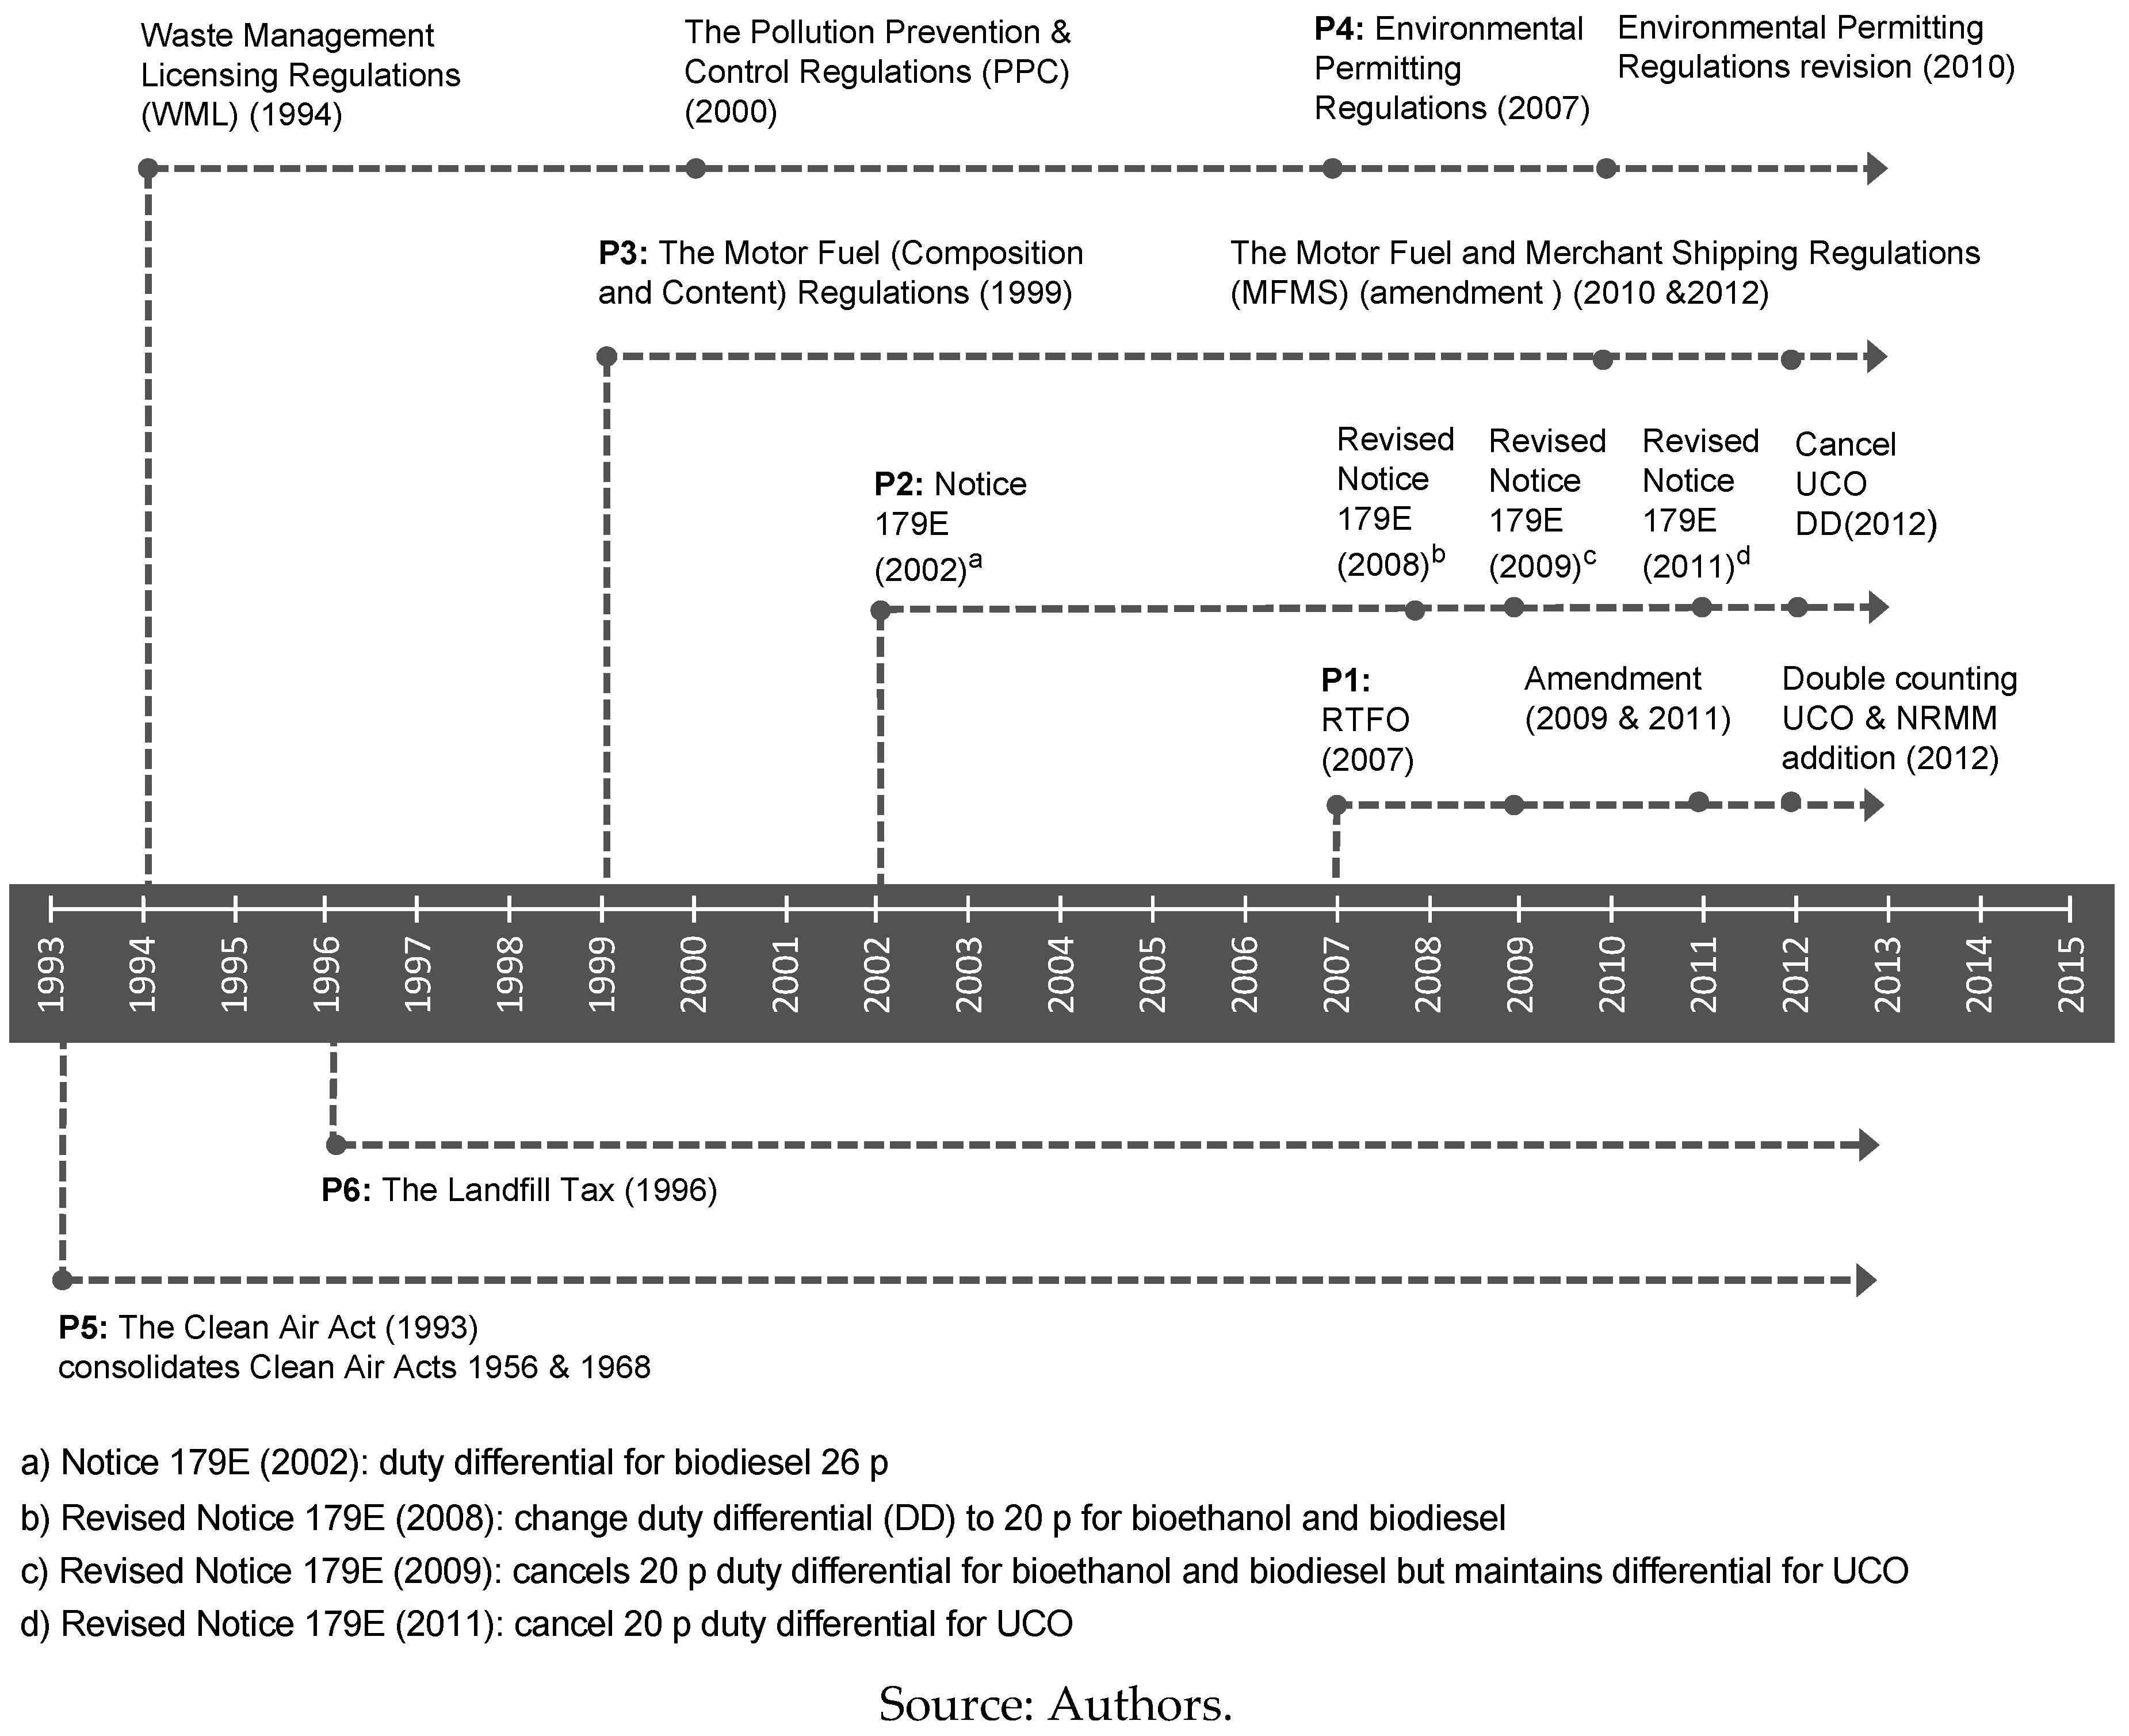
5.3. Overview of UK Policy Instruments within the UK Biofuels Policy Mix

This section provides an overview of the six national PIs that were analysed in the biofuels policy mix. The first three policies, P1: The Renewable Transport Fuels Obligation (RTFO) (2007) [43], P2: HMRC Excise Duty Notice 179E Biofuels and other fuel substitutes (2011) [44] and P3: The Motor Fuel Regulations (2012 amended) [45], are key policies directly impacting the biofuels sector. The next two policies are other environmental regulations that impact specific biofuels stakeholders or indirectly impact the broader biofuels system, P4: The Environmental Permitting Regulations (2007) [46]; and, P5: The Clean Air Act (1993) [47] and The Landfill Tax (1996) [48].
(P1) The RTFO, transposed from the Renewable Energy Directive (RED) and the former Biofuels Directives (2003–2011), establishes a mandatory biofuels target, and it tracks the obligation through a certificate trading system. The RTFO also established sustainability criteria to ensure that biofuels achieved a minimum 35% reduction in GHG emissions. The policy set binding biofuels quotas for the transport sector and it is intended to incentivise the production of renewable fuels. Obligated fossil fuel suppliers must provide evidence that a certain percentage of the fuel that they supply is sourced from renewable and sustainable sources, through the Renewable Transport Fuel Certificates (RTFCs). Each litre of biofuel is issued with a single RTFC, which can be traded in the market to compensate for the higher cost of biofuel production compared to fossil fuels.
(P2) The Excise Duty, which is overseen by HM Revenue and Customs, sets a taxation rate for all fossil fuels and biofuels based on the Energy Taxation Directive. The Excise Duty 179E has had a significant impact in the UK biofuels market. According to industry and expert interviewees, the implementation of the Excise Duty 179E has been more influential in driving or dampening the biofuels market when compared to the RTFO in its first years of implementation. For instance, policy patching has played an import role in the form of revising duty differentials for biofuels.
Prior to 2002, biofuels could be produced tax-free, while diesel, ethanol, and petroleum were taxed at a rate of 51.8 pence/litre, 27 pence/litre, and 50 pence/litre respectively. In July 2002, the Excise Duty 179E specified a tax of 25.8 pence/litre for biofuels, which amounted to a duty differential (i.e., tax break) of 26 pence/litre when compared to the diesel tax. The duty differential was revised in 2008 to 20 pence/litre for biofuels, but it was still instrumental in supporting the development of biofuels in the early to mid-2000s [49]. Based on a litre-to-litre comparison, biofuels and conventional fuels are taxed at the same rate; but when compared, based on the energy content, biofuels have a higher tax burden [50]. The duty differential was cancelled in the revised Excise Duty in 2010. However, according to interviews with industry stakeholders, producers of biofuels from used cooking oil (UCO) successfully lobbied the government to extend the duty differential for another two years until 2012.
(P3) In 1999, the Motor Fuel Regulation (MFMS) was implemented to regulate the sales and the distribution of motor fuel. In 2010, the Motor Fuel and Merchant Shipping Regulations superseded the 1999 regulation and addressed the goals of the Fuel Quality Directive (FQD). The MFMS promoted biofuels by allowing between 7 to 30% biodiesel (by volume) in transport fuel. However, ethanol content for petrol could not exceed 5% (by volume) until 2013 in order to support the operation of older vehicles. From 2013 and onwards, transport fuel could contain up to 10% ethanol.
(P4) The Environmental Permitting Regulations (EPR) stem from two UK policies: the Waste Management Licensing Regulations (WML), which was implemented in 1994, and The Pollution Prevention and Control Regulations (PPC) that was set up in 2000 [51]. The WML and PPC were first combined in the 2007 EPR, a boarder environmental programme that set controls for the transport, storage, usage, and treatment of biodiesel from tallow (such as melted animal fat and/or waste oils).
(P5) The Clean Air Act 1993 consolidated the Clean Air Acts from 1956 and 1968. In accordance with the Air Quality Directive, the Clean Air Act sets controls for specific types of air pollution from motor vehicles, as well as the regulation of sulphur content in the oil fuel for furnaces or engines.
(P6) The Landfill Tax was based on the Landfill Waste Directive and first implemented in 1996 to reduce waste and to recover additional value from waste. The regulation set a tax on the disposal of active waste that increases annually. Waste oil used for biodiesel production and other biomass wastes also fell under the active waste category. In 2010, the landfill tax per tonne of waste was set at £48/tonne and rose to £80/tonne by 2014. After 2014, the increases were more incremental, reaching £88.95/tonne in 2018 [52]. The high landfill tax encouraged waste producers to avoid landfilling, and to instead send their waste to biodiesel producers (usually at no charge).

6. Applying the Multi-Level Method to Evaluate Consistency in Policy Mixes

This section evaluates consistency in the UK biofuels policy mix by applying this study’s two-level method to analyse policy mixes. Section 6.1 focuses on the design features of policy instruments (PIs) in policy mixes, while Section 6.2 includes the interactions with stakeholders, policies, and the context within the policy mix.

6.1. Level 1 Analysing Policy Consistency: Policy Interactions in the UK’s Biofuels Policy Mix

Having defined the PIs that were selected for the UK biofuels policy mix, we now identify the interactions between policy elements, including: policy timeframes, objectives, type of instrument, and target stakeholder groups. We will first provide an overview of the policy timeframe studied (see Figure 3).
All UK policies operate simultaneously from 2007–2013, thus our analysis in this paper is focused around this fixed timeframe, as a demonstration of how to apply the method when evaluating consistency in policy mixes. The end year of 2013 only represents the boundary of our research timeframe based on the APRAISE project funded activities, and it does not indicate that policies are no longer implemented beyond 2013. From 2007 to 2012, P1–P4 exhibited a high activity of policy patching, depicted by the dots on the timeline (i.e., each dot represents a policy revision). P5 and P6 are PIs that indirectly impact the biofuels sector and are only broadly referred to, without details given of their policy development.
Policy Mix 1: (P1–3) consists of the “Nuclear Family’ policy mix within the energy and climate area, which directly impacted stakeholders in biofuels production. Policy Mix 2 consists of the ‘Extended family’ (P1–4), which includes the nuclear family and its ‘cousins’. These PIs are in the same energy and climate policy area, and indirectly target a specific biofuels supplier or end-user group. Policy Mix 3: ‘Family and Friends’ (P1–6), includes an additional group of ‘friends’ or policies in the wider environmental area, that indirectly impact the biofuels sector more broadly. The next step evaluates other policy design features, as seen in Table 4, which provides an overview of the potential interactions at the design level.
The Nuclear Family policy mix demonstrated contradictions over the design features of timeframe, objectives, and type of PI. The Extended Family mix demonstrated contradictions in the design features of objectives, and had duplications of PIs directed at one biofuels stakeholder group (biodiesel producers from used cooking oil). The Family and Friends policy mix revealed synergies in the design features: objectives and types of PIs.
The interactions analysis of policy instruments’ design parameters in Table 5 demonstrates that policy consistency in a policy mix cannot be assessed in a binary manner. Policy mixes are not strictly (in)consistent towards the attainment of overarching policy strategy. Rather, some interactions demonstrated policy consistency through synergies, and others reduced policy consistency through contradictions. Assessing the level of consistency in a policy mix is important because any contradictions identified can adversely impact stakeholders and their response to policies (e.g., collaboration or competition with other stakeholders). The next section explores policy consistency in policy mixes during the policy implementation process with stakeholders and the broader context over time.

6.2. Level 2 Analysis: Interactions between Policies and Stakeholders in the Context of the UK Biofuels Policy Mix

When evaluating policy consistency in policy mixes, stakeholders must be carefully considered as not being a homogenous group, even within the same stakeholder grouping. Stakeholders are diverse, with different interests, and respond differently to each other and policies in the mix. We highlight the diversity of stakeholders in a diagram, demonstrating the logic of the system map (see Figure 4).
The figure has three main categories: (1) policies at the national and EU level; (2–4) a range of stakeholders and; (5) the context, such as, the economy, society, technology, and the environment. The stakeholder category is further disaggregated to include: (2) stakeholders in the biofuels supply chain most impacted by policies (including feedstock producers, feedstock transporters, biofuels processing, biofuels transporters/storage, biofuels distribution, end-users); (3) stakeholders in the enabling/inhibiting environment (e.g., government, NGOs, and academia); and, (4) facilitating service provider stakeholders (e.g., lenders and legal advisors).
This paper does not provide details of the complex interactions within the biofuels policy mix. Rather, the figure highlights the range of interactions between stakeholders, policies, and the main contextual factors that need to be considered when evaluating policy consistency in a policy mix (see Lieu, 2012 for a detailed system map) [37].
We now proceed to explain the key interactions featuring in the policy mixes, which were frequently mentioned during interviews, as a demonstration of how different stakeholder groups respond to a policy mix in a given context. We primarily focus on assessing the interactions in the policy mix when all PIs were simultaneously being implemented, from 2007 onwards until the end of the study in 2013. Here, we apply the policy ‘Consistency Levels’ (i.e., inconsistent, weak/moderate/strong policy consistency) that was introduced in Table 1 to assess the policy consistency of the policy mix.
Policy mix 1 ‘Nuclear Family’ (PI, P2, & P3): This policy mix exhibits inconsistent interactions between P1 (RTFO) and P2 (Excise Duty 179E), because P2, at times, contradicted the goals of P1. The revisions in the P2 duty differential increased the cost of producing biofuels and made it more difficult to reach the biofuel target. There was, however, more consistency between P1 and P3 (MFMS) on motor biofuels percentage content since the two policies reinforced the biofuels target. Although P1 promotes the biofuels sector through the RTFO, and P3 permits the sales of biofuels, the biofuel targets were not consistently achieved, P2 (see Table 5, a table of UK biofuels target realisation in the transport sector).
P1 and P3 have a stronger policy consistency in promoting the biofuels sector, by defining a mandatory quota and monitoring through a certificate trading mechanism. The effectiveness of the RTFO and MFMS, in terms of meeting all four EU environmental priorities, is debatable. There is a diversity of the biofuels feedstocks and uncertain conditions in which biofuels from energy crop feedstocks are grown outside the EU, where the sustainability criteria may be less strictly enforced or is voluntary [53,54].
The MFMS is an important policy that drives biofuels demand, through setting the percentage of biofuels, by volume, which can be mixed with conventional transport fuel. The percentage of biofuels blends is guaranteed by the RTFO quota obligations; thus, the effectiveness of the MFMS is highly dependent on the implementation of the RTFO. Most filling stations supplied E5 (Ethanol 5%) and B5 (biodiesel 5%) during 2012, with expectations to increase the percentage up to E10 and B10. The government hesitated to increase the biofuels blend too quickly, since a large number of older car fleets were not compatible with the higher blends. Older cars tend not to be compatible with biofuels blends and were usually owned by those less well-off and may not be able to afford modifications [50]. Thus, the consideration for end users was important in setting the timeframe for increasing the biofuels blends in transport fuel.
The RTFO set obligations for biofuels to promote the biofuels sector. Initially, the biofuels target was set at 5% by 2010; but the target was revised in 2008, based on the “Gallagher Review”, an influential report published by Renewable Fuels Agency (RFA) [63] that examined the indirect effects of biofuels production. The RTFO obligations underwent policy patching and adjusted as a result of the report’s recommendation to reduce RTFO obligations by 0.5% and to cap the obligation at 5% by 2014 [60]. The Gallagher Review significantly affected biofuel producers in the UK biofuels supply chain, as it questioned the long-term sustainability of biofuels from food crops.
Another driver for revising the biofuels target was a direct result of changes at the EU level; the European Commission proposed a reduction of the target for food-based biofuels from 10% to 5% by 2020. The objective was “to limit global land conversion for biofuels” and “for the first time, the estimated global land conversion impacts from Indirect Land Use Change (ILUC (Indirect land-use change (ILUC) definition: “When biofuels are produced on existing agricultural land, the demand for food and feed crops remains, and may lead to someone producing more food and feed somewhere else. This can imply land use change (by changing e.g., forest into agricultural land), which implies that a substantial amount of CO2 emissions are released into the atmosphere” [64]))—will be considered when assessing the greenhouse gas performance of biofuels” [65]. The intention of this revision was to promote the most sustainable and best performing biofuels in addressing climate change and energy security issues. This policy patching of the EU target, contradicted the short term renewable energy target that was intended for 2020. However, reducing the biofuels target is consistent with long term EU environmental priorities of mitigating climate change, reducing natural resource use, and maintaining and restoring biodiversity (See Lieu [37] for details on how the Gallagher Review impacted RTFO biofuels targets at the UK and EU level, as well as related sustainability and ILUC issues at the EU level).
Since the implementation of the RTFO in 2008, the biofuel obligations were only met in the first two years. This was not due to RTFC prices, but primarily due to the tax relief set up for the trade of biofuels. Stakeholder interviews indicated that the tax differential could have interfered with the RTFC prices, which were aimed at covering the higher cost of biofuels production when compared to fossil fuels. This demonstrated that the RTFC, among other contextual factors (discussed in Section 6.3) did not significantly contribute in driving the biofuel producers to meet the RTFO policy targets.
Additionally, there was an unintended “loop hole” in the RTFO obligation in the first year of implementation; this exempted fossil fuels blended with biofuels prior to the duty point (i.e., when blending occurred outside UK boarders). In practice, the loop hole reduced the biofuels RTFO obligation from 2.5 to 1.15%, as obligated fuel suppliers were only required to reach half of the target. As a result, some members of the biofuels supplier stakeholder group met their obligations without purchasing RTFCs. Both the loop hole and the tax differential contributed to the devaluation of RTFCs within the first year of the RTFO [60]. In year two, the RTFC trading market was more established and “working as intended” [61]. In year three, RTFC prices continued to increase until year four and five, when used cooking oil (UCO) qualified for double counting (double counting: biofuels produced from waste feedstocks were issued two Renewable Transport Fuel Certificates (RTFCs) (or double the RTFCs) for every litre of biofuels produced) in 2012 [55,56,57]. Double counting accounted for the more sustainable production process of utilising waste product (UCO) in biofuel production. In practice, industry stakeholders noted that the RTFC market was ‘volatile’, and there were fears that double counting would flood the market with excess certificates. Double counting continues to be in place (see Section 7.2 for updates on UK’s biofuels policies)
Although there were issues with implementing the RTFO, the policy was still a key driver in developing biofuels production in the UK. According to the Renewable Fuels Agency, “a number of businesses identified that the RTFO was the reason why they existed” [60]. On the other hand, the overall benefits of the RTFO for UK biofuels producers was dampened due to external factors, including less costly biofuels feedstock imported from abroad [60].
The Excise Duty 179E, a revenue generation policy for the government, set a tariff on biofuels. Prior to 2010, biofuels suppliers received a tariff differential that was sufficient to produce biofuels profitably, without redeeming RTFC certificates within the first RTFO year [60]. Thus, the tariff differential was an effective mechanism in promoting the biofuels sector. However, in cancelling the tariff differential, the financial burden of developing the biofuel sector was shifted from the government to the end-users. The biofuels tariff raised the producers’ cost of production, since biofuels tariffs are higher than fossil fuel tariffs when considering the energy content of the fuels.
Industry stakeholders have commented that the policy shift from a stable tariff differential to the RTFO, which is a volatile market-based instrument, reduced the value of biofuels in the market and the confidence of investors. Biofuels need to remain competitive when compared to fossil fuels, and with their higher production costs, there is very little margin for error in biofuels production. The cancellation of the tax differential has had a significant impact on local, small-scale producers, as well as different impacts on biodiesel and bioethanol producers.
A contentious issue that emerged from the study was indirect land use changes (ILUC), caused by oils imported for biodiesel production. The RTFC did not directly differentiate between the economic costs for different feedstocks. Thus, biofuels producers often opted for lower cost imported feedstock, in order to meet the biofuels quota, even if there were potentially higher environmental impacts due to ILUC. Since ILUC was not accounted for within the GHG savings calculations for the RED (“In 2015 new rules came into force which amend the current legislation on biofuels—specifically the Renewable Energy Directive and the Fuel Quality Directive—to reduce the risk of indirect land use change” [66]), during that period, the policy could indirectly lead to additional deforestation. For instance, increased importation of palm oil to the EU from Malaysia and Indonesia have been argued to lead to increased GHGs emissions, as the induced growth in oil palm farming (in)directly caused additional deforestation, habitat changes, and peat drainage [67].
The percentage of biofuels sourced from palm oil has significantly decreased in a short time period. Over 2008–09, palm oil made up around 10% of the total biofuels used in the UK, and only 0.5% of the palm sourced was certified by the Roundtable on Sustainable Palm Oil (RSPO) standard. One year later (2009–10), biofuels from palm oil supplies decreased from 10 to 6% (of which, 28% were RSPO certified) [60,61]. Although regulations did not consider ILUC at that time, external pressure from society, media, NGOs and government, deterred biofuels producers from heavily relying on palm oil imports from Indonesia and Malaysia. The sensitive issues raised on deforestation from biodiesel production resulted in “suppliers changing their procurement practices in response to sustainability concern” [61]. There was also pressure from other government stakeholders, including the Department of Energy & Climate Change, which stated that power stations should not obtain more than 4% of their power from palm oil [68]. These stakeholder interactions demonstrated how strong pressure from government and social stakeholder groups was effective in improving sustainability in the biofuels sector, even in the absence of ILUC policies.
While the biofuels market has converged to using only certified palm oil, many such certification schemes exist, and they rarely capture ILUC impacts [53,69]. This issue is not limited to first generation biofuels, as second generation biofuels can also be prone to ILUC [70]. ILUC issues were recognised by policymakers at the EU level, and were reflected in Directive 2015/1513, which amended Directive 98/70/EC, “relating to the quality of petrol and diesel fuels”, and Directive 2009/28/EC, “on the promotion of the use of energy from renewable sources”. The legislative amendments attempted to reduce the indirect damage caused by biofuels, primarily outside Europe [71]. However, it is fundamentally difficult to fully capture ILUC impacts using life cycle methods with existing data [72], and the impact of this directive is still being explored. Subsequent studies on land use changes have been further explored in relation to energy, food, land use, and environmental impacts [73,74], highlighting the on-going complexities of the issue.
The emergence of ILUC issues addressed through Directive 2015/1513 indicated that there were sustainability issues that were not initially considered when drafting policies to promote biofuels. Thus, overall Policy Mix 1 was inconsistent in meeting the renewable energy target in the transport sector because policies that are aimed at promoting biofuels (P1 and P3) conflicted with the duties (P2) placed on biofuels.
Policy Mix 2 ‘Extended Family’ (PI, P2, & P3) & (P4): has a weak consistency overall due to some conflicts between the Nuclear Family group and the P4 Environmental Permitting Regulations (EPR). Within the biofuels sector, businesses dealing with waste products must obtain a waste carrier licence in order to carry out their business activities. Biofuels producers using waste products (e.g., used cooking oil) fall under the category of waste carriers and are required to track the origins of the waste products through waste transfer notes. These transfer notes are signed by both the biofuels waste collector and by the establishment where waste products are produced. This required the stakeholders in the supply chain (e.g., biofuels waste collectors) to closely interact with establishments (e.g., restaurant owners), not directly targeted by biofuels regulations, to fulfil the monitoring criteria.
Several industry stakeholders also noted that the EPR was an additional monitoring and tracking burden for biofuels producers using waste, as they must also meet sustainability criteria, which are tracked through the RTFC. There may not be a direct negative impact on meeting biofuels policy objectives overall, but the double monitoring system to meet the EPR and RTFO criteria was viewed as an administrative burden for producers. Biofuels producers were required to communicate and interact with the Department for Transport and the Environmental Agency. The overlapping policies and duplication of monitoring activities between biofuels producers and government stakeholders highlighted the need to improve policy coherence between the two government bodies. Overall, the overlaps in Policy Mix 2 resulted in a weak policy consistency, which lowered the effectiveness of the policy mix as a whole, when compared to each PI individually implemented.
Policy Mix 3 ‘Family & Friends’ (PI, P2, & P3), (P4), & (P5 & P6): demonstrated a moderate consistency between the three groups, where the overall effectiveness of the policy mix was higher than a sum total of the effectiveness of individual PIs in promoting biofuels. P5 (the Clean Air Act) and P6 (the Landfill Tax) support the biofuels targets in the Nuclear Family mix. P4 (the Environmental Permitting Regulations), complemented by the P5 Landfill tax, contributed in the reduced of natural resource use. The Environment Agency requires all waste producers to properly dispose of their waste. In order to deter waste producers from landfilling, the taxation is set for active waste, with waste oils falling under this category. Waste oil was taxed at £48/t in 2010/11, increasing by £8 each year to reach £80/t in 2014/15 [75]. The landfill tax along with biofuels producers’ demand for waste products, such as used cooking oil (UCO), tries to ensure that waste products are disposed of legally (rather than illegally pouring UCO down the drain) and are reused where possible. The landfill tax strengthens the incentive for potential producers of waste feedstock (e.g., restaurants) to interact and collaborate with biofuel producers, processing UCO to gainfully dispose of a waste product that would otherwise be costly to dispose of at landfill.
The Clean Air Act can contribute to the EU’s environmental priority for making the EU a healthy place to live. Air quality standards encourage the reduction of sulphur content. This can be achieved through biofuels as they typically have a lower sulphur content than fossil diesel (while synthetic biofuels produced through the Fischer-Tropsch process are virtually sulphur free) [76]. Additionally, if there was to be a moderate use of bioethanol blends, there may be a reduction in air pollutants, including carbon monoxide (CO), hydrocarbons, and particulate matter (PM), but an increase in volatile organic compounds (VOC). The use of biodiesel blends can also result in a minimal increase of nitrogen oxides (NOx) emissions, but reduce the release of air toxins and polyaromatic hydrocarbons [76].
More stringent air quality standards, accompanied by a moderate biofuels quota, can generally be a synergetic policy in reducing transport vehicle tailpipe emissions and contributing to the improvement of the air quality in the UK. Therefore, city mayors who are concerned with urban air quality, may be keen to support biofuels in the transport sector. Furthermore, industry biofuel stakeholders mentioned that biofuels were seen as an attractive option for taxi fleets, as there was a positive social perception that biodiesel was a more environmentally friendly option when compared to fossil fuels (notwithstanding ILUC).
Overall, these PI synergies created moderate consistency across the policy mix—with policies external to the biofuel section, such as the Air Quality Act and Landfill Taxation—by increasing the cost of polluting activities.

6.3. Other Contextual Factors That Have Impacted the Consistency of UK Biofuels Policy Mixes

There have been some key contextual factors that have had a stronger influence on the policy mixes, impacting the development of the UK biofuels sector over the 2007–13 period of study. Some of these main contextual factors are summarised in this section:
International biofuel policies affecting national UK energy goals. There have been external influences outside of the UK that have had an impact on the domestic development of biofuels. Aside from the loopholes in customs classification and taxation on imported biofuels mentioned earlier, policies from other countries have also impacted the UK biofuels sector. One of the major external policies that has impacted UK biofuel producers is biofuel feedstock subsidisation in key biofuels export countries, such as the subsides for biofuel crop in the United States (US). For instance, in 2007–09, biofuel producers in the US received a subsidy of one dollar for every gallon of biodiesel that was blended with fossil diesel. This had a substantial impact in the UK market; during this period, biodiesel production in the UK decreased by one-third from 2007–08. On the other hand, obligated UK fuel suppliers could fulfil their RTFO targets by importing the lower cost subsidised biodiesel from the US [60].
Although the customs loop holes are now closed [18], it is evident that biofuels policies that are set by other governments placed strains on domestic bioethanol producers, since imported subsidised crops were more economical than locally produced crops. From the UK biofuels producer stakeholder perceptive, such policies can threaten small to medium domestic biofuels producers. However, the policy makers interviewed noted that improving the efficiency of producing biofuels could help in meeting the overall biofuels targets, even though meeting the targets efficiently may come at the price of developing the domestic biofuels sector.
Other areas to consider for policy consistency across policy mixes in the UK biofuels context. The UK biofuels policy mix story has many layers of complexity; it crosses a number of sectors and policy areas in energy, agriculture, land use, food, and includes a diverse group of stakeholders within an (inter)national context. This paper could only capture a few elements of the biofuels policy mix, as a demonstration of how to apply the multi-level method for analysing consistency in policy mixes. Aside from environmental policies, other factors included advanced biofuels development, agricultural development, as well as commodity prices for bioethanol and biodiesel. The policy consistency analysis of policy mixes can be extended to include these elements. This method can be carried out ex-ante, to evaluate whether the introduction of new policies into the policy mix may contradict existing policies. The policy consistency analysis may also provide insights for an ex-ante evaluation of coherence in policy mixes, with a greater focus on harmonization, coordination, and cooperation of policy processes across government departments and agencies.
The next section provides a summary of the study and it proposes more general recommendations to help inform decision makers in the policy implementation process.

7. Summary, UK Biofuels Sectoral Updates and Reflections on Policy Implications

7.1. Summary of Findings on the Consistency UK’s Biofuels Policy Mix

Policy interactions influenced the overall policy consistency in the UK biofuels policy mix. The duty differential and The Renewable Transport Fuel Obligation (RTFO) operated in parallel from 2007 to 2009. The duty differential was cancelled in 2009 and the RTFO was intended to continue compensating biofuel producers. The RTFO targets were monitored through certificate trading mechanisms, but the RTFC price was volatile during the initial years of implementation (2007–13). Biofuels from waste producers succeeded in lobbing to maintain the duty differential until 2012. After 2012, biofuels from waste producers received double RTFC certificates, but the compensation was insufficient to maintain profits in the short run. Additionally, the Environmental Permitting Regulations (EPR) required biofuels from waste producers to verify their origin of waste. The EPR requirement duplicated measures that were covered by the RTFO sustainability criteria, placing further administrative burden on biofuels producers as well as government bodies. The dual obligations required the Department for Transport and the Environmental Agency to interact, and ineffective communication between the two resulted in delays in issuing certificates, consequently delaying payments for biofuel producers.
With biofuels containing a lower energy content than fossil fuels, the absence of a tax differential between the two created an uneven level playing field for renewable energy fuels producers. The Motor Fuel and Merchant Shipping Regulations (MFMS) was also a complementary policy that was intended to promote biofuels through setting blending percentages for transport fuels. Additionally, the Gallagher Review in 2008 highlighted problems with Indirect Land Use Change (ILUC) and resulted in lowering RTFO biofuel targets. Policy patching in the RTFO was applied to improve the overall sustainability of energy consumption within and outside Europe in response to unintended ILUC, but it negatively impacted the development of the UK biofuels sector.
Policy interactions between the RTFO, the Excise Duty 197E, and EPR, along with stakeholder responses to the policies, led to a reduction in biofuels production and was inconsistent in meeting renewable energy transport targets. There were, however, some synergies with policies that were external to the biofuel policy section, such as the Air Quality Act and the Landfill Tax, which increased the cost of polluting activities. These stricter environmental standards indirectly promoted biofuels as a means of reducing NOx, SOx, and air pollutants in UK cities. Waste products were encouraged to be used for biofuels, leading to close interactions between biofuels producers and those restaurant owners wishing to dispose of their used cooking oil to avoid high landfill costs.
Finally, the development of the UK biofuels sector was impacted by external contextual factors, including policies covering customs taxation on imported biofuels outside of Europe. Importers of biofuels feedstock responded to opportunities for lower cost feedstocks from abroad and negatively impacted local biofuels producers. These interactions between policies, stakeholders, and the context demonstrate that further attention is needed when devising single policies to meet policy objectives.

7.2. Policy Updates from the UK Biofuels Policy Mix

Since 2013, the share of biofuels has not significantly changed in transport fuel. In 2018, biofuels only made up 3% of the total transport fuel supplied, falling short of the 4.75% target. Of the total biofuels supplied, only 43% were reported to meet the sustainability criteria operating from April 2017–18 [77]. Biodiesel from used cooking oil (UCO) continues to receive support through double counting and has contributed to 20% of the total biofuels recorded from April 2017–18, when compared to 10% in 2012–13. The share of bioethanol used in transport fuel has decreased since 2012–13, falling from 59% of total biofuels to 43% by 2017–18. Although the Motor Fuel and Merchant Shipping Regulations (MFMS) stipulated that bioethanol blends could be increased to 10% (E10) after 2013, this has not occurred. Delays in realising the MSMF has led to the closure of the largest bioethanol producer in the UK in 2017 [78].
The Department of Transport initiated a stakeholder consultation to revise biofuel policies in 2016 and proposed amendments that are based on the consultation in March 2017 [79]. The proposed policy patches support the implementation of E10 bioethanol blends and promote the further development of biofuels from wastes. ILUC issues are also considered through the establishment of a “sliding scale”, which sets a cap for food crops. Biofuels from food crops cannot exceed 4% of the biofuels obligation in 2018, and this cap will be reduced to 2% by 2032. The proposed amendments indicate that stakeholder inputs have been considered in policy redesign.
There has also been limited acknowledgement and acceptance of responsibility in failing to meet biofuels targets. In the latest Renewable Transport Fuel Obligation Annual Report 2015–16 published in 2017, the government indicate that: “The RTFO continues to meet its objective of reducing GHG emissions from road transport. All of the biofuels rewarded under the RTFO meet the mandatory sustainability criteria” [80]. There was no direct acknowledgement that the 4.75% RTFO obligation target was not met in the report and that biofuels only comprised of 3% of the transport share.
Although there continues to be an inconsistent policy mix in the UK biofuels sector, the stakeholder consultation highlighted some lessons learnt based on the past experiences of biofuels policies. The current and future implementation of the UK biofuels policy mix needs to carefully consider the complex interactions between other policies, stakeholders, and the context.

7.3. Reflections

The UK biofuels case study demonstrated the complexities involved in assessing consistency in a policy mix, influenced by stakeholder and policy interactions in a real-life context. Such complexity has not previously been captured with existing methodological approaches, which focus more on a theoretical policy interaction analysis. We provide some reflections from our study that have implications for policy making.
We assessed policy consistency in policy mixes by exploring policy interactions that are based on design characteristics. This provides an initial indication of where potential issues may arise, for instance, due to contradicting objectives. As seen in our case study, policy mixes are rarely fully (in)consistent even at the design level and can exhibit both synergetic and contradicting interactions with stakeholders, leading to unintended outcomes. Although there is a recognition that policy mixes need to be included when designing and implementing new policies addressing sustainability issues [42], few policy makers explicitly consider policies that are outside their jurisdiction. During our research, we asked UK policy makers overseeing biofuels policies if they took into account different policies areas, including agriculture, waste, and air when drafting biofuel policies. They stated that they did not typically consider policies outside their area; thus, changes are needed to widen the scope of policy making to consider different policy areas and their potential interactions.
Additionally, a strong emphasis on stakeholder and policy interactions is needed to understand complex relationships across diverse stakeholder groups. Even seemingly homogenous stakeholder groups, such as biodiesel producers, are distinct in how they respond to policies. Biofuel producers can include those who produce biofuels from waste cooking oil, from energy crops, or those who import feedstock. Each will have a different interest in biofuels production and will be impacted differently by policies. Mapping stakeholders through a system map can help to disaggregate groups that are commonly treated as a singular group. This requires actively consulting different stakeholders, rather than relying on those stakeholders whom approach policy makers through open consultation, as they are often limited to vocal special interest groups. Stakeholders approached should not only include those from the (technology) supply chain, but also from the enabling environment (a wide range of government departments and independent experts) and facilitating service providers.
Consulting stakeholders who are (in)directly impacted by the policy mix can provide a valuable insight into how they would respond in a specific context. Using stakeholder insights within policy making can prevent contradictory policies. Other methods for stakeholder engagement can include carrying out game theory stimulation exercises, to help understand how stakeholders could respond to a changing context. Computational modelling (e.g., Integrated Assessment Models, macroeconomic models, general equilibrium models) that is informed by stakeholder knowledge can also be used to formalise these multiple interactions, and check for secondary impacts, such as effects on the economy, society, and the environment [81].
As our case study shows, policy consistency across policy mixes can change over time due to external contextual factors. Policy patching is therefore an important process in adjusting individual policy instruments. Policy patching is often approached in an ad hoc manner, addressing issues only as they arise, without considering the patched policy’s interactions with other policies or stakeholders. But, revisions can be systematically ‘built’ into the policy making process to account for lessons in the implementation process through regular and meaningful stakeholder consultation. A careful balance is also needed between policy patching design characteristics and improving policy implementation. For instance, frequent revisions of policy targets may cause instability in the policy environment, discouraging investments in low carbon technologies. While improvements in the institutional coordination across different governance levels in policy implementation could help in meeting overarching climate targets (that do not contradict with socio-economic aims) [82].
Overall, implementing these policy recommendations would require significant time, resources, and flexibility within government institutions. There also needs to be a willingness to cross highly protected policy-making spaces along with the creation of neutral platforms for policy learning and stakeholder engagement. Although these recommendations for the policy making processes are not new, we continue to observe inconsistencies in policy mixes at different levels of governance. For instance, Díaz et al. [83] highlights incongruence in the interpretation of the Swiss energy policy strategy at national and local policy making levels. They show the challenges brought about by the divergent perspectives of stakeholders that have not been fully represented in the policy strategy. Therefore, as a part of promoting policy consistency in practice, we propose meaningful, inclusive stakeholder consultation that is based on consensus building [84].
Further research is also needed to study why consistency across policy design and implementation is still not actively considered in the policy making cycle (e.g., in the design or monitoring of policies). Policy researchers and decision makers need to first recognise that complex environmental problems require them to consider changing contexts. This also includes explicitly identifying an interacting policy mix and the diverse stakeholders that respond to each other, as well as responding differently to a multitude of policy intentions. Beyond acknowledging the complexities of policy and stakeholder interactions, policy makers also need to have suitable tools (e.g., methods for assessing policy mix outcomes) and resources at hand to recognise and address the complexities. Thus, greater efforts are needed to create learning feedback loops between policy research and the policy making cycle, to transition from theoretical policy mix evaluations to applications in the real-world context.

Author Contributions

J.L. carried out the UK biofuels case study. J.L., N.A.S., W.v.d.G., and R.A.T. contributed to designing the method. R.A.-T. provided support for refining the theoretical concepts. O.v.V. contributed to the UK biofuels case study, with a focus on land use changes and the international context.

Acknowledgments

This research was carried out under APRAISE Project “Assessment of Policy Interrelationships and Impacts on Sustainability in Europe” (2011–2014), funded by the 7th Framework Programme of the European Commission (ENV.2011.4.2.1-1: Efficiency assessment of environmental policy tools related to sustainability, Grant agreement No.: 283121).

Conflicts of Interest

The authors declare no conflict of interest.

References

  1. Sorrell, S.; Smith, A.; Betz, R.; Walz, R.; Boemare, C.; Quirion, R.; Sijm, J.; Konidari, M.P.D.; Spyros, V.; Haralampopoulos, D.; et al. The Research Directorate General of the European Commission under the Fifth Framework Program (EVK2-CT-2000-0067); Interaction in EU Climate Policy. The INTERACT Project; University of Sussex: Brighton, UK, 2003. [Google Scholar]
  2. Tuerk, A.; Fruhman, C.; Frieden, D. Understanding the Efficacy of Environmental Policy Instruments: The APRAISE 3E Method. In Proceedings of the International Energy Policies & Programmes Evaluation Conference (IEPPEC), Berlin, Germany, 9–11 September 2014. [Google Scholar]
  3. Organisation for Economic Co-operation and Development (OECD). Instrument Mixes for Environmental Policy; Report; OECD Publishing: Paris, France, 2007. [Google Scholar]
  4. Majone, G. Evidence, Argument and Persuasion in the Policy Process; Yale University Press: New Haven, CT, USA; London, UK, 1989; p. 160. [Google Scholar]
  5. Ossenbrink, J.; Finnsson, S.; Bening, R.; Hoffmann, H.V. Delineating policy mixes—Contrasting the top down and bottom up approach along the case of energy storage in California. Res. Policy 2018. [Google Scholar] [CrossRef]
  6. Capano, G.; Lippi, A. Enlightening policy mix complexity: A typology of actors’ choices. In Proceedings of the 1st ICPP Conference, Grenoble, France, 28 June 2013. [Google Scholar]
  7. Howlett, M. What is a Policy Instrument? Policy Tools, Policy Mixes and Policy-Implementation Styles. In Designing Government: From Instruments to Governance; Pearl, E., Hill, M.M., Howlett, M., Eds.; McGill-Queen’s University Press: Montreal, QC, Canada; Kingston, ON, Canada, 2005; pp. 311–350. [Google Scholar]
  8. Bahn-Walkowiak, B.; Wilts, H. The institutional dimension of resource efficiency in a multi-level governance system—Implications for policy mix design. Energy Res. Soc. Sci. 2017, 33 (Suppl. C), 163–172. [Google Scholar] [CrossRef]
  9. Duval, R. A Taxonomy of Instruments to Reduce Greenhouse Gas Emissions and their Interactions; OECD Economics Department Working Papers, No. 636; OECD Publishing: Paris, France, 2008. [Google Scholar]
  10. Jensen, S.G.; Skytte, K. Interactions between the power and green certificate markets. Energy Policy 2002, 30, 425–435. [Google Scholar] [CrossRef]
  11. Jensen, S.G.; Skytte, K. Simultaneous attainment of energy goals by means of green certificates and emission permits. Energy Policy 2003, 31, 63–71. [Google Scholar] [CrossRef]
  12. Sorrell, S.; Harrison, D.; Radov, D.; Klevnas, P.; Foss, A. White certificate schemes: Economic analysis and interactions with the EU ETS. Energy Policy 2008, 37, 29–42. [Google Scholar] [CrossRef]
  13. Burke, M.J.; Stephens, J.C. Energy democracy: Goals and policy instruments for sociotechnical transitions. Energy Res. Soc. Sci. 2017, 33 (Suppl. C), 35–48. [Google Scholar] [CrossRef]
  14. Jann, W.; Wegrich, K. Theories of the policy cycle. In Handbook of Public Policy Analysis: Theory, Politics, and Methods; Fischer, F., Miller, G.J., Sidney, M.S., Eds.; CRC Press, Taylor & Francis: Boca Raton, FL, USA, 2007; pp. 43–62. [Google Scholar]
  15. Kern, F.; Howlett, M. Implementing transition management as policy reforms: A case study of the Dutch energy sector. Policy Sci. 2009, 42, 391–408. [Google Scholar] [CrossRef]
  16. Gautier, P. Horizontal Coherence and the External Competences of the European Union. Eur. Law J. 2004, 10, 23–41. [Google Scholar] [CrossRef]
  17. Rogge, K.S.; Reichardt, K. Towards a More Comprehensive Policy Mix Conceptualization for Environmental Technological Change: A Literature Synthesis; Working Paper Sustainability and Innovation S3/2013; Fraunhofer ISI: Karlsruhe, Germany, 2013. [Google Scholar]
  18. Albu, M.; Griffith, A. Mapping the Market: participatory market-chain development in practice. Small Enterp. Dev. 2006, 17, 12–22. [Google Scholar] [CrossRef]
  19. Nikas, A.; Doukas, H.; Lieu, J.; Alvarez-Tinoco, R.; Charisopoulos, V.; van der Gaast, W. Managing stakeholder knowledge for the evaluation of innovation systems in the face of climate change. J. Knowl. Manag. 2017, 21, 1013–1034. [Google Scholar] [CrossRef] [Green Version]
  20. Spyridaki, N.A.; Banaka, S.; Flamos, A. Evaluating public policy instruments in the Greek building sector. Energy Policy 2016, 88, 528–543. [Google Scholar] [CrossRef]
  21. Bolton, R.; Foxon, T.J. A socio-technical perspective on low carbon investment challenges—Insights for UK energy policy. Environ. Innov. Soc. Transit. 2015, 14, 165–181. [Google Scholar] [CrossRef]
  22. International Renewable Energy Agency (IRENA). Adapting Renewable Energy Policies to Dynamic Market Conditions; Report; IRENA: Abu Dhabi, UAE, 2014. [Google Scholar]
  23. Laswell, H.D. The Policy Orientation. In The Policy Sciences: Recent Development in Scope and Method; Lerner, D., Lasswell, H.D., Eds.; Stanford University Press: Palo Alto, CA, USA, 1951; pp. 3–15. [Google Scholar]
  24. Tinbergen, J. On the Theory of Economic Policy. Books (Jan Tinbergen); North-Holland Publishing Company: Amsterdam, The Netherlands, 1952. [Google Scholar]
  25. Mundell, R. A Theory of Optimum Currency Areas. Am. Econ. Rev. 1961, 51, 657–665. [Google Scholar]
  26. Branson, W.H. Macroeconomic Theory and Policy, 3rd ed.; Harper and Row: New York, NY, USA, 1989. [Google Scholar]
  27. Wildavsky, A. The Art and Craft of Policy Analysis; MacMillan Press: London, UK; Basingstoke, UK, 1979. [Google Scholar]
  28. Del Río González, P. The interaction between emissions trading and renewable electricity support schemes: An overview of the literature. Mitig. Adapt. Strateg. Glob. Chang. 2007, 12, 1363–1390. [Google Scholar] [CrossRef]
  29. Cory, K.; Couture, T.; Kreycik, C. Feed-in Tariff Policy: Design, Implementation, and RPS Policy Interactions; Technical Report (NREL/TP-6A2-45549); National Renewable Energy Laboratory: Golden, CO, USA, 2009.
  30. Tsao, C.; Campbell, J.E.; Chen, Y. When renewable portfolio standards meet cap-and-trade regulations in the electricity sector: Market interactions, profits implications, and policy redundancy. Energy Policy 2011, 39, 3966–3974. [Google Scholar] [CrossRef]
  31. Taeihagh, A.; Givoni, M.; Bañares-Alcántara, R. Which policy first? A network-centric approach for the analysis and ranking of policy measures. Environ. Plan. B Plan. Des. 2013, 40, 595–616. [Google Scholar] [CrossRef]
  32. Boots, M.G.; Schaeffer, G.J.; de Zoeten, C.; Mitchell, C.; Anderson, T.; Morthorst, P.E.; Nielsen, L.; Kühn, I.; Bräuer, W.; Stronzik, M.; et al. The Interaction of Tradable Instruments in Renewable Energy and Climate Changes Markets; The InTraCert Project; The Research Directorate General of the European Commission under the Fifth Framework Program (NNE5/1999/428); ECN: Amsterdam, The Netherlands, 2001. [Google Scholar]
  33. Böhringer, C.; Rosendahl, E.K. Green promotes the dirtiest: On the interaction between black and green quotas in energy markets. J. Regul. Econ. 2010, 37, 316–325. [Google Scholar] [CrossRef]
  34. Howlett, M.; Kim, J.; Weaver, P. Assessing Instrument Mixes through Program- and Agency-Level Data: Methodological Issues in Contemporary Implementation Research. Rev. Policy Res 2006, 23, 129–151. [Google Scholar] [CrossRef]
  35. Howlett, M.; Rayner, J. Patching vs. Packaging: Complementary Effects, Goodness of Fit, Degrees of Freedom and Intentionality in Policy Portfolio Design; Policy Design Working Paper Series. 20; Lee Kuan Yew School of Public Policy: Singapore, 2013. [Google Scholar]
  36. Assessment of Policy Interrelationships and Impacts on Sustainability in Europe (APRAISE). 2011–2013 and Carried Out under the 7th Framework Programme (FP7) of the European Commission; University of Sussex: Brighton, UK, 2013. [Google Scholar]
  37. Lieu, J. Assessment of Policy Impacts on Sustainability in Europe (EC FP7 APRAISE); Report on Case Study Biofuels for Transport in the United Kingdom; University of Sussex: Brighton, UK, 2012. [Google Scholar]
  38. Steiner, D.; Tuerk, A.; Hingsamer, M.; Frieden, D. Assessment of Policy Impacts on Sustainability in Europe (EC FP7 APRAISE)—D2.1 Report on New Qualitative ex-post and ex-ante Evaluation Methods. Graz. 2012. Available online: http://apraise.org/sites/default/files/apraise_d2.1_0_0.pdf#overlay-context=Deliverables (accessed on 5 December 2013).
  39. Moher, D.; Liberati, A.; Tetzlaff, J.; Altman, D.G.; The PRISMA Group. Preferred Reporting Items for Systematic Systematic Reviews and Meta-Analyses. 2009. Available online: http://prisma-statement.org/documents/PRISMA%202009%20flow%20diagram.pdf (accessed on 10 May 2018).
  40. European Union. Regulations, Directives and Other Acts. 2017. Available online: https://europa.eu/european-union/eu-law/legal-acts_en (accessed on 2 February 2018).
  41. European Commission. Roadmap to a Resource Efficient Europe; European Commission: Brussels, Belgium, 2011. [Google Scholar]
  42. European Commission. Environment Action Programme to 2020 ‘Living Well, within the Limits of our Planet’; 20 November 2013, Decision No 1386/2013/EU. 33; European Commission: Brussels, Belgium, 2013. [Google Scholar]
  43. The Renewable Transport Fuel Obligations Order 2007. The Renewable Transport Fuel Obligations Order 2007 Regulations 2007 No. 3072; UK Statutory Instruments; 2007. Available online: http://www.legislation.gov.uk/uksi/2007/3072/pdfs/uksi_20073072_en.pdf (accessed on 10 August 2013).
  44. HM Revenue & Customs (HMRC). HM Revenue and Customs. Retrieved March 8, 2013 from Biofuels and Other Fuel Substitutes: HMRC Reference: Notice 179E; 2011. Available online: http://customs.hmrc.gov.uk/channelsPortalWebApp/channelsPortalWebApp.portal?_nfpb=true&_pageLabel=pageVAT_ShowContent&id=HMCE_CL_000205&propertyType=document (accessed on 10 August 2013).
  45. The Motor Fuel Regulations 2012. The Motor Fuel (Composition and Content) (Amendment) Regulations 2012; UK Statutory Instruments; 2012. Available online: http://www.legislation.gov.uk/uksi/2012/2567/made?view=plain (accessed on 10 August 2013).
  46. The Environmental Permitting Regulations 2010. The Environmental Permitting (England and Wales) (Amendment) (No. 2) Regulations 2010; UK Statutory Instruments; 2010. Available online: http://www.legislation.gov.uk/uksi/2010/2172/pdfs/uksi_20102172_en.pdf (accessed on 20 July 2013).
  47. Clean Air Act 1993. Clean Air Act 1993; Public General Acts; 1993. Available online: http://www.legislation.gov.uk/ukpga/1993/11/pdfs/ukpga_19930011_en.pdf (accessed on 20 July 2013).
  48. The Landfill Tax Regulations 1996. The Landfill Tax Regulations 1996; UK Statutory Instruments; 1996. Available online: http://www.legislation.gov.uk/uksi/1996/1527/contents/made (accessed on 20 July 2013).
  49. Charles, C.; Wooders, P. Biofuels—At What Cost? Mandating Ethanol and Biodiesel Consumption in the United Kingdom; Global Subsidies Initiative (GSI) of the International Institute for Sustainable Development (IISD): Geneva, Switzerland, 2012. [Google Scholar]
  50. Bailey, R. The Trouble with Biofuels: Costs and Consequences of Expanding Biofuel Use in the United Kingdom; Chatham House: London, UK, 2013. [Google Scholar]
  51. The Pollution Prevention and Control Regulations 2000. The Pollution Prevention and Control (England and Wales) Regulations 2000 No. 1973; UK Statutory Instruments; 2000. Available online: http://www.legislation.gov.uk/uksi/2000/1973/contents/made (accessed on 20 July 2013).
  52. HM Revenue & Customs and HM Treasury. Landfill Tax 2018. Available online: https://www.gov.uk/green-taxes-and-reliefs/landfill-tax (accessed on 6 April 2018).
  53. Van Dam, J.; Junginger, M.; Faaij, A.P.C. From the global efforts on certification of bioenergy towards an integrated approach based on sustainable land use planning. Renew. Sustain. Energy Rev. 2010, 14, 2445–2472. [Google Scholar] [CrossRef]
  54. Gamborg, C.H.T.; Anker, H.T.; Sandøe, P. Ethical and legal challenges in bioenergy governance: Coping with value disagreement and regulatory complexity. Energy Policy 2014, 69 (Suppl. C), 326–333. [Google Scholar] [CrossRef]
  55. Department for Transport. Year 3 Verified Report: 15 April 2010–14 April 2011; Department for Transport: London, UK, 2011. Available online: https://www.gov.uk/government/uploads/system/uploads/attachment_data/file/191478/rtfo-aug-2011.pdf (accessed on 20 August 2013).
  56. Department for Transport. Renewable Transport Fuel Obligation Statistics: Obligation Period 4, 2011/12; Report 5; Department for Transport: London, UK, 2012.
  57. Department for Transport. Renewable Transport Fuel Obligation Statistics: Obligation Period 5, 2012/13; Report 4; Department for Transport: London, UK, 2013.
  58. Department for Transport. Renewable Transport Fuel Obligation Statistics: Period 5, 2012–13; Report 4 XLS Tables; Department for Transport: London, UK, 2013.
  59. Department of Transport. Renewable Transport Fuel Obligation Statistics: Obligation Period 6, 2013/14; Report 6; Department for Transport: London, UK, 2015.
  60. Renewable Fuels Agency. Year One of the RTFO: Renewable Fuels Agency Report on the Renewable Transport Fuel Obligation 2008/09; Renewable Fuels Agency: London, UK, 2010.
  61. Renewable Fuels Agency. Year Two of the RTFO: Renewable Fuels Agency Report on the Renewable Transport Fuel Obligation 2009/10; Renewable Fuels Agency: London, UK, 2011.
  62. Non-Fossil Purchasing Agency Limited (NFPAS). e-TOC On-Line Auctions. 2013. Available online: http://www.nfpas-auctions.co.uk/etoc/trackrecord.html (accessed on 15 August 2013).
  63. Renewable Fuels Agency. The Gallagher Review of the Indirect Effects of Biofuels Production; Renewable Fuels Agency: London, UK, 2008.
  64. European Commission. MEMO: Indirect Land Use Change (ILUC). 2012. Available online: http://europa.eu/rapid/press-release_MEMO-12-787_en.htm (accessed on 10 August 2013).
  65. European Commission. New Commission Proposal to Minimise the Climate Impacts of Biofuel Production. EUROPA Press Release. 2012. Available online: http://europa.eu/rapid/press-release_IP-12-1112_en.htm (accessed on 2 February 2018).
  66. European Commission. Land Use Change. 2015. Available online: https://ec.europa.eu/energy/en/topics/renewable-energy/biofuels/land-use-change (accessed on 2 February 2018).
  67. Fritsche, U.R.; Wiegmann, K. Indirect Land Use Change and Biofuels; European Parliament’s Committee on Environment, Public Health and Food Safety, Policy Department Economic and Scientific Policy; European Parliament: Brussels, Belgium, 2011. [Google Scholar]
  68. Harrabin, R. Biofuels: MPs to Consider Subsidies for Power Stations. BBC News Science and Environment, 6 March 2013. Available online: http://www.bbc.co.uk/news/science-environment-21672840 (accessed on 15 August 2013).
  69. Pacini, H.; Assunção, L.; van Dam, J.; Toneto, R. The price for biofuels sustainability. Energy Policy 2013, 59 (Suppl. C), 898–903. [Google Scholar] [CrossRef] [Green Version]
  70. Van Vliet, O.P.R.; Faaij, A.P.C.; Turkenburg, W.C. Fischer–Tropsch diesel production in a well-to-wheel perspective: A carbon, energy flow and cost analysis. Energy Convers. Manag. 2009, 50, 855–876. [Google Scholar] [CrossRef]
  71. European Union. Directive (EU) 2015/1513 of the European Parliament and of the Council of 9 of September 2015 Amending Directive 98/70/EC Relating to the Quality of Petrol and Diesel Fuels and Amending Directive 2009/28/EC on the Promotion of the Use of Energy from Renewable Sources. 2015. Available online: http://eur-lex.europa.eu/legal-content/EN/TXT/?uri=CELEX%3A32015L1513 (accessed on 2 February 2018).
  72. Plevin, R.J.; Delucchi, M.A.; Creutzig, F. Using Attributional Life Cycle Assessment to Estimate Climate-Change Mitigation Benefits Misleads Policy Makers. J. Ind. Ecol. 2014, 18, 73–83. [Google Scholar] [CrossRef]
  73. Langeveld, J.W.A.; Dixon, J.; van Keulen, H.; Quist-Wessel, P.M.F. Analyzing the effect of biofuel expansion on land use in major producing countries: Evidence of increased multiple cropping. Biofuel Bioprod. Biorefin. 2014, 8, 49–58. [Google Scholar] [CrossRef]
  74. Popp, J.; Lakner, Z.; Harangi-Rakos, M.; Fari, M. The effect of bioenergy expansion: Food, energy, and environment. Renew. Sustain. Energy Rev. 2014, 32, 559–578. [Google Scholar] [CrossRef]
  75. HM Revenue & Customs (HMRC). A General Guide to Landfill Tax; HM Revenue & Customs: London, UK, 2013. [Google Scholar]
  76. Air Quality Expert Group. Road Transport Biofuels: Impact on UK Air Quality; Department for Environment, Food and Rural Affairs: London, UK; Scottish Government: Edinburgh, UK; Welsh Assembly Government: Cardiff, UK; Department of the Environment in Northern Ireland: Belfast, Ireland, 2011.
  77. Department for Transport. Renewable Transport Fuel Obligation Statistics: Period 10 2017/18; Report 1; Department for Transport: London, UK, 2017.
  78. Bounds, A.; Chris Tighe, C. Investors Lose Hundreds of Millions as UK Biofuels Industry Stalls. 2017. Available online: https://www.ft.com/content/31b0e84a-d9e1-11e7-a039-c64b1c09b482 (accessed on 13 May 2018).
  79. Department of Transport. The Renewable Transport Fuel Obligations Order: Government Response to the Consultation on Amendments; Department of Transport: London, UK, 2017.
  80. Department of Transport. Renewable Transport Fuel Obligation Annual Report 2015–16; Department of Transport: London, UK, 2017.
  81. TRANSrisk. Transitions Pathways and Risk Analysis for Climate Change Mitigation and Adaption Strategies. EU Horizon 2020 Programme, GA: 642260. 2018. Available online: http://transrisk-project.eu/ (accessed on 2 May 2018).
  82. Organisation for Economic Co-operation and Development (OECD). Aligning Policies for a Low-carbon Economy. In Proceedings of the Meeting of the OECD Council at Ministerial Level, Paris, France, 3–4 June 2015. [Google Scholar]
  83. Díaz Redondo, P.; van Vliet, O.; Patt, A.G. Do We Need Gas as a Bridging Fuel? A Case Study of the Electricity System of Switzerland. Energies 2017, 10, 861. [Google Scholar] [CrossRef]
  84. Lieu, J.; Virla, D.A.; Abel, R.; Fitzpatrick, C. Consensus Building in Engagement Processes’ for reducing risks in developing sustainable pathways: Indigenous interests as core elements of engagement. In Understanding Risks and Uncertainties in Energy and Climate Policy: Multidisciplinary Methods and Tools towards a Low Carbon Society; Doukas, H., Flamos, A., Lieu, J., Eds.; Springer: London, UK, 2017; in press. [Google Scholar]
Figure 1. Evaluation of consistency in the policy making cycle.
Sustainability 10 01896 g001
Figure 2. Multi-level analysis of consistency in policy mixes.
Sustainability 10 01896 g002
Figure 3. Timeline of policies in the UK biofuels policy mix studied (1993–2013).
Sustainability 10 01896 g003
Figure 4. System map elements of the UK biofuels sector.
Sustainability 10 01896 g004
Table 1. Extent of consistency within a policy mix based on pair-wise policy instrument interactions.
Consistency LevelDescription
Inconsistent policy mixA policy mix is considered to be inconsistent when policy instrument (PI) ‘contradictions’ within the mix outweigh the PI ‘synergies’ or ‘facilitations’. Contradictions can be traced at the level of PI design elements and during implementation. PI contradictions can lead to the under-performance of policy instruments, in terms of failing to meet policy objectives/strategies, despite the synergetic effects of other PIs in the mix.
Weak consistency of policy instrument mixA PI mix can be characterized as having a weak consistency when there are no obvious contradictions or synergies between PIs. A lack of strong PI synergy may lead to the effects of the PI mix being equal or slightly lower to the (intended?) effects of the individual PI, or that the policy objectives are met at a higher cost.
Moderate to strong consistency of policy instrument mixSynergies outweigh the contradictions in the PI mix. PIs complement each other and operate together, leading to higher effectiveness than the sum of effects of individual instruments in the mix, and/or higher cost-effectiveness.
Source: Authors.
Table 2. European Union (EU) Directives and transposed United Kingdom (UK) national policies.
EU Directive ReferenceUK National Policies
(1)
Renewable Energy Direct (RED) (2009/28/EC). The Biofuel Directive (2003/30/EC) (replaced by RED)
Renewable Transport Fuels Obligation & sustainability criteria
(2)
Fuel Quality Directive FQD (2009/30/EC)
Motor Fuel and Merchant Shipping Regulations
(3)
The Energy Taxation Directive (2003/96/EC)
Biofuels and Other Fuel Substitutes Regulations
(4)
Landfill Waste Directive (99/31/EC)
The Landfill Tax
(5)
Agricultural Nitrates Directive (91/676/EEC)
Protection of Water Against Agricultural Nitrate Pollution
(6)
The Common Agriculture Policy (CAP), Water Directive (2000/60/EC)
Single Payment Scheme for agricultural production
(7)
Water Directive (2000/60/EC)
The Water Environment Regulations
(8)
Urban Waste Water Directive 91/271/EEC
The Urban Waste Water Treatment Regulations
(9)
Landfill Waste Directive (99/31/EC)
The Landfill Tax; Waste and Emissions Trading Act
(10)
The Air Quality Directive (96/62/EC)
The Clean Air Act
(11)
The Habitats Directive (92/43/EEC)
The Landfill Tax
(12)
Eco design directive (2009/125/EG)
No national policy directly linked to biofuels identified
(13)
Directive on the protection of groundwater against pollution & deterioration (2006/188/EC)
No national policy directly linked to biofuels identified
(14)
Other national policy instruments
Environmental Permitting Regulations
(15)
Other national policy instruments
Finance Act 2002, Chapter 23
(16)
Other national policy instruments
Infrastructure Grant Programme
Source: Authors.
Table 3. Shortlisted UK policies that (in)directly impacted the biofuel sector.
Policy areasUK National Policy Instruments
EnergyP1: Renewable Transport Fuels ObligationP2: HMRC Excise duty Notice 179E
Biofuels and other fuel substitutes
P3: Motor Fuel and Merchant Shipping Regulations
Climate
AgricultureProtection of Water Against Agricultural Nitrate PollutionSingle Payment Scheme for agricultural production
AirP5: The Clean Air Act
Waste/resource useP6: The Landfill TaxWaste and Emissions Trading ActThe Urban Waste Water Treatment RegulationsP4: Environmental Permitting Regulations
WaterThe Water Environment Regulations
BiodiversityConservation of Habitats and Species Regulations
Legend: (1) Italic text: key policies in the UK that directly impact the biofuels sector; (2) Regular text: policies that can indirectly impact the biofuels sector; and, (3) Cells with borders: policies examined in this case study. Source: Authors.
Table 4. Comparison of policy instruments’ design features in policy mixes.
Policy Mix 1 Nuclear Family (PI, P2 & P3)
P1: RTFO;
P2: Excise Duty 179E
P3: MFMS
Policy Mix 2 Family
(PI, P2 & P3) & (P4)
P4: Environmental Permitting Regulations
Policy Mix 2 Family & Friends (PI, P2 & P3), (P4) & (P5 & P6)
P5: The Clean Air Act
P6: The Landfill Tax
1.Time-frame(–) Time overlap: P1 over-laps with P2 creating contra-dictions. P1 supports biofuels & P2 increases costs. P2 overlaps with P3 from 2004.(0) Time overlap: The time overlap between group P1–3 & P4 does not appear to have an impact on the overall performance of the PIs.(0) Time overlap: The time overlap between group P1–3 & P5–6 does not appear to have an impact on the overall performance of the PIs.
2. Policy objectives(–) P1 and P3 promotes biofuels by setting targets while P2 sets a duty rate for biofuels equal to fossil fuels.(–) P4 sets additional monitoring criteria on top of the sustainability criteria for biofuels producers from waste.(+) P1–4 & P5–6: air quality standards encourage bio-fuels use in transport to decrease sulphur emissions & particulates. Higher landfill taxes divert waste from landfill & to reuse waste for biofuels.
3. Type of instrument(–) Mix of quota, trading schemes with regulations & taxes that can contradict meeting biofuels targets.(–) Possibly over regulation in the permits covered by the sustainability criteria in P1.(+) Stricter environmental regulations can complement meeting the biofuels target.
4. Directly targeted stakeholders(0) P1–P3: All domestic biofuels producers, importers of biofuels, & biofuels end-users.(–) P4: Domestic biofuels producers from used cooking oil (UCO) subject to additional permitting.(+) P5–P6: Domestic biofuels producers, importers of biofuels, & biofuels from waste producers (e.g., UCO).
* Contradictions (–); Neutral (0); Synergies (+). Source: Authors.
Table 5. UK Biofuels targets actual realisation in the transport sector.
RTFO Obligation PeriodRTFO Obligation YearTarget (% by Volumne) of Biofuels SuppliedActual (%) of Biofuels SuppliedPrice Range (Pence per RTFC)Target Achieved?
2008–200912.52.70–8.0Yes
2009–201023.253.336.0–8.0Yes
2010–201133.53.2712.75–19.9No
2011–201244.03.65.00–23.5No
2012–201354.53.08.84–17.97No
2013–201464.73.46~ 15.5No
Source: [55,56,57,58,59,60,61,62].

