Organic Carbon Concentrations in High- and Low-Productivity Areas of the Sulu Sea


1
Marine Science Institute, University of the Philippines Diliman, Quezon City 1101, Philippines
2
Department of Oceanography, National Sun Yat-sen University, Kaohsiung 80424, Taiwan
3
Taiwan Ocean Research Institute, National Applied Research Laboratories, Kaohsiung 80143, Taiwan
*
Author to whom correspondence should be addressed.
Sustainability 2018, 10(6), 1867; https://doi.org/10.3390/su10061867
Submission received: 2 February 2018
/
Revised: 28 May 2018
/
Accepted: 31 May 2018
/
Published: 4 June 2018
(This article belongs to the Special Issue Marine Carbon Cycles)
Abstract
:The sequestration of anthropogenic carbon dioxide in the form of organic carbon and its eventual deposition in the sediments is an important component of the marine carbon cycle. In the Sulu Sea, Philippines, organic carbon contents in the sediments have been relatively well studied, but the processes that describe the organic carbon distributions in the water column have not been elucidated. Dissolved and particulate organic carbon (DOC, POC) concentrations were measured at several stations in the Sulu Sea during the northeast monsoon of 2007/2008 to understand the dynamics of organic carbon in this unique internal sea. Analyses of primary productivity estimates, beam attenuation coefficient (at 660 nm) profiles, and correlation coefficients among DOC, POC and other parameters (e.g., apparent oxygen utilization) at different layers of the water column indicate that surface primary productivity, upwelling, bottom intensified flows across sills, and ventilation from shallow sills, which may contain semi-labile DOC that is estimated to largely contribute to microbial respiration in the bathypelagic layer, are the major processes that affect the DOC and POC distributions in the Sulu Sea. The variability of these processes should be taken into consideration when assessing the sustainability of internal and marginal seas as carbon sinks.
1. Introduction
The formation of organic matter through primary production is a major pathway for the sequestration of anthropogenic carbon dioxide (CO2) and is therefore important in climate studies. The strength of this “biological pump” and the fate of carbon fixed as particulate organic carbon (POC), which escapes grazing and remineralization, determine the amount of carbon exported to the ultimate sink, i.e., the sediments. Fixed carbon may successfully reach the sediments as organic particulates or become part of the dissolved organic carbon (DOC) pool. Both forms interact with each other (e.g., adsorption of DOC onto POC) and with various other biogeochemical processes (e.g., regeneration of dissolved inorganic carbon (DIC) and nutrients, scavenging of trace metals and radioisotopes, vertical migration of zooplankton, bacterial respiration, sediment resuspension) that provide clues about their distribution in the water column. Comprehensive reviews of these processes and those pertaining to the dynamics of the marine organic carbon cycle have been provided by several works [1,2,3,4]. In addition, particulate beam attenuation coefficients have been used as an optical index for phytoplankton biomass and were found to be better correlated to POC than phytoplankton carbon [5,6]. Beam attenuation at 660 nm is a measure of light scattering by total suspended particulate matter and is also sensitive to inorganic, detrital, heterotrophic particles and suspended sediments [6]. As part of the marine carbon cycle, transport mechanisms are essential, not only vertically (gravitational settling and overturning circulation) [7,8] but also horizontally (through advection) [9,10,11], regionally (through shelf to open ocean export) [12,13,14,15,16,17], and globally (through the thermohaline circulation) [1,3,17]. Yet, while the efficiency of the DOC pool as a long-term store of carbon is seemingly strengthened by the proposed production of recalcitrant DOC by microbes (i.e., the microbial carbon pump) [18], the POC pool, on the other hand, is challenged by ocean acidification because the dissolution of calcium carbonate, which serves as mineral ballast for organic material, weakens the biological carbon pump [19,20].
The organic carbon contents of Sulu Sea sediments are relatively well studied compared to organic carbon concentrations in the water column. This has been brought about by a number of paleoclimatic [21,22,23,24,25,26] and petrochemical surveys [27] that reported high sediment accumulation rates (from ~6 cm 1000 yr−1 to 100 cm 1000 yr−1) and a moderately high organic carbon content of the sediments (mostly 0.5–2%, ~1% even at the abyssal plains, and 3% in source rocks). These have been attributed to an interplay of factors, including, among others, primary productivity, sediment transport, and tectonic activity, the latter of which largely affected the depositional processes and changes in the water column distributions of temperature and dissolved oxygen in the Sulu Sea’s geological history [21,22,23,24,25,26]. These two factors, in turn, control diagenesis, bioturbation, and the resulting organic carbon preserved in the sediments.
The available POC data in the Sulu Sea date back to 1972 and indicates the rapid downward transport of particulate matter from the surface to the depths [28]. To our knowledge, there are no data published yet on the DOC concentrations of the Sulu Sea. Hydrostatic pressure and the quantity and quality of DOC were suggested as possible reasons for the observed depth-dependent, vertical community structure of bacteria in the basin instead of the anticipated temperature and dissolved oxygen effects [29]. Nonetheless, the DOC data to substantiate these suggestions are not yet available.
The objective of this study is to determine the processes (physical, biogeochemical) that influence the concentrations of DOC and POC in the Sulu Sea during the northeast monsoon of 2007/2008. We hypothesize that organic carbon distributions will be affected by the major processes that were identified to affect the dissolved inorganic carbon distributions, e.g., primary productivity, bottom intensified flows along a topographic barrier, upwelling, and ventilation (Ferrera et al., 2017). As such, the data analyses involved the division of the water column into different depth layers, e.g., 0 m to mixed layer depth (MLD), below MLD to 200 m, 300 m to 1000 m (mesopelagic layer), and 1500 m to bottom depth (bathypelagic layer), and the examination of the linear relationships among DOC, POC, and other parameters at these layers to properly describe the prevailing physical and biogeochemical processes that affect the organic carbon distributions within the basin. The results of this study may be used as input to ocean biogeochemistry models that could be used to assess the sustainability of Sulu Sea’s carbon sink capacity in the following years.
2. Materials and Methods
2.1. Water Sampling
Water column profiles of temperature, salinity, dissolved oxygen, chlorophyll a, and other hydrographic data was obtained using a Conductivity–Temperature–Depth (CTD) profiler (Sea-Bird Electronics 911 plus, Washington, DC, USA) mounted onto a bottle rosette system. Transmittance measurements at 660 nm from a C-Star transmissometer (Sea-Bird Scientific, Washington, DC, USA) attached to the CTD was used to describe the behavior of particles across a topographic barrier.
Six stations in the Sulu Sea and one station in the South China Sea were occupied for organic carbon measurements (Figure 1). High- and low-productivity stations were designated based on estimates of surface primary production using the Vertically Generalized Production Model (VGPM; see [30] for details on the VGPM calculation and Table 1 therein for calculated estimates of primary production at each station). Water samples for DOC analysis were collected in precombusted (550 °C, 3 h) 500 mL borosilicate bottles and preserved with ~125 μL of saturated HgCl2 [31]. For POC, 2 L of seawater were acquired at about sixteen standard depths from 0 m to 1000 m at each station following the Joint Global Ocean Flux Study protocols [32], except for the two deep casts in the high- and low-productivity areas (Stations [Stas.] 77 and 79; Figure 1) where samples were obtained until about 4000 m. Particulate material was filtered through 25 mm precombusted (450 °C, 5 h) glass-fiber filters (GF/F; nominal pore size = 0.7 μm) in an in-line Deldrin holder of a fabricated filtration system. Filter papers were wrapped in precombusted (450 °C, 5 h) aluminum foil and stored in a deep freezer for later analysis at National Sun Yat-sen University’s Department of Oceanography in Kaohsiung, Taiwan.
2.2. Laboratory Analyses
DOC was measured using a high temperature liquiTOC II Total Organic Carbon (TOC) analyzer (Elementar, Langenselbold, Germany) [31]. Prior to analysis, water samples were filtered through precombusted GF/F (450 °C, 5 h) to remove any particulate material. The DOC concentration was determined using the non-purgeable organic carbon (NPOC) method. First, the DIC signal and purgeable organic carbon were removed after acidification with HCl. After this, the NPOC content was determined using high-temperature digestion, in which organically bound carbon was oxidized in a dynamic heater for matrix separation (950 °C) and then in a catalytic chamber for post-combustion (1150 °C). The produced CO2 signal was measured by an infrared detector. Standard Certified Reference Materials for deep seawater (DOC = 45 ± 2 μM) from Hansell Lab were used to check instrument performance. The precision of the analyses was better than 3%.
POC was analyzed using a Vario EL III CHNOS Elemental Analyzer (Elementar, Langenselbold, Germany). Frozen filter papers were thawed and dried at 60 °C until constant weight. Filter papers were placed inside small tin boats, pelletized, and placed onto the rotating sample rack of the analyzer, which led to catalytic combustion tubes with an oxygenated CO2 atmosphere and high combustion (1150 °C) and reduction (850 °C) temperatures. Reference standards with known C compositions (NIST, BCSS, p9, and p11) were analyzed before and after sample runs to check instrument performance. Overall, there was a very good correlation between the resulting mg C and the area C of the standards (r2 = 0.9949 to 0.9999).
3. Results and Discussion
3.1. General Distribution and Surface POC and DOC Concentrations
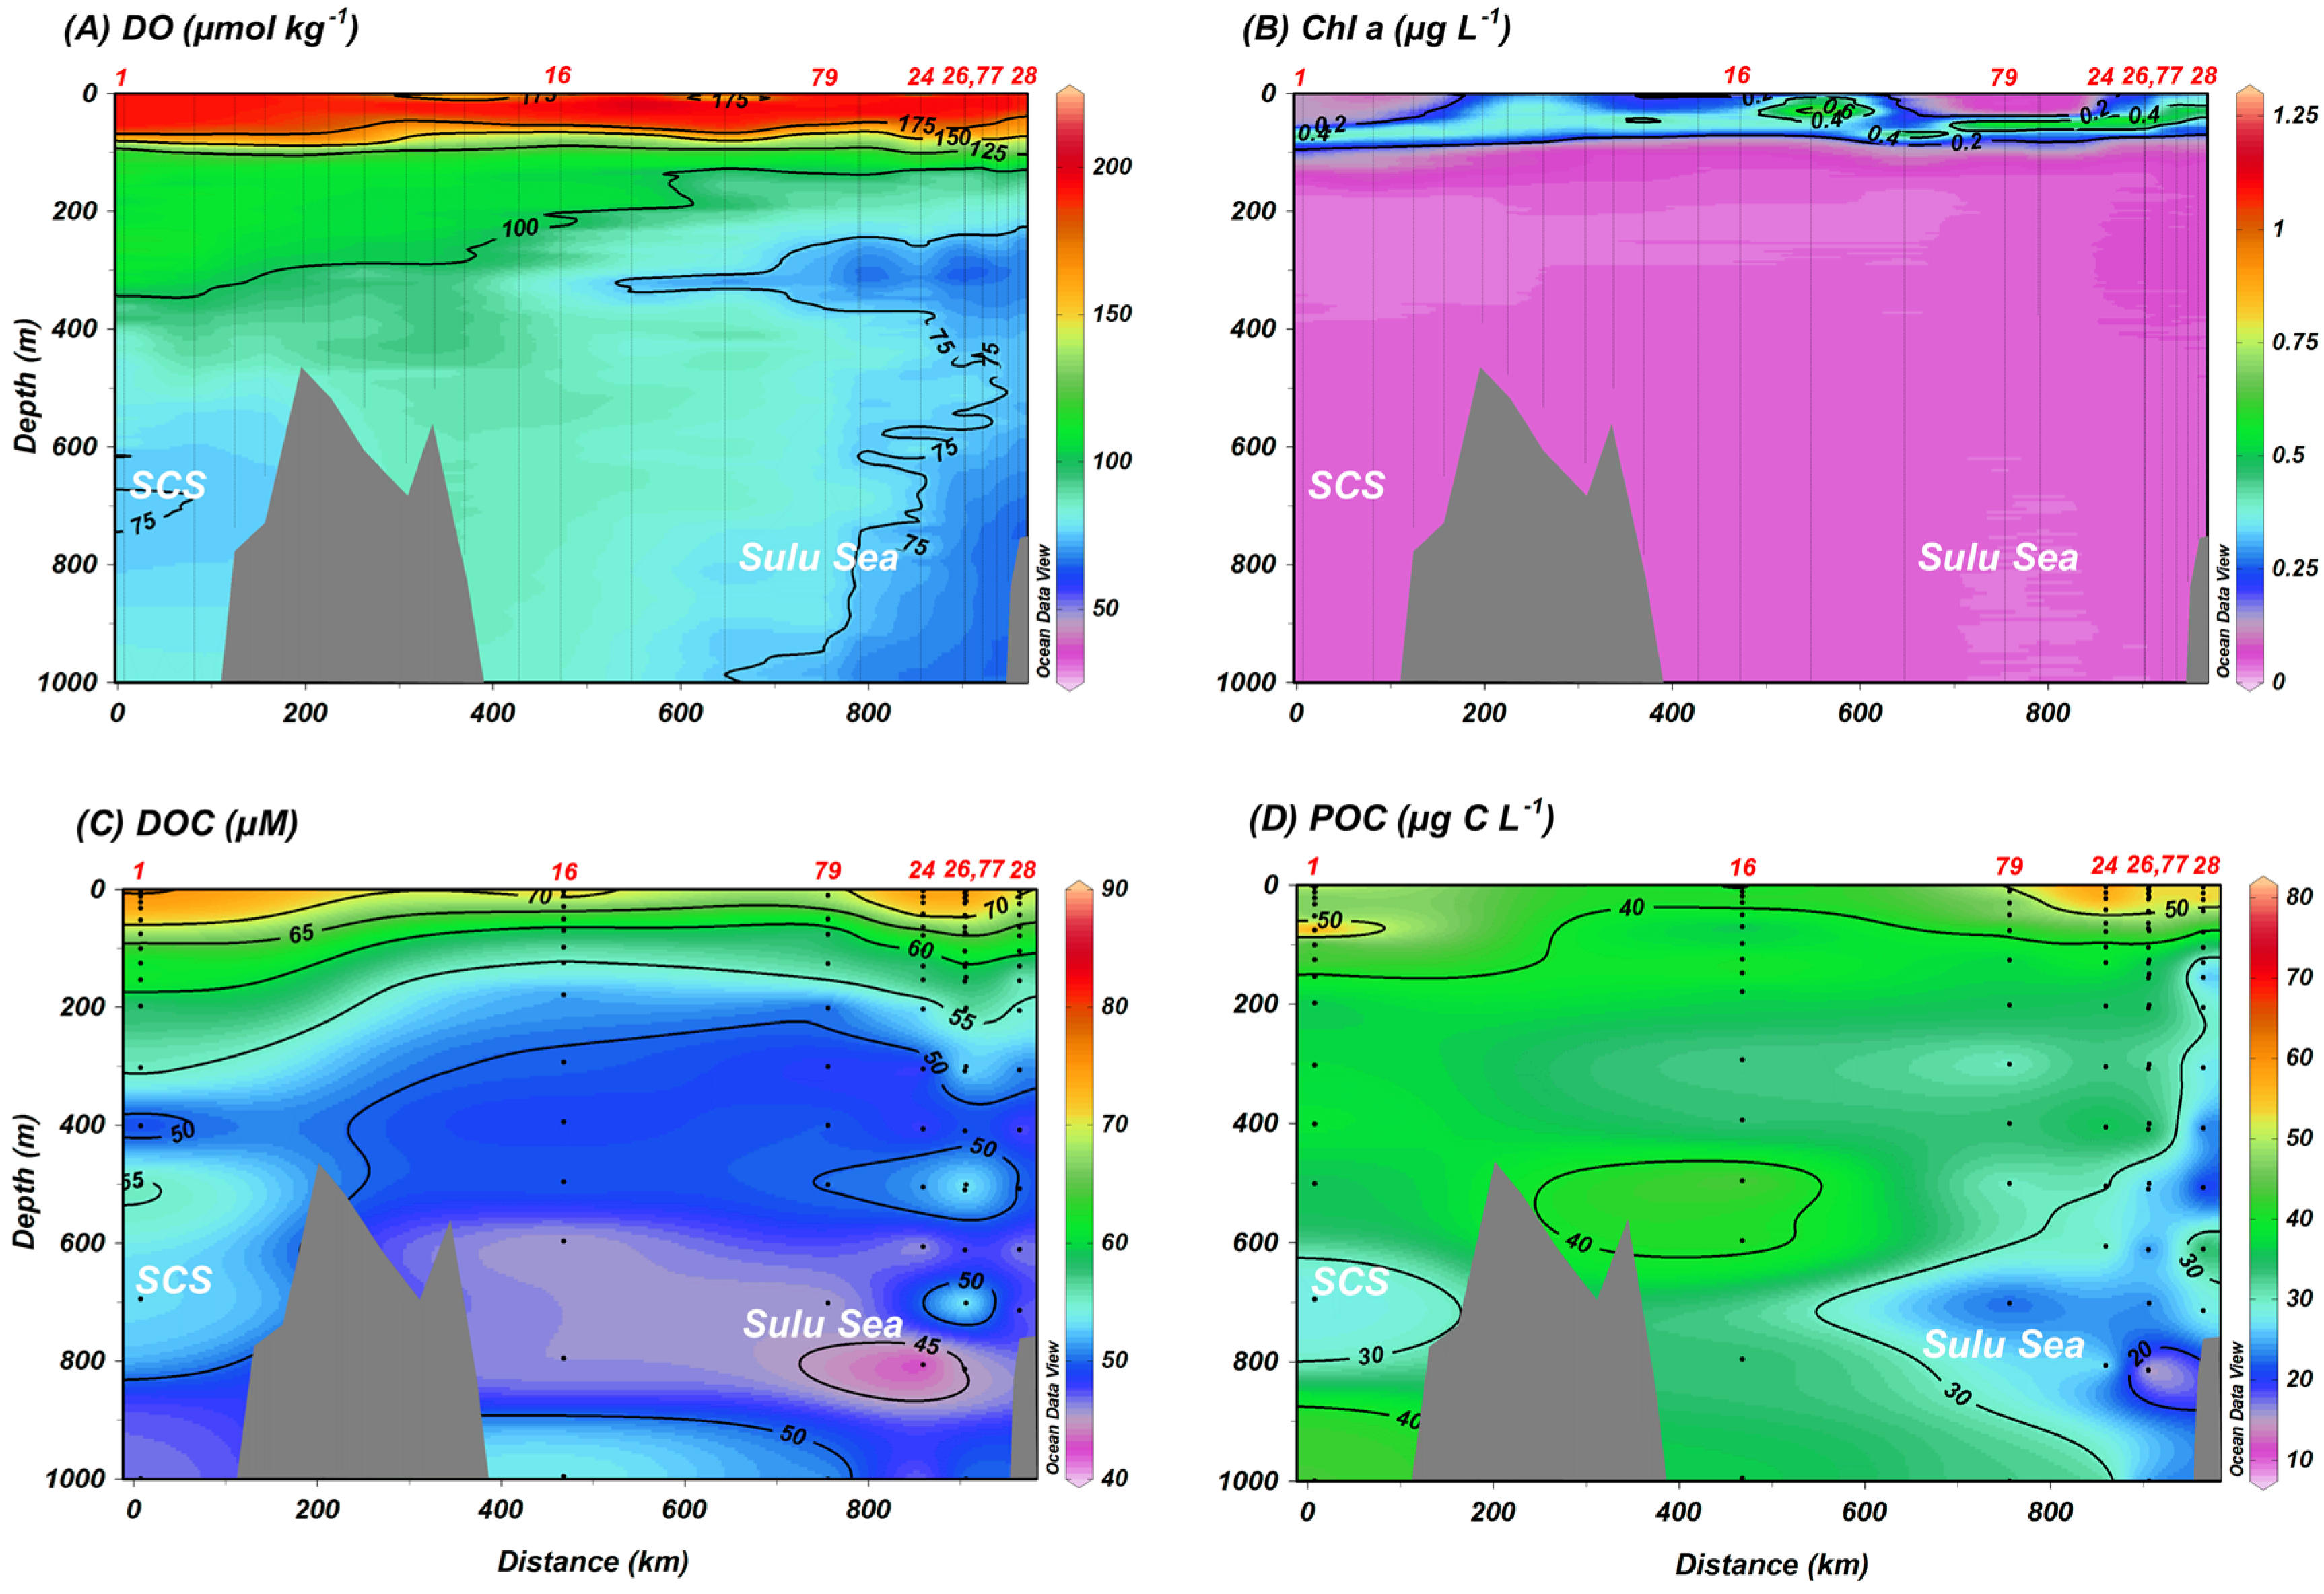
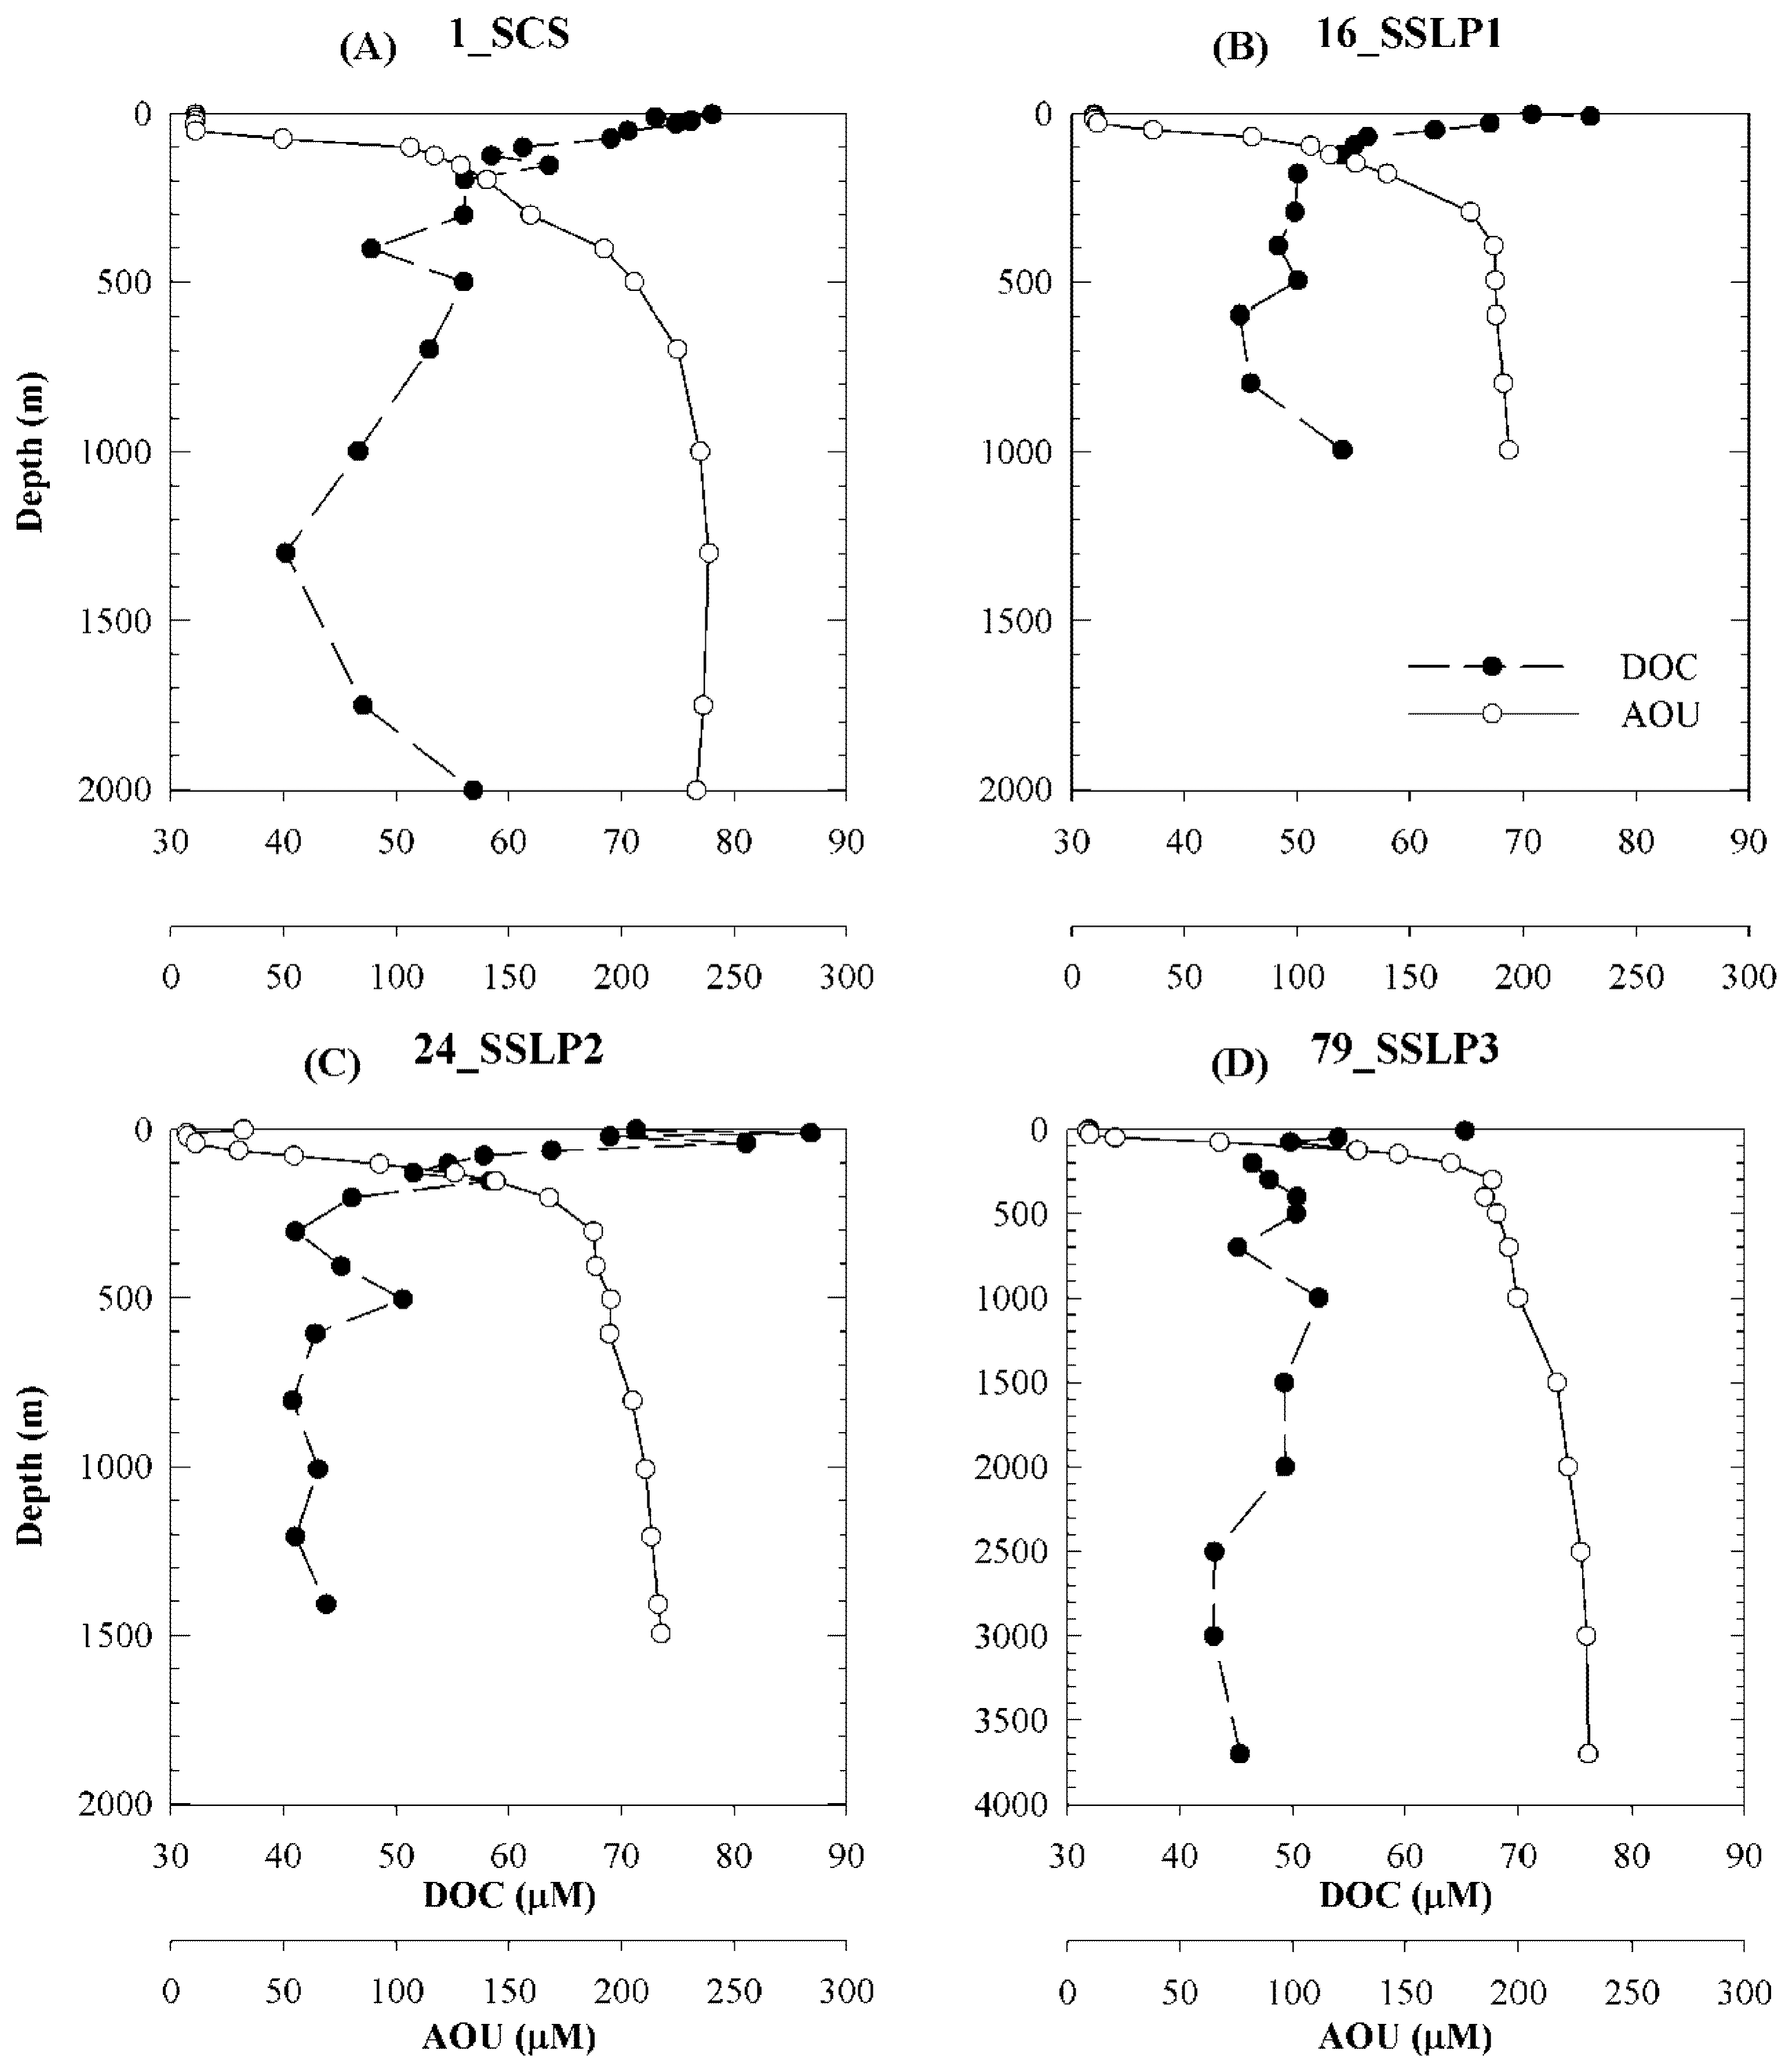
Figure 2 shows the scatter plots of chlorophyll a, DOC, and POC. The highly productive areas at the shelf (stations after Sta. 16) and upwelling region (Sta. 28) and the less productive central Sulu Sea (Sta. 79) were clearly delineated by surface chlorophyll concentrations (Figure 3B). The band of subsurface chlorophyll maximum along the South China Sea—Sulu Sea section is also illustrated. The inflow of the core of low-chlorophyll concentrations at ~200 m (Figure 3B), located at the same depth as the core of high-salinity, subtropical, lower water (Figure 3 in [33]), is not blocked by the sills at the Mindoro Strait and Panay Strait. This supports the results of previous studies in the Sulu Sea [33,34,35,36] and of [30], which used hydrographic data obtained from the same research cruise. These data show the different potential temperature, salinity, and potential density profiles between the South China Sea and Sulu Sea starting at ~400 m and below due to the sills at Mindoro Strait and Panay Strait (~440 m and ~570 m, respectively) [37] that confine the deep waters of the South China Sea to its basin. As a result, surface waters up to a few hundred meters freely enter the basin, while waters overlying the sill depth spill over and ventilate the deeper waters of the Sulu Sea.
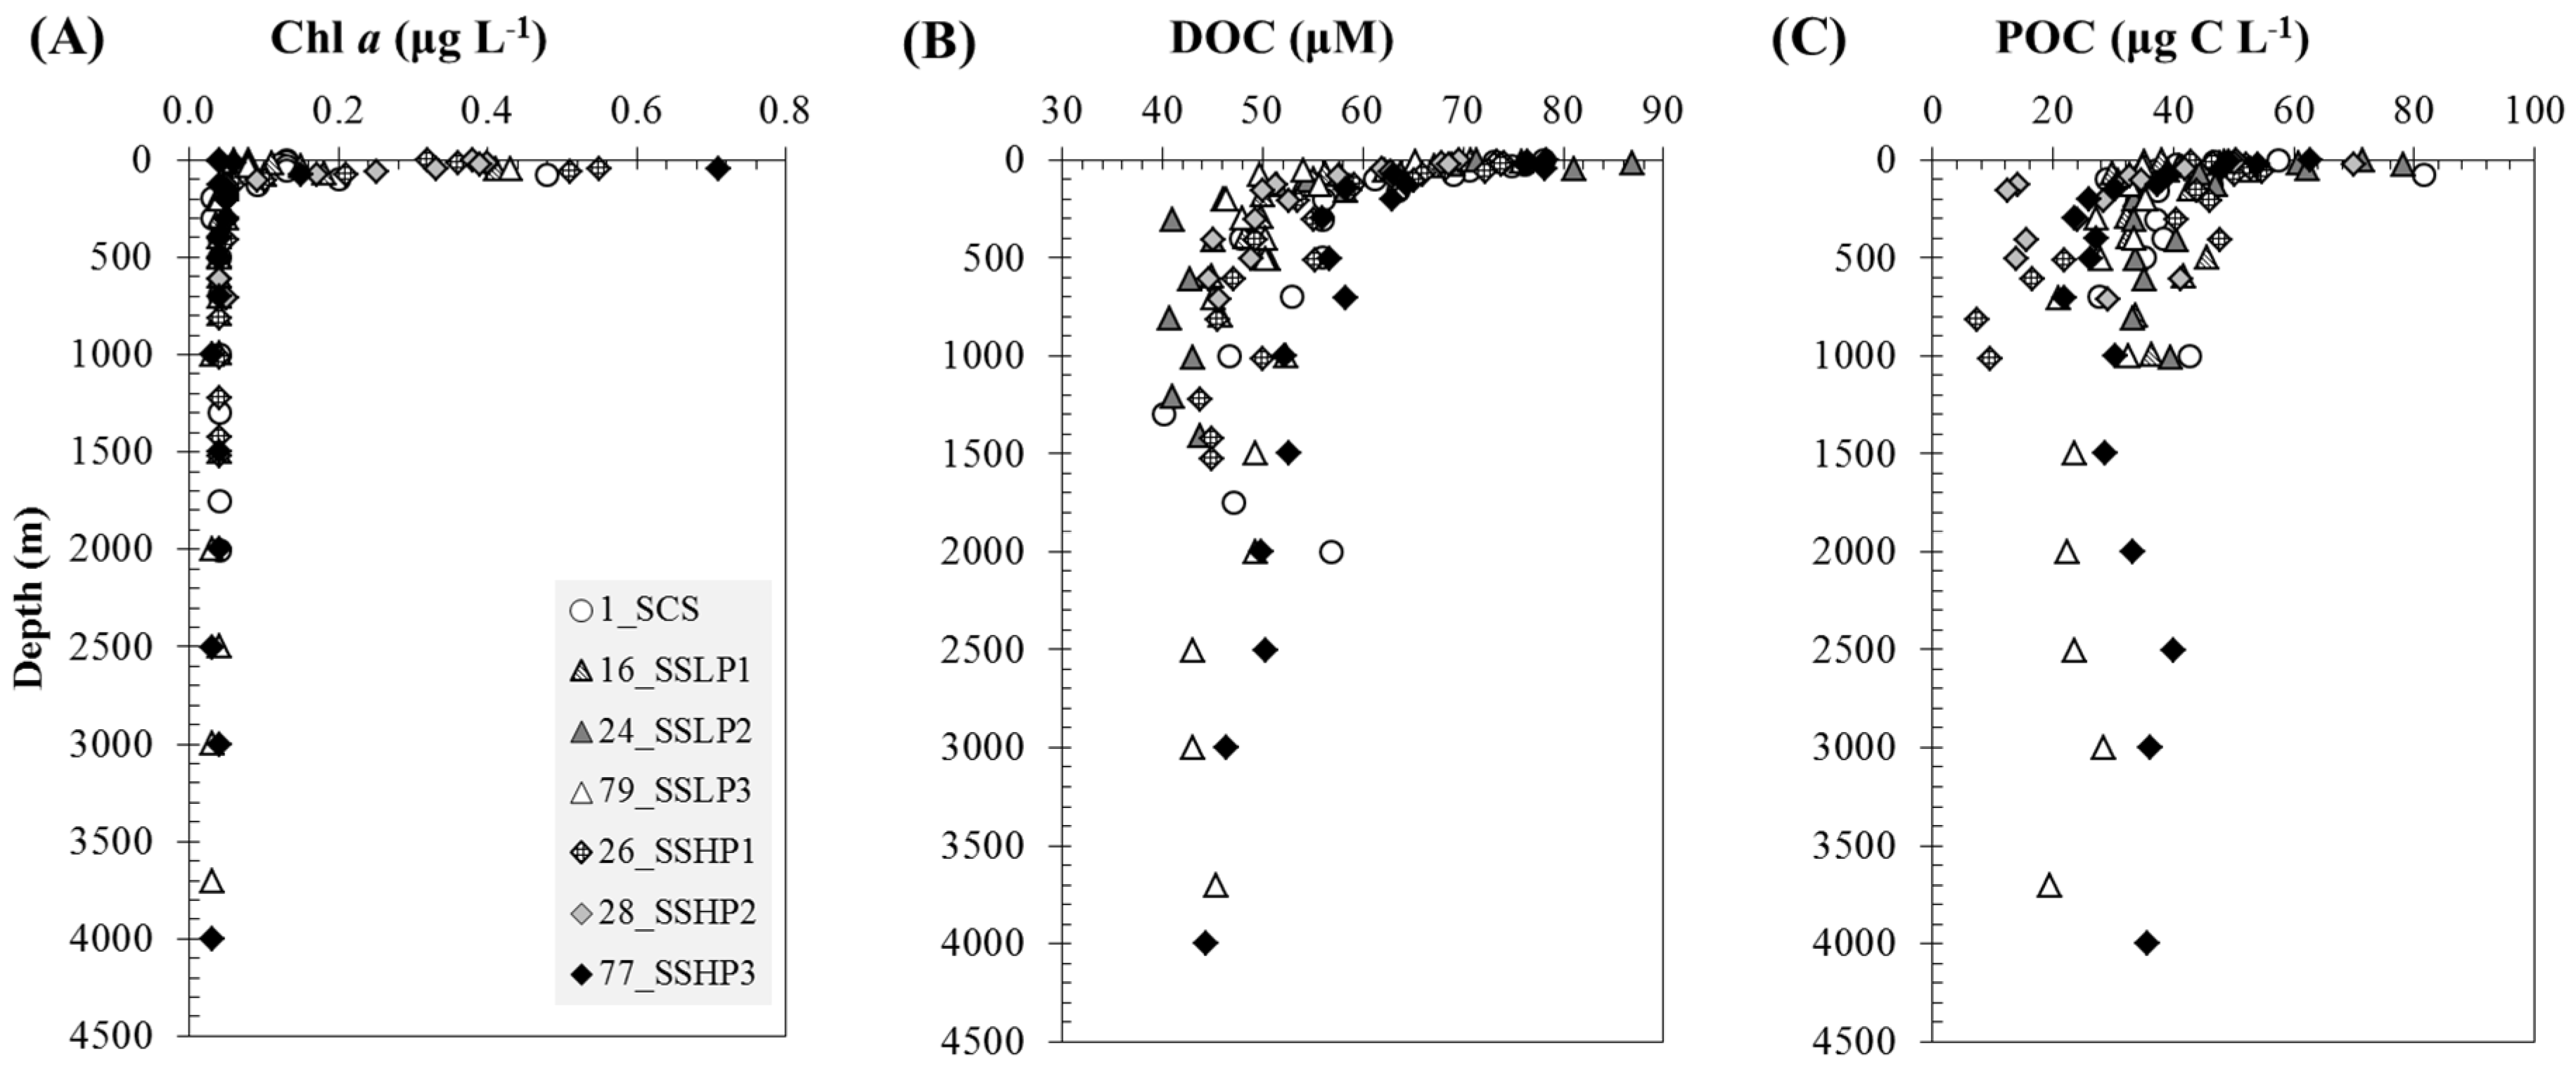
Water-column DOC concentration ranged from 40 to 87 μM, and POC concentration ranged from 7 to 82 μg C L−1. The average DOC and POC concentrations at specific depth layers are shown in Table S1. Mixed layer DOC was highest at Sta. 24 and Sta. 77 (avg. 77 μM), and lowest at Sta. 79 (avg. 60 μM). These DOC values are within the range reported for surface waters in general [2,4], in the northern South China Sea in 2002–2004 [38], in the East China Sea in 2009–2011 [39], and in the east Taiwan Strait in 2013 [40]. Furthermore, these values are typical of the high values found in tropical and subtropical latitudes [3]. For POC, all sampled stations were within the range measured by [28] at the four stations occupied in the Sulu Sea in June 1972. Sta. 24 had the highest mixed layer concentration (avg. 68 μg C L−1 POC), while Sta. 16 had the lowest (avg. 40 μg C L−1 POC). High-productivity areas generally had higher DOC and POC than low-productivity areas except for Sta. 24, which had the highest DOC and POC despite it being a low-productivity area, and Sta. 28, which had a reasonably low DOC due to upwelling subsurface waters with lower DOC (see Section 3.3 for the discussion on upwelling). For all the occupied stations, including the South China Sea, DOC and POC made up 95% and 5% of TOC, respectively, which follows the typical distribution in oceanic waters [1].
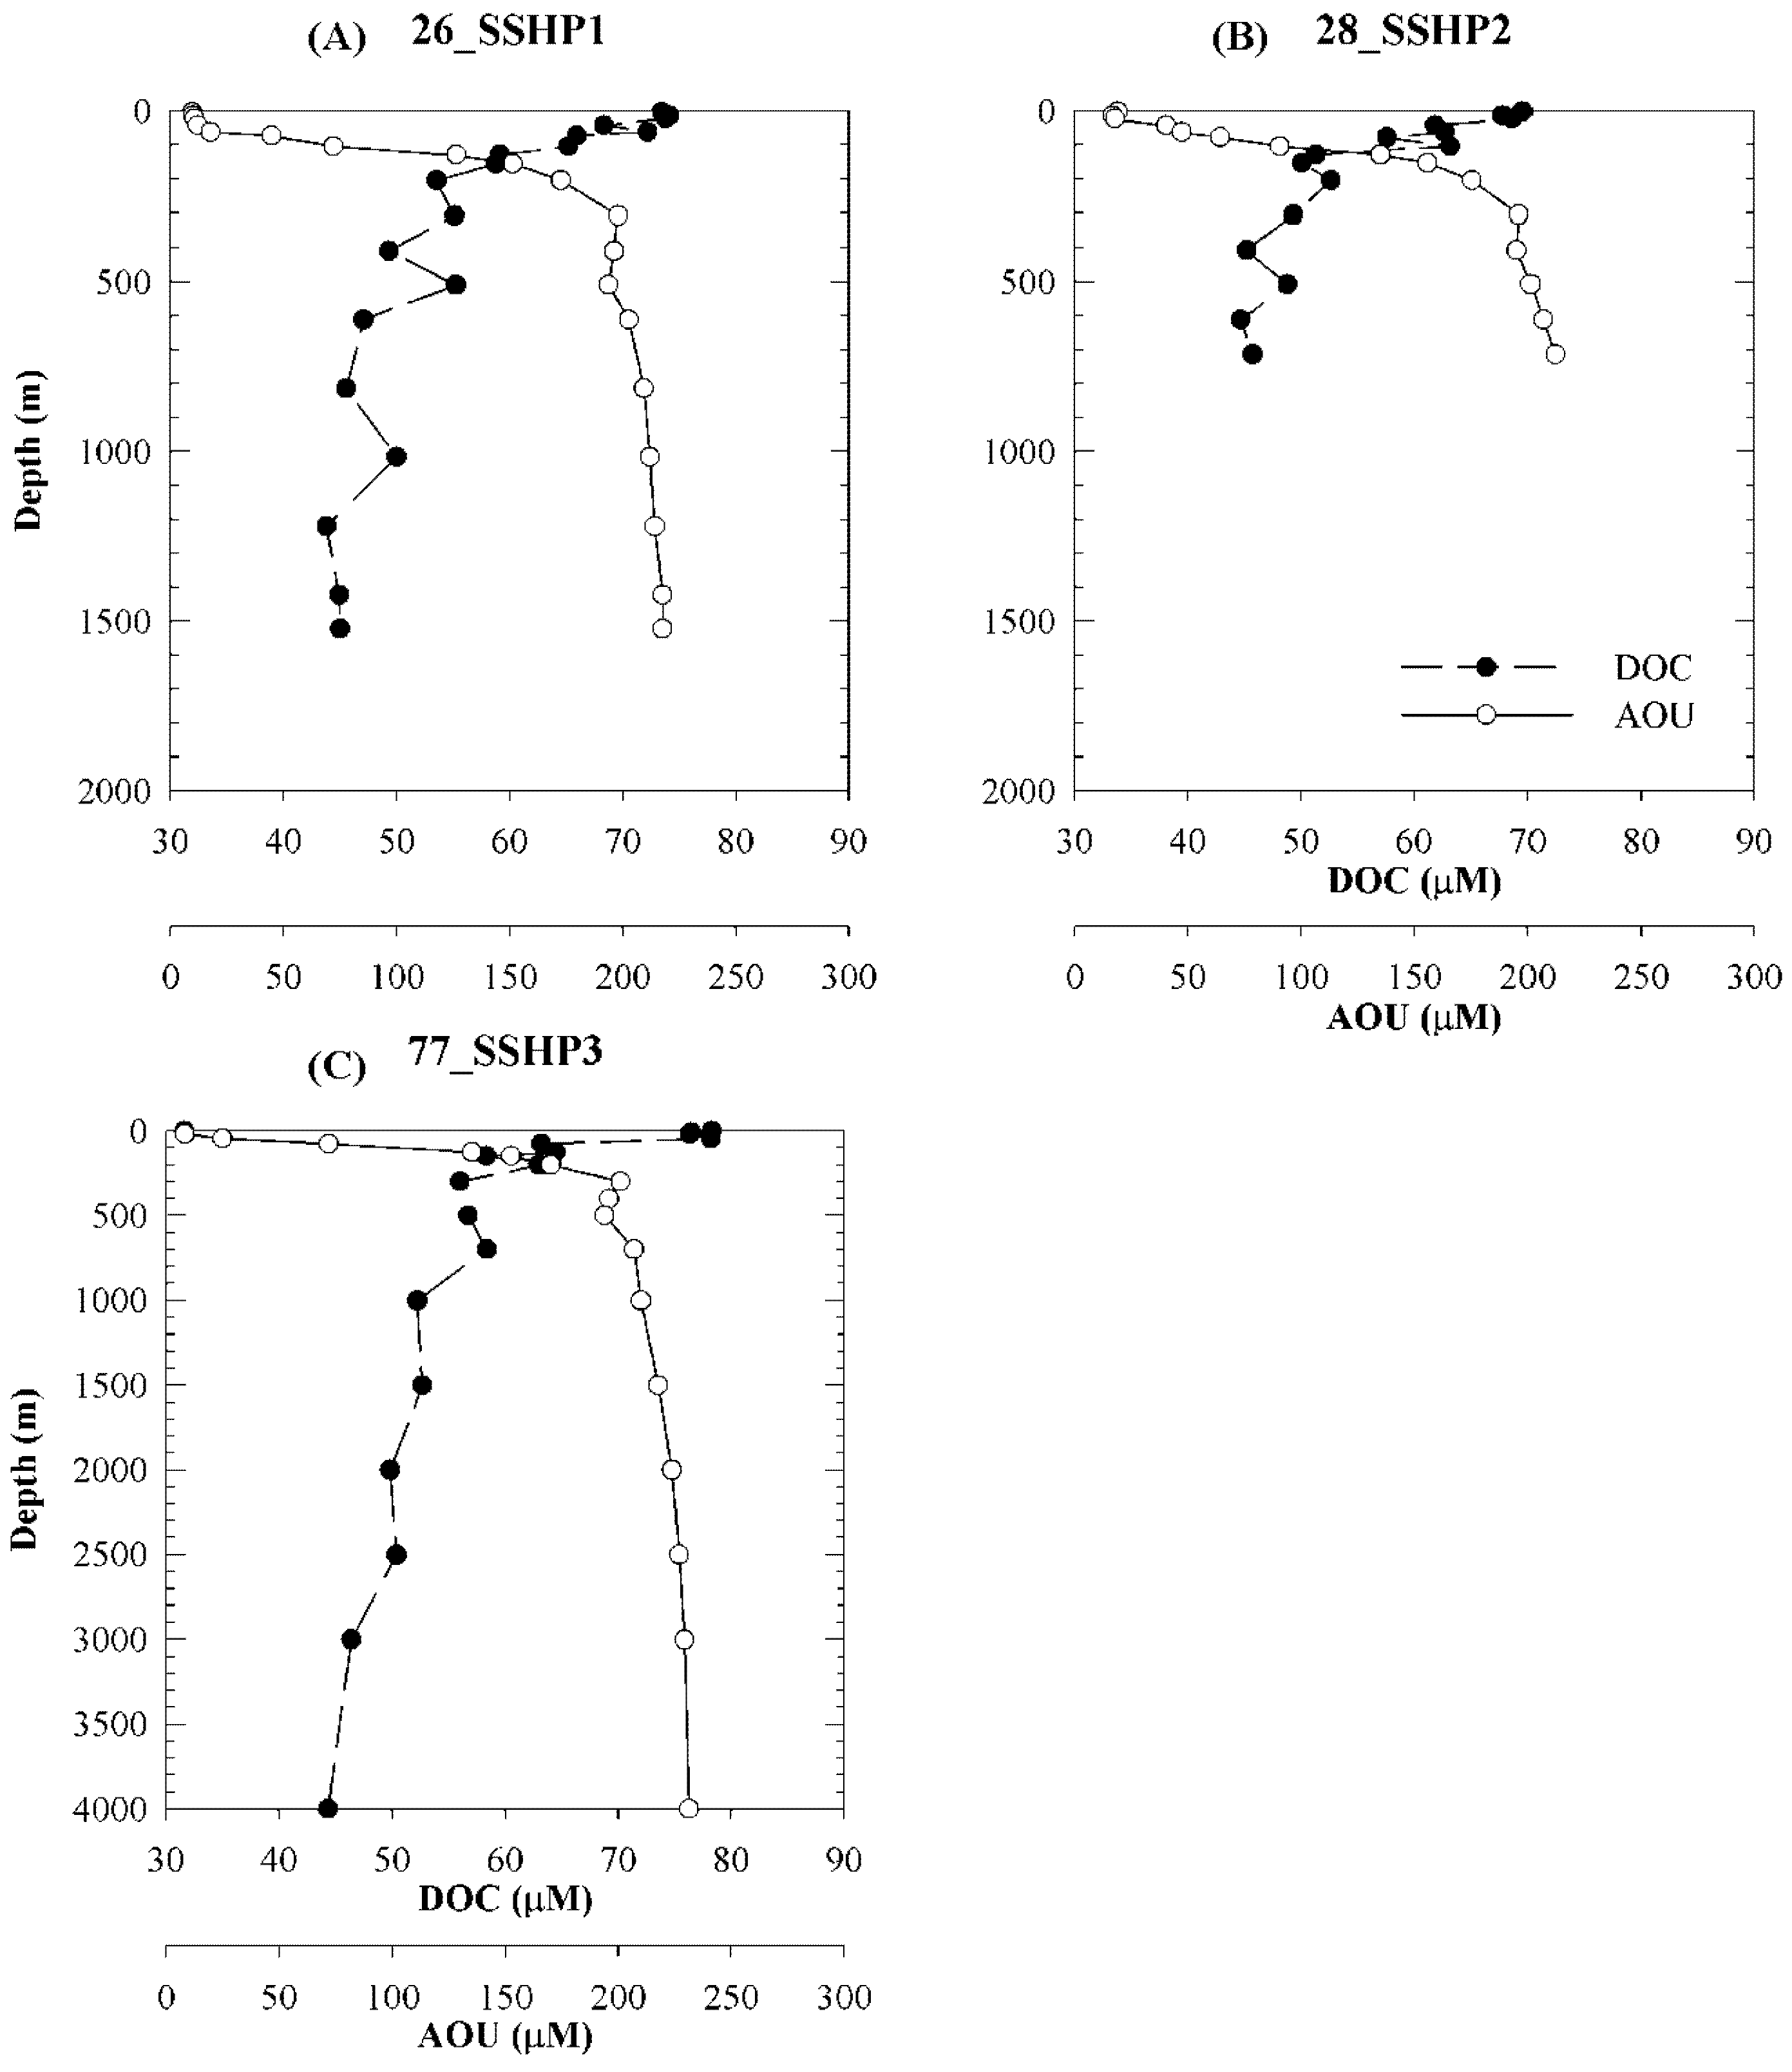
The data also showed higher mixed-layer DOC and POC in Sta. 77 (DOC avg. 77 μM; POC avg. 55 μg C L−1) than in Sta. 26 (DOC avg. 72 μM; POC avg. 50 μg C L−1; Table S1), which are only ~1.5 km apart. The former station was occupied 21 days after the latter. These results could indicate a temporal increase and net production of organic carbon coincident with the development of the northeast monsoon. This observation supports the higher vertically generalized net primary productivity (NPP) estimates (using the 8-day averaged chlorophyll a) in Sta. 77 (432 mg C m−2 d−1) than in Sta. 26 (278 mg C m−2 d−1) [30].
Both DOC and POC profiles show enrichment at the surface due to production, and depletion at depth via organic matter decomposition and remineralization (Figure 4, Figure 5 and Figure 6). The correlation coefficients of POC-DOC linear relationships are shown in Table S2. Correlations were made for different depth layers (e.g., surface to 200 m, 300 m to 1000 m, 1500 m to the bottom) to properly identify the processes prevailing at these depths. Property-property plots of POC and DOC from the surface to 200 m (plots not shown) depicted an overall positive correlation between POC and DOC, with the strongest correlation at the high-productivity Sta. 77 (r2 = 0.80, p = 0.003) and upwelling Sta. 28 (r2 = 0.84, p = 0.001). There was a very low POC-DOC correlation at Sta. 16 (r2 = 0.03, p = 0.664), southwest of the Mindoro and Panay Straits, possibly due to the very strong flow above 200 m [41], which resulted in vertical mixing.
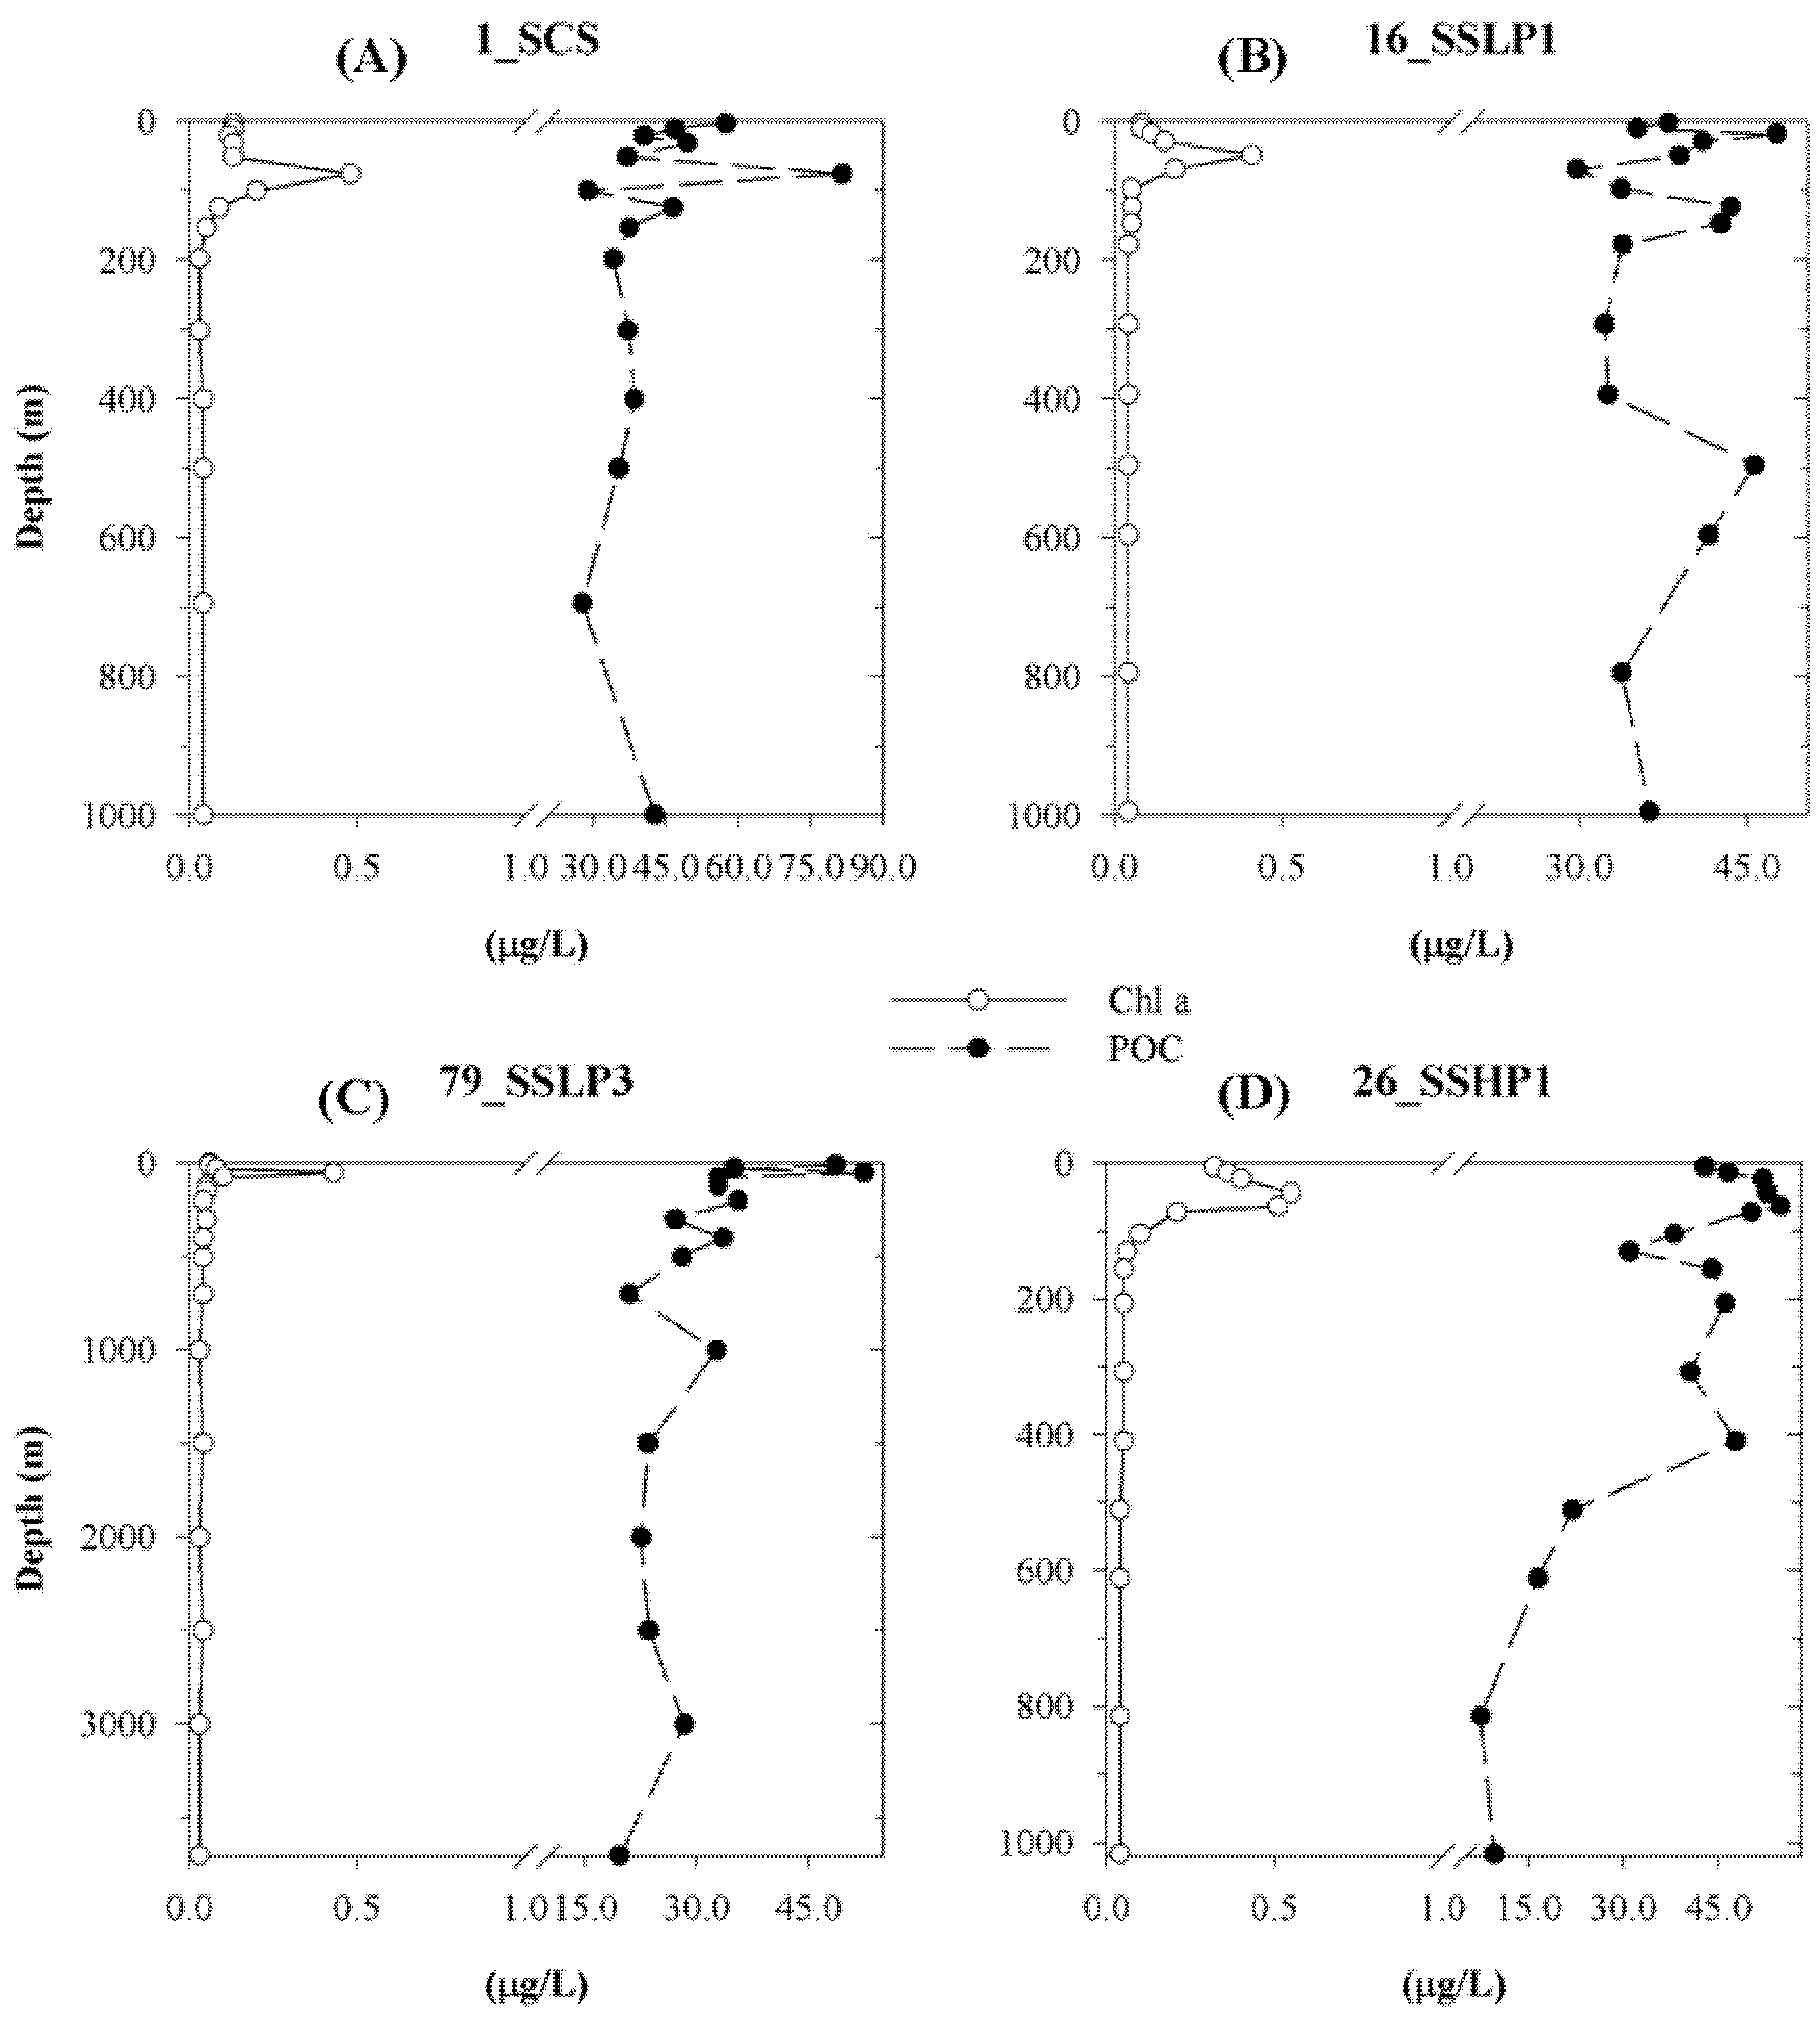
Chlorophyll a represented 0.1–1% of POC. The subsurface chlorophyll max was typically at or very close to the POC maximum, except for Stas. 16 and 77 (Figure 4). The highest contribution of phytoplankton biomass to POC appeared at the mixed-layer depth above the thermocline, which is typically around 125 m. Below the thermocline, peaks and changes in POC could be due to dead phytoplankton; zooplankton; and other non-living particles (e.g., detritus, fecal material), aggregates, and/or suspended materials in the water column.
3.2. Organic Carbon Dynamics across the Mindoro and Panay Straits
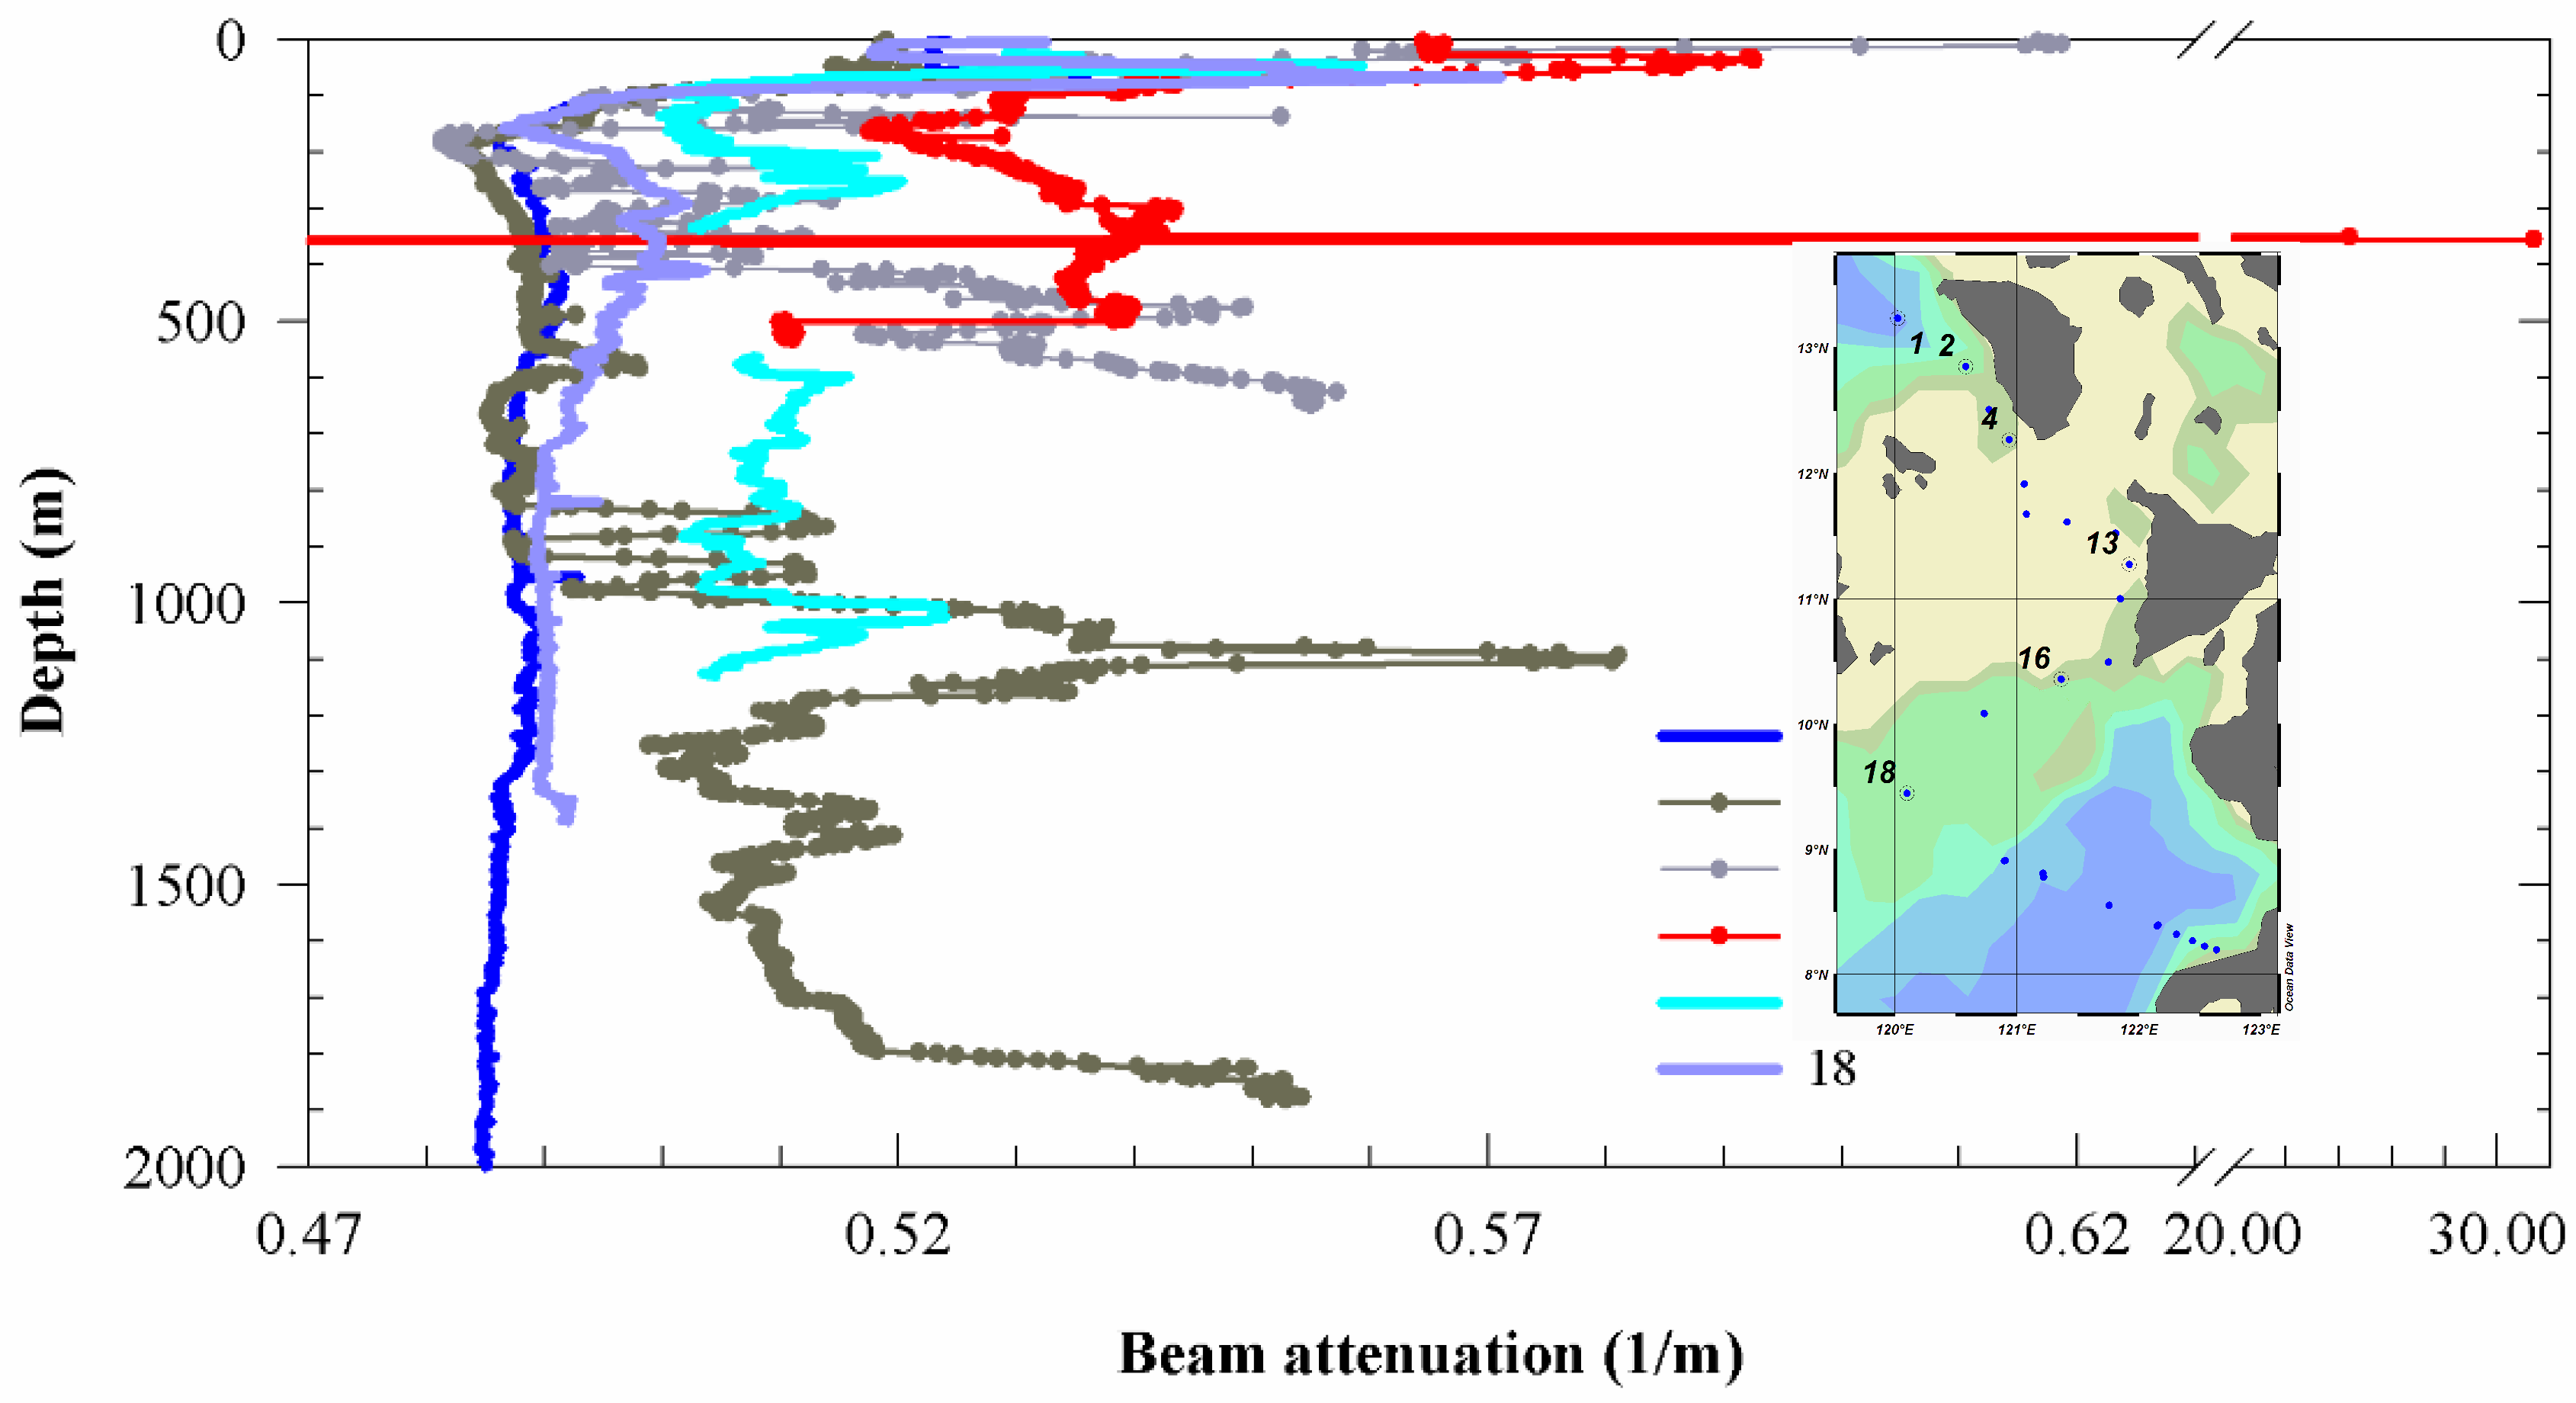
The beam attenuation profiles from the South China Sea, traversing across the sills at Mindoro Strait and Panay Strait, to the northwest basin of the Sulu Sea are shown in Figure 7. During the PhilEx joint cruise, beam attenuation profiles were only available from Sta. 1 until Sta. 20, and therefore were not enough to be correlated with stations that had POC data. Nonetheless, the profiles obtained at the occupied stations were sufficient to provide an indication of the behavior of particles across a topographic barrier.
Typical beam attenuation profiles displayed elevation near the surface and at the subsurface, which are a few meters above the chlorophyll maximum (Figure 7). Below the subsurface max in the upper 70 m, a broad maximum from ~200 m to ~550 m was common in all selected stations. Beam attenuation at Sta. 1 (South China Sea) showed a nearly steady profile from below 800 m until the bottom depth of 2700 m. At Sta. 2 (the closest deep connection between the South China Sea and Sulu Sea), huge spikes started to appear at ~1150 m, 1400 m, and at the bottom depth of 1900 m. Data from a moored profiler located closest to this station (see [43] for details about the mooring), deployed primarily to study internal wave environments within the Philippines seas, showed deep energy from 1500 m to 1800 m that was “mostly upward propagating and of fairly large vertical scale” [43] (p. 108). The beam attenuation response could be due to the upward drag experienced by the deep water as it encounters the base and wall of the Mindoro Sill. High values present at the bottom of Sta. 4 (before entering the Palawan Shelf), which were about the same magnitude as that at the bottom of Sta. 2, possibly indicate that the walls of the Mindoro Sill were continuously experiencing drag or bottom shear created by incoming waters from the South China Sea. Sta. 13 (the Panay Sill), which is also the closest to land, registered the highest beam attenuation between 200 m and 500 m compared to other stations, with a very sharp spike at ~350–360 m characterized by beam attenuation values more than 50 times that of the overlying water. After which, beam attenuation decreased to the bottom but were not as low compared to those at the same depths in Stas. 1 and 2. At Sta. 16 (southwest of the sill), the range of values from ~200 m to 1000 m was almost the same, possibly indicating a vertically mixed water column, followed by a small peak at 1000 m. Reported bottom-intensified flows from ~400 m to 570 m (temporal mean velocity >0.75 m s−1 at 520 m) [37] could have caused the temporary failure of sensors and the absence of data at these depths. These unique characteristics of the flow of organic carbon at this station compared to other stations may explain the very low correlation coefficients (r2 < 0.03) between POC and DOC production at the upper 200 m and POC decomposition to DOC at the depths of 300–1000 m (Table S2). Further into the northwest Sulu Sea basin and far from the energetic environment, the beam attenuation profile at Sta. 18 resembled those of Stas. 1 and 2. The typical dome at ~200–700 m appeared again but with a greater magnitude, indicating that a greater amount of suspended material was ending up in the Sulu Sea at these depths.
The effect of vertical mixing and strong benthic overflow at Sta. 16 manifests as downward sloping isolines of dissolved CO2 parameters (Figure 5 of [30]). For DOC, no such sloping isolines were observed, but rather a plume of relatively high POC (~44 μg C L−1) was observed to cascade down the sill to ~600 m of the northwest basin of the Sulu Sea (Figure 3D). This increase in POC (~32 μg C L−1) at 500–600 m compared to the overlying layers (~32 μg C L−1) can be seen as a peak in Figure 4B. Correspondingly, the DOC profile showed a decrease at 600–800 m (~45 μM) relative to the overlying depths (~50 μM) but without the corresponding increase in apparent oxygen utilization (AOU), which is a measure of the oxygen consumed for organic matter remineralization from the time when a parcel of water was last in equilibrium with the atmosphere (Figure 3C and Figure 5B). This could imply that the incoming waters from the South China Sea from ~400–570 m could have caused bottom sediments to resuspend, resulting in the creation of a nepheloid layer with high concentration of suspended material as depicted by the beam attenuation profiles. However, the POC concentration was not as high as the characteristic concentration of suspended material defined by [1] for a nepheloid layer (200–500 μg L−1) as it was almost of the same magnitude as that at the subsurface POC maximum. It is possible that the resuspended sediments are mainly composed of terrigenous and carbonate material from the nearby islands and the Palawan Shelf, with organic carbon contents corresponding to the measured POC concentration, although this requires further investigation. The resuspension of bottom sediments has been reported to increase POC at the East China Sea continental shelf [12,14,44]. The resulting decrease in DOC could be due to aggregate formation and/or adsorption onto POC at the turbulent region. DOC adsorption onto suspended POC has also been a proposed mechanism for its low concentration in the North Pacific deep waters [7]. DOC increased again at 1000 m (Figure 5B and Figure 9C), which could be due to DOC flux from marine sediments [2]. This could also be a source of chromophoric dissolved organic matter (CDOM) due to sediment resuspension [2,45,46] or benthic remobilization [14].
It has been previously hypothesized that turbidity currents along the slopes of Mindoro Strait aid in the ventilation of the deep Sulu Sea [47]. Although it has been put forward that such sediment loads would not be enough to bring about the required density for the water to sink into great depths [35], these sediments do reach the sea floor, get deposited along the slopes, or remain suspended in the water column, all representing substantial material transport of biogeochemical significance. For instance, the advection of resuspended sediments from continental slopes has been linked to the presence and high concentrations of bioactive trace elements such as Fe, both in dissolved and acid-dissolvable particulate forms, in the Sulu Sea [48,49,50]. This highlights the importance of shelves, sills, and continental slopes and their associated flow dynamics as sources of particulate and dissolved material in deep, semi-enclosed basins. It has been reported that a tidally driven exchange at the San Bernardino Strait, a narrow and shallow connection of the eastern Philippines to the Pacific Ocean, carried elevated concentrations of particles other than phytoplankton during flood tides, resulting in the entrainment and transport of particle loads towards the inland sea [51]. Such a phenomenon might also be happening for the tidally active Sibutu Passage and Sulu Archipelago, which have been proposed to be the conduit of the denser Sulawesi Sea waters from ~200–700 m that plunge and ventilate the depths deeper than 1250 m of the Sulu Sea [35,36].
3.3. Organic Carbon Distributions at the Zamboanga Upwelling Region
According to [52], the density-driven overflow of ventilating waters into a deep basin is compensated by upwelling of resident waters within the confines of the basin that are made less dense due to vertical mixing. For the Sulu Sea, displaced waters have been found to exit at the Sibutu Passage and at the southern part of Sulu Archipelago [41]. In addition, a wind-driven upwelling has been observed off the coast of Zamboanga as a result of alongshore winds, which blow through the Dipolog Strait and parallel to the Zamboanga Peninsula during the northeast monsoon [53]. The results of an analysis of dissolved CO2 distribution [30] showed manifestations of this upwelling in the upper 70 m of the water column using dissolved CO2 parameters (i.e., relatively acidified waters with higher DIC). Correspondingly, upwelling signals were also evident in organic carbon distributions along a section from the central Sulu Sea (Sta. 24) towards Zamboanga (Sta. 28), although the shallowing of isolines were more pronounced in the DOC profiles than in the POC profiles (Figure 8). The mixed-layer DOC (avg. 67 μM) at Sta. 28 was the lowest among the high-productivity stations (Table S1) due to the upward displacement of waters that were low in DOC because of organic matter decomposition. Low concentrations of DOC (60–70 μM) were also found in the upwelling area at the equatorial Pacific [9,54], and also at the shelf edge of East China Sea northeast of Taiwan, the latter of which is due to dilution by the DOC-poor Kuroshio Current’s subsurface water [14,15,40]. However, mixed-layer POC remained high at this station (avg. 53 μg C L−1) possibly due to a prevailing carbon fixation over decomposition as supported by the very high NPP rates (using the VGPM; 422 mg C m−2 d−1) [30] even during the early part of the northeast monsoon season.
It is noteworthy that while Sta. 24 is considered to be a low-productivity station and actually had the lowest NPP (246 mg C m−2 d−1) during the sampling period, this station had the highest mixed-layer DOC (77 μM) and POC (68 μg C L−1) concentrations (Table S1). The mixed-layer DOC at Sta. 24 was higher by ~7 μM than that at Sta. 28, even though Sta. 24 is located ~108 km away from the Zamboanga Peninsula and the high-productivity region (Figure 8). There should therefore be a mechanism that allowed the accumulation of DOC and POC at this location. We speculate that the waters reaching Sta. 24 are those that were previously located at the surface waters near Zamboanga, are advected offshore, and are displaced by upwelling waters, although further studies are needed to support this hypothesis. The prevailing surface circulation and horizontal advection could have brought these waters to the central Sulu Sea. Such advection has been reported in the equatorial Pacific, where DOC values increase with increasing latitudinal advection: from 60–65 μmol kg−1 at the equator to ~70 μmol kg−1 at 2° N and 2° S and to ~80 μmol kg−1 at 12° N and 12° S [9]. High organic carbon concentrations at Sta. 24 could also come from the advected waters of other high-productivity areas, such as those at the lee-side of Panay and Negros Islands [55]. Regardless of the source, the presence of higher AOU (indicating the likelihood of older waters) at the surface of Sta. 24 (33 μmol kg−1, 29 μmol kg−1, and 10 μmol kg−1 at 2 m, 4 m, and 6 m, respectively, decreasing to a minimum of 6.5 μmol kg−1 at 14 m, and increasing afterwards) than in the underlying waters supports the hypothesis that older waters are being advected to this location. The mixed-layer AOU is usually ~10 μmol kg−1 for the rest of the stations except Sta. 28 (AOU > 16 μmol kg−1). Other factors, including a stable water column and subdued bacterial activity, could also be responsible for DOC accumulation and enrichment in a low-productivity area [14].
3.4. Organic Carbon at Depths
3.4.1. POC
Below the POC maximum, POC concentrations decreased with depth due to organic matter decomposition and consumption and/or gravitational settling of particles (Figure 2C and Figure 4). Unlike the steady chlorophyll profile, the POC profile exhibited smaller peaks at or near 200 m. Additional peaks were also present around 400 m, and for the South China Sea station (Figure 4A), this seems to mimic beam attenuation (Figure 7). The presence of peaks other than those mentioned above were due to bottom-intensified flow at Sta. 16 (Figure 4B) and possibly some lateral supply of particles near the bottom of Sta. 28 (Figure 4E). For the two deep stations, peaks also manifested at 1000 m, and at 3000 m for Sta. 79 (Figure 4C), and at 2500 m for Sta. 77 (Figure 4F). These seeming irregularities in the POC profiles were also observed by Ichikawa (1982) during the southwest monsoon (June) of 1972 and were referred to as the secondary and tertiary maxima.
The average POC concentrations at 300–1000 m (Table S1) at the selected low-productivity stations (~36.5 μg C L−1; Stas. 16 and 24) were higher at than the designated high-productivity stations (~24.4 μg C L−1; Stas. 26 and 28) during the early northeast monsoon. This could be due to inefficient decomposition of POC, low grazing pressures at less productive stations, fast particles settling at highly productive stations, or the inherent physical processes that can prevent decomposition (e.g., strong benthic flows at Sta. 16). During the latter part of the northeast monsoon, the occupied low-productivity cast exhibited lower POC concentrations at this layer (28.4 μg C L−1 for Sta. 79, 25.8 μg C L−1 for Sta. 77) possibly indicating a greater loss of POC induced by the increase in surface productivities coincident with the development of the monsoon season. Among the stations, Sta. 77 had the highest contribution to AOU below the mixed-layer depth until 1000 m as demonstrated by the high correlation coefficient of the inverse relationship (slope = −0.009, r2 = 0.73, p = 0.007; Table S2). This could be due to the prevailing decomposition of POC to DOC at this station (slope = −0.106, r2 = 0.83, p = 0.096; Table S2). It should be noted that although the POC-DOC correlation was used as evidence that POC is converted to DOC, it could also be possible that microbial and algal communities produce both extracellular organic matter (in the form of DOC) and POC when they die. However, the mechanisms underlying these processes are beyond the scope of this paper.
The deep-water POC (from 1500 m to bottom) of both the representative high- (avg. 34.8 μg C L−1, Sta. 77) and low-productivity stations (avg. 23.5 μg C L−1, Sta. 79) were higher than those obtained by [26] for the Sulu Sea (16 μg C L−1) as well as those reported in the deep waters of the northern South China Sea (13.2 μg C L−1) [38]. Such high POC concentrations in deep waters have been found at stations as deep as 3000–4000 m near the Sunda Shelf in the South China Sea [28] and all the way to ~900 m at the East China Sea shelf edge [44]. The difference in the deep-water POC of these two deep casts (5.2–16.6 μg C L−1) appears to be significant and is greater than the set limit of variation due to patchiness in the ocean (5 μg C L−1) [56]. During the Hakuho Maru cruise in December 2002, Okubo et al. (2007) reported a suspended particulate matter concentration of 0.02–0.01 mg kg−1 (~20–10 μg L−1) from 1500 to 4603 m at a station near the Sulu Archipelago. Its upper limit was near the average concentration for Sta. 79, and it is plausible that the particulate material in this station is mostly suspended POC, although this requires further investigation. The higher deep-water POC for Sta. 77 could be attributed in part to large aggregates, detritus, and marine snow that rain down in this high-productivity area. A full–water column cross section of POC from the South China Sea toward the Sulu Sea (Figure 9D) illustrates this difference. The POC profile of Sta. 77 seems to follow that of the three-layer model of total suspended material in the oceans—high concentrations at the surface water layer principally due to primary production, relatively lower concentrations at what seems to be a minimum layer (300–1000 m) due to the decomposition or physical removal of organic matter, and elevated concentrations again at the deep-water layer due to the resuspension of sediments at the bottom and at the basin walls [1]. The particle supply resulting from the interaction of ventilating waters from the Sulawesi Sea with the walls of the Sulu Sea basin could be brought about by a series of upwelling (from the Sulawesi Sea), mixing (at the Sibutu Passage), downwelling (towards the Sulu Sea), and cyclonic circulation and advection events along the slopes of the southern basin [57].
The plot of POC against DOC at 1500 m to the bottom depths resulted in negative slopes, which indicate the production or input of POC with a decrease in DOC, although this is not very well correlated (plot not shown; r2 = 0.18, p = 0.468 for Sta. 77; r2 = 0.15, p = 0.516 for Sta. 79). In connection with this [49] reported a high degree of particulate Fe in the deep waters of the Sulu Sea during the Hakuho Maru 2002 cruise and hypothesized that dissolved Fe decreased with depth, which, if present in colloidal form, might be due to coagulation resulting in the formation of particulate matter. Similar to [28], this study also did not find the expected decrease in POC with increasing AOU at the bottom depths; Station 77 even registered a positive slope. This could be due to the previously ascribed rapid transport of large particulate material from the surface to depths or the production or additional input of POC. The Sulu Sea has been regarded as a particle-rich environment [49]. This observation is based on the relationship of particles with trace metals and the scavenging of radioisotopes. The sources of particles include the resuspension of bottom sediments related to turbidity currents and advected particles from the shelves, sills, and slopes of nearby island masses [48,49,50,58].
3.4.2. DOC
DOC, similar to POC, decreased below the surface waters. For the low-productivity stations, the range of average DOC concentrations from 300–1250 m were 43–49 μM, and for the high-productivity stations, DOC concentrations ranged from 47–56 μM (Table S1). For the bathypelagic layer (1500–4000 m), the average DOC concentration for the low-productivity Sta. 79 and high-productivity Sta. 77 were 46 μM and 48.7 μM, respectively (Table S1; Figure 9C); the higher bathypelagic DOC at Sta. 77 compared to Sta. 79 could indicate the influence of surface productivities on DOC at depths. Surprisingly, these values are higher than typically observed for North Pacific deep waters (34–39 μM) [2,7,17] but are closer to the deep-water values reported for the northern South China Sea (43 μM) [38,39] and are lower than at the deep station in the East China Sea shelf northeast of Taiwan (52–58 μM at 1000–2000 m) [14,39]. Such high concentrations (~47 μM) could be found to reach depths greater than 2000 m at the Atlantic Ocean north of 50° N due to the North Atlantic Deep Water formation [8,59]. These high concentrations could be because the waters that ventilate the intermediate and deep waters of the Sulu Sea come from shallower depths where the DOC of overflowing water is high (from the 400–570 m depths of the South China Sea and from 200–700 m in the Sulawesi Sea, respectively) [35,36,37,57].
It has been suggested that ~40 μM exists as refractory DOC throughout the whole water column, while the rest occurs mostly as semi-labile DOC with a turnover of months to years [1]. Assuming that the same concentration of refractory fraction can be estimated for the Sulu Sea, the mesopelagic Sulu Sea (300–1250 m) would have an average of ~3–9 μM semi-labile DOC for the low-productivity stations and ~7–16 μM semi-labile DOC for the high-productivity stations, and the bathypelagic layer (1500–4000 m) would have a narrower average range of ~6–9 μM of semi-labile DOC concentrations. Although it requires further investigation, it may also be assumed that while the ventilating waters of the South China Sea and Sulawesi Sea supply refractory DOC, both sources may also contribute semi-labile DOC that serves as an energy source for microbial respiration. Depending on the ventilation rate, these source waters could provide episodic inputs of biologically available organic carbon, the chemical compositions of which remain to be explored. The reported similarities in the bacterial community structure of the Sulu Sea with those of the Sulawesi and South China Seas [29] may be because of the bioavailable DOC supplied by these two sources. Moreover, organic material supplied by sinking materials has been also considered to influence the bacterial community structure in the deep Sulu Sea [29]. It has been discussed in Section 3.4.1 of this paper that the deep waters of the Sulu Sea are relatively high in POC. Consequently, this POC, which could be in the form of aggregates, has been regarded to provide habitats for microorganisms and a site for the transformation of adsorbed refractory DOC into biologically available forms [3,4,28]. These mechanisms possibly make the Sulu Sea a unique system compared to others reviewed by [4] in terms of bathypelagic microbial dynamics.
DOC-AOU profiles intersect near the thermocline and show an overall decrease in DOC with increasing AOU owing to organic matter decomposition (Figure 5 and Figure 6). Compared to POC, DOC showed negative slopes with relatively higher correlation coefficients with AOU in the mesopelagic layer, especially for high-productivity stations (r2 > 0.54), indicating a greater contribution of DOC to AOU (Table S2). The DOC-AOU relationships in the bathypelagic are more negatively correlated (plot not shown; r2 = 0.83, p = 0.031 for Sta. 77; r2 = 0.72, p = 0.070 for Sta. 79).
The contribution of DOC to AOU at different depth layers has been used by several studies to estimate the contribution of DOC to organic matter decomposition [6,38,60,61,62]. This is achieved by converting AOU to carbon equivalents or Ceq, and determining the slope of its linear regression with DOC. It has been reported that DOC supports ~10–20% of respiration in the dark ocean (below 100 m to 1000 m) [60], 11–30% from 100–1000 m in the northern South China Sea [38], 15–41% at 100–400 m in the Sargasso Sea [61], 5–29% at different density layers from 100 m to ~6000 m in the North Atlantic [8], and 38% in the intermediate waters of the Mediterranean Sea [62]. The highest reported contribution of DOC mineralization to oxygen consumption, 92%, was in the bathypelagic (1000–1250 m) waters of the Adriatic Sea and in the Mediterranean during a temporal observation from January to June 2008 [62].
For the Sulu Sea, the relationship between DOC and Ceq (AOU * 0.768, where 0.768 = 106 mol C/138 mol O2) is represented as the slope of the line in Table 1. Estimates revealed a 3–14% and 12–50% contribution to respiration in the mesopelagic layers of the sampled low- and high-productivity stations, respectively, assuming the decrease in DOC was all attributed to microbial consumption. An even greater contribution was obtained for the bathypelagic layers (58% for Sta. 79 and 74% for Sta. 77), which could be due to the bioavailability and associated dynamics of DOC supplied with ventilation. The effect of mixing in deep waters might also be important and more pronounced in the dissolved organic component compared to particulates, as shown by the inverse relationship of DOC and salinity (plot not shown; r2 = 0.87, p = 0.021 for Sta. 77; r2 = 0.65, p = 0.098 for Sta. 79). It should also be noted that while the obtained values for respiration in the mesopelagic South China Sea (10–16%) are within the published range, those for the bathypelagic layer seems anomalous due to the very high value at 2000 m (>400%; Table 1), which was not observed by [63] in the South China Sea, although they reported a DOC bump at the South China Sea intermediate waters (~1000–1500 m).
3.5. Organic Carbon and the Sustainable Use of the Environment and Resources
The variability of the marine organic carbon cycle in a changing climate has been discussed by several papers in this issue [64,65,66,67]; the dynamics of which are related to temporal (seasonal, inter-annual) variations in hydrodynamics, nutrient cycling, and other biogeochemical processes. Continuous monitoring efforts and modelling studies are essential in predicting future changes organic carbon distributions with respect to identified factors. For instance, monitoring of POC concentrations from space is made possible through the availability of atmospheric data products [68]. On the other hand, the recently identified leaching of DOC from plastics in the oceans [69] may have unaccounted effects to the marine organic carbon cycle. This is of great concern especially in developing countries like the Philippines where continuous increase in population is one of the contributing factors to the increase in plastic pollution [70] that eventually ends up in the coasts, internal seas and offshore waters. Future studies should employ the use of stable isotopes of carbon in DOC to distinguish plastic-derived DOC from other forms of DOC, determining the variability of DOC in garbage patches, and most importantly, extending modelling efforts to incorporate human behaviour variables (e.g., determination of the amount of plastic-derived DOC that will be reduced if the volume of plastic wastes will be decreased through sustainable use of plastic materials) as a form of anthropogenic input of DOC to the oceans.
4. Conclusions
This study examined the different physico-chemical processes that affect the distribution of DOC and POC in the Sulu Sea. Similar to inorganic carbon dynamics, surface productivity affect the concentration of DOC and POC in the surface mixed layer, with generally higher DOC and POC concentrations in the high productivity areas. In addition, the possible rapid transport of particles produced from the highly productive regions of the Sulu Sea could have contributed to the increase in the concentration of POC at depth. On the other hand, unlike inorganic carbon distributions across the sill that form downward sloping isolines, organic carbon dynamics across the sills are influenced by bottom resuspension, resulting in an increase in POC, and decrease in DOC. Upwelling of low DOC waters (67 ± 3.5 μM) in the eastern Sulu Sea support the upwelling of sub-surface waters influenced by organic matter decomposition. The result of unique deep-water ventilation from shallow depths of two source waters (the South China Sea and Sulawesi Sea) seems to be two-fold: high particulates as a result of the interaction of the deep water with the walls and slopes of topographic barriers as seen from the variability of beam attenuation coefficients across the sills of Mindoro and Panay straits, and high DOC from the upper mesopelagic with presumably semi-labile fractions that could support an estimated 58–74% of microbial respiration in the bathypelagic layer. Future studies should address the chemical composition of DOC and POC, apply more quantitative approaches (e.g., determination of fluxes, transports, and decay rates), and determine the contribution of plastic-derived DOC to the marine organic carbon cycle to further understand the role of the Sulu Sea in the biogeochemical cycling of organic carbon and its sustainability as carbon sink in the coming years.
Supplementary Materials
The following are available online at https://www.mdpi.com/2071-1050/10/6/1867/s1, Table S1: Average DOC and POC concentrations in the Sulu Sea and South China Sea, Table S2: Linear relationships of POC and DOC, and POC and DOC with AOU.
Author Contributions
G.S.J. and C.M.F. conceived the sampling design and collected the samples; H.-K.L. performed the laboratory analysis of DOC; C.M.F. analyzed the data; C.M.F., C.-T.A.C., G.S.J. and H.-K.L. wrote the paper.
Acknowledgments
We are very thankful to Pierre Flament, chief scientist of the Joint PhilEx Cruise; Bing-Jye Wang for the analysis of POC samples; and the officers, crew, and technicians of the research vessel Melville. This study was funded by the Southeast Asia Regional Committee for START (SARCS) through the project Nutrient and Carbon Biogeochemistry of the Sulu Sea (agreement number 96/01/CW-005), which also provided funds for covering the costs to publish in open access. Financial support was also provided by the US Office of Naval Research (ONR) through the PhilEx program (under award and sub-award N00014-06-1-0686 to the University of Hawaii and the University of the Philippines). C.M. Ferrera is also grateful to the Department of Science and Technology—Philippine Council for Agriculture, Aquatic, and Natural Resources Research and Development’s (DOST-PCAARRD’s) Accelerated Science and Technology Human Resources and Development Program (ASTHRDP) for graduate studies support. We are grateful to three anonymous reviewers who provided comments that improved the manuscript. The organic carbon data set may be requested from the corresponding author at [email protected].
Conflicts of Interest
The authors declare no conflict of interest.
References
- Chester, R. Marine Geochemistry, 2nd ed.; Blackwell Science Ltd.: Malden, MA, USA, 2003; ISBN 1-4051-0172-5. [Google Scholar]
- Ogawa, H.; Tanoue, E. Dissolved organic matter in oceanic waters. J. Oceanogr. 2003, 59, 129–147. [Google Scholar] [CrossRef]
- Hansell, D.A.; Carlson, C.A.; Repeta, D.J.; Schlitzer, R. Dissolved organic matter in the ocean: A controversy stimulates new insights. Oceanography 2009, 22, 202–211. [Google Scholar] [CrossRef]
- Nagata, T.; Tamburini, C.; Aristegui, J.; Baltar, F.; Bochdansky, A.B.; Fonda-Umani, S.; Fukuda, H.; Gogou, A.; Hansell, D.A.; Hansman, R.L.; et al. Emerging concepts on microbial processes in the bathypelagic ocean—Ecology, biogeochemistry, and genomics. Deep-Sea Res. Part II 2010, 57, 1519–1536. [Google Scholar] [CrossRef]
- Bishop, J.K.B. Transmissometer measurement of POC. Deep Sea Res. Part I 1999, 46, 353–369. [Google Scholar] [CrossRef]
- Behrenfeld, M.J.; Boss, E. Beam attenuation and chlorophyll concentration as alternative optical indices of phytoplankton biomass. J. Mar. Res. 2006, 64, 431–451. [Google Scholar] [CrossRef]
- Hansell, D.A.; Carlson, C.A. Deep-ocean gradients in the concentration of dissolved organic carbon. Nature 1998, 395, 263–266. [Google Scholar] [CrossRef]
- Carlson, C.A.; Hansell, D.A.; Nelson, N.B.; Siegel, D.A.; Smethie, W.M.; Khatiwala, S.; Meyers, M.M.; Halewood, E. Dissolved organic carbon export and subsequent remineralization in the mesopelagic and bathypelagic realms of the North Atlantic basin. Deep-Sea Res. Part II 2010, 57, 1433–1445. [Google Scholar] [CrossRef]
- Murray, J.W.; Barber, R.T.; Roman, M.R.; Bacon, M.P.; Feely, R.A. Physical and biological controls on carbon cycling in the Equatorial Pacific. Science 1994, 266, 58–65. [Google Scholar] [CrossRef] [PubMed]
- Hansell, D.A.; Carlson, C.A.; Bates, N.R.; Poisson, A. Horizontal and vertical removal of organic carbon in the equatorial Pacific Ocean: A mass balance assessment. Deep-Sea Res. Part II 1997, 44, 2115–2130. [Google Scholar] [CrossRef]
- Stoll, M.H.C.; Van Aken, H.M.; De Baar, H.J.W.; De Boer, C.J. Meridional carbon dioxide transport in the northern North Atlantic. Mar. Chem. 1996, 55, 205–216. [Google Scholar] [CrossRef] [Green Version]
- Liu, K.-K.; Lai, Z.-L.; Gong, G.-C.; Shiah, F.-K. Distribution of particulate organic matter in the Southern East China Sea: Implications in production and transport. Terr. Atmos. Ocean. Sci. 1995, 6, 27–45. [Google Scholar] [CrossRef]
- Chen, C.T.A.; Wang, S.L. Carbon, alkalinity and nutrient budgets on the East China Sea continental shelf. J. Geophys. Res. 1999, 104, 20675–20686. [Google Scholar] [CrossRef] [Green Version]
- Hung, J.-J.; Lin, P.-L.; Liu, K.-K. Dissolved and particulate organic carbon in the southern East China Sea. Cont. Shelf Res. 2000, 20, 545–569. [Google Scholar] [CrossRef]
- Hung, J.-J.; Chen, C.-H.; Gong, G.-C.; Sheu, D.-D.; Shiah, F.-K. Distributions, stoichiometric patterns and cross-shelf exports of dissolved organic matter in the East China Sea. Deep-Sea Res. Part II 2003, 50, 1127–1145. [Google Scholar] [CrossRef]
- U.S. Eastern Continental Shelf Team. Eastern US Continental Shelf Carbon Budget: Integrating Models, Data Assimilation and Analysis. Oceanography 2008, 21, 86–104. [Google Scholar] [CrossRef]
- Chen, C.T.A. Microbial carbon pump: Additional considerations. Nat. Rev. Microbiol. 2011, 9, 555. [Google Scholar] [CrossRef] [PubMed]
- Jiao, N.; Herndl, G.J.; Hansell, D.A.; Benner, R.; Kattner, G.; Wilhelm, S.W.; Kirchman, D.L.; Weinbauer, M.G.; Luo, T.; Chen, F.; et al. Microbial production of recalcitrant dissolved organic matter: The long-term carbon storage in the global ocean. Nat. Rev. Microbiol. 2010, 8, 593–599. [Google Scholar] [CrossRef] [PubMed]
- Hofmann, M.; Schellnhuber, H.J. Oceanic acidification affects marine carbon pump and triggers extended marine oxygen holes. Proc. Natl. Acad. Sci. USA 2009, 106, 3017–3022. [Google Scholar] [CrossRef] [PubMed] [Green Version]
- Engel, A.; Barcelos e Ramos, J.; Geider, R.; Hutchins, D.A.; Lee, C.; Rost, B.; Rottgers, R.; Thingstad, F. Production and export of organic matter. In Guide to Best Practices for Ocean Acidification Research and Data Reporting; Riebesell, U., Fabry, V.J., Hansson, L., Gattuso, J.-P., Eds.; European Commission: Luxembourg, 2011; ISBN 978-92-79-20650-4. [Google Scholar]
- Exon, N.F.; Haake, F.-W.; Hartman, M.; Kogler, F.-C.; Muller, P.J.; Whiticar, M.J. Morphology, water characteristics and sedimentation in the silled Sulu Sea, Southeast Asia. Mar. Geol. 1981, 39, 165–195. [Google Scholar] [CrossRef]
- Linsley, B.K.; Thunell, R.C.; Morgan, C.; Williams, D.F. Oxygen minimum expansion in the Sulu Sea, Western Equatorial Pacific, during the last glacial low stand of sea level. Mar. Micropaleontol. 1985, 9, 395–418. [Google Scholar] [CrossRef]
- Bertrand, P.; Berner, U.; Lallier-Verges, E. Organic sedimentation in Celebes and Sulu Basins: Type of organic matter and evaluation of organic carbon accumulation rates. In Proceedings of the Ocean Drilling Program, Scientific Results; Silver, E.A., Rangin, C., von Breymann, M.T., Berner, U., Bertrand, P., Betzler, C., Brass, G.W., Hsu, V., Huang, Z., Jarrard, R.D., et al., Eds.; Ocean Drilling Program: College Station, TX, USA, 1991; Volume 124, pp. 217–225. [Google Scholar]
- Sheu, D.D.D. Geochemical and stable isotopic studies of Celebes and Sulu Sea sediments: Sites 767 and 768, ODP Leg 124. Terr. Atmos. Ocean. Sci. 1991, 2, 267–279. [Google Scholar] [CrossRef]
- Calvert, S.E.; Pedersen, T.F.; Thunell, R.C. Geochemistry of the surface sediments of the Sulu and South China Seas. Mar. Geol. 1993, 114, 207–231. [Google Scholar] [CrossRef]
- Kuehl, S.A.; Fuglseth, T.J.; Thunell, R.C. Sediment mixing and accumulation rates in the Sulu and South China Seas: Implications for organic carbon preservation in deep-sea environments. Mar. Geol. 1993, 111, 15–35. [Google Scholar] [CrossRef]
- Philippine Energy Contracting Rounds Technical Report. Petroleum Potential of West Palawan Basins and Sulu Sea Region. Available online: http://www.ccop.or.th/epf/philippines/other_pdf/TechnicalReport.pdf (accessed on 19 January 2018).
- Ichikawa, T. Particulate organic carbon and nitrogen in the adjacent seas of the Pacific Ocean. Mar. Biol. 1982, 68, 49–60. [Google Scholar] [CrossRef]
- Yoshida, A.; Nishimura, M.; Kogure, K. Bacterial community structure in the Sulu Sea and adjacent areas. Deep-Sea Res. Part II 2007, 54, 103–113. [Google Scholar] [CrossRef]
- Ferrera, C.M.; Jacinto, G.S.; Chen, C.-T.A.; San Diego-McGlone, M.L.; Datoc, M.F.K.T.; Lagumen, M.C.T.; Senal, M.I.S. Carbonate parameters in high and low productivity areas of the Sulu Sea, Philippines. Mar. Chem. 2017, 195, 2–14. [Google Scholar] [CrossRef]
- Department of Energy. Handbook of Methods for the Analysis of the Various Parameters of the Carbon Dioxide System in Sea Water (Ver. 2, ORNL/CDIAC-74); Dickson, A.G., Goyet, C., Eds.; Oak Ridge National Lab.: Oak Ridge, TN, USA, 1994. [Google Scholar]
- Knap, A.; Michaels, A.; Close, A.; Ducklow, H.; Dickson, A. Protocols for the Joint Global Ocean Flux Studies (JGOFS) Core Measurements (JGOFS Report No. 19); UNESCO: Paris, France, 1994. [Google Scholar]
- Chen, C.T.A.; Hou, W.P.; Gamo, T.; Wang, S.L. Carbonate-related parameters of the subsurface waters in the West Philippine, South China and Sulu Seas. Mar. Chem. 2006, 99, 151–161. [Google Scholar] [CrossRef]
- Gamo, T.; Kato, Y.; Hasumoto, H.; Kakiuchi, H.; Momoshima, N.; Takahata, N.; Sano, Y. Geochemical implications for the mechanism of deep convection in a semi-closed tropical marginal basin: Sulu Sea. Deep-Sea Res. Part II 2007, 54, 4–13. [Google Scholar] [CrossRef]
- Gordon, A.L.; Tessler, Z.D.; Villanoy, C. Dual overflows into the deep Sulu Sea. Geophys. Res. Lett. 2011, 38, L18606. [Google Scholar] [CrossRef]
- Gordon, A.L.; Sprintall, J.; Ffield, A. Regional oceanography of the Philippine archipelago. Oceanography 2011, 24, 14–27. [Google Scholar] [CrossRef]
- Tessler, Z.D.; Gordon, A.L.; Pratt, L.J.; Sprintall, J. Transport and dynamics of the Panay Sill overflow in the Philippine seas. J. Phys. Oceanogr. 2010, 40, 2679–2695. [Google Scholar] [CrossRef]
- Hung, J.-J.; Wang, S.-M.; Chen, Y.-L. Biogeochemical controls on distributions and fluxes of dissolved and particulate organic carbon in the Northern South China Sea. Deep-Sea Res. Part II 2007, 54, 1486–1503. [Google Scholar] [CrossRef]
- Liu, Q.; Pan, D.L.; Bai, Y.; Wu, K.; Chen, C.T.A.; Liu, Z.L.; Zhang, L. Estimating dissolved organic carbon inventories in the East China Sea using remote sensing data. J. Geophys. Res. Oceans 2014, 119, 6557–6574. [Google Scholar] [CrossRef]
- Yang, L.; Chen, C.-T.A.; Lui, H.-K.; Zhuang, W.-E. Effects of microbial transformation on dissolved organic matter in the east Taiwan Strait and implications for carbon and nutrient cycling. Estuar. Coast. Shelf Sci. 2016, 180, 59–68. [Google Scholar] [CrossRef]
- Hurlburt, H.E.; Metzger, E.J.; Sprintall, J.; Riedlinger, S.N.; Arnone, R.A.; Shinoda, T.; Xu, X. Circulation in the Philippine archipelago simulated by 1/12° and 1/25° global HYCOM and EAS NCOM. Oceanography 2011, 24, 28–47. [Google Scholar] [CrossRef]
- Chen, C.T.A. Oxygen solubility in seawater. In Oxygen and Ozone: Solubility Data Series; Battino, R., Ed.; Pergamon Press: Oxford, UK, 1981; Volume 7, pp. 41–55. ISBN 978-0-08-023915-6. [Google Scholar]
- Girton, J.B.; Chinn, B.S.; Alford, M.H. Internal wave climates of the Philippine seas. Oceanography 2011, 24, 100–111. [Google Scholar] [CrossRef]
- Zhu, Z.Y.; Zhang, J.; Wu, Y.; Lin, J. Bulk particulate organic carbon in the East China Sea: Tidal influence and bottom transport. Prog. Oceanogr. 2006, 69, 37–60. [Google Scholar] [CrossRef]
- Rochelle-Newall, E.J.; Fisher, T.R.; Fan, C.; Glibert, P.M. Dynamics of chromophoric dissolved organic matter and dissolved organic carbon in experimental mesocosms. Int. J. Remote Sens. 1999, 20, 627–641. [Google Scholar] [CrossRef] [Green Version]
- Boss, E.; Pegau, W.S.; Zaneveld, J.R.V.; Barnard, A.H. Spatial and temporal variability of absorption by dissolved material at a continental shelf. J. Geophys. Res. 2001, 106, 9499–9507. [Google Scholar] [CrossRef] [Green Version]
- Quadfasel, D.; Kudrass, H.; Frische, A. Deep water renewal by turbidity currents in the Sulu Sea. Nature 1990, 348, 320–322. [Google Scholar] [CrossRef]
- Kondo, Y.; Takeda, S.; Furuya, K. Distribution and speciation of dissolved iron in the Sulu Sea and its adjacent waters. Deep-Sea Res. Part II 2007, 54, 60–80. [Google Scholar] [CrossRef]
- Norisuye, K.; Ezoe, M.; Nakatsuka, S.; Umetani, S.; Sohrin, Y. Distribution of bioactive trace metals (Fe, Co, Ni, Cu, Zn and Cd) in the Sulu Sea and its adjacent seas. Deep-Sea Res. Part II 2007, 54, 14–37. [Google Scholar] [CrossRef]
- Obata, H.; Doi, T.; Hongo, Y.; Alibo, D.S.; Minami, H.; Kato, Y.; Maruo, M. Manganese, cerium and iron in the Sulu, Celebes and Philippine Seas. Deep-Sea Res. Part II 2007, 54, 38–49. [Google Scholar] [CrossRef]
- Jones, B.H.; Lee, C.M.; Toro-Farmer, G.; Boss, E.S.; Gregg, M.C.; Villanoy, C.L. Tidally driven exchange in an archipelago strait: Biological and optical responses. Oceanography 2011, 24, 142–155. [Google Scholar] [CrossRef]
- Gordon, A.L.; Yanagi, T. Water masses and circulation of Southeast Asian seas. In Critical States: Environmental Challenges to Development in Monsoon Southeast Asia; Lebel, L., Snidvongs, A., Chen, C.-T.A., Daniel, R., Eds.; Strategic Information and Research Development Centre: Kuala Lumpur, Malaysia, 2009; ISBN 978-983-3782-62-8. [Google Scholar]
- Villanoy, C.L.; Cabrera, O.C.; Yniguez, A.; Camoying, M.; De Guzman, A.; David, L.T.; Flament, P. Monsoon-driven coastal upwelling off Zamboanga Peninsula, Philippines. Oceanography 2011, 24, 156–165. [Google Scholar] [CrossRef]
- Sharp, J.H.; Benner, R.; Bennett, L.; Carlson, C.A.; Fitzwater, S.E.; Peltzer, E.T.; Tupas, L.M. Analyses of dissolved organic carbon in seawater: The JGOFS EqPac methods comparison. Mar. Chem. 1995, 48, 91–108. [Google Scholar] [CrossRef]
- Wang, J.; Qi, Y.; Jones, I.S.F. An analysis of the characteristics of chlorophyll in the Sulu Sea. J. Mar. Syst. 2006, 59, 111–119. [Google Scholar] [CrossRef] [Green Version]
- Gardner, W.D.; Richardson, M.J.; Carlson, C.A.; Hansell, D.; Mishonov, A.V. Determining true particulate organic carbon: Bottles, pumps and methodologies. Deep-Sea Res. Part II 2003, 50, 655–674. [Google Scholar] [CrossRef]
- Lermusiaux, P.F.J.; Haley, P.J., Jr.; Leslie, W.G.; Agarwal, A.; Lohutov, O.G.; Burton, L.J. Multiscale physical and biological dynamics in the Philippine archipelago: Predictions and processes. Oceanography 2011, 24, 70–89. [Google Scholar] [CrossRef]
- Okubo, A.; Obata, H.; Gamo, T.; Minami, H.; Yamada, M. Scavenging of 230Th in the Sulu Sea. Deep-Sea Res. Part II 2007, 54, 50–59. [Google Scholar] [CrossRef]
- Aminot, A.; Kerouel, R. Dissolved organic carbon, nitrogen and phosphorus in the N–E Atlantic and the N–W Mediterranean with particular reference to non-refractory fractions and degradation. Deep-Sea Res. Part I 2004, 51, 1975–1999. [Google Scholar] [CrossRef]
- Aristegui, J.; Duarte, C.M.; Agusti, S.; Doval, M.; Alvarez-Salgado, X.A.; Hansell, D.A. Dissolved organic carbon support of respiration in the dark ocean. Science 2002, 298, 1967. [Google Scholar] [CrossRef] [PubMed] [Green Version]
- Hansell, D.A.; Carlson, C.A. Biogeochemistry of total organic carbon and nitrogen in the Sargasso Sea: Control by convective overturn. Deep-Sea Res. Part II 2001, 48, 1649–1667. [Google Scholar] [CrossRef]
- Santinelli, C.; Nannicini, L.; Seritti, A. DOC dynamics in the meso and bathypelagic layers of the Mediterranean Sea. Deep-Sea Res. Part II 2010, 57, 1446–1459. [Google Scholar] [CrossRef]
- Dai, M.; Meng, F.; Tang, T.; Kao, S.J.; Lin, J.; Chen, J.; Huang, J.C.; Tian, J.; Gan, J.; Yang, S. Excess total organic carbon in the intermediate water of the South China Sea and its export to the North Pacific. Geochem. Geophys. Geosyst. 2009, 10, Q12002. [Google Scholar] [CrossRef]
- Qu, B.; Song, J.; Yuan, H.; Li, X.; Li, N. Carbon Chemistry in the Mainstream of Kuroshio Current in Eastern Taiwan and Its Transport of Carbon into the East China Sea Shelf. Sustainability 2018, 10, 791. [Google Scholar] [CrossRef]
- Basu, S.; Mackey, K.R.M. Phytoplankton as Key Mediators of the Biological Carbon Pump: Their Responses to a Changing Climate. Sustainability 2018, 10, 869. [Google Scholar] [CrossRef]
- Lui, H.-K.; Chen, K.-Y.; Chen, C.-T.A.; Wang, B.-S.; Lin, H.-L.; Ho, S.-H.; Tseng, C.-J.; Yang, Y.; Chan, J.-W. Physical Forcing-Driven Productivity and Sediment Flux to the Deep Basin of Northern South China Sea: A Decadal Time Series Study. Sustainability 2018, 10, 971. [Google Scholar] [CrossRef]
- Zheng, H.; Yan, Z.; Chen, J.; Jin, H.; Chen, C.-T.A.; Liu, M.; Yan, Z.; Ji, Z. Seasonal Variations of Dissolved Organic Matter in the East China Sea Using EEM-PARAFAC and Implications for Carbon and Nutrient Cycling. Sustainability 2018, 10, 1444. [Google Scholar] [CrossRef]
- GIOVANNI: The Bridge between Data and Science v 4.25. Available online: https://giovanni.gsfc.nasa.gov/giovanni/ (accessed on 10 May 2018).
- Romera-Castillo, C.; Pinto, M.; Langer, T.M.; Álvarez-Salgado, X.A.; Herndl, G.J. Dissolved organic carbon leaching from plastics stimulates microbial activity in the ocean. Nat. Commun. 2018, 9, 1430. [Google Scholar] [CrossRef] [PubMed] [Green Version]
- Abreo, N.A.S.; Macusi, E.D.; Cuenca, G.C.; Ranara, C.T.B.; Andam, M.B.; Cardona, L.C.; Arabejo, G.F.P. Nutrient Enrichment, Sedimentation, Heavy Metals and Plastic Pollution in the Marine Environment and its Implications on Philippine Marine Biodiversity: A Review. IAMURE Int. J. Ecol. Conserv. 2015, 15. [Google Scholar] [CrossRef]
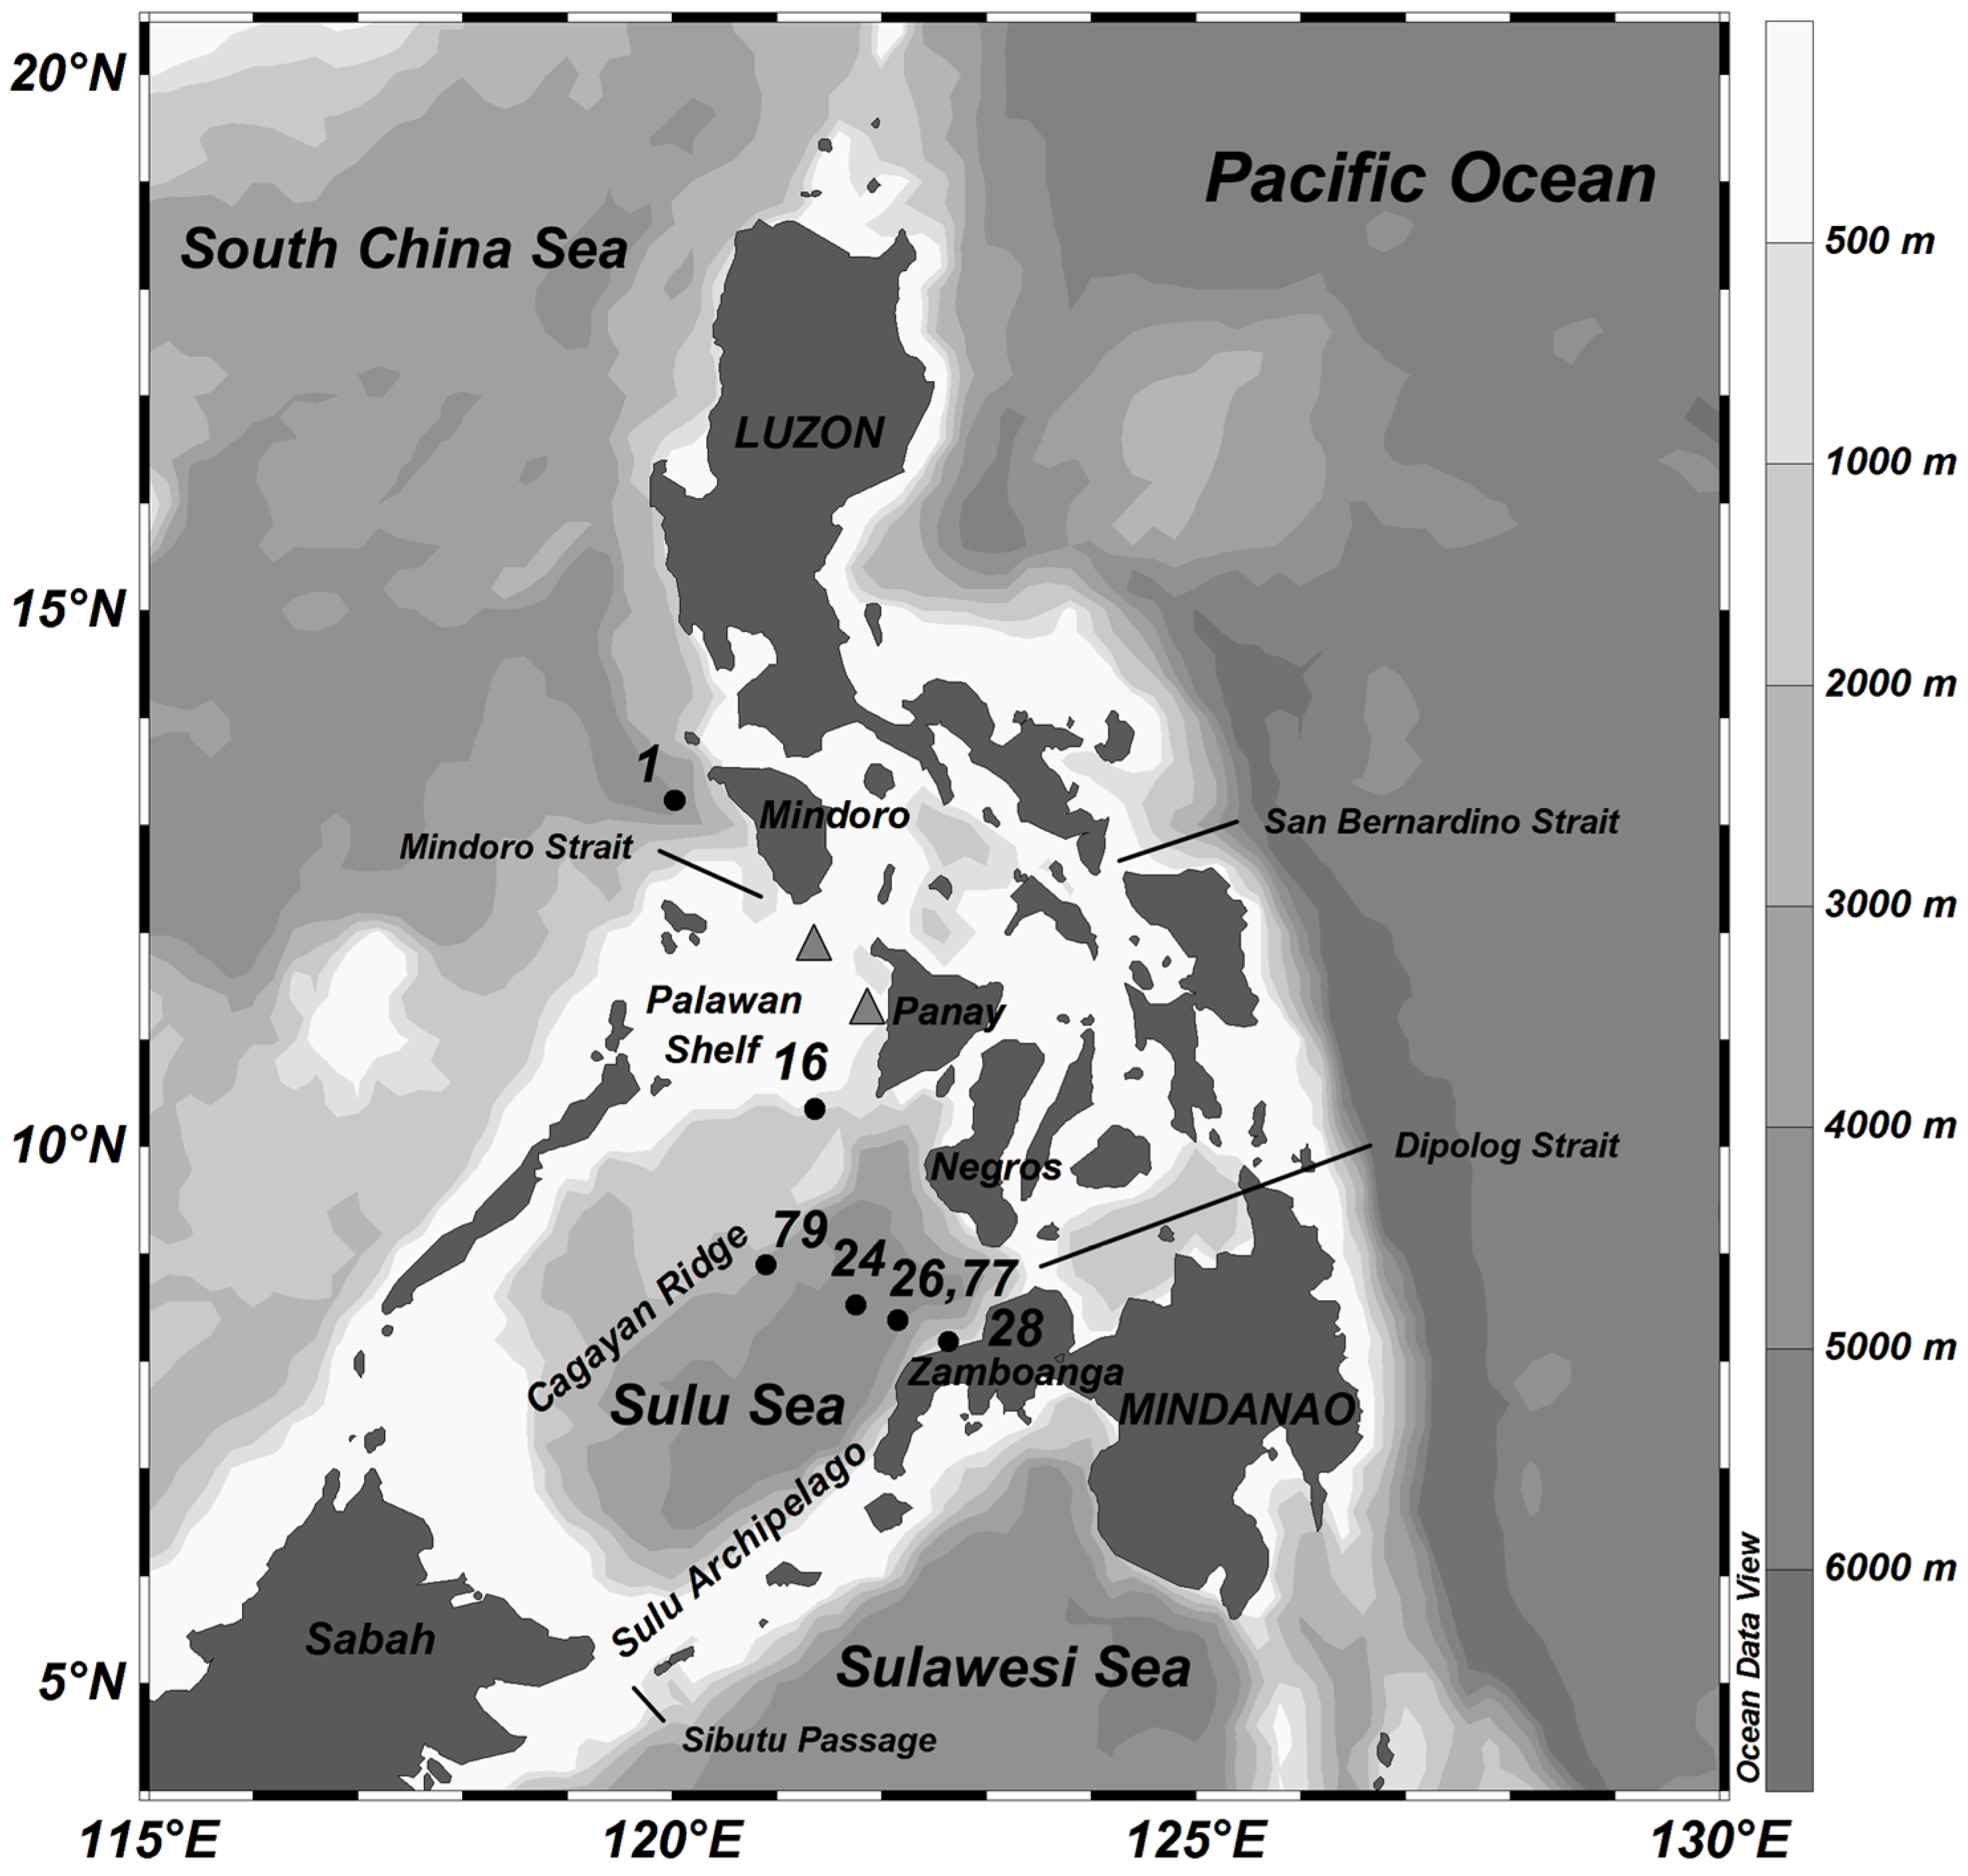
Figure 1.
Sampling stations in the South China Sea and Sulu Sea. Triangles indicate the sills at Mindoro Strait and Panay Strait, respectively. See [28] for details of sampling stations.
Figure 1.
Sampling stations in the South China Sea and Sulu Sea. Triangles indicate the sills at Mindoro Strait and Panay Strait, respectively. See [28] for details of sampling stations.

Figure 2.
Depth profiles of (A) Chlorophyll a; (B) DOC; and (C) particulate organic carbon (POC) in the South China Sea (SCS) and Sulu Sea (SS). LP stands for low productivity, and HP stands for high productivity. See [30] for depth profiles of hydrographic parameters (e.g., potential temperature, salinity, potential density, and others).

Figure 3.
Sections of (A) Dissolved oxygen (DO); (B) Chlorophyll a; (C) DOC; and (D) POC in the upper 1000 m along a transect from the SCS to the Sulu Sea.
Figure 3.
Sections of (A) Dissolved oxygen (DO); (B) Chlorophyll a; (C) DOC; and (D) POC in the upper 1000 m along a transect from the SCS to the Sulu Sea.

Figure 4.
Concentrations of chlorophyll a and POC at all sampling stations except Sta. 24. Note that the scales of POC concentration vary per station.
Figure 4.
Concentrations of chlorophyll a and POC at all sampling stations except Sta. 24. Note that the scales of POC concentration vary per station.


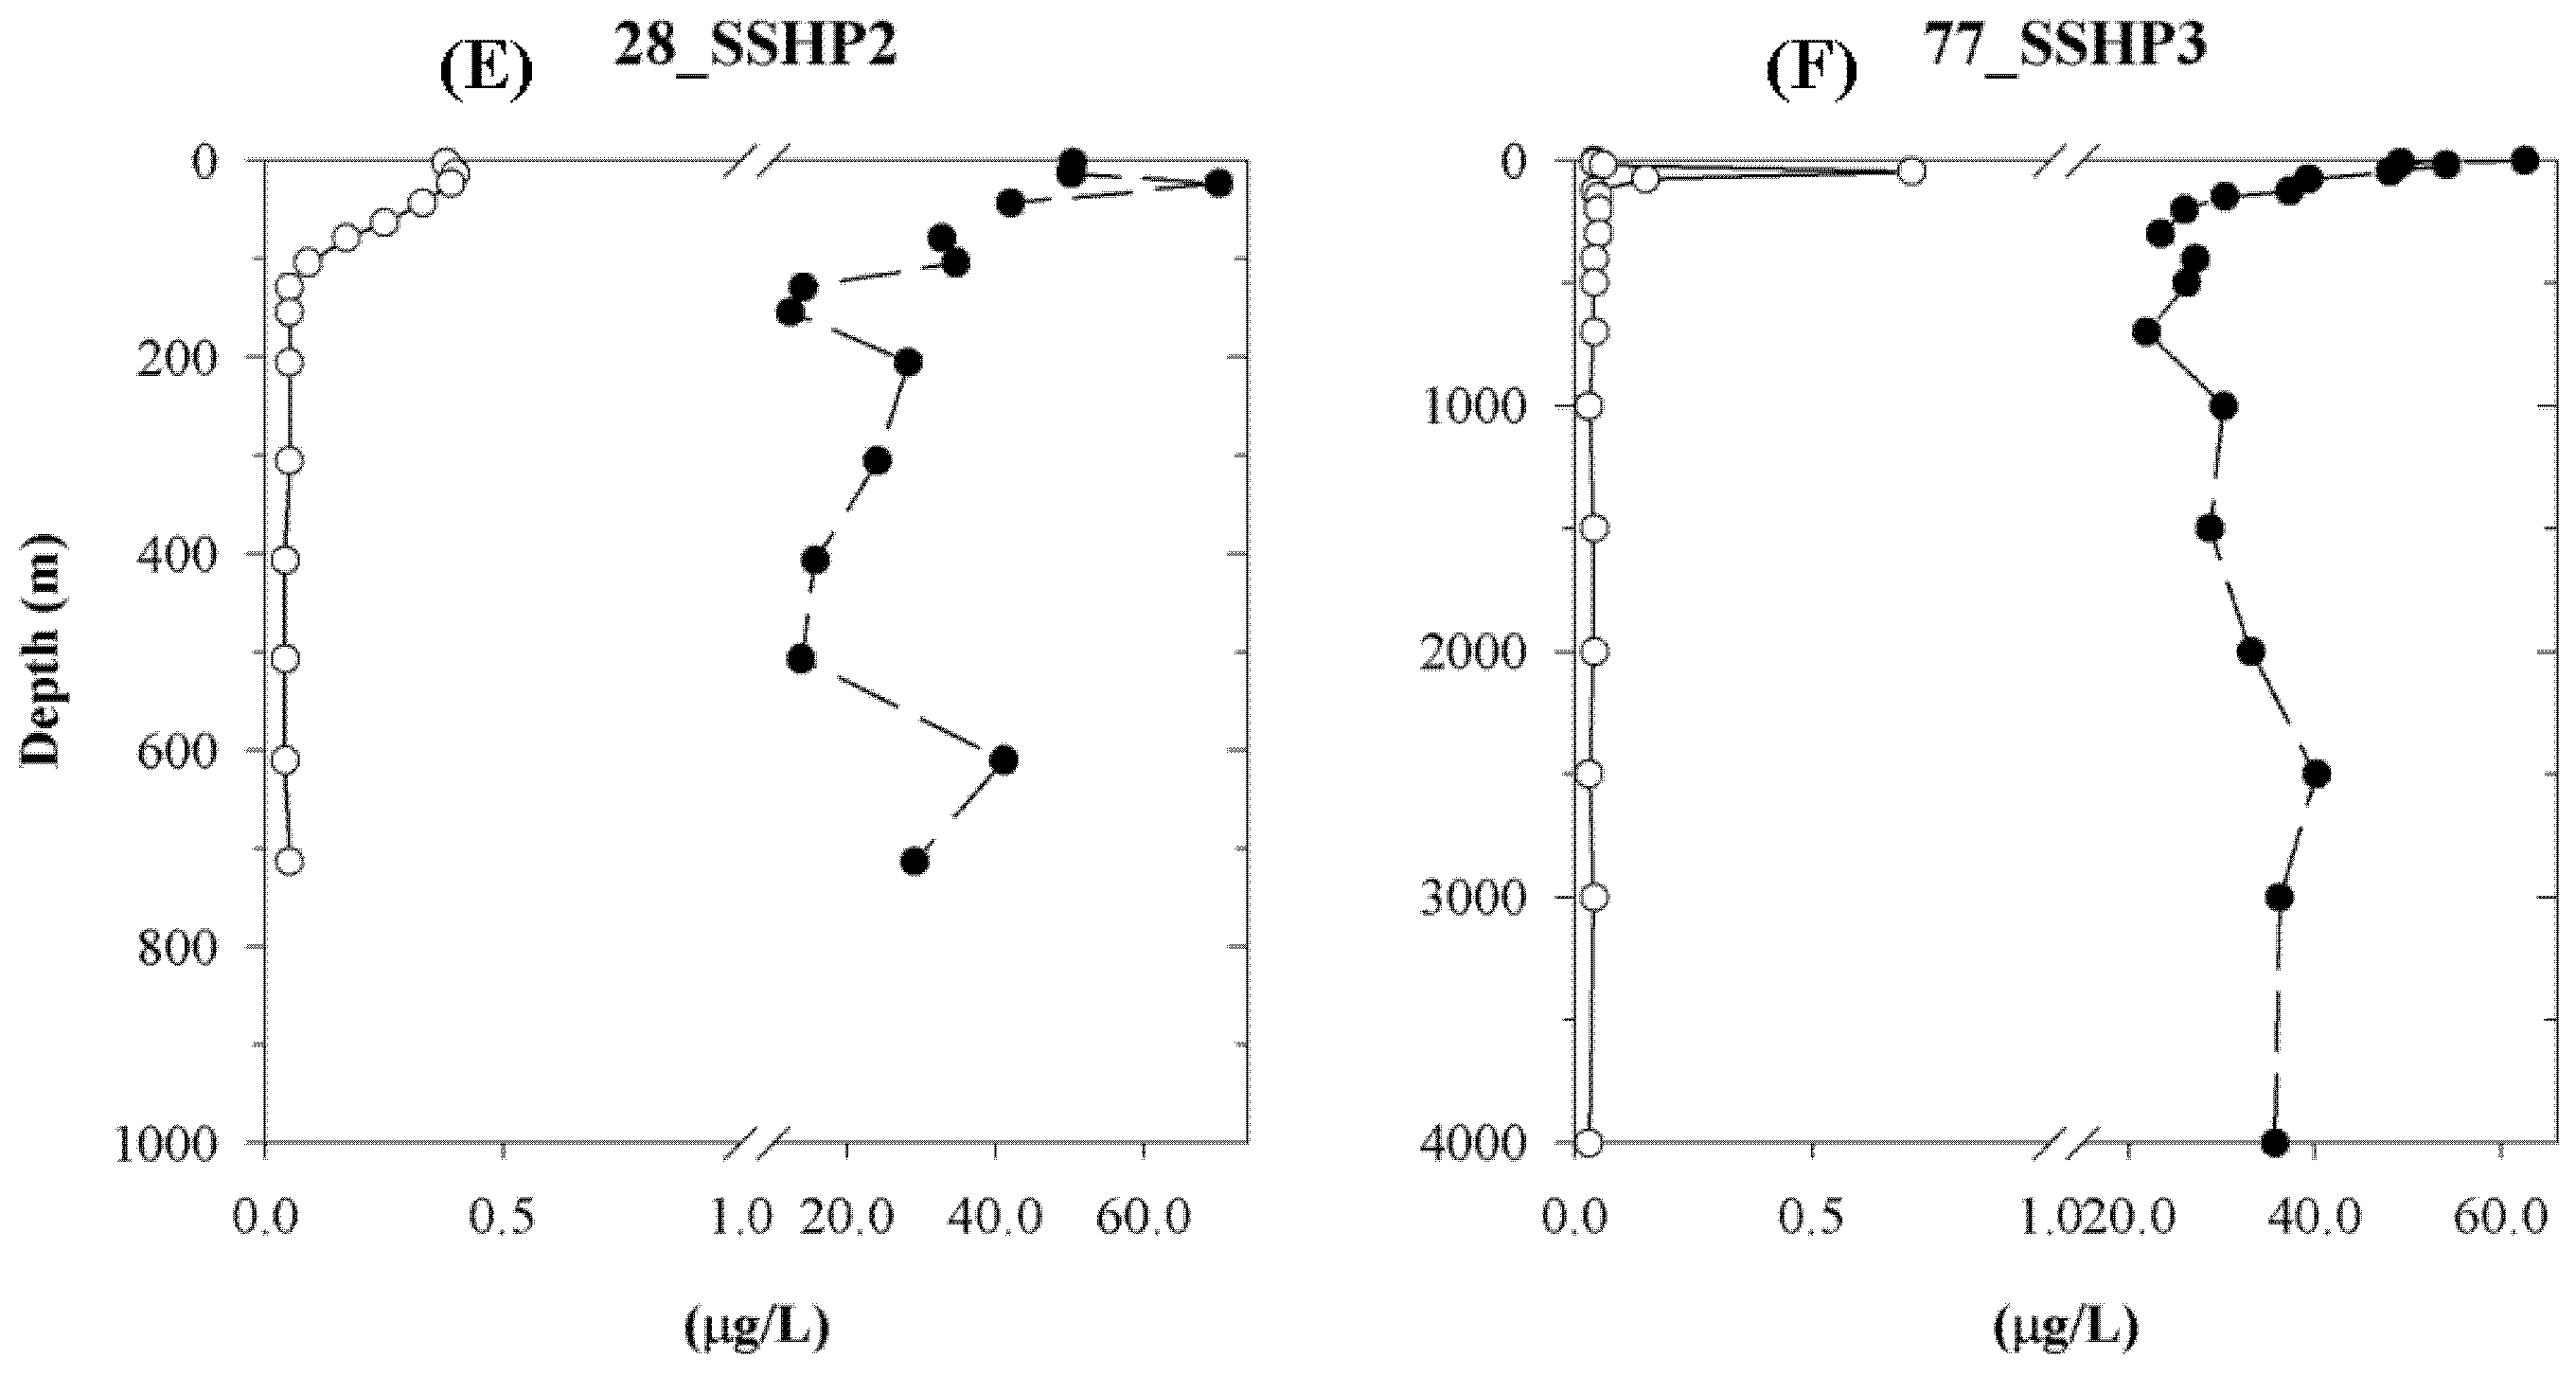
Figure 5.
DOC concentrations and apparent oxygen utilization (AOU) measurements in the (A) South China Sea and (B–D) low-productivity areas of the Sulu Sea. AOU was calculated from DO data generated from the DO sensor of the conductivity–temperature–depth profiler using the method of [42].
Figure 5.
DOC concentrations and apparent oxygen utilization (AOU) measurements in the (A) South China Sea and (B–D) low-productivity areas of the Sulu Sea. AOU was calculated from DO data generated from the DO sensor of the conductivity–temperature–depth profiler using the method of [42].

Figure 6.
DOC concentrations and AOU measurements in the high-productivity areas of the Sulu Sea.

Figure 7.
Beam attenuation profiles of selected stations from the SCS, across the sills at the Mindoro and Panay Straits, to the northwest basin of the Sulu Sea. The inset map shows the location of stations, namely: Sta. 1 (SCS), Sta. 2 (SCS—Sulu Sea deep connection), Sta. 4 (Mindoro Sill wall), Sta. 13 (Panay Sill), Sta. 16 (Sulu Sea low-productivity station), and Sta. 18 (Sulu Sea northwest basin). Values below 2000 m all the way to ~2700 m for Sta. 1 are ~0.485 m−1 but are not shown.

Figure 8.
Sections of (A) POC and (B) DOC along a transect from the central part of the Sulu Sea towards near the coast of Zamboanga.
Figure 8.
Sections of (A) POC and (B) DOC along a transect from the central part of the Sulu Sea towards near the coast of Zamboanga.

Figure 9.
Sections of full–water column (A) DO; (B) Chlorophyll a; (C) DOC; and (D) POC along a transect from the SCS to the Sulu Sea. Inset map in “A” shows the station locations.
Figure 9.
Sections of full–water column (A) DO; (B) Chlorophyll a; (C) DOC; and (D) POC along a transect from the SCS to the Sulu Sea. Inset map in “A” shows the station locations.


Table 1.
Contribution of dissolved organic carbon (DOC) mineralization to apparent oxygen utilization (AOU) (DOC vs. AOU-Ceq).
Table 1.
Contribution of dissolved organic carbon (DOC) mineralization to apparent oxygen utilization (AOU) (DOC vs. AOU-Ceq).
| Station | Depth Layer | Slope | y-Intercept | r2 (p Value) | n |
|---|---|---|---|---|---|
| South China Sea | |||||
| 1 | below MLD–200 m | −0.158 | 74.9 | 0.73 (0.065) | 5 |
| 300–1000 m | −0.100 | 67.6 | 0.26 (0.380) | 5 | |
| 1300–2000 m | −4.018 | 777 | 1.00 (0.032 *) | 3 | |
| Sulu Sea, Low Productivity | |||||
| 16 | below MLD–200 m | −0.144 | 66.1 | 0.97 (0.002 *) | 5 |
| 300–1000 m | 0.059 | 40.3 | 0.01 (0.878) | 6 | |
| 24 | below MLD–200 m | −0.118 | 64.6 | 0.63 (0.060) | 6 |
| 300–1000 m | −0.087 | 57.1 | 0.03 (0.750) | 6 | |
| 79 | below MLD–200 m | −0.030 | 53.4 | 0.06 (0.839) | 3 |
| 300–1000 m | 0.032 | 44.5 | 0.00 (0.934) | 5 | |
| 1500–3700 m | −0.578 | 146 | 0.72 (0.070) | 5 | |
| Sulu Sea, High Productivity | |||||
| 26 | below MLD–200 m | −0.120 | 70.9 | 0.93 (0.008 *) | 5 |
| 300–1000 m | −0.454 | 121 | 0.41 (0.173) | 6 | |
| 28 | below MLD–200 m | −0.121 | 66.6 | 0.69 (0.040 *) | 6 |
| 300–700 m | −0.168 | 72.9 | 0.17 (0.486) | 5 | |
| 77 | below MLD–200 m | −0.130 | 76.5 | 0.65 (0.098) | 5 |
| 300–1000 m | −0.207 | 88.0 | 0.19 (0.564) | 4 | |
| 1500–4000 m | −0.739 | 177 | 0.83 (0.032 *) | 5 | |
n = number of sampling depths; * p < 0.05.
© 2018 by the authors. Licensee MDPI, Basel, Switzerland. This article is an open access article distributed under the terms and conditions of the Creative Commons Attribution (CC BY) license (http://creativecommons.org/licenses/by/4.0/).
Share and Cite
MDPI and ACS Style
Ferrera, C.M.; Jacinto, G.S.; Chen, C.-T.A.; Lui, H.-K. Organic Carbon Concentrations in High- and Low-Productivity Areas of the Sulu Sea. Sustainability 2018, 10, 1867. https://doi.org/10.3390/su10061867
AMA Style
Ferrera CM, Jacinto GS, Chen C-TA, Lui H-K. Organic Carbon Concentrations in High- and Low-Productivity Areas of the Sulu Sea. Sustainability. 2018; 10(6):1867. https://doi.org/10.3390/su10061867
Chicago/Turabian StyleFerrera, Charissa M., Gil S. Jacinto, Chen-Tung Arthur Chen, and Hon-Kit Lui. 2018. "Organic Carbon Concentrations in High- and Low-Productivity Areas of the Sulu Sea" Sustainability 10, no. 6: 1867. https://doi.org/10.3390/su10061867
Note that from the first issue of 2016, this journal uses article numbers instead of page numbers. See further details here.