The Sharing of Benefits from a Logistics Alliance Based on a Hub-Spoke Network: A Cooperative Game Theoretic Approach


1
Korea University Business School, Korea University, Seoul, Korea
2
School of Industrial Management Engineering, Korea University, Seoul, Korea
*
Authors to whom correspondence should be addressed.
Sustainability 2018, 10(6), 1855; https://doi.org/10.3390/su10061855
Submission received: 26 April 2018
/
Revised: 27 May 2018
/
Accepted: 28 May 2018
/
Published: 3 June 2018
(This article belongs to the Special Issue Alliances and Network Organizations for Sustainable Development)
Abstract
:This study investigates a strategic alliance as a horizontal cooperation in the logistics and transportation industries by considering various sharing rules with a cooperative game approach. Through forging a strategic alliance, carriers gain extra benefits from resource sharing and high efficiency resource utilization. In particular, our research focuses on the cost savings from using larger vehicles utilizing collective market demand and regarding them as benefits of cooperation. The model conceptualizes the characteristic function of cost savings by coalitions that take into account the hub-spoke network which is common in transportation services. To share the improved profits fairly between members, we use different allocation schemes: the Shapley value, the core center, the -value, and the nucleolus. By analyzing those cooperative game theoretic solutions employing an alliance composed of three carriers, we investigate whether satisfaction in this specific coalition provides an incentive for carriers to join such a coalition. Our results from the analysis, with respect to fair allocation schemes, provide a practical and academic foundation for further research.
1. Introduction
In general, cooperation promotes mutual development. It enables companies to gain extra benefits through sharing limited resources and hedging risks in terms of generating profits, and this is the main purpose of partnerships. Since logistics companies reap the benefits of employing economies of scale and economies of scope, cooperation through sharing or expanding networks has a bigger effect than in any other industry. In addition, high initial investment costs and regulations related to infrastructure, such as roads, ports, or airports that the logistics industry is based on, require individual logistics companies to collaborate. Moreover, the development of the logistics industry is essential to potentially enhance the competitiveness of firms in other industries by reducing their costs. Furthermore, social needs have forced transportation companies into collaborating in order to decrease the negative social and environmental externalities of greenhouse gas emissions and/or traffic congestion.
This demand for cooperation is in line with the sharing economy, which is prevalent in today’s society. According to Lessig [1], the concept behind the sharing economy suggests the possibility of generating social economic benefits by sharing resources among individuals and creating alternative means of consumption to meet diverse needs in the economy. It implies that bringing people together leads to better results, as can be seen from the well-known and successful Airbnb or Uber enterprises. In 2017, Airbnb was offering temporary living spaces such as apartments in more than 81,000 cities in 191 countries [2]. Similarly, in a growing trend, the car sharing market had about 1.5 million users and 22,000 vehicles in Europe and generated a worldwide revenue of 650 million euros in 2015 [3]. The advantages of the sharing economy specify the efficient use of resources through the utilization of idle resources, resource savings through resource sharing, and the decline of externalities such as traffic congestion or emissions [4,5]. Although there are disadvantages and concerns such as being illegal in some jurisdictions or ignoring pertinent regulations (for example, tax evasion, the possibility of criminal acts, and non-eligibility for damage compensation) [6], it has contributed to increased opportunities for improved business models in many industries [7,8].
There has also been an ever-increasing interest in strategic alliances as sharing-economy-like concepts between companies are seeking to increase profits, which demonstrates that they are being forced to strengthen competitiveness through cooperation. A strategic alliance is an agreement between separate firms to cooperate in terms of sharing resources to achieve a particular goal [9], and firms choose to form a strategic alliance as an alternative to collaborating with their competitors. A considerable amount of research has recognized the substantial impacts and indisputable advantages of a strategic alliance, such as complementing each partner’s vulnerability [10,11,12], hedging against risks [13,14,15], reducing costs [16,17], sharing resource capabilities [15,18,19], transferring knowledge and technologies [18,20], or creating the ability to enter new markets [21,22]. Despite alliances reinforcing the competitiveness of participating firms [23,24,25], such coalitions may not always be the best option [26] and can lead to failure or unplanned dissolution in many cases [18,24,27,28]. Much research has endeavored to figure out the reasons behind alliance failure, which can be caused by factors such as imbalances in power or unequal capacities among partners [24,29,30]. In addition, a high interdependency between partners can result in lower output of the coalition in markets with high entry barriers [31]. In summary, since substantial efforts and coordination costs are required in order to create a successful collaboration [32], companies should be well aware of their own core competencies [33], clearly define the alliance’s common goals [34,35,36,37], and select alliance partners carefully [38,39]. Trust, ultimately, has been found to be the most important condition for maintaining and ensuring a successful collaboration [40,41,42]. In summary, managing relationships between independent partners remains a challenge.
In order to benefit from a coalition, an agreement between partners on sharing profits gained from their cooperation is the key to creating and sustaining an alliance, where a fair allocation is a prerequisite for ensuring a lasting contract. Theoretical approaches based on cooperative game theory allow us to represent the effects induced by the relationships between independent partners in the formation of an alliance. The basic premise comprises two parts. First, the collaboration must derive extra profits. Second, the joint values of a coalition should be greater than the value effectuated by an individual firm’s status quo. In other words, the former is a condition for building an alliance, and the latter is in accordance with preserving it. By assuming that a utility such as monetary value, for example, is transferable between firms, several allocation solutions in a cooperative game define how to distribute the collective outcome among members. An appropriate allocation scheme suggests a distribution that is reasonable or fair to each participating party. Only when all the postulations above are guaranteed can we consider that an alliance will be established and be successfully maintained.
Several studies have applied a cooperative game configuration to alliance sharing networks and the pooling of resources in logistics, including transportation. The topics can be classified into a vehicle routing game [43,44], a joint distribution problem of bundling and procurement [45,46], determination of the usage fees of logistics facilities such as airports or railways [47,48], and related subjects. In most transportation collaboration cases, the objective is to minimize the total cost of the coalition and its characteristic function, which means that the value created by the coalition in a cooperative game is defined as an amount of cost reduction. A study by Lozano et al. [49] explored the synergy from horizontal cooperation in trucking. It considered direct delivery trips with full truck loads when demand was known.
Our model is an extension of Lozano’s model in [49] and explicitly captures the trans-shipment in a hub-spoke network. Note that despite presenting the property of efficient usage of trucks, Lozano’s model [49] assumes full truck loads, which somewhat limits its real-world applicability. Therefore, we assume shipments are consolidated as well as trans-shippable, based on a hub-spoke network. Similar to numerous previous studies of transportation alliances, we assume that the alliance operates to minimize the total cost and that the benefit of the alliance is the amount of cost reduction. In the process, we framed the model to guarantee a balanced network, where outbound volumes are in sync with inbound volumes [50], as well as efficient use of the vehicles. Due to this model contributing to increasing social utility by reducing the number of truck trips, the alleviation of road congestion and the reduction of greenhouse gas emissions, our research is worthy of being studied.
In this paper, we analyze a transportation alliance with the following research questions:
- (1)
- Do logistics alliances as horizontal cooperation affect the profitability?
- (2)
- How should the benefits be shared fairly among participating members?
- (3)
- What could be expected for a specific coalition to form or to join an alliance with respect to those sharing rules?
Based on the above questions, we intend to find the optimal solution related to cost savings and examine the sharing rules of cooperative game theory by conducting a numerical example. First, we address logistics coalitions based on a hub-spoke network with given demands. Despite the potential benefits from cooperation, in order to create and maintain an effective alliance, a balanced and equitable distribution of the outcome of the collaboration should be pre-arranged. In other words, if there is any extra profit through a strategic alliance and there are agreements to sharing rules that guarantee a fair distribution, companies will be motivated to join such an alliance. Furthermore, if each firm is convinced that the distribution is satisfactory, it will have sufficient incentive to remain faithful to the alliance. In our paper, we present a mixed integer programming model that minimizes the total cost of an alliance. Our model allows an alliance to benefit from maximizing its economies of scale through the aggregation of demand and from maximizing its economies of scope through network sharing. Then, by analyzing and comparing different solution concepts based in cooperative game theory, we provide new insights into strategic alliances in transportation services.
This paper is organized as follows. Section 2 presents the aforementioned mixed integer programming model for estimating cost. In Section 3, we discuss cost saving allocation methods based on cooperative game theory. Section 4 describes a numerical example of a three-party hub-spoke transportation network, followed by a sensitivity analysis in Section 5. Finally, conclusions, as well as implementation and directions for further research, are provided.
2. Cost Estimation Model
The key to an alliance in transportation services is that the aggregated network should take into account how participating firms can achieve economies of scale and scope. We present a mixed integer programming model that extends the model in [49] for a hub-spoke network. Both studies assume horizontal cooperation in trucking with the aggregation of known demand. In our model, we examine shipments based on less than a truckload so that freights could be consolidated. Trans-shipment is premised on a hub-spoke network while Lozano’s model [49] considers full truck loads and only direct trips between two locations.
We assume that demand, based on each origin-destination pair, is known for a certain time period. The cost is also known and is calculated by the sum of each route travelled. The decision variables of our model are the amount of shipment of each origin-destination pair carried between each location and using each type of vehicle.
Suppose that the goal of the cooperation is minimizing the total cost, which we present as the objective function. We capture the penalty term for unmatched return trips in [49] and extend it by adding a penalty for unfilled space inside vehicles. Those penalties are reasonable considering the opportunity costs when carriers charge for unconnected return trips or for quick shipping without waiting for consolidation with (an)other shipment(s). To be specific, we regard the penalties as representing the opportunity costs considering all possible situations, such as deadheading (an empty truck trip) or dwell time (the time a driver has to wait for unloading and loading). Moreover, notwithstanding uncertainties in examining both real costs, we apply penalties in terms of inducing the efficient usage of vehicles.
In short, the total cost in our optimization-based cost minimization model comprises an operating cost between nodes depending on the vehicle type, a penalty cost for unmatched return trips between nodes per vehicle, and a penalty cost for the empty space in weight unit between nodes, by vehicle type. Whether the carriers operate independently or they cooperate as an alliance, we assume that the objective function is the same. Note that the demand after collaborating is simply aggregated since we do not suppose any other impact on demand from cooperation.
Before introducing the model formulation, all of the sets, parameters, and decision variables used in this paper are given as follows.
Sets and index
| : | node index | ||
| : | vehicle type index | ||
| c | : | vehicle code index (identification number) | |
| : | set of nodes | ||
| : | set of arcs | ||
| L | : | set of O-D(origin-destination) paths | |
| : | set of arcs on path | ||
| : | set of O-D paths including an arc | ||
| : | set of vehicle types | ||
| : | set of vehicle types leaving or arriving on node | ||
| : | set of vehicle types available on arc | ||
| : | set of codes of vehicle type on arc | ||
| S | : | set of collaborating companies (coalition) | |
| p | : | index of collaborating companies in coalition S |
Parameters
| : | cost of vehicle type with code on arc | ||
| : | level of loading (minimum capacity), | ||
| : | capacity of vehicle type | ||
| : | penalty cost of empty space in a vehicle type with code | ||
| : | penalty cost of unmatched trips of vehicle type | ||
| : | amount of freight (demand) on path |
Decision variables
| : | amount of shipment carried by vehicle type 𝑘 with code on arc (i,j) in path | |
| : | 1 if vehicle type 𝑘 with code is used on arc 0 otherwise, | |
| : | Number of unmatched trips of vehicle type at node , |
Then, the proposed mixed integer programming model for coalition S is presented as follows:
| Minimize | (1) | ||
| Subject to | (2) | ||
| (3) | |||
| (4) | |||
| (5) | |||
The model above solves the amount of assigned shipment between each route from an origin node i to a destination node j, and total given demands are satisfied with requiring the minimum cost. We let be the total minimum cost (i.e., the minimum value of the objective function in the above model) of coalition S. Constraint (2) is bounded at the lower and the upper capacity levels, and this is set by vehicle type. Constraint (3) aims to satisfy the required demands for each origin-destination path l of coalition S by employing each type of vehicle. In our model, we assume that each origin-destination demand is linked to travelling the shortest path based on a hub-spoke network. Thus, if two other demands are at the same origin and destination, they use the same path built with the same arcs. While the number of unmatched trips is calculated at constraint (4), we choose the positive values for imposing penalties of return trips from constraint (5).
Following the work in [49], we solve each company’s demand first and then solve the demand of every possible coalition , including the grand coalition. The optimal total cost of any coalition should be lower than the sum of the minimum cost of individual carriers, thus we could add a condition:
where is the total minimum cost of coalition S and is the total minimum cost of each player (carrier), represented as in a coalition when they transport individually without cooperation.
Let the cost savings, which is the difference between the total minimum costs of each carrier and the total minimum cost of the coalition, serve as values through cooperation. While the cost savings depend on which combination of the coalition is examined, they should guarantee the reservation value. Thus, we suppose the cost savings of the coalition S,, to be:
These cost savings enable the establishment and maintenance of an alliance of transportation services. Mainly, cooperation allows more intensive vehicle utilization by the use of larger and more efficient trucks, thereby reducing the total cost. Comparing cost savings according to coalitions, we develop an analysis of how to best allocate them among members of an alliance with a numerical example.
3. Allocation of Cost Savings
Sharing the profits of cooperation is not an easy task. Simply put, profit distribution based on individual contribution seems to be reasonable, but the problem of deciding how to measure such contributions remains. In this section, we discuss the distribution issue through a cooperative game-theoretic approach. Cooperative game theory is an approach that enables the investigation of the stability of each coalition and the sharing of benefits among players in a stable coalition [51]. In particular, cost allocation problems are designated to distribute the joint expenditures which are generated by coalitions to independent players.
Several solution schemes have been developed and applied in cooperative game theory. The core, a set of feasible payoff profiles for which there is no other coalitions with better payoffs, is a clearly defined concept. Because a non-empty core means that no player has an incentive to leave the coalition, proving the existence of the core implies that the coalition is stable and balanced, even though the core is not unique as is generally known. Following the definition of the core in Gillies [52], as undominated imputations in a game [53], Shapley and Shubik [54] proved the non-emptiness of the core in a convex programming model, while Owen [55] showed that the core is not empty in a linear production process. Although the core concept is intuitive and easy to understand, the core may not exist, and even if it does, it is not often unique. Shapley’s famous solution concept, the Shapley value [56], assigns to each member its marginal contribution. Numerous studies have applied the Shapley value because of its appeal with respect to uniqueness, while it could not exist in the core. On the other hand, the nucleolus introduced by Schmeidler [57] is always in the core if the core is nonempty, and unique as well [51]. The nucleolus defines an allocation that minimizes the maximal excess, which represents the minimization of the maximum of unhappiness. In contrast, the τ-value is a unique feasible payoff for players satisfied with both the minimal right and marginal contribution.
Despite the existence of many desirable allocation solutions, there is no single best or one-size-fits-all solution. To understand what is fair and acceptable to all members of an alliance, we compare the above four allocation solutions from cooperative game theory: the Shapley value, the core center, the τ-value, and the nucleolus. In the rest of the paper, we propose our analysis of benefit sharing in a logistics alliance with cooperative game approach through a numerical example because it seems the most appropriate way of understanding and analyzing the alliance in reality.
4. Numerical Example
In this section, we demonstrate a transportation alliance in a hub-spoke network to show the performance of a cooperative game theoretic approach to the fair allocation and distribution of cost savings. For the sake of brevity, this paper focuses on less than truckload shipping based on a simple hub-spoke network, as the model can be extended to more complex networks, and can be applied to other modes as well.
Let us assume an illustration of three possible carriers (labeled A, B, and C), which cooperate through sharing their networks and merging their own demands. We assume that each carrier operates their transportation services in a two-hub system that consists of two to three main hubs and two local hubs for each main hub. The main hub is functionalized only as a trans-shipment point and the local hub is the demand point. Three types of trucks, which have different capacities, are used. Two lower-capacity types are allocated at the route between a main hub and a local hub, while the highest-capacity type is only allowed to operate between main hubs. Supposing that carriers are homogeneous in their cost structures, the unit operating cost would be the same on the same route using the same vehicle type, and penalty costs would be the same as well. We also assume that all costs and demands are known. Due to not considering any other impacts on demand, aggregate demand by cooperation is just the sum of the demand status quo. Detailed data are presented in the Appendix.
In our example, we have seven possible coalitions (i.e., {A}, {B}, {C}, {AB}, {AC}, {BC}, and {ABC}), so we evaluate the mixed integer programming model in Section 2 for each coalition and calculate the cost savings. The results are shown in Table 1. Note that the cost savings, without collaboration, are all zero values by definition. The biggest cost savings are presented in the case of the grand coalition, since the value increases with coalition size. Thus, the monotonicity and super-additivity of cost savings hold because both of the possibilities for connecting trucks and filling trucks are increased by adding a member. However, it is not convex, as in the case of:
where is the characteristic value function that indicates cost savings in a coalition S. We here note that S can be one of {A}, {B}, {C}, {AB}, {AC}, {BC}, or {ABC} in this numerical example.
Table 2 presents the allocation of cost savings solved by different cooperative game solutions, i.e., the Shapley value, the core center, the –value, and the nucleolus. The results show that allocations by the core center, the -value, and the nucleolus have similar values, while the Shapley value assigns relatively lower distribution to carrier C.
We then compute the satisfaction of coalition S, which is the excess of the sum of distributed cost savings () compared to the grand coalition.
In Table 3, we compare the satisfaction values of each coalition scenario as the absolute term and the relative term , which is a percentage of total costs in the corresponding coalition. Interestingly, in our example, the maximum values exist in the biggest carrier, carrier C, which has three main hubs with the largest volume of shipments. For this reason, carrier C would be quite motivated to create the grand coalition. On the other hand, the minimum satisfaction of all four allocation solutions is shown in a coalition of carrier B with carrier C ({BC}), which has 2.6 to 3.0 percent of satisfaction for a grand coalition. This implies that a coalition {BC} might have little incentive to accept joining carrier A because carrier B and carrier C already enjoy satisfactory cost savings through their coalition {BC}. For example, based on the allocation of the Shapley value, the sum of distributed values to carrier B and carrier C, from cost savings in the case of the grand coalition, would be 1571.89 (606.95 + 964.94), which is an increase of only 2.6% over the cost savings of coalition {BC} (i.e., 1220.161). In practice, since carriers would weigh advantages and disadvantages of an alliance in the formation stage, if the anticipated benefit from the joining of a specific player is not sufficient, they might not invite the player.
Therefore, we could infer the bargaining game situation. For example, carrier C weighs an alliance with B and the grand coalition with A and B. The maximum value it is expected to obtain from the grand coalition is 1068.06 followed by the nucleolus rule, while it has to negotiate its share of the total cost savings (1220.161) with carrier B in the case of coalition {BC}. The problem is that the maximum value carrier B can expect is 606.95 of the Shapley value, which is bigger than 555.55 of the nucleolus. Thus, how to distribute 1220.161 is a new game between carrier B and C depending on each carrier’s bargaining power, which impacts whether the grand coalition will be created.
Although our example is limited in homogenous marginal cost between carriers, it shows that a big company might reap more benefits than small companies, and as a result, strengthens its competitiveness more over the long term. So, if there are no rules or regulations imposed by the market or government, the alliance leads to an oligopoly circumstance through gaining profits by collaboration among big companies. This supports the concerns of advocates of the anti-trust law and numerous studies about the negative impact of coalitions on social welfare [58,59].
5. Sensitivity Analysis
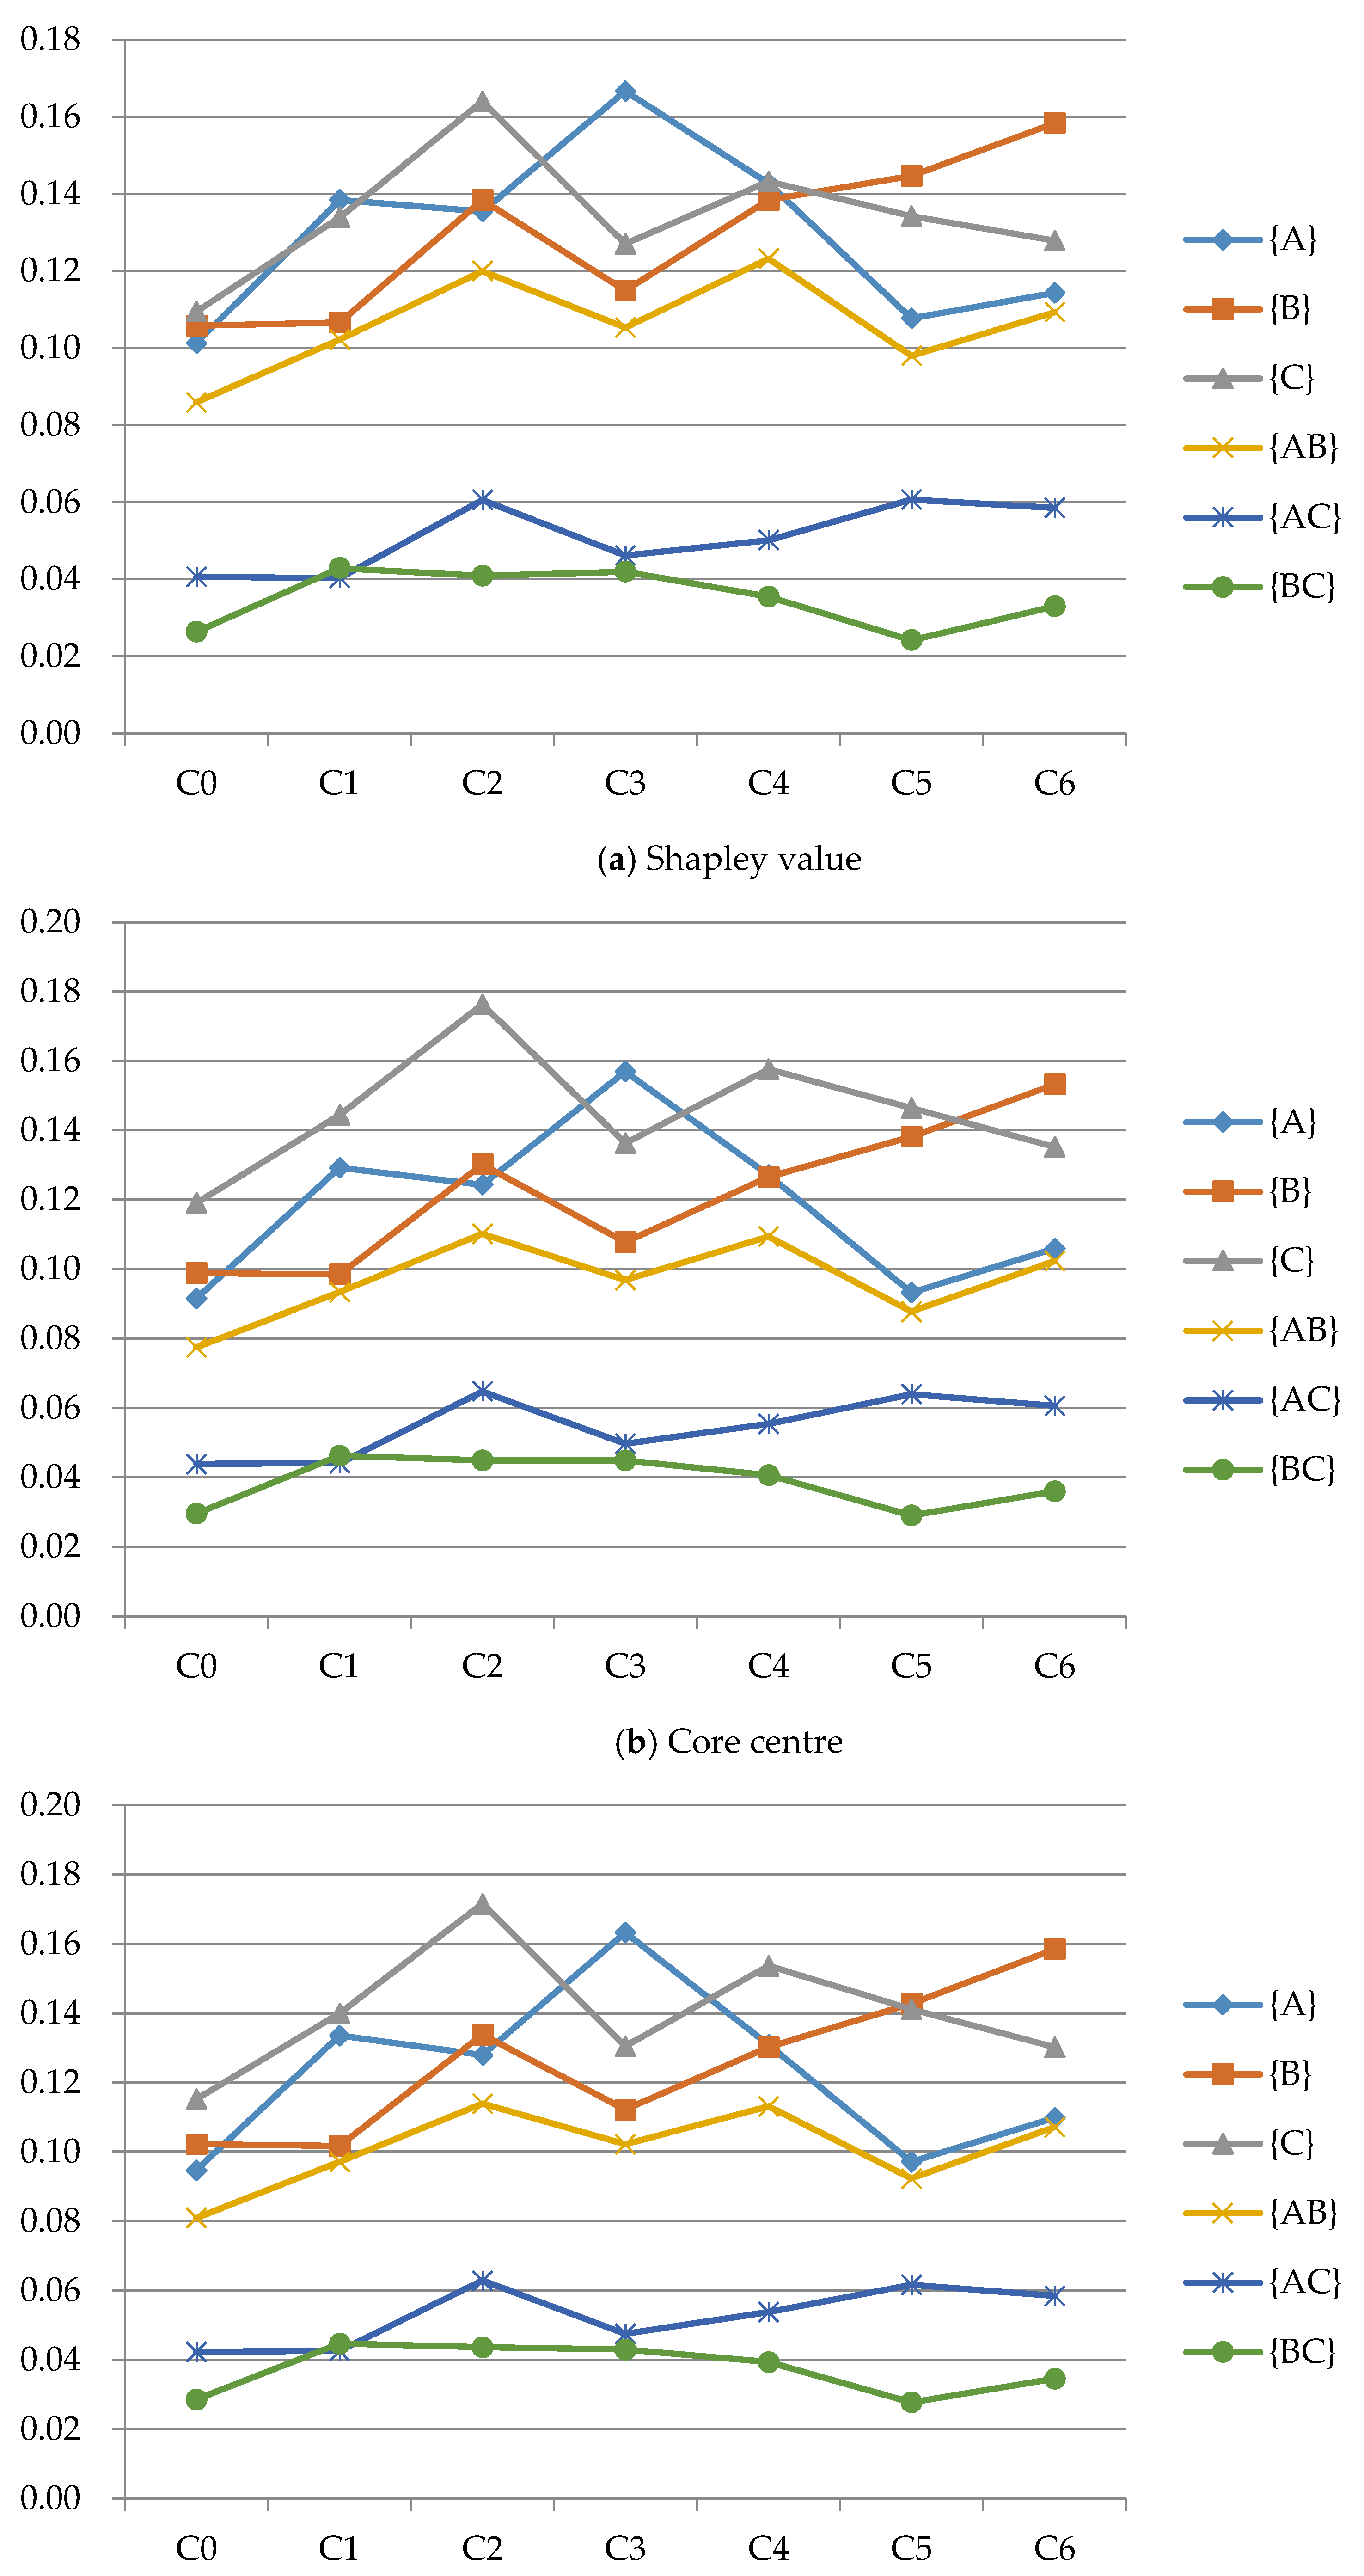
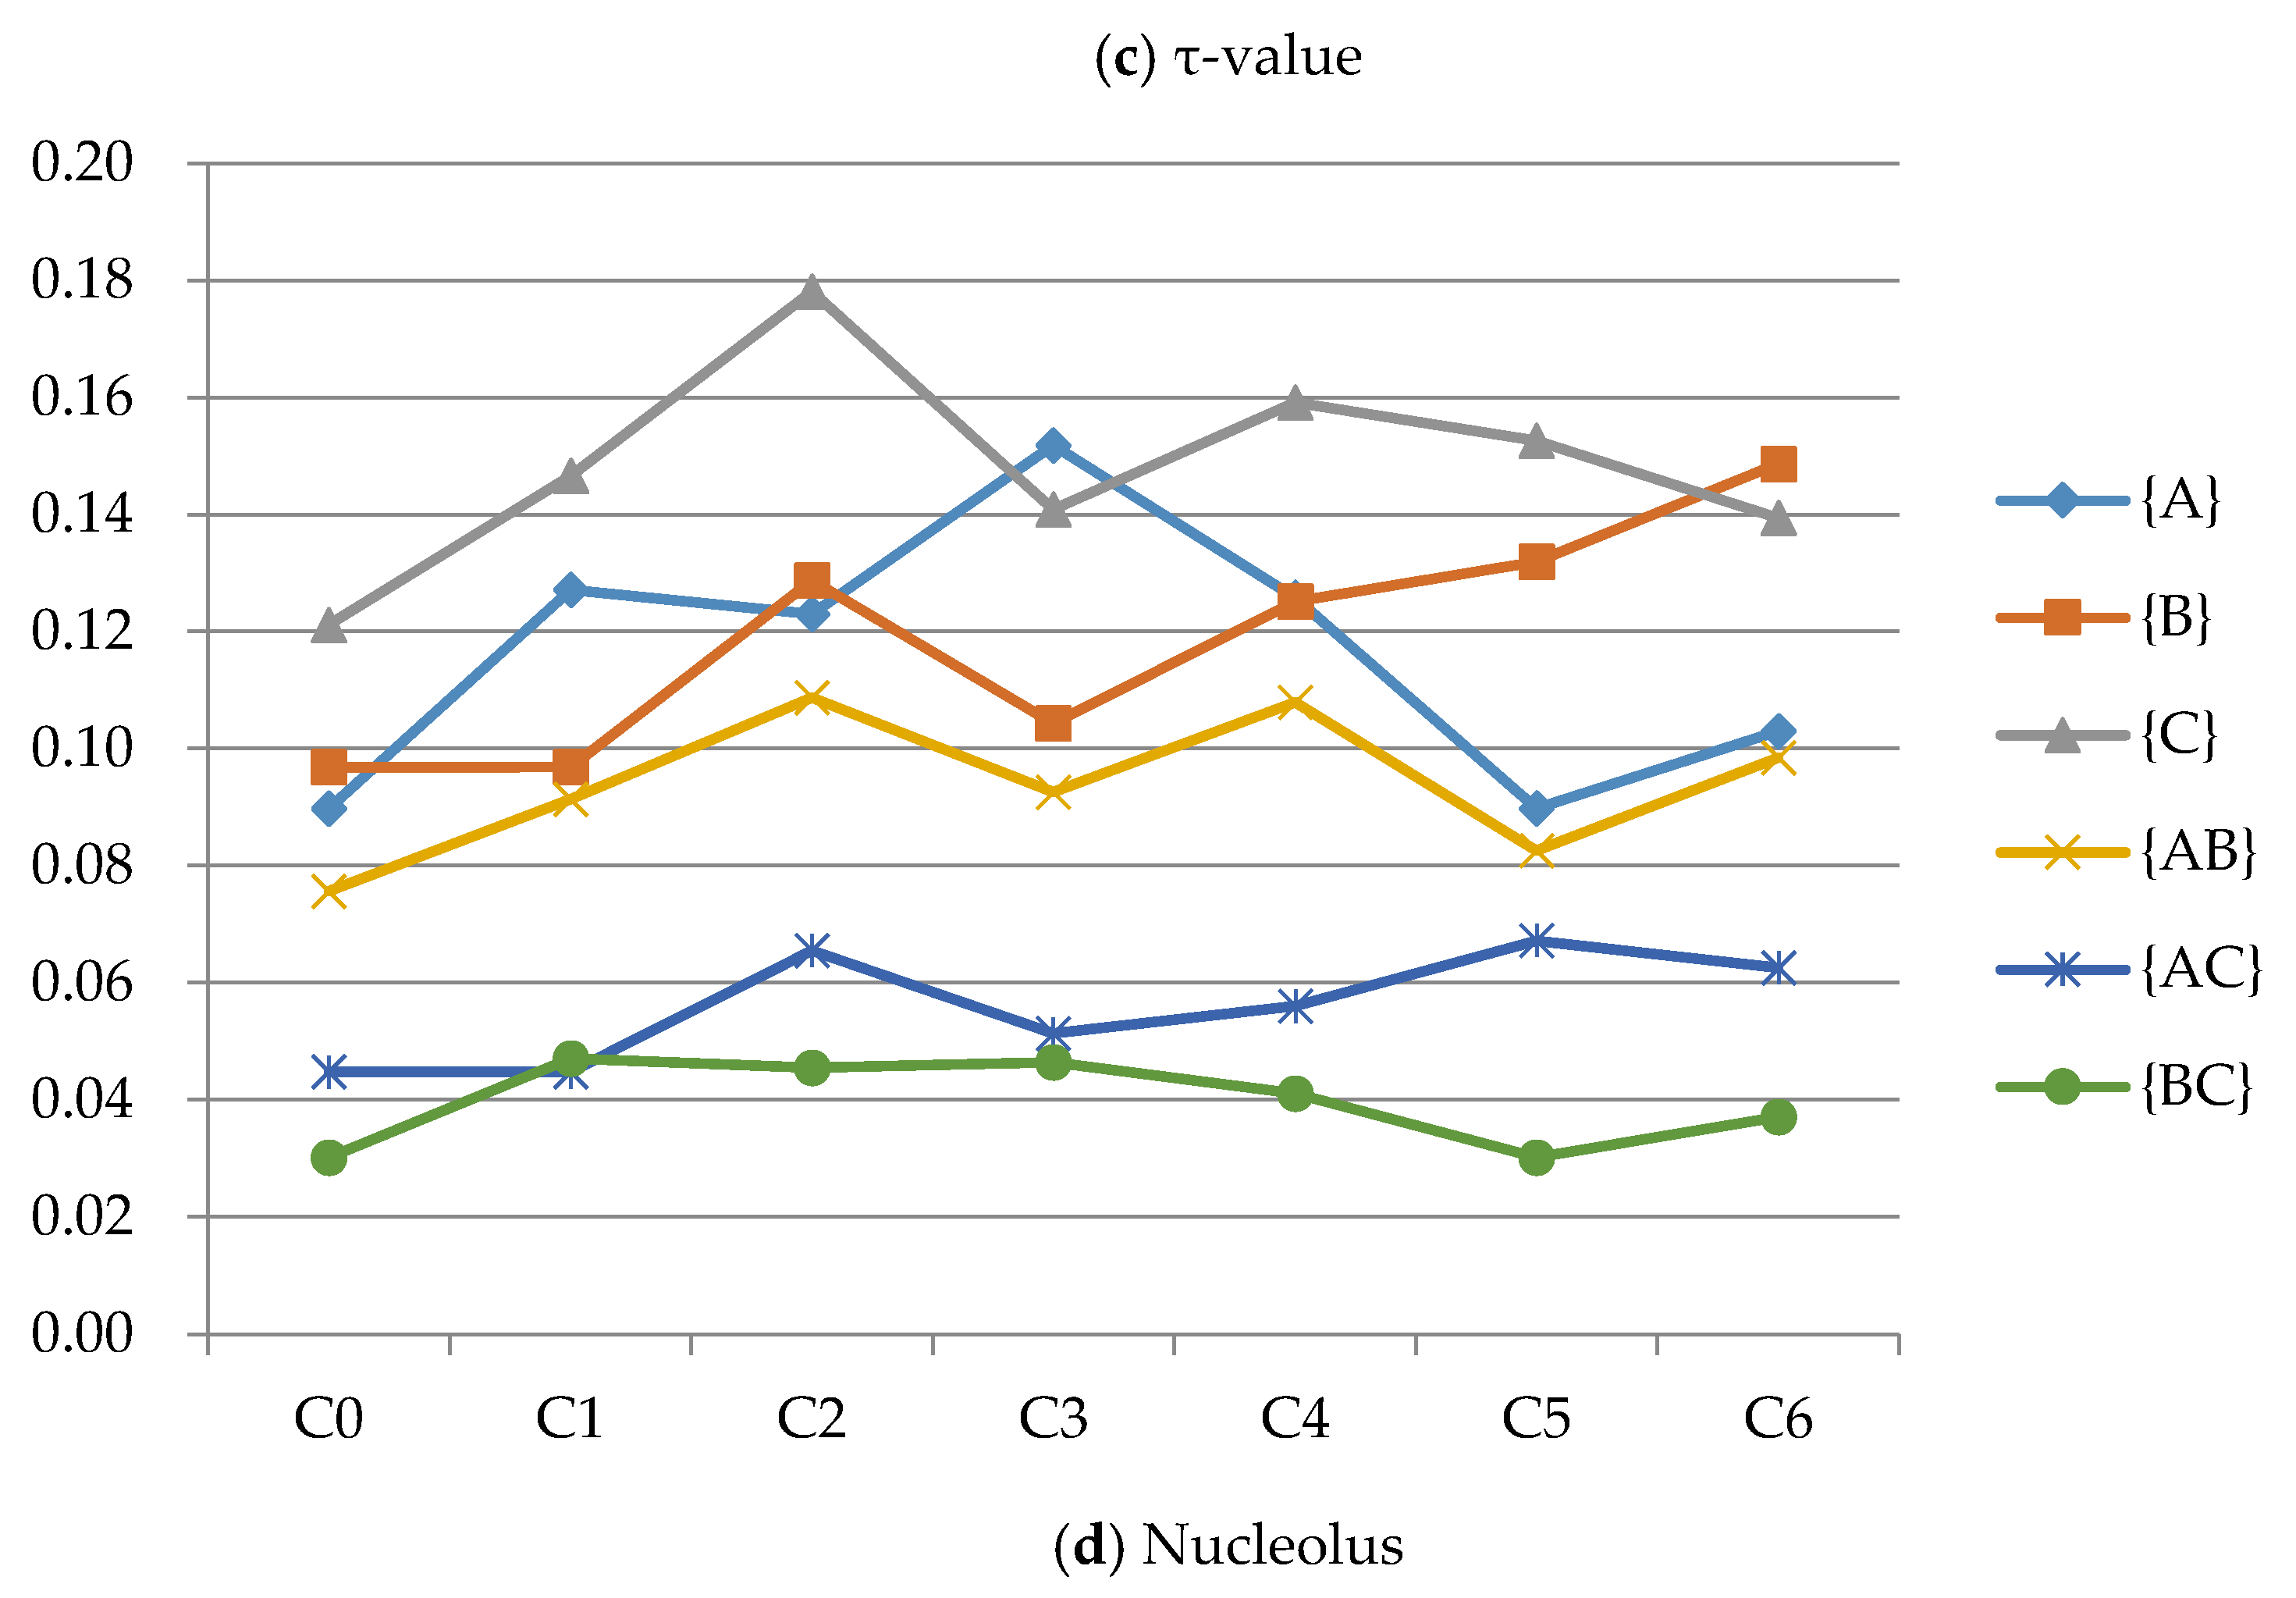
In this section, we provide the results of a sensitivity analysis by relaxing assumptions regarding the homogeneous cost structure. We verify whether the satisfaction with the grand coalition of each coalition is affected if heterogeneous cost structures are assigned to carriers. We assume that the costs are categorized as low or high. The low costs are the costs applied in Section 4, and the experimental variables of the high cost are calculated as a 10% increase over the low cost. Six alternative scenarios of different cost cases are performed to investigate the relative satisfaction. We conduct tests of each scenario to determine how each coalition is relatively satisfied with the grand coalition by comparing cost savings of the coalition to their total minimized cost. Table 5 and Figure 2 provide the results of the experiments.
First, in scenario C3, consisting of low costs in carrier A and high costs in both carrier B and carrier C, the satisfaction of A is the highest in all four allocating solutions, but {BC} shows the least satisfaction. The former implies that cooperation leads to increased efficiency and that carrier A, having competitive costs, is pleased with the fair distributions in the cooperative theoretic solutions as well. On the other hand, since carrier B and carrier C are satisfied with the collaborative outcome in coalition {BC}, where the minimum satisfaction value appears, they do not need to aggressively pursue the grand coalition.
Second, in scenario C6, the cost-competency carrier B demonstrates the maximum satisfaction, while the coalition {BC} still has the minimum value. In the same context as above, carrier B, for cost advantages, desires the grand coalition. However, the coalition {BC} generates sufficient outcomes to carrier B and carrier C. Here, we can suppose a bargaining game between carriers B and A for the grand coalition. Of course, the power of carrier B could be strengthened based on the premise that carrier C already agrees about the coalition {BC}.
In addition, we can observe that scenario C2 leads to the same result as the base model in Section 4. It illustrates that a relatively big firm is more satisfied with cooperation if it has relative cost efficiency as well. The result is shown in higher relative satisfaction compared to scenario C0, the base model.
Finally, comparing the coalition satisfactions of the four allocation solutions, all the minimum values are presented in coalition {BC}, except for coalition {AC}’s value in scenario C1. We can predict that in the case of scenario C1, the grand coalition is the best for cost-inefficient carrier A, whereas it seeks first to cooperate with carrier C to obtain additional benefits from resource sharing and economies of scale.
In summary, we confirm that an alliance could be formed between relatively large firms as in the basic model, even if the costs of carriers vary. Although an individual carrier’s satisfaction with the grand coalition differs depending on the scenario, the minimum satisfaction exists in coalition {BC}, which is the same as in the basic model. Our findings imply that a carrier with cost competitiveness, regardless of demands or network size, will form a grand coalition due to benefits from efficiency and fair distribution. However, forming such alliances tends to be more of a priority among large firms in the market. In contrast, the relatively small firms will try to lead in forming an alliance since they would more than likely not be invited to join an alliance already formed between large firms.
6. Conclusions
In this paper, we attempt to analyze the fair allocation of benefits from trucking alliances by comparing different solutions using cooperative game theory. Carriers in transportation services organize a strategic alliance in order to reduce costs by sharing limited resources and efficient utilization of the resources. An equitable allocation scheme is critical because it is an essential precondition to form an alliance and to maintain it. In our paper, we model a horizontal cooperation among carriers, based on trans-shipment and less-than-truckload shipments. Specifically, we set a two-hub structured network composed of main hubs and local hubs in order to reflect the real-world practices in the trucking industry. The benefits to be gained from cooperation are defined as cost savings, and opportunity costs are added as penalties for empty space in a vehicle as well as penalties for unmatched return trips so that the coalition could realize an efficient use of resources. We derive the minimum costs of all possible coalitions in a numerical example through a mixed integer programming model and calculate the cost savings.
Following that, we investigate allocation solutions in a cooperative game of splitting the cost savings among the alliance members. In particular, we apply the Shapley value, the core center, the τ-value, and the nucleolus for the allocation scheme. In our numerical example, satisfactions of all possible coalitions show that the biggest carrier is the most satisfied member in the grand coalition, whereas the minimum satisfactions exist in its coalition with the second biggest carrier. This implies that big companies could enjoy benefits from cooperation with other big ones and that an oligopoly could be a desirable structure for large firms where there are no restrictions.
This paper has contributed to confirming the possibility of a sharing economy in the logistics industry created by strategic alliances seeking cost savings. We are convinced by the sustainability of growth that enhances competitiveness through collaboration rather than competition. Neumann and Morgenstern [60] also mentioned that “there may exist an opportunity for genuine increases of productivity, simultaneously in all sectors of society.” Particularly in the logistics industry, which possesses all economic benefits such as economies of scale, scope and density, the effect of cooperation could be expected to be greater than for any other industry. Nonetheless, the existing research on logistics alliances is quite limited. Our findings support the feasibility of the coalition through examining the distribution method, which is a prerequisite of cooperation.
The cooperative game theoretic approach is still a relatively untapped research topic. In this study, we address only one aspect of possible alliances in the logistics industry. Additional research areas that need to be addressed include a model considering scheduling, the extension of the network, and the relaxation of assumptions such as demand or cost. For example, we assume the demand of an alliance is just the sum of each demand before collaboration. However, cooperation might influence demand by increasing customer utility, which in turn could impact demand growth and increase expected profits. In addition, our model considers a limited number of selected networks or vehicles. Thus, it does not cover all possible cases resulting from alliances between logistics companies.
In conclusion, despite some challenges, gaining sustainable competitive advantages through cooperation is a general trend in business. By examining the allocation solutions of profits from collaborating, our work can help in understanding the impact of strategic alliances in the logistics industry. Our findings provide practical guidance to logistics managers on how to use the cooperative game theoretic method for a preliminary judgment on direction setting. Moreover, it is meaningful for setting a rule regarding sharing benefits from cooperation by applying actual profit data of the alliance.
Author Contributions
All of the authors contributed significantly to the completion of this manuscript. Minyoung Yea conceived and designed the model and experiments. Seokhyun Chung developed the mathematical programming model and performed the experiments with Minyoung Yea. Minyoung Yea and Taesu Cheong analyzed the results from numerical experiments and derived managerial insights. Minyoung Yea prepared the initial draft of the manuscript. Taesu Cheong and Daeki Kim guided the whole research, supported the structure of the paper and reviewed and edited the final manuscript.
Acknowledgments
We would like to thank three anonymous reviewers for their valuable comments. This research was supported by Basic Science Research Program through the National Research Foundation of Korea (NRF) funded by the Ministry of Education (No. NRF-2018R1D1A1B07047651).
Conflicts of Interest
The authors declare no conflict of interest.
Appendix
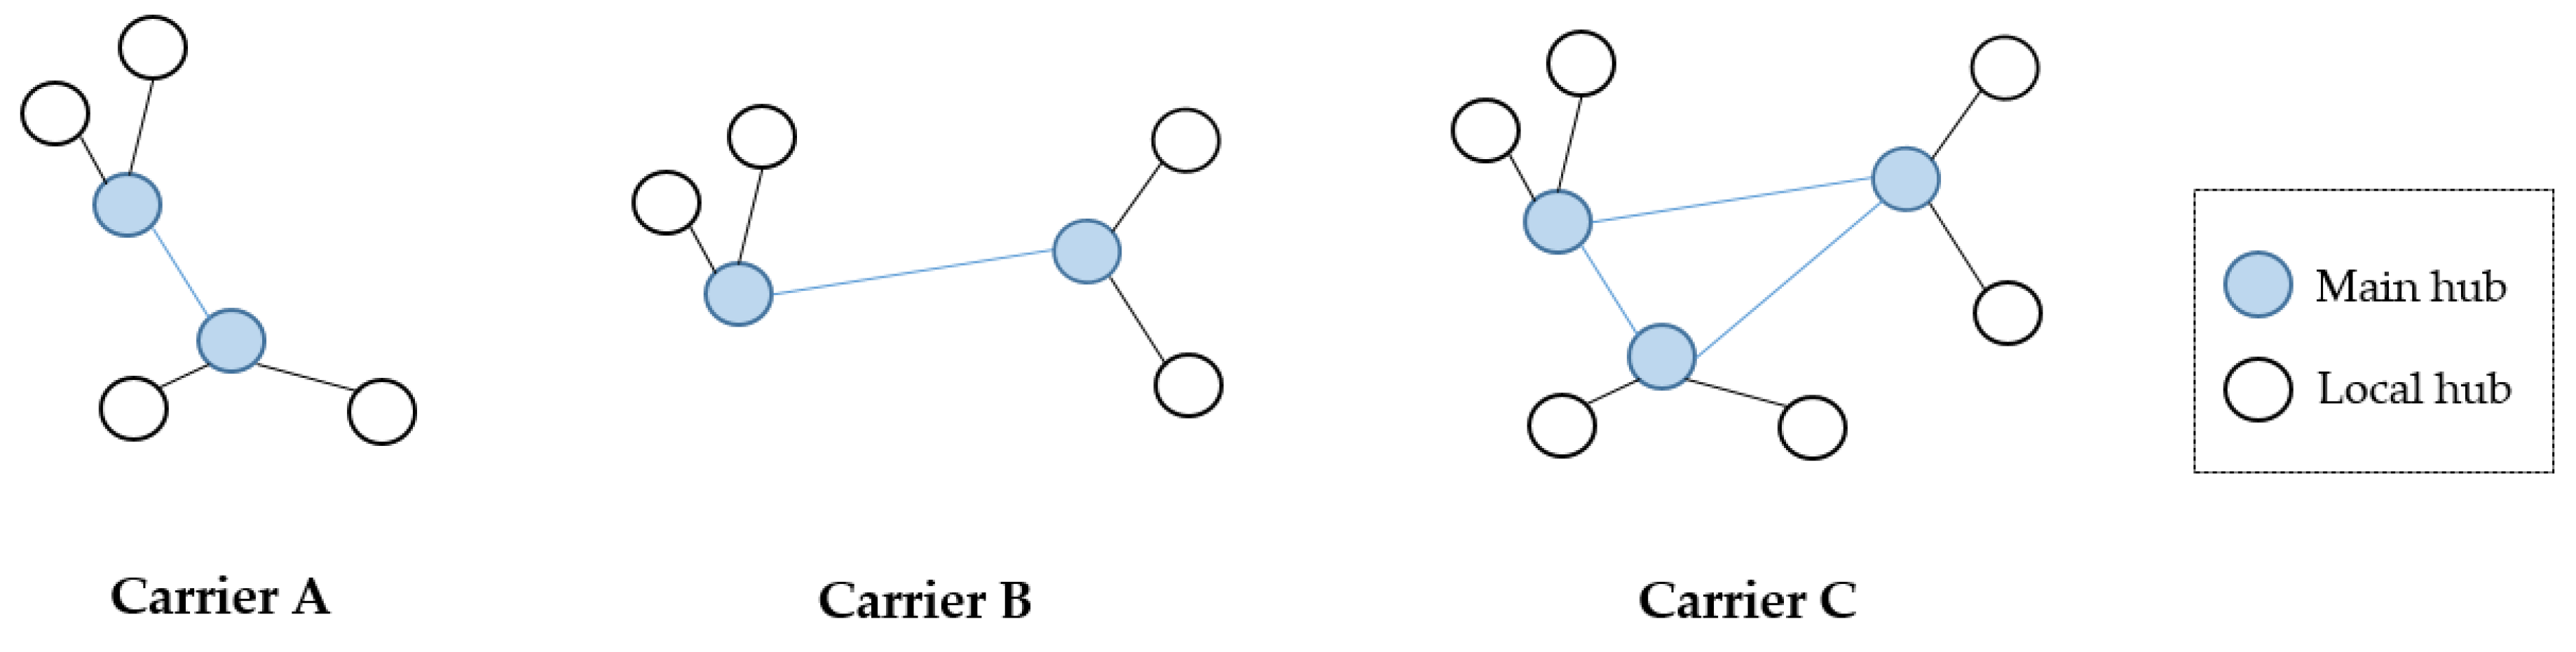
Carrier A’s network consists of two main hubs for transshipment and two local hubs, each connected to a main hub. Carrier B has a network structure similar to carrier A’s, and one main hub with two local hubs is assumed to be shared with carrier A when they cooperate. The largest carrier, C, has three main hubs, each linked to two local hubs. It shares two main hubs with carrier A as well as carrier B. Figure A1 gives illustrations for those networks.
To calculate the minimum cost in the example of this paper, we applied trucking cost data from Freight Transport Market Research Center, KOTI (The Korea Transport Institute). Specifically, we used average shipping costs on three different types of tonnage for cargo trucks in 2016. The whole report, including the data used, is named “Cargo Transportation Market Trends 2016 Annual Report” and can be accessed at Https://roft.koti.re.kr/usr_bbs/view.jsp?bbs_code=tbl_publish&bd_seqn=72&page=1&block=1.
Figure A1.
Network of the carrier.

References
- Lessig, L. Remix: Making Art and Commerce Thrive in the Hybrid Economy; Penguin Press: New York, NY, USA, 2008; ISBN 9781594201721. [Google Scholar]
- Airbnb Newsroom—Fast Facts. Airbnb. Available online: www.airbnb.com (accessed on 4 April 2018).
- Bert, J.; Collie, B.; Gerrits, M.; Xu, G. What’s Ahead for Car Sharing?: The New Mobility and Its Impact on Vehicle Sales. Boston Consulting Group. 23 February 2016. Available online: https://www.bcg.com/publications/2016/automotive-whats-ahead-car-sharing-new-mobility-its-impact-vehicle-sales.aspx (accessed on 4 April 2018).
- Leismann, K.; Schmitt, M.; Rohn, H.; Baedeker, C. Collaborative consumption: Towards a resource-saving consumption culture. Resources 2013, 2, 184–203. [Google Scholar] [CrossRef]
- Fellows, N.T.; Pitfield, D.E. An economic and operational evaluation of urban car-sharing. Transp. Res. Part D Transp. Environ. 2000, 5, 1–10. [Google Scholar] [CrossRef]
- Jenkins, R.; Molesworth, M.; Scullion, R. The messy social live of objects: Inter-personal borrowing and the ambiguity of possession and ownership. J. Consum. Behav. 2014, 13, 131–139. [Google Scholar] [CrossRef]
- Botsman, R.; Rogers, R. What’s Mine Is Yours: How Collaborative Consumption Is Changing the Way We Live; HarperCollins Publishers: New York, NY, USA, 2011; ISBN 9780007395910. [Google Scholar]
- Rifkin, J. The Zero Marginal Cost Society: The Internet of Things, the Collaborative Commons, and the Eclipse of Capitalism; St. Martin’s Press: New York, NY, USA, 2014; ISBN 1137280115. [Google Scholar]
- Oster, S.M. Modern Competitive Analysis, 3rd ed.; Oxford University Press: New York, NY, USA, 1999; ISBN 019511941X. [Google Scholar]
- Chung, S.; Singh, H.; Lee, K. Complementarity, status similarity and social capital as drivers of alliance formation. Strateg. Manag. J. 2000, 21, 1–22. [Google Scholar] [CrossRef]
- Lavie, D. The competitive advantage of interconnected firms: An extension of the resource-based view. Acad. Manag. Rev. 2006, 31, 638–658. [Google Scholar] [CrossRef]
- Varadarajan, P.R.; Cunningham, M.H. Strategic alliances: A synthesis of conceptual foundations. J. Acad. Mark. Sci. 1995, 23, 282–296. [Google Scholar] [CrossRef]
- Das, T.K.; Teng, B.S. A risk perception model of alliance structuring. J. Int. Manag. 2001, 7, 1–29. [Google Scholar] [CrossRef]
- Hihara, K. An analysis of airport-airline vertical relationships with risk sharing contracts under asymmetric information structures. Transp. Res. C-Emerg. Technol. 2014, 44, 80–97. [Google Scholar] [CrossRef]
- Li, L.; Qian, G.; Qian, Z. Do partners in international strategic alliances share resources, costs, and risks? J. Bus. Res. 2013, 66, 489–498. [Google Scholar] [CrossRef]
- Gibson, B.J.; Rutner, S.M.; Keller, S.B. Shipper-carrier partnership issues, rankings and satisfaction. Int. J. Phys. Distrib. Logist. Manag. 2002, 32, 669–681. [Google Scholar] [CrossRef]
- Nguyen, C.; Toriello, A.; Dessouky, M.; Moore, J.E. Evaluation of transportation practices in the California cut flower industry. Interfaces 2013, 43, 182–193. [Google Scholar] [CrossRef]
- Kogut, B. Joint ventures: Theoretical and empirical perspectives. Strateg. Manag. J. 1988, 9, 319–332. [Google Scholar] [CrossRef]
- Roels, G.; Tang, C.S. Win-win capacity allocation contracts in coproduction and codistribution alliances. Manag. Sci. 2016, 63, 861–881. [Google Scholar] [CrossRef]
- Chan, S.H.; Kensinger, J.W.; Keown, A.J.; Martin, J.D. Do strategic alliances create value? J. Financ. Econ. 1997, 46, 199–221. [Google Scholar] [CrossRef]
- Doz, Y.L. Technology partnerships between larger and smaller firms: Some critical issues. Int. Stud. Manag. Organ. 1987, 17, 31–57. [Google Scholar] [CrossRef]
- Hamel, G. Competition for competence and interpartner learning within international strategic alliances. Strateg. Manag. J. 1991, 12, 83–103. [Google Scholar] [CrossRef]
- Crawford, V.P.; Haller, H. Learning how to cooperate: Optimal play in repeated coordination games. Econometrica 1990, 58, 571–595. [Google Scholar] [CrossRef]
- Harrigan, K. Strategic Alliances and Partner Asymmetries. Manag. Int. Rev. 1988, 28, 53–72. [Google Scholar]
- Sheth, J.N.; Parvatiyar, A. Towards a theory of business alliance formation. Scand. Int. Bus. Rev. 1992, 1, 71–87. [Google Scholar] [CrossRef]
- Aloysius, J.A. Research joint ventures: A cooperative game for competitors. Eur. J. Oper. Res. 2002, 136, 591–602. [Google Scholar] [CrossRef]
- Gomes-Casseres, B. Joint venture instability: Is it a problem? Columbia J. World Bus. 1987, 22, 97–102. [Google Scholar]
- Park, S.H.; Russo, M.V. When competition eclipses cooperation: An event history analysis of joint venture failure. Manag. Sci. 1996, 42, 875–890. [Google Scholar] [CrossRef]
- Kumar, M.V.S. Differential gains between partners in joint ventures: Role of resource appropriation and private benefits. Organ. Sci. 2010, 21, 232–248. [Google Scholar] [CrossRef]
- Lin, X.; Germain, R. Sustaining satisfactory joint venture relationships: The role of conflict resolution strategy. J. Int. Bus. Stud. 1998, 29, 179–196. [Google Scholar] [CrossRef]
- Reynolds, R.J.; Snapp, B.R. The competitive effects of partial equity interests and joint ventures. Int. J. Ind. Organ. 1986, 4, 141–153. [Google Scholar] [CrossRef]
- Gulati, R.; Singh, H. The architecture of cooperation: Managing coordination costs and appropriation concerns in strategic alliances. Adm. Sci. Q. 1998, 43, 781–814. [Google Scholar] [CrossRef]
- Lei, D.; Slocum, J.W., Jr. Global Strategy, Competence-Building and Strategic Alliances. Calif. Manag. Rev. 1992, 35, 81–97. [Google Scholar] [CrossRef]
- Dyer, J.H.; Kale, P.; Singh, H. How to make strategic alliances work. MIT Sloan Manag. Rev. 2001, 42, 37–43. [Google Scholar]
- Elmuti, D.; Kathawala, Y. An overview of strategic alliances. Manag. Decis. 2001, 39, 205–218. [Google Scholar] [CrossRef]
- Parkhe, A. Strategic alliance structuring: A game theoretic and transaction cost examination of interfirm cooperation. Acad. Manag. J. 1993, 36, 794–829. [Google Scholar]
- Todeva, E.; Knoke, D. Strategic alliances and models of collaboration. Manag. Decis. 2005, 43, 123–148. [Google Scholar] [CrossRef] [Green Version]
- Medcof, J.W. Why too many alliances end in divorce. Long Range Plan. 1997, 30, 718–732. [Google Scholar] [CrossRef]
- Baum, J.A.; Calabrese, T.; Silverman, B.S. Don’t go it alone: Alliance network composition and startups’ performance in Canadian biotechnology. Strateg. Manag. J. 2000, 21, 267–294. [Google Scholar] [CrossRef]
- Das, T.K.; Teng, B.S. Between trust and control: Developing confidence in partner cooperation in alliances. Acad. Manag. Rev. 1998, 23, 491–512. [Google Scholar] [CrossRef]
- Monczka, R.M.; Petersen, K.J.; Handfield, R.B.; Ragatz, G.L. Success factors in strategic supplier alliances: The buying company perspective. Decis. Sci. 1998, 29, 553–577. [Google Scholar] [CrossRef]
- Ring, P.S.; Van de Ven, A.H. Structuring cooperative relationships between organizations. Strateg. Manag. J. 1992, 13, 483–498. [Google Scholar] [CrossRef]
- Engevall, S.; Göthe-Lundgren, M.; Värbrand, P. The heterogeneous vehicle-routing game. Transp. Sci. 2004, 38, 71–85. [Google Scholar] [CrossRef]
- Krajewska, M.A.; Kopfer, H.; Laporte, G.; Ropke, S.; Zaccour, G. Horizontal cooperation among freight carriers: Request allocation and profit sharing. J. Oper. Res. Soc. 2008, 59, 1483–1491. [Google Scholar] [CrossRef]
- Audy, J.F.; D’Amours, S.; Rousseau, L.M. Cost allocation in the establishment of a collaborative transportation agreement—An application in the furniture industry. J. Oper. Res. Soc. 2011, 62, 960–970. [Google Scholar] [CrossRef]
- Özener, O.Ö.; Ergun, Ö. Allocating costs in a collaborative transportation procurement network. Transp. Sci. 2008, 42, 146–165. [Google Scholar] [CrossRef]
- Hamidi, M.; Liao, H.; Szidarovszky, F. Non-cooperative and cooperative game-theoretic models for usage-based lease contracts. Eur. J. Oper. Res. 2016, 255, 163–174. [Google Scholar] [CrossRef] [Green Version]
- Littlechild, S.C.; Owen, G. A simple expression for the Shapley value in a special case. Manag. Sci. 1973, 20, 370–372. [Google Scholar] [CrossRef]
- Lozano, S.; Moreno, P.; Adenso-Díaz, B.; Algaba, E. Cooperative game theory approach to allocating benefits of horizontal cooperation. Eur. J. Oper. Res. 2013, 229, 444–452. [Google Scholar] [CrossRef]
- Caplice, C.; Sheffi, Y. Optimization-based procurement for transportation services. J. Bus. Logist. 2003, 24, 109–128. [Google Scholar] [CrossRef]
- Leng, M.; Parlar, M. Allocation of cost savings in a three-level supply chain with demand information sharing: A cooperative-game approach. Oper. Res. 2009, 57, 200–213. [Google Scholar] [CrossRef]
- Gillies, D.B. Solutions to general non-zero-sum games. Contributions to the Theory of Games; Tucker, A.W., Luce, R.D., Eds.; Princeton University Press: Princeton, NJ, USA, 1953; Volume 4, pp. 47–85. [Google Scholar]
- Straffin, P.D. Game Theory and Strategy; The Mathematical Association of America: Washington, DC, USA, 1993; ISBN 0-88385-637-9. [Google Scholar]
- Shapley, L.S.; Shubik, M. On market games. J. Econ. Theory 1969, 1, 9–25. [Google Scholar] [CrossRef]
- Owen, G. On the core of linear production games. Math. Program. 1975, 9, 358–370. [Google Scholar] [CrossRef]
- Shapley, L.S. A value for n-person games. In Contributions to the Theory of Games; Kuhn, H.W., Tucker, A., Eds.; Princeton University Press: Princeton, NJ, USA, 1953; Volume 2, pp. 307–317. [Google Scholar]
- Schmeidler, D. The nucleolus of a characteristic function game. SIAM J. Appl. Math. 1969, 17, 1163–1170. [Google Scholar] [CrossRef]
- Bloch, F. Endogenous structures of association in oligopolies. Rand J. Econ. 1995, 26, 537–556. [Google Scholar] [CrossRef]
- Park, J.H. The effects of airline alliances on markets and economic welfare. Transp. Res. Part E-Logist. Transp. Rev. 1997, 33, 181–195. [Google Scholar] [CrossRef]
- Von Neumann, J.; Morgenstern, O. Theory of Games and Economic Behavior, 60th Anniversary ed.; Princeton University Press: Princeton, NJ, USA, 2007; p. 540. ISBN 9780691130613. [Google Scholar]
Figure 1.
Core of the example.

Figure 2.
Relative satisfaction to the grand coalition of coalition S in four allocation solutions.


Table 1.
Optimal transportation cost for each of the possible coalitions.
| Coalition S | (S) | (S) |
|---|---|---|
| {A} | 4,490,078 | 0 |
| {B} | 5,736,211 | 0 |
| {C} | 8,813,446 | 0 |
| {AB} | 10,026,308 | 199,981 |
| {AC} | 12,387,567 | 915,957 |
| {BC} | 13,329,496 | 1,220,161 |
| {ABC} | 17,012,996 | 2,026,739 |
Table 2.
Allocation of the savings, where ({ABC}) = 2,026,739, according to the Shapley value, the core center, the τ-value, and the nucleolus (in thousands)
Table 2.
Allocation of the savings, where ({ABC}) = 2,026,739, according to the Shapley value, the core center, the τ-value, and the nucleolus (in thousands)
| Carrier | Shapley | Core Center | τ-Value | Nucleolus |
|---|---|---|---|---|
| A | 454.85 | 411.00 | 425.50 | 403.29 |
| B | 606.95 | 566.50 | 585.90 | 555.39 |
| C | 964.94 | 1049.20 | 1015.30 | 1068.06 |
Table 3.
Coalition satisfactions for the Shapley value, the core center, the τ-value, and the nucleolus.
Table 3.
Coalition satisfactions for the Shapley value, the core center, the τ-value, and the nucleolus.
| Coalition S | Shapley | Core center | τ-value | Nucleolus |
|---|---|---|---|---|
| {A} | 454.8 | 411.0 | 425.5 | 403.3 |
| 10.1% | 9.2% | 9.5% | 9.0% | |
| {B} | 607.0 | 566.5 | 585.9 | 555.4 |
| 10.6% | 9.9% | 10.2% | 9.7% | |
| {C} | 964.9 | 1,049.2 | 1,015.3 | 1,068.1 |
| 10.9% | 11.9% | 11.5% | 12.1% | |
| {AB} | 861.8 | 777.5 | 811.4 | 758.7 |
| 8.6% | 7.8% | 8.1% | 7.6% | |
| {AC} | 503.8 | 544.2 | 524.8 | 555.4 |
| 4.1% | 4.4% | 4.2% | 4.5% | |
| {BC} | 351.7 | 395.5 | 381.0 | 403.3 |
| 2.6% | 3.0% | 2.9% | 3.0% | |
| Min | 351.7 | 395.5 | 381.0 | 403.3 |
| 2.6% | 3.0% | 2.9% | 3.0% | |
| Max | 964.9 | 1,049.2 | 1,015.3 | 1,068.1 |
| 10.9% | 11.9% | 11.5% | 12.1% |
Table 4.
Core vertices of the example (in thousands).
| Vertex | |||
|---|---|---|---|
| 1 | 0.0 | 200.0 | 1826.8 |
| 2 | 0.0 | 1110.8 | 916.0 |
| 3 | 200.0 | 0.0 | 1826.8 |
| 4 | 806.6 | 0.0 | 1220.2 |
| 5 | 806.6 | 1110.8 | 109.4 |
Table 5.
Relative satisfaction based on sensitivity analysis1.
| (a) Shapley Value | |||||||
| Coalition S | C0 | C1 | C2 | C3 | C4 | C5 | C6 |
| {A} | 0.101 | 0.138 | 0.135 | 0.167 | 0.143 | 0.108 | 0.114 |
| {B} | 0.106 | 0.107 | 0.138 | 0.115 | 0.138 | 0.145 | 0.158 |
| {C} | 0.109 | 0.134 | 0.164 | 0.127 | 0.143 | 0.134 | 0.128 |
| {AB} | 0.086 | 0.102 | 0.120 | 0.105 | 0.123 | 0.098 | 0.109 |
| {AC} | 0.041 | 0.040 | 0.061 | 0.046 | 0.050 | 0.061 | 0.059 |
| {BC} | 0.026 | 0.043 | 0.041 | 0.042 | 0.036 | 0.024 | 0.033 |
| Min | 0.026 | 0.040 | 0.041 | 0.042 | 0.036 | 0.024 | 0.033 |
| Max | 0.109 | 0.138 | 0.164 | 0.167 | 0.143 | 0.145 | 0.158 |
| (b) Core Centre | |||||||
| Coalition S | C0 | C1 | C2 | C3 | C4 | C5 | C6 |
| {A} | 0.092 | 0.129 | 0.124 | 0.157 | 0.127 | 0.093 | 0.106 |
| {B} | 0.099 | 0.098 | 0.130 | 0.108 | 0.126 | 0.138 | 0.153 |
| {C} | 0.119 | 0.144 | 0.176 | 0.136 | 0.158 | 0.146 | 0.135 |
| {AB} | 0.078 | 0.093 | 0.110 | 0.097 | 0.109 | 0.088 | 0.102 |
| {AC} | 0.044 | 0.044 | 0.065 | 0.050 | 0.055 | 0.064 | 0.061 |
| {BC} | 0.030 | 0.046 | 0.045 | 0.045 | 0.041 | 0.029 | 0.036 |
| Min | 0.030 | 0.044 | 0.045 | 0.045 | 0.041 | 0.029 | 0.036 |
| Max | 0.119 | 0.144 | 0.176 | 0.157 | 0.158 | 0.146 | 0.153 |
| (c) τ-Value | |||||||
| Coalition S | C0 | C1 | C2 | C3 | C4 | C5 | C6 |
| {A} | 0.095 | 0.134 | 0.128 | 0.163 | 0.131 | 0.097 | 0.110 |
| {B} | 0.102 | 0.102 | 0.134 | 0.112 | 0.130 | 0.143 | 0.158 |
| {C} | 0.115 | 0.140 | 0.172 | 0.130 | 0.154 | 0.141 | 0.130 |
| {AB} | 0.081 | 0.097 | 0.114 | 0.102 | 0.113 | 0.092 | 0.107 |
| {AC} | 0.042 | 0.043 | 0.063 | 0.048 | 0.054 | 0.062 | 0.058 |
| {BC} | 0.029 | 0.045 | 0.044 | 0.043 | 0.039 | 0.028 | 0.035 |
| Min | 0.029 | 0.043 | 0.044 | 0.043 | 0.039 | 0.028 | 0.035 |
| Max | 0.115 | 0.140 | 0.172 | 0.163 | 0.154 | 0.143 | 0.158 |
| (d) Nucleolus | |||||||
| Coalition S | C0 | C1 | C2 | C3 | C4 | C5 | C6 |
| {A} | 0.090 | 0.127 | 0.123 | 0.152 | 0.126 | 0.090 | 0.103 |
| {B} | 0.097 | 0.097 | 0.129 | 0.104 | 0.125 | 0.132 | 0.149 |
| {C} | 0.121 | 0.147 | 0.178 | 0.141 | 0.159 | 0.153 | 0.139 |
| {AB} | 0.076 | 0.091 | 0.109 | 0.093 | 0.108 | 0.083 | 0.098 |
| {AC} | 0.045 | 0.045 | 0.066 | 0.051 | 0.056 | 0.067 | 0.063 |
| {BC} | 0.030 | 0.047 | 0.045 | 0.046 | 0.041 | 0.030 | 0.037 |
| Min | 0.030 | 0.045 | 0.045 | 0.046 | 0.041 | 0.030 | 0.037 |
| Max | 0.121 | 0.147 | 0.178 | 0.152 | 0.159 | 0.153 | 0.149 |
1 Scenarios: C0 based on the model in Section 4, C1 for HLL, C2 for HHL, C3 for LHH, C4 for LLH, C5 for LHL, and C6 for HLH (H represents the high cost structure and L represents the low cost structure).
© 2018 by the authors. Licensee MDPI, Basel, Switzerland. This article is an open access article distributed under the terms and conditions of the Creative Commons Attribution (CC BY) license (http://creativecommons.org/licenses/by/4.0/).
Share and Cite
MDPI and ACS Style
Yea, M.; Chung, S.; Cheong, T.; Kim, D. The Sharing of Benefits from a Logistics Alliance Based on a Hub-Spoke Network: A Cooperative Game Theoretic Approach. Sustainability 2018, 10, 1855. https://doi.org/10.3390/su10061855
AMA Style
Yea M, Chung S, Cheong T, Kim D. The Sharing of Benefits from a Logistics Alliance Based on a Hub-Spoke Network: A Cooperative Game Theoretic Approach. Sustainability. 2018; 10(6):1855. https://doi.org/10.3390/su10061855
Chicago/Turabian StyleYea, Minyoung, Seokhyun Chung, Taesu Cheong, and Daeki Kim. 2018. "The Sharing of Benefits from a Logistics Alliance Based on a Hub-Spoke Network: A Cooperative Game Theoretic Approach" Sustainability 10, no. 6: 1855. https://doi.org/10.3390/su10061855
Note that from the first issue of 2016, this journal uses article numbers instead of page numbers. See further details here.