Towards Sustainable Renovation: Key Performance Indicators for Quality Monitoring

1
Department of Construction Management and Real Estate, Vilnius Gediminas Technical University, Sauletekio Ave. 11, Vilnius LT-10223, Lithuania
2
The Lithuanian Expanded Polystyrene Association (LEPA), Vilniaus Str. 31, Vilnius 01402, Lithuania
*
Author to whom correspondence should be addressed.
Sustainability 2018, 10(6), 1840; https://doi.org/10.3390/su10061840
Submission received: 1 May 2018
/
Revised: 24 May 2018
/
Accepted: 29 May 2018
/
Published: 1 June 2018
(This article belongs to the Special Issue Sustainability in Construction Engineering)
Abstract
:The aim of this study is to propose the rational quality monitoring of the renovation process with methodology for data collection and analysis. The presented approach is based on a complex system of criteria that enables the comprehensive evaluation of the quality of the renovation process. Methodology that is developed for the rational quality monitoring of the renovation process can be used for long term monitoring activities to ensure that the system is up to date, while reflecting the concerns of the key stakeholders and the transfer of requirements. The main emphasis lies on the identification of the rapidly changing environment (regulations, technologies, needs and expectations of building owners, etc.). Quality monitoring will also serve as an analytical framework to analyze the effects of renovation and to identify what measures shall be undertaken to ensure that the renovation delivers the most positive results. This paper presents the case study analysis of renovated multi-family apartment buildings, the existing indicators of the renovation monitoring scheme and the structure of the proposed monitoring system of the renovation processes, key indicators, the main components of the system, and their links.
1. Introduction
A pressing task that the world is facing today is the sustainable development of cities that is addressed through the constructive interaction of environmental, economic, and social factors. Sustainability priorities focus on the problems of energy efficiency, environment protection, and other issues appearing throughout all of the building life cycle, and deal with various interest groups with different targets. Sustainable development is becoming more relevant, with recent studies showing that more and more research is being published that relates to sustainability across the whole building life-cycle [1]. Sustainable building design [2], integrated planning for sustainable building [3], climate change challenges [4], solutions to achieve Nearly Zero-Energy Buildings [5], building-integrated green technologies [6], and the assessment of building refurbishment measures [7,8,9] are among the most topical areas of recent research.
EU members were ruled by The Energy Performance of Buildings Directive (EPBD) [10] to reduce energy consumption in the building sector. The existing buildings represent the biggest potential for energy savings, and therefore they are crucial in achieving the objective of reducing environmental impacts by about 95% by 2050 compared to 1990. Thus, the rate of building renovations needs to be increased. Although the recast of the EPBD 2010/31/EU [10] focuses on new buildings, the refurbishment of existing buildings requires investigation because of the huge potential for energy savings. The Energy Efficiency Directive 2012/27/EU [11] especially encourages thorough renovations. It covers residential and non-residential buildings and requires the establishment of long-term strategies for the renovation of the national building stock. These requirements were transferred to the national legislative documents. So, the technical regulation of construction [12] in Lithuania sets the requirements for the thermal insulation of residential building envelopes according to the exact energy class. In accordance with the requirements for energy performance [12], the energy efficiency of new buildings constructed after 1 January 2016 should not be lower than A class, and after 1 January 2021, the energy efficiency class of newly constructed buildings should not be lower than A++. Less strict requirements have been set for the energy efficiency class of renovated buildings. Class C of energy efficiency is desirable in many renovation cases so far.
Energy efficiency potential could be identified by considering different factors which influence energy consumption, i.e., climate parameters, solutions for the building envelope, energy systems, the mode of building operation, and the behavior of occupants [13].
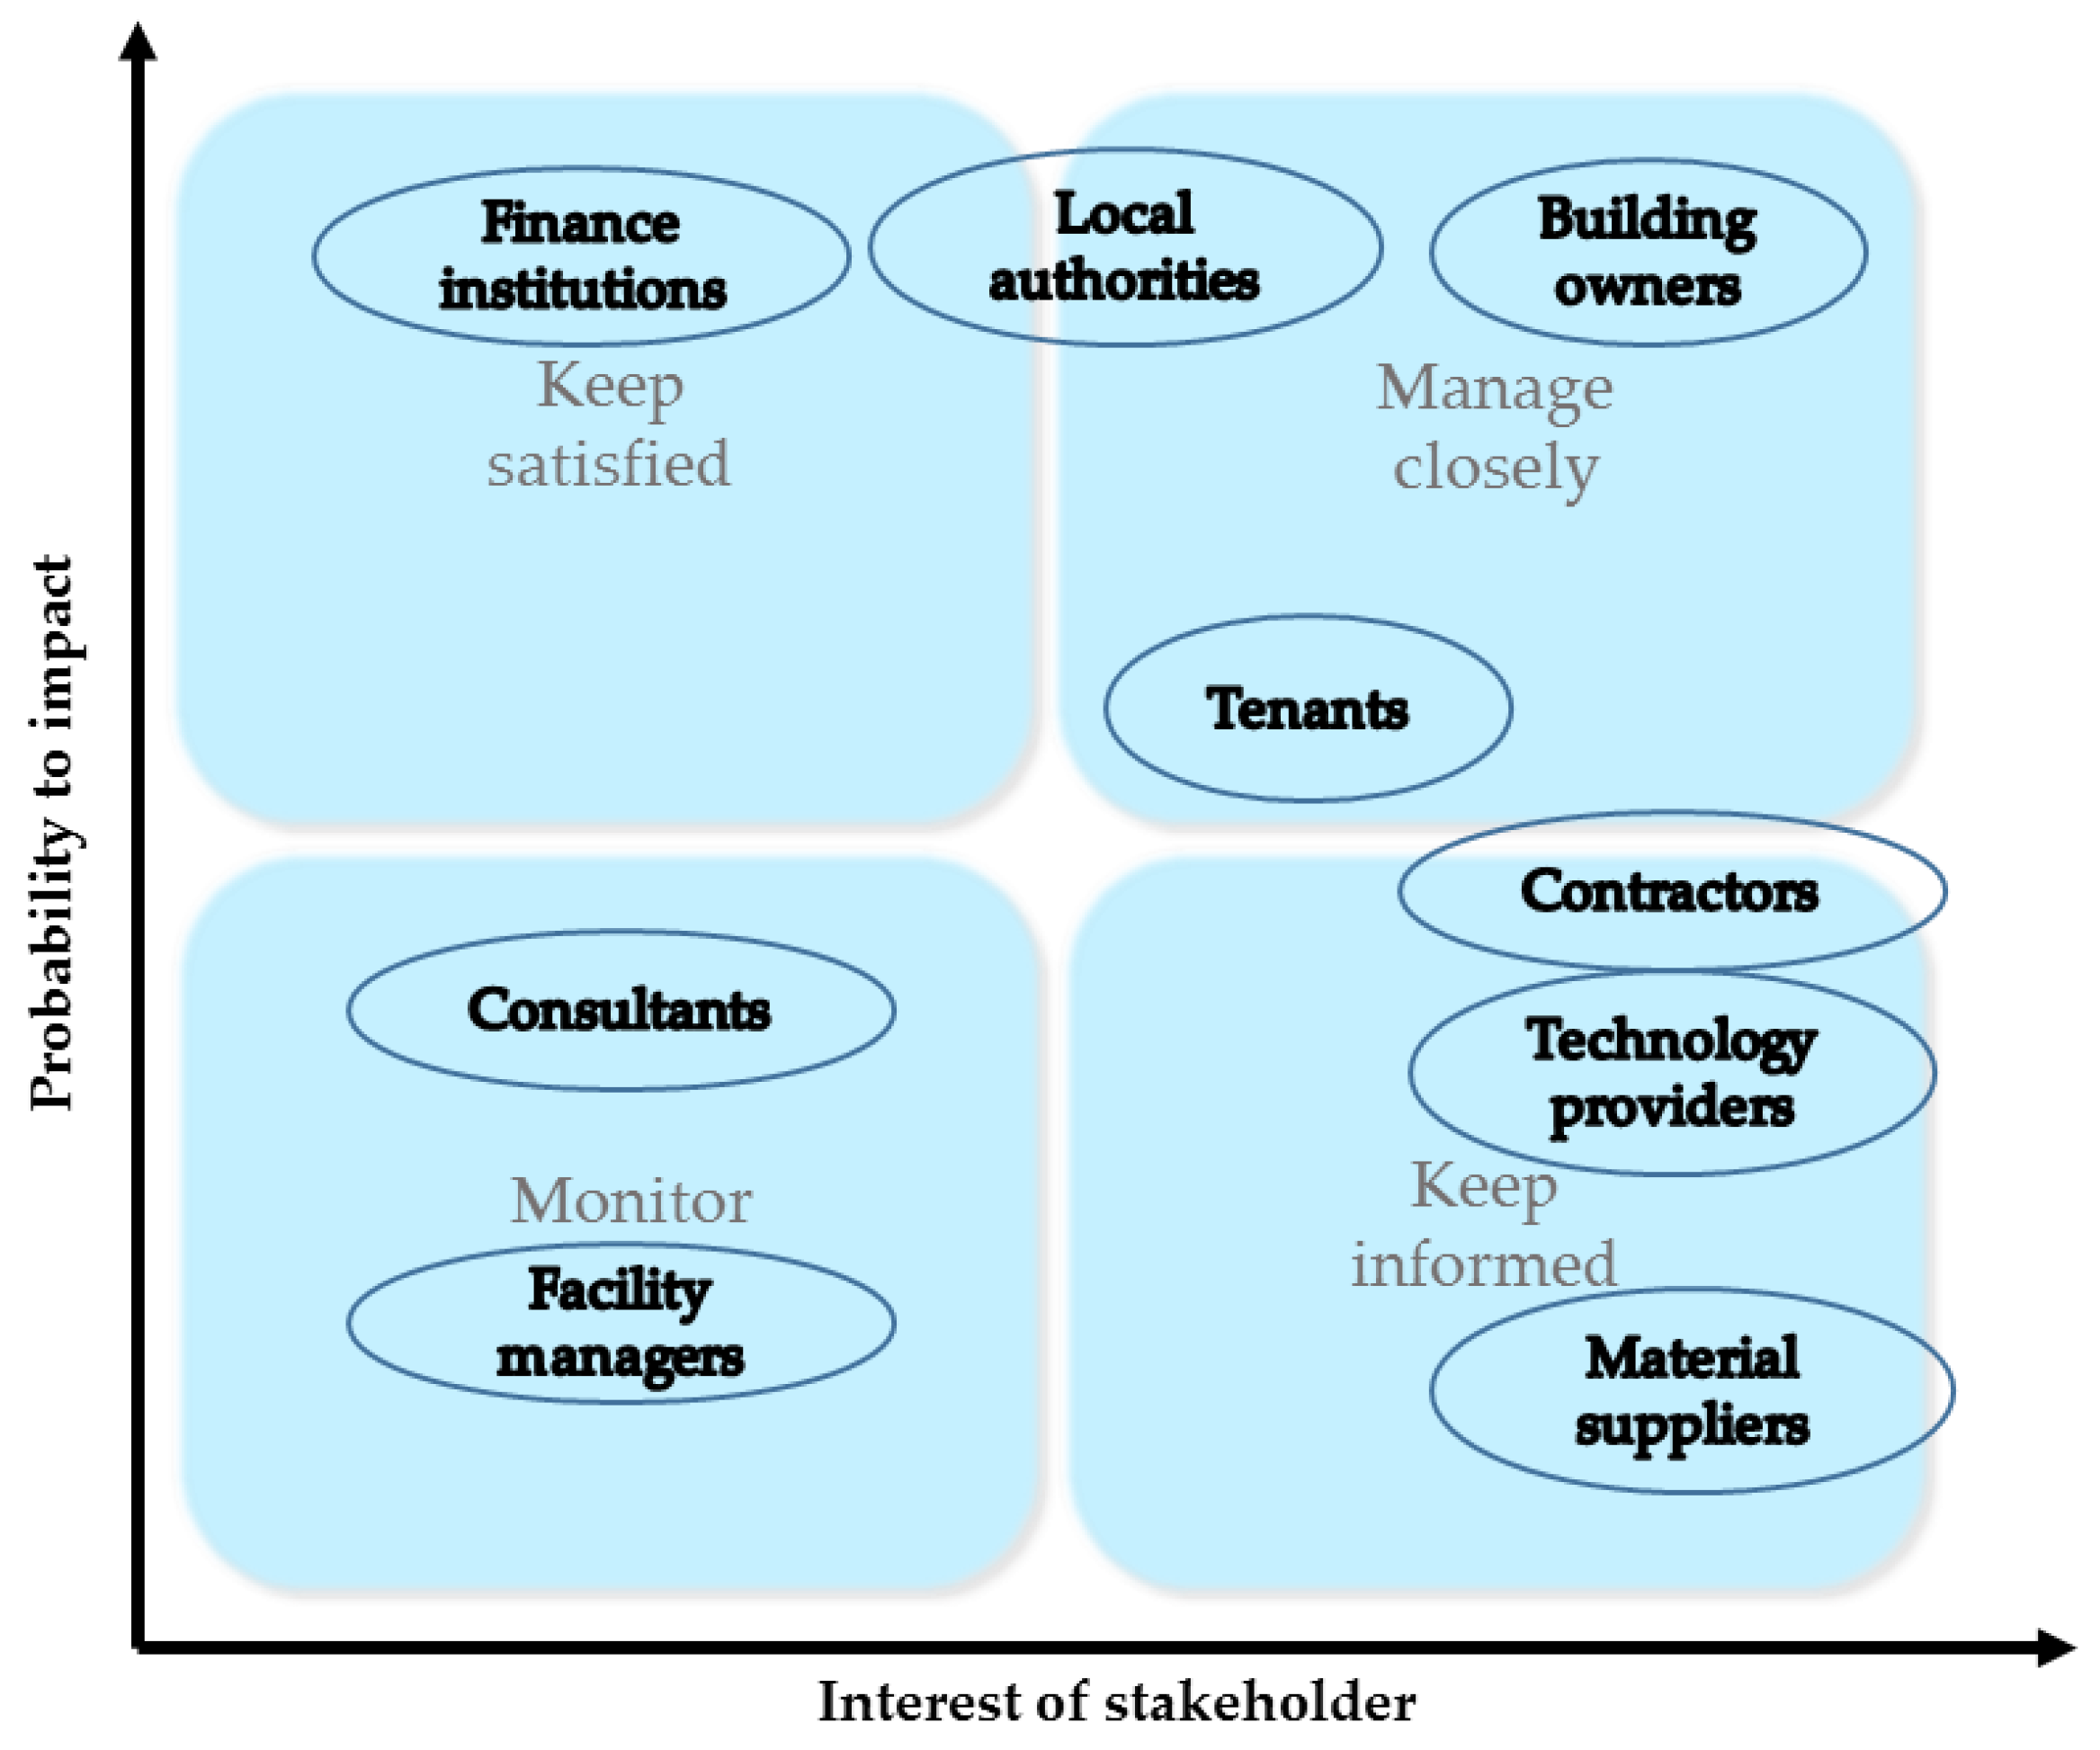
Interest groups, or stakeholders, who participate in the renovation process have different influences on the process and the results of the renovation. Figure 1 depicts the main key stakeholders on different levels participating in the renovation process. The research of Risholtn and Berker [14] revealed that private building owners are a key group that are urging to increase the dwelling energy efficiency rates. The analysis of the effect of domestic occupancy profiles on energy performance revealed that the type and size of household influences the energy demand [15]. If building owners were conscious consumers or had specific knowledge, they would succeed in saving energy. Therefore, relevant and reliable advice is crucial and can get homeowners to realize energy savings. However, recent feedback from implemented renovation projects is insufficient for the provision of reliable advices.
The aim of this study is to propose rational quality monitoring of the renovation process, while taking into account the needs and level of involvement of different stakeholders. The presented approach is based on a complex system of criteria that enables comprehensive evaluation of the quality of the renovation process. Methodology that is developed for the rational quality monitoring of the renovation process can be used for long term monitoring activities to ensure that the system is up to date, while reflecting changes in technologies, the concerns of stakeholders, and the increase of requirements. The main emphasis lies on the identification of the rapidly changing environment (regulations, technologies, needs and expectations of building owners, etc.). Quality monitoring will also serve as an analytical framework to analyze the effects of renovation, and as a means to assist in finding out the measures that shall be undertaken to ensure that the renovation delivers the most positive results. If correctly applied, the developed methodology will help to ensure that the renovation process is directed towards sustainability.
The analysis made by the authors revealed that there is the possibility to collect and analyze renovation related data from different perspectives. This is useful for different stakeholders of the renovation process and would obviously help to facilitate decision-making processes. The study also revealed that in order to allow the systematic data collection, analysis, and transfer, it is necessary to formulate the requirements for the submission of data. The methodological approach proposed in this study can be used for the generation of specific procedures, and it can contribute to the transparency of data collection, analysis, and transfer. The proposed methodology is versatile and could be adapted for other cases by changing the set of criteria so that they respond to the different environment.
The paper is organized as follows: the second section describes the methodology used, the data sources, and presents a workflow diagram of the proposed approach. The third section presents the results of the data analysis of the renovated case buildings. The fourth section presents the specific approach for gathering the information on all stages of the renovation process, and describes the set of monitoring indicators including their codes, links with the processes of the renovation scheme and methods for capturing, measurement, and the calculation of every indicator.
2. Materials and Methods
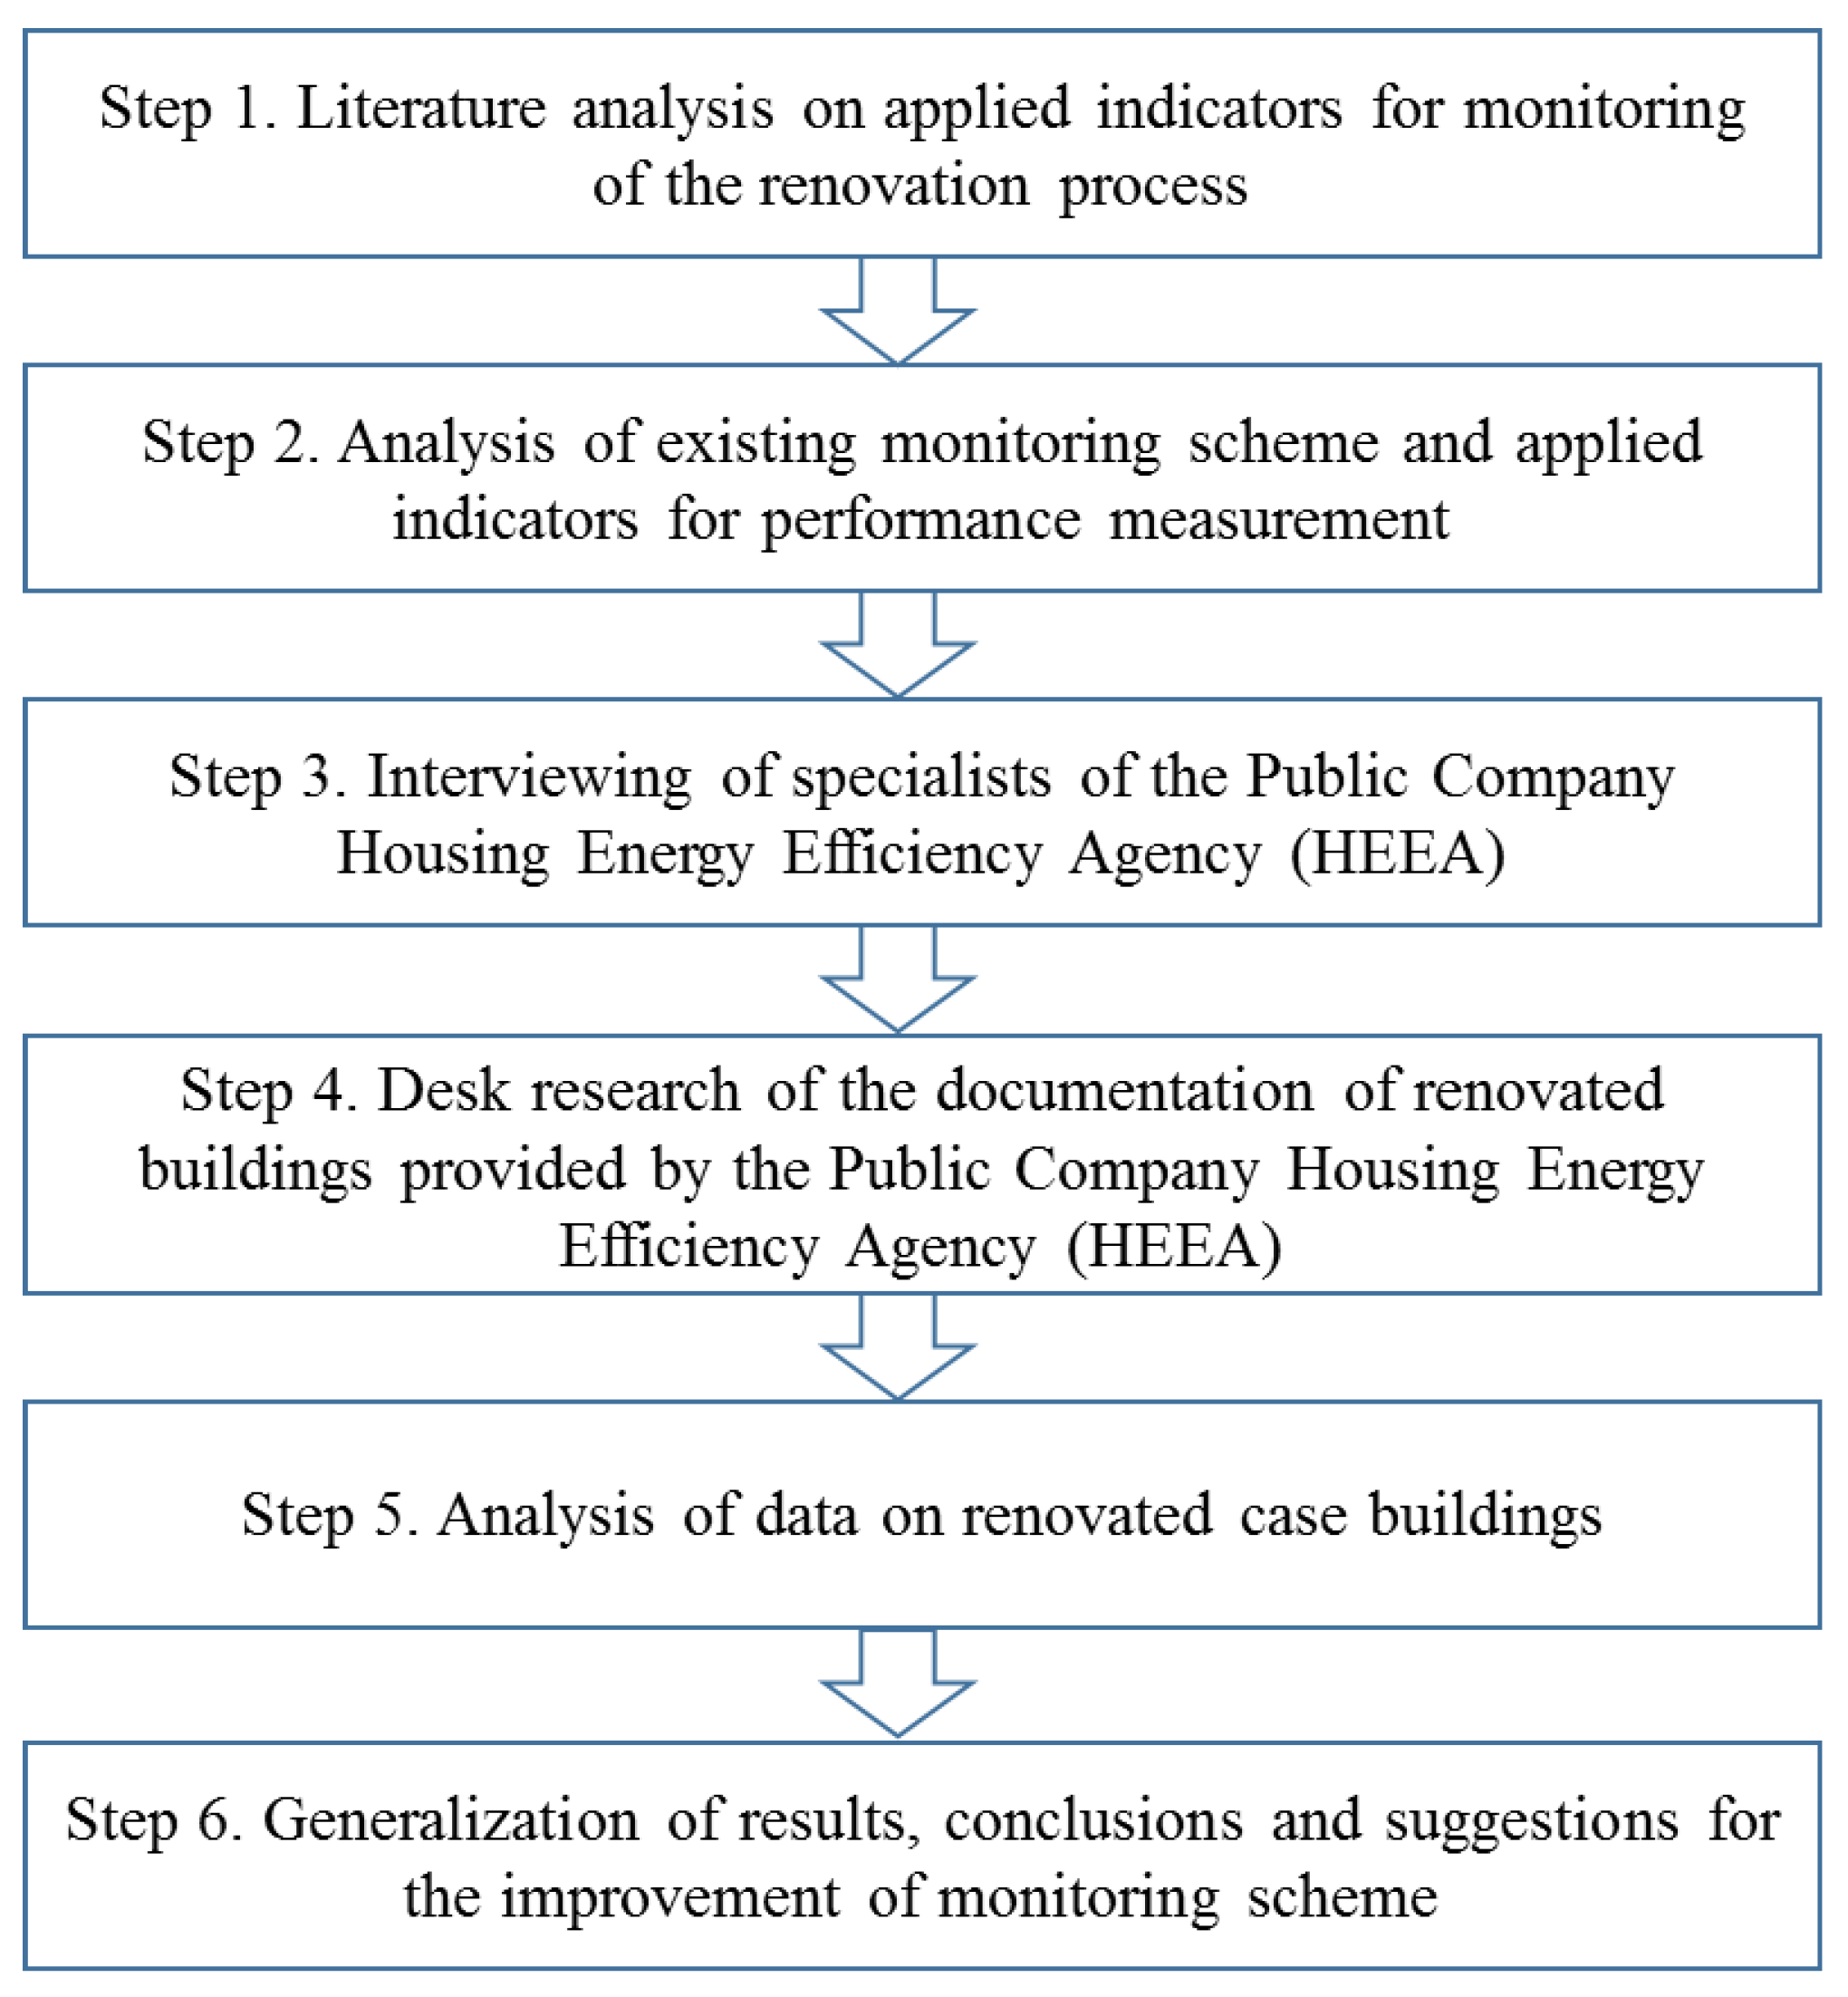
The approach is based on a literature analysis of the generally applied indicators for the monitoring of the renovation process, the analysis of existing monitoring scheme and applied indicators for performance measurement, interviewing specialists of the Housing Energy Efficiency Agency (HEEA), desk research of documentation, and the analysis of data on renovated case buildings (see Figure 2). The analysis resulted in the generalization of findings, conclusions, and suggestions for the improvement of the monitoring scheme for renovations. A sample of 74 buildings located in different regions of Lithuania was taken to analyze the energy performance indicators before and after renovation, the applied renovation measures, and energy renovation scenarios.
3. Results of the Renovation Data Analysis
This section provides a concise and precise description of the results of the analysis of data of the renovated case buildings, the interpretation, and preliminary conclusions.
3.1. Description of Case Buildings
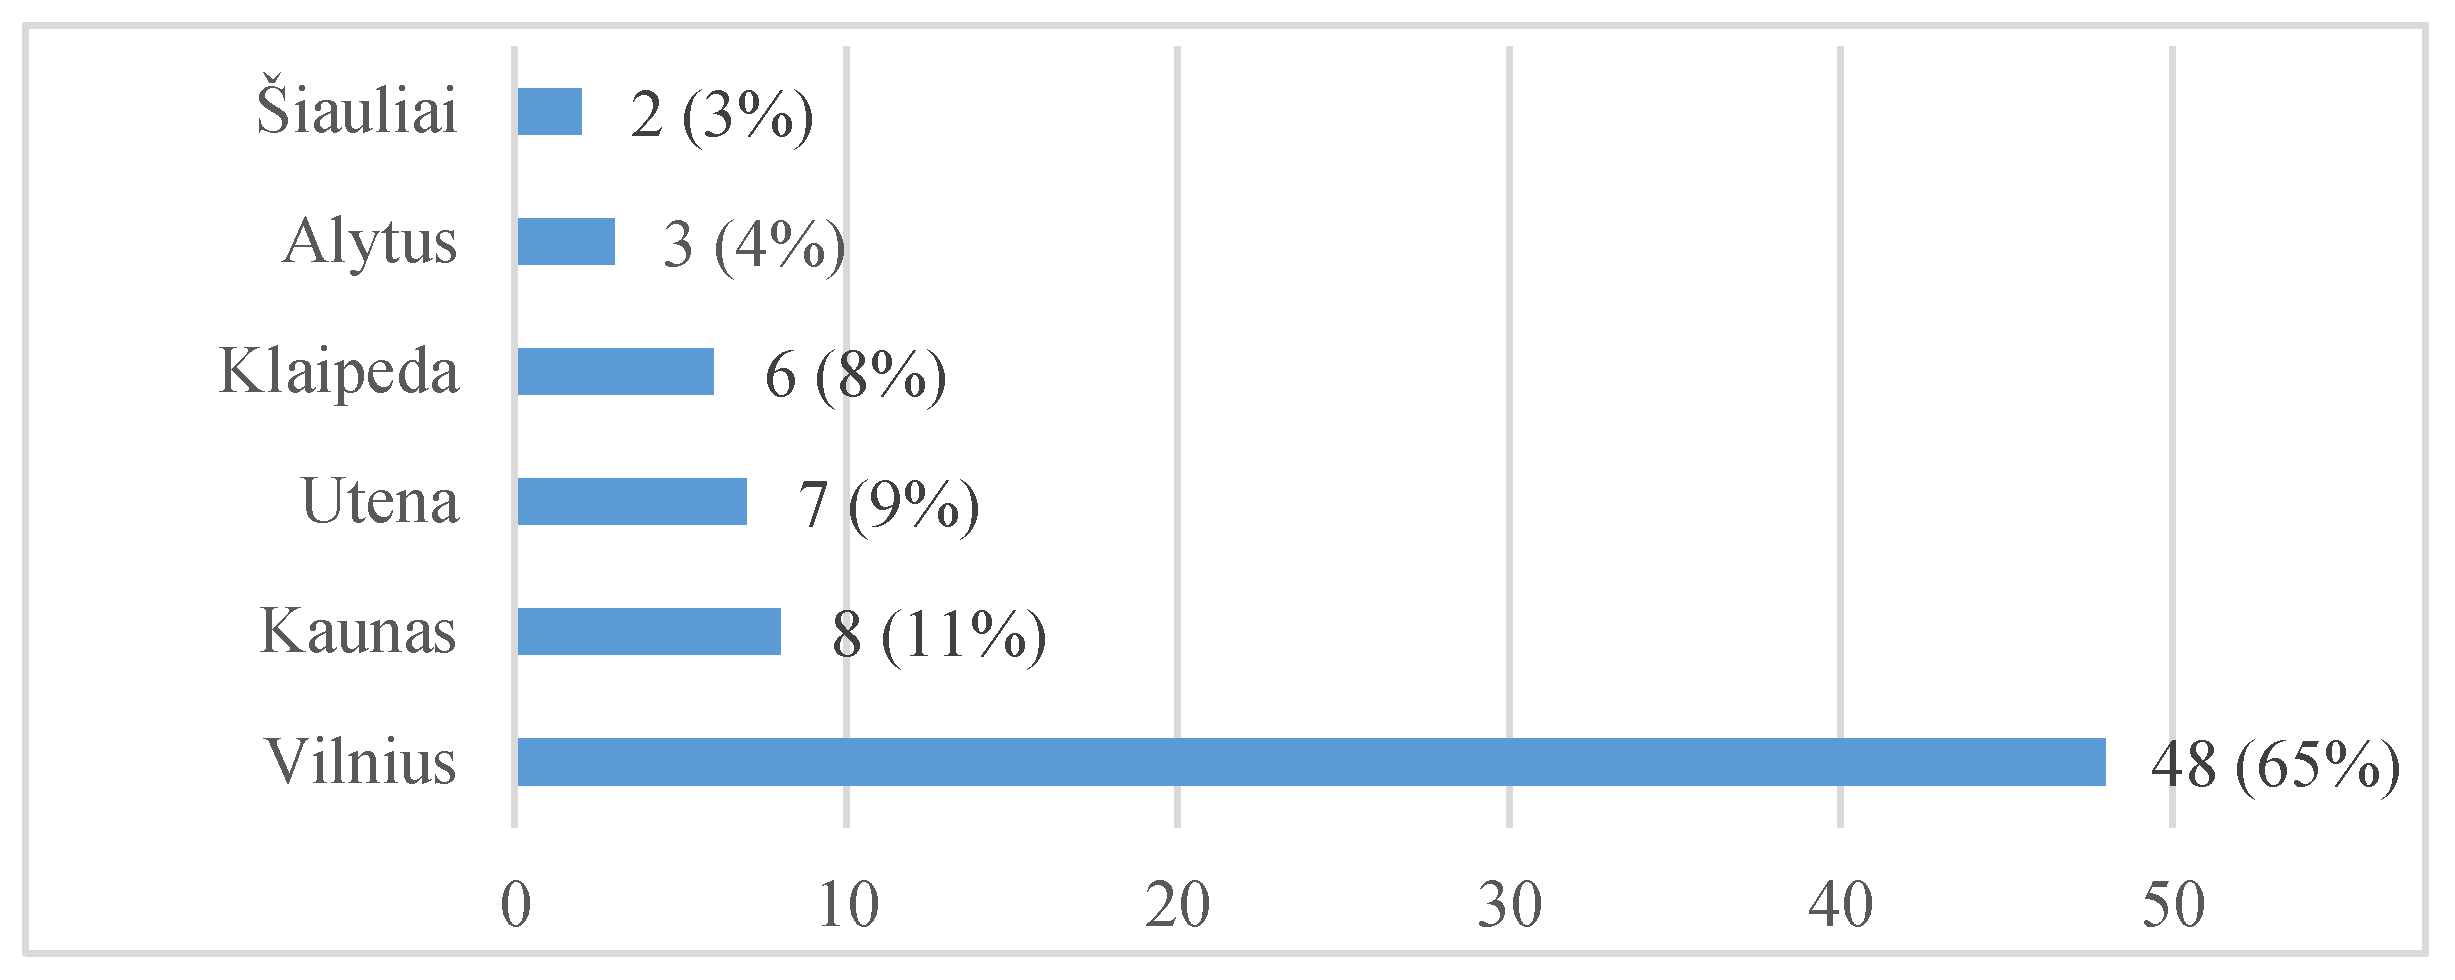
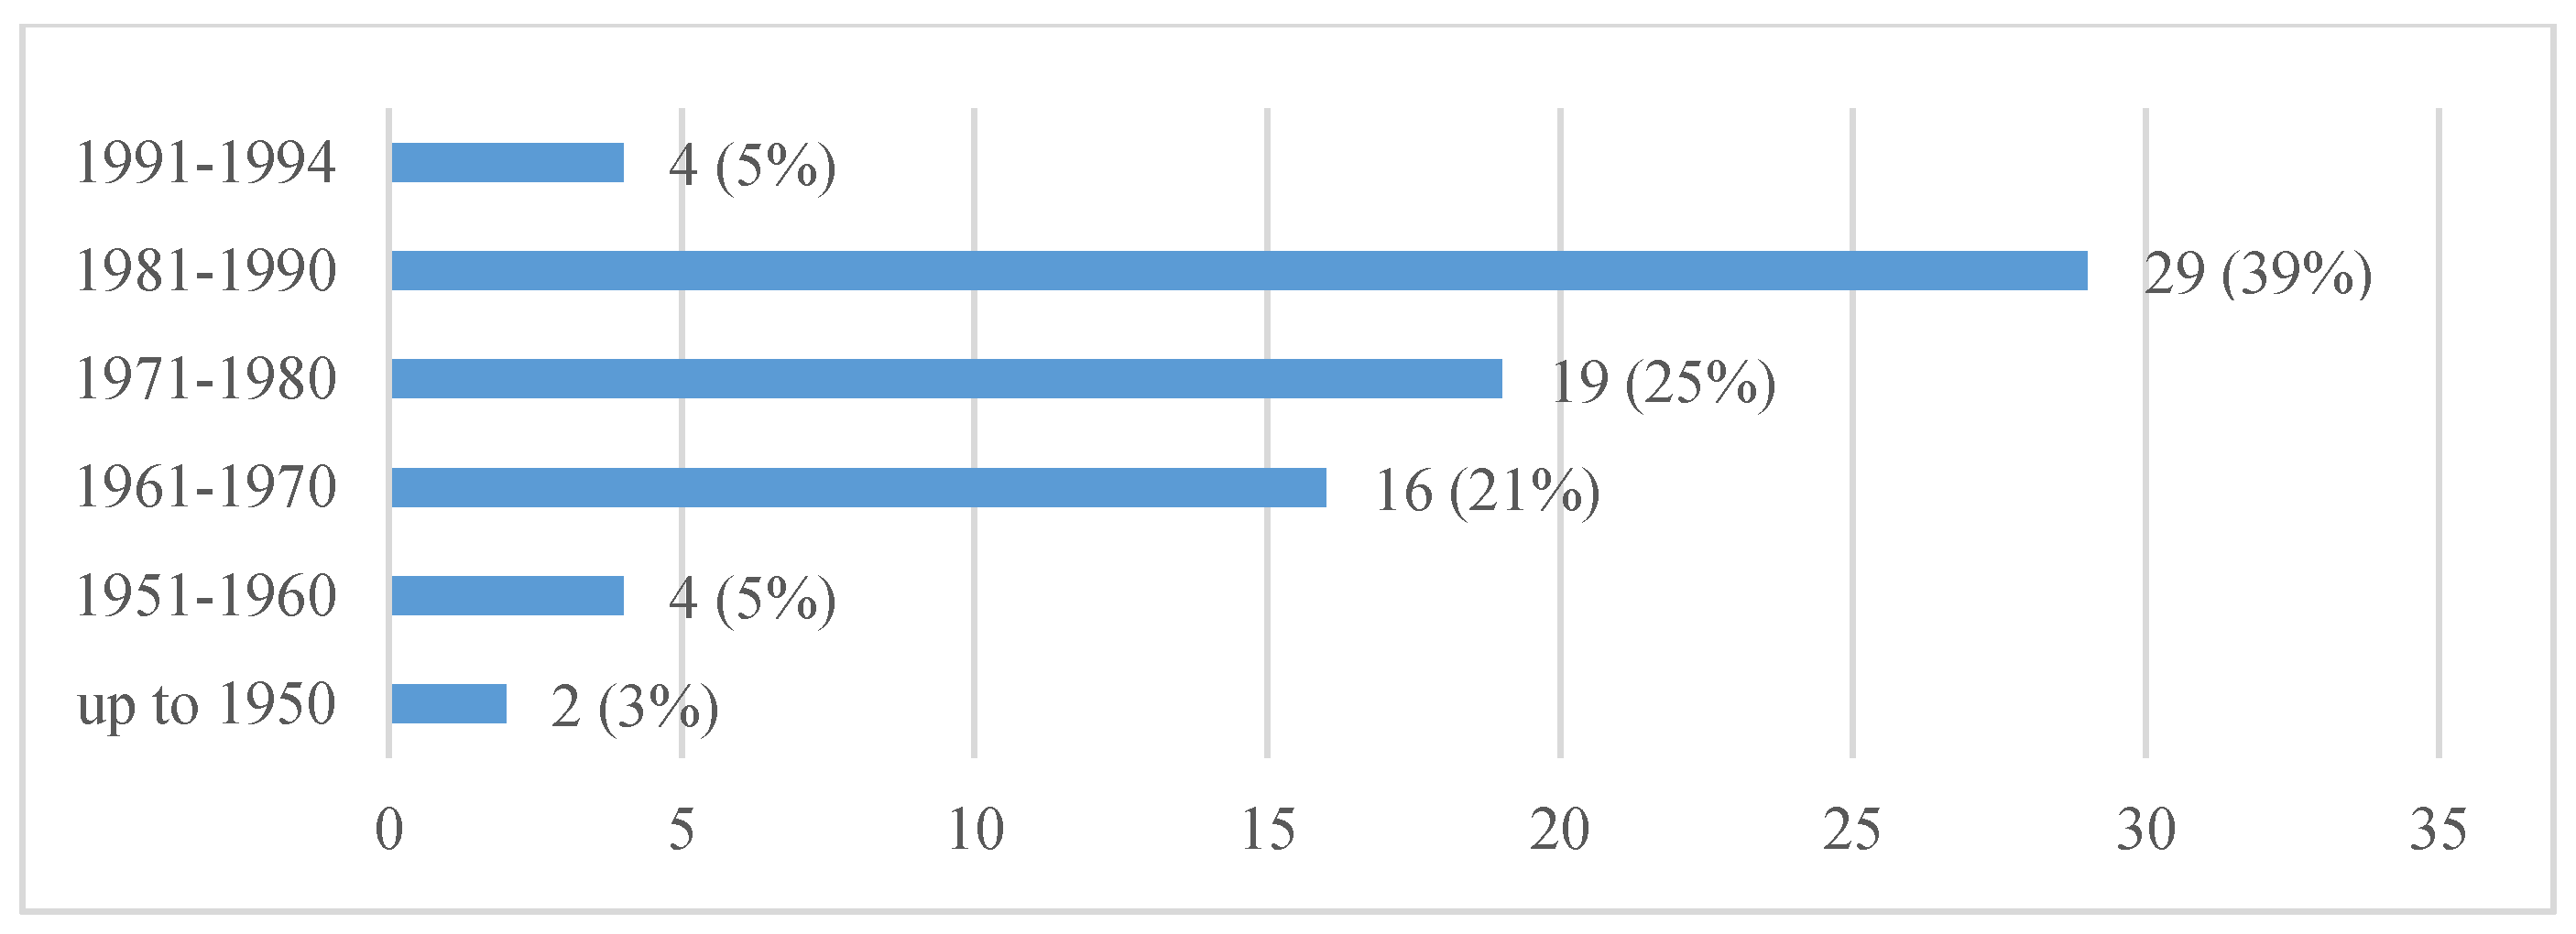
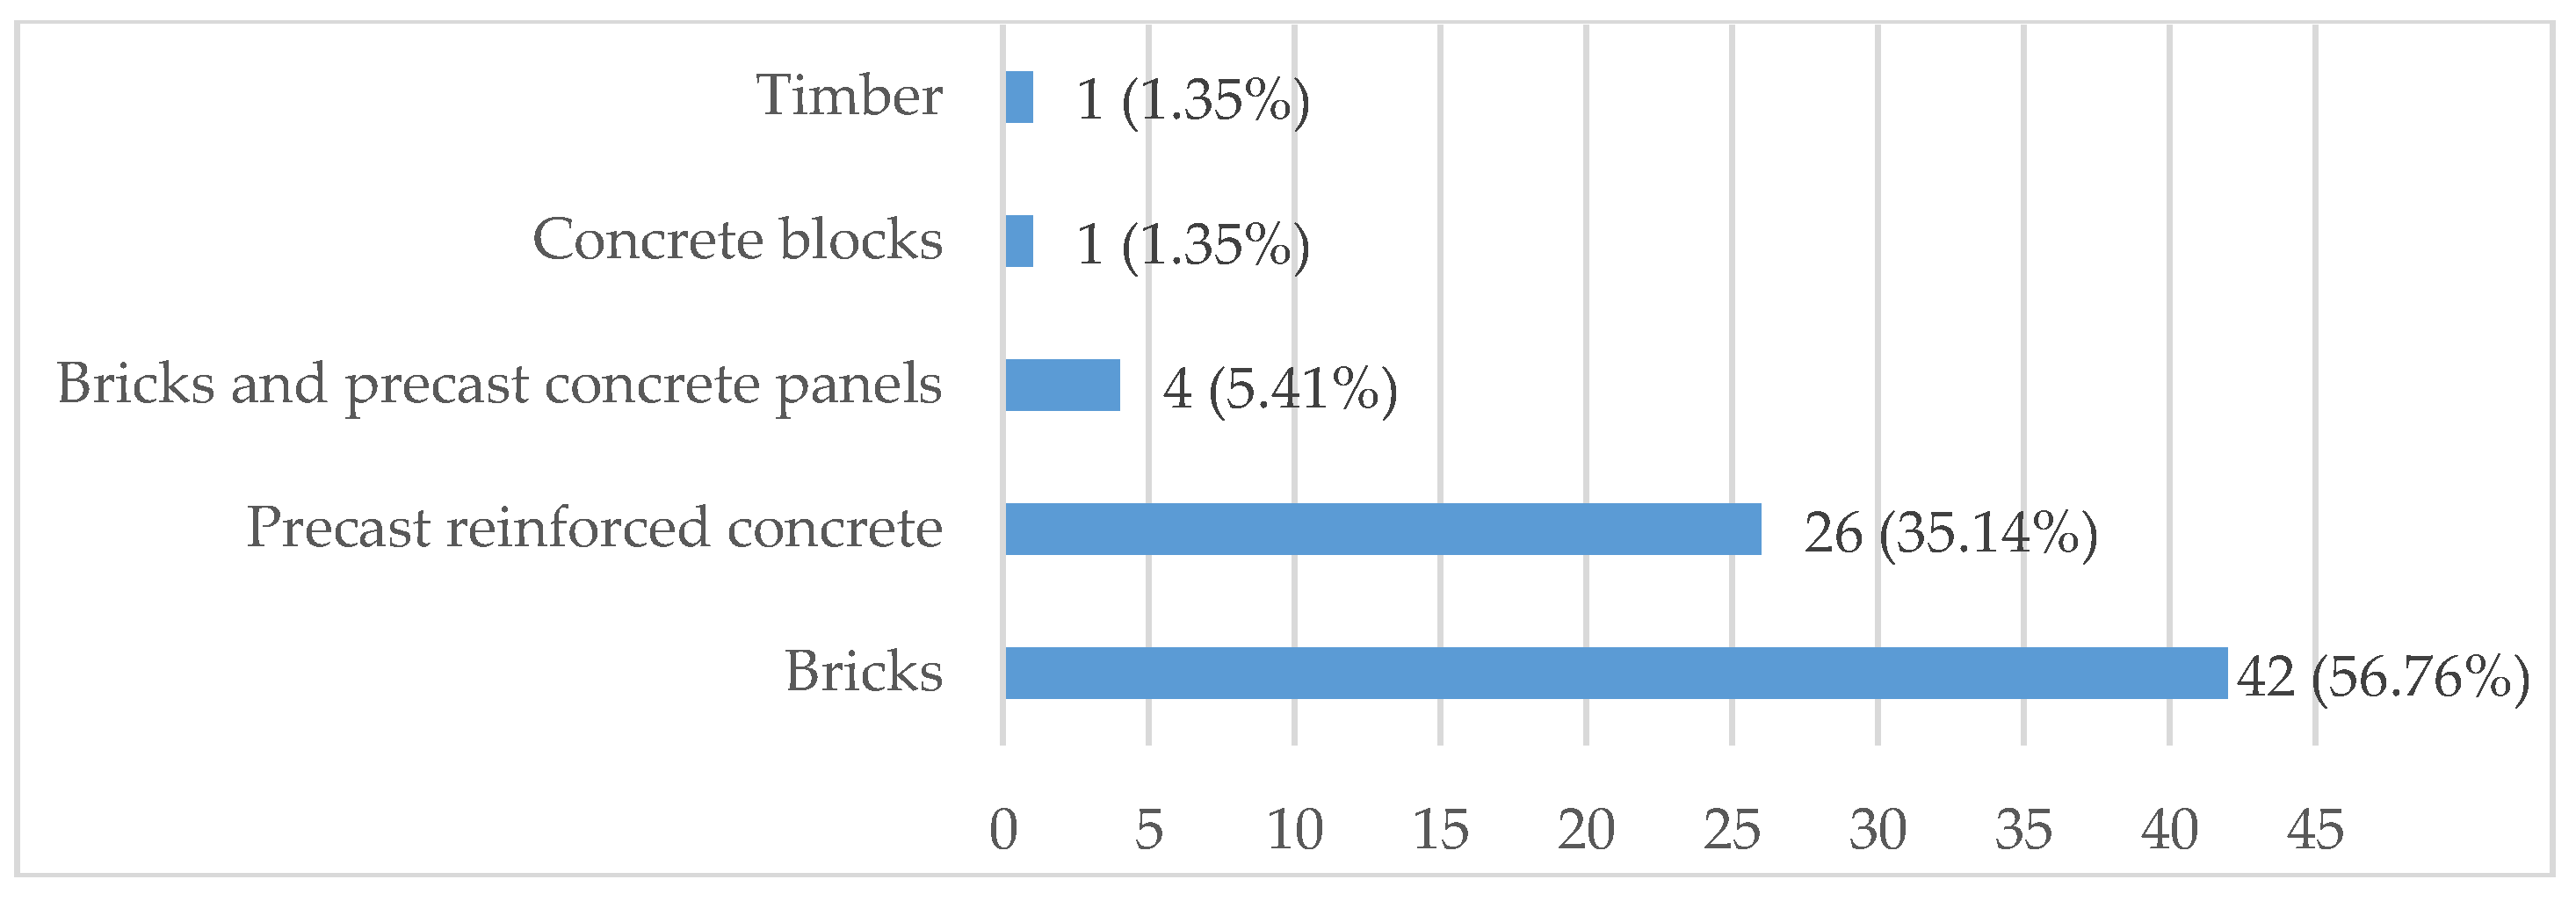
The sample size for the analysis compounded of 74 multi-apartment buildings that had received funding to renovate from the Multi-apartment buildings renovation (modernization) program that was implemented under the leadership of the Public Company Housing Energy Efficiency Agency (HEEA) [16]. The sample buildings were renovated in the period of 2014–2016. Buildings renovated in 2017 were not included in the sample due to the necessity to collect data on the actual values of thermal energy consumption for heating when the renovation was finished. These values were observed during the heating period of 2016–2017. Most of the renovated buildings were located in Vilnius County and were constructed in the period of 1961–1990 (see Figure 3 and Figure 4). This could be explained by the fact that until 1992, in Lithuania there were no strict requirements for the heat preservation in buildings, and therefore multi-apartment buildings constructed before this year were poorly insulated or were not insulated. The rise of requirements for the energy performance of buildings has been gradually tightened since 1992, thus fostering the endeavors to rise the energy performance of buildings. This led to the application of energy efficiency measures including better thermal insulation of envelopes. Therefore, the Multi-apartment buildings renovation (modernization) program only provided funding for buildings constructed before 1993. In buildings constructed before this year, prevail non-insulated precast reinforced concrete and masonry structures, and such construction materials consequently make up the largest share in the analyzed sample (see Figure 5).
3.2. Description of the Renovation Scenarios
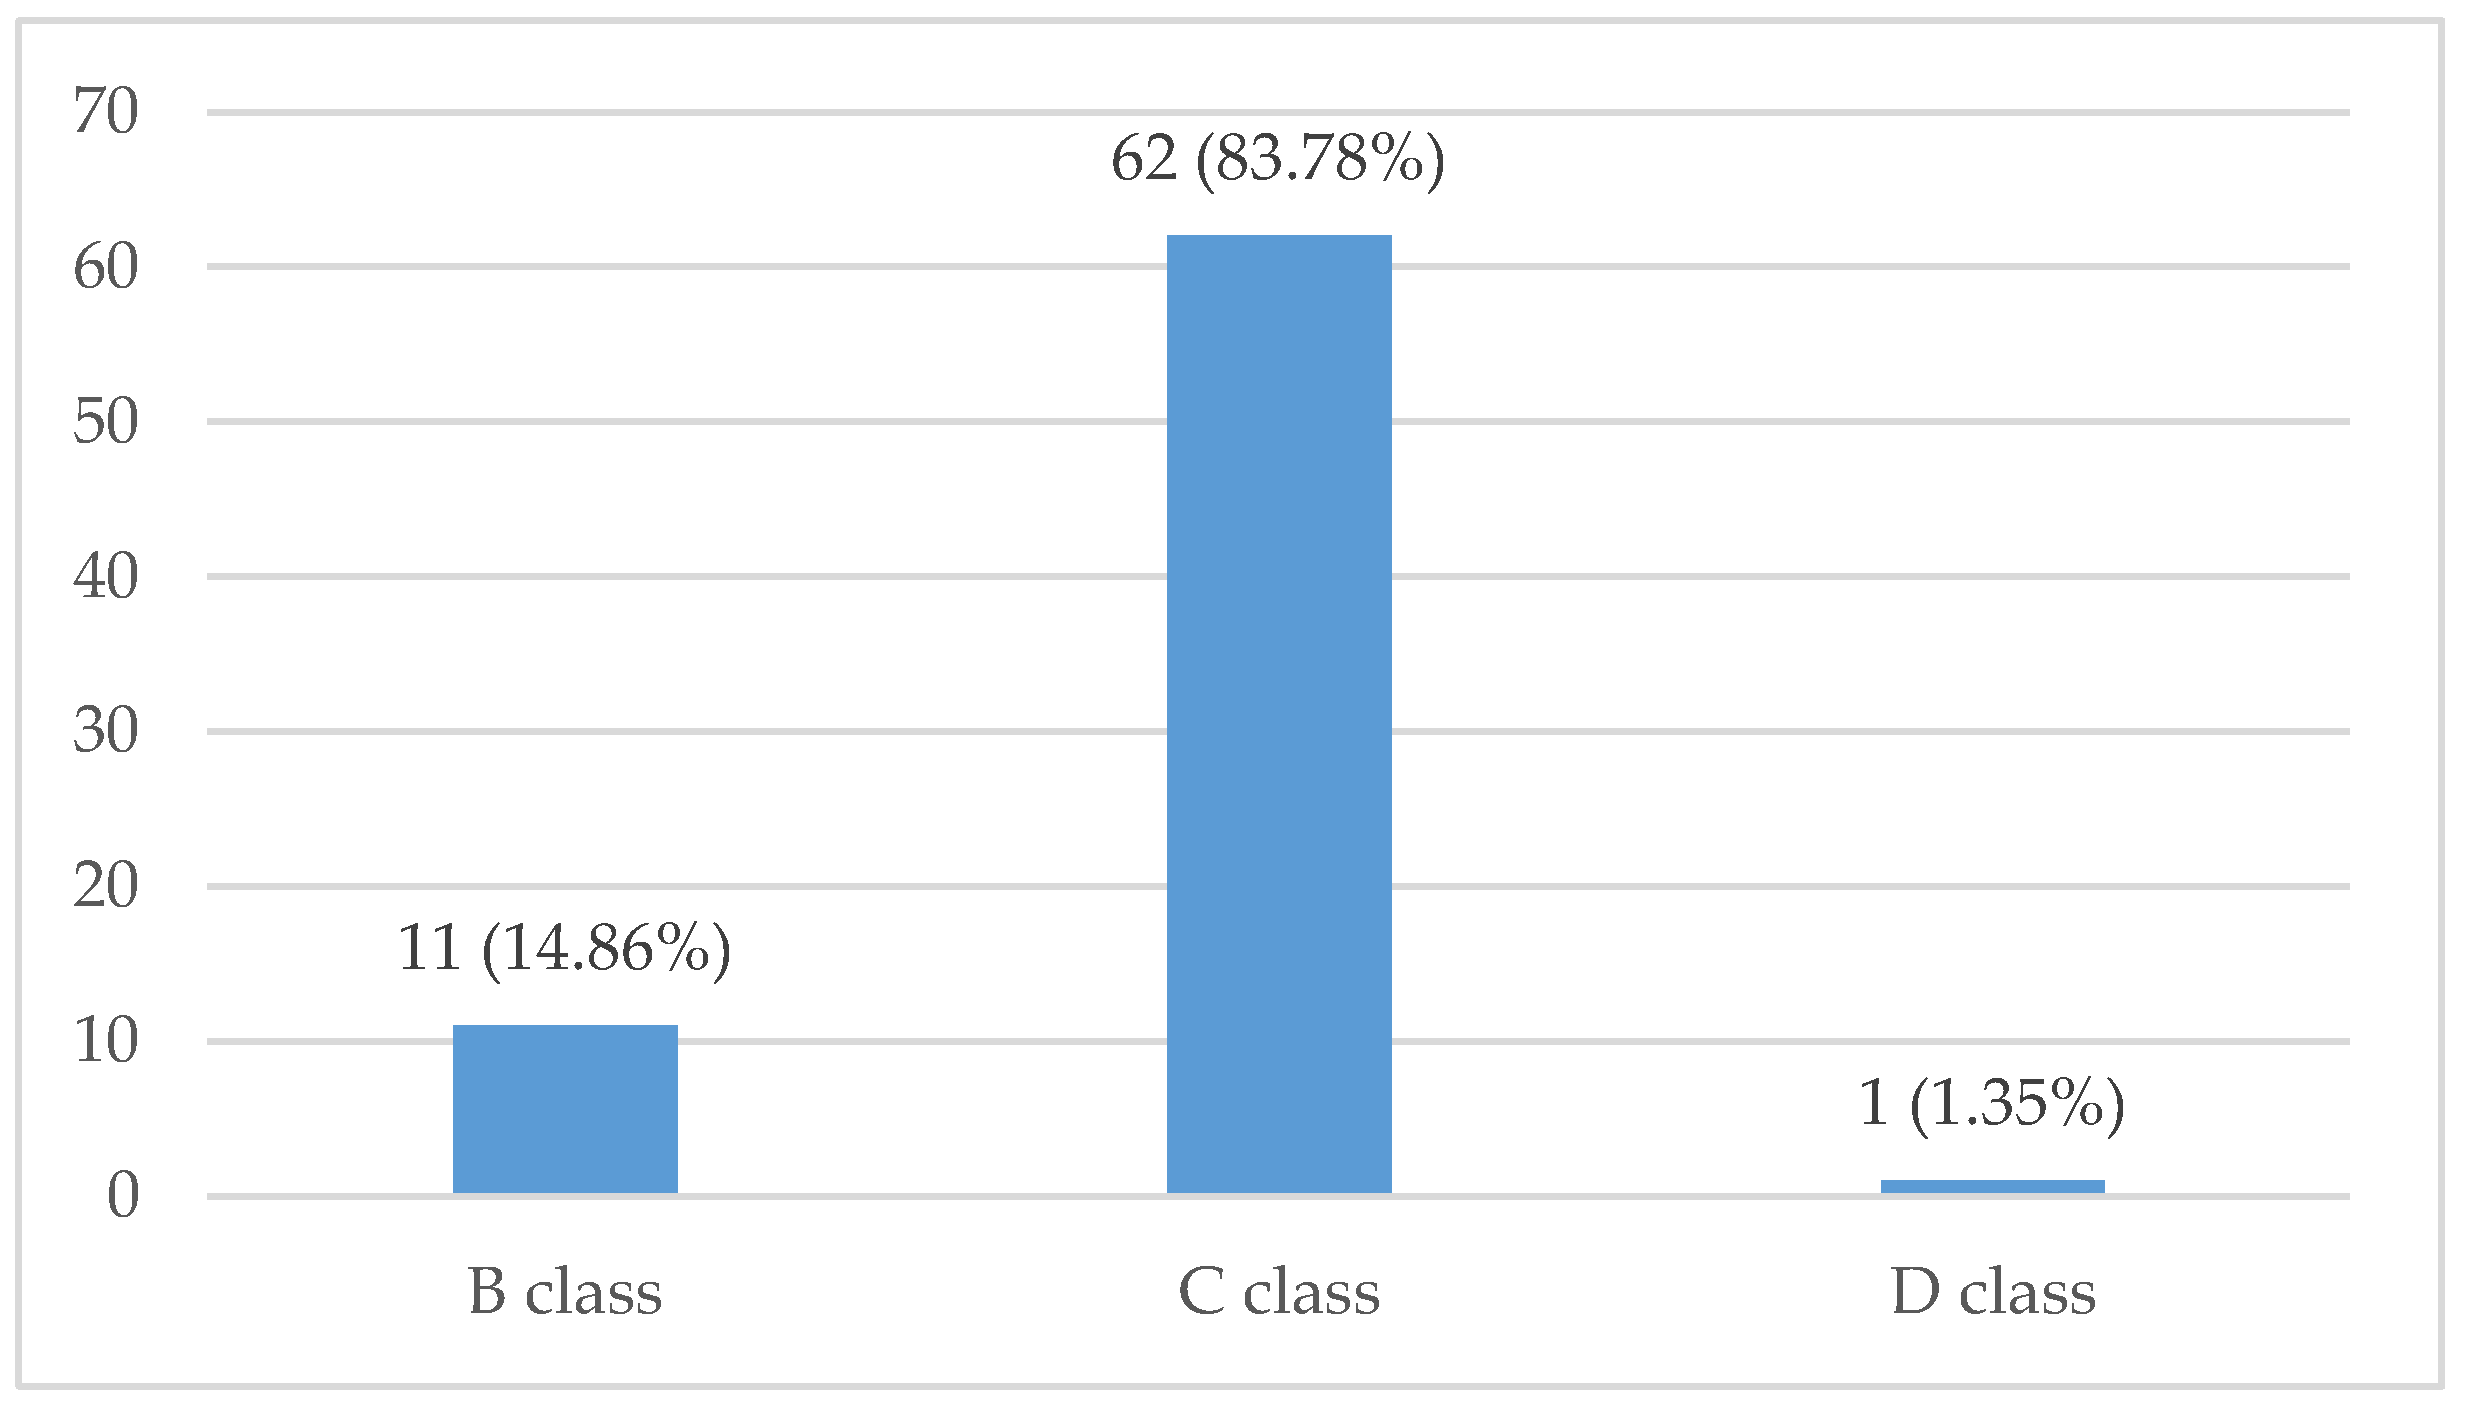
Data of the main renovation scenarios applied in the analyzed case buildings is depicted in Table 1. For each scenario, the table provides the number of cases in the sample and the values of thermal energy consumption based on the data of the energy certificates that were issued before and after the renovation. About 84% of the renovated buildings achieved a C class of energy efficiency (see Figure 6).
3.3. Results of the Renovation in Figures
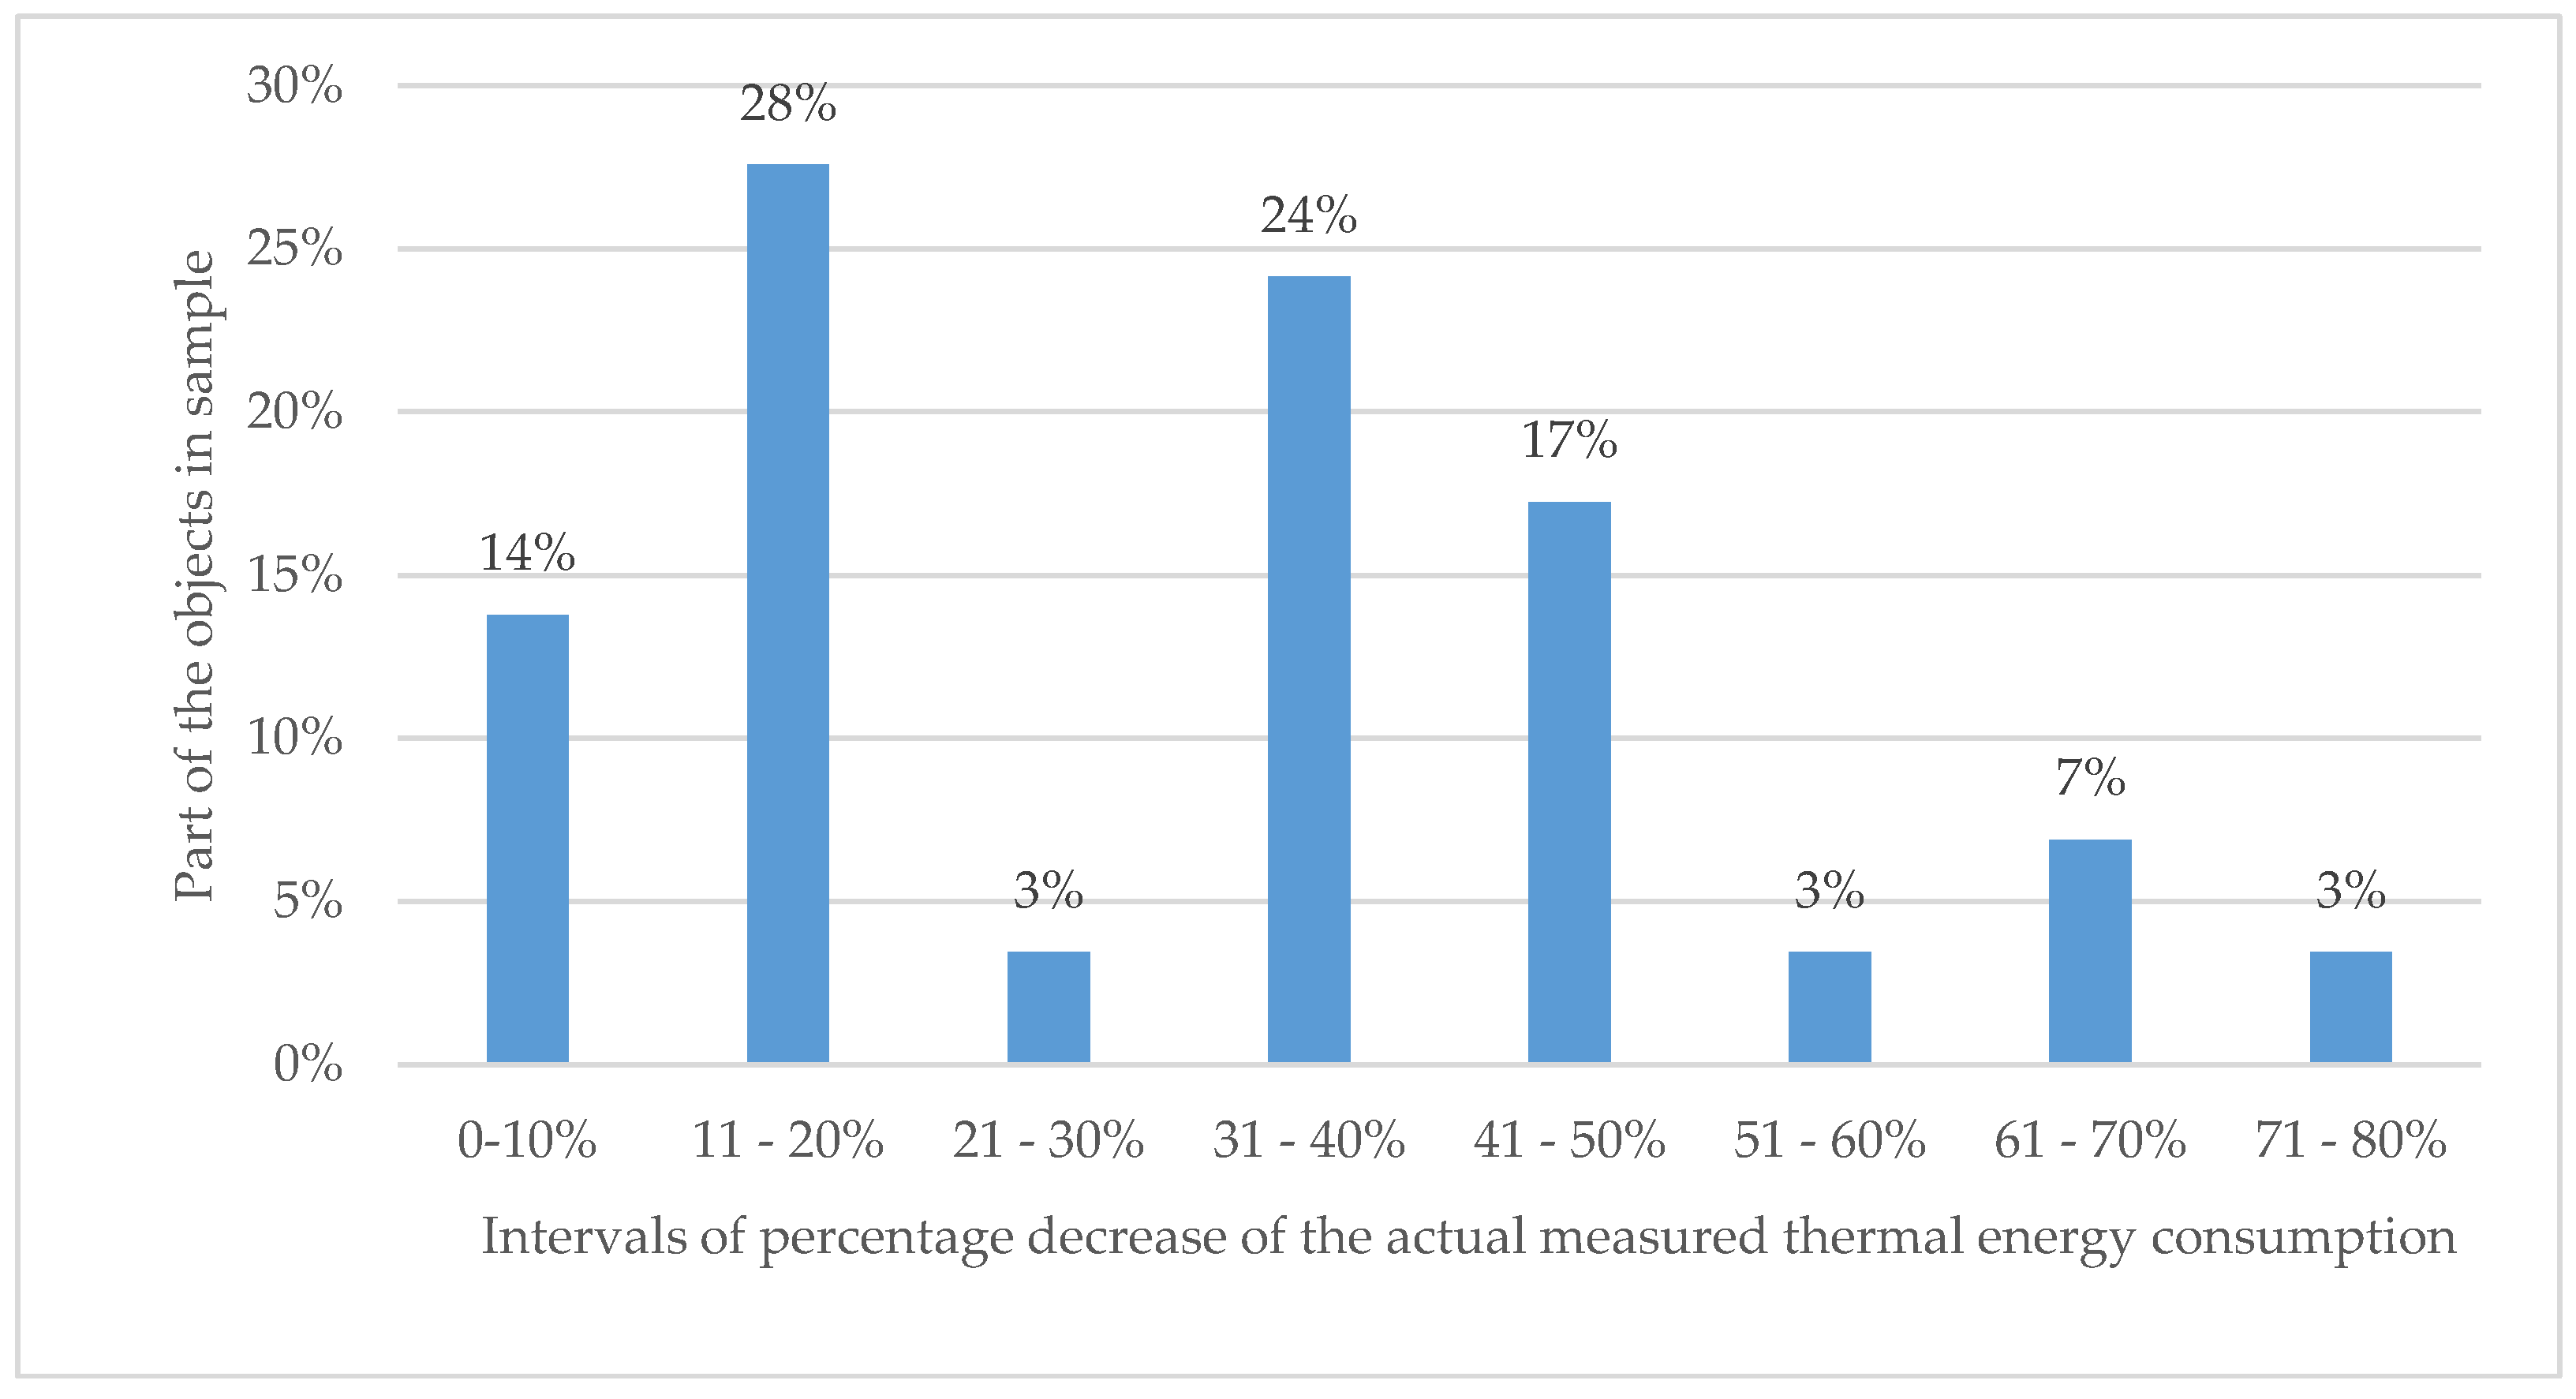
The results of the comparison of the calculated and actual measured values of the thermal energy consumption for heating in the sample of the analyzed buildings is depicted in Table 2. The figures of the actual calculated thermal energy consumption for heating (kWh/m2) were taken from the energy certificates that were issued after the modernization. The figures of the actual measured thermal energy consumption for heating (kWh/m2) were provided by the exact district heating supplier. During the research, this information was provided only for half of the analyzed sample, i.e. for 35 buildings of the 74 that were analyzed. The objects’ data in the table is sorted by the calculated values of the percentage decrease (+) or increase (−) in the consumption of thermal energy for heating. In most cases (about 83% of the sample’s buildings), the difference between the calculated and the actual measured values show a decrease of the actual measured thermal energy consumption. Only 6 from 35 cases (about 17% of the sample’s buildings) show an increase of actual measured thermal energy consumption (see Figure 7).
The energy consumption reduction measures for the renovation are based on the passive and active measures. The insulation of the envelope is most often applied as a passive measure, and the instalment of new efficient equipment is applied as an active measure (see Table 3). The Programme for the renovation/upgrading of multi-apartment buildings [16] (hereinafter–Programme) aims to encourage the apartment owners to comprehensively upgrade multi-apartment buildings and residential districts in order to achieve higher living standards, rational use of energy resources, and compensation for the reduced budgetary expenditure on heating costs. Therefore, the Programme provides the support for both energy efficiency improvement measures and to other building renovation measures, including (i) major repairs or reconstruction of the heating systems and hot and cold water supply systems; (ii) the replacement of windows and exterior doors; (iii) roof thermal insulation, including the installation of new sloping roofs (excluding the construction of attic premises); (iv) glassing of balconies (loggia) under a unified project; (v) thermal insulation of exterior walls; (vi) thermal insulation of cellar ceilings; (vii) thermal insulation of basement walls; (viii) the installation of the equipment for alternative energy sources (sun, wind, etc.); (ix) major repairs and the replacement of elevators; (x) replacement or repair of the buildings’ systems (wastewater systems, electrical and fire prevention installations, and drinking water pipes).
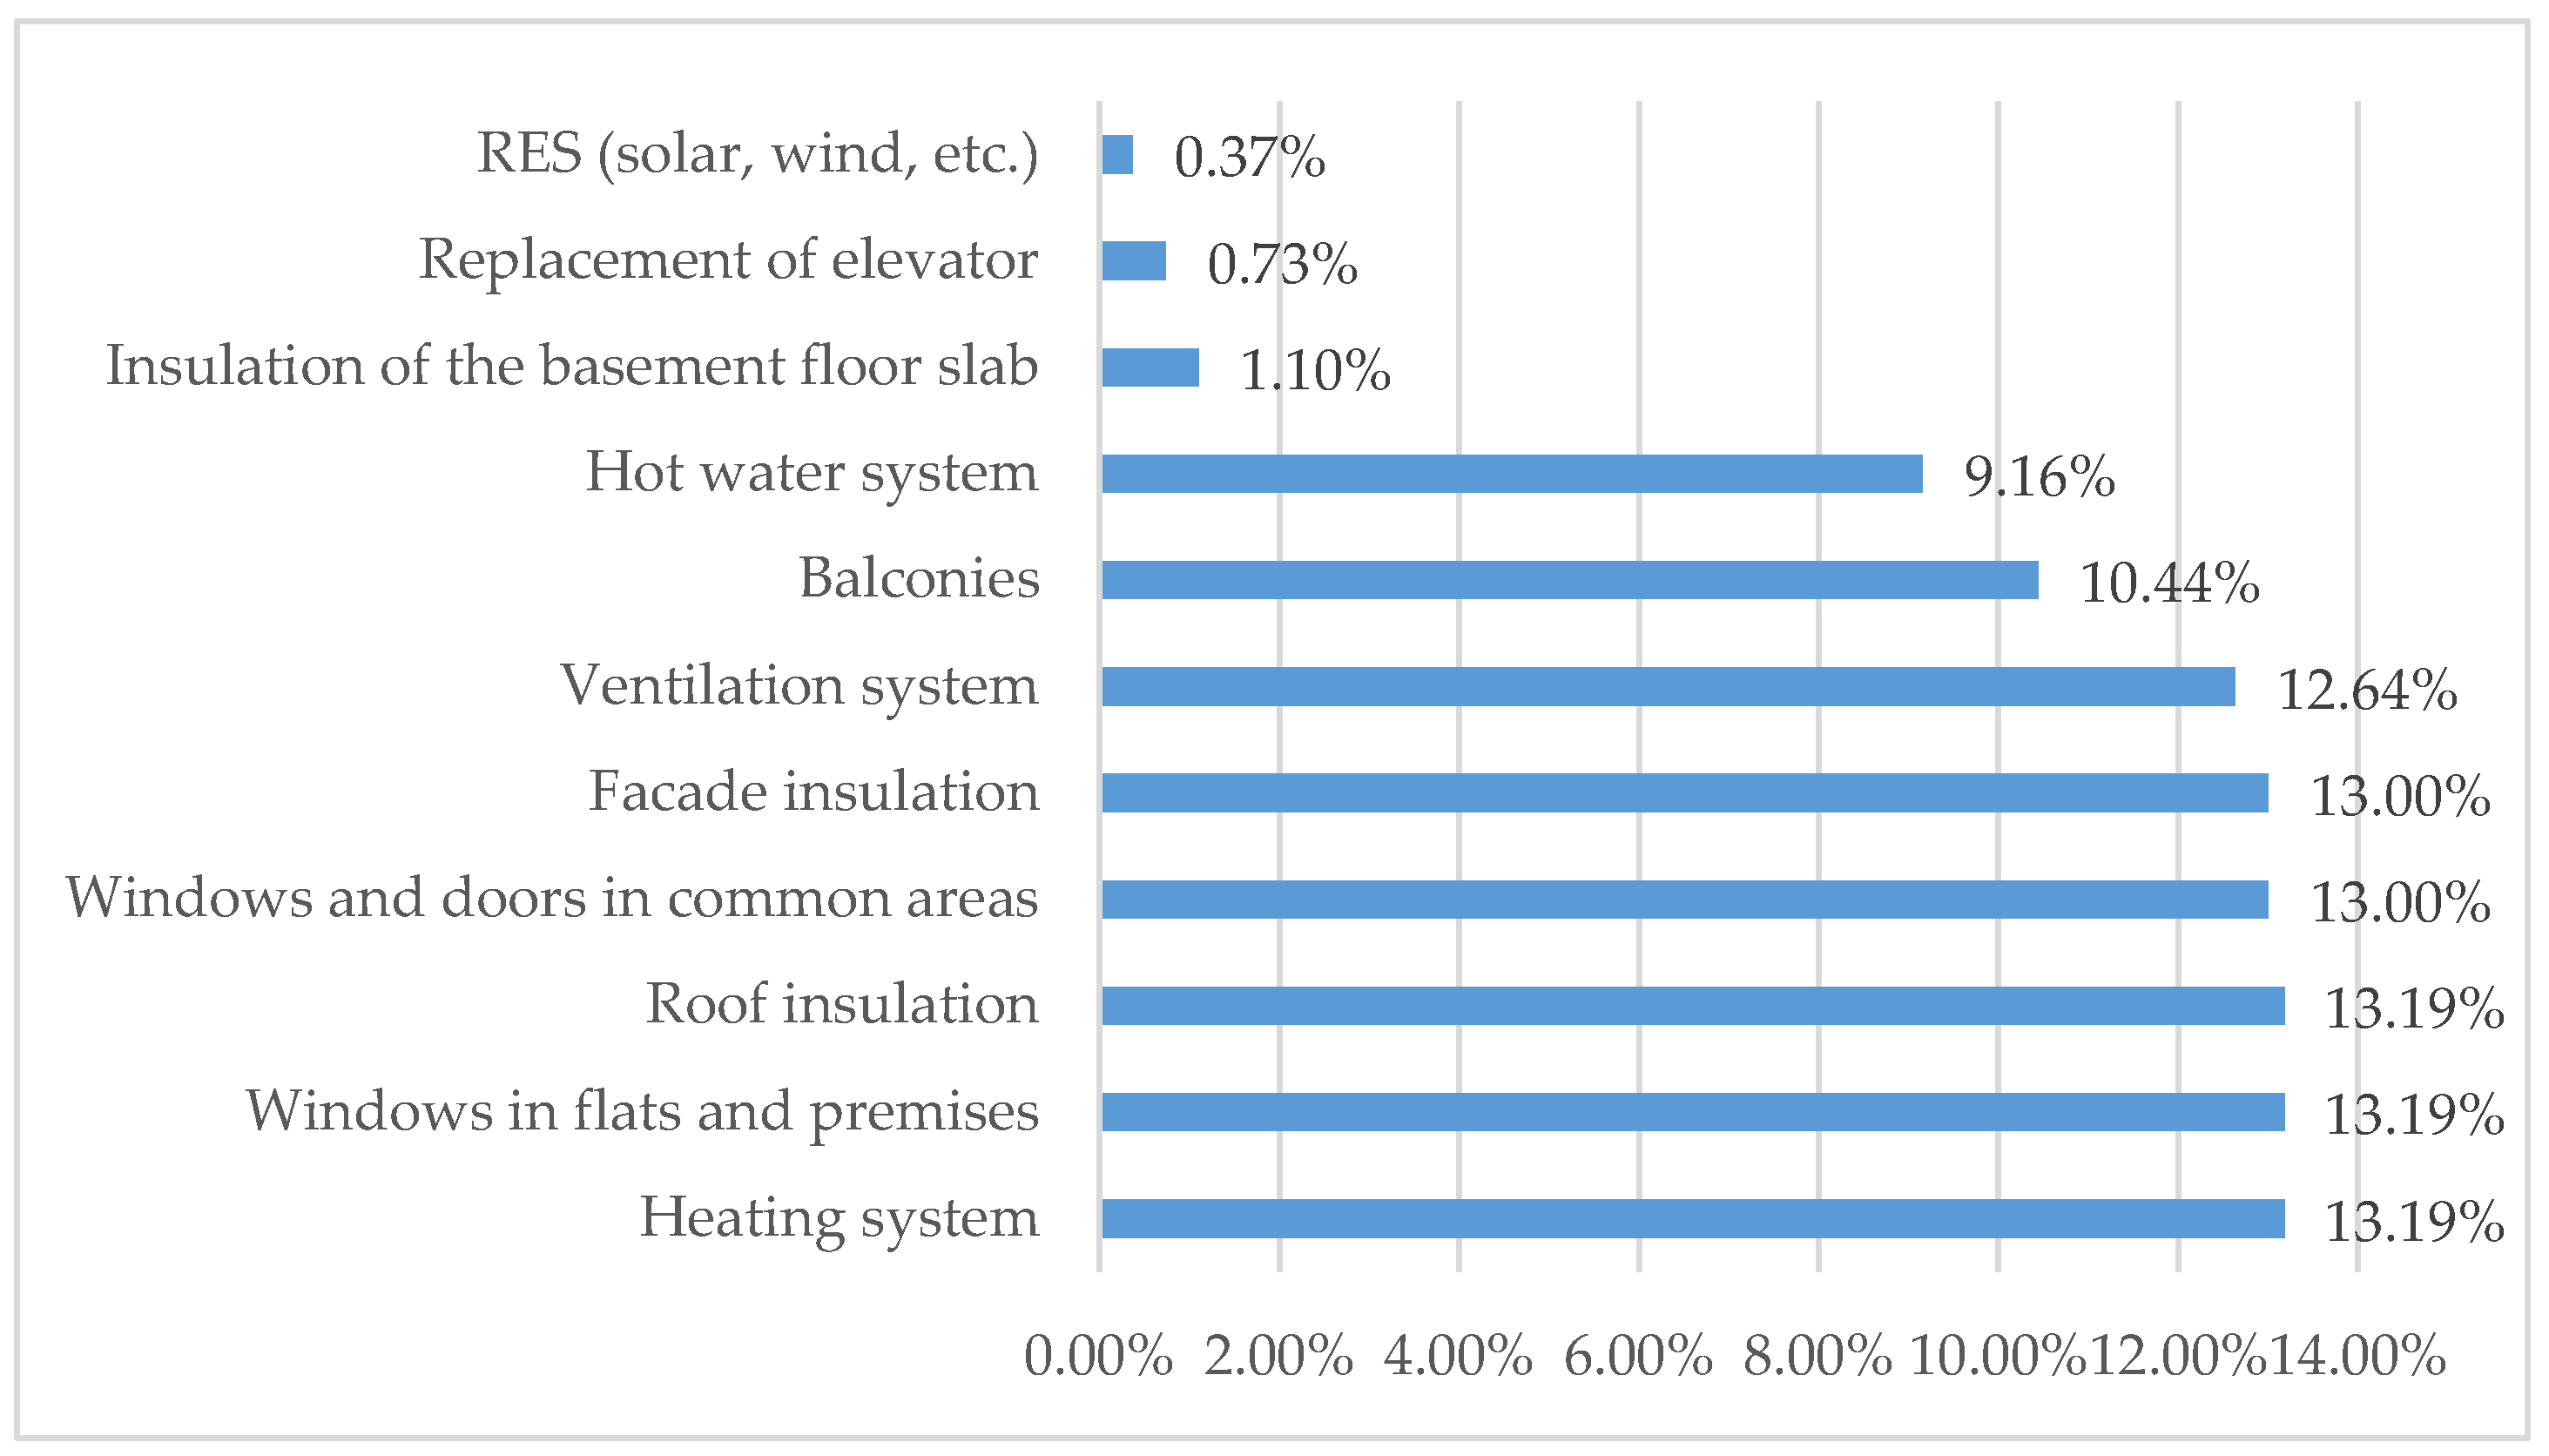
The analysis of the renovated buildings sample shows that the most popular renovation measures are: modernization of the heating system; modernization of the ventilation system; modernization of the hot water system; the replacement of windows in apartments and other premises; the change of windows and doors in other common areas; glazing of balconies; exterior wall insulation; and roof insulation (see Table 3). These measures were applied in most renovation scenarios of the case buildings.
3.3.1. Energy Saving Measures
This section presents the distribution of active and passive energy-saving measures in the case buildings. Main energy-saving measures include the modernization of heating systems; the modernization of ventilation systems; the replacement of windows in apartments and other premises; the change of windows and doors in other common areas; glazing of balconies; exterior wall insulation; and roof insulation (see Figure 8).
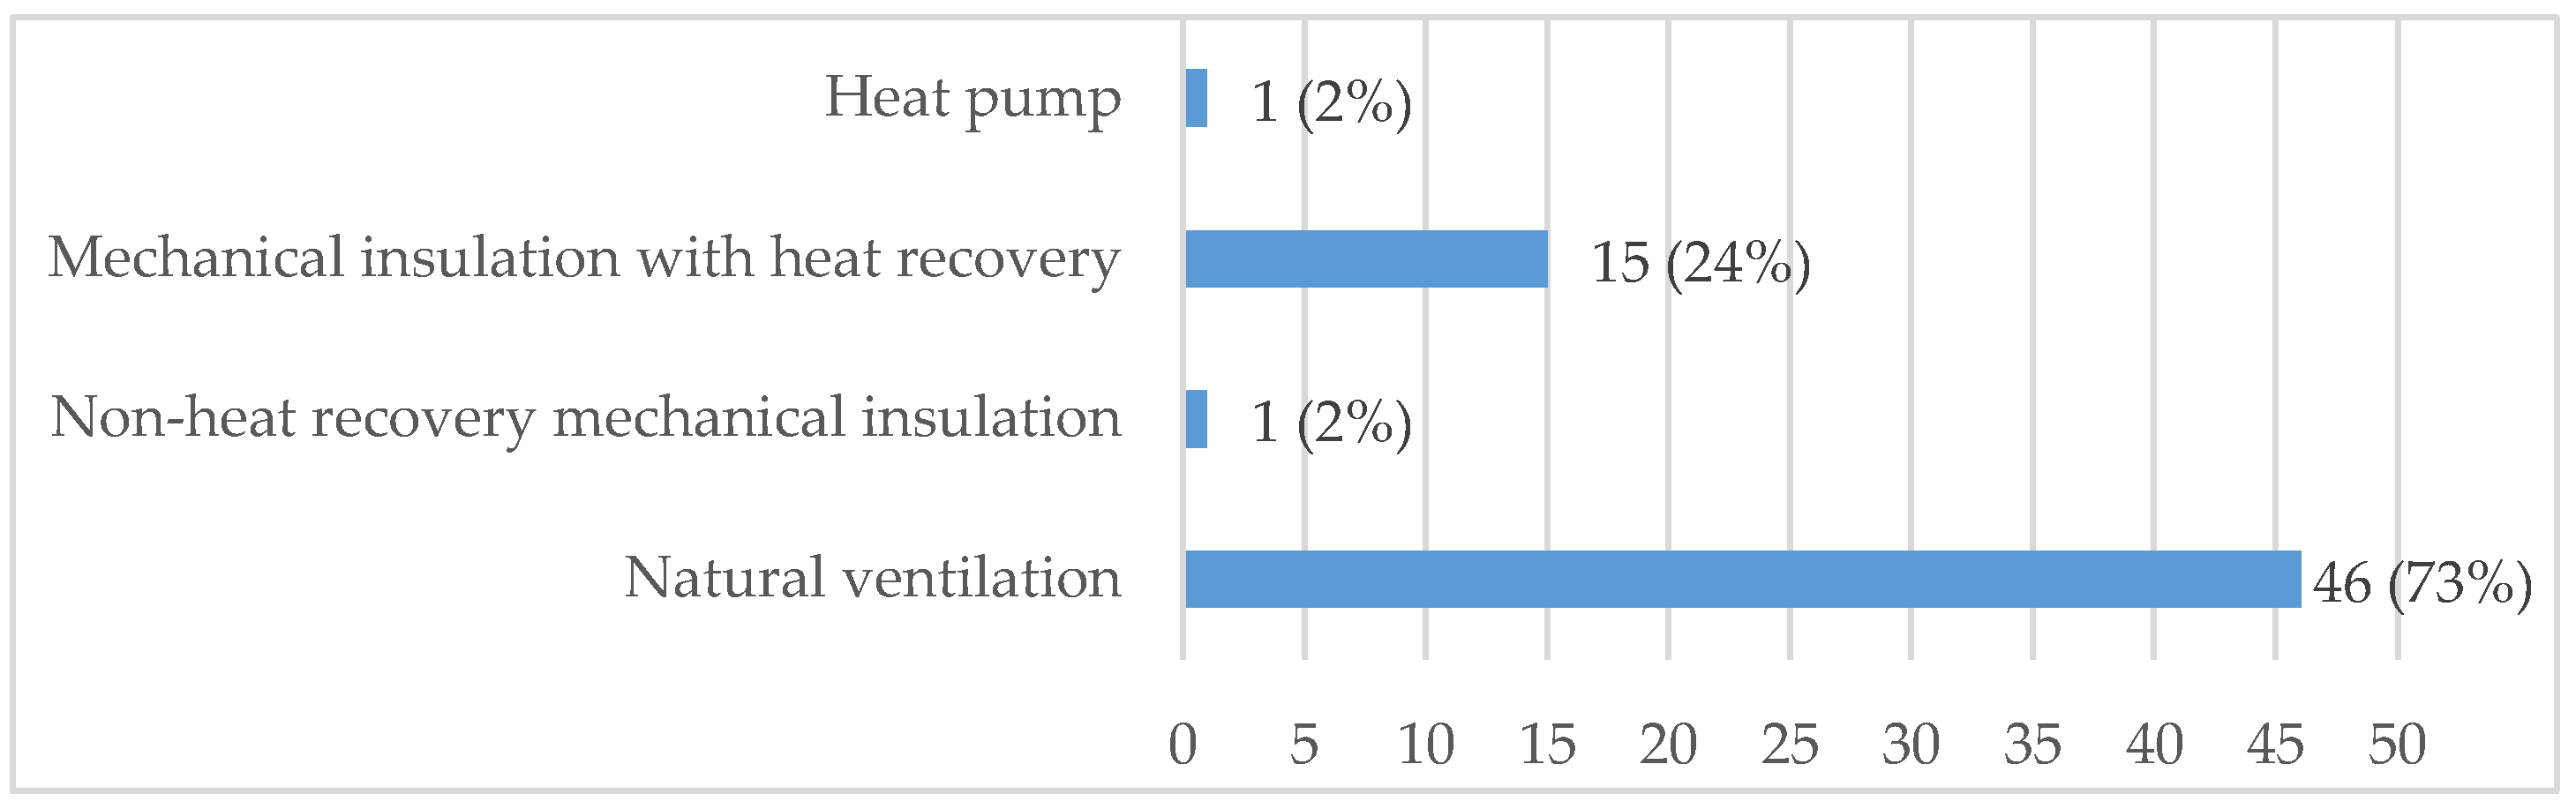
The modernization of ventilation systems mainly covers the repair of existing natural ventilation systems (in 73% of all cases). It was only in 24% of the sample buildings that the mechanical insulation with heat recovery was installed (see Figure 9).
3.3.2. Non-Energy Saving Measures
The most commonly used other (non-energy saving) measures are the replacement of the drinking water system and the installation of a rainwater system (in about 60% of all renovation cases). The replacement of domestic waste water systems, the repair of electric wiring systems, and the repair of drainage is less common (about 40% of all renovation cases) (see Figure 10).
3.3.3. Façade Insulation Materials
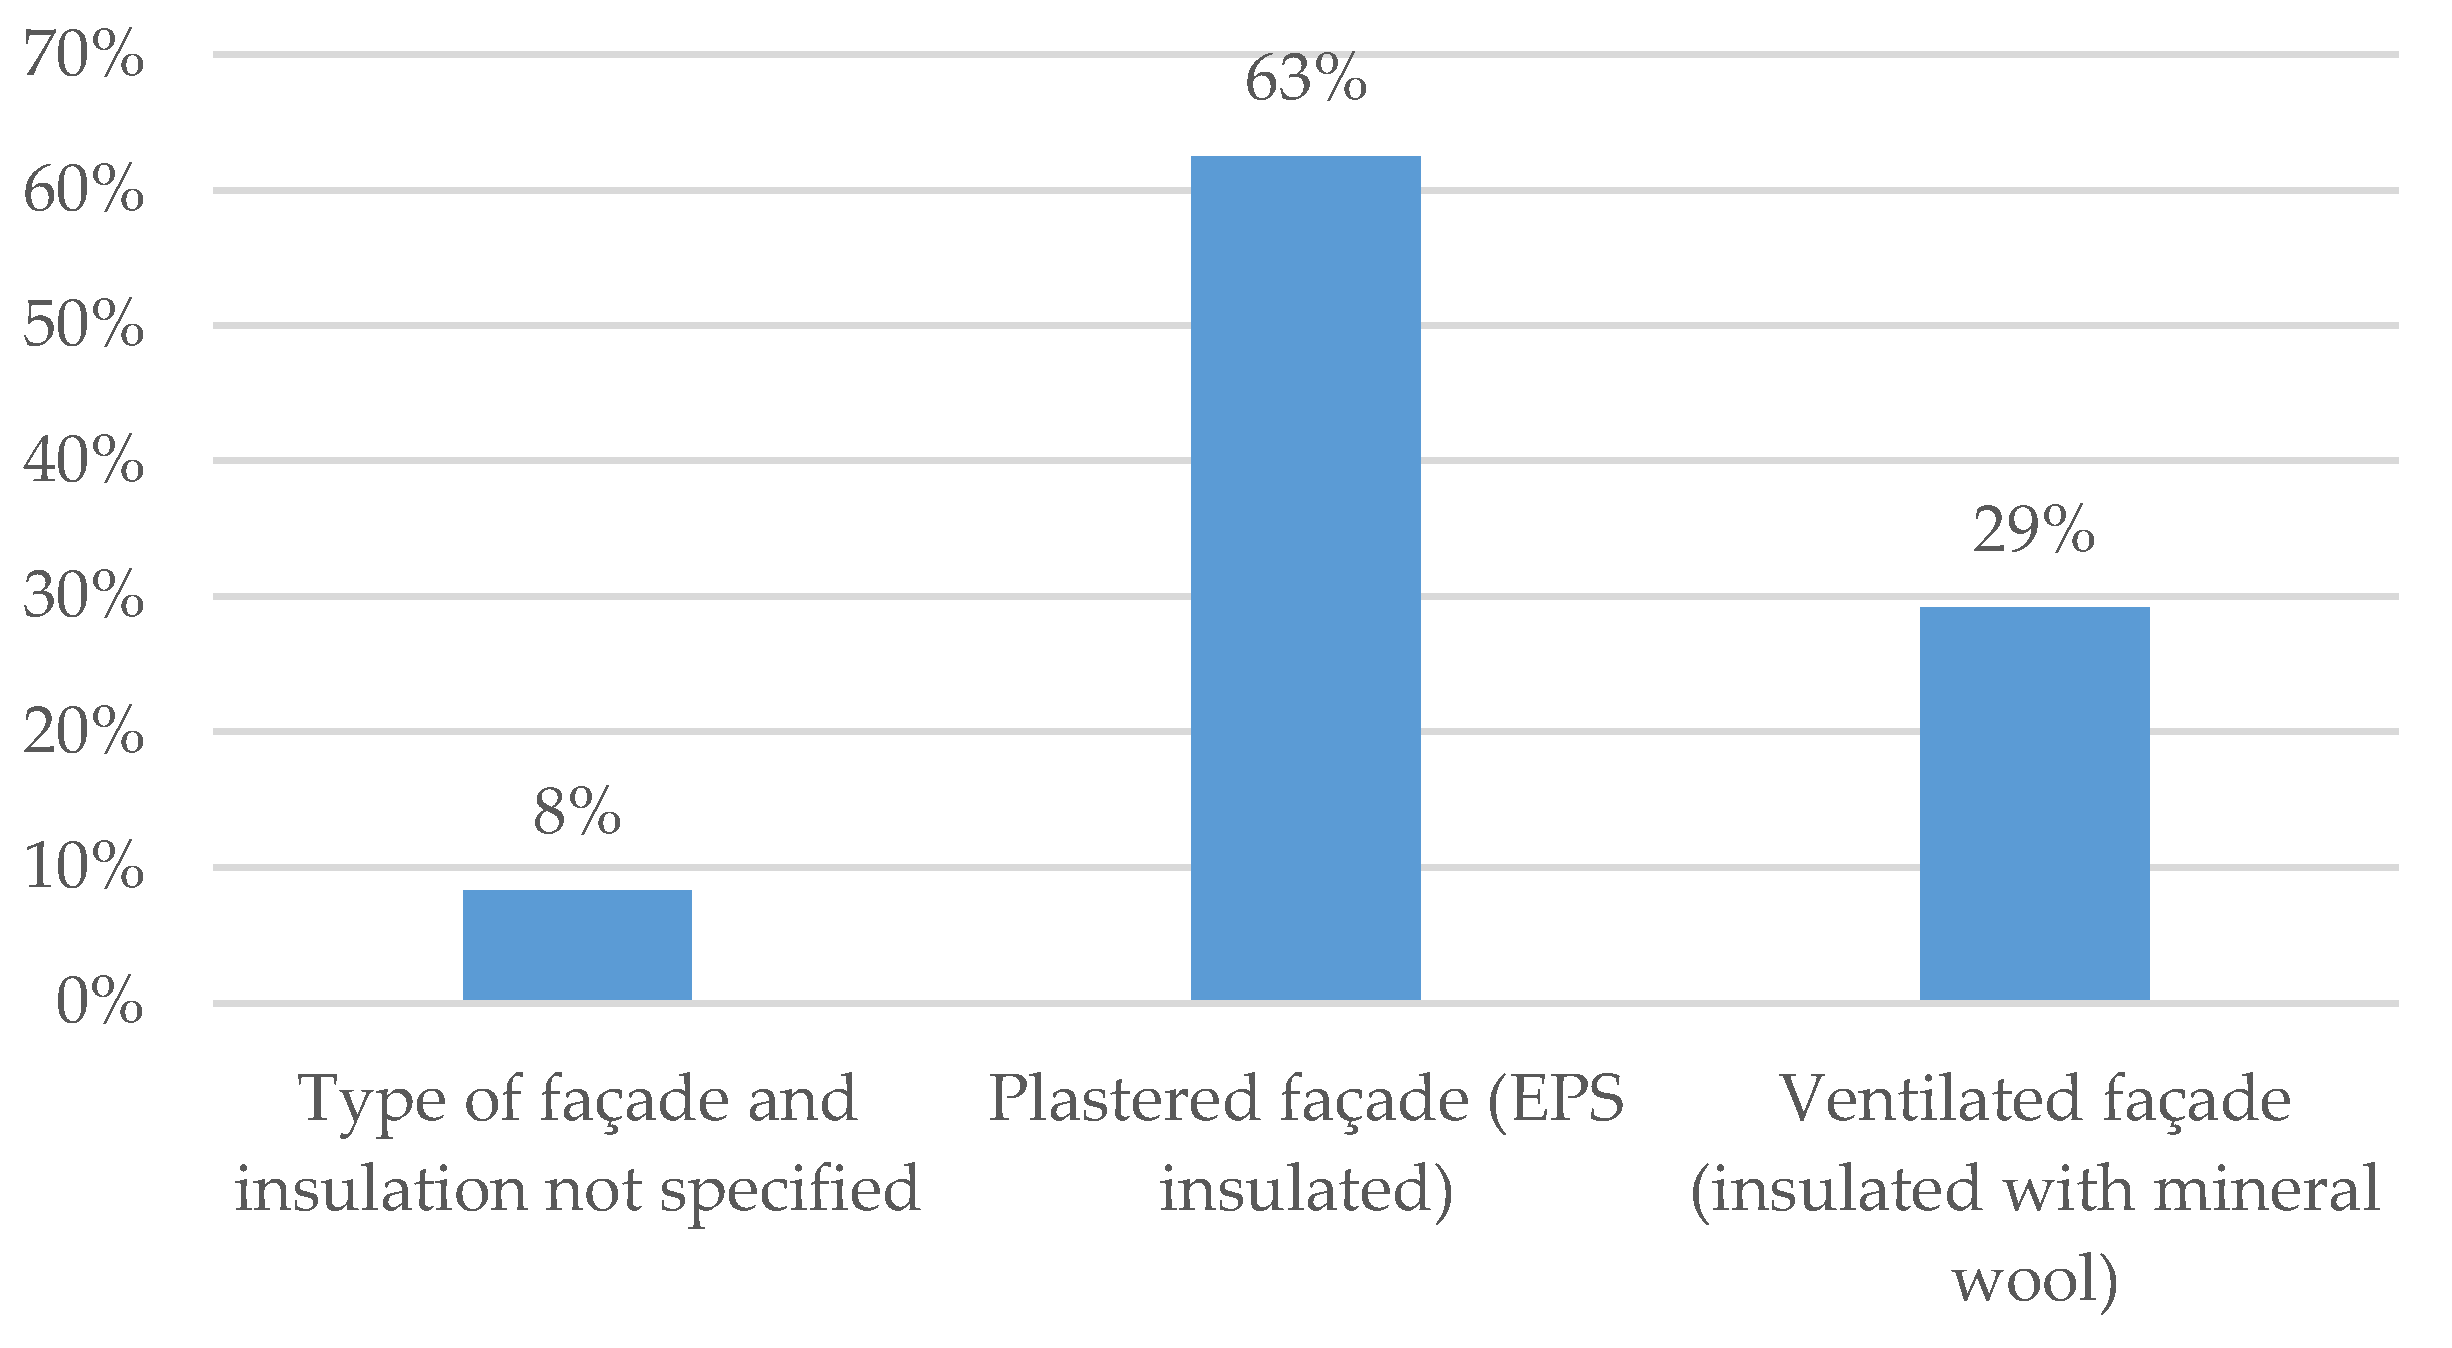
The type and material of insulation for the facade was specified by HEEA specialists. The data provided revealed that expanded polystyrene (EPS) foam and mineral wool are the most popular types of insulation materials. EPS was used almost twice as often as mineral wool (see Figure 11). In most cases, the façade insulation works included the insulation of a basement wall, the repair of defects, and the repair of pathways adherent to the façade surface.
The analysis revealed that plastered facade insulated with EPS required less investments than ventilated facade insulated with mineral wool, while the estimated reduction of heat losses through the walls of the building is similar (respectively, 89.19 and 82.63 kWh/m2/a) for both types of façades (see Table 4). In some cases, the investments depicted in the table include the cost of repairs of defects detected on exterior walls, the cost of basement wall insulation, and the cost of repairs of pathways adherent to the façade surface. The cost of these improvements was the cause of the large interval of costs.
3.3.4. Observations of the Existing Monitoring Scheme
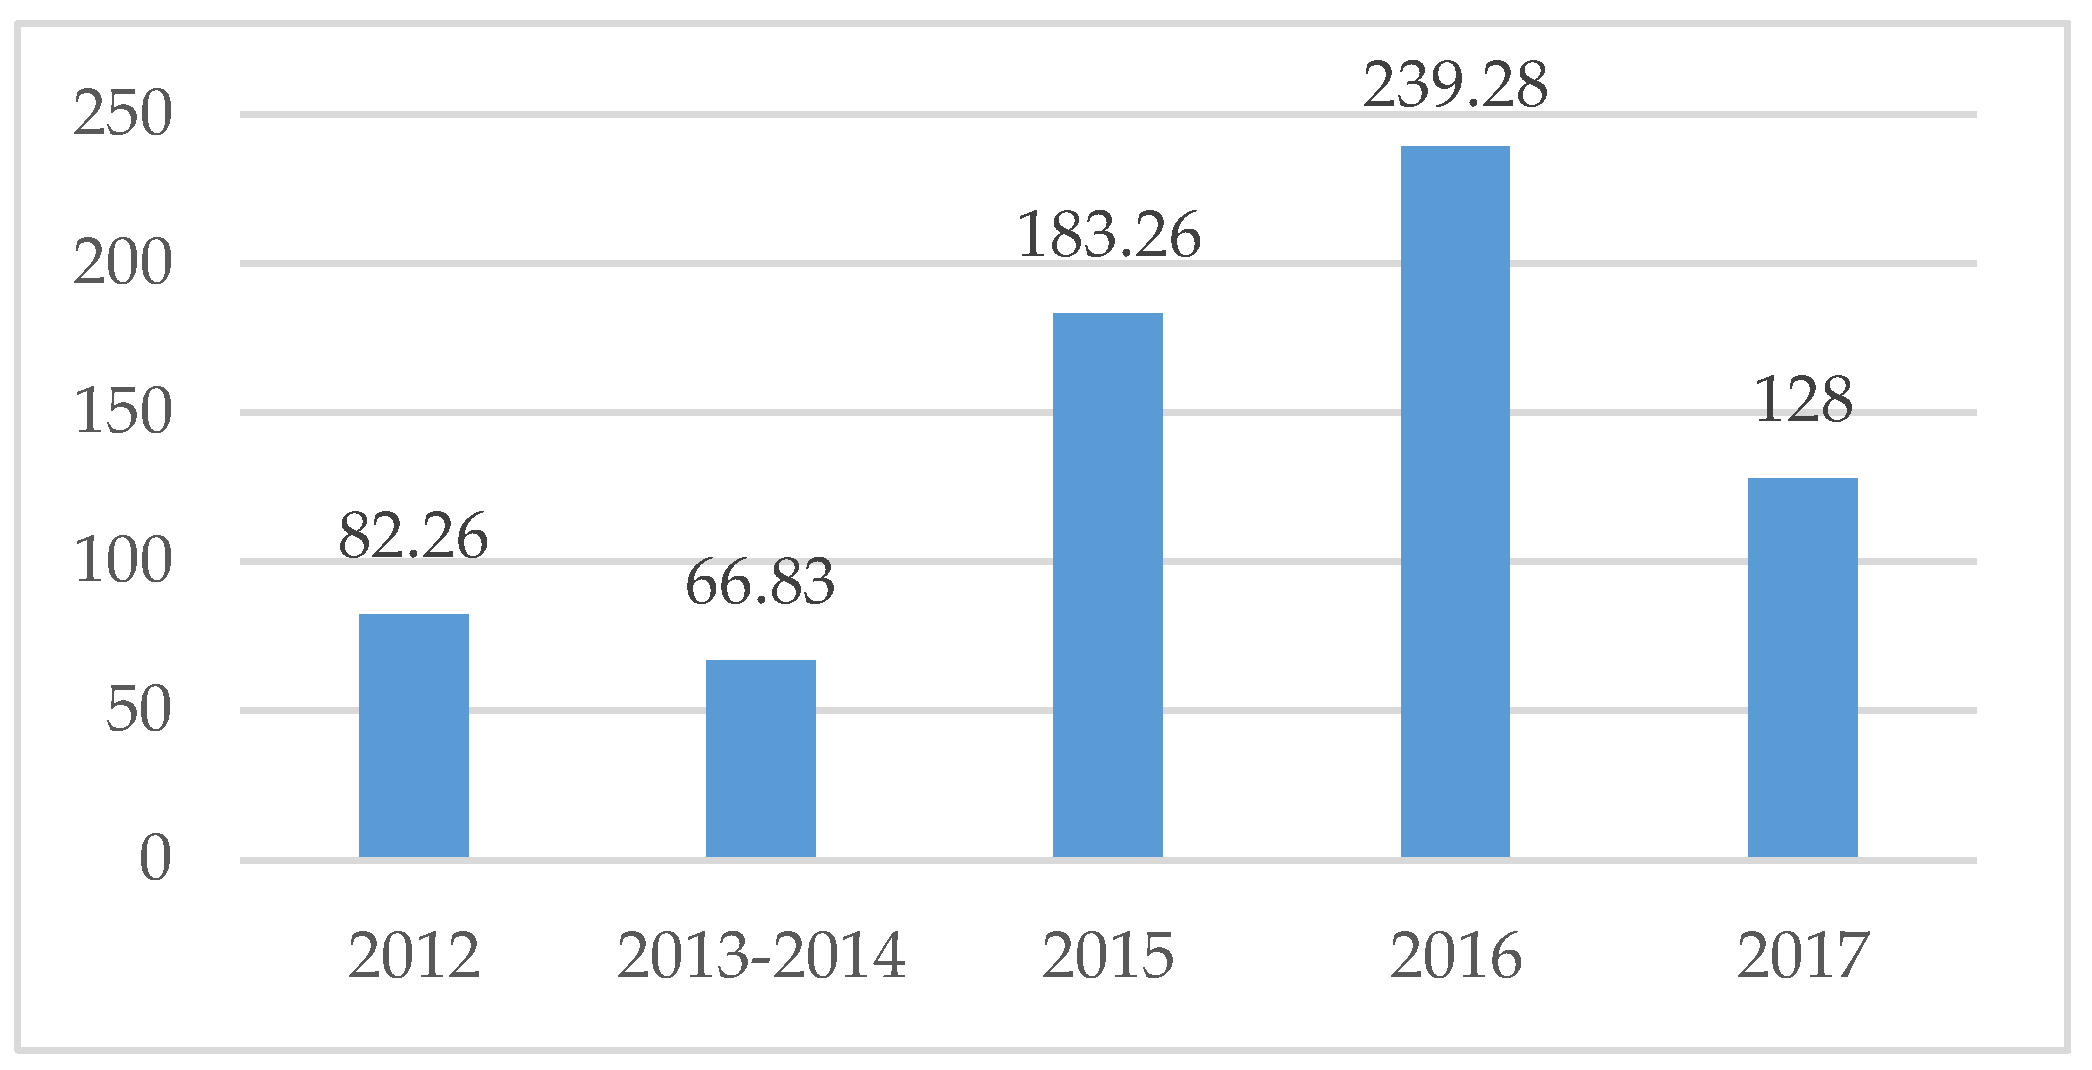
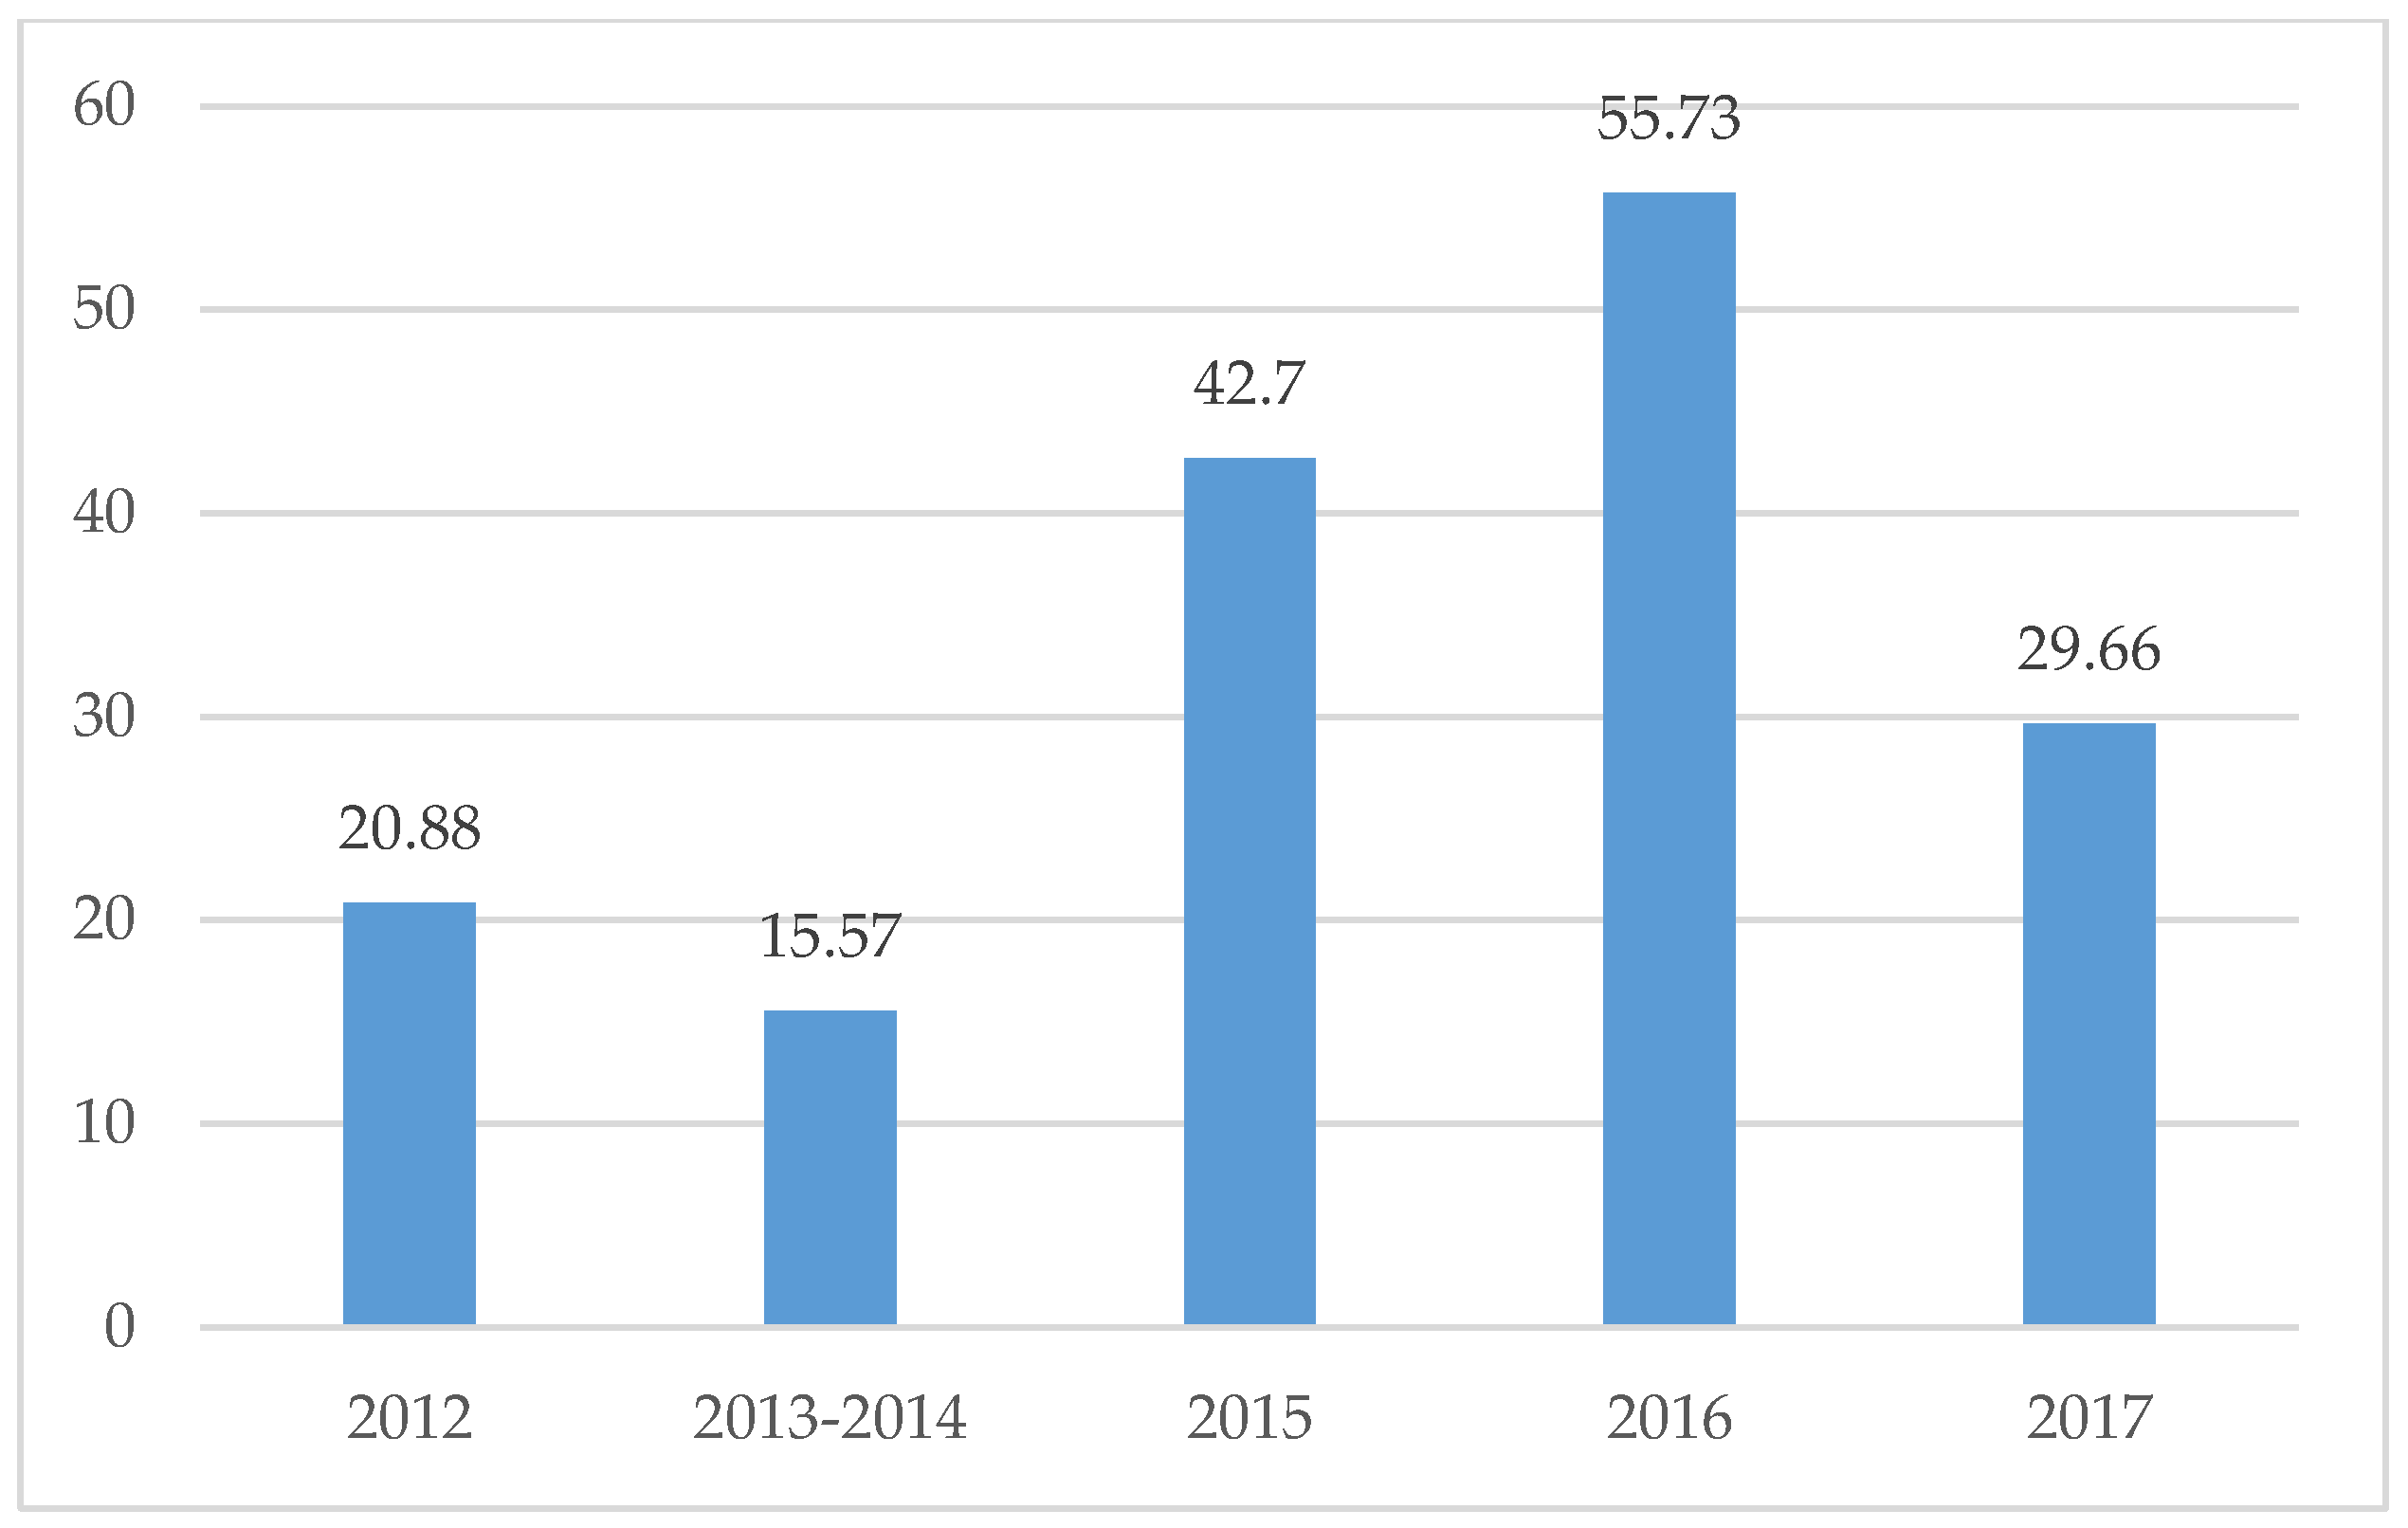
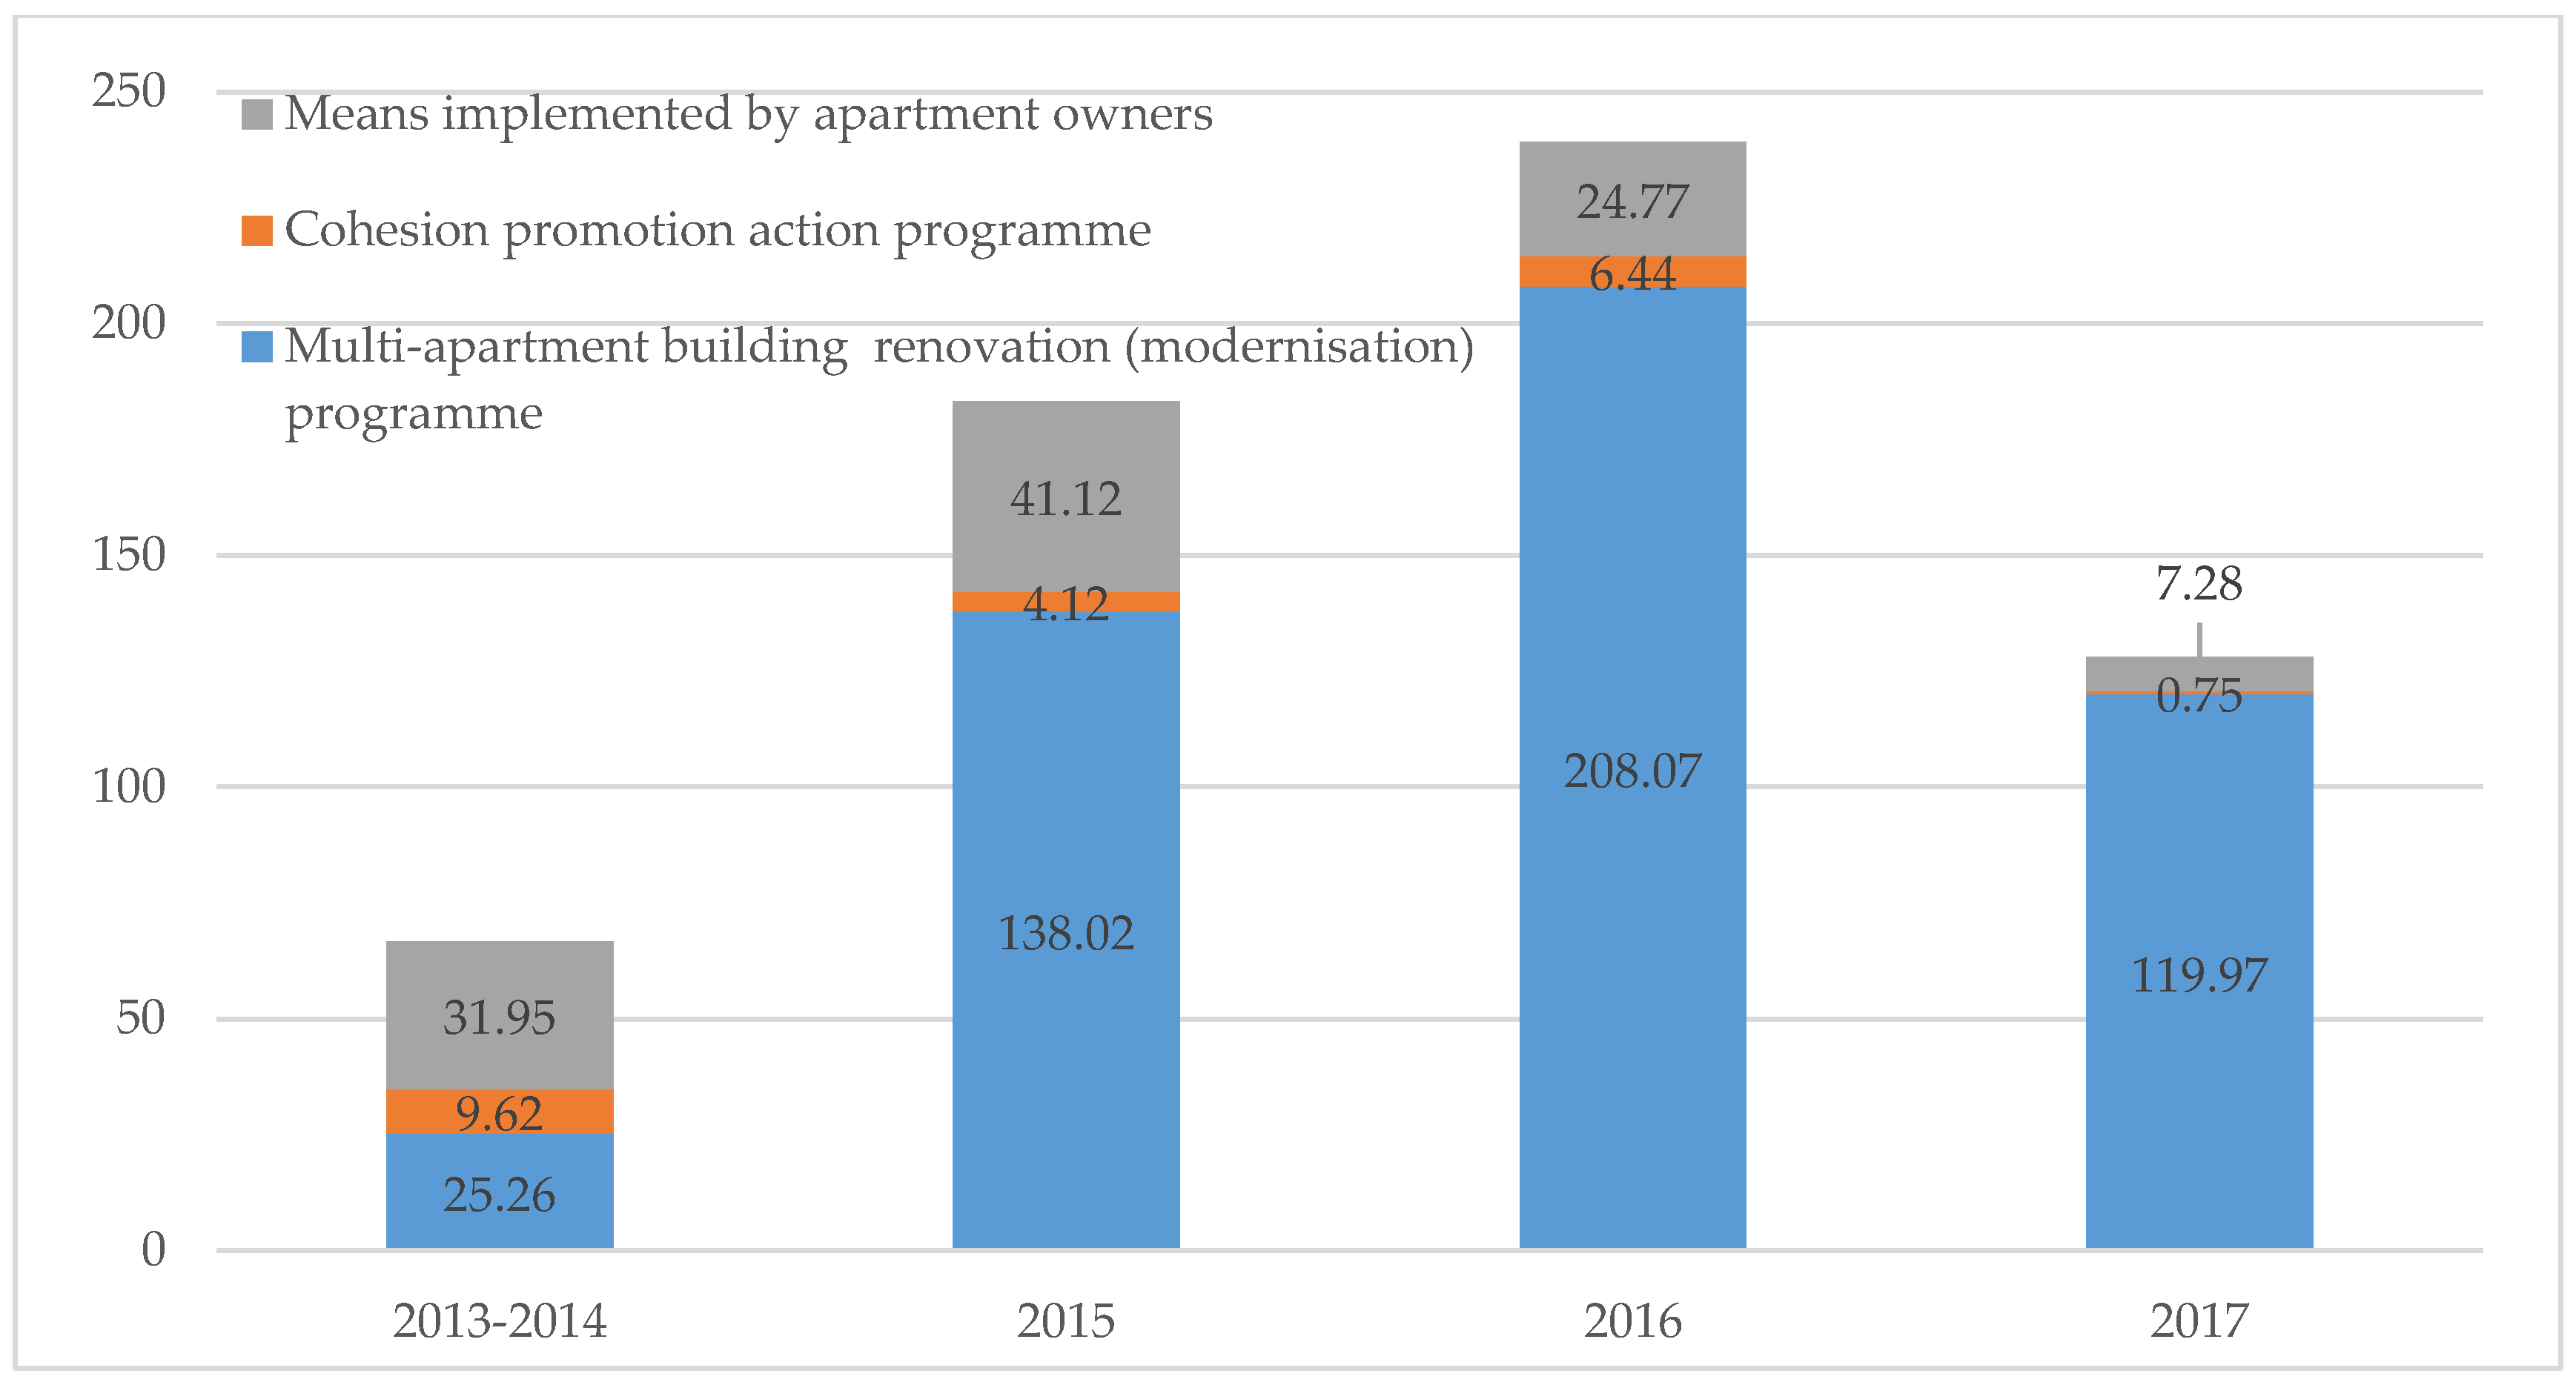
This section provides statistics on the indicators of the existing monitoring carried out by the Public Company Housing Energy Efficiency Agency (HEEA) of the Lithuanian Ministry of the Environment acting as the main managing authority for the programme. The existing monitoring scheme collects information on annual thermal energy savings (GWh/year) in all country renovated buildings (see Figure 12), the reduction of CO2 emissions (thsd. t/year) that resulted from the renovation (see Figure 13), and calculates the distribution of thermal energy savings in all country renovated buildings by the source of funding (see Figure 14). This is obviously insufficient information to support the decisions of renovation interest groups.
3.4. Main Findings and Suggestions
The existing monitoring scheme collects insufficient information on the renovation process, and this therefore reduces the ability to rely on objective and reliable information when deciding on renovation scenarios. The analysis made by the authors revealed that there is the possibility to collect and analyze renovation related data from different perspectives that is useful for different stakeholders of the renovation process, and this would obviously help to facilitate decision-making processes.
Currently, the process of information collection and its transfer to different interest groups is mainly manual, the data is not integrated and is collected in different sources, and in some cases, access is closed. In order to facilitate the flow of information, the data needs to be digitalized.
In order to digitize the information that is related to the renovation process and the results, it is necessary to formulate the requirements for the submission of data in order to allow for systematic data collection, analysis, and transfer.
4. Suggested Key Performance Indicators for the Monitoring of the Renovation Process
Based on the findings of the analysis, two groups of indicators suggested for the quality monitoring of the renovation process:
- IR1
- The indicators assessing the requirements for renovation.
- IR2
- The indicators assessing the results of the renovation process.
Information for quality indicators comes from:
- (1)
- Register of applicants:
- IR1.1. The number of applications.
- IR1.2. The number of approved applications.
- IR1.3. The number of changed investment plans.
- (2)
- The Investment plans and Energy certificates:
- IR1.4. The planned thermal energy savings (calculations made in Investment plans).
- IR1.5. The planned reduction of CO2 emissions (calculations made in Investment plans).
- IR1.6. The existent energy class of the building (Energy certificates).
- IR1.7.–IR 1.10. Number of target A, B, C, D energy class certificates (calculations made in Investment plans).
- (3)
- Actual data:
- IR2.1. Reduction of thermal energy consumption (the calculations made are based on the actual thermal energy consumptions).
- IR2.2. Actual thermal energy savings (data on the actual thermal energy consumptions).
- IR2.3. Actual reduction of CO2 emissions (calculations based on the actual thermal energy consumptions).
- IR2.3.–IR 2.7. Number of achieved A, B, C, D energy class certificates (data from energy certificates).
- (4)
- Other primary and secondary sources of information (Surveys; Expert reports; Feasibility studies; Certification reports).
Table 5 presents a detailed description of all the indicators proposed for quality monitoring of the renovation process, including calculation methods, data sources, and data provider.
5. Conclusions
The existing monitoring scheme collects insufficient information on the renovation process, and this therefore reduces the ability to rely on objective and reliable information when deciding on renovation scenarios. The current paper presents a case study analysis of renovated multi-family apartments. The analysis made by the authors revealed that there is the possibility to collect and analyze renovation related data from different perspectives that is useful for different stakeholders of the renovation process, and this would obviously help to facilitate decision-making processes.
The study proposes methodology for the rational quality monitoring of the renovation process. The presented approach is based on a complex system of criteria that enables the comprehensive evaluation of the quality of the renovation process. The methodology that has been developed for rational quality monitoring of the renovation process can be used for long term monitoring activities to ensure that the system is up to date, while reflecting the concerns of key stakeholders and the increase of requirements.
Quality monitoring could also serve as an analytical framework to analyze the effects of renovation, and may assist in finding out the measures that shall be undertaken to ensure that the renovation process delivers the most positive results. The proposed approach is based on a complex system of criteria that reflects the needs and expectations of the different interest groups of renovation and ensures the reliability of analysis.
There are no strict limitations for the use of the presented approach. The advantage of the proposed approach is that the proposed methodology is versatile and could be adapted for other cases by changing the set of criteria so that is responds to the different environment. Nevertheless, the correctness of application depends on the type and the accuracy of the initial data, the experience level of experts, and the decision-makers.
The methodological approach proposed in this study can be used for the generation of specific procedures, and the authors believe that new methodology could be the baseline for future research and that it can contribute by ensuring the transparency of data collection, analysis, and transfer. Currently, the process of information collection and transfer to different interest groups is mainly manual, data is not integrated, is stored in different sources, and in some cases, access is closed. In order to facilitate the flow of information, the data needs to be digitalized. In order to digitize the information related to the renovation process and the results, it is necessary to formulate the requirements for the submission of data to ensure systematic data collection, analysis, and transfer.
Author Contributions
All authors contributed equally to this work.
Funding
This research received no external funding.
Acknowledgments
The authors are grateful to the Public Company Housing Energy Efficiency Agency (HEEA) for providing access to the documentation of the renovated case study buildings. Also, the authors would like to acknowledge the Public Company, the Lithuanian District Heating Association (LDHA) for providing data on the actual measured thermal energy consumption of some of the renovated case study buildings.
Conflicts of Interest
The authors declare no conflict of interest.
References and Note
- Zavadskas, E.K.; Antucheviciene, J.; Vilutiene, T.; Adeli, H. Sustainable decision-making in civil engineering, construction and building technology. Sustainability 2018, 10, 14. [Google Scholar] [CrossRef]
- Wang, N.M.; Adeli, H. Sustainable Building Design. J. Civ. Eng. Manag. 2014, 20, 1–10. [Google Scholar] [CrossRef]
- Mikaelsson, L.A.; Larsson, J. Integrated Planning for Sustainable Building—Production an Evolution over Three Decades. J. Civ. Eng. Manag. 2017, 23, 319–326. [Google Scholar] [CrossRef]
- Akbari, H.; Cartalis, C.; Kolokotsa, D.; Muscio, A.; Pisello, A.L.; Rossi, F.; Santamouris, M.; Synnefa, A.; Wong, N.H.; Zinzi, M. Local Climate Change and Urban Heat Island Mitigation Techniques—The State of the Art. J. Civ. Eng. Manag. 2016, 22, 1–16. [Google Scholar] [CrossRef]
- Zavadskas, E.K.; Antucheviciene, J.; Kalibatas, D.; Kalibatiene, D. Achieving Nearly Zero-Energy Buildings by applying multi-attribute assessment. Energy Build. 2017, 143, 162–172. [Google Scholar] [CrossRef]
- Si, J.; Marjanovic-Halburd, L.; Nasiri, F.; Bell, S. Assessment of building-integrated green technologies: A review and case study on applications of Multi-Criteria Decision Making (MCDM) method. Sustain. Cities Soc. 2016, 27, 106–115. [Google Scholar] [CrossRef] [Green Version]
- Vilches, A.; Garcia-Martinez, A.; Sanchez-Montañes, B. Life cycle assessment (LCA) of building refurbishment: A literature review. Energy Build. 2017, 135, 286–301. [Google Scholar] [CrossRef]
- Sierra-Pérez, J.; Boschmonart-Rives, J.; Gabarrell, X. Environmental assessment of façade-building systems and thermal insulation materials for different climatic conditions. J. Clean. Prod. 2016, 113, 102–113. [Google Scholar] [CrossRef]
- Yang, J.; Chong, A.; Santamouris, M.; Kolokotsa, D.; Lee, S.E.; Tham, K.W.; Sekhar, C.; Cheong, D.K.W. Energy utilizability concept as a retrofitting solution selection criterion for buildings. J. Civ. Eng. Manag. 2017, 23, 541–552. [Google Scholar] [CrossRef]
- European Parliament and the Council. Directive 2010/31/EU on the energy performance of buildings. Off. J. Eur. Union 2010. [Google Scholar] [CrossRef]
- European Parliament and the Council of the European Union. Directive 2012/27/EU on energy efficiency, amending Directives 2009/125/EC and 2010/30/EU and repealing Directives 2004/8/EC and 2006/32/EC. Off. J. Eur. Union 2012, 55, 1–57. [Google Scholar]
- Building Technical Regulation STR 2.01.02:2016, Design and Certification of Energy Performance of Buildings; adopted on 11 November 2016 by Order No. D1-754 of the Minister of Environment of the Republic of Lithuania (In Lithuanian).
- Džiugaitė-Tumėnienė, R.; Jankauskas, V.; Motuzienė, V. Energy balance of a low energy house. J. Civ. Eng. Manag. 2012, 18, 369–377. [Google Scholar] [CrossRef]
- Risholtn, B.; Berker, T. Success for energy efficient renovation of dwellings—Learning from private homeowners. Energy Policy 2013, 61, 1022–1030. [Google Scholar] [CrossRef] [Green Version]
- Martinaitis, V.; Zavadskas, E.K.; Motuzienė, V.; Vilutienė, T. Importance of occupancy information when simulating energy demand of energy efficient house: A case study. Energy Build. 2015, 101, 64–75. [Google Scholar] [CrossRef]
- Programme for the Renovation/Upgrading of Multi-Apartment Buildings—Lithuania. Available online: http://www.buildup.eu/en/explore/links/programme-renovationupgrading-multi-apartment-buildings-lithuania (accessed on 10 April 2018).
Figure 1.
Mapping of key stakeholders of the renovation.

Figure 2.
Steps of the research methodology.

Figure 3.
The distribution of case buildings by county (sample size n = 74).

Figure 4.
The distribution of case buildings by periods of construction (sample size n = 74).

Figure 5.
The distribution of case buildings by the type of construction materials of the bearing walls (sample size n = 74).
Figure 5.
The distribution of case buildings by the type of construction materials of the bearing walls (sample size n = 74).

Figure 6.
Number of certificates by achieved energy class (sample size n = 74).

Figure 7.
The distribution of buildings by percentage decrease of the actual measured thermal energy consumption (sample size n = 35).
Figure 7.
The distribution of buildings by percentage decrease of the actual measured thermal energy consumption (sample size n = 35).

Figure 8.
Distribution of applied energy saving measures in the case buildings (sample size n = 74).
Figure 8.
Distribution of applied energy saving measures in the case buildings (sample size n = 74).

Figure 9.
Installed ventilation systems by type (sample size n = 74).

Figure 10.
The distribution of the applied non-energy saving measures in the case buildings (sample size n = 74).
Figure 10.
The distribution of the applied non-energy saving measures in the case buildings (sample size n = 74).

Figure 11.
The distribution of case buildings by the type of façade and insulation (sample size n = 48).
Figure 11.
The distribution of case buildings by the type of façade and insulation (sample size n = 48).

Figure 12.
The estimated annual (2012–2017) thermal energy savings in all country renovated buildings (GWh/year). Data source: www.betalt.lt.
Figure 12.
The estimated annual (2012–2017) thermal energy savings in all country renovated buildings (GWh/year). Data source: www.betalt.lt.

Figure 13.
The estimated annual (2013–2017) reduction of CO2 emissions (thsd. t/year). Data source: www.betalt.lt.
Figure 13.
The estimated annual (2013–2017) reduction of CO2 emissions (thsd. t/year). Data source: www.betalt.lt.

Figure 14.
The estimated annual (2013–2017) thermal energy savings in all country renovated buildings classified by source of funding (GWh/year). Data source: www.betalt.lt.
Figure 14.
The estimated annual (2013–2017) thermal energy savings in all country renovated buildings classified by source of funding (GWh/year). Data source: www.betalt.lt.


Table 1.
Renovation scenarios in the analyzed case buildings.
| Renovation Scenarios | Change of Energy Class | Number of Cases in the Sample | Thermal Energy Consumption before the Renovation (Max-Min), kWh/m2 | Thermal Energy Consumption after the Renovation (Max-Min), kWh/m2 | Thermal Energy Consumption before the Renovation (Average), kWh/m2 | Thermal Energy Consumption after the Renovation (Average), kWh/m2 | Thermal Energy Consumption Reduction (Average), % |
|---|---|---|---|---|---|---|---|
| Scenario 1 | D → B | 7 | 322.68–205.48 | 89.43–59.84 | 242.56 | 75.02 | 69.07 |
| Scenario 2 | D → C | 23 | 322.43–175.10 | 159.41–70.99 | 237.64 | 104.01 | 56.23 |
| Scenario 3 | E → B | 4 | 374.34–248.89 | 146.68–85.08 | 301.95 | 108.91 | 63.93 |
| Scenario 4 | E → C | 37 | 553.73–216.84 | 199.4–68.38 | 309.68 | 104.86 | 66.14 |
| Scenario 5 | E → D | 1 | - | - | 400.00 | 170.90 | 57.28 |
| Scenario 6 | F → C | 1 | - | - | 806.25 | 215.86 | 73.23 |
| Scenario 7 | G → C | 1 | - | - | 1095.47 | 316.79 | 71.08 |
Table 2.
The difference between the calculated and the actual measured values of thermal energy consumption for heating (sample size n = 35).
Table 2.
The difference between the calculated and the actual measured values of thermal energy consumption for heating (sample size n = 35).
| Renovated Building | Type of Envelope Insulation | Actual Calculated Thermal Energy Consumption for Heating, kWh/m2 | Actual Measured Thermal Energy Consumption for Heating, kWh/m2 | Difference between the Calculated and the Actual Measured Values, kWh/m2 | Percentage Decrease (+)/Increase (−) in Consumption Thermal Energy for Heating, % |
|---|---|---|---|---|---|
| Biliūno 28 | Mineral wool | 61.13 | 99.02 | −37.89 | −61.98 |
| Liudiškių 31C | Mineral wool | 41.57 | 46.63 | −5.06 | −12.17 |
| Kosmonautų 11 | Mineral wool | 68.38 | 73.09 | −4.71 | −6.89 |
| Smilties pylymo 3 | Mineral wool | 57.39 | 62.90 | −5.51 | −5.93 |
| Panerių 15 | Mineral wool | 46.14 | 47.99 | −1.85 | −4.01 |
| Vilniaus 29 | Mineral wool | 64.89 | 67.70 | −2.81 | −2.82 |
| Šviesos 5 | EPS | 68.93 | 67.51 | 1.42 | 2.06 |
| Šviesos 3 | EPS | 68.98 | 64.05 | 4.93 | 7.15 |
| Chemikų 55 | Mineral wool | 62.33 | 57.55 | 4.78 | 7.67 |
| Lozoraičio 3 | Mineral wool | 48.57 | 38.80 | 9.77 | 9.64 |
| Baltijos 65 | Mineral wool | 47.57 | 33.60 | 13.97 | 12.43 |
| Mickevičiaus 1A | EPS | 87.60 | 76.60 | 11.00 | 12.56 |
| Mickevičiaus 1 | EPS | 76.79 | 65.22 | 11.57 | 15.07 |
| Mickevičiaus 16 | EPS | 83.75 | 69.84 | 13.91 | 16.61 |
| Kretingos 27 | EPS | 97.34 | 80.79 | 16.55 | 17.00 |
| Liudiškių 31B | Mineral wool | 53.57 | 43.58 | 9.99 | 18.65 |
| Liudiškių 31A | Mineral wool | 52.73 | 42.03 | 10.70 | 20.29 |
| Trakų 18 | EPS | 85.44 | 67.69 | 17.75 | 20.77 |
| Mickevičiaus 7 | EPS | 85.18 | 61.40 | 23.78 | 27.92 |
| Saulės 17 | EPS | 85.25 | 55.52 | 29.73 | 34.87 |
| Trakų 29 | EPS | 85.39 | 55.30 | 30.09 | 35.24 |
| Trakų 11 | EPS | 74.19 | 47.97 | 26.22 | 35.34 |
| Taikos 97 | Mineral wool | 56.47 | 19.67 | 36.80 | 37.55 |
| Trakų 27 | EPS | 90.83 | 55.86 | 34.97 | 38.50 |
| Trakų 2 | EPS | 66.08 | 40.22 | 25.86 | 39.13 |
| Trakų 4 | EPS | 80.51 | 47.95 | 32.56 | 40.44 |
| Atgimimo 6 | Mineral wool | 94.00 | 53.94 | 40.06 | 42.62 |
| Lozoraičio 24 | Mineral wool | 192.00 | 101.74 | 90.26 | 47.01 |
| Vilniaus 26 | EPS | 109.11 | 55.16 | 53.95 | 49.45 |
| Trakų 25 | EPS | 82.76 | 41.11 | 41.65 | 50.33 |
| Taikos 103 | Mineral wool | 73.59 | 36.32 | 37.27 | 50.65 |
| Riomerio 6 | Mineral wool | 90.09 | 41.15 | 48.94 | 54.32 |
| Kęstučio 6 | Mineral wool | 93.17 | 34.25 | 58.92 | 63.24 |
| Liepų 20 | EPS | 87.65 | 28.90 | 58.75 | 67.03 |
| Kęstučio 2 | Mineral wool | 98.21 | 26.17 | 72.04 | 73.35 |
Table 3.
Measures applied in the main renovation scenarios.
| Applied Measures * | Renovation Scenarios | ||||||
|---|---|---|---|---|---|---|---|
| Scenario 1 | Scenario 2 | Scenario 3 | Scenario 4 | Scenario 5 | Scenario 6 | Scenario 7 | |
| D → B | D → C | E → B | E → C | E → D | F → C | G → C | |
| Number of Case Buildings Were Measures Applied | |||||||
| 7 | 23 | 4 | 37 | 1 | 1 | 1 | |
| Energy efficiency improvement measures | |||||||
| HS | + | + | + | + | + | + | + |
| VS | + | + | + | + | + | + | + |
| RES | + | + | |||||
| HWS | + | + | + | + | + | ||
| AWR | + | + | + | + | + | + | + |
| CWR | + | + | + | + | + | + | + |
| BG | + | + | + | + | + | + | |
| WI | + | + | + | + | + | + | |
| RI | + | + | + | + | + | + | + |
| BSI | + | + | + | ||||
| EU | + | + | |||||
| Other (non-energy saving measures) | |||||||
| WWS | + | + | + | + | |||
| DWS | + | + | + | ||||
| DRS | + | ||||||
| RWS | + | + | |||||
| EWS | + | + | + | + | |||
* HS—modernization of heating system; VS—modernization of ventilation system; RES—installation of renewable energy sources (solar, wind, etc.); HWS—modernization of the hot water system; AWR—replacement of windows in apartments and other premises; CWR—change of windows and doors in other common areas; BG—glazing of balconies; WI—exterior wall insulation; RI—roof insulation; BSI—basement slab insulation; EU—replacement of old elevators to higher energy class elevators; WWS—modernization of the waste water drainage system; DWS—modernization of the drinking water supply system; DRS—drainage system instalment; RWS—instalment of a rainwater drainage system; EWS—upgrade of electrical wiring system.
Table 4.
Economic estimates of reduced heat losses through walls after renovation.
| Economic Estimates of Reduced Heat Losses through Walls | Type of Façade | |
|---|---|---|
| EPS Insulated Plastered Façade | Ventilated Façade Insulated with Mineral Wool | |
| Investments (interval values), Eur/m2 | 42.24–128.19 | 57.47–227.04 |
| Investments (average values), Eur/m2 | 76.19 | 104.54 |
| The estimated reduction of heat losses through the walls of the building (interval values), kWh/m2/a | 40.30–120.61 | 35.22–181.84 |
| The estimated reduction of heat losses through the walls of the building (average values), kWh/m2/a | 89.19 | 82.63 |
| The share of investments for the reduction of heat losses through the walls of the building (interval values), Eur/kWh/m2/a | 256.02–4280.31 | 233.96–6962.53 |
| The share of investments for the reduction of heat losses through the walls of the building (average values), Eur/kWh/m2/a | 1178.76 | 2531.05 |
Table 5.
Key performance indicators for the quality monitoring of the renovation process.
| Code of Indicator | Monitoring Indicator | Measuring Unit | Calculation Method | Data Sources | The Moment of Attainment * | Data Provider |
|---|---|---|---|---|---|---|
| 1 | 2 | 3 | 4 | 5 | 6 | 7 |
| IR1 The indicators assessing the requirements for renovation | ||||||
| IR1.1. | Number of applications | Quantity | Data transfer Assignment to groups Aggregation | Submitted applications Register of applications | The application is submitted | Housing Energy Efficiency Agency |
| IR1.2. | Number of approved applications | Quantity | Data transfer Assignment to groups Aggregation | Approved applications Register of applications | The application is approved | Housing Energy Efficiency Agency |
| IR1.3. | Number of changed investment plans | Quantity | Data transfer | Approved applications | The final revision of the investment plan is approved | Housing Energy Efficiency Agency |
| IR1.4. | Planned thermal energy savings (all buildings) | GWh/year | Data transfer | Investment plan | The final revision of the investment plan is approved | Housing Energy Efficiency Agency |
| IR1.5. | Planned reduction of CO2 emissions | t/year | Data transfer | Investment plan | The final revision of the investment plan is approved | Housing Energy Efficiency Agency |
| IR1.6. | Existent energy class of building | Code of energy class | Aggregation | Investment plan Energy certificate issued before the renovation | The energy certificate is issued | Housing Energy Efficiency Agency |
| IR1.7. | Number of target A energy class certificates | Code of energy class | Aggregation | Investment plan | The final revision of the investment plan is approved | Housing Energy Efficiency Agency |
| IR1.8. | Number of target B energy class certificates | Code of energy class | Aggregation | Investment plan | The final revision of the investment plan is approved | Housing Energy Efficiency Agency |
| IR1.9. | Number of target C energy class certificates | Code of energy class | Aggregation | Investment plan | The final revision of the investment plan is approved | Housing Energy Efficiency Agency |
| IR1.10. | Number of target D energy class certificates | Code of energy class | Aggregation | Investment plan | The final revision of the investment plan is approved | Housing Energy Efficiency Agency |
| IR2 The indicators assessing the results of renovation process | ||||||
| IR2.1. | Reduction of thermal energy consumption (single buildings) | % | Calculated using the following formula: (—actual thermal energy consumption after renovation; —thermal energy consumption before renovation) | Investment plan/actual measurements | The yearly data of actual thermal energy consumption is provided | Housing Energy Efficiency Agency Thermal energy provider |
| IR2.2. | Actual thermal energy savings (all buildings) | GWh/ year | Data transfer Aggregation of actual thermal energy savings of single buildings | Investment plan/actual measurements | The yearly data of actual thermal energy consumption is provided | Housing Energy Efficiency Agency Thermal energy provider |
| IR2.3. | Actual reduction of CO2 emissions | t/year | Recalculated according to actual thermal energy savings | Investment plan | The yearly data of actual thermal energy consumption is provided | Housing Energy Efficiency Agency |
| IR2.4. | Number of achieved A energy class certificates | Code of energy class | Data transfer | Investment plan Energy certificate issued after the renovation | The energy certificate is issued | Housing Energy Efficiency Agency |
| IR2.5. | Number of achieved B energy class certificates | Code of energy class | Data transfer | Investment plan Energy certificate issued after the renovation | The energy certificate is issued | Housing Energy Efficiency Agency |
| IR2.6. | Number of achieved C energy class certificates | Code of energy class | Data transfer | Investment plan Energy certificate issued after the renovation | The energy certificate is issued | Housing Energy Efficiency Agency |
| IR2.7. | Number of achieved D energy class certificates | Code of energy class | Data transfer | Investment plan Energy certificate issued after the renovation | The energy certificate is issued | Housing Energy Efficiency Agency |
* Column explains the condition when the indicator is considered to be attained.
© 2018 by the authors. Licensee MDPI, Basel, Switzerland. This article is an open access article distributed under the terms and conditions of the Creative Commons Attribution (CC BY) license (http://creativecommons.org/licenses/by/4.0/).
Share and Cite
MDPI and ACS Style
Vilutiene, T.; Ignatavičius, Č. Towards Sustainable Renovation: Key Performance Indicators for Quality Monitoring. Sustainability 2018, 10, 1840. https://doi.org/10.3390/su10061840
AMA Style
Vilutiene T, Ignatavičius Č. Towards Sustainable Renovation: Key Performance Indicators for Quality Monitoring. Sustainability. 2018; 10(6):1840. https://doi.org/10.3390/su10061840
Chicago/Turabian StyleVilutiene, Tatjana, and Česlovas Ignatavičius. 2018. "Towards Sustainable Renovation: Key Performance Indicators for Quality Monitoring" Sustainability 10, no. 6: 1840. https://doi.org/10.3390/su10061840
Note that from the first issue of 2016, this journal uses article numbers instead of page numbers. See further details here.