Article

Integrating a Procurement Management Process into Critical Chain Project Management (CCPM): A Case-Study on Oil and Gas Projects, the Piping Process

1
Dae-Woo Engineering and Construction, Engineering Management Team, Division of Plant Engineering, 75 Saemunan-Ro, Jongro-Ku, Seoul 03182, Korea
2
Graduate Institute of Ferrous Technology & Graduate School of Engineering Mastership, Pohang University of Science and Technology (POSTECH), 77 Cheongam-Ro, Nam-Ku, Pohang 37673, Korea
*
Author to whom correspondence should be addressed.
Sustainability 2018, 10(6), 1817; https://doi.org/10.3390/su10061817
Submission received: 8 April 2018 / Revised: 28 May 2018 / Accepted: 29 May 2018 / Published: 31 May 2018
(This article belongs to the Special Issue Circular Economy, Ethical Funds, and Engineering Projects)

Abstract

:
Engineering, Procurement, and Construction (EPC) of oil and gas megaprojects often experience cost overruns due to substantial schedule delays. One of the greatest causes of these overruns is the mismanagement of the project schedule, with the piping works (prefabrication and installation) occupying a majority of that schedule. As such, an effective methodology for scheduling, planning, and controlling of piping activities is essential for project success. To meet this need, this study used the Critical Chain Project Management (CCPM) to develop a piping construction delay prevention methodology, incorporating material procurement processes for EPC megaprojects. Recent studies indicate that the traditional scheduling method used on oil and gas mega projects has critical limitations regarding resource scarcity, calculation of activity duration, and dealing with uncertainties. To overcome these limitations, the Theory of Constraints-based CCPM was proposed and implemented to provide schedule buffers management. Nonexistent in literature, and of critical importance, is this paper’s focus on the resource buffer, representing material uncertainty and management. Furthermore, this paper presents a step-by-step process and flow chart for project, construction, and material managers to effectively manage a resource buffer through the CCPM process. This study extends the knowledge of traditional resource buffers in CCPM to improve material and procurement management, thus avoiding the shortage of piping materials and minimizing delays. The resultant process was validated by both deterministic and probabilistic schedule analysis through two case studies of a crude pump unit and propylene compressor installation at a Middle Eastern Refinery Plant Installation. The results show that the CCPM method effectively handles uncertainty, reducing the duration of piping works construction by about a 35% when compared to the traditional method. Furthermore, the results show that, in not considering material uncertainty (resource buffers), projects schedules have the potential for approximately a 5% schedule growth with the accompanying delay charges. The findings have far-reaching applications for both oil and gas and other sectors. This CCPM case-study exemplifies that the material management method represents an opportunity for industry to administrate pipeline installation projects more effectively, eliminate project duration extension, develop schedule-based risk mitigation measures pre-construction, and enable project teams to efficiently manage limited human and material resources.

1. Introduction

1.1. EPC Megaprojects Schedule Under-Performance

Over the last decade, EPC (Engineering, Procurement, and Construction) megaprojects (>1 billion USD), especially within the petrochemical and oil and gas industries, have experienced substantial cost overrun and prolonged schedule delay. Frequently, the burden of these overruns and delays fall on the contractor. This is most commonly the case in lump-sum turn-key contracts where the EPC contractors manage the contractual liabilities of the project. In these projects, the contractors are at risk of incurring considerable financial damages for poor project performance [1]. The frequency of project overruns experienced in the petrochemical and oil and gas industry, and the resultant contractor losses, suggests a major need for managerial process improvement.
Poor schedule management is one of the greatest causes of these overruns on mega-EPC projects [2]. The traditional scheduling management process, Program Evaluation and Review Technique/Critical Path Method (PERT/CPM), is found to be lacking, namely in its ability to handle resource constraints and project uncertainty. Therefore, this study proposes a Critical Chain Project Management (CCPM) which is better equipped to handle resource constraints and provides a more transparent uncertainty management process. While certain authors are dedicated to this topic, no existing literature discusses the management of the resource buffer (material availability uncertainty). Therefore, this paper presents a supplementary procurement management process, including schedule management of the uncertainties, to both fill the research gap and aid practitioners in effectively estimating project schedules. This process was developed for piping installation (one of the major petrochemical and oil and gas activities) and validated through an executed Korean EPC project.

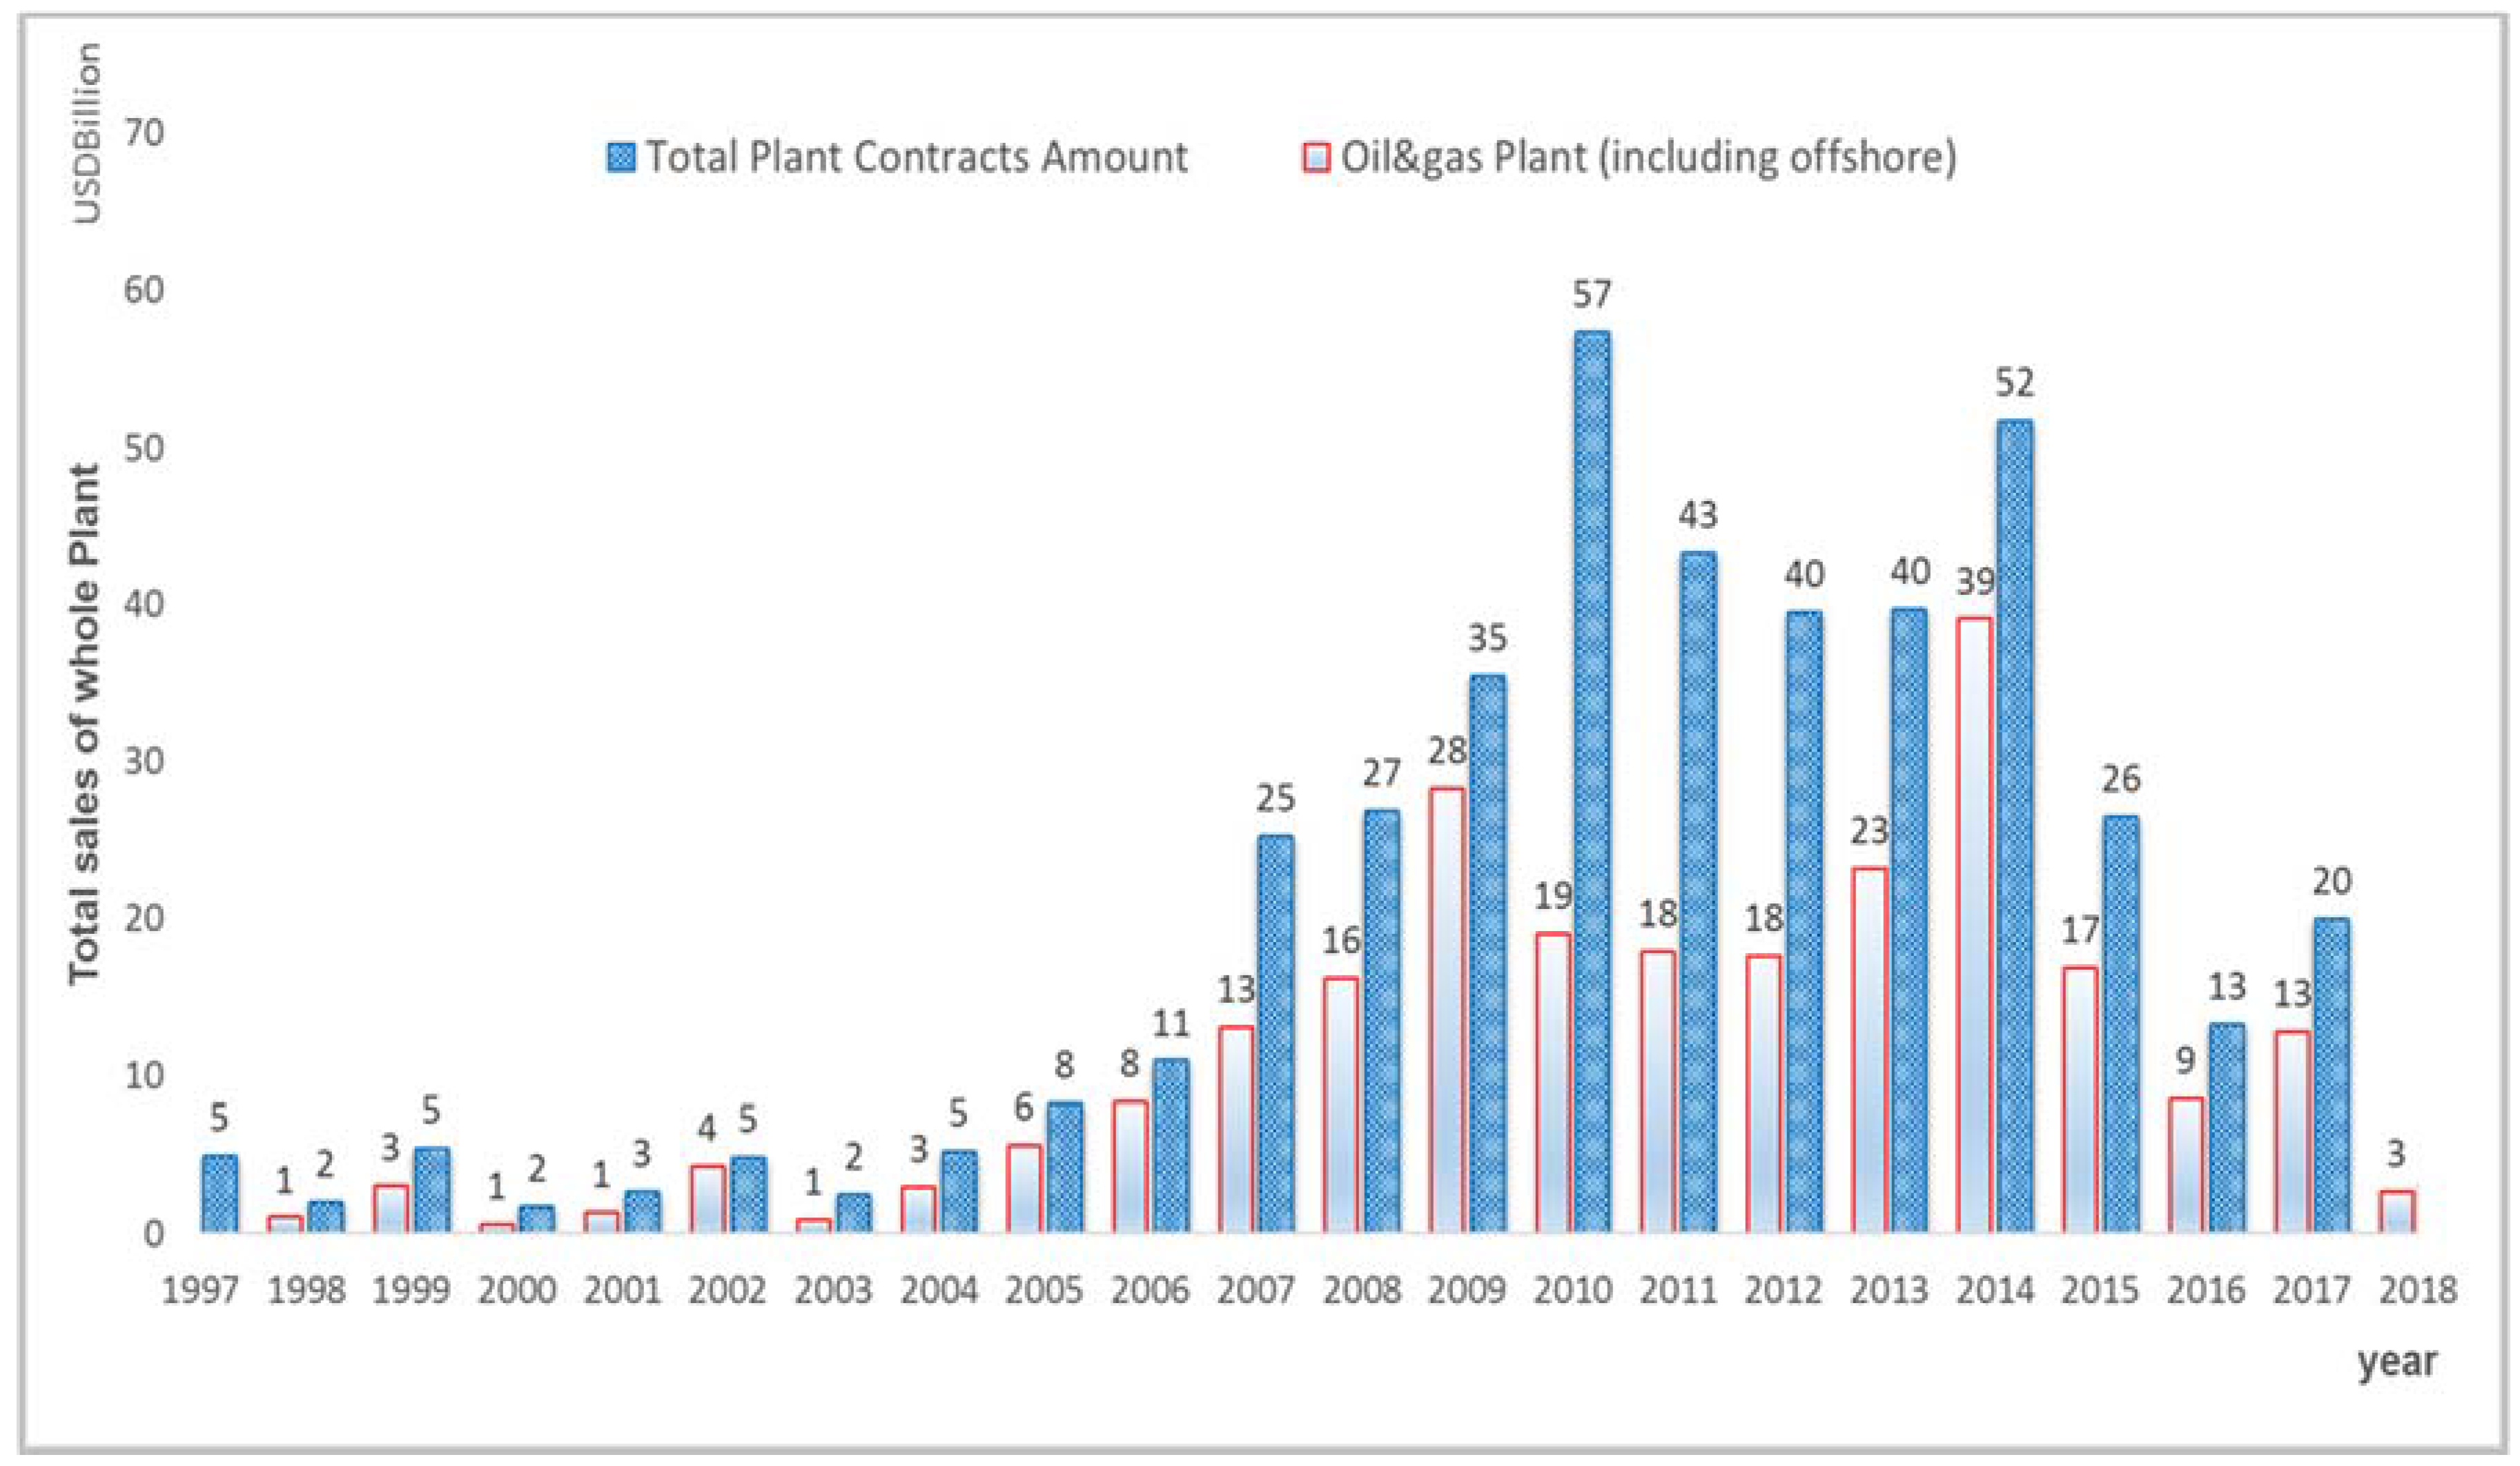
1.2. Problem Background: Fluctuation of Korean EPC Contractors’ Revenue in Overseas Market

As already stated, the focus of this paper is the oil and gas industry. In practice, the global oil and gas projects market consists of: (1) upstream, development of oil and gas fields for production; (2) midstream, transfer oil and gas through pipelines; and (3) downstream, converting oil and gas to petrochemical products. Globally, spending on oil and gas (EPC) projects has been in decline, with approximately USD 437 billion worth of work performed in 2016, a 42% decrease from 2014. Within the last few years, this market has experienced severe decline in the investments and cancellation of capital projects due to this steep downturn. In response to this downturn, oil and gas EPC companies have taken great lengths to improve their overall business portfolio including effective partnering, complementing skillsets [3].
Similar to the global trends, the Korean oil and gas EPC contractors working internationally have experienced profit fluctuation and project volatility. This has been caused by variables, including oil price drop, global market recession, etc. The total annual overseas onshore and offshore contracts executed by Korean EPC contractors has substantially reduced over the last few years, as shown in Figure 1. In 2014, the total value for mainly oil and gas projects awarded to Korean EPC contractors was about USD 39 billion (approximately 80% of total overseas plant projects of USD 52 billion). This was substantially reduced to only USD 9 billion in 2016 with only a slight bounce-up in 2017 (USD 13 billion) potentially due to the crude oil price recovery [4].
This downturn has resulted in major Korean EPC contractors’ hardships such as earning shock due to insolvency at overseas construction sites. In a study of six Korean oil and gas EPC contractor’s overseas experience, the losses experienced ranged from USD 80 million to 1.2 billion from 2013 to 2016 [2]. This is not an isolated occurrence. To date, most international overseas oil and gas (mainly plant) EPC contractors are experiencing cost-overruns, schedule delays, and outstanding disputes and claims on their projects [1]. This problem is further intensified by the loss of work in floating or fixed-platform oil and gas production facilities. While these projects once encompassed a major portion of overseas profit, most Korean EPC contractors now experience large deficits and losses in performing mega offshore EPC projects (fabrication of oil and gas production facilities). According to some media reports, major Korean shipbuilders’ cumulative financial damages were about USD 12 billion over the last few years due to their under-performance in megaprojects [2].
To exacerbate low profits, these contractors often experience poor project performances [1]. The main causes of the losses and damages include: (a) poor estimation resulting in bid/contract amount insufficient to cover project expenses; (b) poor project management, control, and engineering due to inexperience/lack of knowledge; resulting in (c) schedule delays and associated penalties; and (d) poorly managed claims, disputes, legal remediations, etc. [2]. Among these, industry experts believe that the most significant is schedule delays. These delays come with significant penalties, upward of USD 1–2 million per day of delay (so-called delay liquidated damages) [5].
With low profits caused by low project availability and poor project performance, it is ever more important for EPC contractors to prevent the delay of the schedule and reduce the length of the project duration. Although many activities exist, none is more critical than piping installation, namely the procurement of piping materials. As such, this paper presents the Critical Chain Project Management (CCPM) used to develop a piping construction delay prevention methodology, incorporating material procurement processes for EPC megaprojects to prevent project delay on mega-EPC projects, leading to higher contractor profits.

2. Plant Piping Construction: Major Causes for Delays

In an onshore EPC project, piping construction comprises more than 40% of the work volume for the entire project, and welding is the major critical activity. From the lessons learned and experience of recently completed oil and gas EPC mega projects interviewed by the researchers, the main reasons for the delay of piping construction were determined to be resource constraints, lack of material management, and unrealistic work durations.
The critical resources for piping construction are those involved with welding: the welder, welding materials, and welding equipment. There are limited quantities of these resources, e.g. qualified welders, yet many simultaneous activities will require welding. The most common error for Korean mega-project EPC oil and gas contractors is not taking into consideration this limited resource. This is often caused by using the traditional Critical Path Method (CPM), ignoring resource constraints. To meet their developed schedules, welders must be mobilized without any constraint, which is impractical for most onshore EPC project sites.
The next main project management error is an insufficient, or lack of, material management plan. As stated, the piping activities are on the critical path, as are the procurement of piping materials [6]. Typical schedules include only milestones on the estimated time of arrival of piping materials. As such, the contractor is only notified of an issue once the material delivery is delayed. The contractor is not able to recognize the problem until a delay has already occurred [7]. Neither the PERT/CPM nor CCPM methods can sufficiently manage this process [8]. This paper presents a supplemental material management process, likely the paper’s greatest addition to literature and the general body of knowledge of this paper.
Finally, during the estimation process, the schedulers often develop unrealistic work durations. This negatively impacts either efficiency and/or the ability for contractor’s to meet their contractual schedule. This research has found the greatest error to be the use (or misuse) of schedule contingency/float. Often these contingencies are “hidden” within activities by schedulers, minimizing project management teams’ ability to effectively manage the resultant float. The CCPM scheduling process, with the “buffer” concept, is proposed to mitigate this issue (explained in greater detail below).

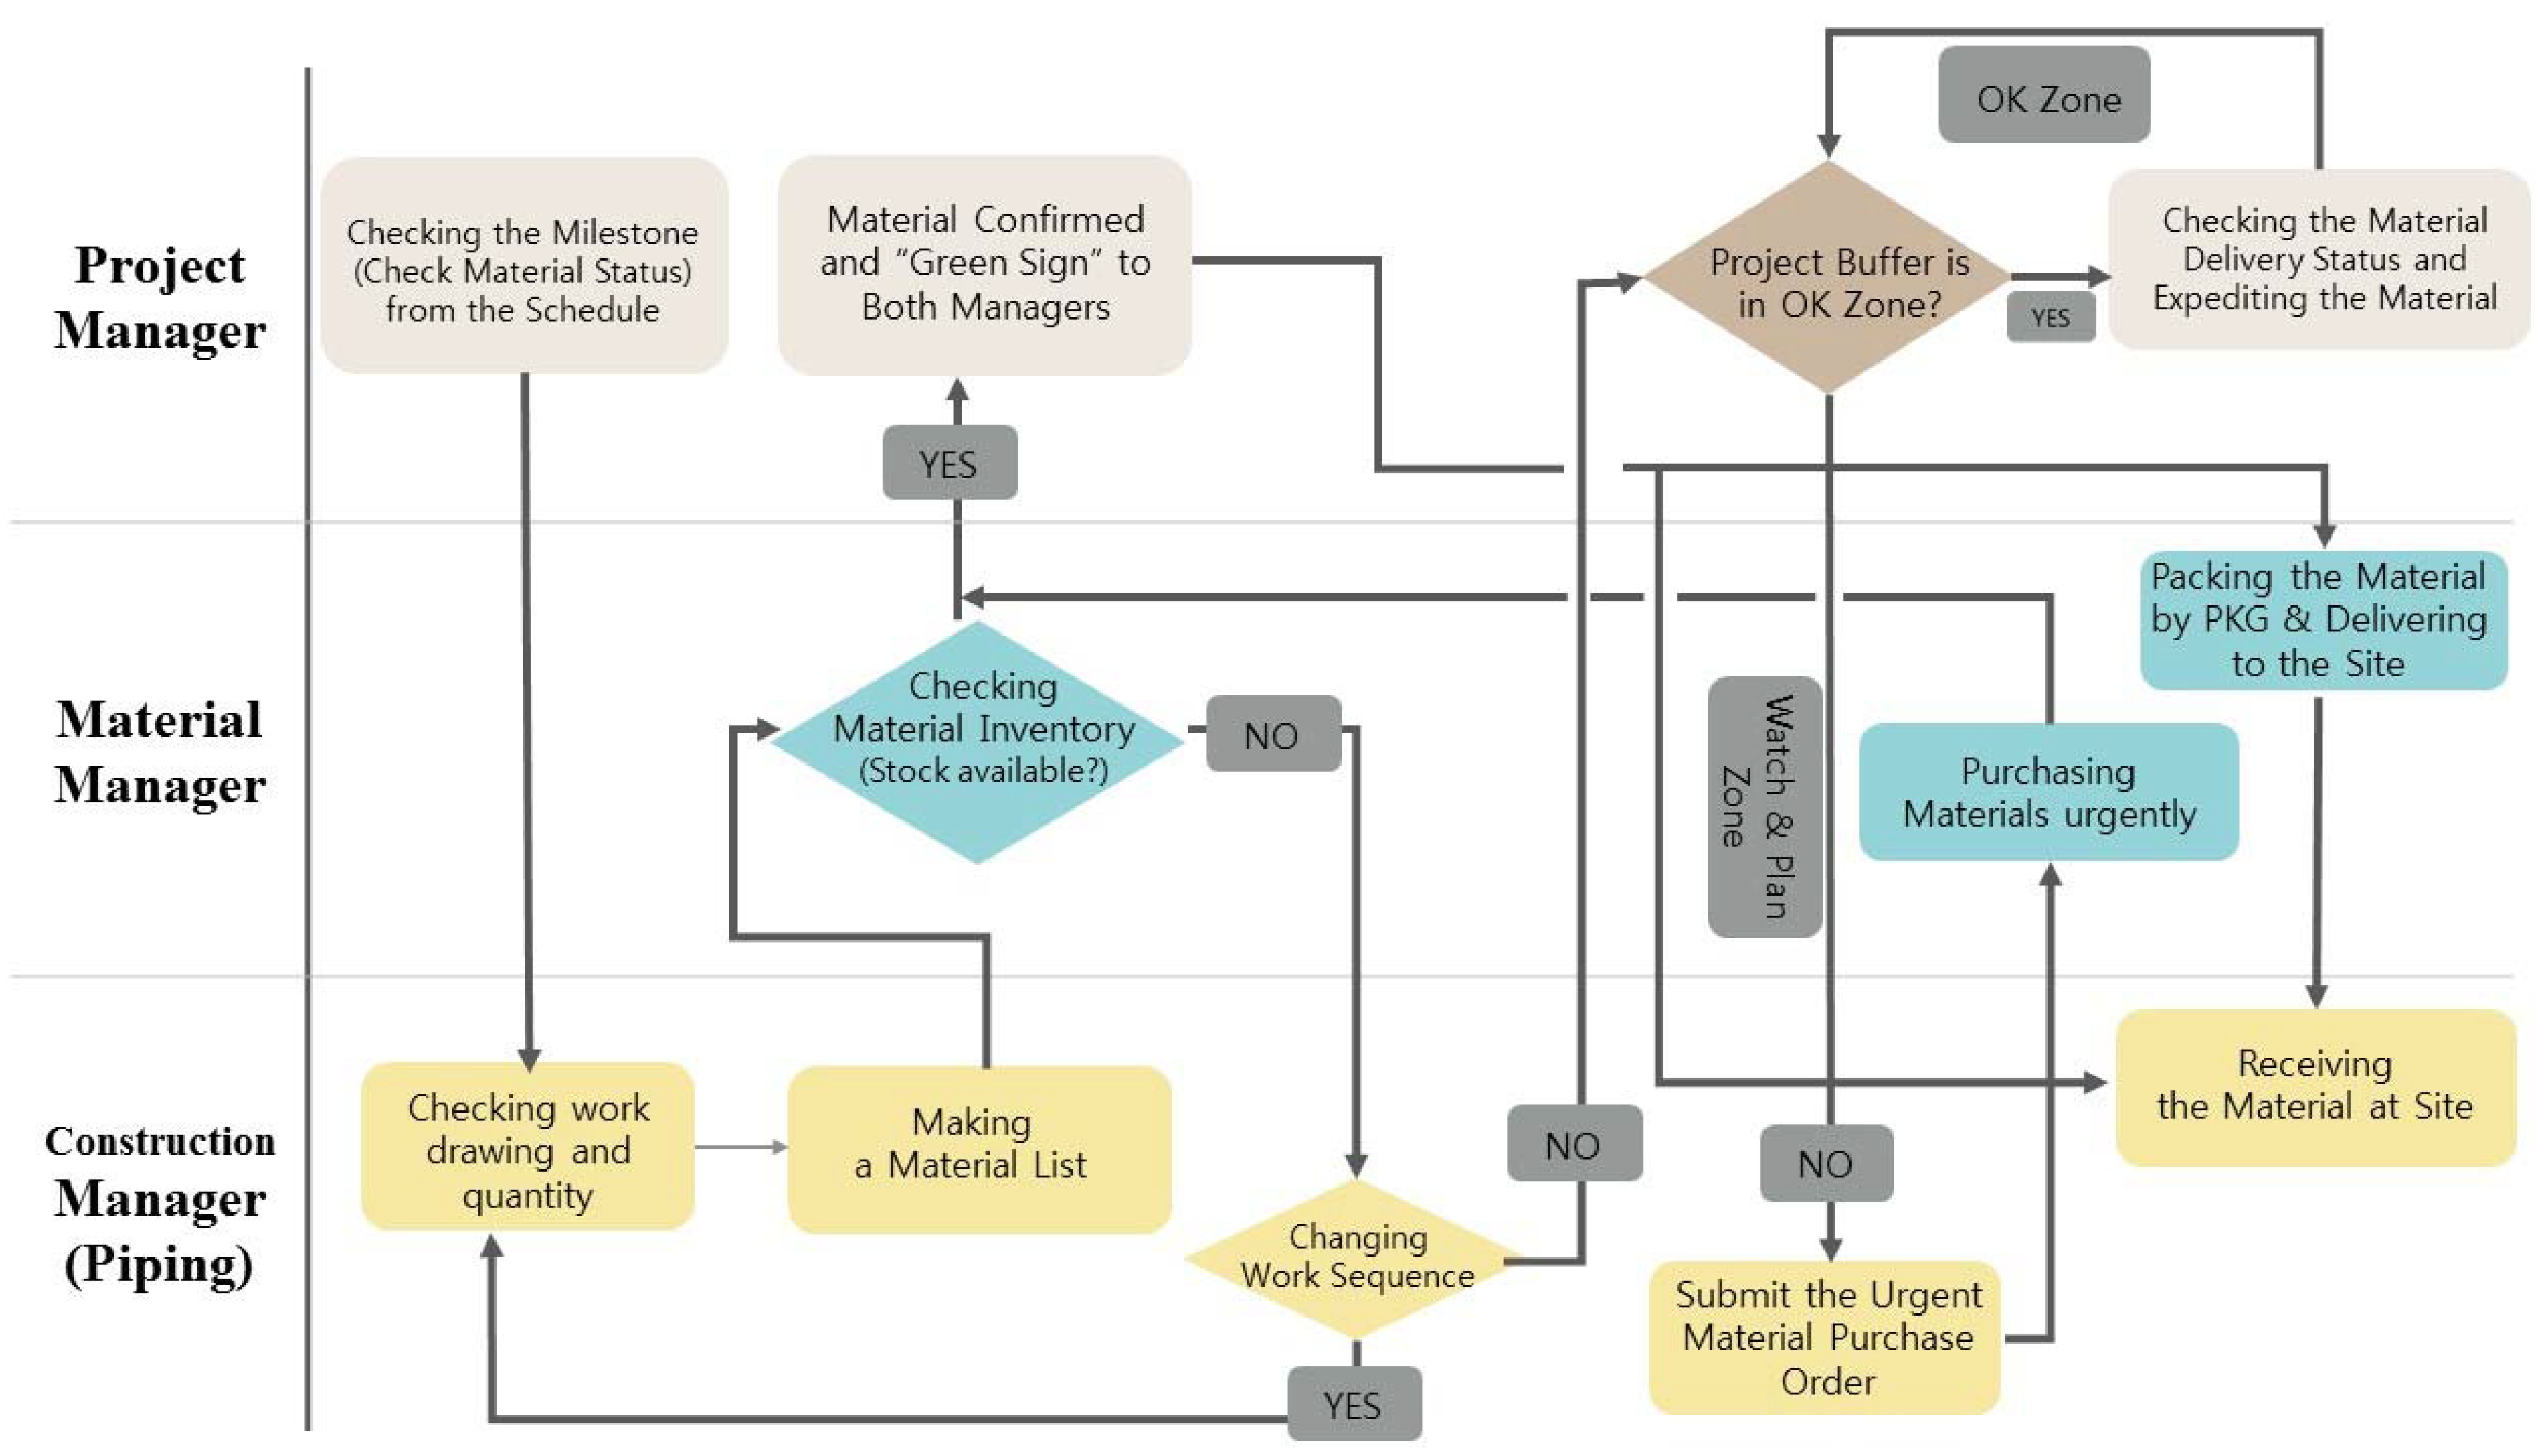
CCPM Scheduling Process: The Use of a Buffer

A key part of estimating a project’s cost and schedule is a contingency and scheduling float, called a buffer for CCPM and this paper. This buffer allows flexibility for unknown and/or unplanned occurrences without negatively impacting the schedule. There are two traditional methods used by Korean oil and gas contractors for estimating a buffer size: cut and paste and square root methods. In the cut/paste method a “safe estimate” (includes duration to account for uncertainty) is cut and half of the duration is attached to the end of all tasks. In the root square error method, uncertainty is calculated through the difference of the safe and average estimate. The uncertainty is then calculated through the square root of the sum of squares [9,10].
The CCPM buffer calculation differs to the traditional method. First, as opposed to CPM’s critical path, CCPM has a resource-constrained critical, known as the critical chain [11,12]. The CCPM critical chain accounts for the resource competition (resource loaded) and includes duration buffers that are non-work schedule activities to manage uncertainty. CCPM’s buffers fall into three categories [13]:
  • Project Buffer
    • Placed at the end of the critical chain
    • Protects target finish date from slippage along the critical chain
  • Feeding Buffer
    • Placed at each point where a chain of dependent activities is not on the critical chain
    • Protects the critical chain from slippage along the feeding chains
  • Resource Buffer
    • The period of preparing resources to be used for critical chain activities
    • Protects the delay of starting activities due to resource constraint
In CCPM, buffers are separate activities. The size of each buffer reflects the duration uncertainty of the dependent activities leading up to that buffer. Instead of managing the total float of network paths, the critical chain method focuses on managing the remaining buffer durations against the remaining duration of chains of activities. The CCPM buffer management process is typically split into three stages: OK, Watch and Plan, and Act. The OK stage is where approximately 100% to 67% of the buffer is left and no action is required. Next, in the Watch and Plan stage (67% to 33% buffer remaining) remaining buffers are continuously reduced. The trend needs to be monitored and the plan needs to be set for the action. Finally, in the Act stage, the buffers are exhausted, and it is thus time to execute the action (overtime work, additional resources, etc.) based on the plan.

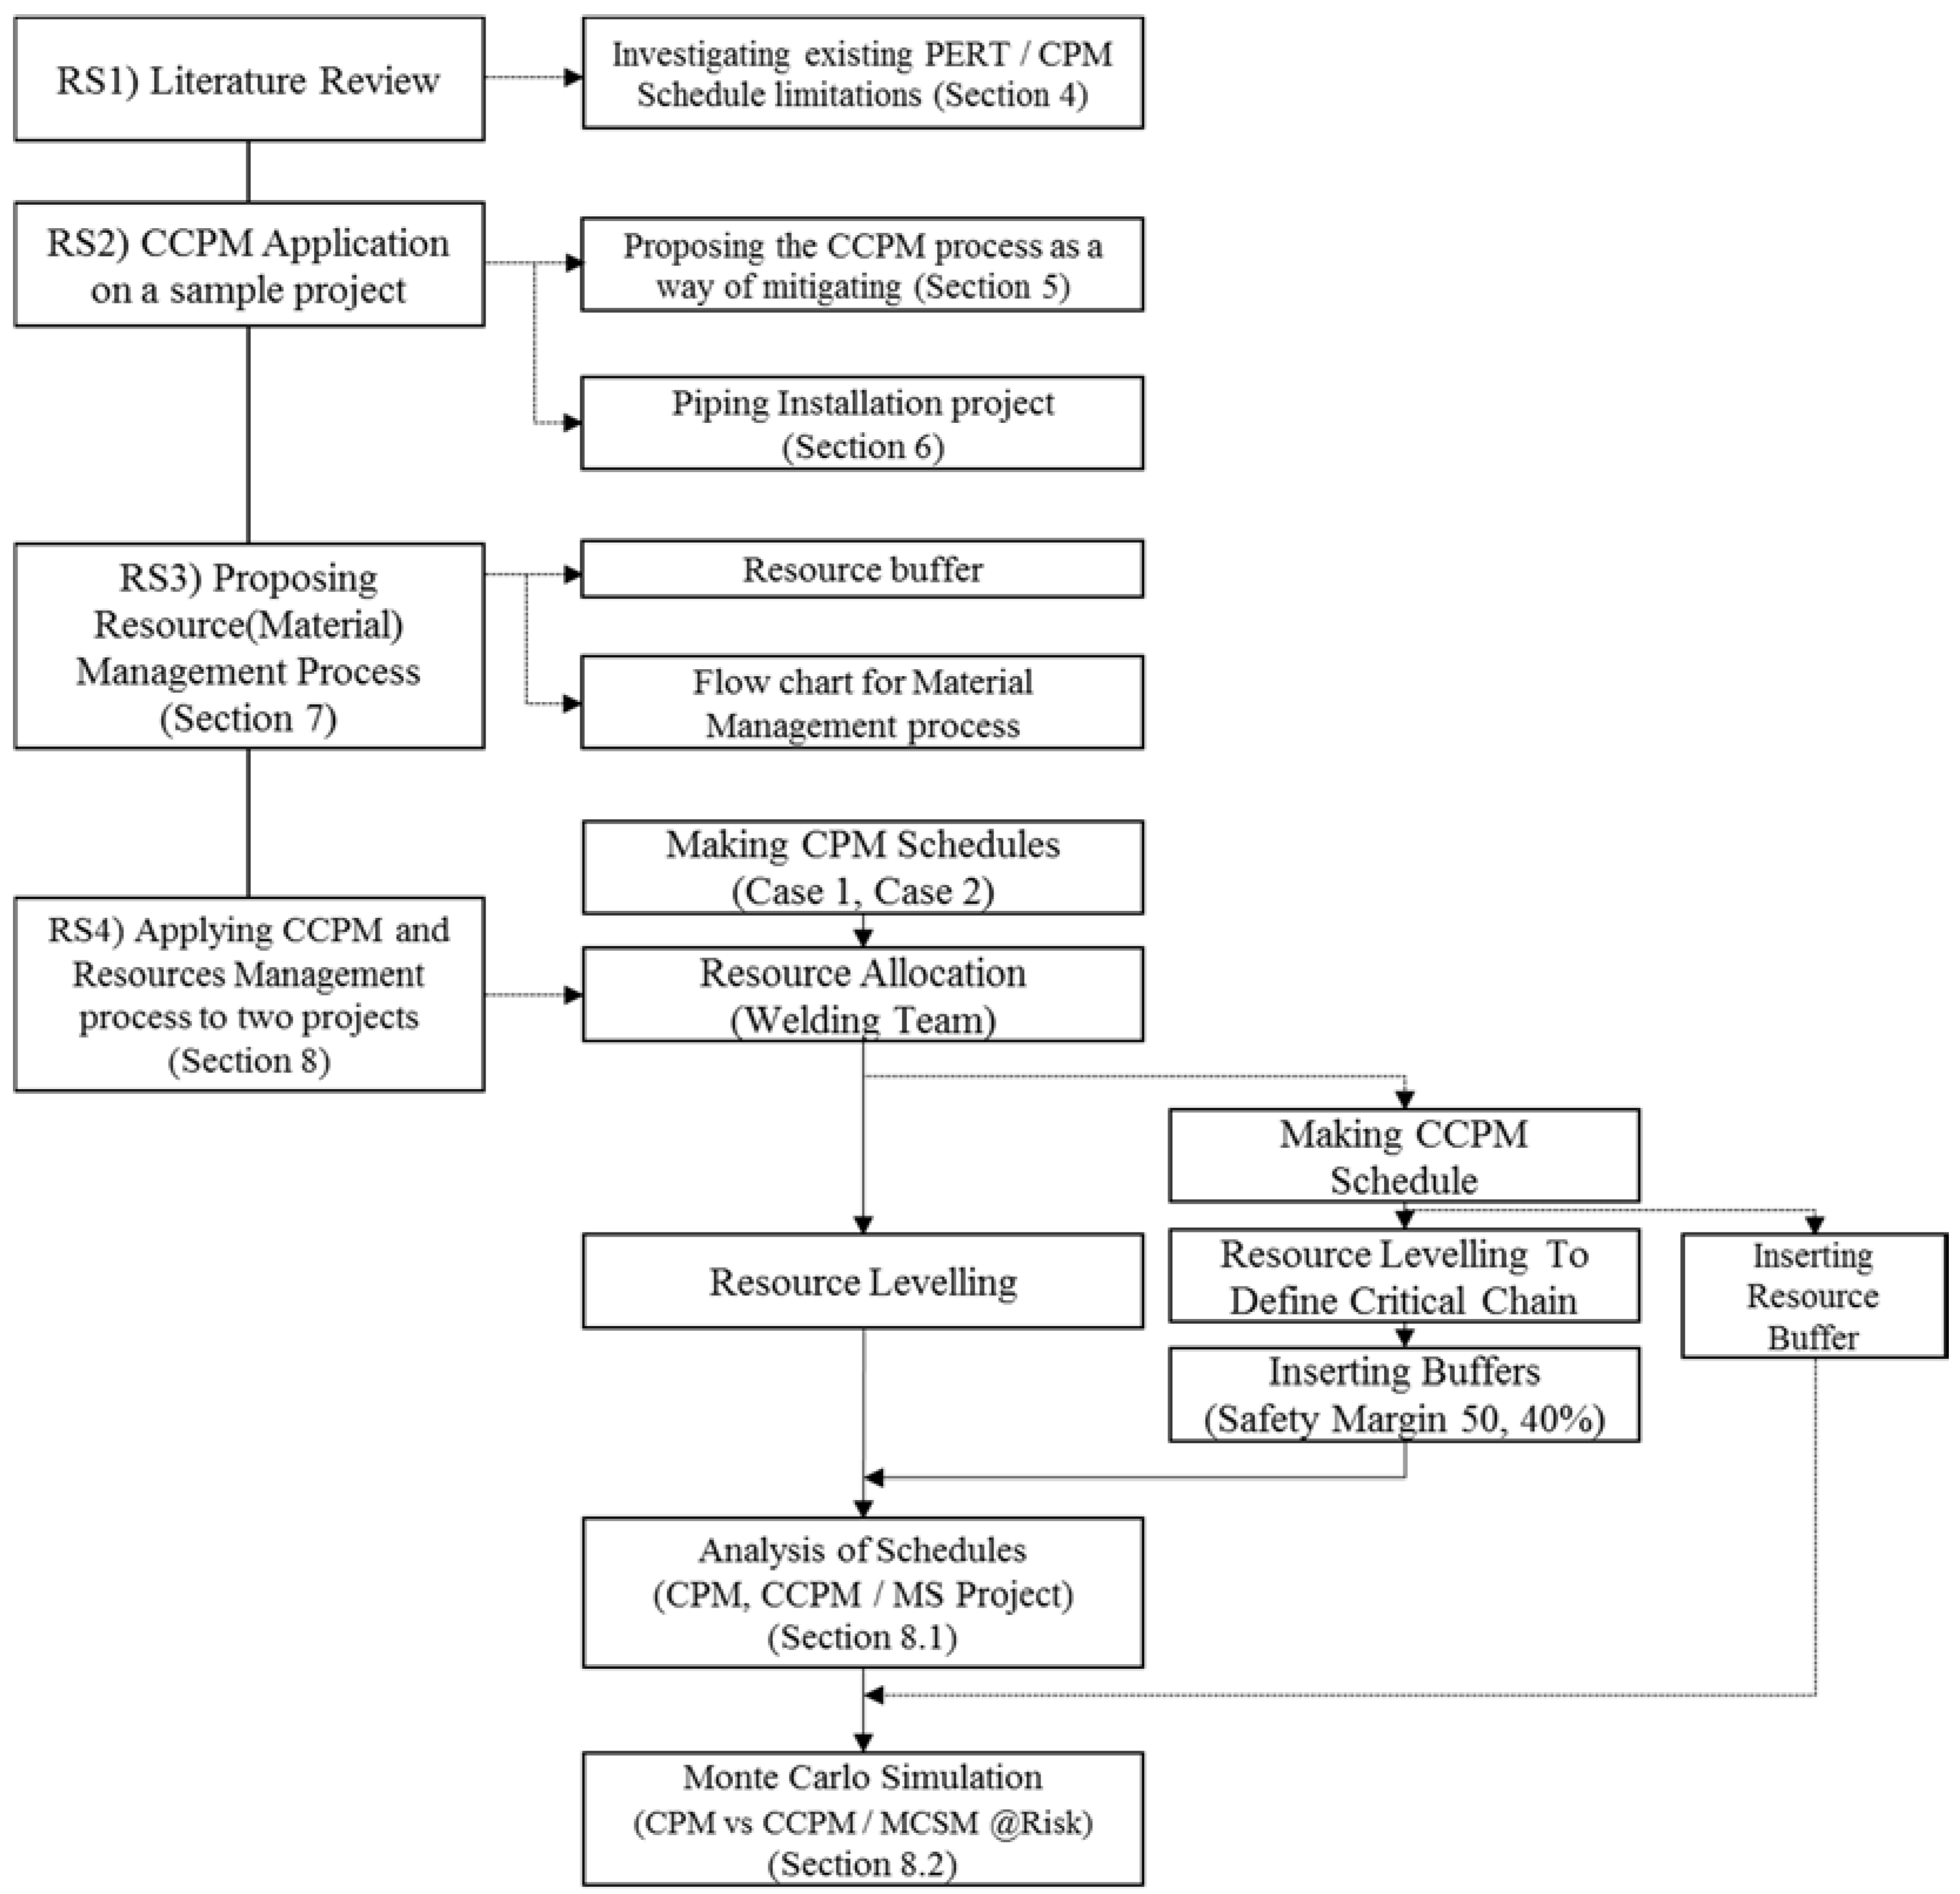
3. Novelties and Contribution

Previous studies verified that CCPM is applicable to real projects [14,15,16,17] and can be used to manage project schedules [18,19]. These studies focused on architecture and civil industries, but did not consider plant construction. Previous studies have introduced, evaluated, and developed the CCPM concept, but lack CCPM implementation within a realistic environment [17]. In addition, no previous research has presented CCPM for robust schedules or sufficiently discussed how cost and quality fluctuate with schedule management.
This paper adds to the general body of knowledge by presenting a CCPM process applied to a robust EPC plant project schedule such that can be used by practitioners in a real-world scenario. However, the major uniqueness of this study is that it manages to integrate a material resource management process into the CCPM process. This proposed process will allow project managers to check the availability of the piping materials needed for installation in advance to avoid delays. Through this process, piping materials are seen as a resource and any unintended absences’ schedule impacts are managed through a “resource buffer” flexibility. The proposed method’s superior performance (compared to traditional CPM without a material management process) is verified through Monte Carlo Simulations of a project case-study.
This study focuses on producing a superior schedule management process for field installation of piping units for plant construction projects, validated through an executed Korean EPC project. This analysis has been isolated to the construction portion of the project and has ignored the engineering and procurement schedule and cost impacts. This isolation allows a focused discussion on the different construction management techniques (PERT/CPM vs. CCPM), removing variables that are not the focus of this paper. (Although the procurement schedule is also not included in the PERT/CPM vs. CCPM analysis, its management is discussed through a separate process.) Below, the four research steps (RS) taken are described. These research steps are also illustrated in a box-flow in Figure 2.
(RS1)
Investigating existing PERT/CPM schedule limitations and Proposing the CCPM process as a way of mitigating limitations for PERT/CPM,
(RS2)
CCPM Application on a sample, theoretical piping installation project,
(a)
Propose the application step: CPM Schedule→Resource Allocation and Leveling→Creating Critical Chain Activities→Creating Buffers→Material Risk Management with Resource Buffer (details in Section 8).
(RS3)
Propose a supplemental resource management process for piping material risk analysis,
(a)
Identify the risk factors for project delay
(b)
Propose the way to insert the resource buffer as a schedule milestone
(c)
Propose the flow chart for material management process
(RS4)
Apply CCPM and resource management process to two processes (Crude Pump Unit and Propylene Compressor Unit) within a previously executed Middle Eastern Refinery Expansion Project (performed by Korean EPC), verifying:
(a)
Deterministic Schedule Analysis: CPM vs. CCPM applied resource management process using MS Project
(b)
Probabilistic Schedule Analysis: CPM vs. CCPM applied resource management process using @Risk (schedule risk simulation software, Palisade, Sydney, Australia) on a previously executed Korean projects.

4. Relevant Literature

Critical Chain Project Management is a method and collection of algorithms based on the Theory of Constraints (TOC). This theory is a management philosophy that proposes focusing on constraints is a better strategy to achieve the goal. The idea of CCPM was first introduced by Eliyahu M. Goldratt in 1997 [20]. After its introduction, many researchers have studied the efficacy of CCPM. Studies have included providing clarity on CCPM’s use [21], presenting advantages and disadvantages of the CCPM approach [22], comparing traditional and TOC project management processes [23], and proposing an enhanced framework combining Supply Chain Management (SCM) and CCPM to manage EPC project uncertainty [24]. Wang et al. proposed an improved CCPM framework that addressed two major challenges in CCPM-based scheduling such as buffer sizing and multiple resources leveling to enhance the implementation of CCPM. This study’s results displayed that performing multiple resources leveling in CCPM-based construction scheduling was both feasible and effective [25].
Although research in CCPM has been exhaustive, the systematic assessment of its performance within probabilistic schedules has been identified as a gap in the literature [26]. Specifically, no previous research has presented algorithms for robust schedules, sufficiently discussed how cost and quality fluctuate with schedule management, and/or were conceptual, lacking specific application. This paper seeks to bridge these gaps.
A subsection of CCPM, management of buffers, has also been studied. There exist general guidelines of managing buffer through the three layers (i.e., “OK”, “Watch”, and “Plan”) [27]. In addition, Lee [28] experimented how the duration and cost of a project fluctuated depending on how the three levels of buffer management were set up. Alternatively, Lee [14] studied how to set the levels of buffer management according to the project’s schedule margin. However, none reflect the characteristics of an EPC project.
As stated, a need was found in incorporating the material management procurement process into a scheduling process, currently missing in literature and industry. Several researchers have studied managing the procurement process through differing scheduling processes. Yeo and Ning proposed the enhanced framework for procurement by coupling the concepts of SCM and CCPM [24]. Bevilacqua developed a prioritization method for work packages, within the critical chain context to minimize the risks related to accidents in refinery plants [15]. Feng proposed a model with multi-resource constraints, which could be applied to the critical chain construction of the A-bid section in the South-to-North Water Diversion Project [18]. Dong attempted to apply the CCPM theory to the maintenance period arrangements of power plant electrical equipment, and a mathematical model of optimizing the maintenance period was established [19]. Jose Finocchio Jr. discussed the adequacy of the CCPM for scheduling projects involving shutdowns on an oil platform [29]. These findings were used as foundation for the scheduling portion of this research, but lack applicability to EPC mega-project procurement.
Previous studies, performed by practitioners, studied the relationship between PERT/CPM and CCPM in industry use. PERT/CPM and CCPM methodologies can coexist in project-based organizations [30] because “CPM employs one time estimate and one cost estimate for each activity; PERT may utilize three time estimates (optimistic, expected, and pessimistic) and no costs for each activity. Although these are distinct differences, the term PERT is applied increasingly to all critical path scheduling” [31]. Nowadays, PERT is commonly used in conjunction with the CPM, while PERT/CPM is the most widely used terminology for project management techniques. Even though PERT/CPM is the most widely used technique, many studies have shown it is lacking, containing fundamental limitations [32,33]. The most significant limitation of PERT/CPM is the inability to consider resource constraints and poor management of project uncertainty.
While PERT/CPM estimates an optimized schedule, the process only considers the work sequence and relations for planning the schedule, ignoring resources availability [11]. Resource optimization, such as resource leveling or resource smoothing, is a recommended scheduling practice to ensure resource availability is considered and is included in the CCPM process [11]. Alternatively, the traditional uncertainty management approach of PERT/CPM is also lacking. In this traditional process, schedulers create “safety time” or a “safety margin” to protect against project growth during execution caused by unknowns, often based on worst case scenarios [20]. This results in project uncertainties being “buried” and unrealistically long project durations [33]. The CCPM process includes separate buffer activities which are transparent safety margins allowing a more efficient schedule risk (safety margin) management process.
Researchers conclude that CCPM is superior in reliable planning and the execution process. CPM was found to offer no execution methodology, a fundamental limitation, and it is recommended that CPM should subordinate to CCPM during execution of the scheduling control [34]. CCPM also better manages limited essential resources (high-capacity lifting cranes, professional welders, piping fitters, etc.), experienced in recently EPC megaprojects in the middle east Asia. This is illustrated from the following quote, “CPM is as scheduling method to identify the shortest time a project could be accomplished assuming resources are Infinite, whereas CCPM is a method of planning and managing projects that put the main emphasis on the resources required to execute project tasks” This implies that CPM alone does not make sense for field resource allocations and supports this paper’s use of CCPM as a more applicable scheduling analysis tool for EPC megaprojects [30]. Goldratt [20] and others pointed out with rectifiable reasons that the reliance on CPM as the sole schedule planning methodology frequently causes projects to miss deadlines and commitments to stakeholders. A major risk omitted from mitigation in CPM is the contention for scarce resources [34].

5. RS1: CCPM Application

CCPM differs from PERT/CPM mainly due to its inclusion of resource dependencies and fixed nature during the project period [12]. CCPM improves the project plan by ensuring that it is feasible and immune from reasonable common cause variation such as uncertainty or statistical fluctuations [33]. As stated, CCPM is based on the TOC, in which there is always at least one constraint. In TOC, a focusing process is used to identify constraints and reorganize around said constraint to minimize impacts [20]. CCPM uses logical relationships and resource availability and ensures activities durations do not include safety margins. It also uses statistically determined buffers, aggregated safety margins of activities placed at strategic points on the project schedule path. This accounts for limited resources and project uncertainty, limitations of PERT/CPM as discussed above.
In conclusion, CCPM mitigates the CPM limitations in the following ways [12]:
(1)
Risk Management: Unexpected risks management and risk absorption with buffer management.
(2)
Focused Oversite: Management attention remains centralized on critical chain which is fixed.
(3)
Resource contention: The project duration is dependent on Resource Availability no later than the logical sequence of activities.

6. RS2: CCPM Application to Pipe Installation Works

The authors have chosen to apply CCPM on a sample piping installation project. To allow the reader a better understanding of the project, a brief description of activities, relations, durations, and basic scheduling follow. A sample piping field installation for plant construction project was developed with activities, relations, and general schedule seen below in Table 1. The case study in this paper basically uses “day” as the time unit for activity duration, according to a common industry practice for EPC projects. The critical path activity is activity Nos. 1→3→5→6 and the project duration is 18 days.
The project was then resource loaded for each resource for the sample project. Resource competition occurs for activity numbers 2, 3 and 4. Resource B is allocated to both activity numbers 2 and 3 from Day 3 to Day 6, and both activity numbers 3 and 4 from Day 7 to Day 8. Figure 3 depicts the weakness of the traditional scheduling method: the schedule cannot be realistically completed in 18 days due to the resource constraints. If this were at true error, the project schedule would be delayed due to poor schedule estimating techniques.
To solve the resource competition, the activity sequence is rearranged based on resource B. This results in increasing the project duration from 18 days to 20 days. After resolving the resource constraint, the critical path activity is revised to a critical chain activity, activity numbers 1→3→2→4→6.
Next, safety margins, or buffers, are introduced to the schedule. The estimation of the buffer size is dependent on each activity and its safety margin. To reduce the behaviors and time wasting associated with having excessive embedded safety, CCPM recommends that the task estimates are reduced by half the length of a “normal” duration [20]. To develop the buffer to be used for this research, this paper relies on the findings of previous studies. Many researchers estimated the project buffer as the 50% of a total sum of the 50% safety margin [13,16,28,35,36,37]. However, Lee [38] suggested that it is not reasonable to estimate the buffer to 50% of work duration and proposes 20% of work duration be applied by Monte Carlo simulation. Liu [39] insisted that the buffer should be estimated according to the worker’s ability and experience. Cho [40] argued that, when estimating the safety margin, the positive case in the 3-point estimation needs to be eliminated. Han [41] concluded that Many factors are considered when estimating a buffer.
For simplicity, and as this is common practice, the authors assume (as illustrates in Figure 4) that each activity has a 50% safety margin for the beginning, providing a project buffer of 50% of the total sum of the safety margin [20]. However, a project buffer with 40% or 30% of the total sum of the safety margin are compared when this process is applied to the project case study in Section 10. The critical chain activity is activity numbers 1→3→2→4→6 and the project duration is reduced to 15 days. The buffers include a feeding buffer (one day) and a project buffer (five days) (Figure 4).

7. RS3: CCPM Incorporating with Material Resource Management

Previous researchers concentrated on project buffer and feeding buffer size and there is a lack of investigations into the resource buffer [42]. Resource buffers have been treated only as a milestone activity notifying the start of successor activities. This leaves project managers at a disadvantage for managing this uncertainty and represents a gap in existing literature. Valikoniene proposed including resource buffers as time buffers with the assigned resources and cost, and concluded that “application of the resource buffers on average shortens project duration” [42]. In this study, resource buffers were created as a milestone activity for project schedule and it proposed the resource (material) management process is a flow chart. When simulating the projects for the case studies, the resource buffers are considered as time buffers with durations of 0–1.7 days. Concerning this gap in the literature, the checking and monitoring piping material availability is currently not supported by the CPM and CCPM processes used in practice. To fill this void, this study proposed a method to manage the materials related to the work activity from the concept of resource buffers. These resource buffers are inserted alongside the critical chain within the schedule to ensure that the appropriate people and skills are available to work as soon as needed [20]. Researchers suggested placing milestone activities in the CCPM schedule to indicate the timing for the delivery. However, supplementary to the schedule management, the practitioner should use the resource management process presented within this paper.
The resource management process proposed is depicted in Figure 5 as a flow chart. As can be seen, this process is complex and requires collaboration and efficient communication between the project manager (reviewing milestone schedules), material manager (monitoring piping availability and source of replenishment), and construction manager (controlling resource use and allocation within the work sequence).
Many factors can contribute to a delay in the availability of piping material, and the solution differs depending on the case. In a previous study, the risk factors contributing to the material issue for the plant construction project were presented. Kim, Yong-Su, Hwang, Moon-Hwan, Park, and Chan-Sik indicated the most common reason for delay is mobilization of workers, which accounts for 25% of project delays. They went on to account 13% of delays due to lack of project planning accounts, 11% of delays due to a delay in arrival of material, 2% of delays due to equipment mobilization and lack of qualified workers each [43]. Kim [44] insisted that the risks of design change and additional works have a significant impact on project duration. Kang [45] indicated that a delay of material procurement and logistics as well as a design change while construction work is in progress are the major factors for project delay.

8. RS4: Case Study of CCPM Application with Material Resource Management

The purpose of this section is to validate the application of the CCPM on the piping field installation work for a plant construction project. The following shows the project outline and piping unit information for the case study, which was recently completed. Table 2 depicts the work quantities for each case described below.
  • Project Name: Refinery Expansion Project (Middle East)
  • Contractor: D Company
  • Project Duration: 50 Months
  • Unit: Crude Pump Unit (CPU)/Propylene Compressor Unit (PCU)
  • Discipline: Piping Field Installation
CPU (Case 1): The function of the Crude Pump Unit (CPU) is to transport the crude oil to the storage tank. It consists of three pumps that have suction, discharge, and min. flow lines. Diameter inch (DI) is the unit of measurement for pipe welds. If a particular spool has five joints of 6” diameter, the total DI for the pipe welds is 30 DI (6” × 5 joints = 30 DI).
PCU (Case 2): The function of the Propylene Compressor Unit (PCU) is to compress the propylene gas to transform it into a liquid state to minimize the propylene gas loss and increase the efficiency of the refinery. The unit consists of one compressor unit with three suction lines and one discharge line.

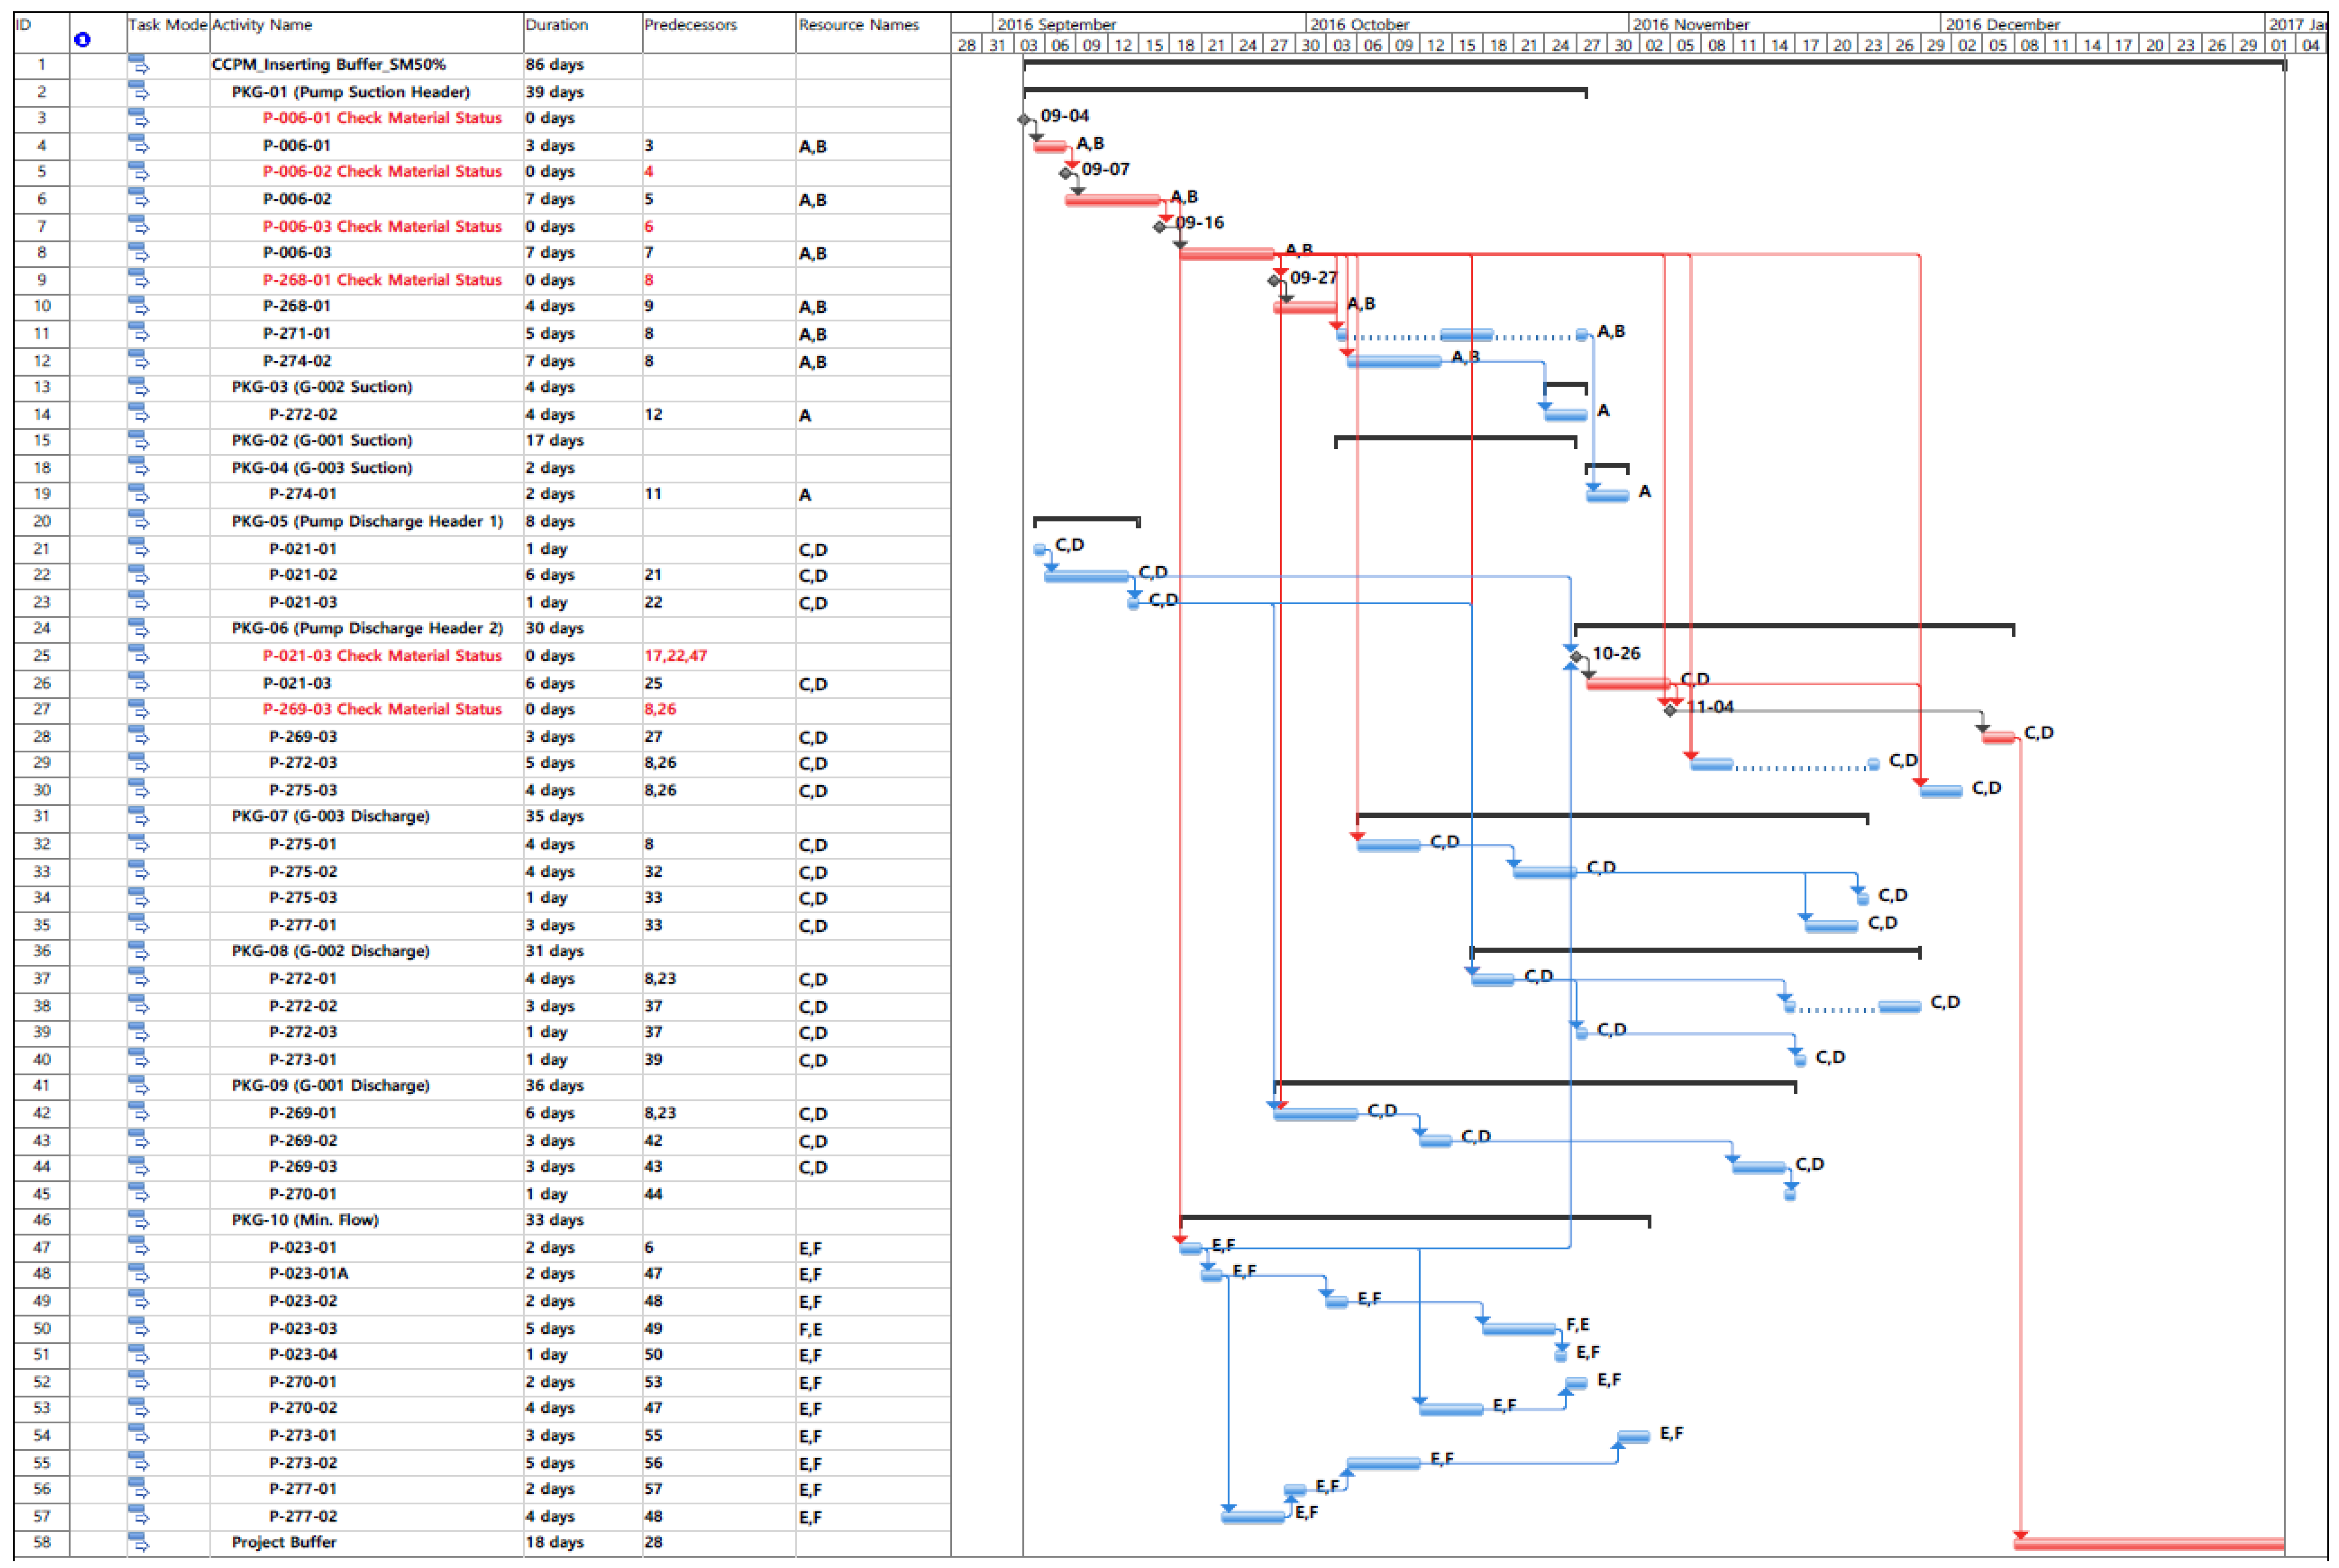
8.1. Deterministic Schedule Analysis: CPM vs. CCPM

To prepare a schedule, the following condition is assumed in this study:
(1)
The schedule is limited to the field welding for piping work.
(2)
The resources are welding teams (other resources such as cranes, loaders, operators, painting crews, insulation crews, etc. are not considered.)
(3)
The day productivity is 8 DI/welder. Available resources are six welding teams for crude pump unit and four teams for propylene compressor unit.
(4)
Piping welding is conducted by piping work package based on the isometric drawings.
(5)
The work sequence requires the pump and header line to be welded first followed by the branch lines due to the space constraint.
Table 3 and Table 4 indicate the package number, isometric drawing number, work sequence, work quantity, resource allocation (welding team), and work duration for the crude pump unit and propylene compressor unit.
As stated, in preparing the CCPM schedule, resource leveling and buffer creations are performed. Since resource leveling was performed when making the CPM schedule, the buffers can now be created and inserted into the CCPM schedule. In this study, the safety margins are assigned differently based on the activity, resource, and project, so the safety margin is set as three cases of 50%, 40%, and 30%. Table 3 and Table 4 summarize the inputs setting for CCPM simulation. After creating the project buffer, feeding buffer, and resource buffer, they are incorporated into the CCPM schedule, as shown in Figure 6 and Figure 7 for the crude pump unit and propylene compressor unit, respectively.
Table 5 shows a comparison of the CPM Schedule and the CCPM Schedule with a 50% safety margin. The units differ for the critical path (critical chain) activity and project duration. Critical Path for CPU-Case 1 is: Activity Nos. 2→3→4→5→11→19→21, while critical chain is: Activity Nos. 2→3→4→5→11→19→20. This is the result from the resource leveling. Critical chain for PCU-Case 2 is also different with critical path due to resource leveling. Applying CCPM to the project reduces the overall project duration by about 48 days from 134 days to 86 days for CPU-Case 1 and by about nine days from 76 days to 67 days for PCU-Case 2.
However, setting the safety margin at 50% for all projects would be impractical. To check the sensitivity due to the safety margin, a CCPM schedule was prepared in this study and 40% and 30% safety margins were applied for both units (Table 6).
With a smaller safety margin, the CCPM-predicted project duration increased, although it is still shorter than the CPM project duration. In the case of the crude pump unit, the project duration of CPM is 134 days. However, the project duration of CCPM with a 30% safety margin is 97 days including 15 days of buffers. For the propylene compressor unit, while the project duration in both CPM and CCPM with a 30% safety margin is 76 days, CCPM has a 12-day project buffer. For both projects, CCPM is more capable of reducing the project duration even when applying a 30% safety margin.

8.2. Case Studies for Probabilistic Simulation; CPM vs. CCPM

In this study, the Monte Carlo Simulation Model (MCSM) and @Risk Program (schedule risk simulation SW) are used for validating the project duration. The simulation procedure for the piping installation work is as follows:
  • Developing Model: Create the schedule using MS Project (network diagram).
  • Defining Parameter: Define the piping installation work and input the project duration (parameter).
  • Defining Uncertainty: Define the PERT distribution (three-point estimation) for each activity duration.
  • Simulation: Check and analyze the total project duration.
The simulation is conducted 1000 times with random input and confidence of 85%. The project buffer is considered a fixed value as it is calculated from the project duration. Each activity is applied to PERT distribution (three-point estimating), a probabilistic distribution function, and each three have different values: minimum, most likely, and maximum. For the CCPM, the three cases of maximum value are 30%, 40%, and 50% followed by the safety margin proposition. For both CPM and CCPM, the minimum value is −10% and the most likely value is the project duration by the MS Project.
The resource buffer is presented as a milestone in the project schedule, so it has no duration and does not affect the schedule. In field application, the resources would be delayed for various reasons. The resource buffer is therefore considered a parameter. It could have a three-point distribution as a beta-distribution (i.e., most likely, pessimistic (min), and optimistic (max)). For example, each resource buffer has the most likely case of 1 day, a minimum value of 0 days (no delay), and a maximum value of 1.7 days, which is calculated based on the sum of all resource buffers being less than the sum of all project buffers. Figure 8 and Figure 9 show the results of CCPM simulation.

8.3. Comparison of Analysis Results—Probabilistic Simulations

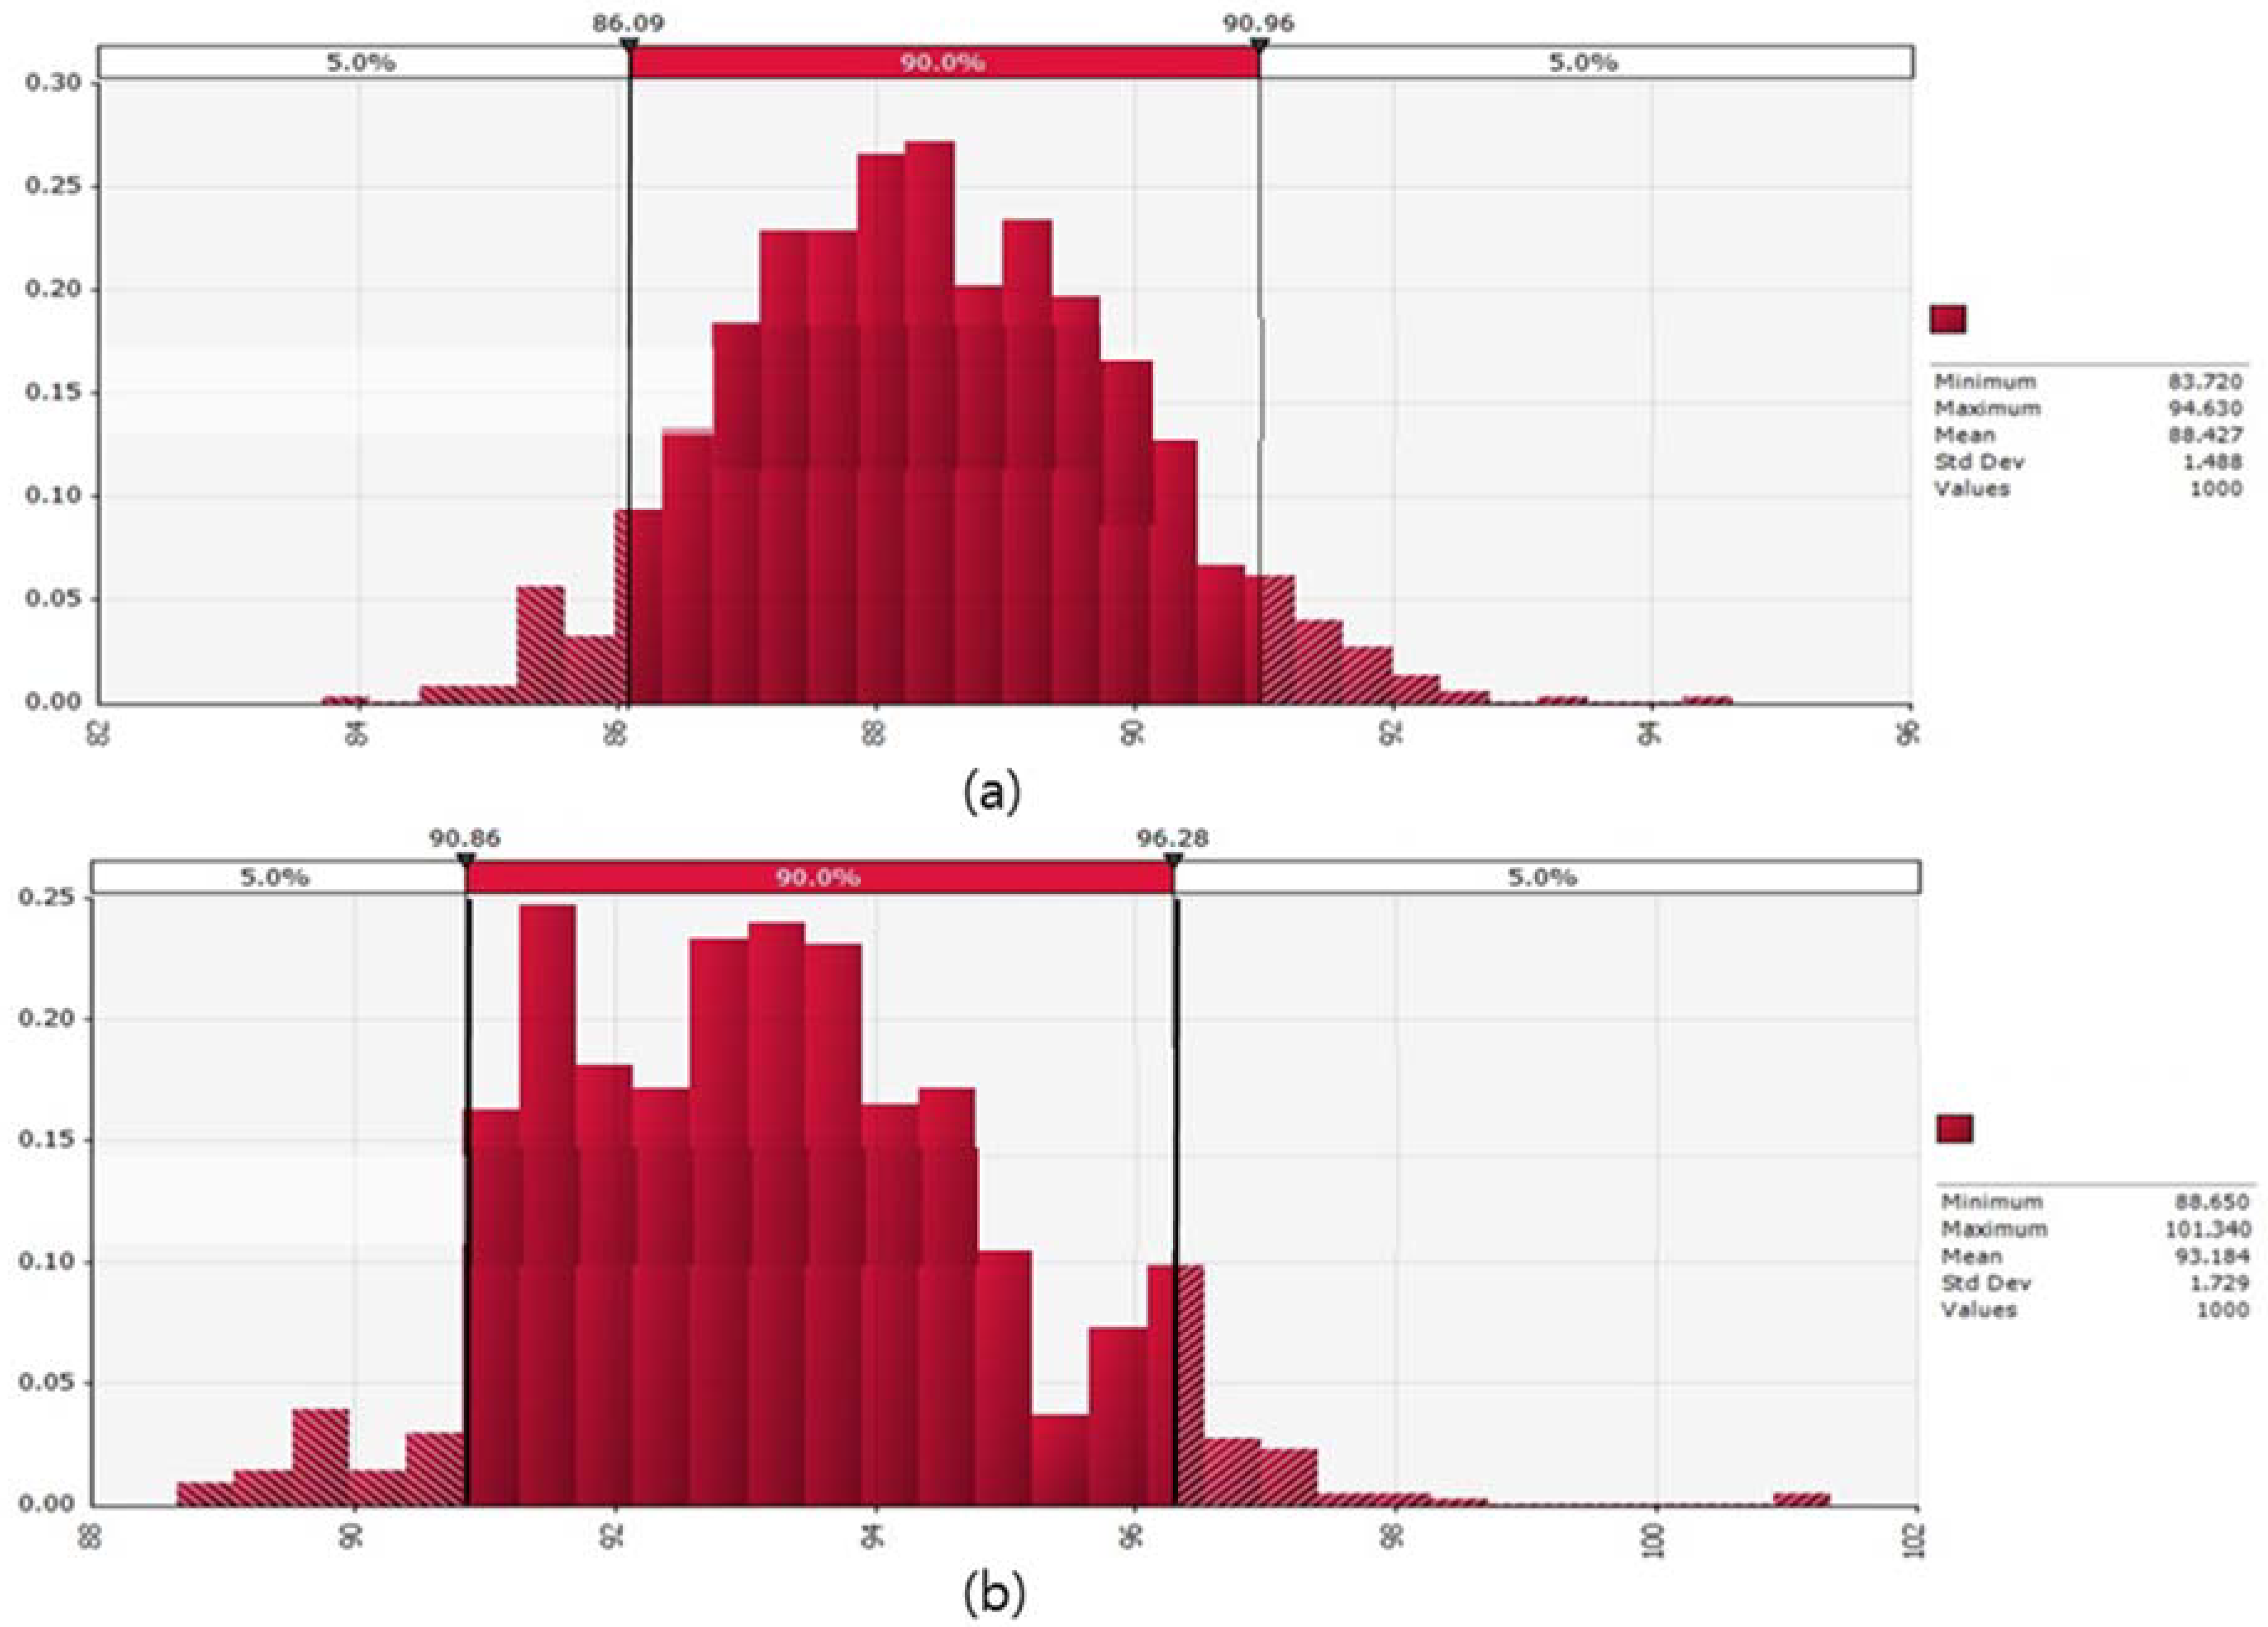
8.3.1. CPM vs. CCPM without Resource Buffer

The summary of the simulation results between CPM and CCPM with various safety margins is shown in Table 7. In the case of the Crude Pump Unit (CPU-Case 1), the result indicates that the CPM project duration would have a range of 134 to 152 days. The project duration range of CCPM with a safety margin 30% is 95 days to 103 days. The CPM project duration from @Risk with 85% confidence is 146 days, while it is 101 days for CCPM (SM 30%). As confirmed at the deterministic schedule analysis (Section 8.1), CCPM is capable of shortening the project duration from 146 days to 101 days at 85% confidence in the probabilistic schedule analysis as well. CCPM, moreover, clearly indicates the project buffer to response to the project risk, while CPM could not present the project buffer. Comparing the project duration between deterministic and probabilistic analysis, the project duration of CPM increases from 134 days to 146 days (difference: 12 days) at 85% confidence, while CCPM (SM 30%) is from 97 days to 101 days (difference: four days only) at 85% confidence. These results ensure that CCPM is more stable than CPM and has the benefit of reducing the project duration. For applying the safety margin, as safety margin decreases from 50% to 30%, the project buffer is also reduced from 18 days to 12 days and the project durations are increased for both deterministic analysis (from 86 days to 97 days) and probabilistic analysis (from 91 days to 101 days). When it comes to the size of the project buffer, CCPM with SM 30% is still valid against CPM. In the case of Propylene Compressor Unit (PCU-Case 2), the same results are observed.

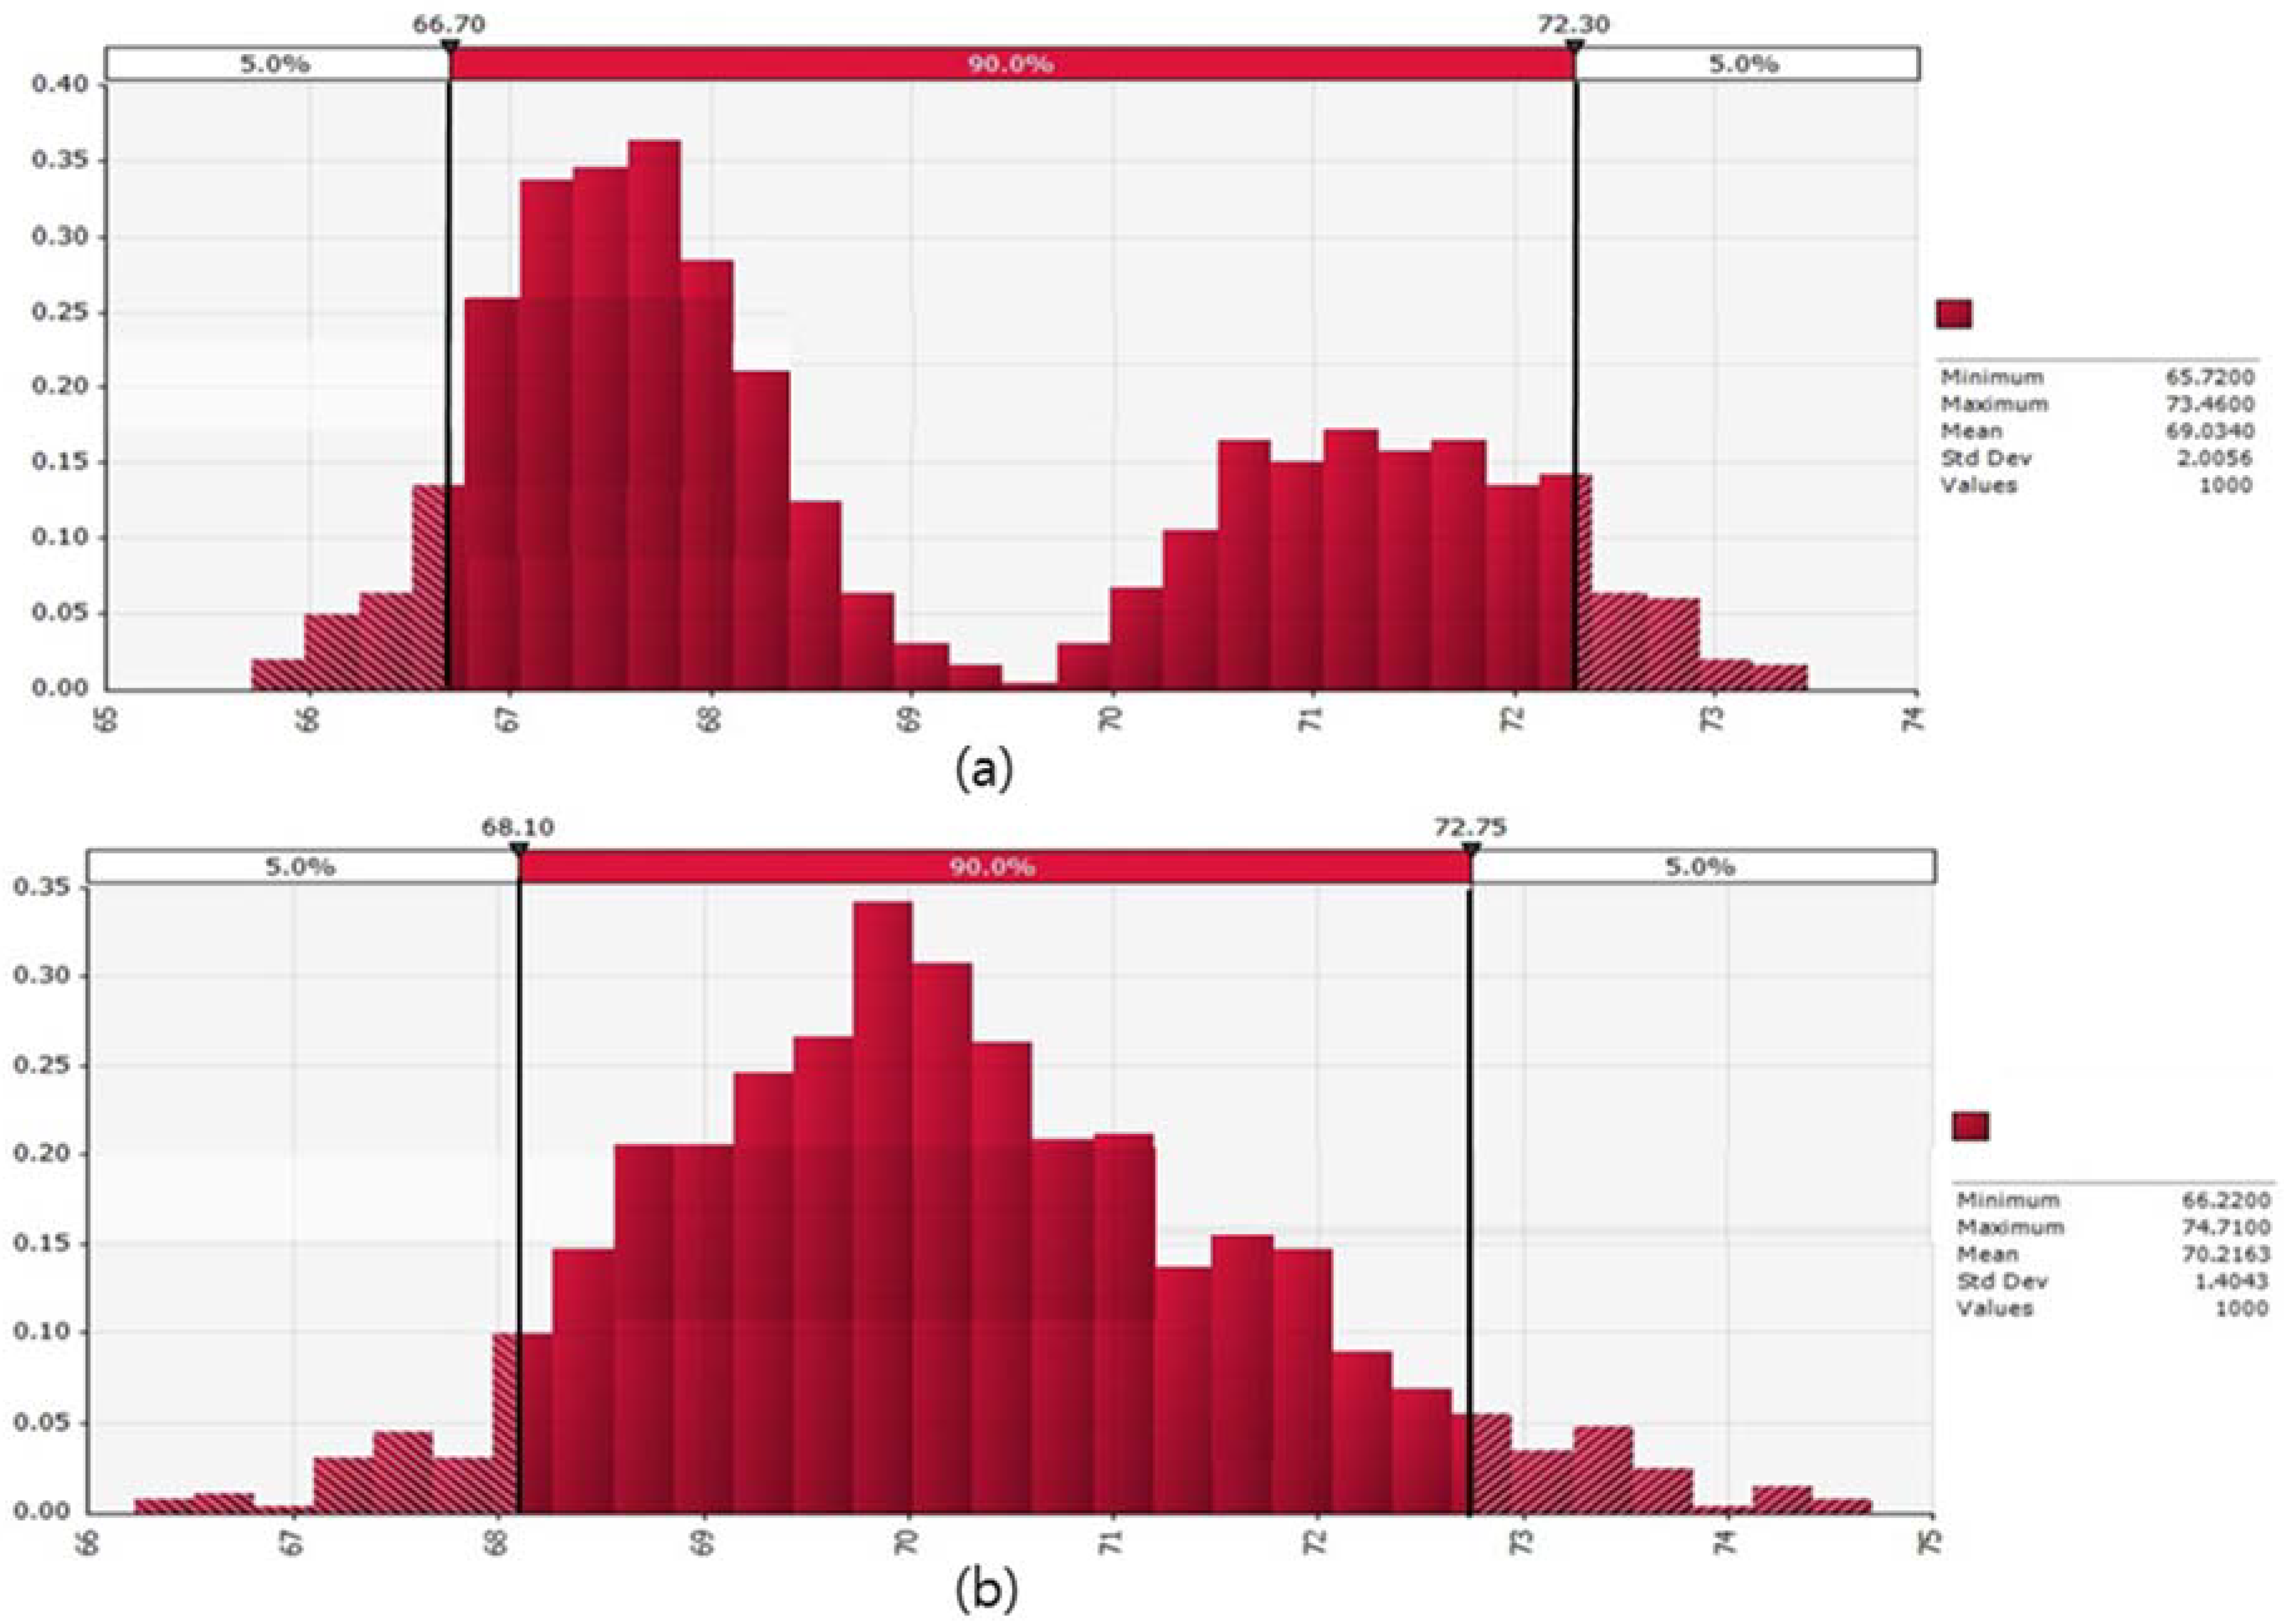
8.3.2. CPM vs. CCPM with Resource Buffer

This paper has claimed that the resource buffer is a greatly underutilized tool. To test its efficacy, a simulation is performed on the CCPM schedule in which the resource (material) buffer is considered. The findings are presented in Table 8. The duration of the resource buffers was determined to be 0–1.7 days for the PERT distribution. As can be seen, applying the resource buffer increases the project duration (comparing Table 7 to Table 8 findings). For example, Table 7 shows the CCPM (SM 50%) duration as 91 days (85% confidence), while Table 7 depicts 96 days for CCPM (SM 50%) with the resource buffer. Similar findings can be finding when comparing all SMs amongst the two Case Studies.
These findings illustrate that, without a resource buffer, projects are more likely to have extended schedules due to not adequately taking into account potential delivery delays. For example, when using a SM of 50%, the Crude Pump duration of 91 days includes no delivery delays. This means that when a delivery delay occurs, the project manager will likely have to pull from the project buffer “fund” which is likely allocated to other risks. Alternatively, the project manager using data from Table 8 will be better prepared to handle delivery delays and less likely to have schedule delays due to said delivery delays (as the project includes contingency for such an event).
It is also interesting to note that the project durations when applying CCPM with resource buffers are less than those of CPM. For example, in the case of CPU-Case 1, the project duration for CCPM (SM 30%) is 106 days at 85% confidence, while the project duration for CPM is 146 days. Although the CPM schedule will have ample float, it will likely be less efficient and/or result in the bidder not being competitive.

9. Conclusions

Through an investigation of scheduling of a crude pump unit and propylene compressor unit, it was found that the traditional PERT/CPM scheduling method may be prone to overestimating project durations (~35% increase of duration when compared to the CCPM method in this study). Alternatively, excluding material uncertainty (represented by the resource buffer) in schedule development, a project has a greater potential for schedule growth due to improper risk preparedness (5% schedule growth potential found in this study). In summary, this paper finds that the CCPM scheduling technique, when coupled with adequate use of resource buffers and a procurement management process, is more apt at effectively and efficiently managing a project’s risks.
The impacts of resource buffer on project duration are lacking in the literature. As such, the results of this paper represent an addition to the existing body of knowledge. Furthermore, this study provides practitioners a useful platform to manage piping installation work, eliminate project duration extension, and enable project teams to effectively manage limited human and material resources using the buffer management and material management processes.

10. Recommendations for Future Research

This study was conducted for piping field installation work for an EPC plant project. It was demonstrated that construction scheduling needs to be expanded to engineering and procurement scheduling. A method of estimating the buffer size needs to be developed and validated, such as project buffer, feeding buffer, and resource buffer, which is more reliable and realistic. While this study only considered the labor resource (welder), for the further study, additional resources such as equipment, scaffolding, etc. will be considered. The case study in this paper used “day” as the time unit basically (although it incorporated decimal points of project buffers), according to a common industry practice. Using “hour” time unit in the CCPM analysis might have some advantages (namely more precision to better present the sensitivity of resource allocations), which might be covered in future research.

Author Contributions

Sung-Hwan Jo developed the concept and drafted the manuscript based on the analysis. Kyoung-Youl Pyo verified the analysis and revised the manuscript. Eul-Bum Lee set up the study directions and supervised the overall work. All of the authors read and approved the final manuscript.

Acknowledgments

This work was supported by the Technology Innovation Program (10077606, To Develop an Intelligent Integrated Management Support System for Engineering Project) funded By the Ministry of Trade, Industry & Energy (MOTIE), Korea. The authors would like to thank D.S. Alleman (a Ph.D. candidate in University of Colorado—Boulder) for his industry feedback on this CCPM research.

Conflicts of Interest

The authors declare no conflict of interest.

Abbreviations

CCPMCritical Chain Path Method
EPCEngineering Procurement Construction
PERTProgram Evaluation and Review Technique
CPMCritical Path Method
TOCTheory of Constraints
ETAEstimated Time of Arrival
P-I MatrixProbability-Impact matrix
DIDiameter Inch
BLBranch Line

References

  1. CERIK. Construction Trend Monthly Briefing; Korean Construction and Economy Research Institute of Korea (CERIK): Seoul, Korea, 2018. [Google Scholar]
  2. Ahn, B. Managing the Efficiency of Foreign Engineering Contracts: A Study of a Norwegian and South Korean Project Interface; University of Stavanger: Stavanger, Norway, 2015. [Google Scholar]
  3. Tanmay. Oil & Gas EPC Market Perspective and Comprehensive Analysis to 2023. 2018. Available online: https://theexpertconsulting.com/oil-gas-epc-market-perspective-and-comprehensive-analysis-to-2023/ (accessed on 20 May 2018).
  4. National Contractors Association of Korea. Statistics on Overseas Construction Contracts Amount; National Contractors Association of Korea: Seoul, Korea, 2018; Available online: http://www.icak.or.kr/reg/login.php?s_url=L3BsdC9wbHRfc3RhMDQucGhwP2ZfZGF0ZT0xOTY5LzAxLzAxJnRfZGF0ZT0yMDE4LzA1LzIxJnJfY29kZT0= (accessed on 20 May 2018).
  5. McNair, D. EPC Contracts in the Process Plant Sector; Asia Pacific Projects Update; DLA Piper: London, UK, 2011. [Google Scholar]
  6. Blankenbaker, E.K. Construction and Building Technology; Goodheart-Willcox: Tinley Park, IL, USA, 2013. [Google Scholar]
  7. Tommelein, I.D. Pull-driven scheduling for pipe-spool installation: Simulation of lean construction technique. J. Constr. Eng. Manag. 1998, 124, 279–288. [Google Scholar] [CrossRef]
  8. Dilmaghani, F. Critical Chain Project Management (CCPM) at Bosch Security Systems (CCTV) Eindhoven: A Survey to Explore Improvement Opportunities in the Scheduling and Monitoring of Product Development Projects; University of Twente: Enschede, Netherlands, 2008. [Google Scholar]
  9. Newbold, R.C. Project Management in the Fast Lane: Applying the Theory of Constraints; CRC Press: Boca Raton, FL, USA, 1998. [Google Scholar]
  10. Tukel, O.I.; Rom, W.O.; Eksioglu, S.D. An investigation of buffer sizing techniques in critical chain scheduling. Eur. J. Oper. Res. 2006, 172, 401–416. [Google Scholar] [CrossRef]
  11. PMI. PMBOK® Guide, 6th ed.; PMI (Project Management Institute): Newton Square, PA, USA, 2017. [Google Scholar]
  12. PMI. Practice Standard for Scheduling, 2nd ed.; PMI (Project Management Institute): Newton Square, PA, USA, 2017. [Google Scholar]
  13. Kim, K.H. A Study on the Application of TOC Critical Chain Project Management; National Contractors Association of Korea: Kwang-Ju, Korea, 2004. [Google Scholar]
  14. Lee, K.C. A Study of CCPM Improvement on Shipbuilding Industry; Pusan National University: Busan, Korea, 2013. [Google Scholar]
  15. Bevilacqua, M.; Ciarapica, F.; Giacchetta, G. Critical chain and risk analysis applied to high-risk industry maintenance: A case study. Int. J. Proj. Manag. 2009, 27, 419–432. [Google Scholar] [CrossRef]
  16. Ha, B.G. The Application of CCPM (Critical Chain Project Management) for Schedule Management in Construction Projects; Dongwi-Univ.: Pusan, Korea, 2010. [Google Scholar]
  17. Grant, K.P.; Marton, G. Critical chain project management: Under investigation or case closed? In Proceedings of the PMI® Research and Education Conference, Limerick, Ireland, 15–18 July 2012. [Google Scholar]
  18. Feng, J.-C.; Li, L.; Yang, N.; Hong, Y.-Z.; Pang, M.; Yao, X.; Wang, L.-C. Critical chain construction with multi-resource constraints based on portfolio technology in South-to-North Water Diversion Project. Water Sci. Eng. 2011, 4, 225–236. [Google Scholar]
  19. Dong, L.; Zhao, X.K.; Zhou, W.P.; Lv, Q. Application of Critical Chain Project Scheduling Theory in Power Plant Electrical Equipment Maintenance. In Proceedings of the Advanced Materials Research, Lulea, Sweden, 21–22 March 2013; pp. 1985–1989. [Google Scholar]
  20. Goldratt, E. Critical Chain; The North River Press Publishing Corporation: Great Barrington, MA, USA, 1997. [Google Scholar]
  21. Steyn, H. An investigation into the fundamentals of critical chain project scheduling. Int. J. Proj. Manag. 2001, 19, 363–369. [Google Scholar] [CrossRef]
  22. Herroelen, W.; Leus, R. On the merits and pitfalls of critical chain scheduling. J. Oper. Manag. 2001, 19, 559–577. [Google Scholar] [CrossRef]
  23. Wei, C.-C.; Liu, P.-H.; Tsai, Y.-C. Resource-constrained project management using enhanced theory of constraint. Int. J. Proj. Manag. 2002, 20, 561–567. [Google Scholar] [CrossRef]
  24. Yeo, K.; Ning, J. Integrating supply chain and critical chain concepts in engineer-procure-construct (EPC) projects. Int. J. Proj. Manag. 2002, 20, 253–262. [Google Scholar] [CrossRef]
  25. Ma, G.; Wang, A.; Li, N.; Gu, L.; Ai, Q. Improved critical chain project management framework for scheduling construction projects. J. Constr. Eng. Manag. 2014, 140. [Google Scholar] [CrossRef]
  26. Su, Y.; Lucko, G.; Thompson, R.C., Jr. Evaluating performance of critical chain project management to mitigate delays based on different schedule network complexities. In Proceedings of the 2016 Winter Simulation Conference, Washington, DC, USA, 11–14 December 2016; pp. 3314–3324. [Google Scholar]
  27. Patric, F. Critical Chain Scheduling and Buffer Management…. In Proceedings of the Project Management Institute, Philadelphia, PA, USA, 10–16 October 1999. [Google Scholar]
  28. Lee, D.G. A Study on the Buffer Management of Critical Chain Project Management; Ulsan-University: Ulsan, Korea, 2002. [Google Scholar]
  29. Junior, J.F.; Martins, M.R. Offshore Platform Turn around Using the Critical Chain Project Management Method (CCPM). In Proceedings of the ASME 2009 28th International Conference on Ocean, Offshore and Arctic Engineering, Honolulu, HI, USA, 31 May–5 June 2009; pp. 479–485. [Google Scholar]
  30. Critical Chain and Critical Path, Can They Coexist? 2018. Available online: http://3escp33iuwsj485tugc1mb91.wpengine.netdna-cdn.com/wp-content/uploads/bsk-pdf-manager/2016/02/CPM-and-CCPM-a-Compare-and-Contrast-Pinnacle-Strategies.pdf (accessed on 20 May 2018).
  31. Brennan, M. PERT and CPM: A Selected Bibliography; Council of Planning Librarians: Chicago, IL, USA, 1968. [Google Scholar]
  32. Shin, K.Y. A Study on the Method of Applying CCPM to Shipbuilding Industry; Pusan University: Pusan, Korea, 2009. [Google Scholar]
  33. Leach, L.P. Critical chain project management improves project performance. Proj. Manag. J. 1999, 30, 39–51. [Google Scholar]
  34. Bagchi, T.P.; Sahu, K.; Jena, B.K. Why CPM Is Not Good Enough for Scheduling Projects. In Proceedings of the 2017 IEEE International Conference on Industrial Engineering and Engineering Management (IEEM), Singapore, 10–13 December 2017. [Google Scholar]
  35. Im, H.M. A Study on Schedule Management in Construction Projects by CCPM; Pukyeong Univ.: Pusan, Korea, 2003. [Google Scholar]
  36. Kim, Y.M. Application of Critical Chain Technique in Project-Type Contract Production Environment; Pukyeong-Univ.: Pusan, Korea, 2005. [Google Scholar]
  37. Kim, O.S. Optimal Schedule Selection by CCPM on Project Planning Phase; Pukyeong-Univ.: Pusan, Korea, 2003. [Google Scholar]
  38. Lee, M.R. (A) Study on the Project Buffer Set-up Methodology of Critical Chain Project Management: Small Manufacturing Project; Hanyang-University: Seoul, Korea, 2012. [Google Scholar]
  39. Liu, J. A Study on the Buffer Sizing Method of CCPM Technique; Kachon University: Seongnam, Korea, 2012. [Google Scholar]
  40. Cho, J.S. A Study on Project Schedule Management System Modeling for Small Scale IT Companies; Ulsan-University: Ulsan, Korea, 2009. [Google Scholar]
  41. Han, H.D. Study on Practical Application of Critical Chain Project Management; Soongsil-University: Seoul, Korea, 2006. [Google Scholar]
  42. Valikoniene, L. Resource Buffers in Critical Chain Project Management; University of Manchester: Manchester, UK, 2015. [Google Scholar]
  43. Kim, Y.-S.; Hwange, M.-H.; Park, C.-S. A study on the present status and problem analysis of construction process management in domestic building construction sites. J. Architect. Inst. Korea 1996, 12, 253–264. [Google Scholar]
  44. Kim, J.W.; Lee, J.-H. Identifying Risks of Power Plant EPC Business in the Middle East and Analyzing Their Priority by the AHP. Plant J. 2015, 11, 32–46. [Google Scholar]
  45. W., K.H. A Case Study on the Analysis of Maintenance Costs though the Estimation of Elemental Costs for Educational Buildings; ChungAng-Universtiy: Seoul, Korea, 2009. [Google Scholar]
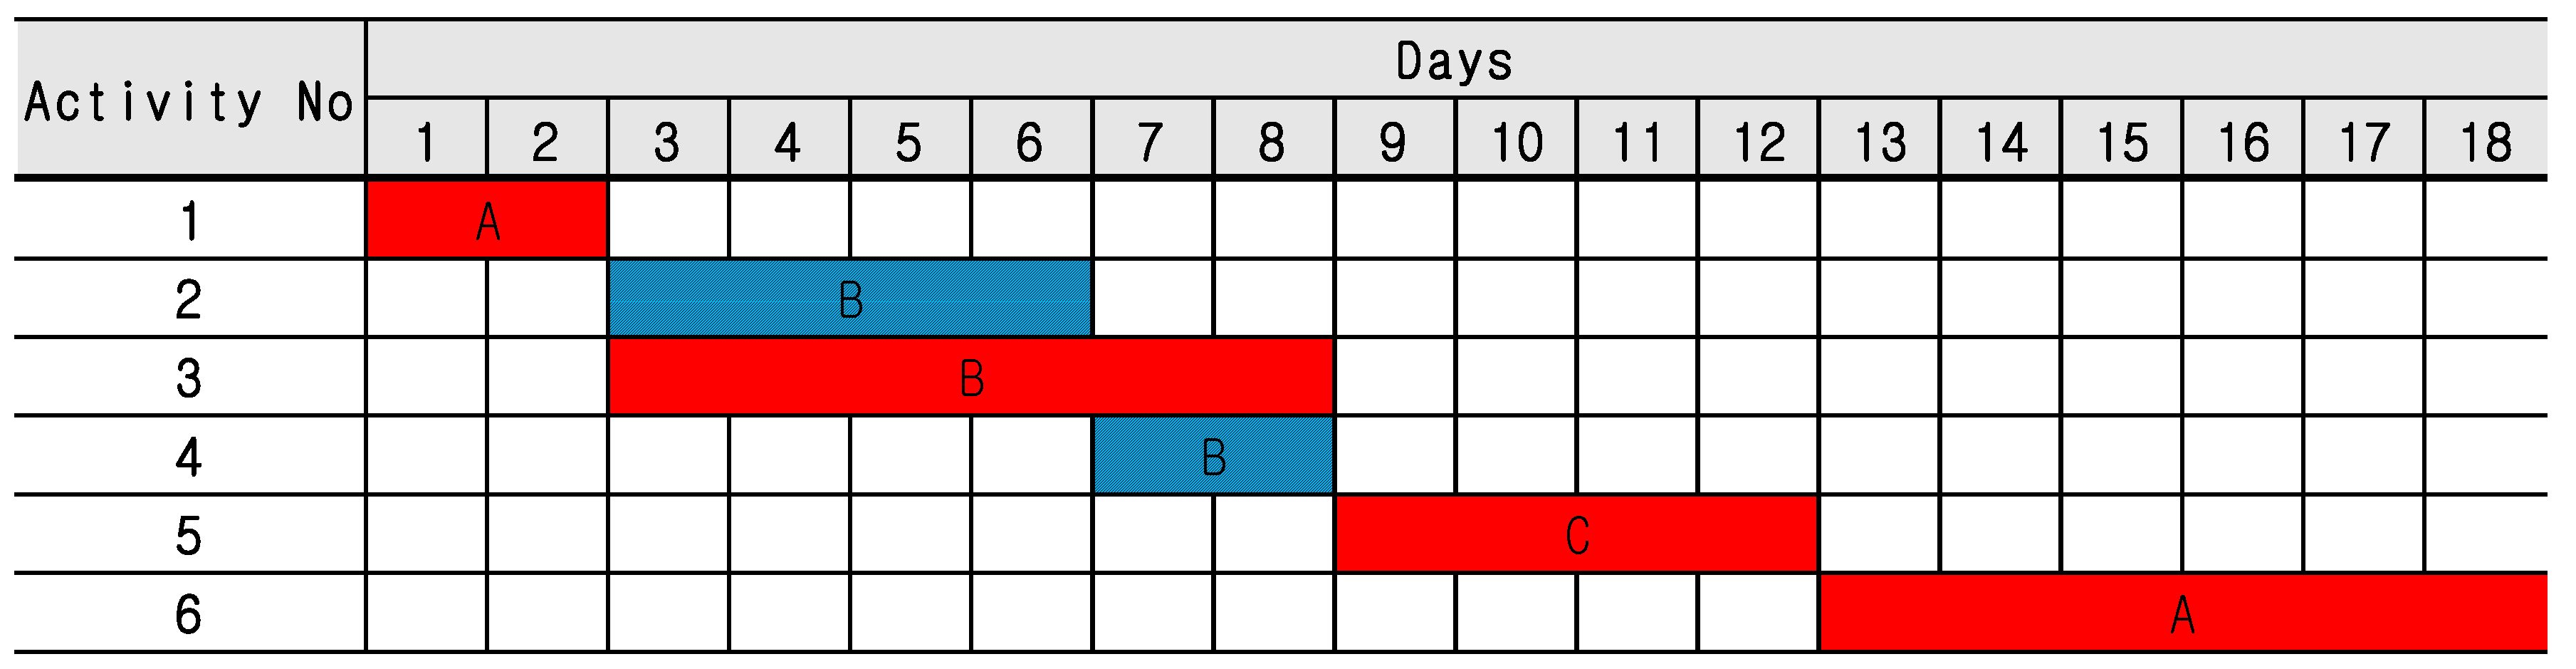
Figure 1. Total annual contracts amount by Korean EPC contractors on overseas projects [4].
Sustainability 10 01817 g001
Figure 2. Research Methodology and Process.
Sustainability 10 01817 g002
Figure 3. Critical path for sample project and resource allocation (labor). (A: Resource A, B: Resource B, C: Resource C).
Sustainability 10 01817 g003
Figure 4. Critical chain activities (resource leveling) and inserting Buffers (project buffer and feeding Buffer). (A: Resource A, B: Resource B, C: Resource C, FB: Feeding Buffer, PB: Project Buffer).
Sustainability 10 01817 g004
Figure 5. Flow Chart for Material Management Process.
Sustainability 10 01817 g005
Figure 6. CCPM schedule for CPU-Case 1 (safety margin 50%).
Sustainability 10 01817 g006
Figure 7. CCPM Schedule for PCU-Case 2 (safety margin 50%).
Sustainability 10 01817 g007
Figure 8. Project Duration for CCPM with: (a) Safety Margin of 50%; and (b) resource buffer applied (CPU-Case 1).
Sustainability 10 01817 g008
Figure 9. Project Duration for CCPM with: (a) safety margin of 50%; and (b) resource bugger applied (PCU-Case 2).
Sustainability 10 01817 g009
Table 1. Sample project—piping installation work.
Activity No.PredecessorSuccessorRelationsDuration (Days)Resource Name
1 2, 3FS2A
214FS4B
315FS6B
426FS2B
536FS4C
64, 5 FS6A
Table 2. Work Quantity for Both Cases.
CaseLine No.DescriptionPiping Size (Inch)Piping D/I *PKG Q’ty ** (Test)
Field
Crude Pump Unit (CPU-Case 1)54”-P-006Pump Suction Header5416891
42”-P-268G-001 Suction423261
42”-P-271G-002 Suction421821
42”-P-274G-003 Suction424521
36”-P-021Pump Discharge Header369552
20”-P-023Min. Flow Header209961
24”-P-269G-001 Discharge245701
12”-P-270G-001 Min. Flow12223(Min. Flow Header)
24”-P-272G-002 Discharge246131
12”-P-273G-002 Min. Flow12186(Min. Flow Header)
24”-P-275G-003 Discharge246511
12”-P-277G-003 Min. Flow12233(Min. Flow Header)
Propylene Compressor Unit (PCU-Case 2)20”-P-1968K-001C Suction 1203802
14”-P-Return Line14476(Discharge)
14”-P-K-001C Suction 2142182
12”-P-Return Line1296(Discharge)
16”-P-K-001C Suction 3161222
16”-P-Return Line16240(Discharge)
18”-P-K-001C Discharge183261
(Note: * Pipe D/I = pipe diameter—inch, which is typical unit of work-quantity for ping installation). ** PKG Q’ty = Pipe spool package quantity).
Table 3. Crude pump unit (CPU-Case 1)—activity sequence and resource allocation.
Activity No.PKG No.ISO DWG No.DescriptionPredecessorPiping D/IWelding Team (8 DI/Day)Duration (Day)Duration (Day) SM 50%Duration (Day) SM 40%Duration (Day) SM 30%
Field
1PKG-01 Pump Suction Header 15123
2 P-006-01 108 4.53.02.73.2
3 P-006-02 2324 13.57.08.19.5
4 P-006-03 3324 13.57.08.19.5
5 P-268-01 4210 8.84.05.36.1
6 P-271-01 4210 8.84.05.36.1
7 P-274-02 4336 14.07.08.49.8
8PKG-03 G-002 Suction 661
9 P-271-02 766 8.04.04.85.6
10PKG-02 G-001 Suction 1081
11 P-268-02 5108 14.07.08.49.8
12PKG-04 G-003 Suction 241
13 P-274-01 724 3.02.01.82.1
14PKG-05 Pump Discharge Header 1 2522
15 P-021-01 36 2.31.01.41.6
16 P-021-02 15180 11.36.06.87.9
17 P-021-03 1636 2.31.01.41.6
18PKG-06 Pump Discharge Header 2 5402
19 P-021-03 11, 16, 39180 11.36.06.87.9
20 P-269-03 4, 1996 6.03.03.64.2
21 P-272-03 4, 19144 9.05.05.46.3
22 P-275-03 4, 19120 7.54.04.55.3
23PKG-07 G-003 Discharge 3702
24 P-275-01 4134 8.44.05.05.9
25 P-275-02 24120 7.54.04.55.3
26 P-275-03 2524 1.51.00.91.1
27 P-277-01 2592 5.83.03.54.0
28PKG-08 G-002 Discharge 2482
29 P-272-01 4, 17120 7.54.04.55.3
30 P-272-02 2972 4.53.02.73.2
31 P-272-03 2924 1.51.00.91.1
32 P-273-01 3132 2.01.01.21.4
33PKG-09 G-001 Discharge 3882
34 P-269-01 4, 17182 11.46.06.88.0
35 P-269-02 3472 4.53.02.73.2
36 P-269-03 35102 6.43.03.84.5
37 P-270-01 3632 2.01.01.21.4
38PKG-10 Min. Flow 8502
39 P-023-01 360 3.82.02.32.6
40 P-023-01A 3940 2.52.01.51.8
41 P-023-02 4040 2.52.01.51.8
42 P-023-03 41160 10.05.06.07.0
43 P-023-04 4220 1.31.00.80.9
44 P-270-01 4548 3.02.01.82.1
45 P-270-02 39132 8.34.05.05.8
46 P-273-01 4740 2.52.01.51.8
47 P-273-02 39140 8.85.05.36.1
48 P-277-01 4940 2.52.01.51.8
49 P-277-02 40130 8.14.04.95.7
Total Piping D/I 4358
Table 4. Propylene compressor unit (PCU-Case 2)—activity sequence and resource allocation.
Activity No.PKG No.ISO DWG No.DescriptionPredecessorPiping D/IWelding Team (8 DI/Day)Duration (Day)Duration (Day) SM 50%Duration (Day) SM 40%Duration (Day) SM 30%
Field
1PKG-01 BL to K-001C Suction 1171922
2 P-876-02 32 2.01.02.02.0
3 P-979-01A 2, 1480 5.02.53.03.5
4 P-979-01 3, 2380 5.02.53.03.5
5PKG-02 K-001C Suction 1 901 ---
6 P-876-01 264 8.04.04.85.6
7 P-876-01A 626 3.31.62.02.3
8PKG-03 BL to K-001C Suction 2 1401 ---
9 P-878-02 72 9.04.55.46.3
10 P-980-01 968 8.54.35.16.0
11PKG-04 K-001C Suction 2 901 ---
12 P-878-01 990 11.35.66.87.9
13PKG-05 BL to K-001C Suction 3 4402 ---
14 P-1968-02 160 10.05.06.07.0
15 P-978-01 14, 9, 20280 17.58.810.512.3
16PKG-06 K-001C Suction 3 1601 ---
17 P-1968-01 14160 20.010.012.014.0
18PKG-07 K-001C Discharge95542 ---
19 P-892-01 2092 5.82.93.54.0
20 P-892-02 21126 7.93.94.75.5
21 P-892-03To BL 36 2.31.12.01.6
22 P-979-01ReturnLine (Suction 1)2080 5.02.53.03.5
23 P-978-01ReturnLine (Suction 3)20196 12.36.17.48.6
24 P-980-01Return Line (Suction 2)2024 1.50.82.02.0
Table 5. Schedule comparison of CPM and CCPM (safety margin 50%).
UnitsDescriptionCritical Path/Critical ChainProject Duration
Crude Pump Unit
(CPU-Case 1)
CPMActivity Nos. 2→3→4→5→11→19→21134 Days
CCPM
(Safety Margin 50%)
Activity Nos. 2→3→4→5→11→19→2086 Days
Propylene Compressor Unit
(PCU-Case 2)
CPMActivity Nos. 14→16→2→6→776 Days
CCPM
(Safety Margin 50%)
Activity Nos. 14→17→2→6→767 Days
Table 6. Deterministic schedule analysis: CPM vs. CCPM with different safety margins.
Project(Unit: Day)CPMCCPM with Safety Margin
50%40%30%
Crude Pump Unit (Case 1)Project Duration134.086.093.097.0
Project Buffer 18.015.012.0
Feeding Buffer (1) 4.03.02.0
Feeding Buffer (2) 1.01.01.0
Propylene Compressor Unit (Case 2)Project Duration76.067.071.076.0
Project Buffer 21.016.012.0
Table 7. Summary of simulation results.
ProjectDescriptionProject Duration (Deterministic)Project BufferMCSM (@Risk)
MinMLMaxConfidence 85%
Crude Pump Unit (Case 1)CPM134 134.0141.2151.8146.3
CCPM (SM 50%)861883.788.494.691.0
CCPM (SM 40%)931591.595.499.898.4
CCPM (SM 30%)971295.198.6103.3100.8
Propylene Compressor Unit (Case 2)CPM76 74.079.388.683.5
CCPM (SM 50%)672165.769.073.572.3
CCPM (SM 40%)711669.572.377.474.5
CCPM (SM 30%)761274.377.281.380.4
(SM: Safety Margin, ML: Most Likely).
Table 8. Simulation result of CCPM schedule applying the resource (material) buffer.
ProjectDescriptionProject Duration (Deterministic)Project BufferMCSM (@Risk)Remarks
MinMLMaxConfidence 85%
Crude Pump Unit (Case 1)CCPM (SM 50%)861888.793.2101.396.3Resource Buffers are added from 0 to 1.7 days
CCPM (SM 40%)931596.0100.6106.2103.9
CCPM (SM 30%)971298.4103.4109.2106.4
Propylene Compressor Unit (Case 2)CCPM (SM 50%)672166.270.274.772.8
CCPM (SM 40%)711670.274.178.576.7
CCPM (SM 30%)761274.878.585.081.5
(SM: Safety Margin, ML: Most Likely).

