Article

Commercial African Catfish (Clarias gariepinus) Recirculating Aquaculture Systems: Assessment of Element and Energy Pathways with Special Focus on the Phosphorus Cycle

1
Department of Aquaculture and Sea-Ranching, Faculty of Agricultural and Environmental Sciences, University of Rostock, 18059 Rostock, Germany
2
Marine Geology, Leibniz Institute for Baltic Sea Research, IOW, 18119 Rostock, Germany
3
Department of Waste and Resource Management, Faculty of Agricultural and Environmental Sciences University of Rostock, 18059 Rostock, Germany
*
Author to whom correspondence should be addressed.
These authors contributed equally to this study.
Sustainability 2018, 10(6), 1805; https://doi.org/10.3390/su10061805
Submission received: 1 April 2018 / Revised: 23 May 2018 / Accepted: 28 May 2018 / Published: 30 May 2018

Abstract

:
The reuse of effluent waters and sediments from African catfish (Clarias gariepinus) recirculation aquaculture systems requires a deeper understanding of the nutrient and energy flows and material pathways. Three semi-commercial systems, differing in stocking density, were sampled for nutritive and pollutant elements of the input- (tap water, feed) and output pathways (fillet, carcass, process water, sediments) by ICP-OES/MS and calorimetry. Highly water-soluble elements, e.g., potassium, accumulated in the water, whereas iron, copper, chromium and uranium where found in the solids. Feed derived phosphorous was accounted for, 58.3–64.2% inside the fish, 9.7–19.3% in sediments, and small amounts 9.6–15.5% in the process waters. A total of 7.1–9.9% of the feed accumulated as dry matter in the sediments, comprising 5.5–8.7% total organic carbon and 3.7–5.2% nitrogen. A total of 44.5–47.1% of the feed energy was found in the fish and 5.7–7.7% in the sediments. For reuse of water and nutrients in hydroponics, the macro-nutrients potassium, nitrate, phosphorus and the micro-nutrient iron were deficient when compared with generalized recommendations for plant nutrition. Low energy contents and C/N-ratio restrict the solely use of African catfish solids for biogas production or vermiculture. Using the outputs both for biogas supplement and general fertilizer in aquaponics farming (s.l.) (combined with additional nutrients) appears possible.

1. Introduction

The globally growing and developing human population within the save limits of the planetary boundaries [1] increasingly depends on the level of sustainability of the agricultural systems of the future. These systems must produce higher yields by using fewer resources, but also entail fewer emissions when compared with those of the present times. To meet these demands, future food production must be intensified [2] and integrated [3] into other farming systems. The use of intensive recirculation aquaculture systems (RAS) to produce aquaculture species is considered as one of the most sustainable farming methods of animal protein [4,5]. The makeup and reuse of process water in RAS allows conservation of valuable resources like water and energy, and the capacity in concentrating animal waste products, i.e., feces, offers more effective waste treatment, disposal or recycling [6]. One of the most efficient warm water aquaculture RAS production has been described for the African catfish, Clarias gariepinus [7,8] allowing stocking densities of up to 200–350 kg m−3 water and on a fairly limited space [8,9,10].
Despite these advantages, the environmental conditions inside a RAS challenge the animal, because of increasing concentrations of feed- and input water-derived elements accumulating in the system [8,11,12,13]. Most recently it was detected that the production intensity of African catfish RAS disproportionally affects the accumulation of nutrients in the process water [8]. In addition, the fast growth rate and rapidly increasing feed input with subsequent adjustment of process water treatment and water exchange rates resulted in highly variable proportions of the macro-nutrients during the production cycle. In combination with biogas production, liquid and solid effluent wastes from RAS have been added to the anaerobic digester for energy production, without information on the possible impact on the methanation process and a better use, such as plant fertilizer. Also considering the quality of the fish product, increasing levels of different elements in the process water finally may accumulate in the flesh of the fish [14] and affect its product quality.
To transform modern RAS into production models that comply with the principles of the circular economy, different integrative approaches have been tested or are under development. To save energy costs, warm water RAS are integrated into biogas production facilities to benefit from the excess heat [15]. In order to reduce the effects of nutrient emissions, the integration of commercial plant production systems under reuse of process water, also known as aquaponics [16], is in the process of investigation [17]. The plant nutritive elements contained in the process water are provided through the unretained fish feed nutrients [8,16,18]. The high process water reuse rate of RAS favors the accumulation of valuable plant essential nutrients, i.e., nitrate, phosphate, and potassium [8,13,19,20,21]. However, the optimal process water reuse and the subsequent different aquaponics systems constructions are still under dispute [16].
Under reuse of nutrients and process water from African catfish production in aquaponics, both the total concentration and the ratio of primary macro- and micro-nutrients influence the productivity and quality of plant produce [19,20,22]. So far, only few studies registered all the essential plant nutrients in RAS process water, such as for Tilapia (Oreochromis niloticus) [18]. Compared with African catfish, Tilapia resulted in better yields in lettuce, cucumber, tomato [23], and basil [24]. Nutrients from solid wastes have not been utilized in aquaponics s.s. in the sense of Palm et al. [16], however, were considered suitable for aquaponics farming in combination of salmon smolts with wheat and barley [25]. In African catfish RAS, the solids, usually separated gravitationally from the process water by clarifiers, might also be suitable for a subsequent reuse. The deposited solids are removed during regular cleaning intervals, in addition to the regular water exchange (ca. 10–15% of total RAS volume per day). This discard, however, results in notable loss of water and nutrients and therefore does not comply with a sustainable resource use.
Based on limited input pathways of nutrients (tap water, feed) and different output pathways of macro- and micro-nutrients (process water, deposited solids, fish), the purpose of the present study was to analyze the element fluxes in commercial African catfish RAS under different stocking densities and two different feeding regimes. With the actual growth of commercial catfish RAS and increasing emissions, the best options to achieve most efficient nutrient uptake and/or reuse must be evaluated. Besides catfish farmers and general RAS operators, stakeholders intending to invest into aquaponics require information on nutrient fluxes and pollutant accumulation as well as the most deficient elements inside liquid and solid effluents for an effective plant production. This enables targeted adjustment of their aquaponics, either with additional waste treatment, nutrient addition or adequate adjustment of the applied catfish holding conditions (nutrient management). We, therefore, present the nutritive and pollutant elements inside the water, deposited solids and fish, combined with an evaluation of the energetic balance between feed energy input and detected output values in fish and deposited solids. This allows for first suggestions of optimal reuse options of African catfish RAS outputs in order to move forward towards the principle of a future circular economy.

2. Materials and Methods

2.1. Aquaculture Facilities

The experiment was carried out in the aquaculture research facilities in the “FishGlassHouse” [8,16] of the Faculty of Agriculture and Environmental Sciences of the University of Rostock. Three nearly identical RAS at a semi-commercial scale were used. Each RAS comprised nine fish tanks, one clarifier, one sump (heater and trickling filter supply pump), one nitrifying trickling filter, and one trickling filter sump (fish tank supply pump). Detailed specifications of the systems have been described previously [8,16].

2.2. Fish and Feeding

The three RAS were stocked with African catfish (Clarias gariepinus Burchell, 1822) at three different production intensities: extensive aquaculture system (EAS): max 50 kg m−3 ≙ 35 fish tank−1, semi-intensive aquaculture system (SIAS): max 100 kg m−3 ≙ 70 fish tank−1, and the intensive aquaculture system (IAS): max 200 kg m−3 ≙ 140 fish tank−1 under staggered production with three age/size class cohorts per RAS. All RAS were stocked in parallel with the same three cohorts. Cohort 1 was stocked and first fed on 01 Nov 2016, cohort 2 on 13 Jan 2017, and cohort 3 on 10 Apr 2017, with initial mean weights of 35, 35, and 40 g fish−1. The fish were automatically fed by commercial diet for African catfish (Skretting Meerval TOP 4.5 mm) from two different batches. Except for zinc sulfate monohydrate, manufacturers specifications indicated identical feed compositions, containing 42% protein, 13% fat, 8.5% ash, 1.8% fiber, 2% calcium, 0.4% sodium, 1.2% phosphorus, 42 mg kg−1 iron 2 hydrate monohydrate, 2.1 mg kg−1 calcium iodate anhydrous, 5 mg kg−1 copper sulfate pentahydrate, 16 mg kg−1 manganese sulfate monohydrate, 110 mg kg−1 zinc sulfate monohydrate in batch 1 and 100 mg kg−1 in batch 2.
To determine fish growth and feed efficiency, all fish were weighed during stocking, and on 8 Jun 2017 (fish sampling). With the data obtained from stocking and sampling, the feed conversion ratio (FCR) Equation (1), the specific growth rate (SGR) Equation (2), and the survival rate (SR) Equation (3) of the different RAS and cohorts were calculated. For the calculations on fish performance, the mean values per tank were used. The respective coefficients of variance (CV) were calculated between the mean values of the triplicated tanks.
FCR = F G
with F = feed as given (ww, in g), G = growth (ww, in g)
SGR   ( %   d 1 ) = ( ln BW final ln BW initial ) t 100 ,
with BWfinal = body weight (ww) on the day of sampling at the end of the experiment, BWinitial = body weight t = time in days of feeding (d).
SR   ( % ) = n   fish final n   fish initial 100 .
with n fishfinal = number of fish on the day of sampling at the end of the experiment, n fishinitial = number of fish on the day of sampling at the beginning of the experiment.

2.3. System Management

The sampling of the systems was performed under two different feeding regimes. Fish were fed according to 50% and 80% of a feeding curve supplied by a commercial partner (Fischgut Nord eG, Abtshagen, Germany). Thereby the 50% feeding regime resulted in higher oxygen levels and 80% in lower oxygen levels. To allow microbes in the three RAS to adapt to both feeding regimes, the systems were run on the respective feeding and management regimes for four weeks prior sampling. The water flow in each RAS was modified via the amount of inlet water in the fish tanks. The flow of the clarifiers in each RAS was adapted to a mean value (±CV) 11.2 ± 18.4 m3 h−1 resulting in approximately the same hydraulic surface load Equation (4) in each clarifier with a mean value (±CV) of 0.14 ± 10.0 m3 m−2 h−1. Once a week during clarifier cleaning, the flow was measured and adjusted if necessary. The water level in inside the systems was controlled automatically by a buoyant valve.
Hydraulic   surface   load   ( m 3   m 2   h 1 ) = Q AB   ( m 3 h ) A   ( m 2 ) ,
with QAB = flow rate in clarifier, A = effective surface area of tube settler.

2.4. Monitoring of Holding Conditions

To ensure adequate holding conditions of the fish, the physico-chemical water parameters (dissolved oxygen (DO), pH-value, temperature, redox potential, and conductivity) were measured daily with a multimeter (HACH LANGE HQ40d). Process water samples for the determination of ammonia nitrogen (NH4+-N), nitrite nitrogen (NO2-N), nitrate nitrogen (NO3-N) were taken every seven days from the outlet of the nitrifying trickling filter over the run of the experiment and were analyzed colorimetrically (Gallery™, Thermo Fisher Scientific, Dreieich, Germany). To calculate water nutrient input as a consequence of water exchange and precipitation, the water meters of the systems were recorded daily.

2.5. Sampling

Sampling of the clarifiers was performed six days after the cleaning of the clarifiers. The first sampling during high DO management (50% feeding ≙ low feeding level) was performed on 8 May 2016 after a total feed input RAS−1 6 d−1 as dry matter (dm) of EAS = 7.0 kg, SIAS = 13.9 kg and IAS = 27.5 kg.
The second sampling during low DO management (80% feeding ≙ high feeding level) was done on Tuesday 6 Jun 2017 after a total feed input RAS−1 6 d−1 (dm) of EAS = 14.1 kg, SIAS = 28.3 kg and IAS = 56.6 kg.
To collect sludge and supernatant water samples, the clarifiers were decoupled from the water circuits (switched from “flow-through” to “bypass”). The solids in the clarifiers were left to settle down for 15 min, before the removal of the water with a pond sludge suction cleaner. The sludge on the tube settlers was then flushed of with a high-pressure cleaner and caught in the clarifier. Thereafter, the clean tube settlers were removed and the filling level (hCE) was measured for further calculations. The sludge in the clarifiers was homogenized by heavy stirring with a water blade. For sampling, a 5 L graduated beaker was filled with homogenized sludge. Under continuous stirring, a graduated cylinder (1000 mL) was filled with ca. 1 L (VS: exact volume was noted) of sludge and left for 15 min for the solids to settle. According to this scheme, three samples were taken. The supernatant water from the cylinders was decanted into a second graduated beaker.
Solids: The sludge material was transferred into glass trays (31.3 × 21.3 × 4.0 cm) and dried in an oven („Universal Oven UN750“, Memmert, Germany) at 60 °C for 24 h (first sampling) and 48 h (second sampling) until weight constancy. Samples were checked at 08:00 am, 12:00 am and 04:00 pm, and were removed after mass constancy. To determine the dm (mDMS) Equation (5) and water contents (mWS) Equation (6) of the sludge-samples, the empty weight (mETray), the wet weight (ww) (mWTray), and the DW (mDTray) of the glass trays were determined.
m DMS   ( g ) = m DTray   ( g ) m ETray   ( g )
m WS   ( g ) = m WTray   ( g ) m DTray   ( g )
Sample masses were extrapolated Equation (8) with the aid of a volumetric conversion factor (CF) Equation (7). The dried sample material was then transferred into tubes, sealed, and stored at −18 °C until analysis.
CF = l C ( m ) w C ( m ) h CE ( m ) V S ( m 3 )
m DMC   ( g ) = m DMS   ( g ) CF
lC, wC: length and width of the clarifier bottom; hCE: filling level; Vs: mean volume of the three homogenized sludge samples
Water: The supernatant was filtered through a glass fiber filter (GF6, Ø 47 mm, Whatman, UK). Then a single-use syringe (60 mL, ISO 7886-1) was flushed with the pre-filtered sample water. Samples for dissolved species were taken with pre-cleaned syringe filters (0.4 µm, SFCA) and stored cool in acid-cleaned (2 vol % HNO3) 50 mL PP tubes after acidification with 1 mL sub-boiled HNO3. Tap water samples were treated in the same way.
Feed: Both feed batches were sampled three times (150 g each) and the material was dried at 60 °C until weight constancy (“Universal Oven UN750”, Memmert, Germany). The water content was calculated from the weight loss after drying. Finally, the feed was transferred into tubes and sealed and stored at −18 °C until analysis.
Fish: To determine the contents of nutritive and pollutant elements in the fish, a small and a large animal from the three fish tanks with the largest cohort (cohort 1) in every RAS was chosen. The filets were removed from the carcasses. The filets and the flesh-free carcasses from one respective RAS were then weighed and shredded with a meat chopper. After that, a whole fish sample was simulated by mixing a proportional part of the shredded filet and carcass for every RAS. The filet, carcass, and whole fish samples (each ca. 100 g) were deep-frozen (−20 °C) in freezer bags and freeze-dried for 3 days. The water content was again calculated from the weight difference of the wet and dry fish samples. The fish sampling was carried out only during the second sampling under 80% feeding.

2.6. Chemical Analysis

Sample preparation: The dried sludge samples were homogenized by an agate ball mill (200 rpm for 10 min) and the feed samples by an agate mortar. The freeze-dried fish samples were first crushed with an agate ball mill (200 rpm for 20 min) and then homogenized using a ceramic mill. As pre-treatment for the analysis, about 50 mg of the dried and homogenized feed and sludge samples and 250 mg of the fish samples were put in closed Teflon vessels [26] for acid digestion. To oxidize the organic matter contents, the samples were first treated for 1 h with 2 mL (fish samples 3 mL) concentrated HNO3 at 60 °C on a hot plate. Thereafter, 2 mL (fish samples 3 mL) concentrated HClO4 was added and the closed Teflon vessels were heated at 185 °C for 12 h. After digestion, the acids were evaporated at 185 °C on a hot plate to almost dryness before the samples were fumed-off three-times with 2 mL 1+1 HCl. To the residues, 5 mL 2 vol % HNO3 were added and the digestion sintered for 1 h at 60 °C. After cooling, the samples were transferred into 50 mL centrifuge tubes and filled up with 2 vol % HNO3 to a final volume of 50 mL.
ICP-OES and ICP-MS Analysis: In fish and solid waste samples, the major elements Al, Fe, Ca, Mg, Na, K, P, and S were measured by ICP-OES (iCAP 7400 Duo, Thermo Fisher Scientific, Bremen, Germany) using an external calibration and Sc as internal standard. Precision and accuracy of the measurements were monitored by the international reference material SGR-1b (USGS, Denver, CO, USA) and were ≤4.9% and 2.7%, respectively. The trace elements As, Cd, Co, Cr, Cu, Mn, Mo, Ni, Pb, Se, Sn, U, and Zn were determined by ICP-MS (iCAP Q, Thermo Fisher Scientific coupled to a PrepFast dilution module, ESI, Dreieich, Germany) using external calibration and Be, Ga, Rh, and Ir as internal standards. The measurements were done in the KED (kinetic energy discrimination) mode with He as collision gas for all elements except for Se (He with 8% H2). Precision and accuracy of the measurements were also determined by the international reference material SGR-1b and were ≤2.9% and 7.6%, respectively. The water samples were also measured by ICP-OES for major ions and P and Mn, whereas ICP-MS was used for As, Cd, Co, Cr, Cu, Fe, Mo, Ni, Se, Pb, U and Zn. Precision and accuracy were determined by the international reference material SLRS-5 (NRCC, Ottawa, Canada) and were ≤5.8% and 5.2% for ICP-OES and ≤4.0% and 9.3% for ICP-MS.
CNS-Analysis: The total C and N contents of sludge, feed, and fish samples were determined by combustion in an elemental analyzer (Euro EA, HEKAtech, Wegberg, Germany). While ~5 mg of the sludge and feed material was directly weighed together with vanadium pentoxide in tin capsules, the fish samples were mixed 1:10 with silica sand and homogenized in the agate ball mill (200 rpm for 20 min). Of this mixture, ≈15 mg were again weighed in the tin capsules with vanadium pentoxide as catalyst. Precision and accuracy were determined by the international reference standard MBSS and were 3.6% and −3.1% for TC and 9.3% and 1.6% for TN.
Total inorganic carbon (TIC) was determined by an elemental analyzer (multi EA 4000, Analytik Jena, Jena, Germany) after acid treatment of 50 mg of the samples with 1:1 phosphoric acid. Precision and accuracy were checked with the in-house reference material OBSS and were 3.1% and −0.2%. Total organic carbon (TOC) was calculated by the difference of TC and TIC.
Hg-Analysis: For the determination of Hg by atomic absorption spectroscopy (DMA 80, Milestone, Leutkirch im Allgäu, Germany), ≈100 mg of the sludge, feed, and fish samples were weighed into metal boats. In brief, after combustion at 700 °C, released gases were transferred to an amalgamator where Hg was removed by forming gold amalgam. After evaporation, Hg was finally measured by AAS at a wavelength of 253.7 nm. Precision and accuracy where calculated from the reference material MBSS and were 7.1% and 9.4%.
Energetic analysis: The calorific values (gross calorific value) of the dry and homogenized samples (sludge, feed and fish) were measured by a bomb calorimeter Parr 6400 after DIN51900-2 using 1 g of each sample. Fiber content (Acidic Detergent Fibre (ADF), Neutral Detergent Fibre (NDF) of feed and deposited solids was analyzed by using a Gerhard Fibretherm after Weender and detergent analysis method according to van Soest (described in [27]). A total of 10 g of the dry samples are used for each triplicate. Raw ash (XA) represents the inorganic content of the samples. XA was analyzed by incineration of the sample by using a muffle furnace at 550 °C until weight constancy. The ADF summarizes commonly not digestible compounds from cell walls as lignin and cellulose, whereas the difference between NDF and ADF Equation (9) characterizes the hemicellulose (H) content of the cell wall, which is known as (heavily) digestible. Easily digestible are cell contents as proteins, fat, sugar, starch and pectin, which were not analyzed. The principally easily digestible fraction (ED) could be calculated as difference between 100% dm and the sum of NDF and ash Equation (10).
H   ( % ) = NDF   ( % ) ADF   ( % )
ED   ( % ) = 100   ( % ) NDF   ( % ) XA   ( % )

2.7. Mass Balance Calculations

Nutrient calculations: For nutrient balancing, the masses of elemental nutrient input by the feed and by the water, the masses of elemental nutrients that accumulated in the clarifiers sludge (mOS) and in the system water (mOW) as well as the masses of elemental nutrients that were retained in the fish (mOFi), were calculated using the results of the samples. The balancing was done for the six days of sludge collection during 80% feeding. To obtain the mass of elemental nutrient input through the feed (mIF), the measured nutrient concentration (cIF) was multiplied with the dm of feed that was given during the six foregoing (mAllF) days (time space between last clarifier cleaning and sampling) Equation (11). The mass of an elemental nutrient in the sludge dm (mOS) was determined with the measured concentration of the nutrient (cOS) in a sample and the calculated sludge dm in the clarifier of one RAS (mDMC) Equation (12). To determine the elemental nutrient mass that retained in the fish during the six days (mOFi) Equation (16), the mean proportion of elemental nutrient input through the feed that retained in the fish from stocking until sampling was calculated (WStSFFi) Equation (15). Therefore, the elemental nutrient input by the feed from stocking until sampling (mStSF) in one RAS was calculated by multiplying the mean values of the measured elemental feed nutrient concentrations (cF) and the mass of feed brought into the system from stocking until sampling (mAllStSF) Equation (14). The masses of elemental nutrients that retained in the fish from stocking until sampling (mStSFi) were determined by multiplying the biomass gain of fish (mAllStSFi) over this time in one RAS with the mean values of the measured concentrations in the fish (cFi) samples Equation (13).
For calculating the elemental nutrient input by the water (mIW), the water exchange rate (VIW) was multiplied by the elemental nutrient concentrations in the tap water (cIW) Equation (17). The water exchange was performed during the clarifier cleaning. To calculate the accumulation of elemental nutrients over six days in the water, a steady state regarding the dissolved nutrients was assumed. In this context the elemental nutrient concentrations in the supernatant (cOW) multiplied with RAS volume (VRAS) represented the highest elemental nutrient masses in the process water of one RAS (mEndRAS) Equation (18). The water exchange rate (VIW) multiplied with the supernatant concentrations (cOW) showed the output of nutrients (mOutW) Equation (19). Consequently, the mass of elemental nutrient accumulation (mOW) could be calculated by building the difference of mEndRAS and mOutW Equation (20).
m IF = c IF m AllF
m OS = c OS m DMC
m StSFi = m AllStSFi cFi
m StSF = cF Batch 1 + cF Batch 2 2 m AllStSF
W StSFFi = m StSFi m StSF
m OFi = W StSFFi m IF
m IW = V IW c IW
m EndRAS = V RAS c OW
m OutW = V IW c OW
m OW = m EndRAS m OutW
Balancing: The proportional amount (X) of element input by feed and tap water in% in relation to overall input was calculated according to formula Equation (21).
X   ( % ) = m x m n 100 ,
with X = percentage of the input element in feed or tap water in relation to overall element input (feed + tap water), mx = mass of the element in feed or tap water, ∑mn = sum of the element masses in feed and tap water.
The proportional element/energy output (Y) in fish, sludge and process water in relation to its overall input (element = feed, tap water; energy = feed) in% was calculated according to formula Equation (22).
Y   ( % ) = m y m n 100 ,
with Y = percentage of element/energy output in relation to overall input, my = mass of the element mass/energy in fish, sludge or water, ∑mn = sum of the element in feed and tap water/energy value of input feed.

2.8. Statistics

All statistical analysis was performed with “IBM SPSS Statistics 22”, with a significance level of p < 0.05. The daily measured water parameters (O2 (%, mg L−1), pH, temperature (°C), conductivity (μS cm−1) and salinity (‰, calculated)) over the six days between clarifier cleaning and sampling (for 50% as well as 80% feed input) were tested for normal distribution using Shapiro-Wilk-test. Homogeneity of variance was tested using Levene’s Test. When data showed no homogeneity of variance, after an univariate ANOVA, Dunett T3 was used as post hoc test. This was the case for salinity, conductivity and O2 (%) under 50% feed input. When data was not normally distributed, Kruskal–Wallis-test was performed. This was the case for all water parameters during 80% feed input and pH, temperature and O2 mg L−1 under 50% feed input.

3. Results

3.1. Fish Performance

The fish demonstrated efficient growth and high survival rates (Table 1). The increase of production intensity did not affect weight gain, FCR and SGR, but resulted in reduced survival rate in the IAS by 4% when compared with EAS. Under all production intensities, increase of age/size (fish cohort 1–3) resulted in an increase of the FCR by about 0.11, and a decrease of SGR by about 1.4.

3.2. Water Quality

The results on the physico-chemical water quality are given in Table 2. The temperature remained close to 27 °C. The pH values were in the range of 4.5–4.9 under 50% F and between 5.0–5.8 under 80% F. Increase of production intensity increased the EC, but increase of F from 50 to 80% did not result in proportionate increase of conductivity. DO remained between 5.3 and 7.1 mg L−1, with the lowest values in the SIAS and highest values in EAS. The concentrations of dissolved nutritive and pollutant elements are given in Table 3. The highest concentrations of N and P were observed in the IAS under 50% F and the lowest in EAS under 50% F. The concentration of TDN per unit of feed input decreased with increase of production intensity under both feeding regimes. The highest level of total dissolved nitrogen (TDN) per kg feed input was observed in EAS under 50% F, the lowest concentration of N per kg feed input in the IAS under 80% F.

3.3. Element Concentrations Inside the Fish

The concentrations of nutritive (macro- and micro-nutrients) and pollutant elements analyzed in the total fish, the fillet and the carcass (dw) of African catfish, stocked at three different intensities (EAS, SIAS, IAS) are given in Table 4.
In the whole fish from all production intensities, macro-nutrient concentrations decreased in the order N > Ca > P > K> S> Na > Mg. Amongst the micro-nutrients, except for the switched order between the concentrations of Cr and Cu in IAS, the concentrations in all systems decrease in the order Fe > Zn > Mn > Cu > Cr > Se > Mo > Co. Amongst the pollutant elements, the concentrations decreased in the order Al > Ni > As > Pb > Cd > Hg > Sn > U.
When compared between fillet and carcass, the concentrations of the macro-nutrients N, K and S were found to be higher in the fillet, all other macro- and micro-nutrients were higher concentrated in the carcass. Likewise, the pollutant elements Hg and As were higher in the fillet, all other pollutant elements in the carcass.
In the fish fillets from the three RAS, the macro-nutrient concentrations decreased in the order N > K > P > S > Na > Mg > Ca. Except for N, the highest macro-nutrient concentrations were found in the fillets from IAS. The lowest concentrations of K, P and Mg in fillets were determined in the EAS, and the lowest concentrations of S, Na and Ca in fillets from the SIAS. Except for the switched order of Co and Mo in the fillets from IAS, the micro-nutrient concentrations in all systems decreased in the order Fe > Zn > Cu > Mn > Cr > Se > Co > Mo. Amongst the pollutant elements, the concentrations in EAS and SIAS decreased in the order Al > Ni > As > Pb > Hg > Sn > Cd > U, and in IAS Al > As > Pb > Ni > Hg > Sn > Cd > U. In the carcasses from all RAS, macro nutrient concentrations decreased in the order N > Ca > P > K > S > Na > Mg.
Amongst the micro nutrients, except for the switched orders of Fe and Mo in EAS and Cu and Cr in IAS, the concentrations in all systems decreased in the order Fe > Mo > Zn > Co > Mn > Cu > Cr > Se. Amongst the pollutant elements, the concentrations in EAS and SIAS decreased in the order Al > Cd > Hg > Sn > Ni > U > Pb > As, and in IAS Cd > Al > Hg > Sn > Ni > U > Pb > As. The relative distribution of nutritive elements between fish fillet and carcass are illustrated in Figure 1 (exact values: see Table S1). All nutritive elements were recorded in the carcass, unaffected by stocking density. While the distribution of K between fillet and carcass are closer to equal, Ca and Mn are overbalanced in the carcass (Ca > 99%, Mn > 96% for all RAS). The relative distribution of the pollutants between fish fillet and carcass are illustrated in Figure 2. Most pollutant elements were recorded in the carcass. While the distribution of Hg, As and Cs between fillet and carcass are closer to equal, Al, Cd and Ni are overbalanced in the carcass (Al > 97%, Cd > 98%, Ni > 88% for all RAS).

3.4. Solids

The dm content and calorific values in the effluent sludge of one clarifier (deposited solid waste per clarifier water volume) after 6 d of solid waste collection was in EAS to SIAS 0.06, 0.1 and 0.13% under 50% F, and 0.1, 0.22 and 0.24% under 80% F. The amounts of dm, TOC and calorific values, which were determined in the deposited solid waste that was recovered from the clarifiers of the EAS, SIAS and IAS, after 6 d of solids collection, under the 50 and the 80% F are given in Figure 3. The total amount of dm increased from EAS to IAS under 50% F (0.69, 1.1, 2.2 kg) and 80% F (1.2, 2.7, 4.0 kg). The relative amount of dm as percentage of feed input 6 d−1 (dm) decreased from EAS to IAS under 50% F (9.9, 8.6, 8.0%). Likewise, under 80% F (8.4, 9.6, 7.1%), this amount was lower in IAS when compared with EAS, but the highest amount was found in SIAS. The total amount of TOC increases from EAS to IAS under 50% F (0.29, 0.47, 0.87 kg) and 80% F (0.46, 0.98, 1.46 kg). The relative amount of TOC as percentage of feed TOC input decreases from EAS to IAS under 50% F (8.7, 7.2, 6.7%). Likewise, under 80% F (6.9, 7.3, 5.5%), this amount was lower in IAS when compared with EAS, but the highest amount was found in SIAS. The fiber analysis, done only for 50% F, showed low differences between the EAS, SIAS and IAS but as expected considerable between feed and sludge (Table 5). The proportions of raw ash, NDF, ADF, the theoretically easy digestible (ED) share and hemicellulose are illustrated in Figure 4. It is to recognize a slight lower hemicellulose and slight higher ash content at solids of the EAS. The total calorific values increase from EAS to SIAS under 50% F (13.5, 22.7, 42.0 MJ) and 80% F (21.5, 46.4, 68.8 MJ). The relative calorific values as percentage of feed calorific input decreases from EAS to IAS, under 50% F (9.2, 7.7, 7.3%). Likewise, under 80% F (7.2, 7.7, 5.7%), this amount is lower in IAS when compared with EAS, but the highest amount was found in SIAS. The concentrations of relevant elements for anaerobic digestion in the effluent sludge (nutrients from water and solids) from one clarifier after 6 d of solid waste collection are given in Table 6. The concentrations of all detected elements in the solids waste from one clarifier after 6 d of solid waste collection are given in Table 7. The highest concentrations of N per dm were observed under 50% F, with the highest concentration in SIAS. Likewise, concentrations P and Ca, Cu, Co were higher under 80% F, with the highest concentrations in SIAS. S was higher under 50% F, with highest concentrations in EAS. Ni, Pb and U decrease under increased production intensity.

3.5. Mass Balance

Input of nutritive elements: The proportions of nutritive element input via the feed and the tap water into the EAS, SIAS and IAS within 6 d of feeding (80% F) without maintenance, are given in Figure 5. Most of all nutrient input into the EAS, SIAS and IAS was attributed to the feed, which accounted for more than 99% of N, P, Fe, Mn, Zn, Se, Co and Cr resulting from feed nutrient concentrations of 6.9% N, 1.4% P, 431 mg Fe kg−1, 50.0 mg Mn kg−1, 188 mg Zn kg−1, 0.76 mg Se kg−1, 0.35 mg Co kg−1 and 9.5 mg Cr kg−1 (per dm). Nutrient input via the feed into the EAS, SIAS and IAS further accounted for 95.3%, 97.6% and 98.3% of K, 69.4%, 82.1% and 86.6% of Ca, 66.7%, 80.2% and 85.1% of Mg, 69.1%, 81.9% and 86.4% of S, 94.8%, 97.3% and 98.1% of Mo and 90.4%, 95.0% and 96.4% of Cu. The analyzed concentrations of the nutritive elements inside the feed are given in Table S2. The calculated proportions of input nutritive elements via the feed and the water are given in Table S3.
Output of nutritive elements: The calculated amounts of the nutritive element output (process water, fish, deposited solids and other) relative to the nutritive element input (tap water, feed) in% are given in Figure 6. The element output through the process water was dominated by the elements S (63.3, 52.9, 37.4%, EAS to IAS), Co (61.9, 32.5, 17.4%) and Mg (57.8, 51.3, 35.6%), via the fish by the elements P (58.7, 58.3, 64.2%), N (42.7, 48.7, 46.9%), Ca (37.5, 45.6, 52.2%), K (34.1, 35.6, 37.5%) and Se (35.6, 32.5, 33.5%), and via the deposited solids by the elements Cu (145.2, 81.9, 50.8%), Co (85.3, 90.8, 36.9%), Fe (57.5, 67,3, 54.0%), Zn (63.1, 82.2, 60.3%), Mn (30.0, 81.9, 57.1%) and Mo (48.1, 45.5, 33.5%). The unaccounted nutrients were dominated by Cr (76.9, 74.2, 60.2%), N (41.1, 38.4, 44.9%), K (40.7, 36.9, 39.6%), Mo (31.7, 35.4, 50.0%) and Se (31.0, 32.9, 39.8%). The calculated proportions of output nutritive elements (process water, fish, deposited solids and other) are given in Table S4.
Input of pollutant elements: The proportions of pollutant elements (As, Cd, Ni, Pb, U) input through tap water and feed into the EAS, SIAS, and IAS are given in Figure 7. In accordance with the contents of As (0.99 mg kg−1), Cd (0.18 mg kg−1), Ni (5.83 mg kg−1) and Pb (0.74 mg kg−1) in the feed, most of the pollutant input into the EAS, SIAS and IAS can be attributed to the feed (>97%). The input of U into the EAS, SIAS and IAS via the feed (0.16 mg kg−1) accounted for 55%, 71% and 77%. The calculated proportions of input pollutant elements via the feed and the water are given in Table S3.
Output of pollutant elements: The calculated amounts of the pollutant element output (process water, fish, deposited solids and other) relative to the pollutant element input (tap water, feed) are given in Figure 8. This is dominated (from EAS to IAS) via process water by the element As (35.9, 29.5, 30.0%), via the fish by the element Ni (38.5, 59.9, 67.6%), and via the deposited solids by the elements, U (72.4, 84.8, 59.3%), Cd (51.8, 61.8, 43.8%), Pb (46.8, 37.5, 26.2%). Likewise, the highest unaccounted pollutant output was dominated by As (31.0, 33.5, 37.4%), Ni (45.1, 22.3, 20.5%) and Pb (27.3, 36.0, 47.5%). The calculated proportions of output pollutant elements (process water, fish, deposited solids and other) are given in Table S4.

3.6. Energy Balance

The energy balance is illustrated in Figure 9. About 44.5–47.2% of the feed energy input was recovered in the fish. The energy content of the carcass accounted for about 70% of the whole energy content of the fish. The energy inside the deposited solids was <10% of total feed energy input and decreased with an increase in production intensity and F. About 45–50% of the feed energy input was not recorded.

4. Discussion

The general holding conditions, described by the physico-chemical parameters temperature, DO, pH-value, EC [28], as well as the concentrations of NH4+-N [29], NO2-N [30], NO3-N [
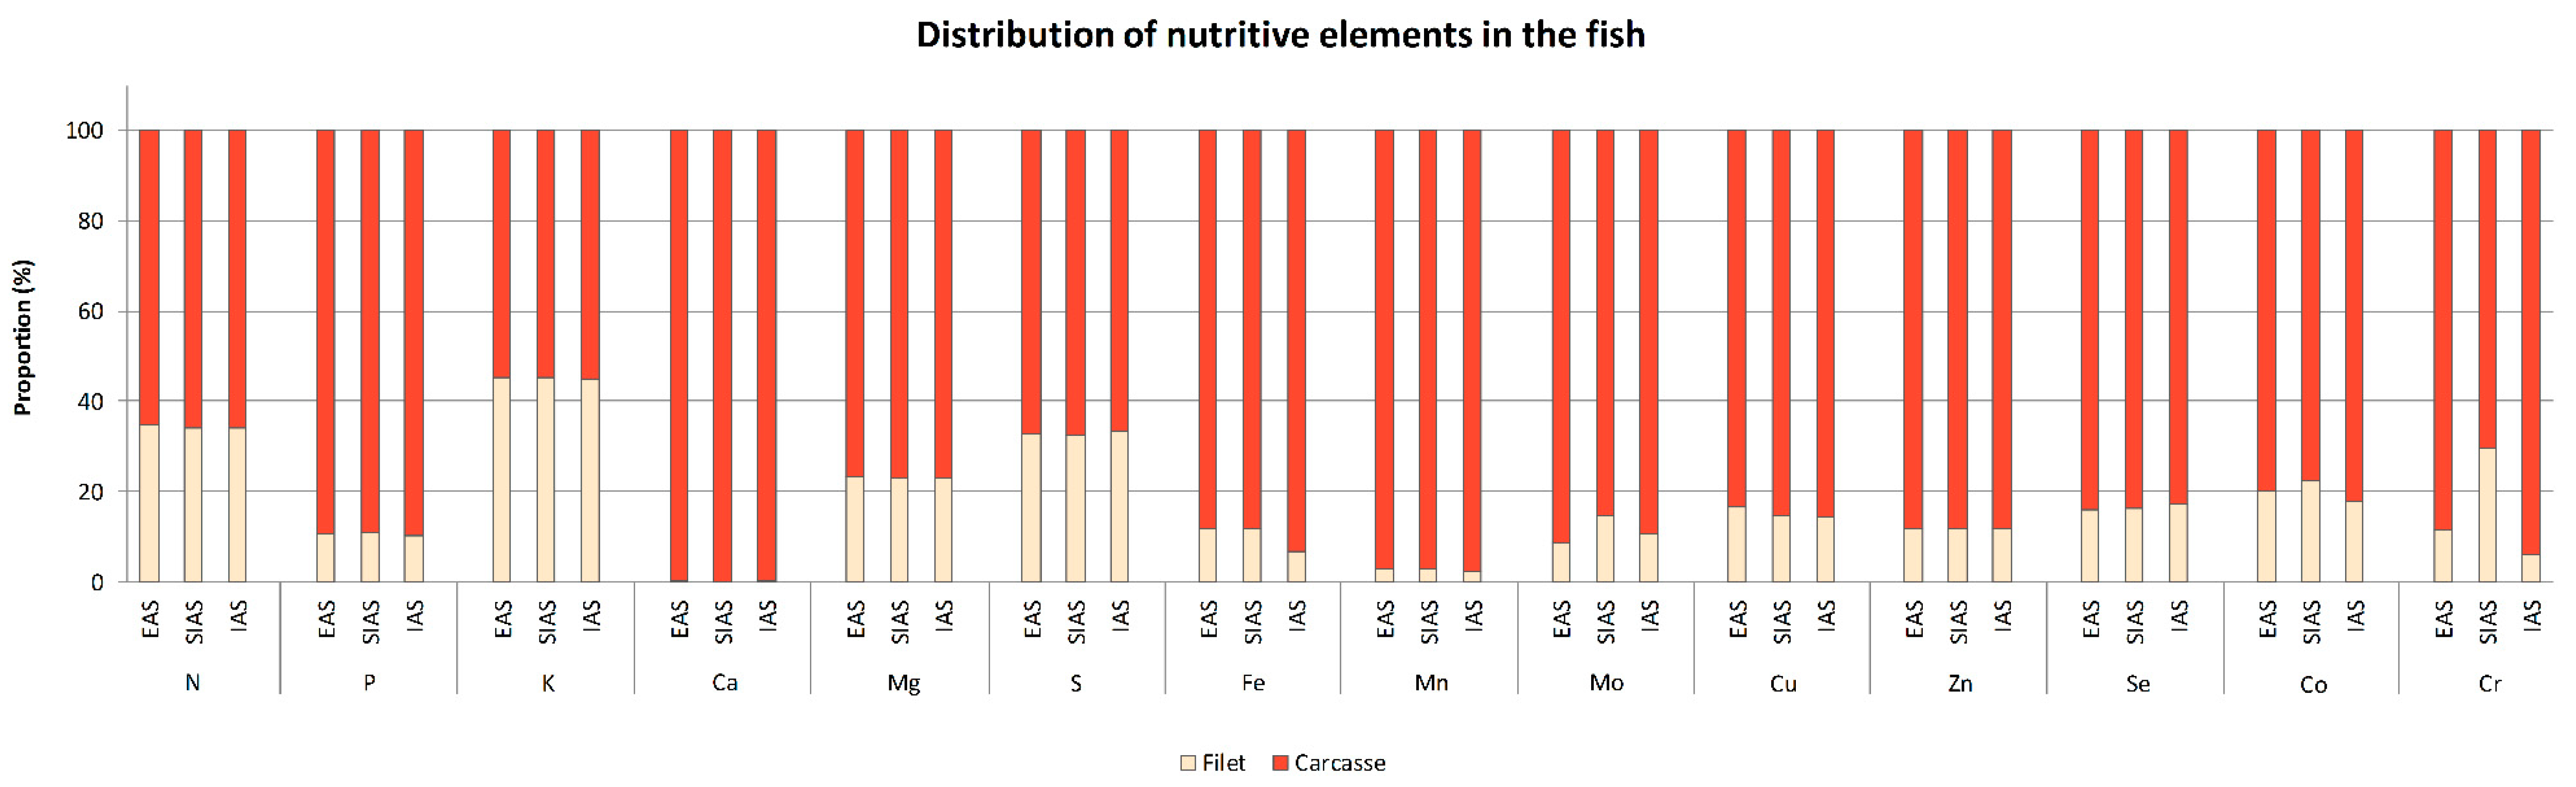
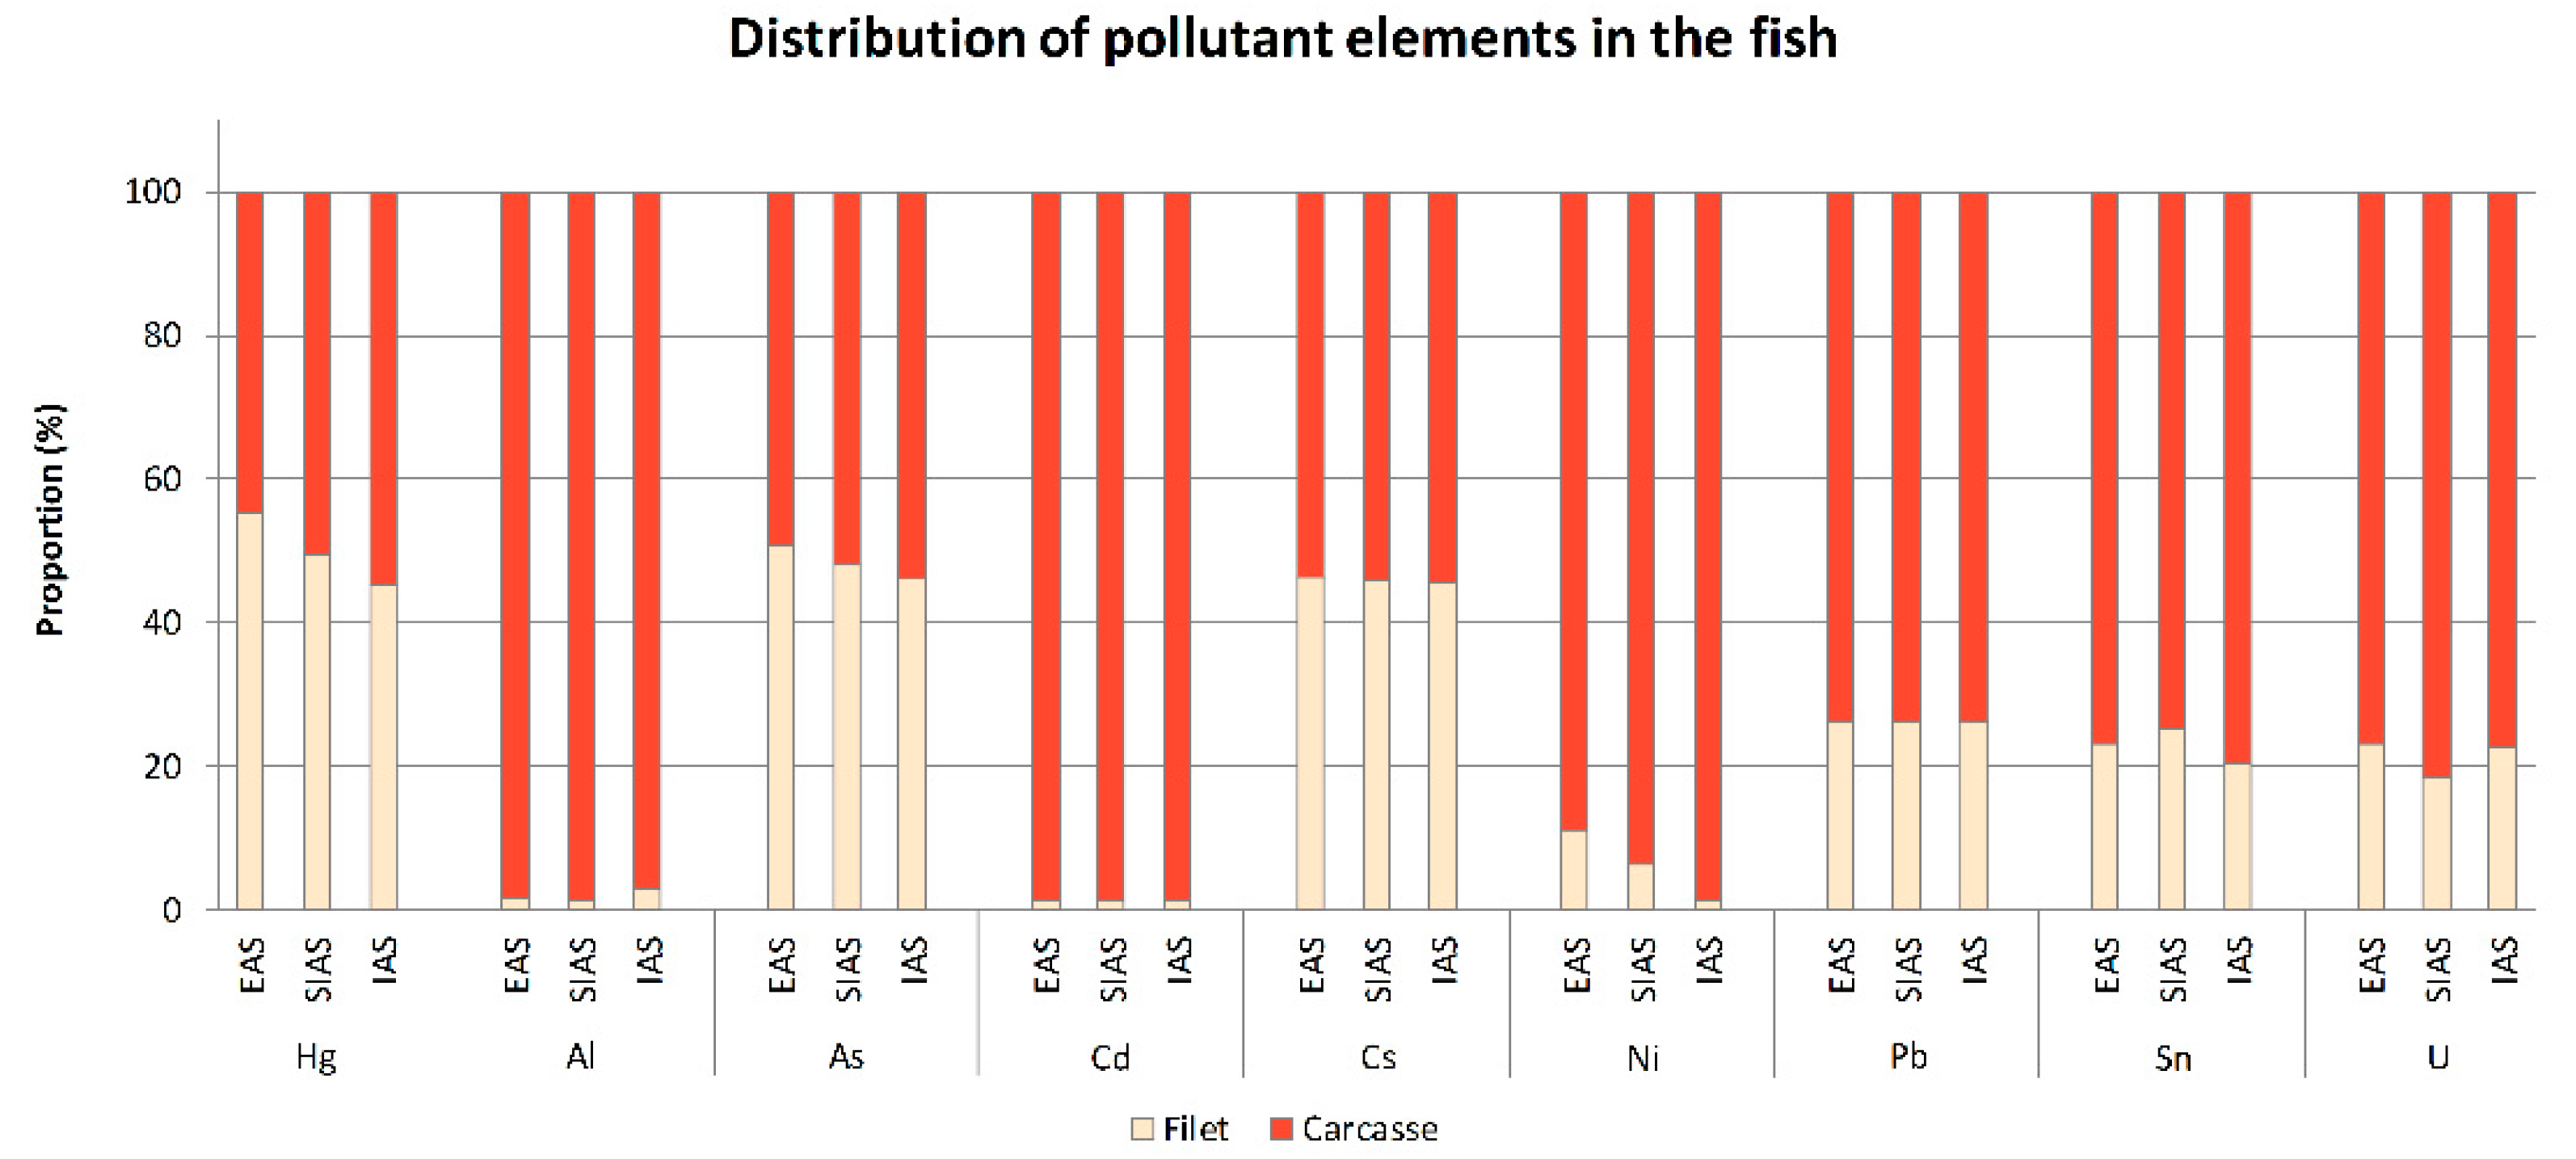
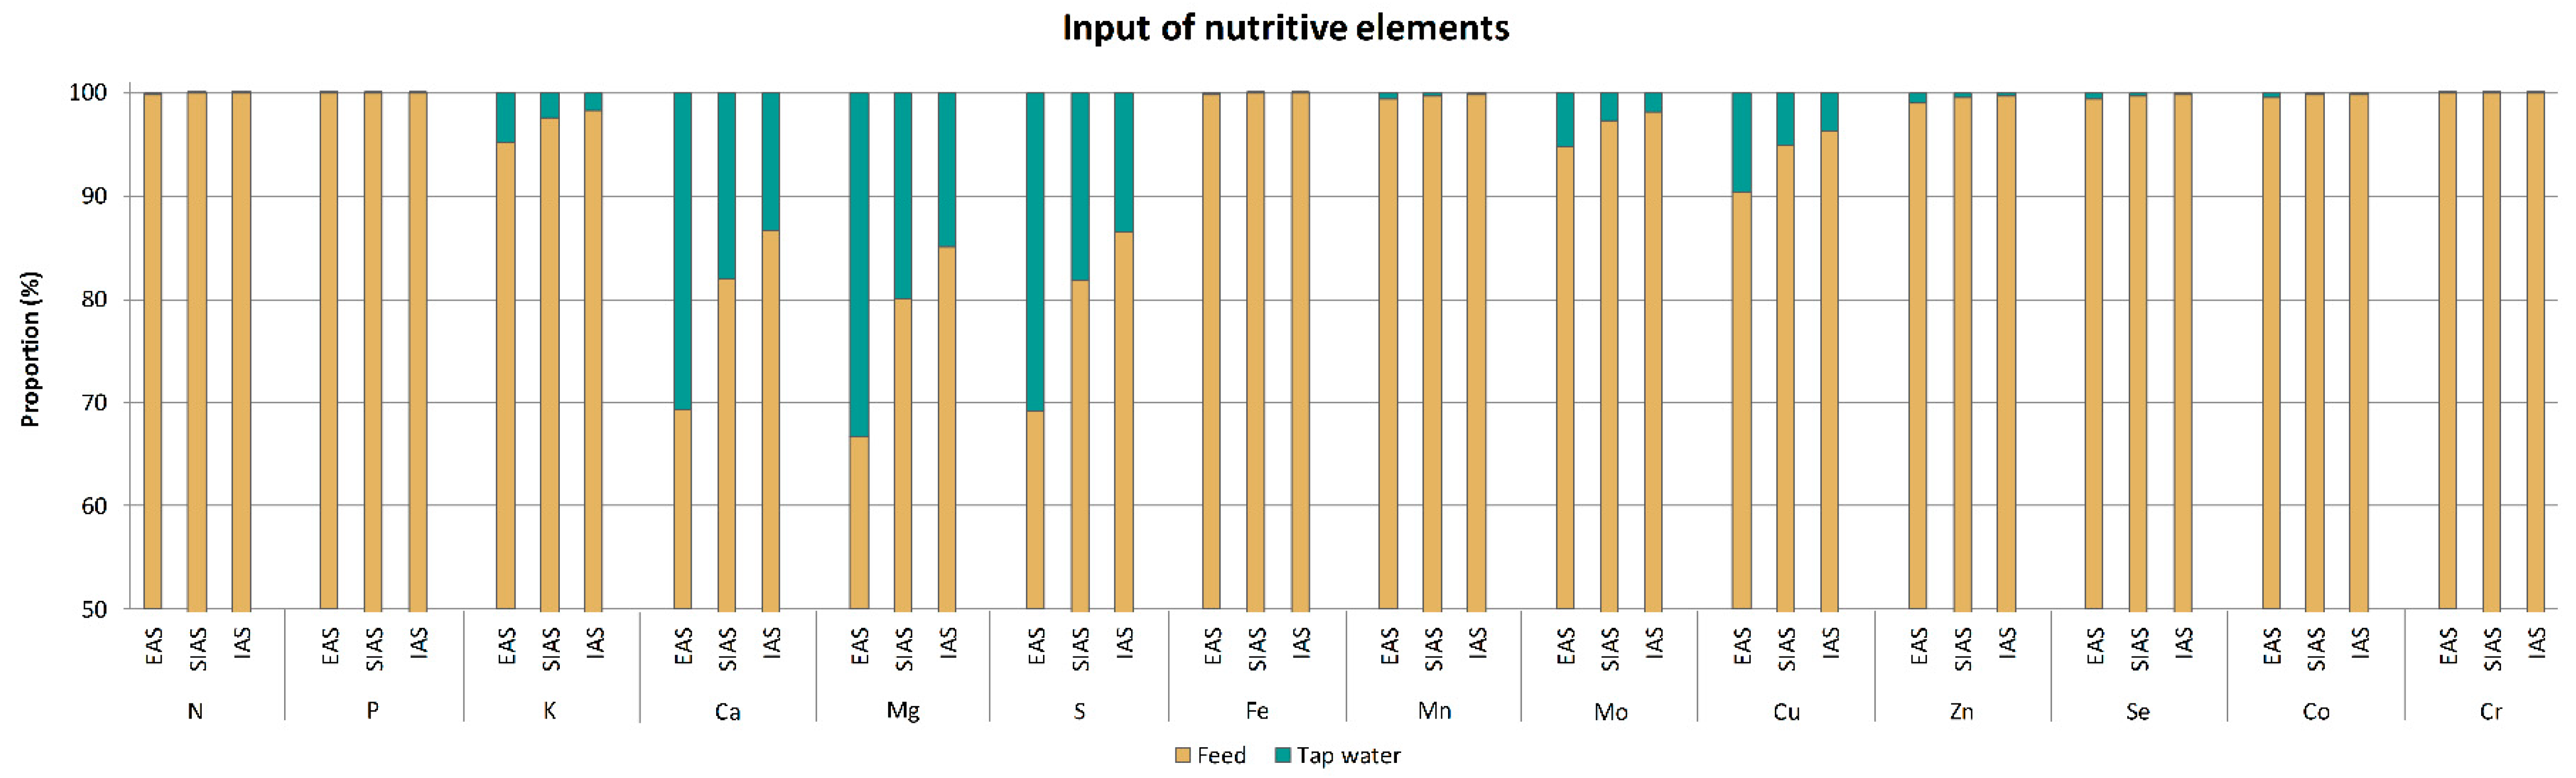
31], were well suitable for the cultivated African catfish. This was seen in very good growth parameters (FCR, SGR) and adequate mortality rates. Most macro- and micro-nutrients and energy contents could be recorded from the produced fish, sediments and water. Most nutrients (N, P, K, Fe, Mn, Mo, Cu, Zn, Se, Co, Cr) were introduced through the fish feed. Notable proportions of the macro-nutrients Ca, Mg, S (approx. 25%) and the micro-nutrients Mo and Cu (approx. 5%) were introduced through tap water and reduced in proportion under increase of production intensity, as this value reflects the ratio of feed input and water use. Similar results were found by Delaide et al. [18] who studied nutrient mass balances in the PAFF box (small scale Tilapia aquaponics 
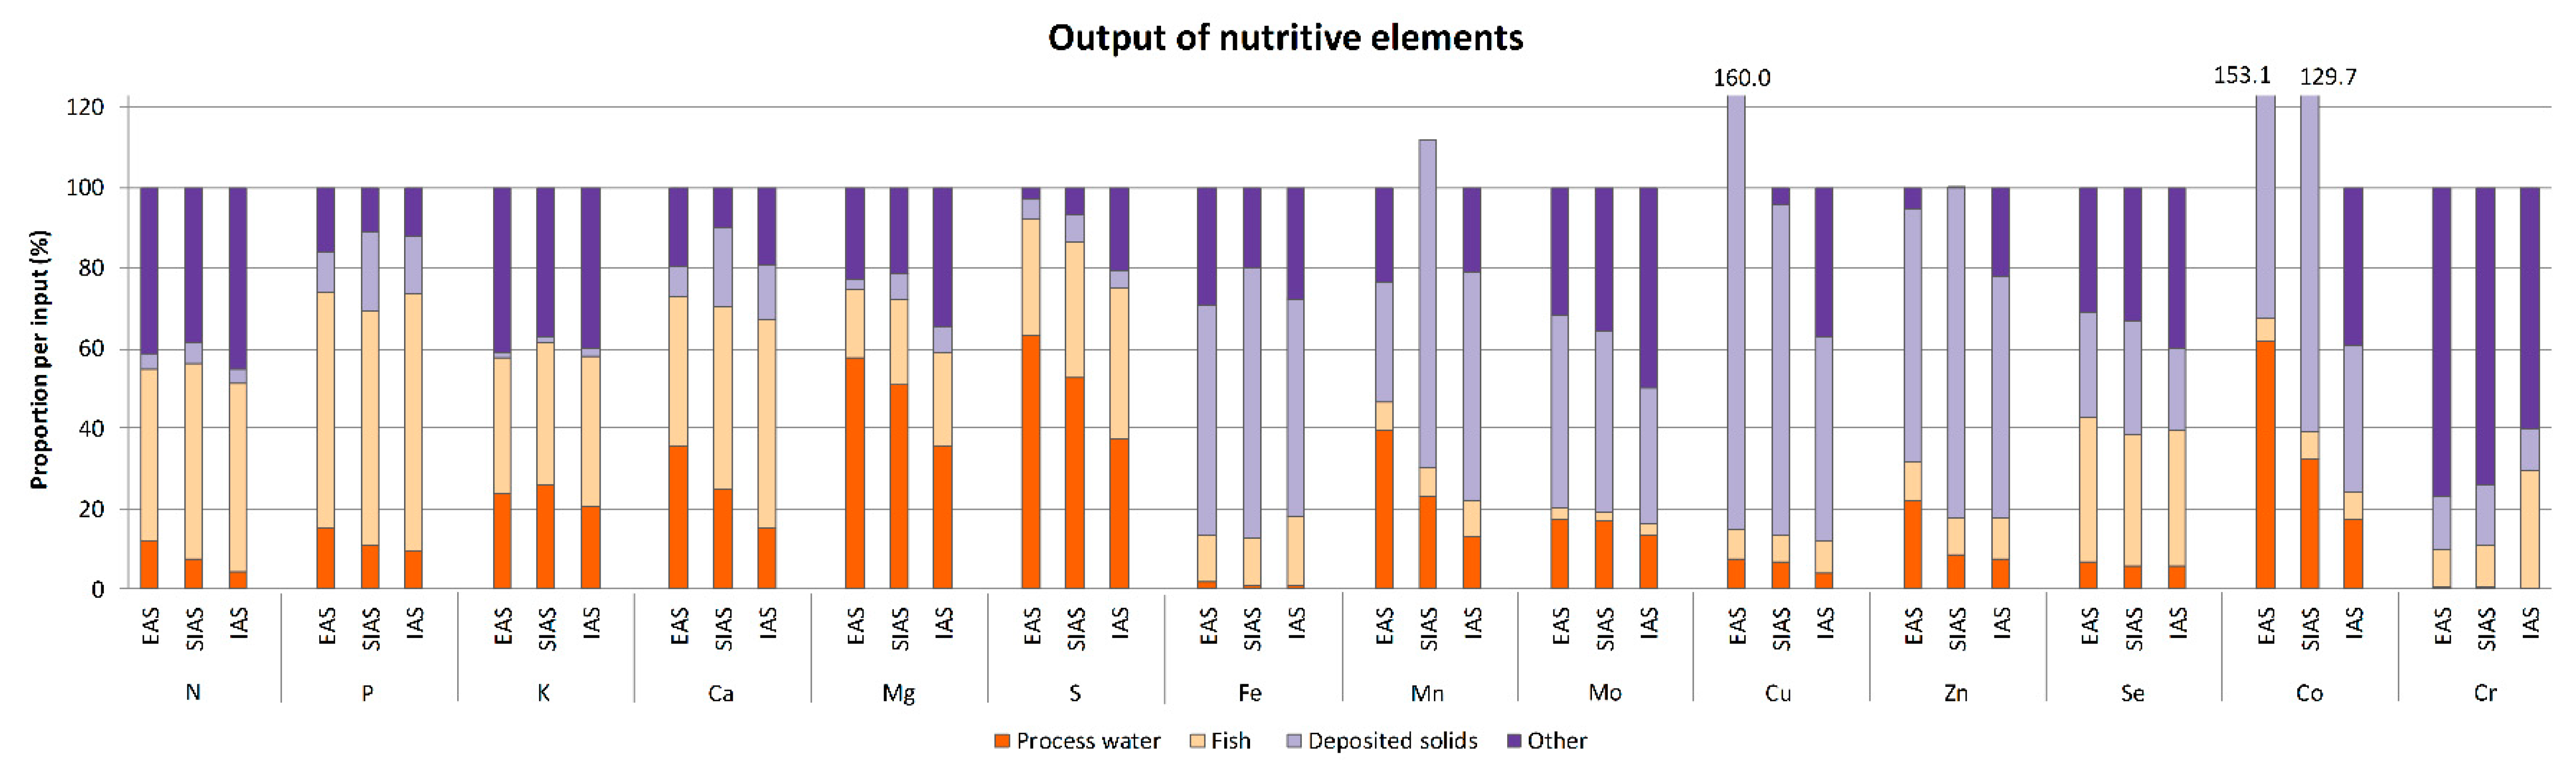
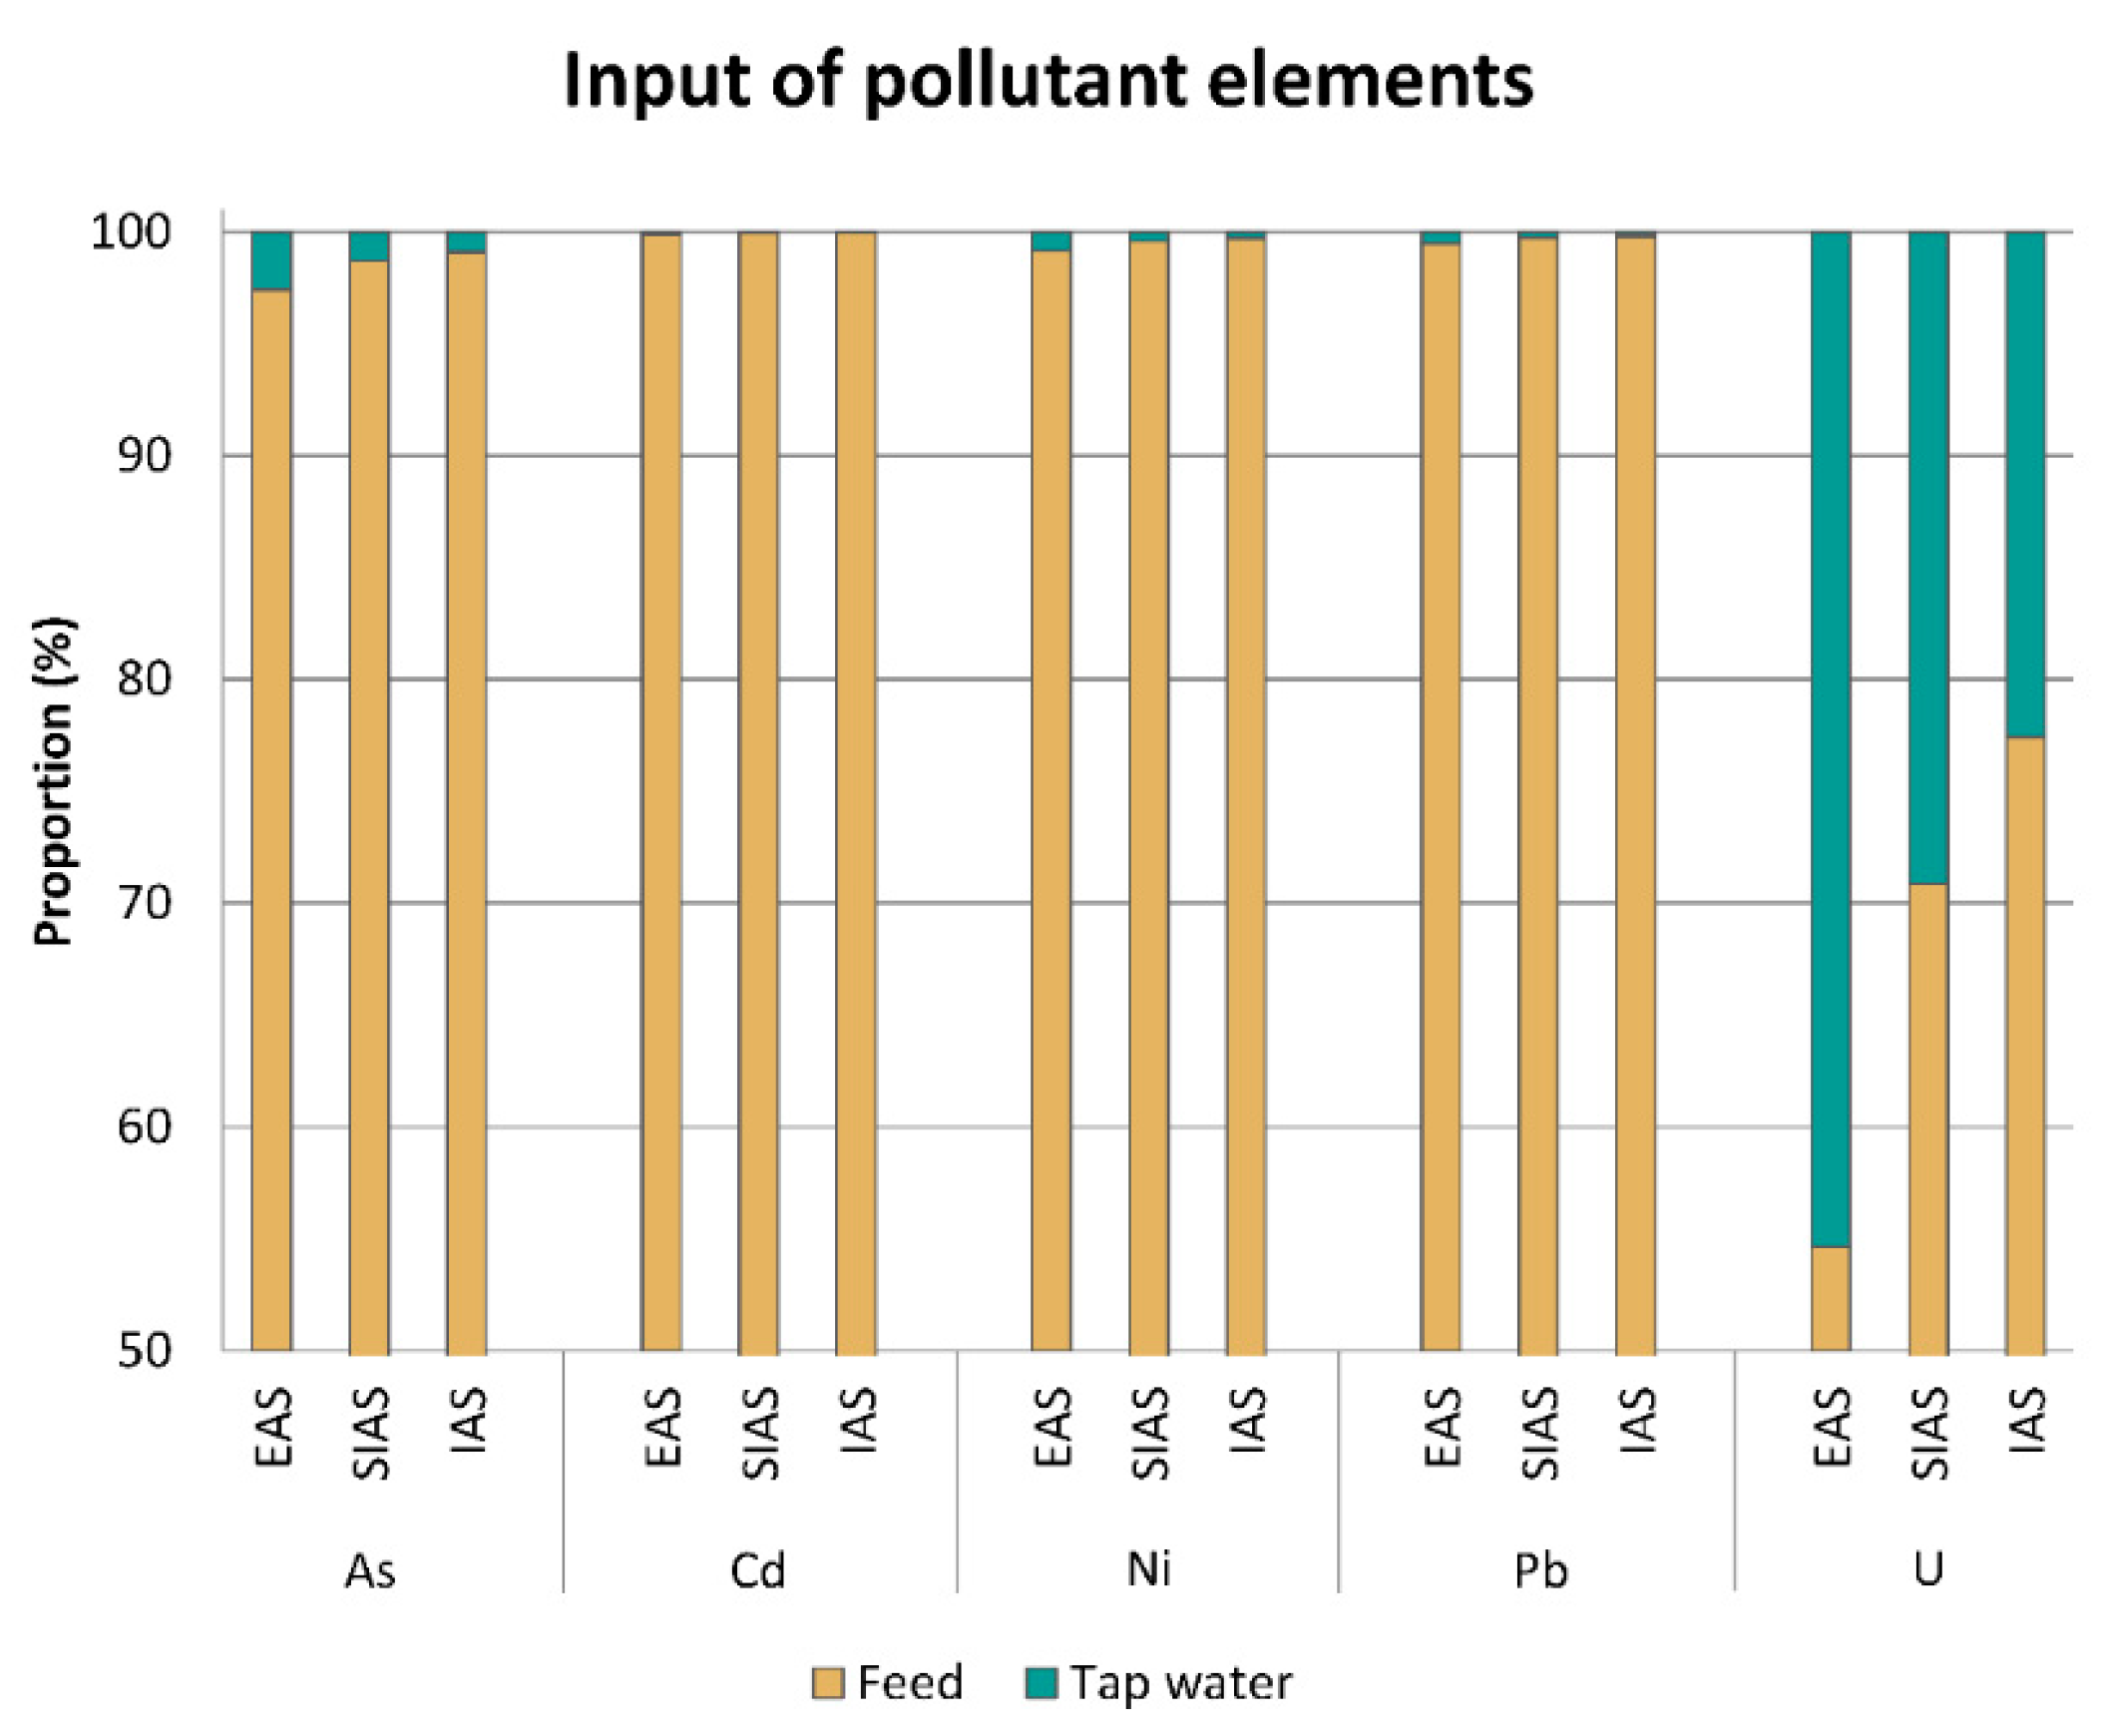
s.s.), although the proportions of nutrients introduced with the tap water were more predominant when compared with our study. In the PAFF box, the input via the water accounted for about 80% of total input of Ca, Mg and S, and for about 2–20% for Mn, Zn and Cu. Considering the pollutant elements in our experiment, only U was introduced by the water in larger quantities, all other pollutants mainly entered the systems through the feed. It is interesting to note that most amounts of P (80%) could be re-found either in the process water (Ø12% per input P), deposited in the fish carcass (Ø54% per input P) or in the sludge (Ø14% per input P), while only 55–62% of the input N could be detected.

4.1. Process Water

The assessment of the process water revealed that all measured plant essential elements were present. To evaluate the reuse of the process water by aquaponics plant production, we compared the concentrations with general recommendations for standard hydroponic nutrient solutions [32]. The deviations from these ‘optimum’ concentrations are given in Table 8, demonstrating that the overall concentrations inside the process water were comparatively low and imbalanced. Amongst the macro-nutrients, K, and amongst the micro-nutrients, Fe, Mo and Mn were most deficient, supporting Delaide et al. [18]. Increasing production intensity during 50% F combined with higher oxygen values resulted in an increase of the deficient N, a sign of optimal aerobic nitrification. The situation changed during 80% F, where the amount of dissolved N decreased under increasing production intensity, due to denitrification under lower oxygen regime. A stimulated denitrification processes can be attributed to lower DO and increased TOC in the deposited solid waste inside the clarifier [7,8]. Likewise, an increase of the production intensity under both scenarios 50 and 80% F reduced the deficit in total dissolved P to nearly ideal concentrations for plant production in hydroponics. However, concentrations of plant available ortho-P were 21–37% below total dissolved P. It is interesting to note, that in aquaponics, plant production is possible, even when some nutrients appear low [24], indicating other modes of action stimulating plant growth aside from the detected nutrient concentrations [19]. Despite that, in order to maximize the overall nutrient efficiency and to achieve economic competitiveness with conventional hydroponics, the plant quality and performance can be optimized by nutrient adjustment [19,33,34]. In that sense, Table 8 serves as a generalized indication of the plant relevant properties of the process water.

4.2. Fish

We found that a higher amount of nutrients was allocated to the carcass compared with the fillets. Considering that the carcass accounts for about 73% of the total dry weight of the fish, this is not surprising. Per dm weight, N, K and S were higher concentrated in the fillet; likewise, the macro-nutrients P, Ca and Mg were much higher concentrated in the carcass because it is included in the bones with crystal structures of calcium phosphates, the hydroxyapatite [35]. Inside the fillets from IAS (80% F), we found highest concentrations of all macro-elements and trace elements Zn, Mn, Se, compared with SIAS and EAS. Hoffman et al. [36] and Deng et al. [37] compared fillets of wild and farmed African catfish. While the former authors recorded mineral contents (mg kg−1, on a dm basis) in farmed fish of K > P > Mg > Ca > Fe > Zn > Cu, as in our catfish fillets, Deng et al. [37] showed minor differences from cultured fish (Na > Ca > K > P > Mg > Fe > Zn ww). Polak-Juszczak [38] analyzed African catfish from Polish markets, with smaller values for P, Cu and Se but nearly similar results for Mg (282 mg kg−1 ww) and Ca (106 mg kg−1 ww). Rosa et al. [39] found for raw fillets of farmed African catfish from a retailer in the Netherlands comparable macro- and trace mineral distributions in descending order K > P > Na > Mg > Ca > Zn > Fe > Cu >Mn with only higher concentration for Zn. They showed that K was the major element followed by P and Na as it was found for African catfish in this study. Similar order for minerals were found for African catfish from the Fish Bazaar in Hatay (Turkey) with K > Na > Mg > Ca > Fe > Zn > Cu > Mn [40]. Wasenitz et al. [41] analyzed the content of P (given as P2O5) and Se in fillets of farmed African catfish in Germany. For P2O5 they found 4.2 g kg−1 ww (value converted into P was 1.84 g kg−1 ww) and for Se around 0.58 mg kg−1 ww. In comparison, the values for P were much lower and for Se slightly higher in their study than we found in fillets of all RAS in our assessment.
Pollutant concentrations were investigated in the fillets of African catfish from commercial fish market in India [42], in wild fish from Red Sea in Egypt [43] or in Nile tilapia (Oreochromis niloticus) from three RAS reared under different water exchange rates [12]. The authors found that pollutant elements were low concentrated in examined muscle tissue compared to other organs. Jia et al. [14] pointed out that large amounts of heavy metals accumulate in the liver due to bounding metallothionein and in the gills through exchange of ions. Mahboob et al. [44] found enriched values of different metals in the skin of African catfish in comparison with the muscle and suggested that metal ions from water can bind to the surrounding mucus layer on the catfish body resulting possibly in higher absorption of elements in fish without scales through the skin. Moreover, we found nearly balanced levels for As, Hg, Cs and K in carcass and fillets. According to EFSA [45], fishmeal and fish oil were identified as the main source of As in fish feed. With view on the edible part of fish, elevated values for the pollutants Al, Sn, U, Pb, Hg and Cd were identified in fillets from IAS. For As, comparable values (0.22 mg kg−1, in ww) were found in African catfish from Polish market [38] Pb (0.004 mg kg−1, in ww) and Hg (0.03 mg kg−1, in ww) values were higher in comparison to our results. Gonzales et al. [46] pointed out the dietary protein source is the main influence on fillet element composition, especially phosphorus. They found lower levels of Al, Cr and Ni but much higher values of As, Pb, Cd and Co for yellow perch, farmed in RAS and feed with commercial diet. Colt [47] reported that heavy metals and further minerals came into fish in closed RAS through the vitamin premix in the feed. In a different study, Martins et al. [12] pointed out, that in RAS with Tilapia, a decrease in water exchange rates (1500, 70 and 30 L kg−1 feed d−1) resulted in increased concentrations of metals like As, Fe, Mn, Ni and Zn in the process water but not in liver or muscle tissue. Except for As, samples of Tilapia revealed higher accumulation of pollutant elements in the liver than in the fish meat. Considering that the majority of P output is via the fish carcass, combined with substantial amounts of other nutrients (N = Protein), Ca and energy, the most sustainable reuse option of this resource appears to be animal feeds. Already to date the carcasses of catfish in Mecklenburg-Western Pomerania are hydrolyzed and fed to pigs. In how far other applications, e.g., as feed additives and/or snacks for companion animals, may improve economic profits along the economic value chain need to be evaluated.

4.3. Solids

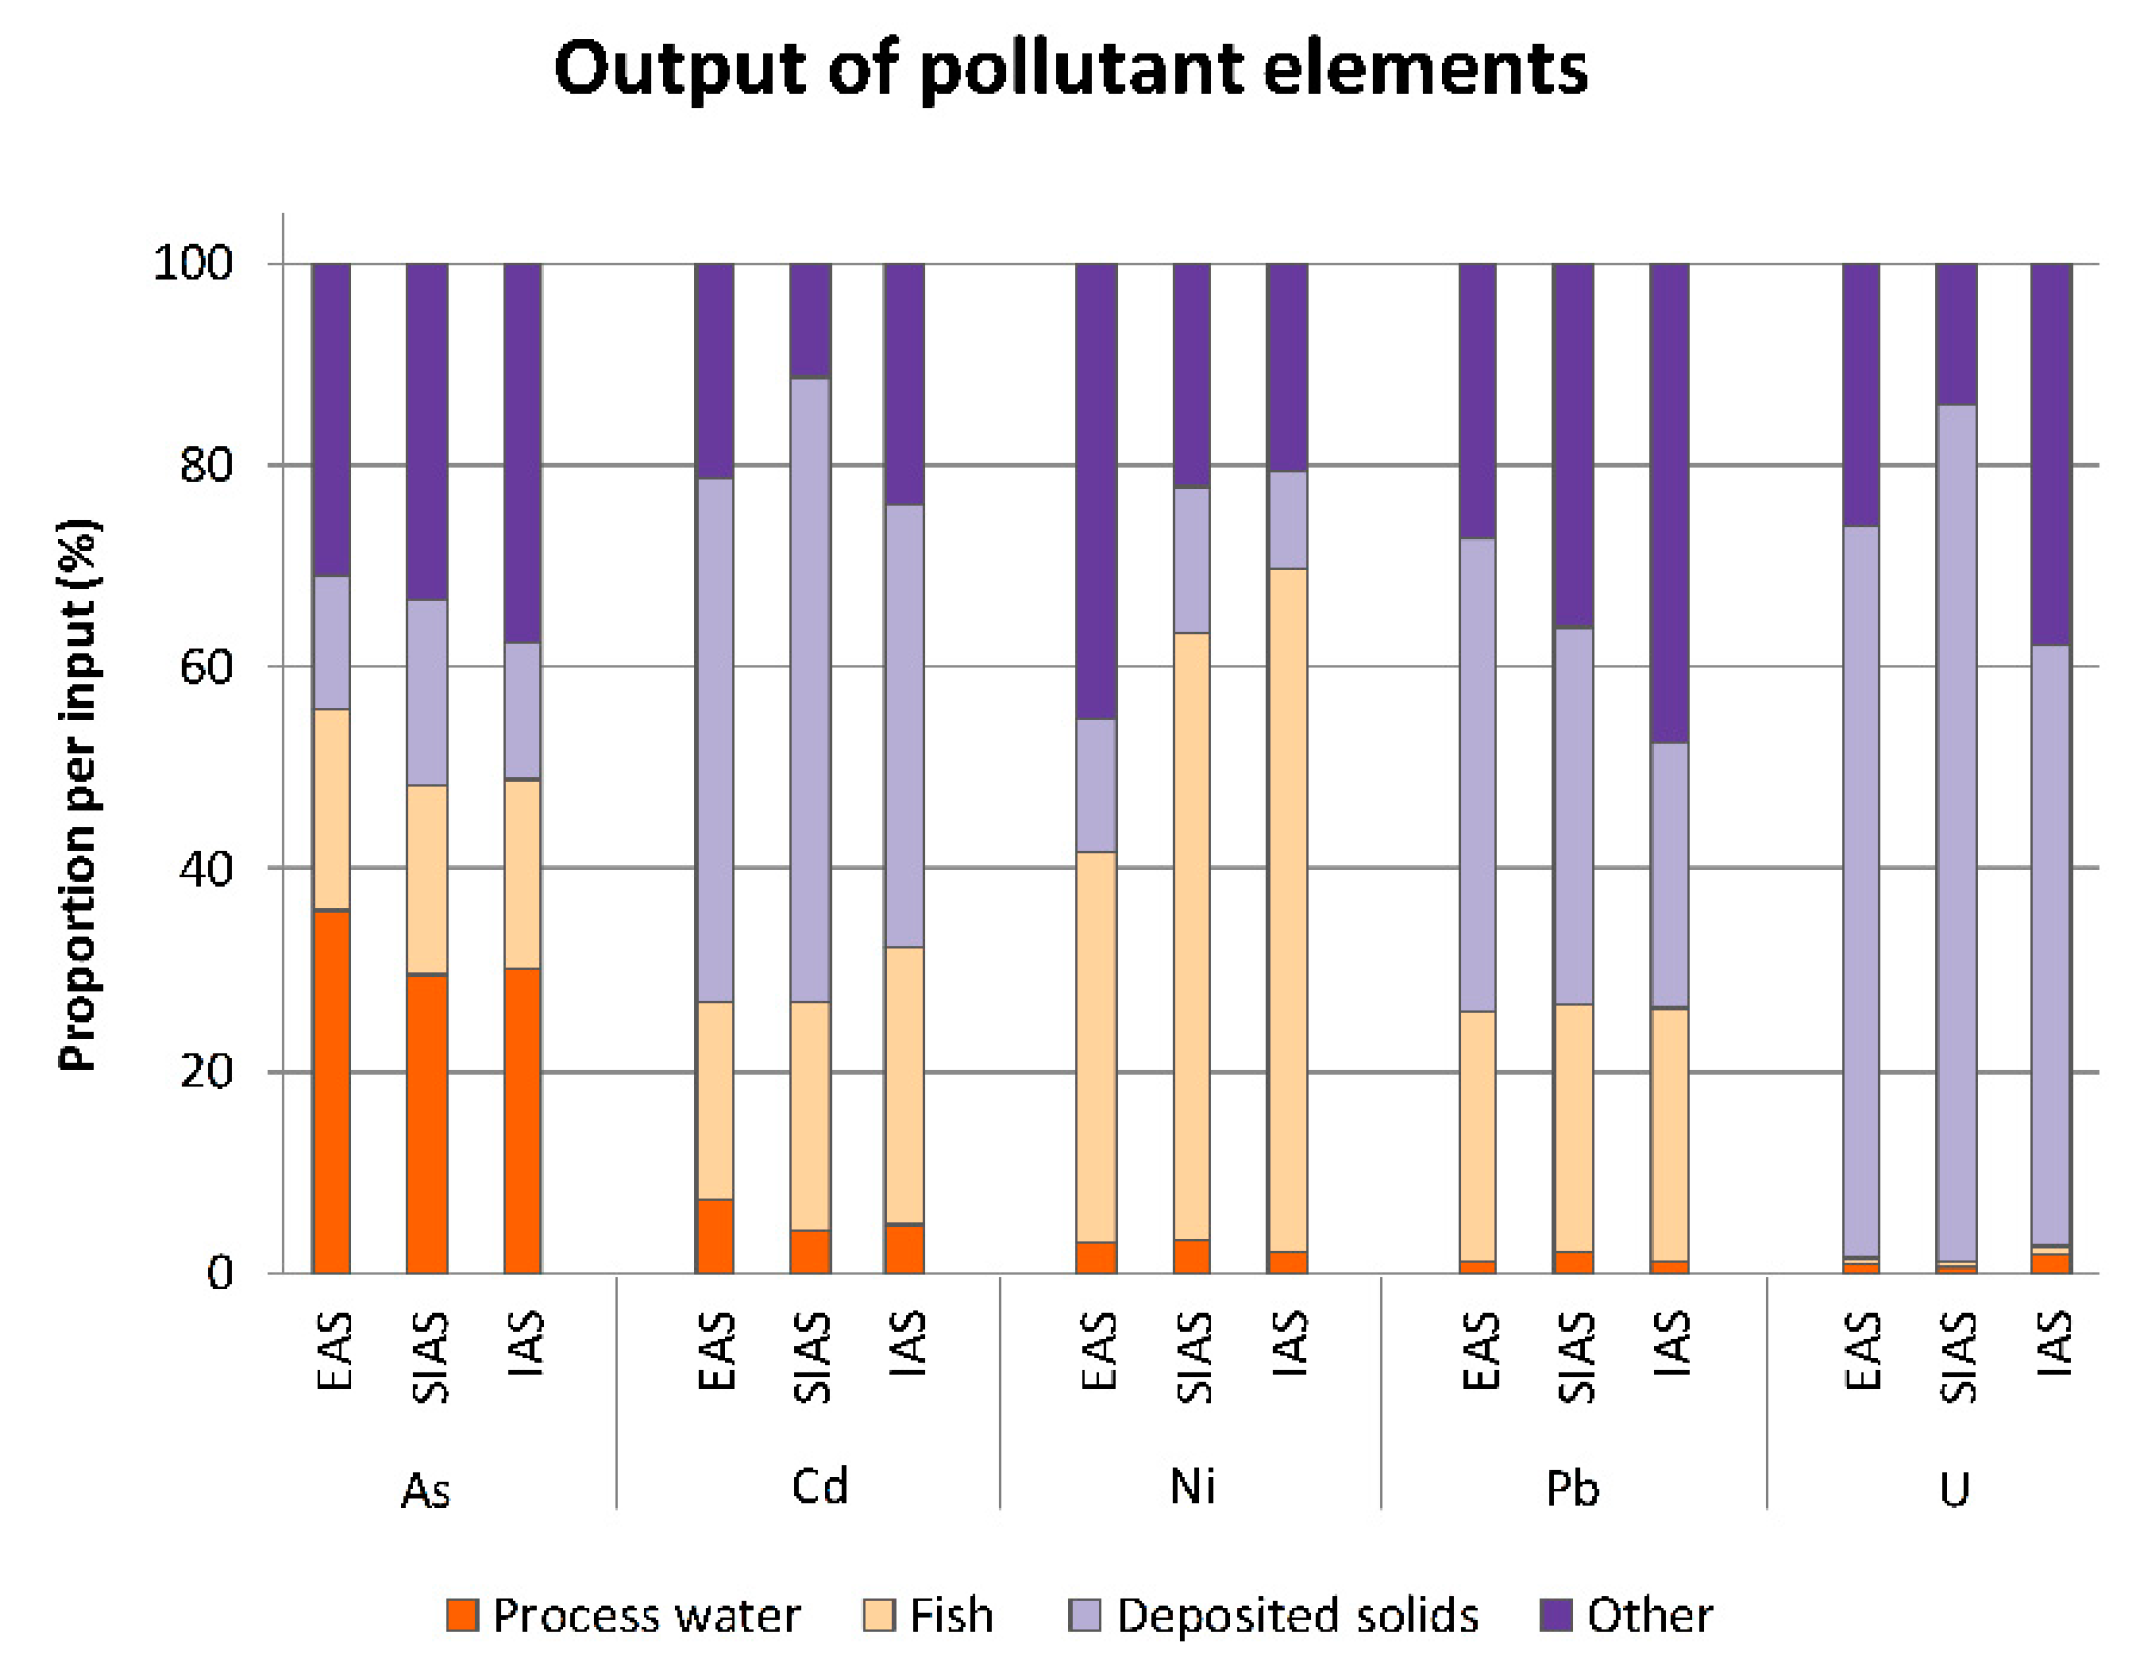
The sludge is a major sink for U, Pb, most transition metals (Fe, Mn, Mo, Cu, Zn, Cd, Co) and holds notable quantities of P, Ca, Se and As. The U concentrations of input water (1.5 µg L−1) were higher than the concentrations in the process water after 6 days without maintenance (from EAS to IAS: 0.02, 0.02, 0.11 µg L−1). That shows that U entered the system through the water but accumulated somewhere else in the system. Most U accumulated in the sludge with a percentage of (EAS to IAS) 72.5, 84.8 and 59.6% per total U input. We found that the effluent sludge from the clarifiers of the African catfish RAS only contained low dm concentrations (< 0.24%). Only little information on dm content of aquaculture effluent is reported in literature. Regarding the effluent of commercial African catfish RAS, no information is available. Cripps and Bergheim [48] reported a wide range of dm content in aquaculture effluents, and for clarifier effluent from Tilapia RAS, Monsees et al. [49] reported similar concentrations (0.114–0.165%). Nevertheless, it appears that the concentrations observed here are typical for RAS effluent without sludge thickening technologies [50,51]. The solids contained comparatively low concentrations of TOC (366–416 g kg−1 dm), but substantial amounts of the macro-nutrients N (33–50 g kg−1 dm), P (13–27 g kg−1 dm) and Ca (29–57 g kg−1 dm), and low levels of K (1.3–3 g kg−1 dm). Detailed information on the sludge composition of solid wastes from African catfish RAS is unavailable. As a comparison, sludge obtained from a commercial on-land Marine Harvest salmon hatchery in Norway contained 2.3 g kg−1 TOC, 82 g kg−1 N, 24 g kg−1 P, 8.2 g kg−1 K and 42 g kg−1 Ca [25], demonstrating even lower C/N-ratio, fewer N but higher P concentrations when compared with the solid waste from our experiment. Likewise, the effluent sludge obtained from Tilapia RAS [49], was recorded with 3.4–3.8 g kg−1 TC, 39–44 g kg−1 N, 25–36 g kg−1 P and 48–70 g kg−1 Ca, suggesting similar composition of nutritive elements inside the solid wastes of Tilapia and African catfish. The micro-nutrients were predominantly concentrated in the solids. Junge et al. [17] recorded that Cu, Zn, Mn were predominantly output via the solids, suggesting that this phenomenon takes place in the production of different aquaculture production systems and species.
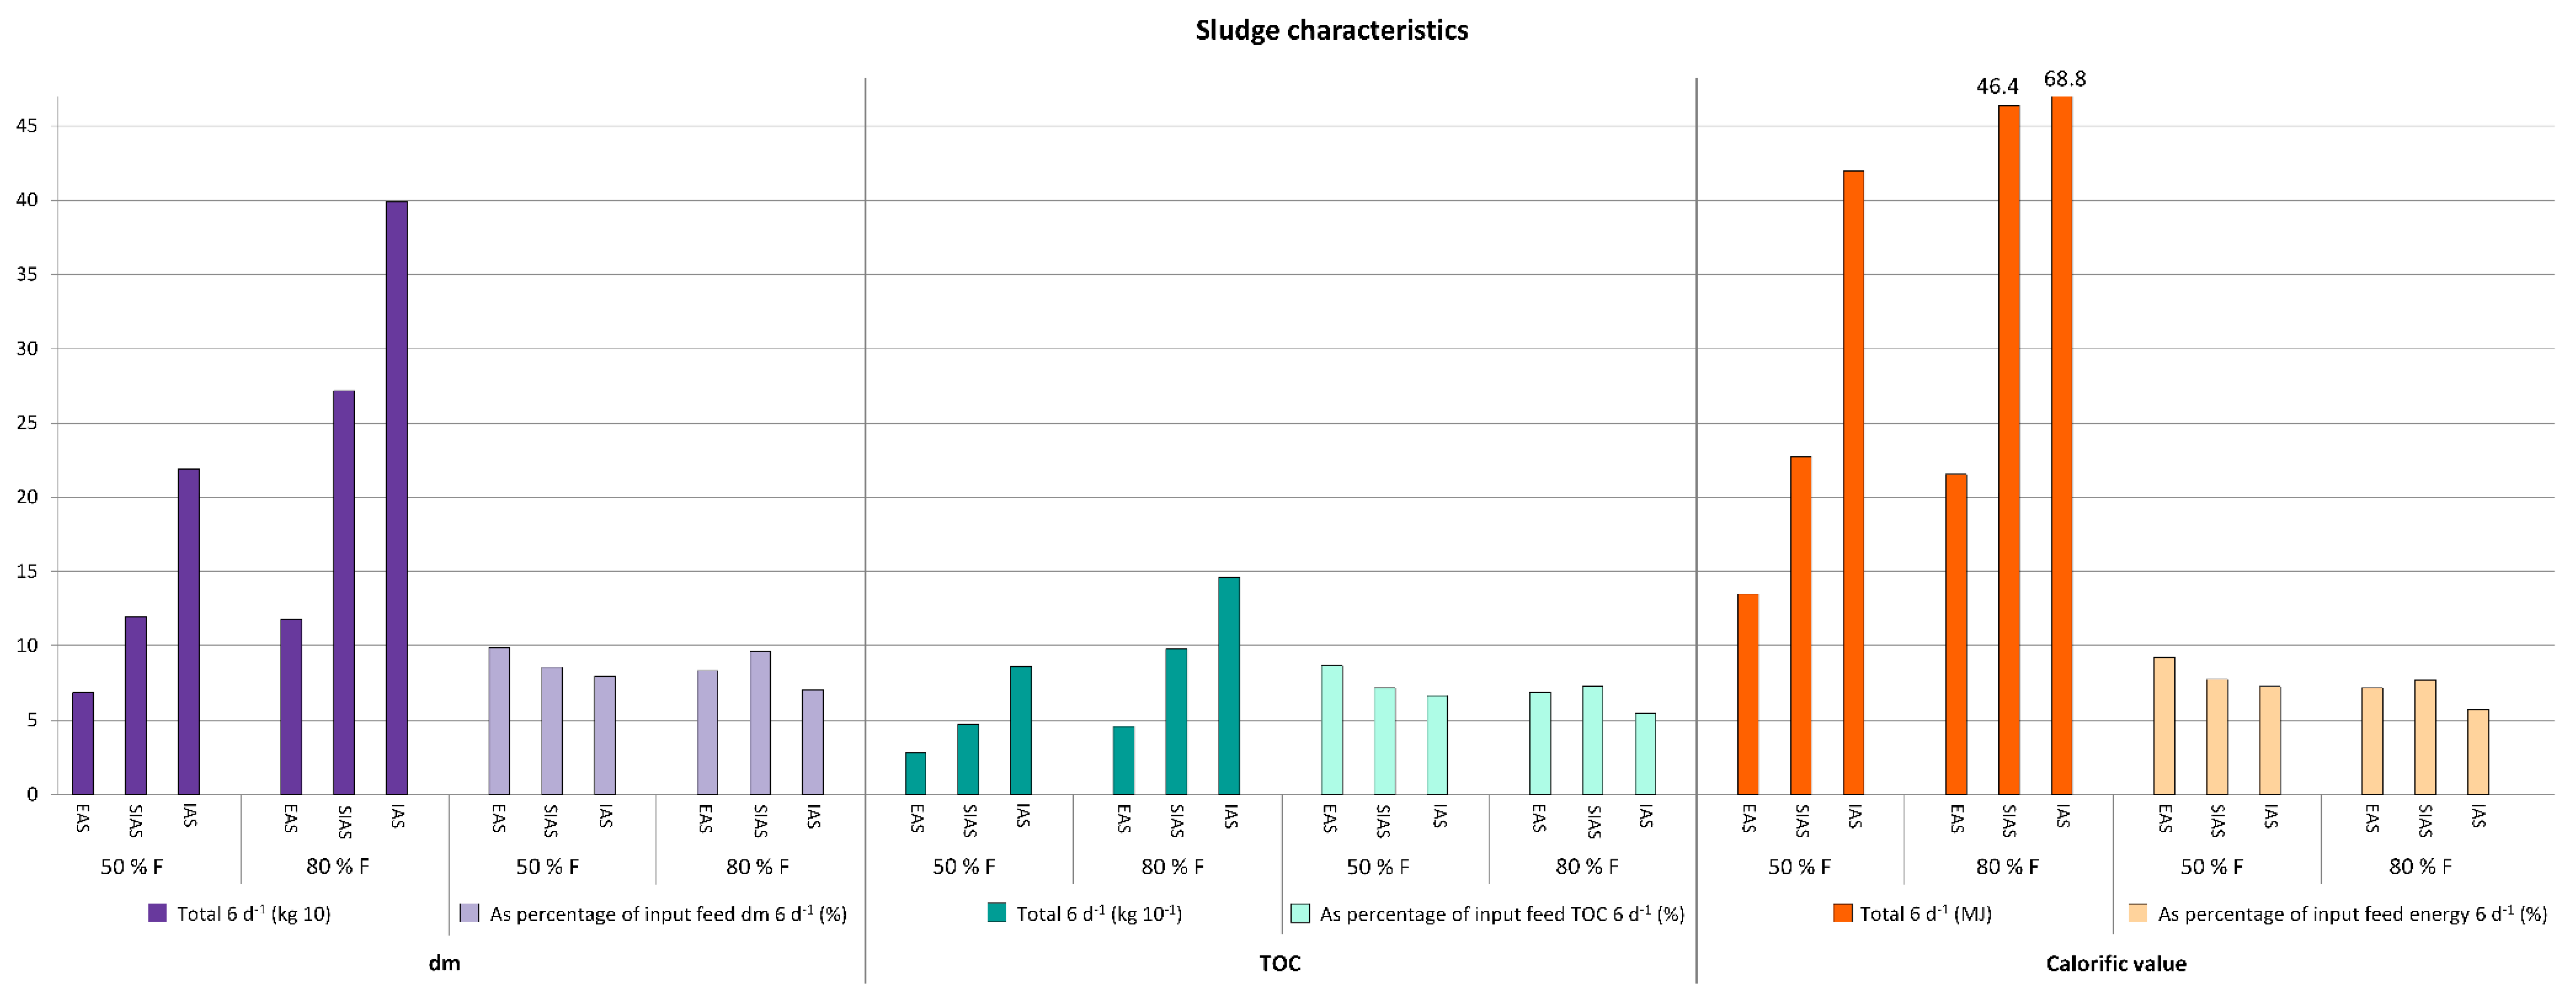
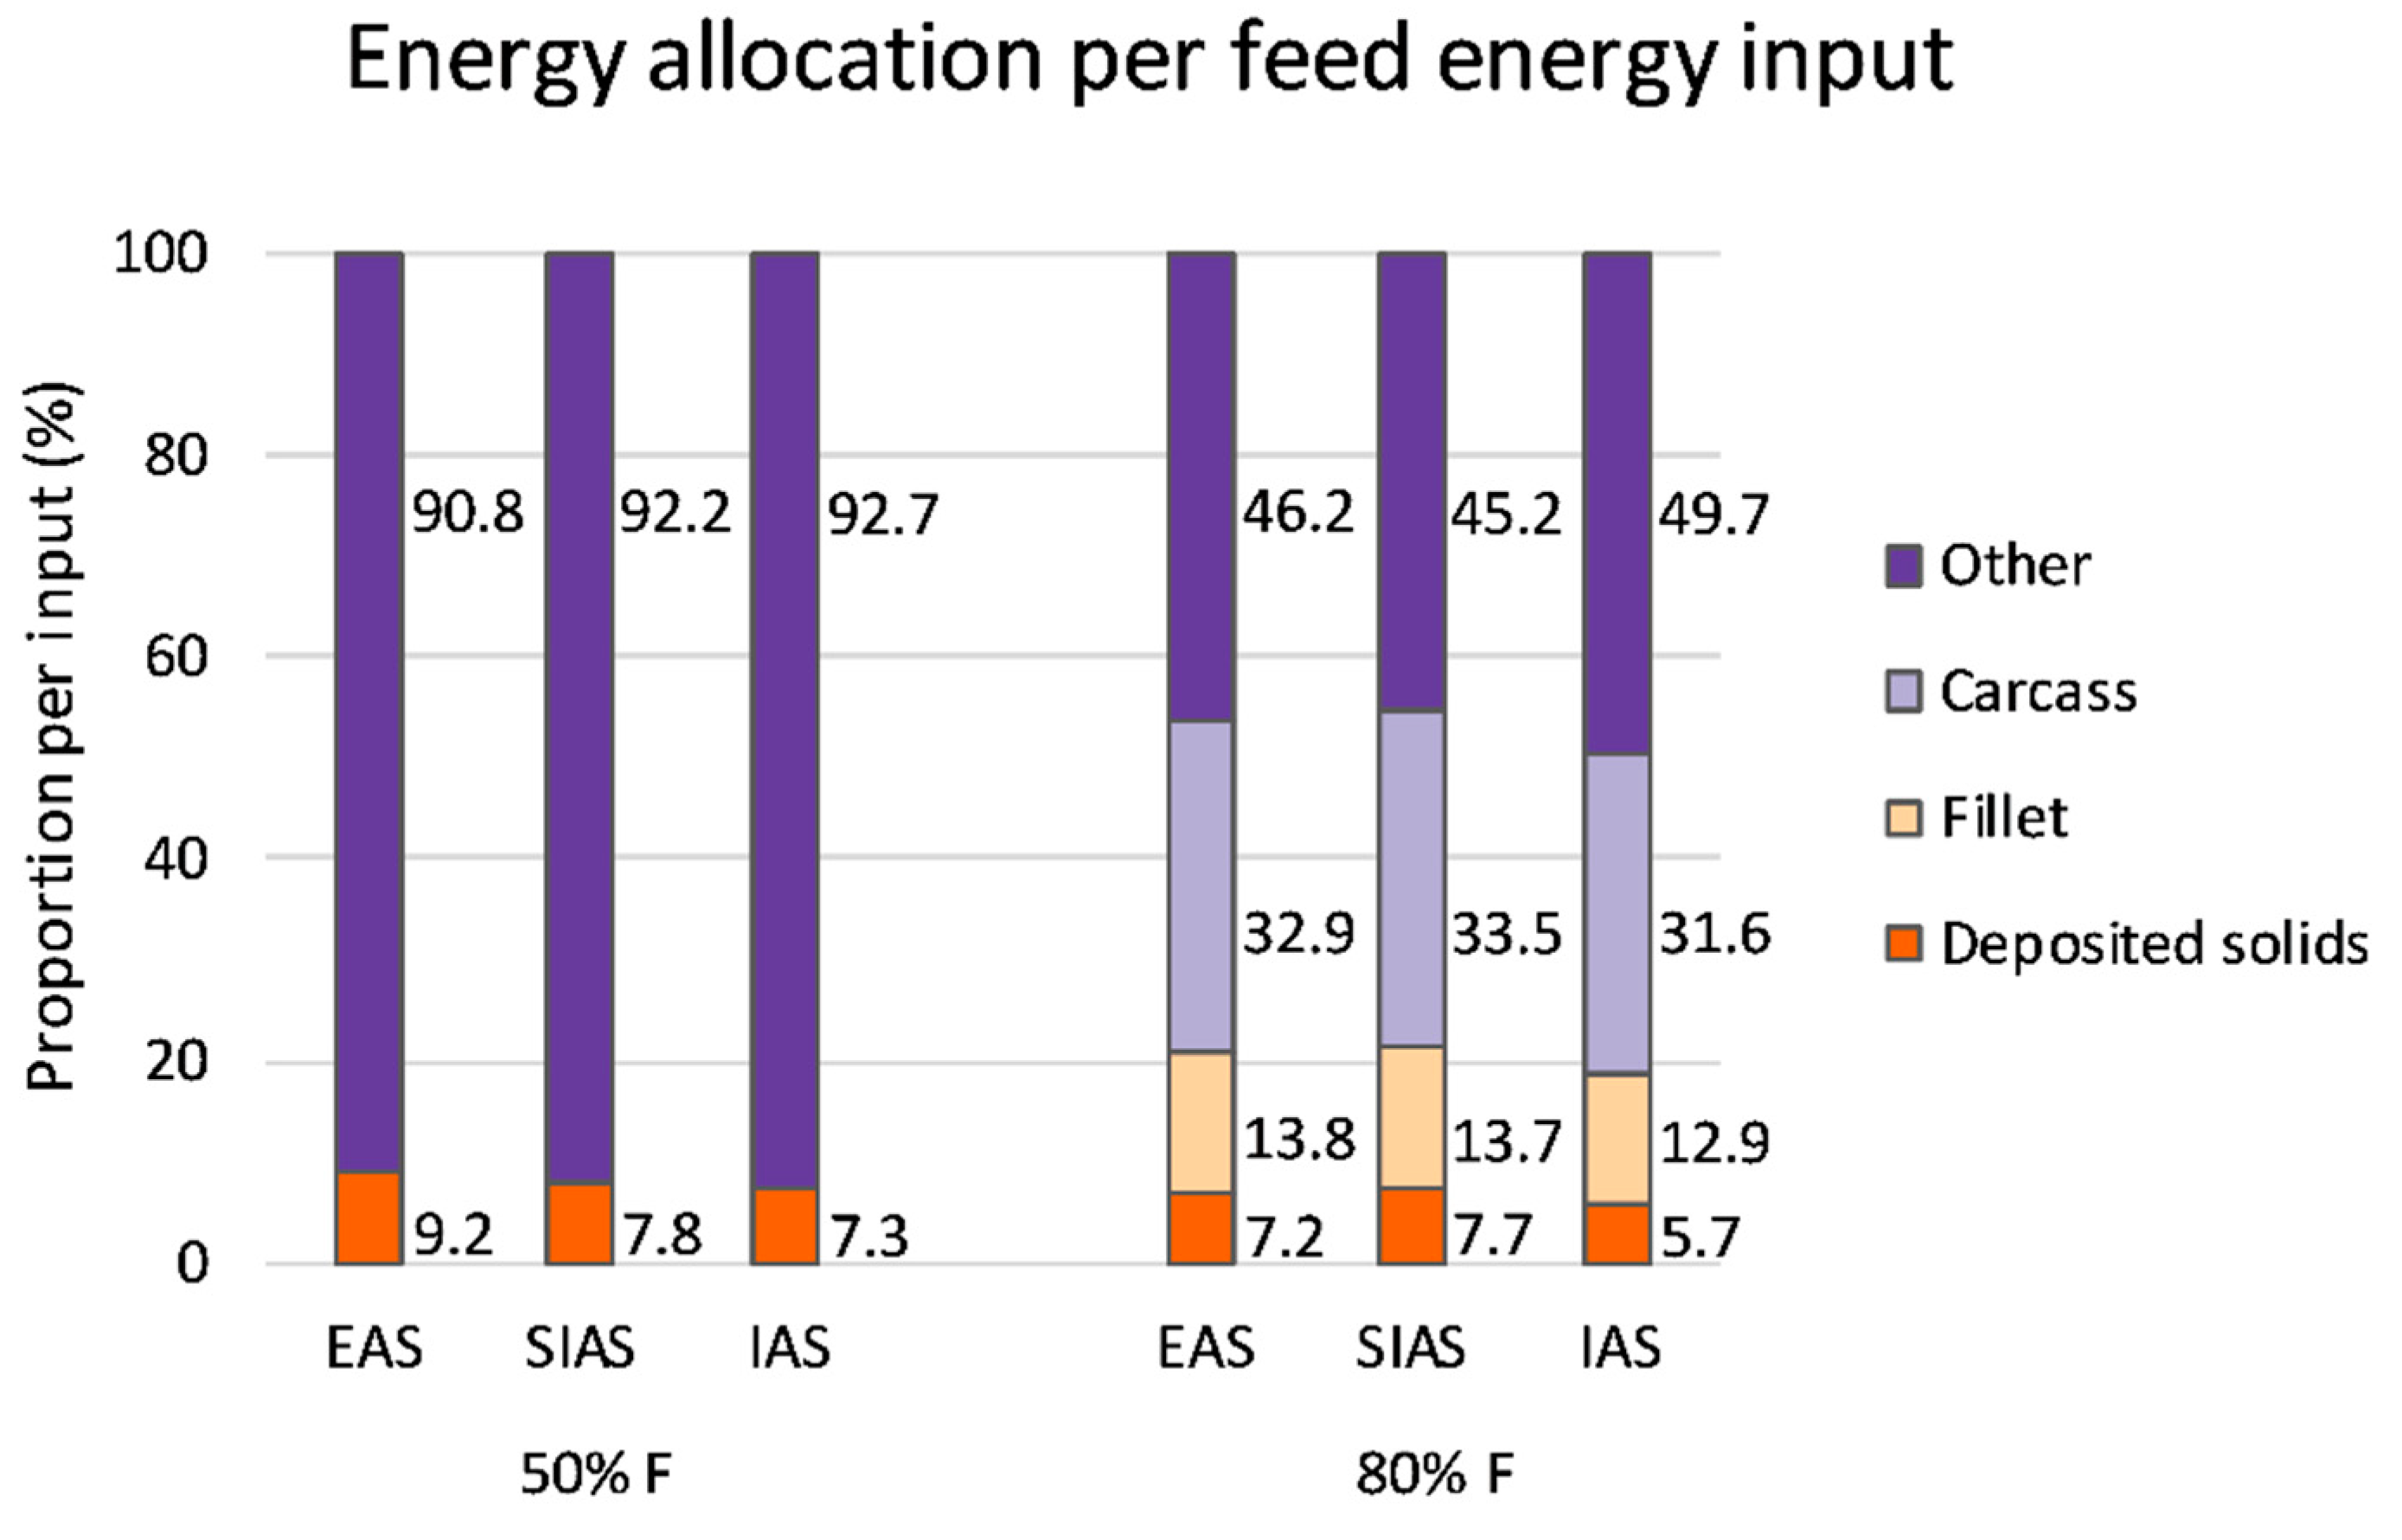
Biogas production: We found that 5 to 10% of the energy input (by feed) is recovered in the deposited solid wastes. Mirzoyan and Gross [52] stated that 2 to 4% of the RAS energy demands could be covered by using the energetic potential of the remaining sludge by anaerobic digestion (AD). Recommendations on stable operation in AD depend on multiple parameters, i.e., C/N-ratio (TC/TN) TOC, pH, nutrient and trace elements (Table 9) [53]. When compared with these recommendations, the C/N-ratio in our study was about 1.1–3.8 times lower. At low C/N-ratio, N can undergo excessive formation of ammonia (NH3), which, even at low concentrations, inhibits the growth of bacteria and may lead to a complete collapse of the entire microorganism population [53,54]. The N:P:S-ratio differed only in small extend from the recommendation of [53], as P is elevated in relation to N and S. The supply of a carbon source can enhance the AD process stability and biogas formation, as for example the addition of cellulose to RAS sludge [52]. The total organic carbon content (TOC) of the investigated dry RAS sludge is with 36% to 42% lower as typical biogas substrates. For example, the TOC of manure ranges from 68 to 86% [53], of vinasse, a liquid waste from sugar cane ethanol production, from 80 to 85% [54]. Together with the low dm content of the fresh sludge a low specific biogas and methane yield from the studied catfish solids could be expected.
Biogas and methane tests of different studies demonstrate broad variety of test arrangements, substrates and results. Mirzoyan and Gross [52] reached a stable AD performance with sludge from brackish RAS (mono fermentation) by using UASB reactors and reached a maximal biogas production rate of 11.1 to 14.6 mL⋅g−1 vs. d−1 respectively 4.2 to 5.5 mL⋅g−1 CODadd.d−1, while the methane concentration of the biogas was only 4% to 15%. Zhang et al. [55] found a comparable high maximum specific methane yield of 203 mL CH4 g−1 CODadd. at organic load rate (OLR) of 4.4 kg COD m−3 d−1 for concentrated salty sludge from a brackish RAS. In a review study, Mirzoyan and Gross [52] reported specific methane yields between 20 and 250 mL CH4 g−1 CODadd. and methane concentrations from 30 to 80%.
Other authors found for sludge from a rainbow trout RAS also a high biochemical methane potential (BMP) of 318 ± 29 mL CH4 g−1 VS (volatile solid) [56]. Lanari and Franci [57] found for sludge from rainbow trout RAS, by using a fixed bed up-flow reactor, CH4 concentrations of >80% and very high specific methane yields from 400 to 460 mL CH4 g−1 VS.
In commercial biogas plants, the methane concentration of the produced biogas ranges between 45 and 70%, the specific methane yield of liquid manure between 210 and 250 mL CH4 g−1 VS and of silage maize about 340 mL CH4 g−1 VS [49]. Data for AD of sludge from fresh water RAS for fish species with high temperature demand are not available.
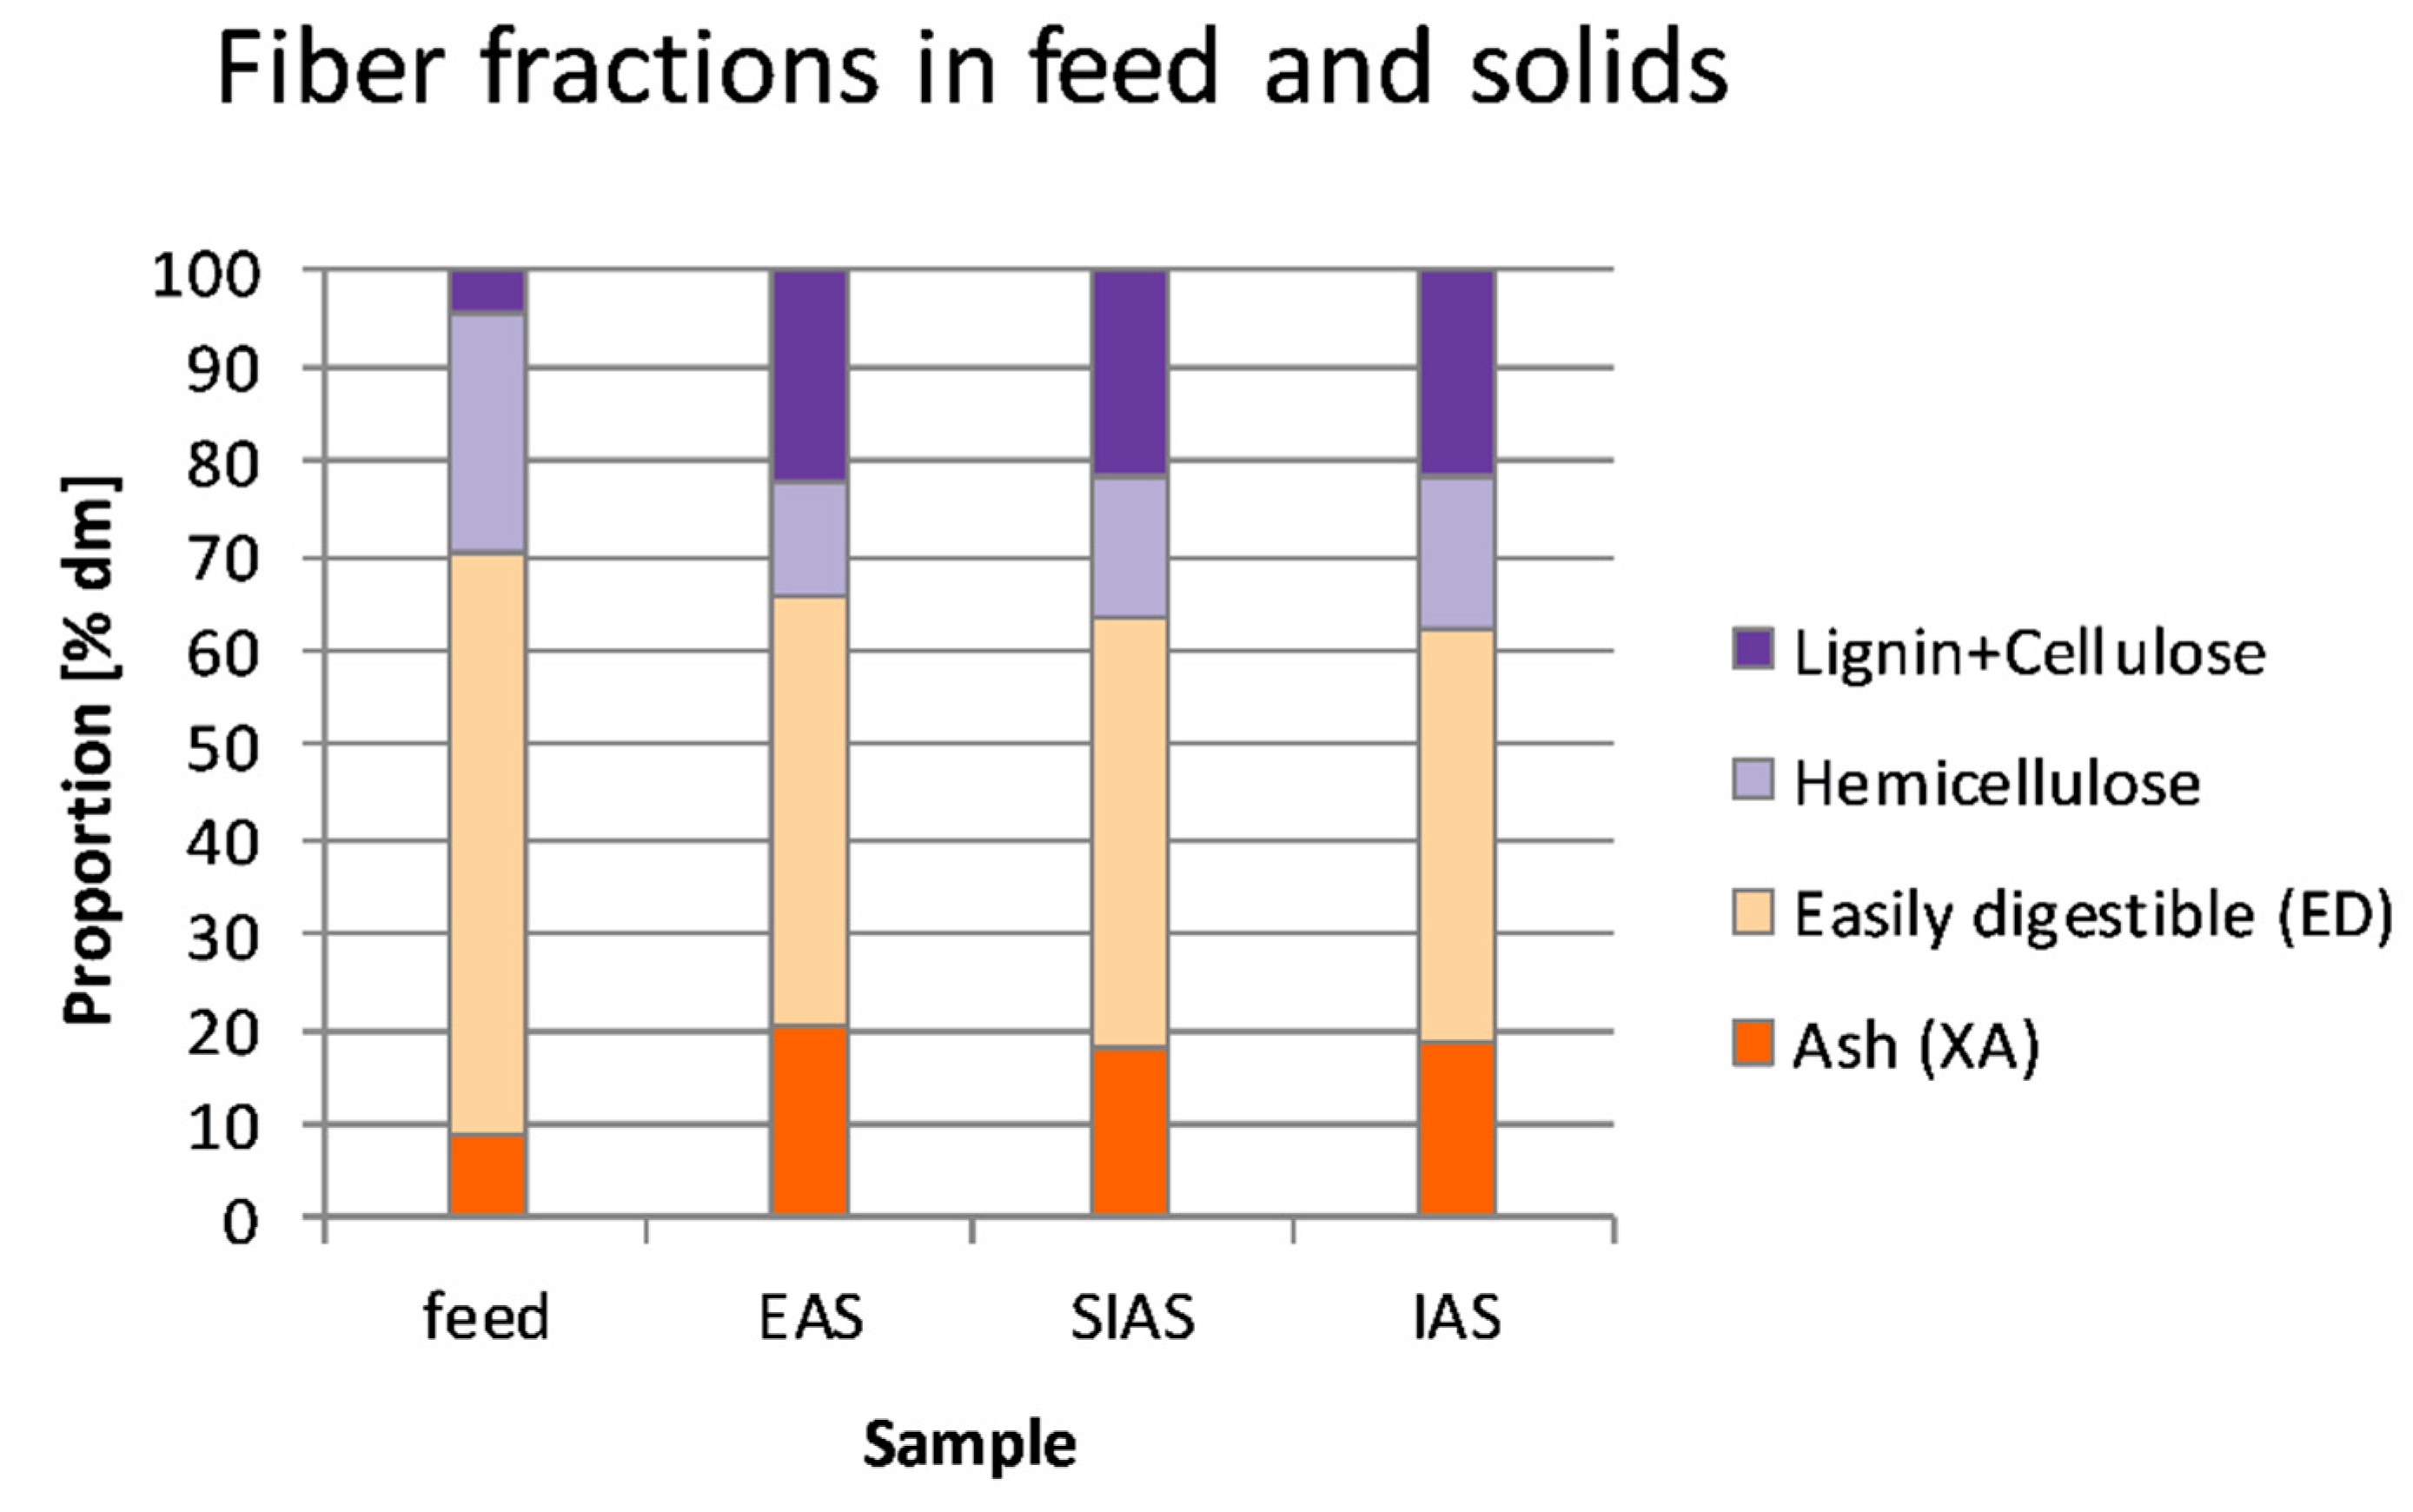
The applied methodology of fiber analyses was introduced for vegetable origin feed. The results of the fiber analysis investigations of fish feed and RAS sludge gave an indication on the principle digestibility. As a result, it could be found that the characteristics of the RAS sludge are in some parameters similar with typical biogas substrates as maize or grass silage. The as not digestible regarded ADF content of the dry sludge was with 21 to 23% comparable with the ADF of maize silage (18–25% [58]). The NDF content, which includes ADF and hemicellulose of the dry sludge, was with 34 to 38% in the range of with maize silage (35–40% [58]). The as digestible regarded hemicellulose content of the dry sludge was with 12 to 16% lower than reported for maize or maize silage (21–23% [59]), respectively (17–18% [58]) but in the range of grass silage (15–18% [58]). In maize silage, the aimed content of easy digestible (ED) content is 55 to 60%. Since the ED of the dry RAS sludge reached 44 to 43%, a medium specific biogas and methane yield related to the dry mass or volatile solids could be expected. The high water content of the fresh sludge reduced this dramatically. The found dm content of 0.06 to 0.24% is much lower than in other agricultural residues as liquid manure with average 6% [53]. Assuming a 3% dm and 40% TOC content and a methane yield of 300 mL CH4 g−1 VS of RAS sludge, the specific methane yield related to the fresh mass would only be 3.6 mL CH4 g−1 FM (fresh mass). Based on this, with the investigated RAS sludge, a specific methane yield between 0.08 and 0.29 mL CH4 g−1 FM could be expected. The average specific methane yield of maize silage with 106 mL CH4 g−1 FM and even of pig slurry with 17 mL CH4 g−1 FM is considerable higher (average dm content: maize silage 33%, pig slurry 6% [53]). New RAS sludge separation technologies are promising regarding the dm content, up to 18% could be reached [60]. It could be assumed that with increasing dm content also the methane yield related to the fresh matter will increase considerable. This is important for economic considerations (investments versus energy yield), but also for the usability of the produced biogas.
The element concentration of the fresh RAS sludge is mostly lower than recommended optimum for the anaerobic digestion process [53]. Only Ni at intensive RAS (IAS) and feeding regime 80% already reached the optimum. Minimal concentrations are reached or closely reached for Ni, Se, Mn and Fe (Table 9). With increasing dm content of fresh sludge, higher concentrations of the investigated elements could be expected what may result in excess concentrations of some elements or imbalances, which may affect the digestive process.
Vermifiltration: The treatment of organic wastes by Vermifiltration has gained much attention in recent years [61]. Evidence suggests high capacity to mineralize nutrients [62] and the remediation of pollutant elements [63]. The experimental use of worms to treat distillery waste water demonstrated removal of about 91% BOD, 89% COD, 90–92% TDS and 92% TSS [64]. Earthworm digestion activity and accompanied microbial decomposition though, are severely affected by temperature, pH and C/N-ratio and moisture content of the substrate. Optima for those parameters depend on the species used. The commonly used red wiggler (Eisenia fetida) thrives best between 20 and 29 °C in horse manure substrate [65]. Hughes et al. [66] reported tolerance levels towards pH between pH 4–9, while Jicong et al. [67] found pH range to be much smaller (6.5–8.6). Minimum pH value during this experiment was 4.17 (EAS) while maximum was 6.22 (SIAS). Given these values in catfish production would require pH adjustment of sludge prior to vermifiltration. Raising process water pH to levels of about 6.8 to 7.5 may also benefit efficiency of the nitrifying biofilter [68] and plant nutrient uptake in hydroponics [69]. Decomposition by microbes and worm feeding activity is most effective at C/N-ratio of 25 [70]. Considering that the average C/N-ratio of African catfish solid wastes detected here range from 7.4 (EAS) to 9.2 (IAS), sludge treatment by vermifiltration would require addition of organic carbon, such as cardboard, cotton wastes, wood chips, etc. If integrated systems such as aquaponics are used, the supply of organic C may be supplied by plant by products, such as the stems of tomato plants. The optimum moisture content for vermifiltration was reported to range from 75 to l90% [71]. As the moisture content of the effluent sludge was ≥99.76%, alternative solids separation would be required in order to achieve adequate dm content. Modern mechanical filters, such as ‘disc filters’, achieve moisture content of 82% [60], suggesting ideal conditions for vermifiltration.
Aquaponics farming: A most recent nomenclature of aquaponics allows aquaponic production systems under use of soil and substrates [16]. Considering the challenges and constraints associated with biogas production and vermifiltration, the reuse of the aquaculture sludge as fertilizer on arable land may be a practical solution [25]. This holds especially true when considering the reuse of P, because when compared with mineral fertilizers, the fish sludge contains higher P/U-ratio. First investigations of this reuse option were carried out by Brod et al. [25] in Norway. In direct comparison of fish solid wastes from smolt aquaculture with conventional fertilizers on the productivity of wheat and barley, an agronomic efficiency of 50–80% was achieved.
Table 10 shows the deviation of the clarifier effluents from our experiment from the recommended fertilizer composition by [32]. It is evident, that when the nutrient concentrations contained in the process water are combined with those concentrations contained inside the solid wastes, the overall nutrient concentrations can be increased, and specific deficiencies can be balanced. This holds especially true for the macro-nutrients N, P, Ca, and the micro-nutrients Fe, Cu, Mn, and at lower extend, Mo. Specific nutrient deficiencies of the mixture are given for K, Mg, S and Mo. When compared with the concentrations of fish sludge by [25] only minor differences are given for N, P and Ca, suggesting similar agronomic efficiency for African catfish sludge in aquaponics farming [16].

4.4. Unaccounted Elements

Considering all the input of nutritive and pollutant elements by feed and water, our mass balance calculations revealed deficit and excess quantities in the total nutrient outputs. In our experiment, the fraction of the suspended solids and the biofilms were not assessed and therefore the nutritive and pollutant element loads contained in them are unaccounted for. This potential elemental sink has been discussed previously [18]. Indeed, there is much evidence for a high capacity of suspended solids, especially the microbiota to concentrate nutritive [72,73] and pollutant [74,75,76] elements. Different mechanisms causing this phenomenon are understood, i.e., microbial absorption [72,75,76] or adhesion [74]. For instance, our mass balance revealed much unaccounted K. In general, K-salts are highly soluble in water [77], so it should be expected that most K can be detected inside the process water. As all water input was exactly monitored, unintended water loss cannot account for loss of K from the RAS. Pilwat and Zimmermann [72] demonstrated that E-coli bacteria can concentrate K in the cytoplasm by a factor 50 when compared with the external medium. Although Pantanella et al. [78] did not find any E. coli bacteria in aquaponic process water, microorganisms are highly abundant in RAS [79]. Consequently, the abundance of microorganisms could be a sink for some undetected elements. This theory is supported by Monsees et al. [49], who demonstrated that aerobic and anaerobic sludge digestion liberates significant amounts of K. In our RAS, the highest surface area for microbiota is the biofilter. The microbial biofilm that abrades off its surface gets caught in the biofilter collecting tank, where we observed regular accumulation of solids. In this respect, we strongly recommend assessing the role of the microbiota in the accumulation of nutritive and pollutant elements in African catfish RAS.
Aside from sorption (in) to fine solid particles, loss of N and possibly S is also affected by anoxic microbial activity. Considering N, the total output relative to the total input reduced with the increase of production intensity and F, resulting in unaccounted N in the EAS, SIAS and IAS of 39.9, 37.4, and 44.1% during 80% F. Bovendeur et al. [7] recorded that in African catfish pilot reactors, denitrification in lamella inserts of sedimentation tanks can result in nitrate loss of 40–80%. Considering, that in our experiment the concentrations of NO3 relative to the amount of feed input decreased with increase of production intensity and F, we suggest that microbial denitrification in the anoxic zones in the RAS act as the predominant sink for NO3-N. Under consideration of lower oxygen values under 80% F, an increase in production intensity stimulates anoxic processes inside the clarifiers, causing denitrification by using TOC as electron donor, reducing the nutrient efficiency as well as availability of plant available N in an aquaponic system as a hole. Palm et al. [8] suggested an oxygen threshold of <6 mg L−1 in commercial catfish RAS. We therefore recommend identifying adequate technical solutions that either increase the oxygen value inside the system or remove solid wastes instantly in African catfish RAS with minimum use of water and labor.
We also found, that the amount of the Fe and Cu, in the sludge was larger than there was put in with the feed. These quantities may likely be from dissolution of system components [6] as they resemble elements typically used in steel.

5. Conclusions

The aim of our study was to recommend optimum reuse options of energy and nutrients from the output along the process water, fish carcass and sludge in African catfish RAS. We accounted approx. 46–51% and 55–62% of TOC and N as well as 50–55% of the original energy input, leaving about 40% of the targeted nutrients and energy unaccounted for. Best values were recorded for P, with 58–64% of the input P ending in the fish, 10–15% in the waste water and 11–22% in the solids. In order to achieve optimum reuse of nutrients from African catfish RAS, and adverse C/N ratio and low contents in the solids prevent solely use of the sediments for biogas production, alternative options must be applied. The recovery of energy from the sludge by anaerobic digestion is only practical as co-substrate in combination with substantial amounts of energy rich organic carbon substrate. Despite the high nutrient efficiency of African catfish, a portion of nutrients is still unaccounted for. Only plant essentially P was recovered by 84–89%, most of it remaining inside the carcass. This suggests new strategies to exploit this energy and nutrient rich resource, and beside animal feeds, to recover and reuse P.
The process water and the sludge were found to be rich in plant essential macro- and micro-nutrients, however, in much lower concentrations used in traditional fertilizers. Both can be used as potential resource in aquaponics in the sense of Palm et al. [16], in addition with regular fertilizer (aquaponics s.s.), or in direct use for aquaponics (s.l.) farming. The former requires tolerant plants like mint or basil as produce without complicate adjustment of the water quality. For more demanding plants, the overall nutrient concentrations as well as the relative proportions of K and Fe are insufficient and require new strategies of fertilizer supplementation. Aerobic digestion treatment of solid wastes or sludge by using microorganisms or vermifiltration would require addition of alkalinity and organic C for pH and C/N adjustment. We are aware that the chosen feed had a direct influence on the observed output values and nutrient dynamics. However, because all biotic and abiotic dynamics inside RAS are caused by the general element properties (aerobic/anaerobic processes, mineralization, adhesion) our findings are applicable also for other RAS, as they allow to estimate the general trends that occur under the conditions described in our study.

Supplementary Materials

The following are available online at https://www.mdpi.com/2071-1050/10/6/1805/s1, Table S1: Allocation of nutritive and pollutant elements between fish fillet and carcass (%), Table S2: Analyzed feed composition, Table S3: Input of nutritive and pollutant elements (%) by feed and water, Table S4: Element recovery in process water, fish, deposited solids and other per element input (%).

Author Contributions

S.M.S.: Main writing, analyses of nutrient fluxes and budgets. L.C.W.: Element analyses, nutrient calculations, main sampling, material and methods, figures. A.B.: Nutrient cycles. O.D.: Element analyses, material and methods. J.K.: Vermifiltration. A.S.: Energy content and fiber analyses, interpretation of results. B.W.: Fish quality analyses, interpretation of results. H.W.P.: Planning of experiments, manuscript structure and writing.

Funding

This research was funded by the pilot project FishGlassHouse: Innovationsinitiative zur ressourceneffizienten Nahrungsmittelproduktion in MV (European Fisheries Fund-EFF), grant number VI-560/730-32616-2013/025; the Ministry of Agriculture, Environment and Consumer Protection of Mecklenburg Western Pomerania, grant number BNRZD: 13 903 000 0103; the EIP-AGRI operational groups, grant number WM-EIP-0007−1 5; the Leibniz Science Campus Phosphorus Research Rostock, grant number SAS-2015-IOW-LWC. We acknowledge financial support by Deutsche Forschungsgemeinschaft and Universität Rostock/Universitätsmedizin Rostock within the funding program Open Access Publishing.

Acknowledgments

We thank Anne Köhler and Ines Scherff (IOW) for technical support during element analytics, and Peggy Wefers and Kersten Eckermann (Uni Rostock, AUF), for technical support during calorific and fiber analysis. We thank Stefan Theisen, Florian Pach, Harvey Harbach, Jan Eike Krämer, Phillip Schneider, Julia Zimmermann and Monique Fouquet for their support during fish weighing and other activities. We thank Dana Zimmer for advise on notations. We like to thank the guest editors Gerald Steiner and Bernhard Geissler for giving us the opportunity to publish in the special issue “Phosphorus Circular Economy: Closing Loops through Sustainable Innovation”, as well as the reviewers of this manuscript for their constructive feedback.

Conflicts of Interest

The authors declare no conflict of interests.

References

  1. Rockström, J.; Steffen, W.; Noone, K.; Persson, Å.; Chapin, F.S., III; Lambin, E.F.; Lenton, T.M.; Scheffer, M.; Folke, C.; Schellnhuber, H.J.; et al. A safe operating space for humanity. Nature 2009, 461, 472–475. [Google Scholar] [CrossRef] [PubMed]
  2. Rockström, J.; Sachs, J.D.; Öhman, M.C.; Schmidt-Traub, G. Sustainable Development and Planetary Boundaries. Background Research Paper Submitted to the High Level Panel on the Post-2015 Development Agenda; Sustainable Development Solutions Network: Paris, France; New York, NY, USA, 2013. [Google Scholar]
  3. Tyson, R.V.; Treadwell, D.D.; Simonne, E.H. Opportunities and challenges to sustainability in aquaponic systems. Horttechnology 2011, 21, 6–13. [Google Scholar]
  4. Badiola, M.; Mendiola, D.; Bostock, J. Recirculating Aquaculture Systems (RAS) analysis: Main issues on management and future challenges. Aquac. Eng. 2012, 51, 26–35. [Google Scholar] [CrossRef]
  5. Martins, C.I.M.; Eding, E.H.; Verdegem, M.C.; Heinsbroek, L.T.; Schneider, O.; Blancheton, J.P.; Roques d’Orbcastel, E.; Verreth, J.A.J. New developments in recirculating aquaculture systems in Europe: A perspective on environmental sustainability. Aquac. Eng. 2010, 43, 83–93. [Google Scholar] [CrossRef]
  6. Blancheton, J.P.; Piedrahita, R.; Eding, E.H.; Lemarie, G.; Bergheim, A.; Fivelstad, S.; Roque D’Orbcastel, E. Intensification of landbased aquaculture production in single pass and reuse systems. In Aquacultural Engineering and Environment; Bergheim, A., Ed.; Research Signpost: Trivandrum, India, 2007; pp. 21–47. ISBN 9788130801995. [Google Scholar]
  7. Bovendeur, J.; Eding, E.H.; Henken, A.M. Design and performance of a water recirculation system for high-density culture of the African catfish, Clarias gariepinus (Burchell 1822). Aquaculture 1987, 63, 329–353. [Google Scholar] [CrossRef]
  8. Palm, H.W.; Knaus, U.; Wasenitz, B.; Bischoff, A.A.; Strauch, S.M. Proportional up scaling of African catfish (Clarias gariepinus Burchell, 1822) commercial recirculating aquaculture systems disproportionally affects nutrient dynamics. Aquaculture 2018, 491, 155–168. [Google Scholar] [CrossRef]
  9. Van de Nieuwegiessen, P.G.; Olwo, J.; Khong, S.; Verreth, J.A.; Schrama, J.W. Effects of age and stocking density on the welfare of African catfish, Clarias gariepinus Burchell. Aquaculture 2009, 288, 69–75. [Google Scholar] [CrossRef]
  10. Elies, R.; (Fischgut Nord eG/PAL Anlagenbau GmbH & Co. KG, Abtshagen, Germany). Personal communication, 2017.
  11. Good, C.; Davidson, J.; Welsh, C.; Brazil, B.; Snekvik, K.; Summerfelt, S. The impact of waterexchange rate on the health and performance of rainbow trout Oncorhynchus mykiss in water recirculation aquaculture systems. Aquaculture 2009, 294, 80–85. [Google Scholar] [CrossRef]
  12. Martins, C.I.; Eding, E.H.; Verreth, J.A. The effect of recirculating aquaculture systems on the concentrations of heavy metals in culture water and tissues of Nile tilapia Oreochromis niloticus. Food Chem. 2011, 126, 1001–1005. [Google Scholar] [CrossRef]
  13. Mota, V.C.; Limbu, P.; Martins, C.I.; Eding, E.H.; Verreth, J.A. The effect of nearly closed RAS on the feed intake and growth of Nile tilapia (Oreochromis niloticus), African catfish (Clarias gariepinus) and European eel (Anguilla anguilla). Aquac. Eng. 2015, 68, 1–5. [Google Scholar] [CrossRef]
  14. Jia, Y.; Wang, L.; Qu, Z.; Wang, C.; Yang, Z. Effects on heavy metal accumulation in freshwater fishes: Species, tissues, and sizes. Environ. Sci. Pollut. Res. Int. 2017, 24, 9379–9386. [Google Scholar] [CrossRef] [PubMed]
  15. Schmidt-Puckhaber, B. Fisch vom Hof?: Fischerzeugung in Standortunabhängigen Kreislaufanlagen, 1st ed.; DLG-Verlag: Frankfurt am Main, Germany, 2010; ISBN 9783769007275. [Google Scholar]
  16. Palm, H.W.; Knaus, U.; Appelbaum, S.; Goddek, S.; Strauch, S.M.; Vermeulen, T.; Jijakli, M.H.; Kotzen, B. Towards commercial aquaponics: A review of systems, designs, scales and nomenclature. Aquac. Int. 2018, 26, 813–842. [Google Scholar] [CrossRef]
  17. Junge, R.; König, B.; Villarroel, M.; Komives, T.; Jijakli, M.H. Strategic points in aquaponics. Water 2017, 9, 182. [Google Scholar] [CrossRef]
  18. Delaide, B.; Delhaye, G.; Dermience, M.; Gott, J.; Soyeurt, H.; Jijakli, M.H. Plant and fish production performance, nutrient mass balances, energy and water use of the PAFF Box, a small-scale aquaponic system. Aquac. Eng. 2017, 78, 130–139. [Google Scholar] [CrossRef]
  19. Delaide, B.; Goddek, S.; Gott, J.; Soyeurt, H.; Jijakli, M.H. Lettuce (Lactuca sativa L. Var. Sucrine) growth performance in complemented aquaponic solution outperforms hydroponics. Water 2016, 8, 467. [Google Scholar] [CrossRef]
  20. Seawright, D.E.; Stickney, R.R.; Walker, R.B. Nutrient dynamics in integrated aquaculture–hydroponics systems. Aquaculture 1998, 160, 215–237. [Google Scholar] [CrossRef]
  21. Diver, S. Aquaponics-Integration of Hydroponics with Aquaculture; ATTRA: Melbourne, Australia, 2006. [Google Scholar]
  22. Rakocy, J.E. Aquaponics Q and A (The Answers to Your Questions about Aquaponics); Nelson and Pade: Montello, WI, USA, 2011; ISBN 978-0-9779696-3-0. [Google Scholar]
  23. Palm, H.W.; Bissa, K.; Knaus, U. Significant factors affecting the economic sustainability of closed aquaponic systems. Part II: Fish and plant growth. AACL Bioflux 2014, 7, 162–175. [Google Scholar]
  24. Knaus, U.; Palm, H.W. Effects of fish biology on ebb and flow aquaponical cultured herbs in northern Germany (Mecklenburg Western Pomerania). Aquaculture 2017, 466, 51–63. [Google Scholar] [CrossRef]
  25. Brod, E.; Oppen, J.; Kristoffersen, A.Ø.; Haraldsen, T.K.; Krogstad, T. Drying or anaerobic digestion of fish sludge: Nitrogen fertilisation effects and logistics. Ambio 2017, 46, 852–864. [Google Scholar] [CrossRef] [PubMed]
  26. Heinrichs, H.; Brumsack, H.J.; Loftfield, N.; König, N. Verbessertes Druckaufschlußsystem für biologische und anorganische Materialien. J. Plant Nutr. Soil Sci. 1986, 149, 350–353. [Google Scholar] [CrossRef]
  27. Naumann, C.; Bassler, R.; Seibold, R.; Barth, C. Methodenbuch, Band 3: Die Chemische Untersuchung von Futtermitteln, 3rd ed.; VDLUFA Verlag: Darmstadt, Germany, 1997; Volume 3, pp. 1–6, ISBN 3922712142, 9783922712145. [Google Scholar]
  28. Oellermann, L.K. A comparison of the Aquaculture Potential of Clarias gariepinus (Burchell, 1822) and Its Hybrid with Heterobranchus longifilis Valenciennes, 1840 in Southern Africa. Ph.D. Thesis, Rhodes University, Grahamstown, South Africa, 1995. [Google Scholar]
  29. Schram, E.; Roques, J.A.; Abbink, W.; Spanings, T.; De Vries, P.; Bierman, S.; van de Vis, H.; Flik, G. The impact of elevated water ammonia concentration on physiology, growth and feed intake of African catfish (Clarias gariepinus). Aquaculture 2010, 306, 108–115. [Google Scholar] [CrossRef]
  30. Roques, J.A.; Schram, E.; Spanings, T.; Schaik, T.; Abbink, W.; Boerrigter, J.; de Vries, P.; van de Vis, H.; Flik, G. The impact of elevated water nitrite concentration on physiology, growth and feed intake of African catfish Clarias gariepinus (Burchell 1822). Aquac. Res. 2013, 46, 1384–1395. [Google Scholar] [CrossRef]
  31. Schram, E.; Roques, J.A.; Abbink, W.; Yokohama, Y.; Spanings, T.; de Vries, P.; Bierman, S.; van de Vis, H.; Flik, G. The impact of elevated water nitrate concentration on physiology, growth and feed intake of African catfish Clarias gariepinus (Burchell 1822). Aquac. Res. 2014, 45, 1499–1511. [Google Scholar] [CrossRef]
  32. Trejo-Téllez, L.I.; Gómez-Merino, F.C. Nutrient solutions for hydroponic systems. In Hydroponics–A Standard Methodology for Plant Biological Researches; Asao, T., Ed.; InTech: London, UK, 2012; pp. 1–22. ISBN 9789535103868. [Google Scholar]
  33. Roosta, H.R. Comparison of the vegetative growth, eco-physiological characteristics and mineral nutrient content of basil plants in different irrigation ratios of hydroponic: Aquaponic solutions. J. Plant Nutr. 2014, 37, 1782–1803. [Google Scholar] [CrossRef]
  34. Suhl, J.; Dannehl, D.; Kloas, W.; Baganz, D.; Jobs, S.; Scheibe, G.; Schmidt, U. Advanced aquaponics: Evaluation of intensive tomato production in aquaponics vs. conventional hydroponics. Agric. Water Manag. 2016, 178, 335–344. [Google Scholar] [CrossRef]
  35. Hamada, M.; Nagai, T.; Kai, N.; Tanoue, Y.; Mae, H.; Hashimoto, M.; Miyoshi, K.; Kumagai, H.; Saeki, K. Inorganic constituents of bone of fish. Fish. Sci. 1995, 61, 517–520. [Google Scholar] [CrossRef]
  36. Hoffman, L.C.; Casey, N.H.; Prinsloo, J.F. Fatty acid, amino acid and mineral contents of African sharptooth catfish (Clarias gariepinus) fillets. S. Afr. J. Food Sci. Nutr. 1992, 4, 36–40. [Google Scholar]
  37. Deng, O.O.; Mohamed, A.H.; Agib, M.A.; Fl-faki, F.E.; Ali, M.E. Comparative studies on nutritive value of wild and farmed African catfish Clarias gariepinus. Int. J. Fish. Aquat. Stud. 2016, 4, 327–329. [Google Scholar]
  38. Polak-Juszczak, L. Chemical characteristics of fishes new to the Polish market. Acta Sci. Pol. Piscaria 2007, 6, 23–32. [Google Scholar]
  39. Rosa, R.; Bandarra, N.M.; Nunes, M.L. Nutritional quality of African catfish Clarias gariepinus (Burchell 1822): A positive criterion for the future development of the European production of Siluroidei. Int. J. Food Sci. Technol. 2007, 42, 342–351. [Google Scholar] [CrossRef]
  40. Ersoy, B.; Özeren, A. The effect of cooking methods on mineral and vitamin contents of African catfish. Food Chem. 2009, 115, 419–422. [Google Scholar] [CrossRef]
  41. Wasenitz, B.; Karl, H.; Palm, H.W. Composition and quality attributes of fillets from different catfish species on the German market. J. Food Saf. Food Qual. 2018, 69, 57–65. [Google Scholar]
  42. Javed, M.; Usmani, N. Accumulation of heavy metals in fishes: A human health concern. Int. J. Environ. Stud. 2011, 2, 659. [Google Scholar]
  43. El-Moselhy, K.M.; Othman, A.I.; El-Azem, H.A.; El-Metwally, M.E.A. Bioaccumulation of heavy metals in some tissues of fish in the Red Sea, Egypt. EJBAS 2014, 1, 97–105. [Google Scholar] [CrossRef]
  44. Mahboob, S.; Al-Ghanim, K.A.; Alkahem Al-Balawi, H.F.; Al-Misned, F.; Ahmed, Z. Assessment of Accumulation of Trace Elements in Muscles, Gills, Liver and Intestine of Clarias gariepinus (Burchell, 1822) from Wadi Hanefah, Saudi Arabia. Pak. J. Zool. 2016, 48, 875–880. [Google Scholar]
  45. European Food Safety Authority (EFSA). Opinion of the scientific panel on contaminants in the food chain on a request from the European parliament related to the safety assessment of wild and farmed fish question N° efsa-q-2004-22. EFSA J. 2005, 365, 1–118. [Google Scholar]
  46. González, S.; Flick, G.J.; O’Keefe, S.F.; Duncan, S.E.; McLean, E.; Craig, S.R. Composition of farmed and wild yellow perch (Perca flavescens). J. Food Compost. Anal. 2006, 19, 720–726. [Google Scholar] [CrossRef]
  47. Colt, J. Water quality requirements for reuse systems. Aquac. Eng. 2006, 34, 143–156. [Google Scholar] [CrossRef]
  48. Cripps, S.J.; Bergheim, A. Solids management and removal for intensive land-based aquaculture production systems. Aquac. Eng. 2000, 22, 33–56. [Google Scholar] [CrossRef]
  49. Monsees, H.; Keitel, J.; Paul, M.; Kloas, W.; Wuertz, S. Potential of aquacultural sludge treatment for aquaponics: Evaluation of nutrient mobilization under aerobic and anaerobic conditions. Aquac. Environ. Interact. 2017, 9, 9–18. [Google Scholar] [CrossRef]
  50. Piedrahita, R.H. Reducing the potential environmental impact of tank aquaculture effluents through intensification and recirculation. Aquaculture 2003, 226, 35–44. [Google Scholar] [CrossRef]
  51. Van Rijn, J. Waste treatment in recirculating aquaculture systems. Aquac. Eng. 2013, 53, 49–56. [Google Scholar] [CrossRef]
  52. Mirzoyan, N.; Gross, A. Use of UASB reactors for brackish aquaculture sludge digestion under different conditions. Water Res. 2013, 47, 2843–2850. [Google Scholar] [CrossRef] [PubMed]
  53. Fachagentur Nachwachsende Rohstoffe e.V. (FNR). LEITFADEN BIOGAS Von der Gewinnung zur Nutzung, 7th ed.; Fachagentur Nachwachsende Rohstoffe e.V. (FNR): Gülzow-Prüzen, Germany, 2016; ISBN 3000143335. [Google Scholar]
  54. Janke, L.; Leite, A.F.; Batista, K.; Silva, W.; Nikolausz, M.; Nelles, M.; Stinner, W. Enhancing biogas production from vinasse in sugarcane biorefineries: Effects of urea and trace elements supplementation on process performance and stability. Bioresour. Technol. 2016, 217, 10–20. [Google Scholar] [CrossRef] [PubMed]
  55. Zhang, X.; Tao, Y.; Hu, J.; Liu, G.; Spanjers, H.; van Lier, J.B. Biomethanation and microbial community changes in a digester treating sludge from a brackish aquaculture recirculation system. Bioresour. Technol. 2016, 214, 338–347. [Google Scholar] [CrossRef] [PubMed]
  56. Suhr, K.I.; Letelier-Gordo, C.O.; Lund, I. Anaerobic digestion of solid waste in RAS: Effect of reactor type on the biochemical acidogenic potential (BAP) and assessment of the biochemical methane potential (BMP) by a batch assay. Aquac. Eng. 2015, 65, 65–71. [Google Scholar] [CrossRef] [Green Version]
  57. Lanari, D.; Franci, C. Biogas production from solid wastes removed from fish farm effluents. Aquat. Living Resour. 1998, 11, 289–295. [Google Scholar] [CrossRef]
  58. Dunker, M. Gras und Silomais neu Bewertet; LUFA-Fachinformation: Rostock, Germany, 2008. [Google Scholar]
  59. Schimpf, U. Enzymatischer Abbau des Lignocellulosekomplexes in Energiepflanzen unter Besonderer Berücksichtigung der Silierung und der Biogasproduktion. Ph.D. Thesis, Humboldt-Universität zu Berlin, Berlin, Germany, 2014. [Google Scholar]
  60. Scheibe, G.; (PAL-Aquakultur GmbH, Abtshagen, Germany). Personal communication, 2017.
  61. Sinha, R.K.; Herat, S.; Valani, D.; Chauhan, K. Earthworms—The environmental engineers: Review of vermiculture technologies for environmental management and resource development. Int. J. Glob. Environ. Issues 2010, 10, 265–292. [Google Scholar] [CrossRef]
  62. Sandell, L. Vermicompost for Reduction of Vegetable Waste-and a Possible Means to Produce Fish Feed in Aquaponic Systems? Epsilon Archive for Student Projects; SLU, Department of Biosystems and Technology: Uppsala, Sweden, 2014. [Google Scholar]
  63. Kumar, S.; Sharma, V.; Bhoyar, R.V.; Bhattacharyya, J.K.; Chakrabarti, T. Effect of heavy metals on earthworm activities during vermicomposting of municipal solid waste. Water Environ. Res. 2008, 80, 154–161. [Google Scholar] [PubMed]
  64. Manyuchi, M.M.; Mbohwa, C.; Muzenda, E. Biological treatment of distillery wastewater by application of the vermifiltration technology. S. Afr. J. Chem. Eng. 2018, 25, 74–78. [Google Scholar] [CrossRef]
  65. Kaplan, D.L.; Hartenstein, R.; Neuhauser, E.F.; Malecki, M.R. Physicochemical requirements in the environment of the earthworm Eisenia foetida. Soil Biol. Biochem. 1980, 12, 347–352. [Google Scholar] [CrossRef]
  66. Hughes, R.J.; Nair, J.; Mathew, K.; Ho, G. Toxicity of domestic wastewater pH to key species within an innovative decentralised vermifiltration system. Water Sci. Technol. 2007, 55, 211–218. [Google Scholar] [CrossRef] [PubMed]
  67. Huo, J.; Qiao, Y.; Liu, G.; Renjie, D. The Influence of Temperature, pH and C/N Ratio on the Growth and Survival of Earthworms in Municipal Solid Waste. 2005. Available online: https://ecommons.cornell.edu/handle/1813/10443 (accessed on 30 May 2018).
  68. Lekang, O. Aquaculture Engineering, 2nd ed.; Wiley-Blackwell: Hoboken, NJ, USA, 2013; ISBN 9780470670859. [Google Scholar]
  69. Resh, H.M. Hydroponic Food Production: A Definite Guidebook for the Advanced Home Gardener and the Commercial Hydroponic Grower, 7th ed.; CRC Press: Boca Raton, FL, USA, 2013; ISBN 9781439878675. [Google Scholar]
  70. Ndegwa, P.M.; Thompson, S.A. Effects of C-to-N ratio on vermicomposting of biosolids. Bioresour. Technol. 2000, 75, 7–12. [Google Scholar] [CrossRef]
  71. Gunadi, B.; Edwards, C.A.; Blount, C., IV. The influence of different moisture levels on the growth, fecundity and survival of Eisenia fetida (Savigny) in cattle and pig manure solids. Eur. J. Soil Biol. 2003, 39, 19–24. [Google Scholar] [CrossRef]
  72. Pilwat, G.; Zimmermann, U. Untersuchungen über den Kaliumtransport bei Escherichia coli B/Potassium Transport in Escherichia coli B. Z. Naturforsch. B 1972, 27, 62–67. [Google Scholar] [CrossRef] [PubMed]
  73. Hu, Z.R.; Wentzel, M.C.; Ekama, G.A. Anoxic growth of phosphate-accumulating organisms (PAOs) in biological nutrient removal activated sludge systems. Water Res. 2002, 36, 4927–4937. [Google Scholar] [CrossRef]
  74. Strandberg, G.W.; Shumate, S.E.; Parrott, J.R. Microbial cells as biosorbents for heavy metals: Accumulation of uranium by Saccharomyces cerevisiae and Pseudomonas aeruginosa. Appl. Environ. Microbiol. 1981, 41, 237–245. [Google Scholar] [PubMed]
  75. Gadd, G.M. Heavy metal accumulation by bacteria and other microorganisms. Experientia 1990, 46, 834–840. [Google Scholar] [CrossRef]
  76. Tsekova, K.; Kaimaktchiev, A.; Tzekova, A. Bioaccumulation of heavy metals by microorganisms. Biotechnol. Biotechnol. Equip. 1998, 12, 94–96. [Google Scholar] [CrossRef]
  77. Harvie, C.E.; Møller, N.; Weare, J.H. The prediction of mineral solubilities in natural waters: The Na-K-Mg-Ca-H-Cl-SO4-OH-HCO3-CO3-CO2-H2O system to high ionic strengths at 25 °C. Geochim. Cosmochim. Acta 1984, 48, 723–751. [Google Scholar] [CrossRef]
  78. Pantanella, E.; Cardarelli, M.; Di Mattia, E.; Colla, G. Aquaponics and food safety: Effects of UV sterilization on total coliforms and lettuce production. Int. Conf. Exhib. Soil. Cult. 2010, 1062, 71–76. [Google Scholar] [CrossRef]
  79. Schreier, H.J.; Mirzoyan, N.; Saito, K. Microbial diversity of biological filters in recirculating aquaculture systems. Curr. Opin. Biotechnol. 2010, 21, 318–325. [Google Scholar] [CrossRef] [PubMed]
Figure 1. Nutrient distribution in fish between fillet and carcass (%) under three different stocking densities.
Sustainability 10 01805 g001
Figure 2. Pollutant distribution in fish between fillet and carcass (%) under three different stocking densities.
Sustainability 10 01805 g002
Figure 3. Dry matter contents (dm), total organic carbon contents (TOC) and the calorific values in EAS, SIAS and IAS under 50 and 80% feeding ratio (F) after a solids collection period of 6 d.
Sustainability 10 01805 g003
Figure 4. Proportional distribution of fiber fractions in feed and solids under 50% feeding regime.
Sustainability 10 01805 g004
Figure 5. Nutrient input via water and feed at the three stocking (EAS, SIAS, IAS) densities under 80% feeding level.
Sustainability 10 01805 g005
Figure 6. Nutrient output via the process water, fish, solids and other (unexplained) at the three stocking densities (EAS, SIAS, IAS) under 80% feeding level.
Sustainability 10 01805 g006
Figure 7. Pollutant input via feed and water at the three stocking densities (EAS, IAS, SIAS) under 80% feeding level.
Sustainability 10 01805 g007
Figure 8. Pollutant output via the process water, fish, solids and other (unexplained) at the three stocking densities (EAS, SIAS, IAS) under 80% feeding level.
Sustainability 10 01805 g008
Figure 9. Energy allocation in the output of African catfish RAS (in% per feed energy input) under three production intensities.
Sustainability 10 01805 g009
Table 1. Fish performance parameters under the three different stocking densities extensive aquaculture system (EAS), semi-intensive aquaculture system (SIAS) and intensive aquaculture system (IAS).
Stocking DensityFish CohortsBWinitial (g fish−1)BWfinal (g fish−1)FCRSGR (% d−1)SR (%)
MeanMean±CVMean±CVMean±CVMean±CV
EAS1351172±4.20.88±1.41.61±1.294.3±3.0
235738±12.60.80±3.42.10±4.088.6±14.1
340246±4.50.76±3.13.13±2.585.7±8.8
SIAS1351204±3.00.87±0.71.61±0.992.9±1.5
235721±2.40.83±0.92.09±0.886.7±1.0
340223±2.90.75±0.42.96±1.798.1±2.2
IAS1351208±1.60.87±1.41.62±0.490.2±0.9
235655±1.50.82±0.82.02±0.596.2±0.9
340223±4.60.77±1.12.96±2.794.0±3.9
Table 2. Physico-chemical water quality parameters under the three different stocking densities EAS, SIAS and IAS.
Feeding RegimeStocking DensityTemperature (°C)pHConductivity EC (µS cm −1)Oxygen DO (mg L−1)Oxygen DO (%)
Mean±CVMean±CVMean±CVMean±CVMean±CV
50%EAS26.9 a±0.44.5 a±8.91012 a±2.67.1 a±1.388.7 a±1.0
SIAS26.9 a±0.84.9 b±11.11299 b±2.55.3 b±4.366.9 b±4.2
IAS26.6 b±0.54.5 ab±3.81455 c±4.16.9 c±0.985.7 c±1.1
80%EAS27.1±0.75.0 a±6.91036 a±3.26.2 a±3.278.5 a±3.6
SIAS27.0±0.25.8 b±4.91367 b±3.65.3 b±4.366.9 b±4.3
IAS27.1±0.75.6 b±5.21374 b±5.55.4 b±3.567.7 b±3.3
Superscript letters indicate significant differences between the experimental groups (p < 0.05).
Table 3. Concentrations of dissolved nutritive and pollutant elements in the process water of African catfish recirculation aquaculture systems (RAS) under three stocking densities and 50% and 80% F.
50% F80% F
EASSIASIASEASSIASIAS
TDN, ortho-PUnit
NH4+-Nmg L−15.59.442.410.121.416.9
NO2-Nmg L−10.090.160.460.120.510.02
NO3-Nmg L−182.298.6114.179.888.473.5
PO43−-Pmg L−113.623.231.417.120.624.4
Nutritive elements
Nmg L−187.810815790.111090.34
Pmg L−117.429.340.522.431.638.6
Kmg L−130.353.059.725.5653.560.1
Camg L−1145187162.5125145120
Mgmg L−119.627.826.717.425.123.4
Smg L−156.075.469.348.867.364.2
Namg L−149.866.270.058.569.870.0
Feµg L−150.758.941788.375.3110
Mnµg L−1217444452211241195
Moµg L−12.53.23.42.03.84.3
Cuµg L−127.528.242.114.624.420.6
Znµg L−1126216554441334413
Seµg L−10.430.701.20.550.931.3
Coµg L−12.84.32.62.32.41.8
Crµg L−10.360.610.740.400.570.71
Pollutant elements
Asµg L−13.77.08.83.96.28.9
Cdµg L−10.050.080.340.130.150.25
Niµg L−11.32.53.21.94.03.7
Pbµg L−10.090.160.420.100.330.27
Uµg L−10.040.050.040.020.020.11
Table 4. Water content, total organic carbon (TOC), energy and elemental concentrations in African catfish (total, carcass, fillet; per dm), reared in the three RAS with different stocking densities (EAS, SIAS, IAS); Mean values ± Coefficient of variance (CV). Pooled: n = 6.
TotalFilletCarcass
EASSIASIASEASSIASIASEASSIASIAS
Unit (per dm)mean±CVmean±CVmean±CVmean±CVmean±CVmean±CVmean±CVmean±CVmean±CV
Water(%)71.4±3.868.9±6.869.4±4.574.3±0.774.3±3.674.6±3.066.7±4.266.3±2.066.2±2.0
TOC(g kg−1)496±2.5522±1.4485±4.4531±3.7534±1.7517±5.2482±2.1517±1.2473±4.1
Energy(MJ kg−1)25.5±1.125.7±0.324.3±6.127.1±3.427.2±3.026.1±6.724.9±0.425.1±0.923.6±6.0
Nutritive elements
N(g kg−1)77.9±6.788.1±0.885.2±4.697.0±8.8111±4.7107±11.870.6±5.279.8±0.177.0±0.7
P(g kg−1)19.4±0.319.2±0.321.2±11.07.44±14.47.67±9.28.13±13.324.0±1.423.5±2.926.0±11.2
K(g kg−1)9.0±12.29.1±6.89.6±8.814.7±10.815.2±10.116.0±11.06.78±12.26.83±8.07.17±5.6
Ca(g kg−1)30.5±8.831.2±1.934.0±12.70.38±4.20.31±25.00.49±50.342.1±8.042.9±5.246.4±13.1
Mg(g kg−1)1.26±4.81.29±5.51.36±8.51.06±12.91.09±12.41.16±14.61.34±2.51.37±2.81.44±6.8
S(g kg−1)5.3±8.75.13±5.45.48±6.16.2±9.76.14±8.46.76±13.24.90±8.04.77±4.85.00±2.4
Na(g kg−1)3.1±6.83.01±3.63.30±2.21.55±7.31.53±2.41.79±1.73.66±7.33.56±2.03.85±2.6
Fe(mg kg−1)77.8±17.481.6±18.3118±3.233.5±17.634.9±5.130.3±1.295.0±17.998.5±19.4150±4.1
Mn(mg kg−1)10.8±31.110.7±4.013.6±5.81.21±7.51.14±1.61.25±12.914.5±31.614.3±1.118.2±5.8
Mo(µg kg−1)81.1±21.859.0±2.783.5±22.225.0±45.632.2±3.633.0±20.5112±27.569.2±4.3102±27.6
Cu(mg kg−1)3.4±6.33.06±2.53.63±4.52.06±13.01.66±7.21.93±1.93.97±5.23.58±2.54.25±4.6
Zn(mg kg−1)46.9±5.843.7±0.549.4±1.220.0±10.319.1±9.121.5±5.357.3±4.653.0±0.359.7±2.4
Se(mg kg−1)0.69±3.40.62±8.50.65±5.10.40±8.90.38±17.70.41±10.20.80±2.80.72±5.10.73±8.0
Co(µg kg−1)39.5±8.842.5±12.744.4±11.828.4±10.734.6±4.129.6±0.943.8±8.745.2±16.849.8±14.8
Cr(mg kg−1)1.34±12.21.50±3.74.04±33.90.55±49.11.61±37.80.94±41.41.64±8.01.43±21.75.20±39.3
Pollutant elements
Hg(µg kg−1)30.0±6.431.9±12.045.3±1.959.9±1.958.3±19.075.8±27.918.5±10.022.3±9.233.9±20.2
Al(mg kg−1)129±35.6105±21.875.52±3.66.83±4.85.05±45.18.20±39.2175±35.4143±24.4100±23.6
As(mg kg−1)0.57±6.70.527±9.30.53±2.71.04±5.20.92±4.90.91±5.70.39±6.70.37±9.00.39±0.9
Cd(µg kg−1)82.6±13.793.8±15.8114±11.13.55±0.13.93±5.15.91±7.2113±13.0127±12.9154±10.8
Ni(mg kg−1)3.37±37.45.15±31.05.87±10.01.35±83.21.21±10.50.25±52.94.15±32.36.70±34.77.94±8.9
Pb(mg kg−1)0.39±2.30.39±1.690.40±3.70.37±3.30.37±1.30.38±0.50.40±4.20.39±1.60.40±4.8
Sn(µg kg−1)13.1±10.111.8±1.922.9±10.310.9±3.910.9±12.717.4±14.913.9±14.212.1±7.124.9±8.9
U(µg kg−1)3.84±9.63.73±4.44.01±12.53.20±20.82.50±1.23.35±0.74.08±6.74.19±4.44.25±16.5
Table 5. Raw ash (XA), Neutral detergent fiber (NDF) and Acidic Detergent Fiber (ADF) content of feed and solids at feeding regime 50% related to the dry matter (dm) content.
SampleXA (%)NDF (% dm)ADF (% dm)
Feed9.029.54.2
EAS20.134.322.5
SIAS18.136.621.5
IAS18.537.721.6
Table 6. Concentrations of anaerobic digestion (AD) relevant elements in the effluent from one clarifier after 6 d of solid waste collection.
EASSIASIAS
50%80%50%80%50%80%
Element(mg L−1)
Co0.0060.0060.0050.0100.0030.006
Ni0.0070.0110.0080.0230.0090.023
Se0.0020.0030.0030.0060.0040.007
Mo0.0080.0080.0070.0150.0090.016
Mn0.320.390.271.170.351.15
Fe1.423.052.536.633.917.90
Table 7. Concentrations of TOC, energy, and the nutritive and pollutant elements in the deposited solid wastes after 6 d of solid waste collection.
50% F80% F
EASSIASIASEASSIASIAS
UnitMean±CVMean±CVMean±CVMean±CVMean±CVMean±CV
TOCg kg−1416±0.8396±0.5396±2.8390±0.63360±0.49366±0.18
EnergyMJ kg−119.6±0.2619.0±0.2919.2±0.5418.3±1.317.1±0.4517.2±0.62
Nutritive elements
Ng kg−148.9±3.150.0±2.842.7±3.432.7±3.837.6±2.836.7±4.3
Pg kg−113.2±4.115.6±3.314.2±4.615.9±0.127.5±2.327.3±0.4
Kg kg−11.3±18.61.3±2.91.6±11.31.7±7.21.4±27.03.0±14.3
Cag kg−128.5±1.935.5±4.630.7±6.629.3±2.456.8±4.749.7±0.8
Mgg kg−10.9±12.31.0±4.31.0±16.10.9±7.11.6±11.22.0±8.3
Sg kg−16.2±3.05.9±3.05.7±6.44.3±2.14.4±11.23.7±15.9
Feg kg−12.4±6.52.6±4.13.0±3.73.0±1.33.0±1.13.3±1.7
Mnmg kg−1176±0.8285±2.1274±2.6181±0.3427.0±2.1406±0.9
Momg kg−19.1±2.77.0±0.36.9±2.56.4±1.85.1±1.15.1±3.9
Cumg kg−1494±6.3220±2.6144±1.2312±2.5146±0.8121±1.5
Zng kg−11.1±2.31.4±1.81.4±1.41.4±2.21.6±1.71.6±0.8
Semg kg−13.1±0.43.3±1.13.1±1.92.4±2.02.3±6.52.3±8.1
Comg kg−14.9±1.74.8±1.42.4±2.23.6±1.83.3±1.31.8±3.3
Crmg kg−115.0±3.411.8±7.611.8±6.915.0±12.414.8±10.414.1±20.9
Pollutant elements
Hg *µg kg−194.0±2.0103±1.994.1±2.067.8±6.962.4±0.858.2±1.8
Asmg kg−11.9±2.32.0±1.91.8±3.81.6±1.91.9±2.21.9±6.7
Cdmg kg−10.8±2.01.0±1.71.0±1.31.1±1.61.1±2.01.1±0.6
Nimg kg−110.0±8.88.2±9.87.2±4.89.4±6.68.8±4.68.1±14.6
Pbmg kg−14.4±1.13.5±1.12.8±7.54.2±4.52.9±1.52.8±5.2
Sn *mg kg−10.8±1.40.9±53.40.9±2.20.6±5.50.4±4.90.5±12.6
Umg kg−14.0±1.43.3±1.42.5±1.92.5±1.32.0±0.51.7±1.6
* Nutrient concentration in the sludge (decanted).
Table 8. Deviation of the analyzed nutrient concentrations behind the clarifier from generalized recommendations calculated as a mean from Hoagland and Aarnon (1938), Hewitt (1966), Cooper (1979) and Steiner (1984) (Table 2 in [32]).
Deviation from Recommended Concentrations (%)
Nutritive Element50% F80% F
EASSIASIASEASSIASIAS
N−54−43−18−52−42−53
P−57−28−1−45−22−5
K−87−78−75−89−78−75
Ca−1410−4−26−14−29
Mg−53−34−37−59−40−44
S−57−42−46−62−48−50
Fe−99−99−92−98−99−98
Cu−46−45−17−71−52−60
Zn55165582443311408
Mn−76−51−51−77−74−79
Mo−97−96−96−97−95−95
Table 9. For anaerobic digestion recommended element concentrations and element ratios (C:N:P:S) and comparison with RAS sludge characteristics (related to fresh sludge) [53].
ElementOptimal (mg L−1)Minimal (mg L−1)Measured (Range)Deviation from Recommended Optimum
Co0.1200.0600.003–0.005Lower than minimum
Ni0.0150.0060.006–0.020Minimum or optimum reached
Se0.0180.0080.002–0.006Close to minimum
Mo0.1500.0500.005–0.013Lower than minimum
Mn*0.005–500.107–0.995Higher than the minimum
Fe*1–101.37–7.81Minimum concentration reached
RatiosRecommendation (FNR, 2016)Measured(Average)Deviation from Recommendation
C:N:P:S ratio600:15:5:3112:13:8:3Carbon much to low related to N, P, S concentration
C:N ratio10–30:18–9:1carbon 100% to low related to the nitrogen concentration
* No recommendations given.
Table 10. Deviation of the analyzed and calculated nutrient concentrations in the deposited solids from generalized recommendations calculated as a mean from Hoagland and Aarnon (1938), Hewitt (1966), Cooper (1979) and Steiner (1984) (Table 2 [32]).
Deviation from Recommended Concentrations (%)
Nutritive Element50% F80% F
EASSIASIASEASSIASIAS
N−39−1811−361−7
P−38844−6124152
K−87−77−74−89−76−72
Ca−53019−95940
Mg−52−32−34−56−32−33
S−54−37−41−59−40−44
Fe−72−49−15−403156
Cu515368348538568500
Zn85718342791220046295088
Mn−65−22−12−572826
Mo−91−88−85−90−82−81

