Morphology Dependent Assessment of Resilience for Urban Areas


1
Fraunhofer Institute for High-Speed Dynamics, Ernst-Mach-Institut, 79104 Freiburg, Germany
2
Institute for Sustainable Technical Systems, University of Freiburg, 79110 Freiburg, Germany
*
Author to whom correspondence should be addressed.
Sustainability 2018, 10(6), 1800; https://doi.org/10.3390/su10061800
Submission received: 17 April 2018
/
Revised: 28 May 2018
/
Accepted: 28 May 2018
/
Published: 30 May 2018
(This article belongs to the Special Issue Sustainable Built Environment and Urban Growth Management)
Abstract
:The formation of new threats and the increasing complexity of urban built infrastructures underline the need for more robust and sustainable systems, which are able to cope with adverse events. Achieving sustainability requires the strengthening of resilience. Currently, a comprehensive approach for the quantification of resilience of urban infrastructure is missing. Within this paper, a new generalized mathematical framework is presented. A clear definition of terms and their interaction builds the basis of this resilience assessment scheme. Classical risk-based as well as additional components are aligned along the timeline before, during and after disruptive events, to quantify the susceptibility, the vulnerability and the response and recovery behavior of complex systems for multiple threat scenarios. The approach allows the evaluation of complete urban surroundings and enables a quantitative comparison with other development plans or cities. A comprehensive resilience framework should cover at least preparation, prevention, protection, response and recovery. The presented approach determines respective indicators and provides decision support, which enhancement measures are more effective. Hence, the framework quantifies for instance, if it is better to avoid a hazardous event or to tolerate an event with an increased robustness. An application example is given to assess different urban forms, i.e., morphologies, with consideration of multiple adverse events, like terrorist attacks or earthquakes, and multiple buildings. Each urban object includes a certain number of attributes, like the object use, the construction type, the time-dependent number of persons and the value, to derive different performance targets. The assessment results in the identification of weak spots with respect to single resilience indicators. Based on the generalized mathematical formulation and suitable combination of indicators, this approach can quantify the resilience of urban morphologies, independent of possible single threat types and threat locations.
1. Introduction
Cities are key drivers for technological, organizational, social and economic innovation and well-being for individuals and the society. Sustainable progress in these domains depends on the availability of infrastructures and buildings. This also holds true for the scale of interaction and connectivity.
Agglomerated areas comprise a high degree of critical infrastructure. At the same time, critical infrastructures specify significantly the resilience and the robustness [1]. It is clearly observable that systems, cities and infrastructures will become more complex and interconnected [2]. Due to this change, the failure of a single element increases the probability to produce cascading effects with unexpected consequences [3] as well as emergent threats.
Industrialization and population growth are the main reasons for an increasing urban population. This fact is clearly observable in different studies, as stated in the report of the United Nations [4]. It results in a changing density of population, a higher degree of urbanization and an increasing focus on hazard vulnerability reduction and resilience [5].
A further challenge is the formation of new threats. According to Branscomb [1], cities are increasingly vulnerable to three kinds of disasters:
- natural, like hurricanes, floods or earthquakes,
- technogenic, resulting from human error and failing infrastructure, like a power failure, and
- terrorism, “a growing and important asymmetric threat which can pick targets anywhere” [6].
In summary, the rising urbanization, growing complexity of critical infrastructure and formation and increase of new and old threats lead to the need to manage possible hazardous events and their corresponding consequences in an ever-increasing number, especially in urban areas. These aspects motivate the need of sustainable cities, which are able to cope with adverse events.
Based on the new challenges for urban areas, this paper focuses on how the built urban environment, urban spaces, buildings and infrastructure can better cope with potentially adverse and disruptive events. The overarching aim is to contribute from an engineering–technical science driven perspective to the sustainability of urban areas and infrastructures. Achieving sustainability requires the strengthening of resilience [7].
The concept of resilience is used in a great variety of interdisciplinary work concerned with the interaction of people and nature [8]. Examples can be found in social sciences [9,10] or engineering disciplines [11,12,13]. There are approaches which give a holistic overview but results in qualitative measures [14]. Other methods have no detailed information concerning the recovery behavior after a disruptive event [15,16] or focus on single scenarios and objects [17], which require a manual reapplication, if there are deviations or uncertainties. In summary, there is a need for the development of a clear analysis scheme for the quantification of resilience of urban areas. The assessment focusses on the identification on weak spots to circumvent a pure scenario-driven approach.
An urban area reflects a complex and dynamic composition of different zonings and functions, which defines the urban form and have a lasting effect on the sustainability, the resilience [18,19] as well as the coping capacity with disruptive events [10]. Within this paper, different urban footprints are evaluated to investigate the resilience depending on the morphology. Building density, building dimensions, construction types and object use are main parameter, which will be varied within the investigations and the introduced framework can give contributions to new development plans to reflect or incorporate resilience indicators and to shape a sustainable environment.
Section 2 introduces a generalized framework for the evaluation of resilience and Section 3 follows with a mathematical definition of single components of that framework. Certain analysis examples for different urban forms and the discussion of the assessment scheme are shown in Section 4. A summary and conclusion is given in Section 5.
2. Generalized Framework to Quantify Expected Losses and Recovery Processes
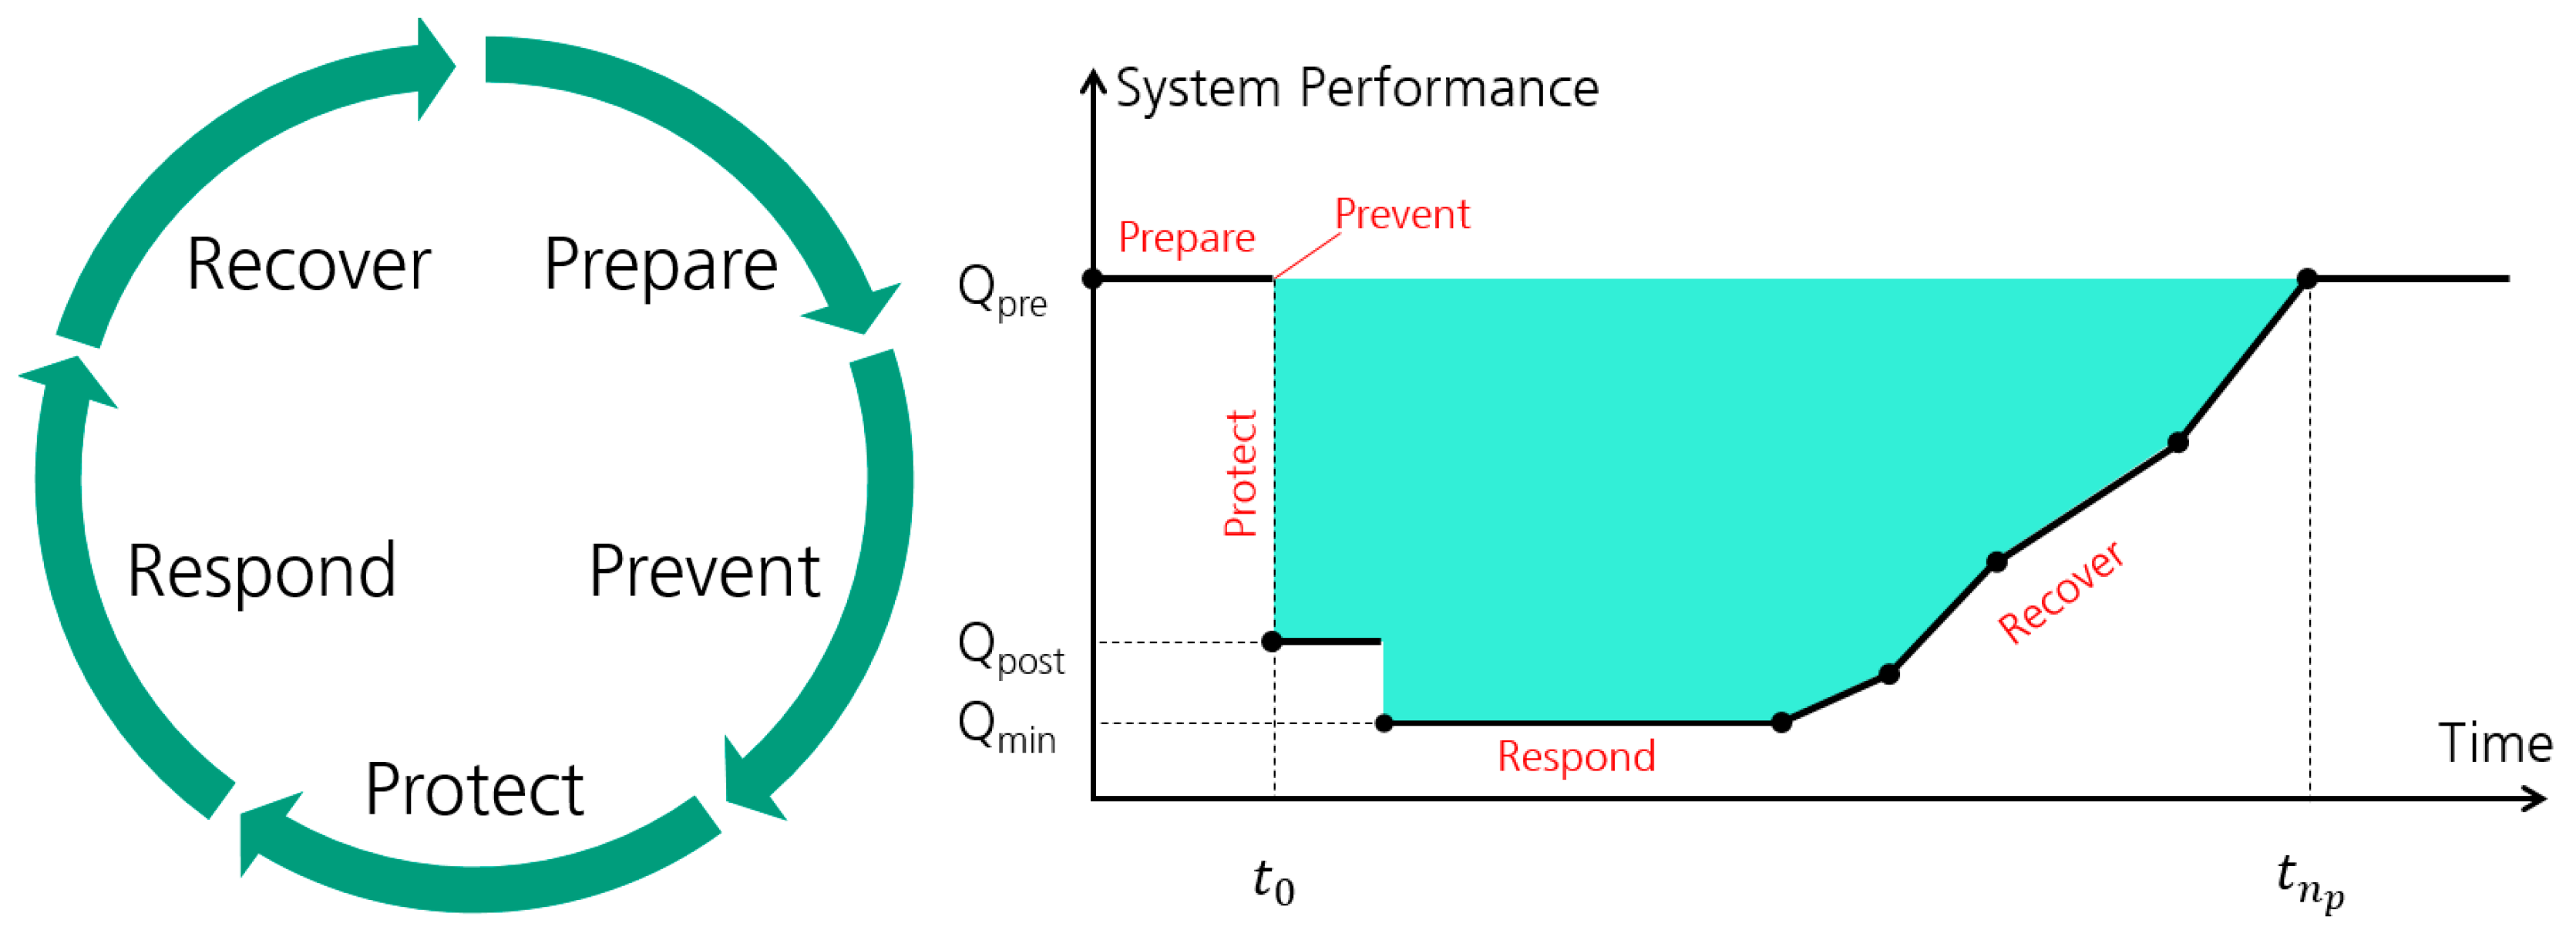
Findings from different approaches to evaluate resilience are sighted, compared and consolidated to propose a novel framework with the aim to quantify resilience, which requires a clear definition of terms. Based on the interdisciplinary research in the field of resilience, there are different interpretations concerning the definition and of that term [20]. Within the present work, the resilience cycle (Figure 1 left) according to Thoma [21] is used as definition. Therefore, resilience is defined as:
“The ability to repel, prepare for, take into account, absorb, recover from and adapt ever more successfully to actual or potential adverse events. Those events are either catastrophes or processes of change with catastrophic outcome, which can have human, technical or natural causes.”
As shown by Bruneau [11] or Kröger [3], a performance-time relation can be used to describe the resilience of a system. A generalized and simplified shape of one such relation shows the right picture of Figure 1. A catastrophic event causes a disruption and a sudden performance loss at time , which is followed by a response stabilization and recovery process. Resilience can be measured by the size of the expected degradation of performance over time, as indicated with the green area in the right diagram of Figure 1. Single phases of the resilience cycle can be assigned using performance-time diagrams for suitable system parameter and determine the effectiveness of single indicators and, if approved, to measure the resilience of the system. As indicated in Figure 1, measures of preparation and prevention will extend the time before disruptive events or avoid them completely. The drop of the system performance indicators is a measure of the level of protection and vulnerability. Efficient response decreases the degree of disruption and helps to start to bounce back quickly after the shock event. Finally, the resilience phase recovery describes all the aspects of relaxation, recovery and possible learning and the preparation for future events.
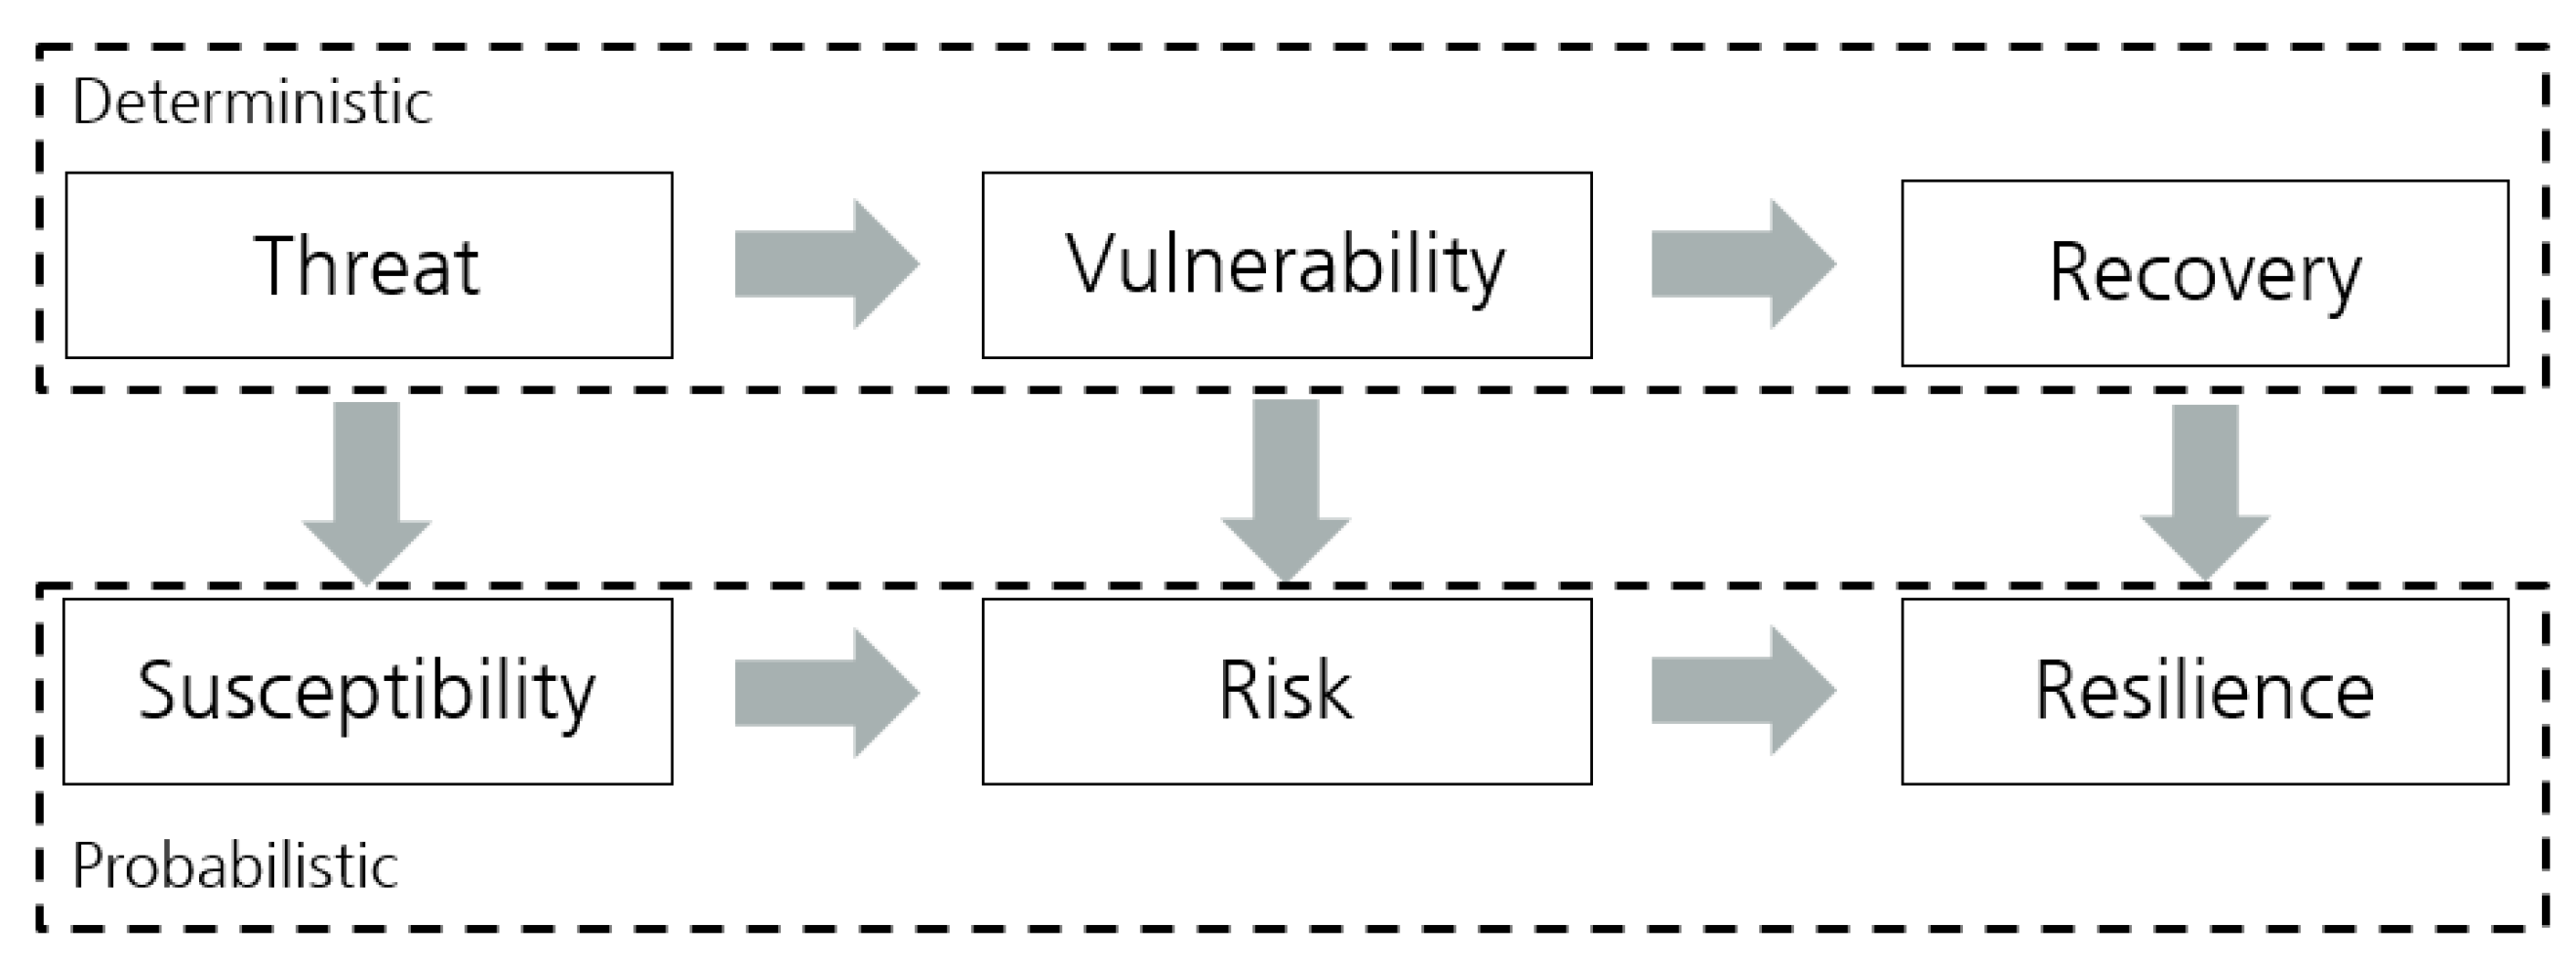
Based on the definitions in [22] and Figure 1, the aim of the proposed framework is the characterization of a performance target over time as basis for resilience quantification. Several components are integrated to achieve this objective and a generalized overview is given in Figure 2. The assessment scheme can be separated into two main parts. Under the assumption of a threat occurrence, the deterministic part uses physical models to quantify the intensity of a hazard source and the corresponding damage effects (vulnerability). A certain degree of recovery is required based on the resulting damage effects. The deterministic realm is applicable to derive a performance-time relation for a single threat, but requires the definition of a decisive scenario. Based on uncertainties that a certain threat event occurs, the deterministic part is coupled with a probabilistic realm. Stochastic methodologies are applied to evaluate the frequency and the exposition of a threat within the susceptibility approach. The combination of susceptibility and potential damage effects results in a risk-based vulnerability. Averaged results for multiple threat scenarios moves the approach from a scenario driven to a consequence based analysis for the identification of weak spots. The combination of weighted (risk-based) vulnerabilities and corresponding recovery processes consider a multitude of random scenarios and results in an averaged performance-time relation to characterize the resilience of a system, e.g., an urban surrounding. Single components of this framework can operate single phases of the resilience cycle (Figure 1).
Bruneau [11] states that resilience can be conceptualized “as encompassing four interrelated dimensions: technical, organizational, social and economic”. With regard to Bruneau, the introduced framework including the quantification of susceptibility and vulnerability cannot cover all aspects concerning the resilience of urban areas but can give essential contributions.
First results within the susceptibility and vulnerability approach of Figure 2 are published in [23] to evaluate terroristic explosive events in urban areas. Pre-defined construction types are applied to assess the physical damage effects of buildings with the use of engineering models [24,25], if an adverse event occurs. The susceptibility, i.e., the frequency of a hazardous event and the exposition of single urban objects, is derived with historical statistical data from the Terror Event Database [26,27], depending on the object use, the threat type and the region. Based on these essential findings, the approach is in this paper subsequently enlarged to compare the risk-based results between different morphologies in a quantitative way. Furthermore, the consideration of time scales allows the assessment of a recovery process to result in a single quantity for the resilience of urban objects. Subsequent, a mathematical formulation will introduce the interaction of single components of the presented framework.
3. Mathematical Formulation
In alignment to the introduced framework in Figure 2, an abstract model of an urban area is defined as a superset including a finite number of subsets, like free spaces or buildings
A single building is characterized by a position , a spatial extension dimension and a type of object use , like residential or office, for example.
A security relevant event, such as an explosion source or an earthquake within or close to an urban environment is defined as threat . A threat can have different forms and the various threat types are expressed with the running index . A threat can occur at a number of possible locations . The physical hazard potential of a threat is described within a hazard model [22], as indicated in Equation (2). This model relates the threat type and the event location to the urban environment . The physical properties are defined within the attribute to characterize the (time dependent) hazard potential, like the magnitude of an earthquake, for example.
Depending on the intensity and the exposition, the occurrence of a threat can cause a certain type of consequences at different locations in the urban surrounding . Possible consequences of type , like direct structural or non-structural damage at a building, at location are characterized within the local what-if vulnerability . An exemplary assessment of structural building damage can be realized with the use of single degree of freedom models [24] as basis for the collapse behavior of buildings [25]. Further details of the vulnerability assessment are described in [22].
Based on the degree of damage or loss of functionality, a certain degree of recovery is required to reach normal community activities and the initial performance of the investigated system, like an urban environment. The rebuild and recovery function characterize the time-dependent behavior as a stepwise linear function considering recovery phases. A generalized sketch of this function is shown in the right picture of Figure 1.
This causal chain of threat occurrence, resulting vulnerability and required time-dependent recovery is summarized as
and expresses the deterministic part of the introduced methodology in Figure 2. This mathematical expression is valid to describe arbitrary threat types and investigated systems. The application of physical or engineering models results in quantitative measures as basis for decision makers. In particular, for each building type and damage level, a recovery function with respective recovery phases is defined, e.g., by resorting to typical planning and construction times and respective subsystem availabilities. Exemplary construction type dependent recovery times are shown in the Appendix A in Table A1.
The prediction of a single threat type scenario can be fraught with inaccuracies because it is difficult to estimate the threat position and the threat intensity can vary. Based on this fact and in alignment to the generalized framework in Figure 2, the frequency that a certain threat occurs at a certain position is summarized within the susceptibility and hence the causal chain in Equation (2) can be weighted with a probability that such an event occurs on in the urban surrounding. This step incorporates the probabilistic realm of the assessment scheme.
The introduction of an averaged time-dependent recovery process (Equation (3)) considers multiple threat types and intensities (index i), threat positions (index j) and urban objects (index k). Each combination is weighted with the corresponding susceptibility . Equation (3) quantifies the averaged loss and recovery with respect to all possible threat events and urban objects, if a single event occurs:
The summation of the performance-time relations in Equation (3) results in a single quantity to describe the resilience of urban environments. The recovery function for a single scenario is characterized with the deterministic part of the framework in Figure 2. The consideration of multiple scenarios and the corresponding probabilistic susceptibility weighting transfers the approach from a scenario driven to a consequence based approach.
The introduced framework combines statistical data and physical approaches to evaluate urban environments with respect to the region and the geo-spatial information of the urban surrounding as well as properties of single urban objects, like the object use, constructional details, person densities or the asset value.
Single elements of the introduced approach are validated in [22] and enable a postulation of a resilience quantity for an arbitrary city. Furthermore, single resilience phases, like preparation, prevention, protection or recovery can be evaluated with this structured methodology. In particular, the susceptibility quantity, a generalized frequency of event an exposure measure, is an indicator for preparation and prevention, the vulnerability quantity, a generalized damage expression characterizes robustness and the recovery quantity characterizes response and recovery.
The presented framework intends to provide a quantitative methodology to achieve more robust and sustainable cities. Subsequently, different urban forms are investigated with the introduced approach. Based on the fact of a growing urbanization, the results should give insights for a sustainable growth of agglomerated areas.
4. Analysis Examples of Different Urban Forms
An urban environment reflects a complex interaction of different zonings and functions. Physical footprints are categorized in buildings, open spaces, traffic routes and landscapes and characterize the morphology [28]. Zonings distinguish between residential, retail, commercial, financial, industrial or educational objects. The variables of a city describe the physical and social characteristics and are dynamic in nature. Examples are physical constraints, growth, population (e.g., age, education or health), economic activities, environmental characteristics or community facilities.
The dynamic growth influences the footprint of a city and can result in a change of the zonings and variables. Urban planning processes encompass a variety of technical and political challenges to characterize and design the environment with respect to the well-being of the population and the natural habitat. To manage the growth and the shaping for tomorrow, new development plans are multi-dimensional in nature and match different variables.
The economic size of a city depends on the available infrastructure, for example. The mixture of different social groups results in a stable community of an urban area (social cohesion). A pedestrian area can give space for human interaction and creativity. The presented resilience framework can be integrated to consider safety and security aspects. The challenge is to achieve a secure and sustainable environment, which still allow for convenient living conditions. New development plans should include policies and objectives to reflect or incorporate the needs of the five phases of the resilience management cycle according to Figure 1 left. These aims have to be adopted depending in particular on the physical layout and the dynamic urban variables, i.e., demographic, social, economic or environmental.
4.1. Characterization and Modelling of the Urban Surroundings
The introduced framework is applied to three different examples representing main urban forms which are oriented to existing cities. The comparison of a compact and a linear city model investigates the resilience depending on the urban footprint. A further assessment describes a central business district to investigate variations of object and construction types. The generated information is intended to provide decision support for urban planning activities to integrate security and sustainability aspects aligned with a dynamic and sustainable growth of agglomerated areas.
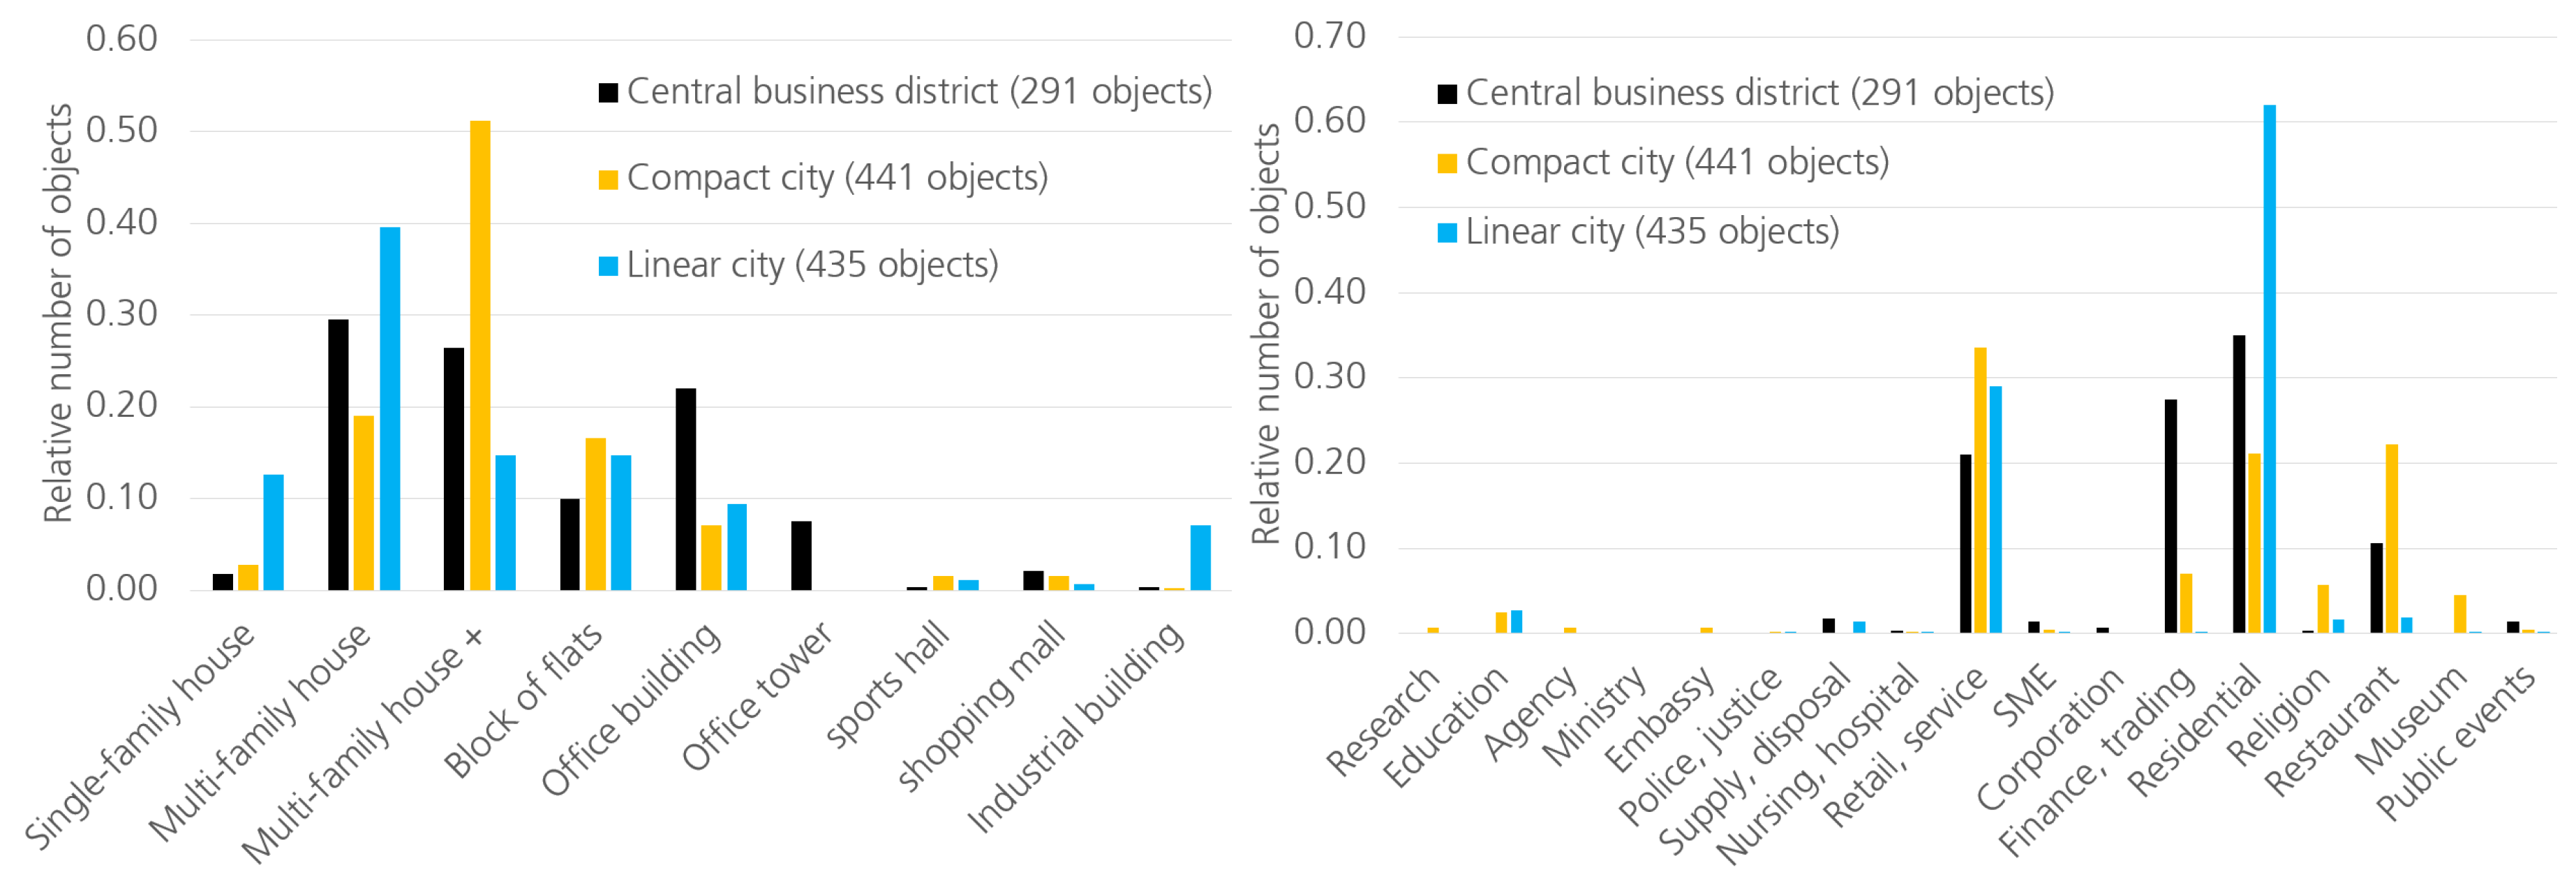
As introduced in Section 3, single buildings of the urban surrounding can be abstracted characterized with a certain number of attributes. The consideration of each individual building within a city would exceed the effort of investigation. The introduced framework uses, a set of 10 pre-defined and fully designed buildings [29]. Possible designs are oriented to the categories in the left bar diagram of Figure 3. For each construction type, the physical properties are available to characterize the robustness and hence certain structural damage effects in case of a disruptive event occurrence [25]. Furthermore, the periods for planning and construction are available depending on the building type and result in quantities to estimate the required recovery for the introduced formulation in Equations (2) and (3). Table A1 in the Appendix A gives a detailed overview of the used building types and time scales to estimate the recovery process.
Figure 3 (left) compares the three application cases concerning their construction types in accordance to the list of pre-defined buildings. Based on the high connectivity and the mixture of residential with other uses, the compact city includes a high degree of multi-family houses with commercial use in the ground floor, indicated with “multi-family house +” in the left diagram of Figure 3. Due to the clear separation of zonings, the linear city includes areas with a higher number of industrial buildings and residential areas with single- or multi-family houses. Characteristic for a district with specific task assignment, the central business district includes an increased number of office buildings and office towers.
Next to the constructional characterization, a further description of the three city models includes the description of building use types. The properties of the compact city become apparent by comparison of the object use types, as shown in the right diagram of Figure 3. A high degree of residential objects is mixed with a wide range of different other types within all sectors. Dual use objects (residential and commercial) are considered as commercial use and result in the higher degree of objects for retail and service. The linear city is dominated by approximately two thirds of residential objects. Besides this object type, buildings dedicated to finance, trading, retail and service dominate the central business district.
4.2. Empirical and Spatial Distributed Evaluation of Disruptive Events
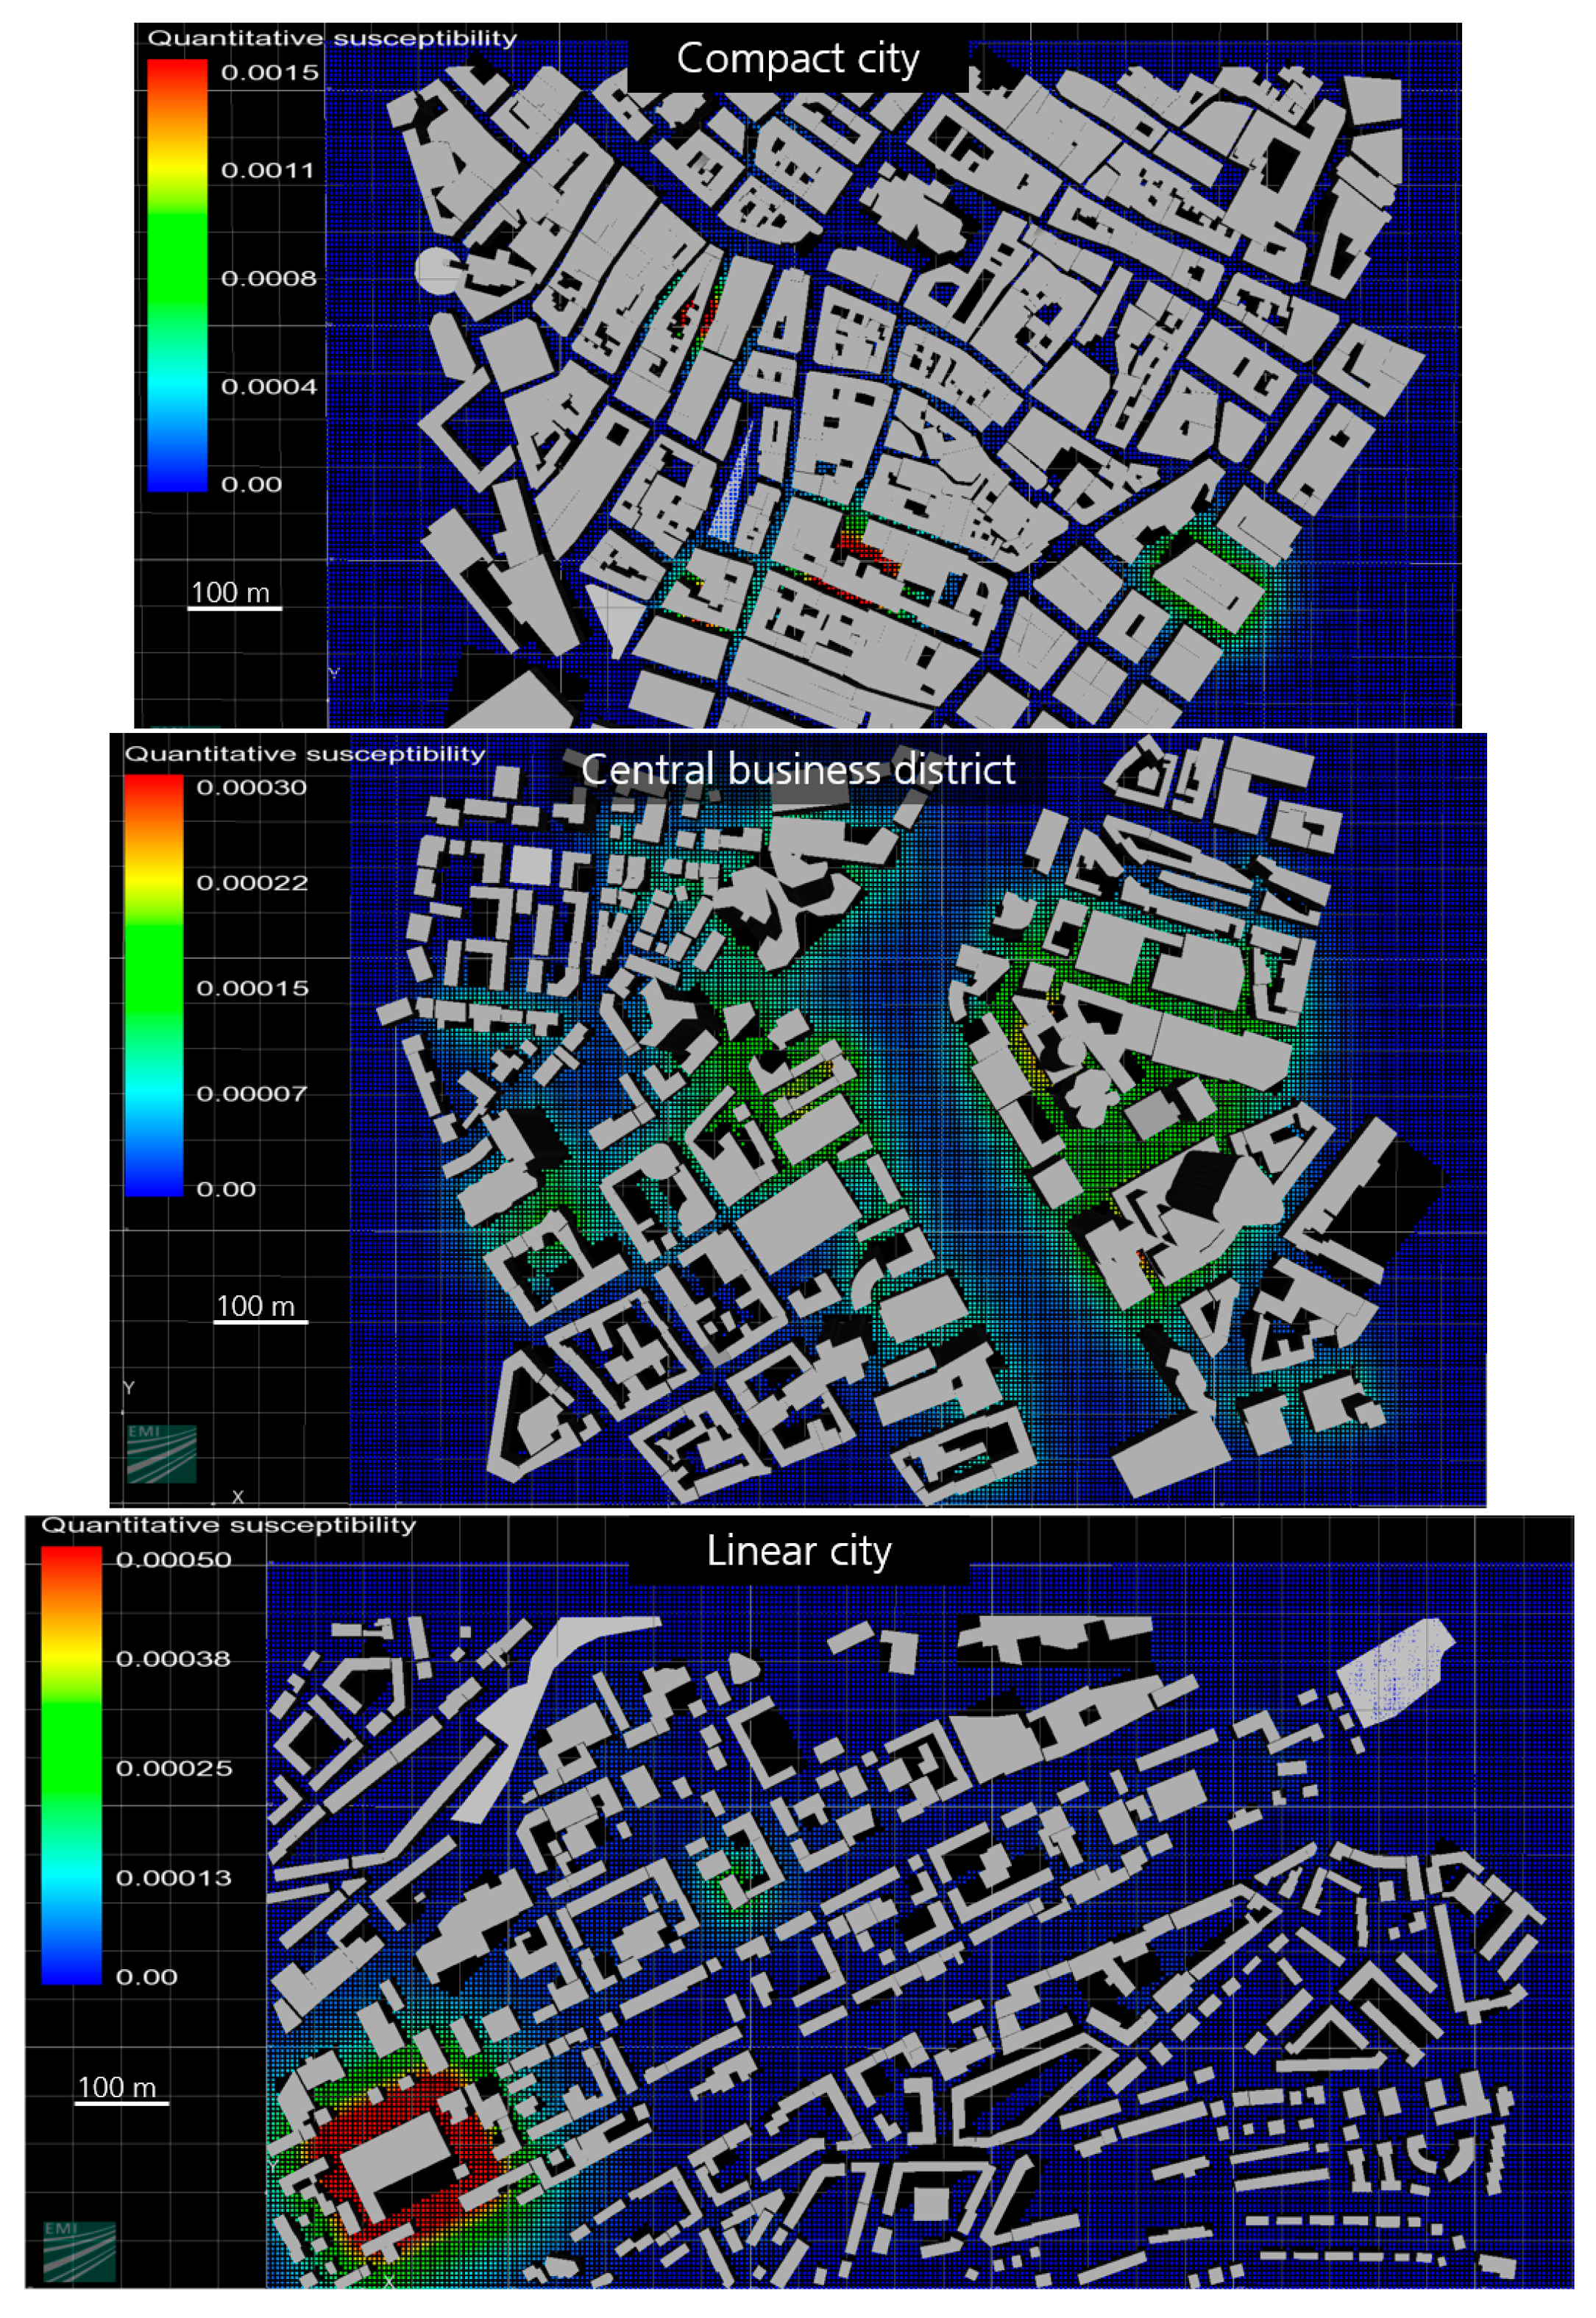
In alignment to the already published parts of the approach [22,23], the introduced framework is applied to evaluate possible terroristic events in the considered urban forms. As shown in Figure 2, a first step includes the quantitative susceptibility analysis. Statistical information from the Terror Event Database [26,27] are combined with the geospatial characteristics of a city to evaluate possible threat positions. Figure 4 visualizes the results with historical data of Western Europe and give the information of possible locations with higher susceptibilities. The color code indicates locations with the highest probability, if a single event occurs.
The results underline the characteristics of the three urban forms. A compact city includes a high mixture of object types, no clear zonings and a higher building density, which is apparent in the upper picture of Figure 4. There are several hotspots with a relative high susceptibility. The clear separation of different zonings within the linear city results in area-covering susceptibilities within an elongated area as shown in the middle picture of Figure 4. Broader areas with residential use generate low criticalities. Finally, the lower picture shows the empirical area distributed results for the central business district. Based on the clear assignment of object types, there are many objects with a similar criticality. In opposite to the linear model, the derived susceptibility is slightly higher and there is no local maximum.
The susceptibility approach in Figure 4 allows an efficient evaluation of possible threat types at certain locations within a single quantity . The frequency of a disruptive event depends on the empirical data of the threat type and object use. This information is distributed on possible event positions in alignment to the investigated city models [22]. This probability quantity is combined with the vulnerability approach to evaluate expected damage effects at certain positions in the city model of a certain damage type , as introduced in the general overview of Figure 2.
4.3. Quantitiative Risk Assessment in F-N Diagrams
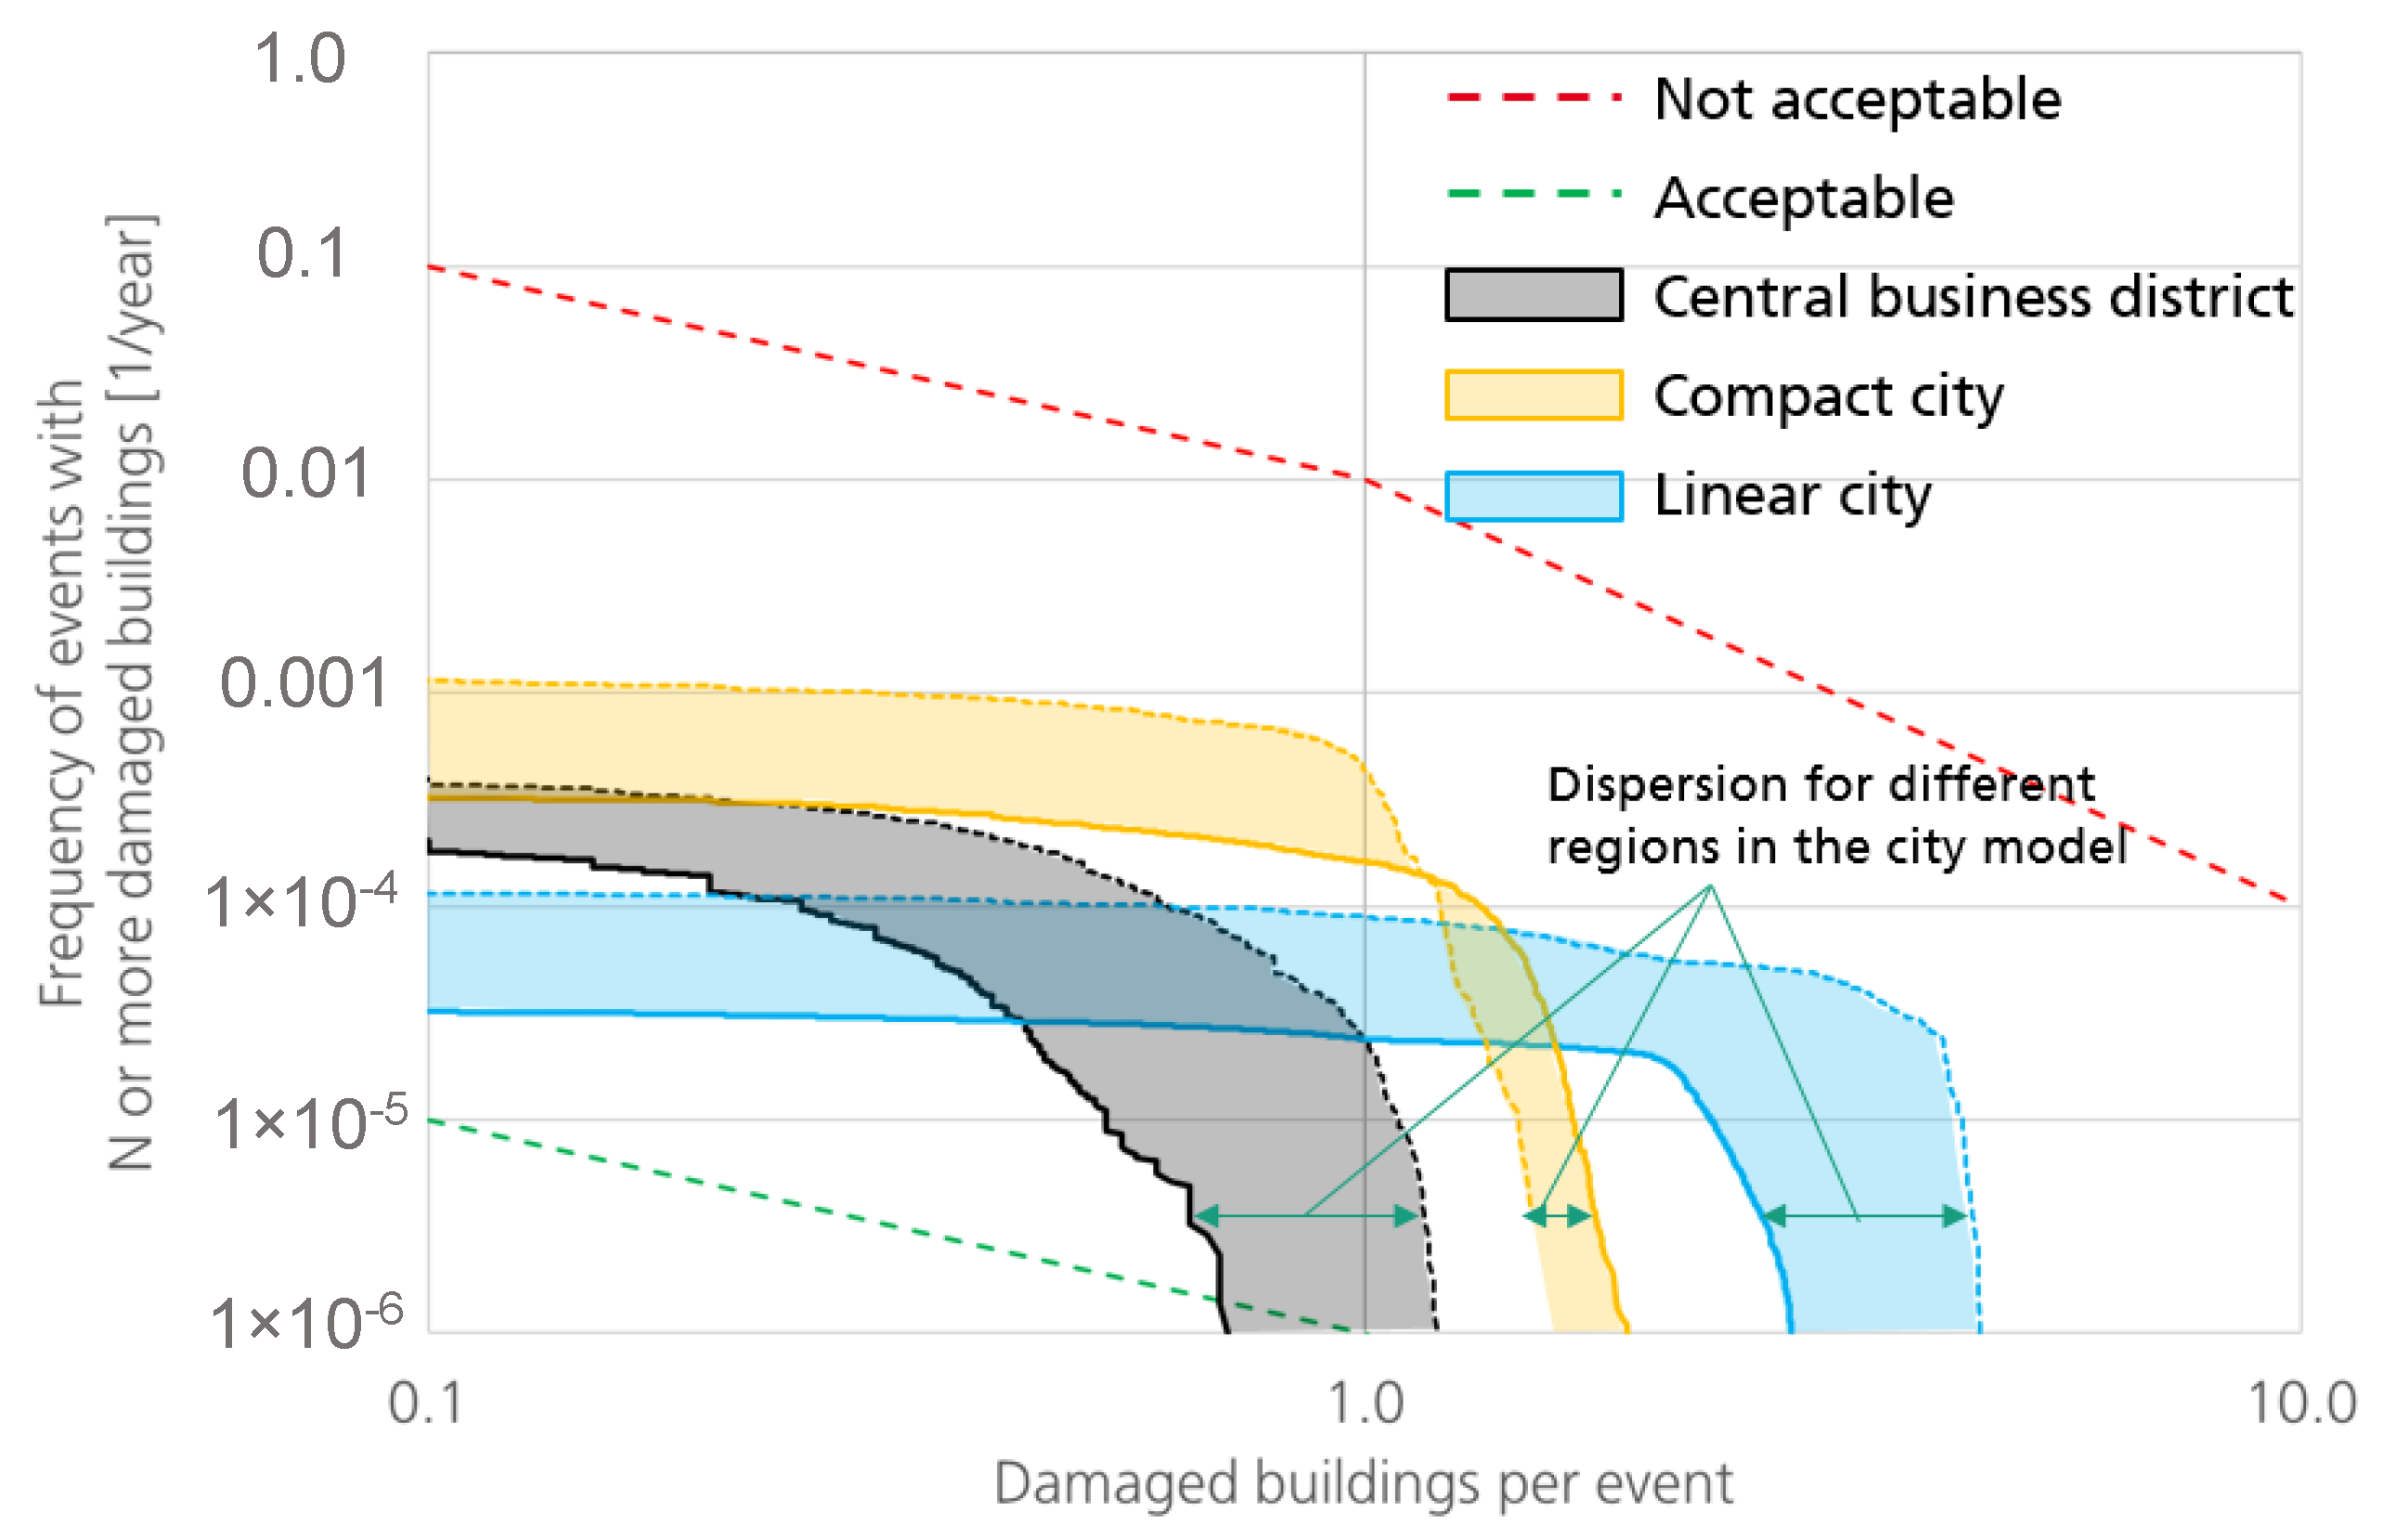
The introduced methodology [22,23] uses physical and engineering models to assess expected damage effects. Each combination of threat position , as shown in Figure 4, threat type and intensity causes a certain degree of damage and is weighted with the derived susceptibility that this event occurs. The results can be counted to events with N or more damaged buildings and a corresponding cumulated frequency of occurrence. This information is collected for each investigated urban form of the application examples within a frequency-number (F-N) diagram, see Figure 5. Based on the investigated urban areas, combinations of buildings, threat types and threat positions results in tens of millions possible combinations with respect to the formulations in Equations (2) and (3) which exceeds the capacity of spreadsheet applications. Therefore, the investigated city models are separated into single areas, which results in certain dispersion for each city in the diagram of Figure 5.
The dotted lines separate the diagram into regions for acceptable (green line) or not acceptable (red line) risk quantities. The area between these two criteria marks the “ALARP” region, meaning as low as practicable possible and optional mitigation measures should be considered in relation to their efficiency [30]. Different criteria define the level of acceptance [31]. In this diagram, the “Groningen criterion” according to [30] is chosen.
The central business district is characterized with many equal object types, which result in a relatively uniform distribution of susceptibility, as indicated in the empirical approach in Figure 4. This city model includes many robust construction types, like the high-rise buildings and results in low vulnerabilities with rather restricted local building damage effects and these characteristics result in the lowest quantitative risks of the three considered city models.
A larger proportion of construction types with a high vulnerability, e.g., single-family houses, results for the linear city in the highest criticality of all three examples. The large areal dispersion and the higher percentage of uncritical object types result in the lowest frequencies.
The compact city model includes a high mixture of different object types, a high building density and results in several local hotspots. Different construction types lead to a varying severity concerning the vulnerability. The lowest criticality of the compact city is higher rated than the maximum values of the central business district, which is observable with the yellow and black curves on the ordinate in Figure 5, for example.
Beside the derived risk quantities, the introduced framework enables the consideration of recovery processes, which is quantitatively described as performance over time [22]. The performance is oriented to the usability of an object and depends on the derived degree of damage.
4.4. Analysis of Recovery and Overall Resilience
The results for the response and recovery processes depending on the urban configuration are compared in Figure 6. The application of Equation (3) is visualized in this diagram, meaning the averaged loss of performance for a certain city model, if an adverse event occurs with respect to all possible threat types, threat positions and buildings. The dispersion of risk, as shown in the risk diagram of Figure 5 is eliminated in the performance-time relation by building the average.
In Figure 6, the high vulnerability for the linear city model is present with the strongest drop of performance at the time of the impact. The smallest discontinuity at t = 0 underlines the robust behavior of the central business district, which is congruent with the results of the risk analysis in Figure 5. Full recovery time of the building usability of the central business district is twice as long as in case of the linear model, which shows a relative short recovery behavior. This circumstance is due to the fact that high-rise buildings have a longer construction time than multi-functional and single-family houses, as shown in the overview in Table A1. Hence, the mixture of different object and construction types of the compact city is also reflected with the performance-time relations.
Per the definition, as shown in Figure 1 (right), an often used single quantity to measure the resilience of a system is realized by integration of the performance loss over time or the loss per time is often used [11,32]. The recovery capabilities are determined in the following with respect to a performance loss function per duration time of disruption (second division by ), a kind of performance function loss gradient,
Additionally, to the pure risk assessment, the recovery behavior influences the target quantity of acceptable resilience. The elongated form of the linear city results in areas, which will be not affected by critical objects and hence small susceptibilities. Many of the residential objects are constructed as a single-family house with masonry wall constructions and result in strong vulnerabilities and hence in critical risk values. The simple construction types include short recovery to reach the initial usability, which has a lasting effect on the defined resilience quantity. The application of Equation (4) shows that the linear city () has almost the same averaged performance loss per time than the central business district (). Because of the larger proportion of similar object use types, the central business district includes no single hotspots. The averaged risk depends mainly on the vulnerability. The considered construction types to the larger extent of office buildings or towers include longer recovery phases, which is the reason for similar resilience quantities compared to the linear city.
Small free spaces and a high mixture of object types are the main reasons for an aerial susceptibility with several hot spots within the compact city model. A great variety of construction types result accordingly in a broad spread concerning expected damage effects but also in parts with robust behavior and short recovery phases. Within the three applied models and in alignment to the introduced methodology, the outcomes point out that the compact city () results in the smallest quantities concerning the averaged performance loss over time. This is a very interesting result, since the compact city is also favored from many other perspectives including sustainability and quality of living.
The three application examples underline the benefit of a susceptibility, vulnerability driven and risk-informed resilience assessment. The extension on the further dimension of recovery allows a more precise and deeper evaluation compared to classical risk assessment schemes. Low vulnerability or a high susceptibility results in critical risk values. However, in combination with short recovery phases, such systems can still be comparatively resilient despite critical risk quantities. From a risk perspective, the costs of the overall recovery phase have to be quantified adequately. From a resilience management perspective, classical susceptibility, vulnerability and risk cover only parts of the resilience management cycle. Hence, a correlation between risk and resilience is not mandatory.
The new framework allows a quantification which resilience phase is more effective for the considered urban area. Based on the multi-dimensional and complex characteristics of a certain city type, generalized statements about a most effective resilience improvement measure are not available and requires an individual investigation per city and the examination of different resilience phases. If the assessment results in relatively high susceptibilities, preparation or prevention measures will be more powerful. Protection measures are adequate, if the considered system exhibits high vulnerabilities. Decreasing damage effects result in smaller recovery efforts and require lower efforts concerning the response.
The response and recovery perspective, with focus on reconstruction offers the additional quantification of resilience in terms of recovery times, recovery slopes and expected loss. A steeper slope of the performance function results in a faster recovery and is considered in the applied expression to give an idea of rapidity within the recovery phase. The introduced formulation in Equation (4) results in a single quantity and gives the option of comparability between different cities or resilience improvements.
5. Summary and Conclusions
Within this paper, a risk-based method, as introduced in [22], is applied to three different urban forms and expanded to the aspect of recovery to get insights concerning the resilience of urban areas. Based on a decisive definition of the terminology, the present paper introduces a mathematical concept for the quantification of resilience. Different quantities are identified to be most relevant for the five resilience management phases. Urban modelling quantities have a lasting effect on the preparation phase for resilience. The susceptibility analysis is able to evaluate the prevention phase. Protection measures can be matched with the vulnerability and risk quantities. Recovery processes can be matched with the estimation of time spans for different urban objects. Response measures are only indirectly matched with consideration of other resilience management phases.
The combination of risk quantities and recovery processes deliver a time dependent estimation of performance to quantify resilience. The application of different enhancement measures allows then the evaluation of the effectiveness for single resilience management phases. Preparation, prevention and protection measures can be directly addressed. The management phases of response and recovery are indirectly supported. An increased robustness results in smaller damage effects and hence in smaller efforts concerning response and recovery, for example.
Complex and mostly qualitative social aspects are not considered, but the derived approach delivers a precise estimation of expected losses in terms of loss and degree of recovery of built functionalities of urban objects. However, the performance of buildings is not yet quantified and prized.
The risk-based resilience approach is applied to three typical urban forms concerning the damage type building collapse. The building density, the mixture of object types and the applied construction types determine the various resilience management quantities. City quarters with a clear and homogeneous allocation of use types result in an approximately uniform distribution of susceptibility and the risk depends mainly on the vulnerability effects, as shown with the results of the central business district. Therefore, the application of protection measures would be most effective to result in a resilient surrounding.
The extension on recovery as a further resilience dimension shows that an increasing robustness or low risk values alone are not sufficient to qualify resilient systems. The example of the linear city results in stronger damage effects but a similar resilience quantity compared to the central business district, based on shorter recovery times. The approach allows a quantitative comparison, how effective the investigation of further resilience phases, like preparation of prevention, which could be an option if there are several hotspots at risk.
The high mixture of object and construction types within a compact city results in several hot spots but the composition results in a robust behavior an short recovery and hence in the most resilient morphology in terms of recovery behavior without application of enhancement measures. The inhomogeneous distribution repeals scenarios with strong damage effects or long recovery phases. This fits nicely with the often-attributed sustainability and societal acceptance of compact city forms.
Building density or the distribution of objects, free spaces, construction type or the use of a building are main attributes, which will influence the resilience of an urban surrounding. The results deliver information on how growing agglomerations can be sustainably designed also with regards to new threats. The overall framework and calculation methods builds a possible basis for urban planners, decision makers or insurance companies to analyze and optimize designs of city areas.
Within this paper, terroristic threats are exemplary evaluated. Based on the clear definition, this framework allows also an evaluation of other main kind of disasters. This requires the availability of statistical data and appropriate models to assess expected damage effects. Examples could be models in the range of earthquake events [33] or flood risks [34].
The introduced framework uses validated engineering models and the comparison to real events underline the accuracy of the statistical data. The estimation of recovery phases based on expert knowledge and results in capable quantities to postulate resilience. A possible deviation of recovery times is currently not considered and will be a point of reference for future research. Similar to social aspects, which are currently only indirect matched.
Author Contributions
Besides the work of K.F., the following contributions are provided by the coauthors: S.H. supervised the research that leads to the content of this paper. W.R. gave contributions within the application examples and the definition of the city models. I.H. helped to define the mathematical formulations, presented in this paper.
Acknowledgments
The research leading to these results has received funding form the European Commission’s 7th Framework Programme within the EU project EDEN under grant agreement no. 313077 and VITRUV under grant agreement no. 261741. The contribution of Andreas Bach and Ingo Müllers (Schüßler-Plan Engineering GmbH) for the provision of the list with pre-defined construction types including the estimated time scales is gratefully acknowledged.
Conflicts of Interest
The authors declare no conflict of interest.
Appendix A

Table A1.
Overview of pre-defined building types, their construction and time-scales for planning and construction to estimate the recovery process [29].
Table A1.
Overview of pre-defined building types, their construction and time-scales for planning and construction to estimate the recovery process [29].
| Construction Type | Construction | Number of Floors | Recovery Time [month] | |
|---|---|---|---|---|
| Planning, Approval | Construction | |||
| Single-family house | Masonry (walls) Reinforced concrete (slabs, beams) | 3 | 9 | 11 |
| Multi-family house | Reinforced concrete (walls, slabs, beams) | 6 | 15 | 13 |
| Block of flats | Reinforced concrete (walls, slabs, columns) | 17 | 18 | 18 |
| Industrial building | Steel (beams) trapezoidal steel profiles (roof, walls) | 1 | 18 | 14 |
| Multi-family house, mixed use | Reinforced concrete (walls, columns, slabs) Steel (columns) Timber (girders) | 4 | 15 | 13 |
| Sports hall | Reinforced concrete (walls, columns, slabs) Steel (roof construction) | 1 | 15 | 18 |
| Shopping mall | Reinforced concrete (walls, slabs, columns) | 5 | 20 | 22 |
| Office building | 7 | 18 | 18 | |
| Office tower | 13 | 20 | 22 | |
| Public transport terminal | Reinforced concrete (walls, slabs, columns) Steel (roof) | 1–2 | 24 | 24 |
References
- Branscomb, L. Sustainable cities: Safety and Security. Technol. Soc. 2006, 28, 225–234. [Google Scholar] [CrossRef]
- The Minerals, Metals and Materials Society (TMS). Engineering Solutions for Sustainability, Materials and Rescources—Workshop Report and Recommendations; John Wiley & Sons: Hoboken, NJ, USA, 2012. [Google Scholar]
- Kröger, W.; Zio, E. Vulnerable Systems; Springer: London, UK, 2011. [Google Scholar]
- Department of Economic and Social Affairs. World Urbanization Prospects; The 2014 Revision; United Nations: New York, NY, USA, 2014.
- Cross, J. Megacities and small towns: Different perspectives on hazard vulnerability. Environ. Hazards 2001, 3, 63–80. [Google Scholar]
- Lin, C.; Liou, D.; Wu, K. Opportunities and challenges created by terrorism. Technol. Forecast. Soc. Chang. 2007, 74, 148–164. [Google Scholar] [CrossRef]
- Tamvakis, P.; Xenidis, Y. Comparative Evaluation of Resilience Quantification Methods for Infrastructure Systems. Procedia Soc. Behav. Sci. 2013, 74, 339–348. [Google Scholar] [CrossRef]
- Carpenter, S.; Walker, B.; Anderies, J.; Abel, N. From Metaphor to Measurement: Resilience of What to What? Ecosystems 2001, 4, 765–781. [Google Scholar] [CrossRef]
- Cutter, S.; Bernes, L.; Berry, M.; Burton, C.; Evans, E.; Tate, E.; Webb, J. A place-based model for understanding community resilience to natural disasters. Glob. Environ. Chang. 2008, 18, 598–605. [Google Scholar] [CrossRef]
- Gallopín, G. Linkages between vulnerability, resilience, and adaptive capacity. Glob. Environ. Chang. 2006, 16, 293–303. [Google Scholar] [CrossRef]
- Bruneau, M.; Chang, S.; Eguchi, R.T.; Lee, G.C.; O’Rourke, T.D.; Reinhorn, A.M.; Shinozuka, M.; Tierney, K.; Wallace, W.A.; von Winterfeldt, D. A Framework to Quantitatively Assess and Enhance the Seismic Resilience of Communities. Earthq. Spectra 2003, 19, 733–752. [Google Scholar] [CrossRef]
- Chang, S.; Shinozuka, M. Measuring Improvements in the Disaster Resilience of Communities. Earthq. Spectra 2004, 20, 739–755. [Google Scholar] [CrossRef]
- Cimellaro, G.; Reinhorn, A.; Bruneau, M. Framework for analytical quantification of disaster resilience. Eng. Struct. 2010, 32, 3639–3649. [Google Scholar] [CrossRef]
- Jabareen, Y. Planning the resilient city: Concepts and strategies for coping with climate change and environmental risk. Cities 2013, 31, 220–229. [Google Scholar] [CrossRef]
- Federal Emergency Management Agency. HAZUS—Methodology for Estimating Potential Losses from Disasters. Available online: http://www.fema.gov/hazus (accessed on 3 August 2015).
- Quiel, S.; Marjanishvili, S.; Katz, B. Performance-Based Framework for Quantifying Structural Resilience to Blast-Induced Damage. J. Struct. Eng. 2015, 142, C4015004. [Google Scholar] [CrossRef]
- Federal Emergency Management Agency. FEMA-426: Reference Manual to Mitigate Potential Terrorist Attacks Against Buildings, 2nd ed.; U.S. Department of Homeland Security: Washington, DC, USA, 2011.
- Curdes, G. Stadtmorphologie und Klimawandel—Welche Stadtstrukturen können den Klimawandel überleben? In Proceedings of the 17th International Seminar on Urban Form, Hamburg, Germany, 20–23 August 2010. [Google Scholar]
- Jabareen, Y. Sustainable Urban Forms—Their Typologies, Models, and Concepts. J. Plan. Educ. Res. 2006, 26, 38–52. [Google Scholar] [CrossRef]
- Adger, W. Social and ecological resilience. Are they related? Prog. Hum. Geogr. 2000, 24, 347–364. [Google Scholar] [CrossRef]
- Thoma, K. Resilien-Tech-Resilience-by-Design: Strategie für die Technologischen Zukunftsthemen; Acatech, Deutsche Akademie der Wissenschaften: Berlin, Germany, 2014. [Google Scholar]
- Fischer, K. Resilience Quantification of Urban Areas, an Integrated Statisitcal-Empirical-Physical Approach for Man-Made and Natural Disruptive Events. Ph.D. Thesis, University of Freiburg, Freiburg, Germany, 2018. [Google Scholar]
- Fischer, K.; Häring, I.; Riedel, W.; Vogelbacher, G.; Hiermaier, S. Susceptibility, vulnerability and averaged risk for resilience enhancement of urban areas. Int. J. Protect. Struct. 2016, 7, 45–76. [Google Scholar] [CrossRef]
- Fischer, K.; Häring, I. SDOF response model parameters from dynamic blast loading experiments. Eng. Struct. 2009, 31, 1677–1686. [Google Scholar] [CrossRef]
- Müllers, I.; Fischer, K.; Nawabi, A.; Riedel, W. Design against Explosions and Subsequent Progressive Collapse. Struct. Eng. Int. 2015, 25, 319–325. [Google Scholar] [CrossRef]
- Siebold, U.; Ziehm, J.; Häring, I. Terror Event Database and Analysis Software. In Proceedings of the 4th Security Research Conference, Karlsruhe, Germany, 29th September–1st October 2009. [Google Scholar]
- Fischer, K.; Siebold, U.; Vogelbacher, G. Empirical analysis of security critical events in urban areas. Bautechnik 2014, 91, 262–273. [Google Scholar] [CrossRef]
- Valente-Pereira, L. Urban Form Definition in Urban Planning; Simplissimo: Lisbon, Portugal, 2014. [Google Scholar]
- Schüßler Plan Ingenieurgesellschaft mbH. D4.4: Vulnerability Analysis of Generic Structures and Functional Units; EU project VITRUV: Düsseldorf, Germany, 2013; Available online: www.vitruv-project.eu (accessed on 28 May 2018).
- Proske, D. Catalogue of Risks; Natural, Technical, Social and Health Risks; Springer: Berlin, Germany, 2008. [Google Scholar]
- Hunter, P.; Fewtrell, L. Acceptable Risk. In Water Quality: Guidelins, Standards and Health; Fewtrell, L., Bartram, J., Eds.; WHO by IWA Publishing: London, UK, 2001. [Google Scholar]
- Cimellaro, G. Urban Resilience for Emergency Response and Recovery—Fundamental Concepts and Applications; Springer: Berlin, Germany, 2016. [Google Scholar]
- Krawinkler, H.; Miranda, E. Performance-based earthquake engineering. In Earthquake Engineering, from Engineering Seismology to Performance-Based Engineering; Bozorgniam, Y., Bertero, V.V., Eds.; CRC-Press: Boca-Raton, FL, USA, 2004; pp. 1–59. [Google Scholar]
- Büchele, B.; Kreibich, H.; Kron, A.; Thieken, A.; Ihringer, J.; Oberle, P.; Merz, B.; Nestmann, F. Flood-risk mapping: Contributions towards an enhanced assessment of extreme events and associated risks. Nat. Hazards Earth Syst. Sci. 2006, 6, 485–503. [Google Scholar] [CrossRef]
Figure 1.
Five phases of the resilience cycle (left) according to [21] and their interpretation within a performance-time relation (right) for the quantification of resilience.
Figure 1.
Five phases of the resilience cycle (left) according to [21] and their interpretation within a performance-time relation (right) for the quantification of resilience.

Figure 2.
Proposed framework to assess the occurrence of adverse events and the expected losses as basis for resilience quantification according to [22].
Figure 2.
Proposed framework to assess the occurrence of adverse events and the expected losses as basis for resilience quantification according to [22].

Figure 3.
Distribution of construction types (left) and object use types (right) depending on the investigated city model.
Figure 3.
Distribution of construction types (left) and object use types (right) depending on the investigated city model.

Figure 4.
The quantitative susceptibility analysis combines statistical data per object use with the geospatial information of an urban surrounding to evaluate possible threat positions. Comparison of the three investigated urban forms. The susceptibility is given as probability of any dangerous event per area of size, in case of an occurring disruptive event.

Figure 5.
Comparison of the investigated city models within a frequency-number diagram concerning the expected damage and the comparison to criteria of acceptance. Based on the composition of construction types and object uses, each city model results in varying probability that an event with N or more damaged buildings occurs.

Figure 6.
Comparison of the performance-time relation of the three investigated city models based on the average of the derived risk quantities in combination with expected recovery times.
Figure 6.
Comparison of the performance-time relation of the three investigated city models based on the average of the derived risk quantities in combination with expected recovery times.

© 2018 by the authors. Licensee MDPI, Basel, Switzerland. This article is an open access article distributed under the terms and conditions of the Creative Commons Attribution (CC BY) license (http://creativecommons.org/licenses/by/4.0/).
Share and Cite
MDPI and ACS Style
Fischer, K.; Hiermaier, S.; Riedel, W.; Häring, I. Morphology Dependent Assessment of Resilience for Urban Areas. Sustainability 2018, 10, 1800. https://doi.org/10.3390/su10061800
AMA Style
Fischer K, Hiermaier S, Riedel W, Häring I. Morphology Dependent Assessment of Resilience for Urban Areas. Sustainability. 2018; 10(6):1800. https://doi.org/10.3390/su10061800
Chicago/Turabian StyleFischer, Kai, Stefan Hiermaier, Werner Riedel, and Ivo Häring. 2018. "Morphology Dependent Assessment of Resilience for Urban Areas" Sustainability 10, no. 6: 1800. https://doi.org/10.3390/su10061800
Note that from the first issue of 2016, this journal uses article numbers instead of page numbers. See further details here.