Integrating Irrigation and Drainage Management to Sustain Agriculture in Northern Iran


1
Water Engineering Department, Sari Agricultural Sciences and Natural Resources University, 4816118771 Sari, Iran
2
Water Resources Management Group, Wageningen University, 6700AA Wageningen, The Netherlands
*
Author to whom correspondence should be addressed.
Sustainability 2018, 10(6), 1775; https://doi.org/10.3390/su10061775
Submission received: 15 April 2018
/
Revised: 22 May 2018
/
Accepted: 24 May 2018
/
Published: 29 May 2018
(This article belongs to the Special Issue Degradation and Sustainable Management of Land)
Abstract
:In Iran, as in the rest of the world, land and water for agricultural production is under pressure. Integrating irrigation and drainage management may help sustain intensified agriculture in irrigated paddy fields. This study was aimed to investigate the long-term effects of such management strategies in a newly subsurface drained paddy field in a pilot area in Mazandaran Province, northern Iran. Three strategies for managing subsurface drainage systems were tested, i.e., free drainage (FD), midseason drainage (MSD), and alternate wetting and drying (AWD). The pilot area consisted of subsurface drainage systems, with different combinations of drain depth (0.65 and 0.90 m) and spacing (15 and 30 m). The traditional surface drainage of the region’s consolidated paddy fields was the control. From 2011 to 2017, water table depth, subsurface drainage system outflow and nitrate, total phosphorous, and salinity levels of the drainage effluent were monitored during four rice- and five canola-growing seasons. Yield data was also collected. MSD and AWD resulted in significantly lower drainage rates, salt loads, and N losses compared to FD, with MSD having the lowest rates. Phosphorus losses were low for all three practices. However, AWD resulted in 36% higher rice yields than MSD. Subsurface drainage resulted in a steady increase in canola yield, from 0.89 ton ha−1 in 2011–2012 to 2.94 ton ha−1 in 2016–2017. Overall, it can be concluded that managed subsurface drainage can increase both water productivity and crop yield in poorly drained paddy fields, and at the same time reduce or minimize negative environmental effects, especially the reduction of salt and nutrient loads in the drainage effluent. Based on the results, shallow subsurface drainage combined with appropriate irrigation and drainage management can enable sustained agricultural production in northern Iran’s paddy fields.
1. Introduction
Increases in population and ongoing urbanization, along with a decrease in productive lands, are major challenges facing policy makers aiming for better use of limited available land and water resources. In spite of there being considerable amounts of land potentially suitable for agriculture, much of it is covered by forests, protected for environmental reasons, or used for urban settlements [1]. As a result of this ongoing urbanization, global arable land, currently more than 1500 Mha, is expected to decline to 1385 Mha by 2060 [2]. Moreover, increasing demand for water for irrigation, municipal, industrial, and environmental uses is intensifying competition for the limited available water resources in many parts of the world [3]. Under such circumstances, increased crop production per unit of arable land and per unit of available water is mainly possible through improved land and water management practices.
Paddy fields, which occupy about 30% of the world’s irrigated cropland [4], have good potential for increased water, nutrient, and crop productivity. However, there are some challenges. More than 75% of the world’s paddy fields are continuously flooded during rice growing season [5], mainly to limit variations in soil moisture and temperature and to depress soil-borne diseases and weed growth [6]. However, such anaerobic conditions can increase emissions of CH4 [7,8]—one of the most important greenhouse gasses influencing global warming. In addition, water productivity and crop yield are generally low under continuously flooded irrigation [9]. Furthermore, waterlogging and ponding problems in paddy fields during rainy seasons, when lower temperatures limit rice cultivation, prevent winter cropping in some parts of the world, which further decreases the productivity of these fields. These conditions, which also exist in northern Iran, have made paddy cultivation economically unsustainable for many farmers who rely on paddy fields for their income. This is a major reason for land use changes and a decrease in paddy lands. In Iran, the area of paddy fields decreased 1.4% per year over the period 2000–2011 [10,11].
To prevent conversion from paddy fields to other land uses, the government of Iran initiated land consolidation projects to increase agricultural productivity [12]. These projects included improved water management through the installation of a separate water supply and drainage canals. In northern Iran’s paddy fields, these improvements were not sufficient to combat the waterlogging and ponding problems [10]; consequently, feasibility studies for the installation of subsurface drainage were initiated to enable crop diversification and low-cost rice farming.
Subsurface drainage can provide suitable conditions for intensive agriculture in paddy fields. Improved water management in subsurface drained paddy fields is possible through controlled drainage, which allows drainage during specific periods. Examples of controlled drainage management strategies are midseason drainage (MSD) and alternate wetting and drying (AWD), which have been developed in various parts of the world to improve crop and water productivity and decrease water consumption during the rice growing season [13,14,15,16]. Such strategies can also decrease CH4 emissions [6,17,18] and reduce nutrient loss from drained areas [19]. Although winter cropping in subsurface drained paddy fields in humid regions, like northern Iran, requires free drainage for effective control of waterlogging; this leads to concerns about the environmental impact of nutrient loss. Managed subsurface drainage is a means to secure sustainable agriculture in the region with fewer consequences for the fragile environment overall. However, before such new technologies can be implemented on a large scale, these environmental effects need to be quantified at the level of pilot areas.
A drainage pilot test area consisting of five different drainage systems was constructed at the Sari Agricultural Sciences and Natural Resources University (SANRU) in northern Iran in 2011. These different drainage systems were used to test three alternative controlled irrigation and drainage management strategies: free drainage (FD) in the winter season, when canola is cultivated; midseason drainage (MSD); and alternate wetting and drying (AWD) in the summer, during the rice-growing season. This paper discusses the effects of these strategies in the different drainage systems on water efficiency, salt loads, nutrient losses and crop yield.
2. Materials and Methods
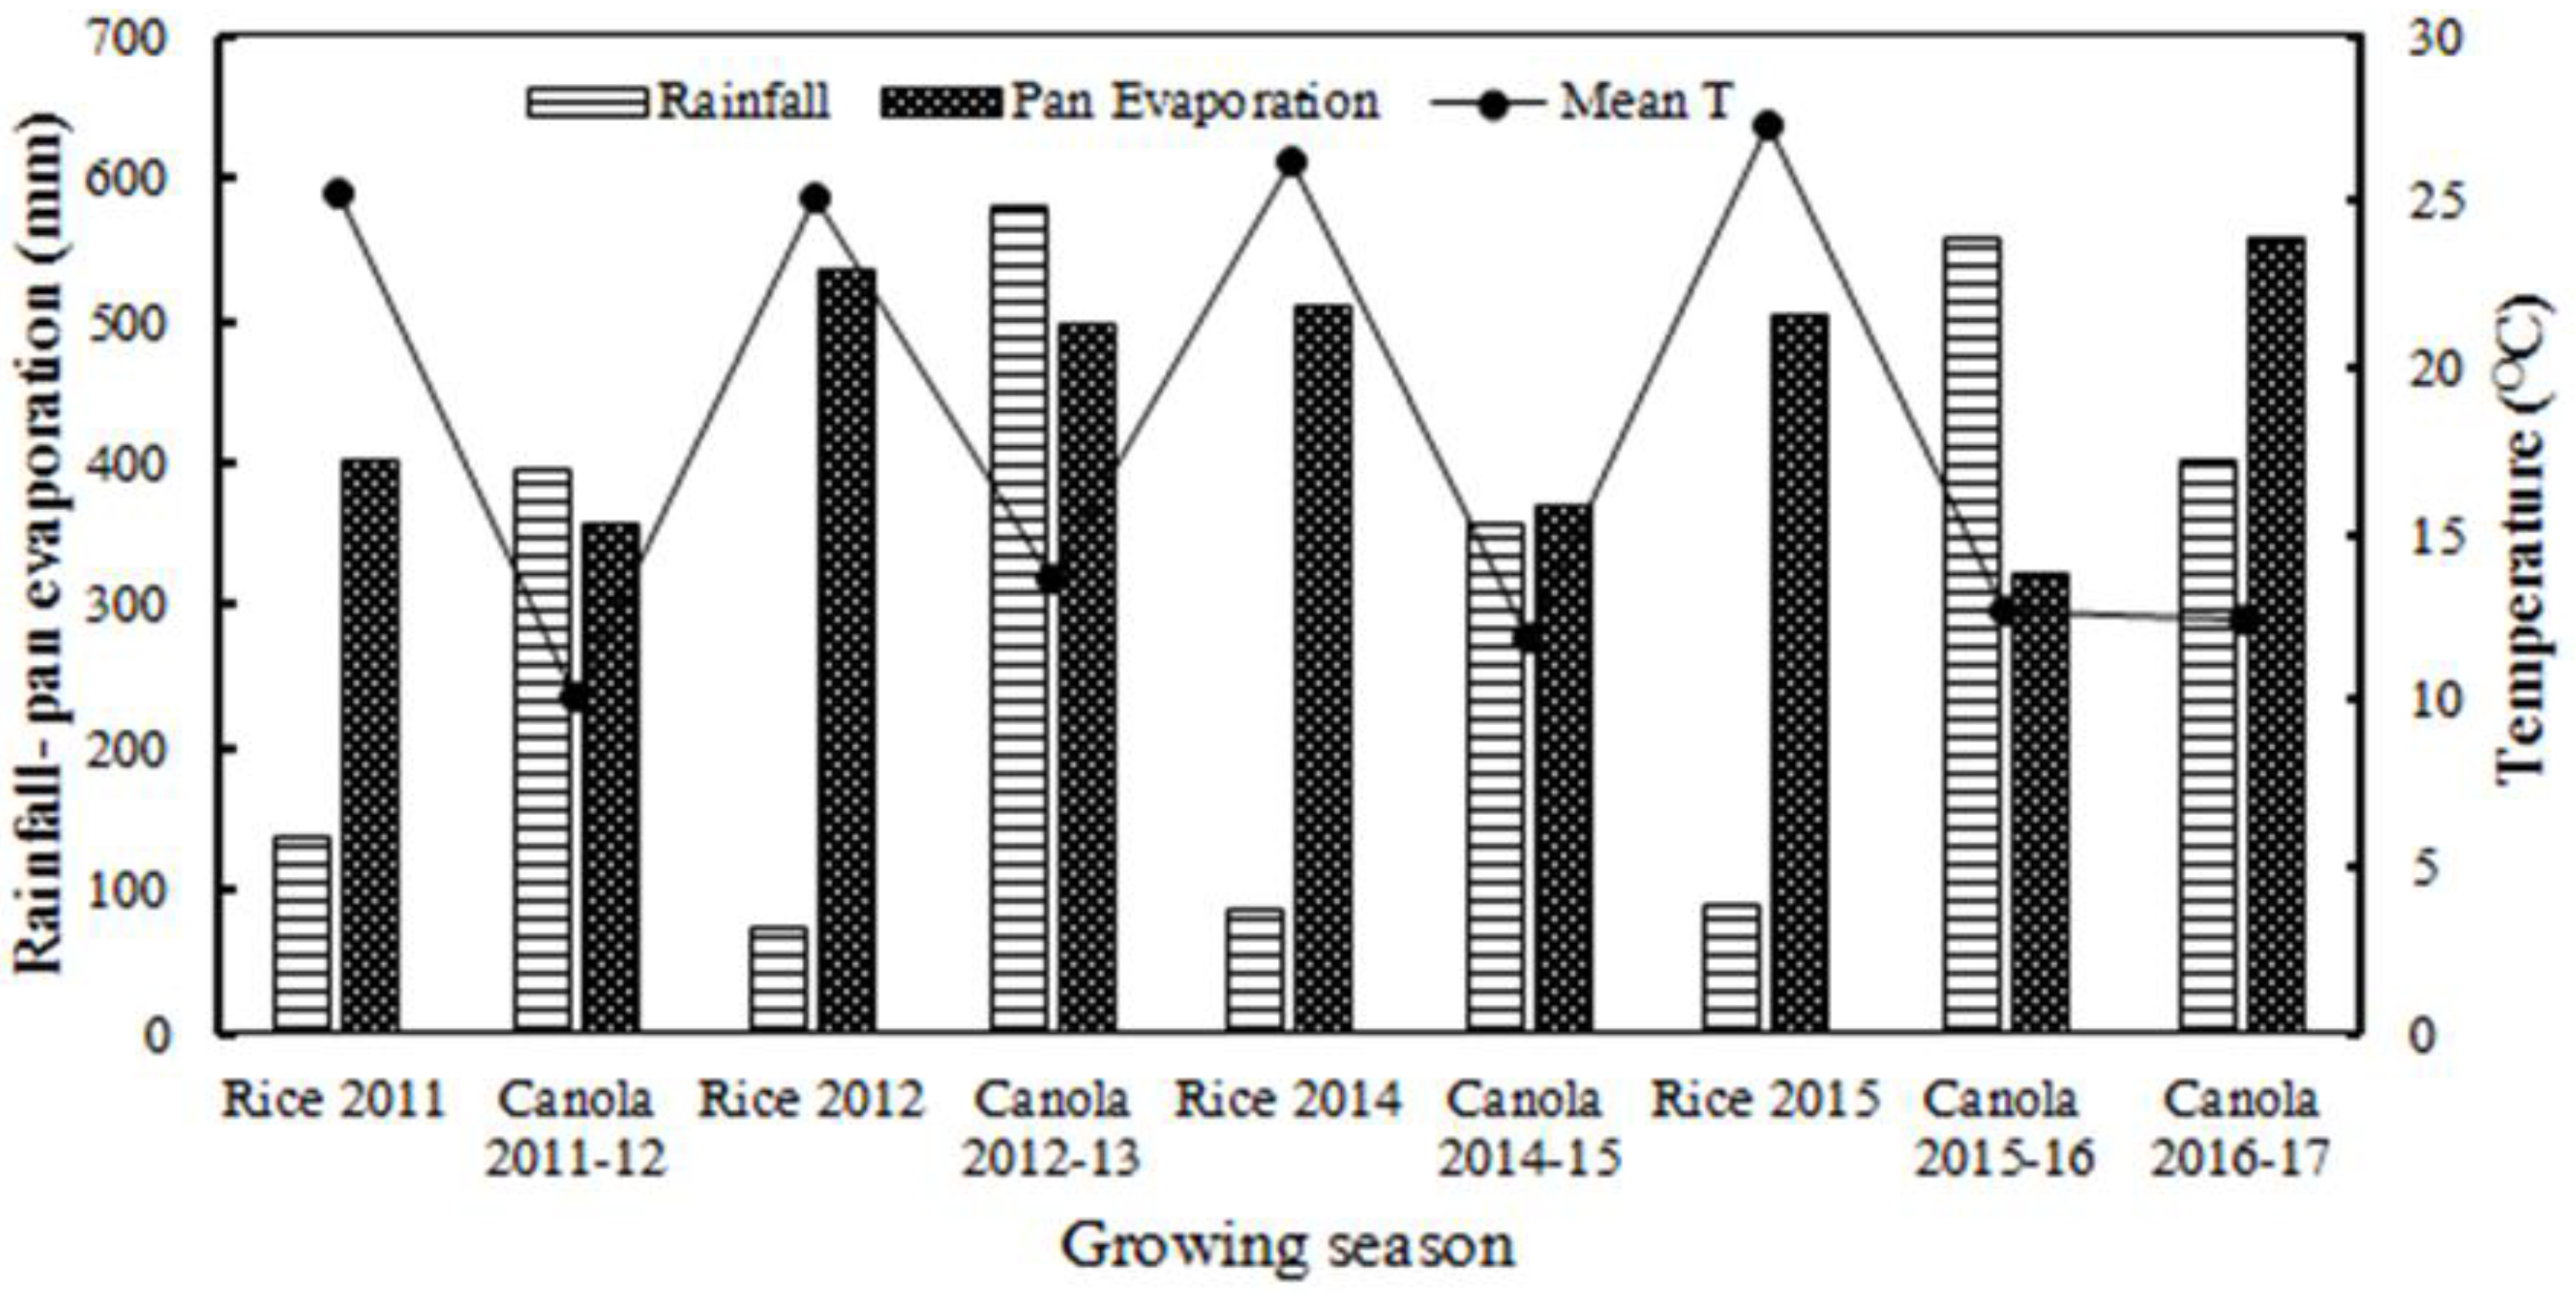
The experimental site is located in the poorly drained and consolidated paddy fields of SANRU, located in Mazandaran province, norther Iran (36.3 °N, 53.04 °E; 15 m below sea level). The area has a mild, semi-humid climate with dry summers, mild winters, and temperatures above 22 °C in the warmest month (Koeppen–Geiger classification: Csa Climate). Over the study period (2011–2017), seasonal average rainfall varied between 86 and 137 mm during the rice growing seasons, significantly lower than the average pan evaporation (402–535 mm), clearly indicating the need for irrigation (Figure 1). In the winter, during the canola-growing season, rainfall exceeded pan evaporation, except for 2014–2015 and 2016–2017. Mean temperatures ranged between 25.1–27.3 °C and 10.1–13.6 °C in the rice and canola growing seasons, respectively. The site is typical of the heavy paddy soils of northern Iran. The soil is silty clay to clay, with 4–11% sand, 38–55% silt and 42–60% clay in different soil layers to a depth of 3 m, with a very low conductive layer at 30–60 cm depth.
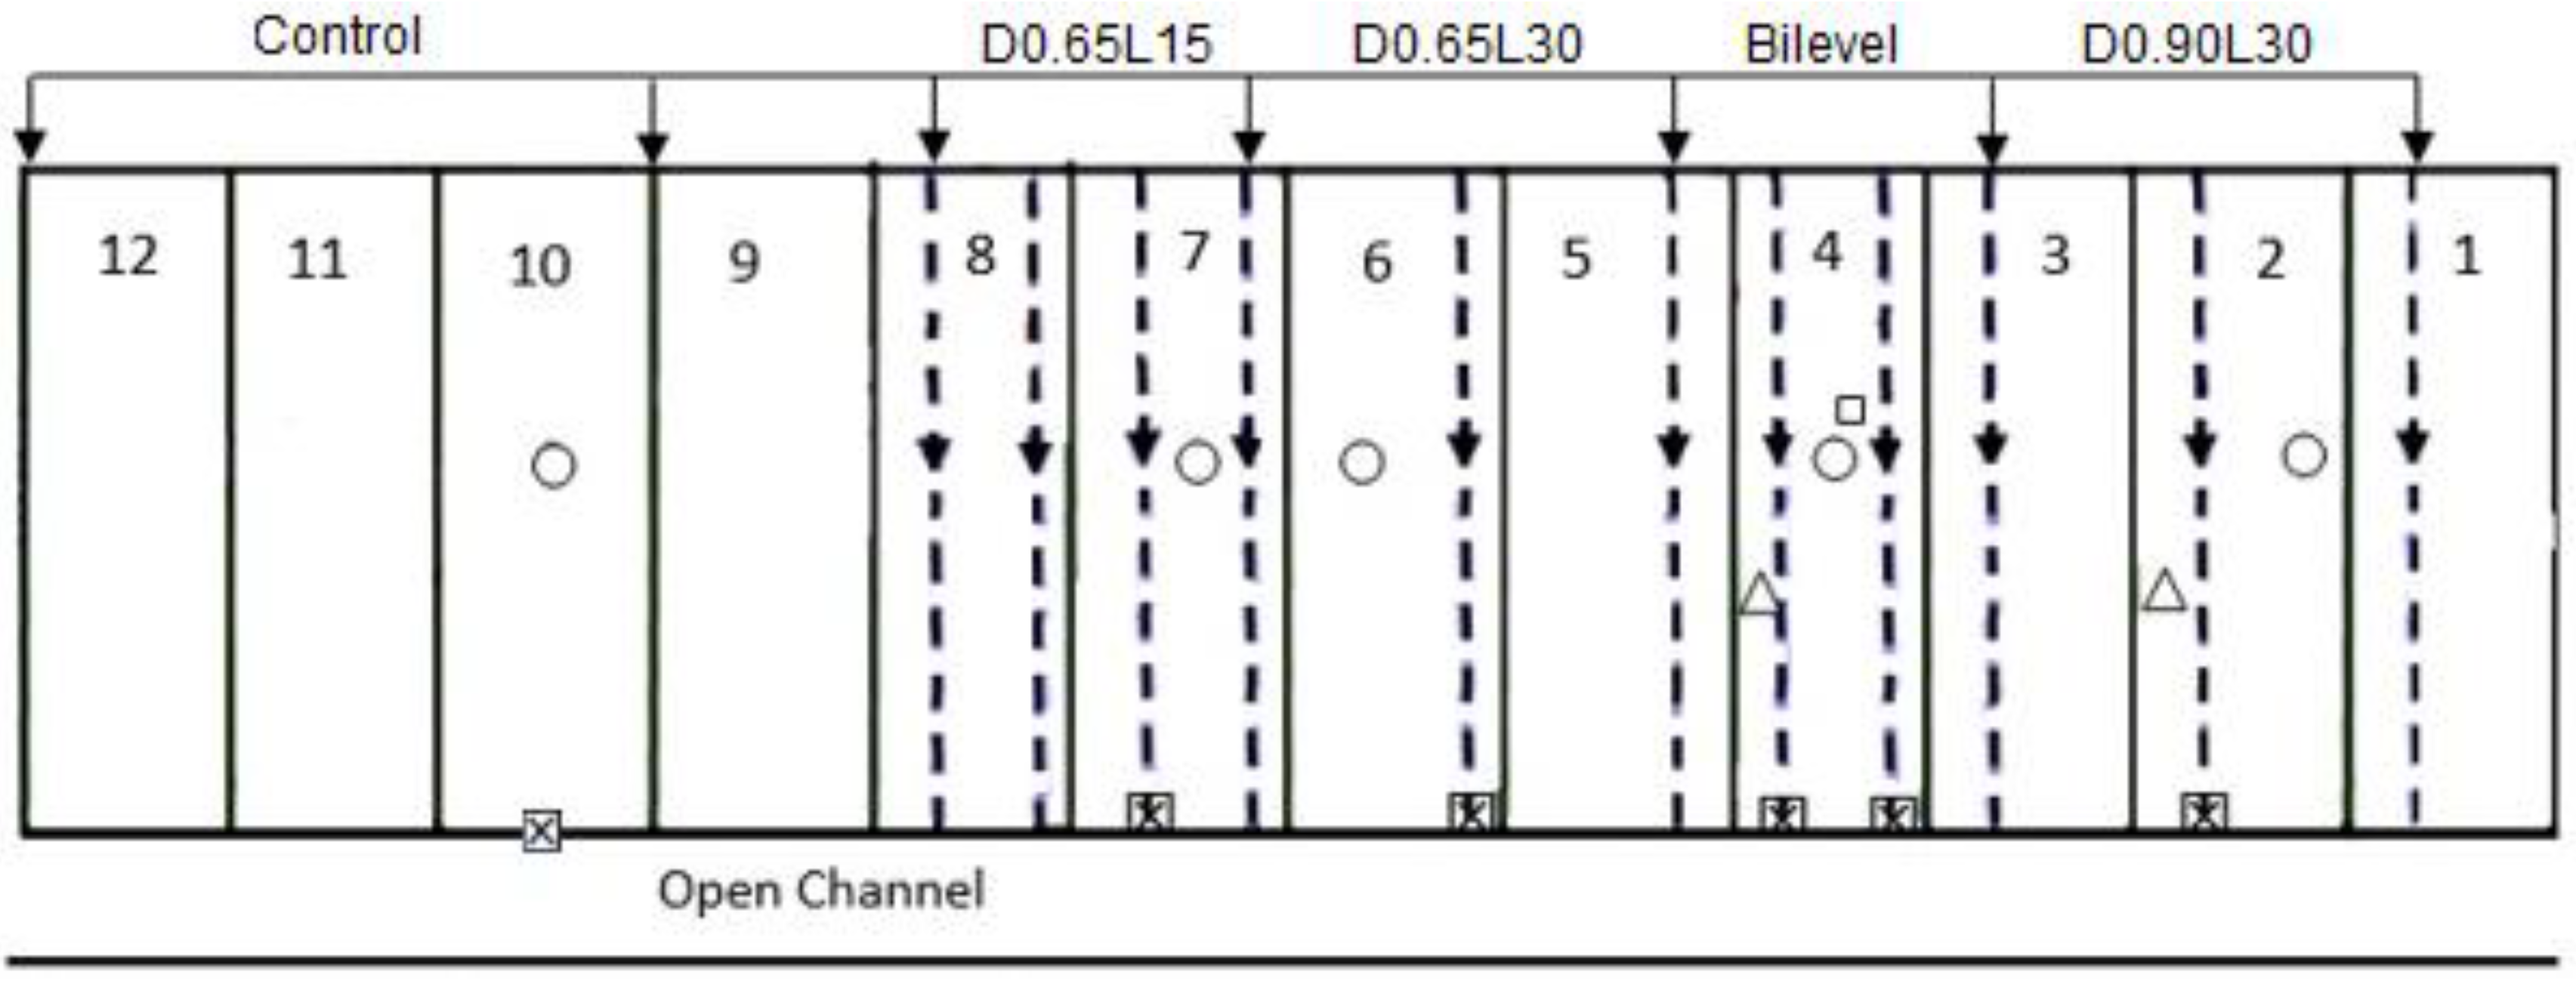
Through national land consolidation projects, the irregular paddy plots in the study site were reshaped into standard plots with a width of 30 m and a length of 100 m, providing access roads and improving irrigation and drainage facilities were other components of the projects. In 2011, subsurface drainage systems were installed using two drain depths (0.65 and 0.90 m) and two drain spacings (15 and 30 m). Depth and spacing of the subsurface drains were selected based on national recommendations and field conditions. The installed drainage systems are D0.90L30, D0.65L30, and D0.65L15, in which the values after D and L indicate the depth and spacing of the pipe drains (Figure 2). In addition, another subsurface drainage system, consisting of four drain lines with 15 m spacing and 0.65 and 0.90 m alternating depths (Bilevel), was also installed. All subsurface drainpipes are connected to an open channel at a depth of 1.2 m. For the region, traditional and representative surface drainage with only an open drain was selected as the control plot. A detailed description of the drainage systems can be found in [20].
One variety of rice (Daylamani Tarom) and one variety of canola (Hayola 401) were grown in these plots during nine growing seasons (2011–2017); four rice growing seasons (21 July 2011 to 10 October 2011, 28 May 2012 to 11 August 2012, 10 May 2014 to 5 August 2014, and 4 June 2015 to 28 August 2015); and five canola growing seasons (28 November 2011–8 May 2012, 4 October 2012–15 May 2013, 10 October 2014–10 May 2015, 3 October 2015–4 May 2016, 2 October 2016–20 May 2017).
Rice was cultivated under two controlled irrigation and drainage management regimes, namely midseason drainage (MSD) in 2011 and 2012, and alternate irrigation and drainage—or alternate wetting and drying (AWD)—in 2014 and 2015. In 2013 and 2016, rice cultivation was done under the conventional flooding practices; these years are not included in this research. Under MSD, the paddy plots were drained for a seven-day period starting 25 days after transplanting (DAT). Two drainage periods were adopted for AWD practice: 25–34 DAT and 44–49 DAT in 2014, and 28–32 DAT and 39–43 DAT in 2015. Additionally, at the end of the growing season, drainage was practiced for a period of 7–14 days before harvest for all treatments. In the periods that there was no drainage, a water layer of about 5 cm was maintained in the paddy plots. Shallow groundwater was extracted from wells to irrigate the paddy plots during the rice growing seasons. Total irrigation inputs during rice growing seasons were monitored through daily measurements of well discharges. The average salinity of the irrigation water (ECi) during the rice growing seasons of 2011, 2012, 2014 and 2015 was, respectively 1.12, 1.29, 1.25 and 1.30 dS m−1.
After the rice harvest, canola was grown under rainfed conditions in 2011, 2012, 2014, 2015, and 2016. During the canola growing seasons, the fields had free drainage except for short periods at the end of the seasons, when the drain outlets were closed to avoid water stress. Fertilization practices for both crops were based on the normal practices in the region (Table 1).
During the drainage periods of the different growing seasons, the depth of the water table was measured daily in observation wells midway between two adjacent drains in all subsurface drainage systems. Evapotranspiration and deep percolation during the rice-growing season were measured with a set of closed- and open-bottom lysimeters [20]. Drainage outflow was measured daily whenever subsurface drains were discharging during all-rice-growing seasons and the three canola-growing seasons (2011–2012, 2015–2016, and 2016–2017). In these growing seasons, the electrical conductivity (EC) of the drainage water was measured, and water sampling for nitrate and total phosphorus (TP) concentration in the drainage was done for at least three successive days during each drainage event, during the rice growing seasons, and at 15-day intervals during the canola growing seasons. A total of 345 and 384 water samples were analysed for EC and nitrate concentration, respectively. EC was measured using an electrical conductivity meter (EC meter). The water samples were analysed spectrophotometrically for nitrate and TP concentrations. The TP concentration was analysed spectrophotometrically (700 nm) by the ammonium molybdate method of Murphy and Riley [21], with ascorbic acid as a reducing agent. Total losses of nitrate and TP, as well as salt loads, were calculated based on the concentration of nitrate, TP, and EC in the drainage water and the drainage outflow. At harvest, crop yield was determined for each treatment in each growing season. The effects of the drainage systems and management strategies were determined from analysis of variance (ANOVA) using the general linear model (GLM) procedure in Statistical Analysis System (SAS) software [22]. The PROC MEANS procedure within SAS was used to calculate the standard deviation. The least significant difference (LSD) test at 0.05 probability level was used to check significant differences between means.
3. Results and Discussion
3.1. Analysis of the Water Balances in the Different Irrigation and Drainage Management Treatments
The measured rainfall, irrigation, evapotranspiration and drain outflows were used to calculate water balances for the three management treatments (Table 2). During rice cultivation, irrigation allotment varied per season, partly due to variation in rainfall and evapotranspiration, but the irrigation allotments for the MSD treatment were slightly higher (2%) compared to AWD. This can be attributed to the number of days the subsurface drainage systems were open, during which no irrigation water was applied: the total drainage period for AWD was at least five days longer than that of MSD. The subsurface drainage outflow, however, was significantly lower than the deep percolation. Drainage of the control plot was performed through opening the outlet of this plot; in addition, there were some heavy rainfall events during the drainage periods that contributed to the surface runoff. By lowering the depth of the water table, subsurface drains provided better conditions for the crops to use the rainfall.
The increased subsurface drainage outflow under AWD, while having a lower irrigation input compared to MSD, is partly due to improved internal soil drainage, through alternate wetting and drying, and the long-term positive effects of the subsurface drainage system [23]. Moreover, the depth and spacing of the drains and the duration of the drainage period, due to their different impact on the soil conditions, affects the total volume of drainage water.
During the three canola-growing seasons with FD management, 31 to 48% of the total rainfall was discharged through the subsurface drainage systems. Of the total water input (rainfall + irrigation: 4347 mm) during the study period, 511 (12%), 458 (11%), 785 (18%), and 731 (17%) mm was discharged through the D0.90L30, D0.65L30, bilevel, and D0.65L15 systems, respectively. Not surprisingly, outflow was the highest for the system with the highest drainage intensity (bilevel). When compared to losses from the traditional drainage (control), it is evident that the use of subsurface drainage significantly reduces rainfall runoff, as more water can be stored in the root zone.
Deep percolation was quite high for all subsurface drainage treatments, exceeding deep percolation in the control plot. The high percolation losses resulted in low irrigation efficiencies. The relative water supply (RWS) ratio was used to assess irrigation efficiency (Equation (1)). RWS is defined as the ratio between total volume of water available for the crop (i.e., the irrigation water supplied to the crop (I)) and the effective precipitation (Pe) to the amount of water needed for crop production, which is equal to crop evapotranspiration (ET) [24]:
The RWS values varied between 1.6 and 2.1 (Table 3). RWS values between 0.9 and 1.2 are considered adequate to meet the theoretical irrigation requirement. RWS values higher than 1.2 indicate that there is an excess supply of water. If we excluded the deep percolation losses, the RWS ratios (RWS*) are significantly lower; thus, we may conclude that the soil texture, which has a clay content lower than 60%, is a major contributing factor to this low irrigation efficiency. Rainfall and other unaccounted losses such as seepage may have also contributed to these high RWS values. Additionally, ET was only measured during irrigation periods, which could have resulted in lower ET than the actual: this can also have contributed to the high RWS ratios.
Despite the low irrigation efficiency in rice production indicated by the RWS ratios, it is clear that the integrated irrigation and drainage management practices of MSD and AWD reduce drainage losses compared to traditional practices and FD, allowing more water to be captured in the soil. It is also clear that uncontrolled subsurface drainage (FD) enables high drainage volumes, which can create suitable conditions for winter cropping in paddy fields.
3.2. Drainage Water Salinity, Leaching Efficiency and the Corresponding Salt Loads
3.2.1. Drainage Water Salinity and Leaching Efficiency
Salinity of the subsurface drainage water quickly decreased after the installation of the subsurface drainage systems in 2011 (Table 4). Only the runoff from the control plot had a significantly higher initial salinity level (EC = 4.24 dS/m). After the first year, the salinity levels continued to drop, but at a slower rate. By 2016–2017, the salinity levels in all drainage systems had dropped to below 1.5 dS/m, with no significant difference between the three management treatments. However, comparing the individual drainage systems, we can see that the systems with the highest drainage intensity (D0.65L15 and bilevel) tend to have a higher salinity level compared to the systems with lower drainage intensity (D0.65L30 & D0.90L30), although these differences are generally not significant.
The salinity of the drainage water was used to calculate the leaching fraction (LF) (Table 5). The leaching fraction is defined as the fraction of the amount of water drained beyond the root zone in relation to the total applied water that enters in the root zone. The relationship between the total applied water (AW), the evapotranspiration (ET), and LF is shown below [25]:
In addition, the corresponding soil salinity levels were calculated using Equation (3), according to Van Hoorn and Van Alphen [26]:
where, ECi is the electrical conductivity of the irrigation water (dS/m) and ECe is the electrical conductivity of the saturated extract, as defined in Table 5. As expected, the leaching fractions are high, mainly due to the high deep percolation losses. Consequently, the soil salinity levels are low. The salinity levels calculated with the leaching fraction are in agreement with the measured salinities of the drainage water (Table 4).
3.2.2. Depth of the Water Table and Drainage Water Salinity
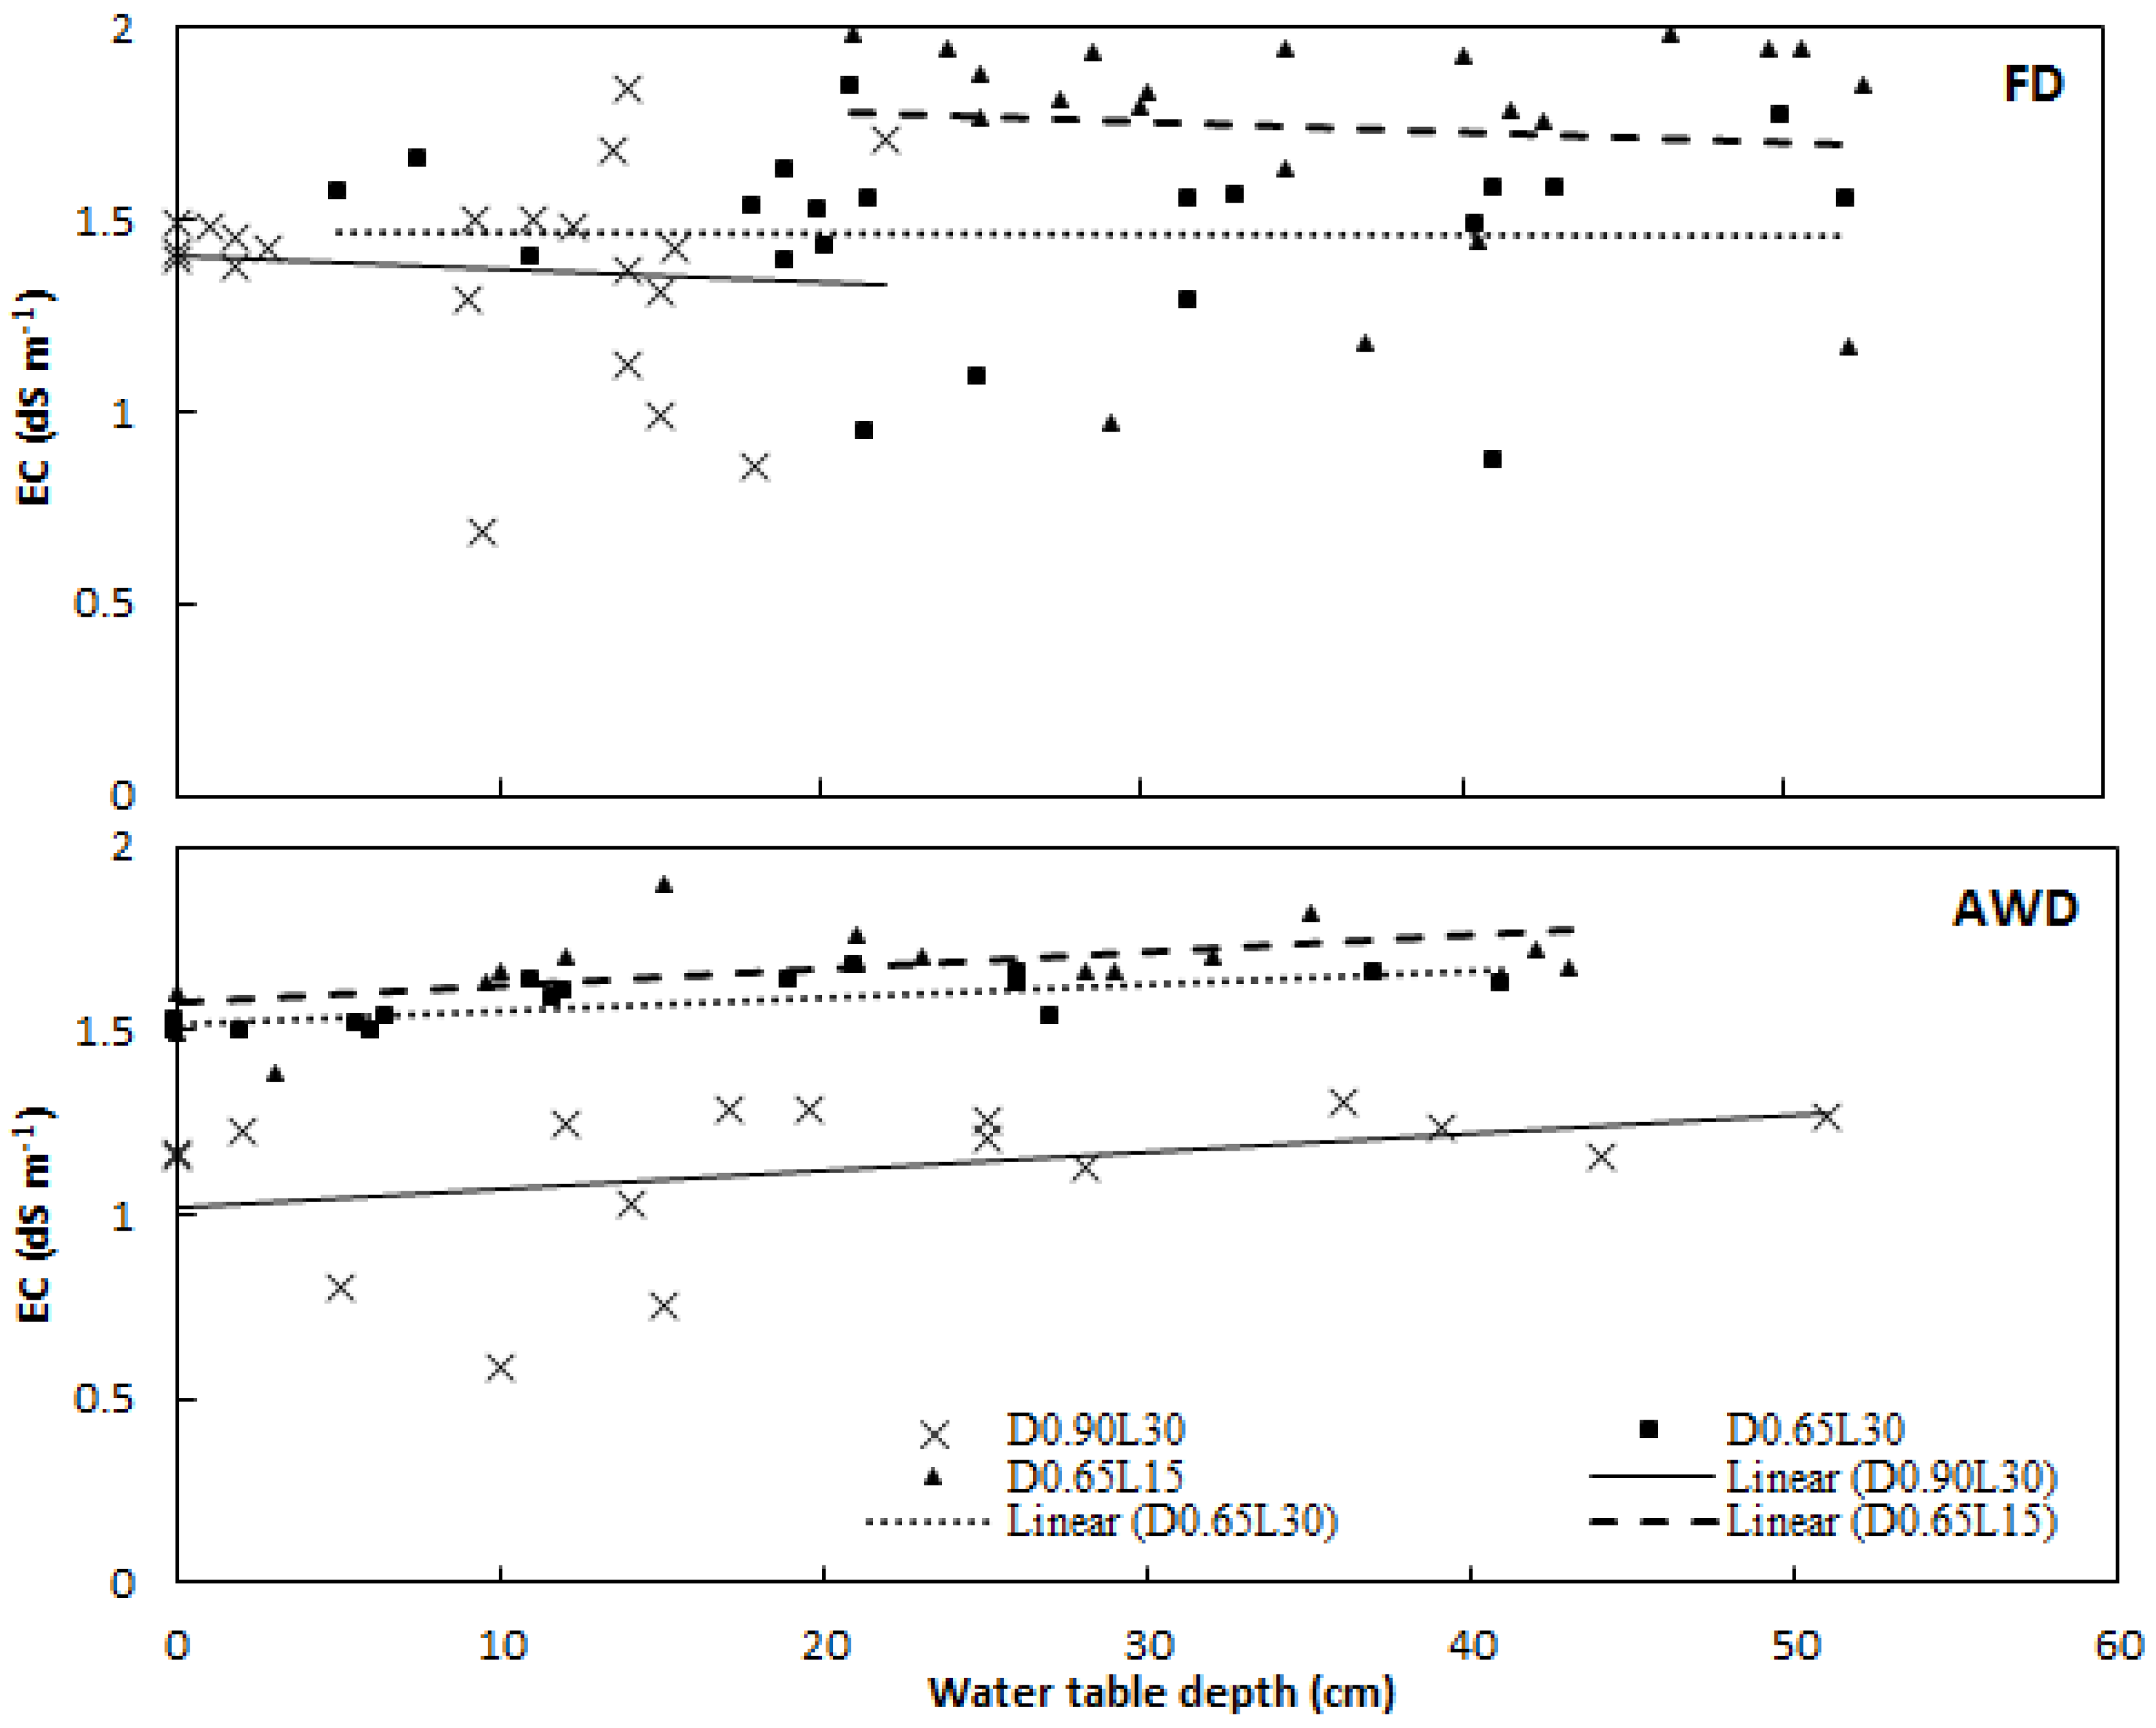
The relationship between the salinity of the drainage water and the depth of the water table for the different subsurface drainage systems was investigated by comparing the FD system in the canola seasons and the AWD in the rice-growing seasons (Figure 3). Under AWD, drainage water salinity increased with an increase in the depth of the water table, but this trend was not observed under FD in canola seasons.
The difference between the two systems is probably caused by the differences in salt input through irrigation water or rainfall and subsequent water storage in the soil profile during the irrigation periods. Evaporation was also higher in the rice growing seasons compared to the canola growing seasons (Figure 1), necessitating irrigation to satisfy the rice water requirement and leading to more salt input into the soil. As leaching is more effective under unsaturated conditions, the release rate of the stored salts during drainage periods of the rice growing seasons was affected by the water table depth. It is therefore logical that an increase in the water table depth will increase the salinity of the drainage water under AWD management. A deeper water table has been reported by others to increase drainage water salinity [27,28,29] as more of the soil profile is exposed to leaching.
During canola seasons, no irrigation was applied, and the rainfall gradually removed the salts from the soil profile. Free drainage enables the permanent and direct release of salts especially during the gradual fall of the water table. The EC–water table depth relationship observed in the canola seasons, however, indicates that a deeper water table may have no considerable effect on drainage water salinity during rainy seasons.
3.2.3. Drainage Water and Salt Loads
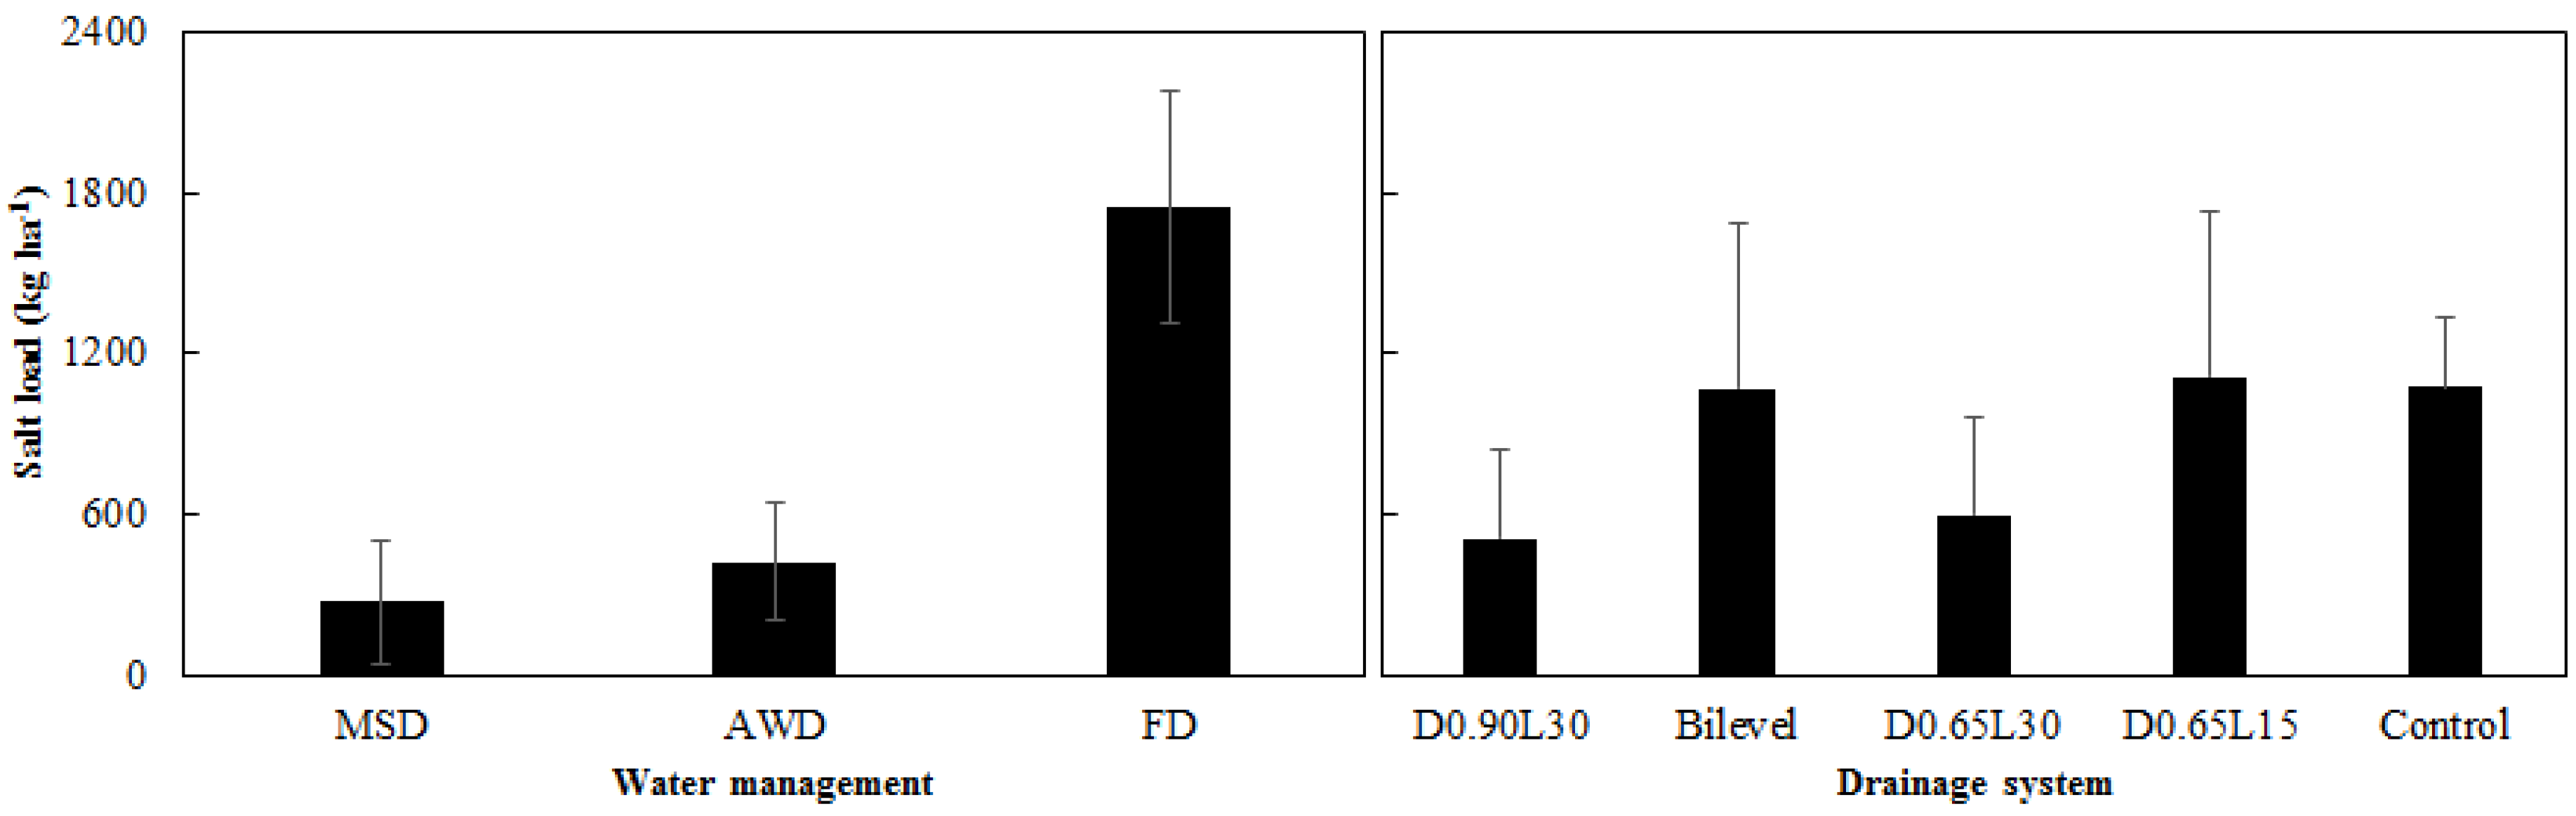
The different management strategies in the different drainage systems resulted in considerable differences in salt loads in the drainage water (Figure 4). Free drainage (FD), which was required to avoid waterlogging in the canola-growing season, resulted in significantly higher salt loads than the MSD and AWD practices during the rice growing seasons. Overall, salt loads under FD were 6.4 and 4.1 times higher than those under MSD and AWD strategies, respectively. AWD had somewhat higher salt loads than MSD, although the difference was not significant. All of these differences are primarily the result of the higher drainage rates (Table 2), as the differences in salinity concentration were not significant (Table 4). It was reported that alternate wetting and drying of especially fine textured soil, can make cracks in the soil profile [30]. Water flow to subsurface drains connects the cracks, resulting in preferential flow paths, especially under shallow subsurface drainage systems [23]. On the other hand, the cracking of heavy clay soils when drying induces preferential flow and will increase percolation losses after re-flooding [31]. This increases salt leaching below the root zone and through the drainpipes during the subsequent drainage events.
The various drainage systems responded differently to the rice–canola cropping system: significantly higher salt loads were observed with the more intensive drainage systems (D0.65L15 and bilevel) compared to less intensive systems (D0.90L30 and D0.65L30). The maximum salt load per growing season came from the D0.65L15 drainage system (1.12 ton ha−1) followed by the control (1.08 ton ha−1) and bilevel (1.07 ton ha−1). Significantly lower salt loads were observed in the D0.65L30 (0.60 ton ha−1) and D0.90L30 (0.51 ton ha−1). Lower salt loads in the D0.90L30 and D0.65L30 systems are probably due to the preferential flow effect. In low-permeable clay soils, drain flow is caused by preferential flows through soil macro pores [32]. Such flows could be more for shallow drains than deeper ones, due to better conditions for soil cracking under the influence of wetting and drying. Crack development will provide preferential flow paths, especially in soil under drainage systems with a shallow depth and narrow spacing [33]. On the other hand, longer flow paths under deeper drainage systems may allow chemical reduction of solutes [34], resulting in a lower salt load in the D0.90L30 and D0.65L30 systems than in the D0.65L15 and bilevel systems. The considerably higher salt load in the control than in the D0.90L30 and D0.65L30 systems suggests that these subsurface drainage systems are more suitable than the control, which is representative of conventional monoculture in the study area (rice during spring and summer seasons, and fallow during autumn and winter seasons). Moreover, such drainage systems provide an appropriate condition for winter cropping as an additional merit that boosts the overall productivity of the poorly drained paddy fields.
3.3. Nitrate Losses through the Drainage Systems
3.3.1. Nitrate Concentration in the Drainage Water
Integrated irrigation and drainage strategies for water management had significant effects on the contents of nitrate in the drainage effluent (Table 6), although different seasons resulted in varying patterns of nitrate concentration in the drainage effluents. The highest seasonal average nitrate concentrations occurred under FD in the 2016–2017 canola season, six years after the introduction of the subsurface drainage systems, with the D.90L30 drainage system having significantly higher concentrations than the other systems. These high concentrations can be explained by improved soil structure [35] and the formation of stable flow paths to the subsurface drains. During the 2011, 2012, and 2014 rice seasons, maximum nitrate concentration was observed in the shallow drains, while in the 2015 rice season and canola growing seasons, the maxima were found in the deeper drains. Longer drainage periods in canola seasons may cause extended preferential flow paths to the lower soil profile, resulting in higher nitrate concentrations in the deeper drains.
In addition to the depth and spacing of a drainage system, irrigation, and drainage management practices, hydrological conditions, amounts and types of applied fertilizers, crop characteristics, soil properties, and agricultural operations are major factors affecting nitrate losses through drainage systems. Drainage of paddy soil produces an oxidative environment in the soil layer that will enhance the nitrification of ammonium in the plough-layer soil [36]. Under such circumstances, nitrogen uptake by the rice plants will increase [10,37], resulting in less nitrate leaching.
Except for the 2012 rice season, there were hardly any differences in the nitrate concentrations in the drainage effluents under the MSD and AWD strategies. At the beginning of the 2012 rice-growing season, canola residues were returned to the soil through soil preparation practices, which may be a possible reason for increased nitrate concentration in the drainage effluents in this season. These residues were not returned to the soil at the beginning of the rest of the rice and canola growing seasons. Returning plant residue to the soil is reported as an effective method for increasing nutrient availabilities [38].
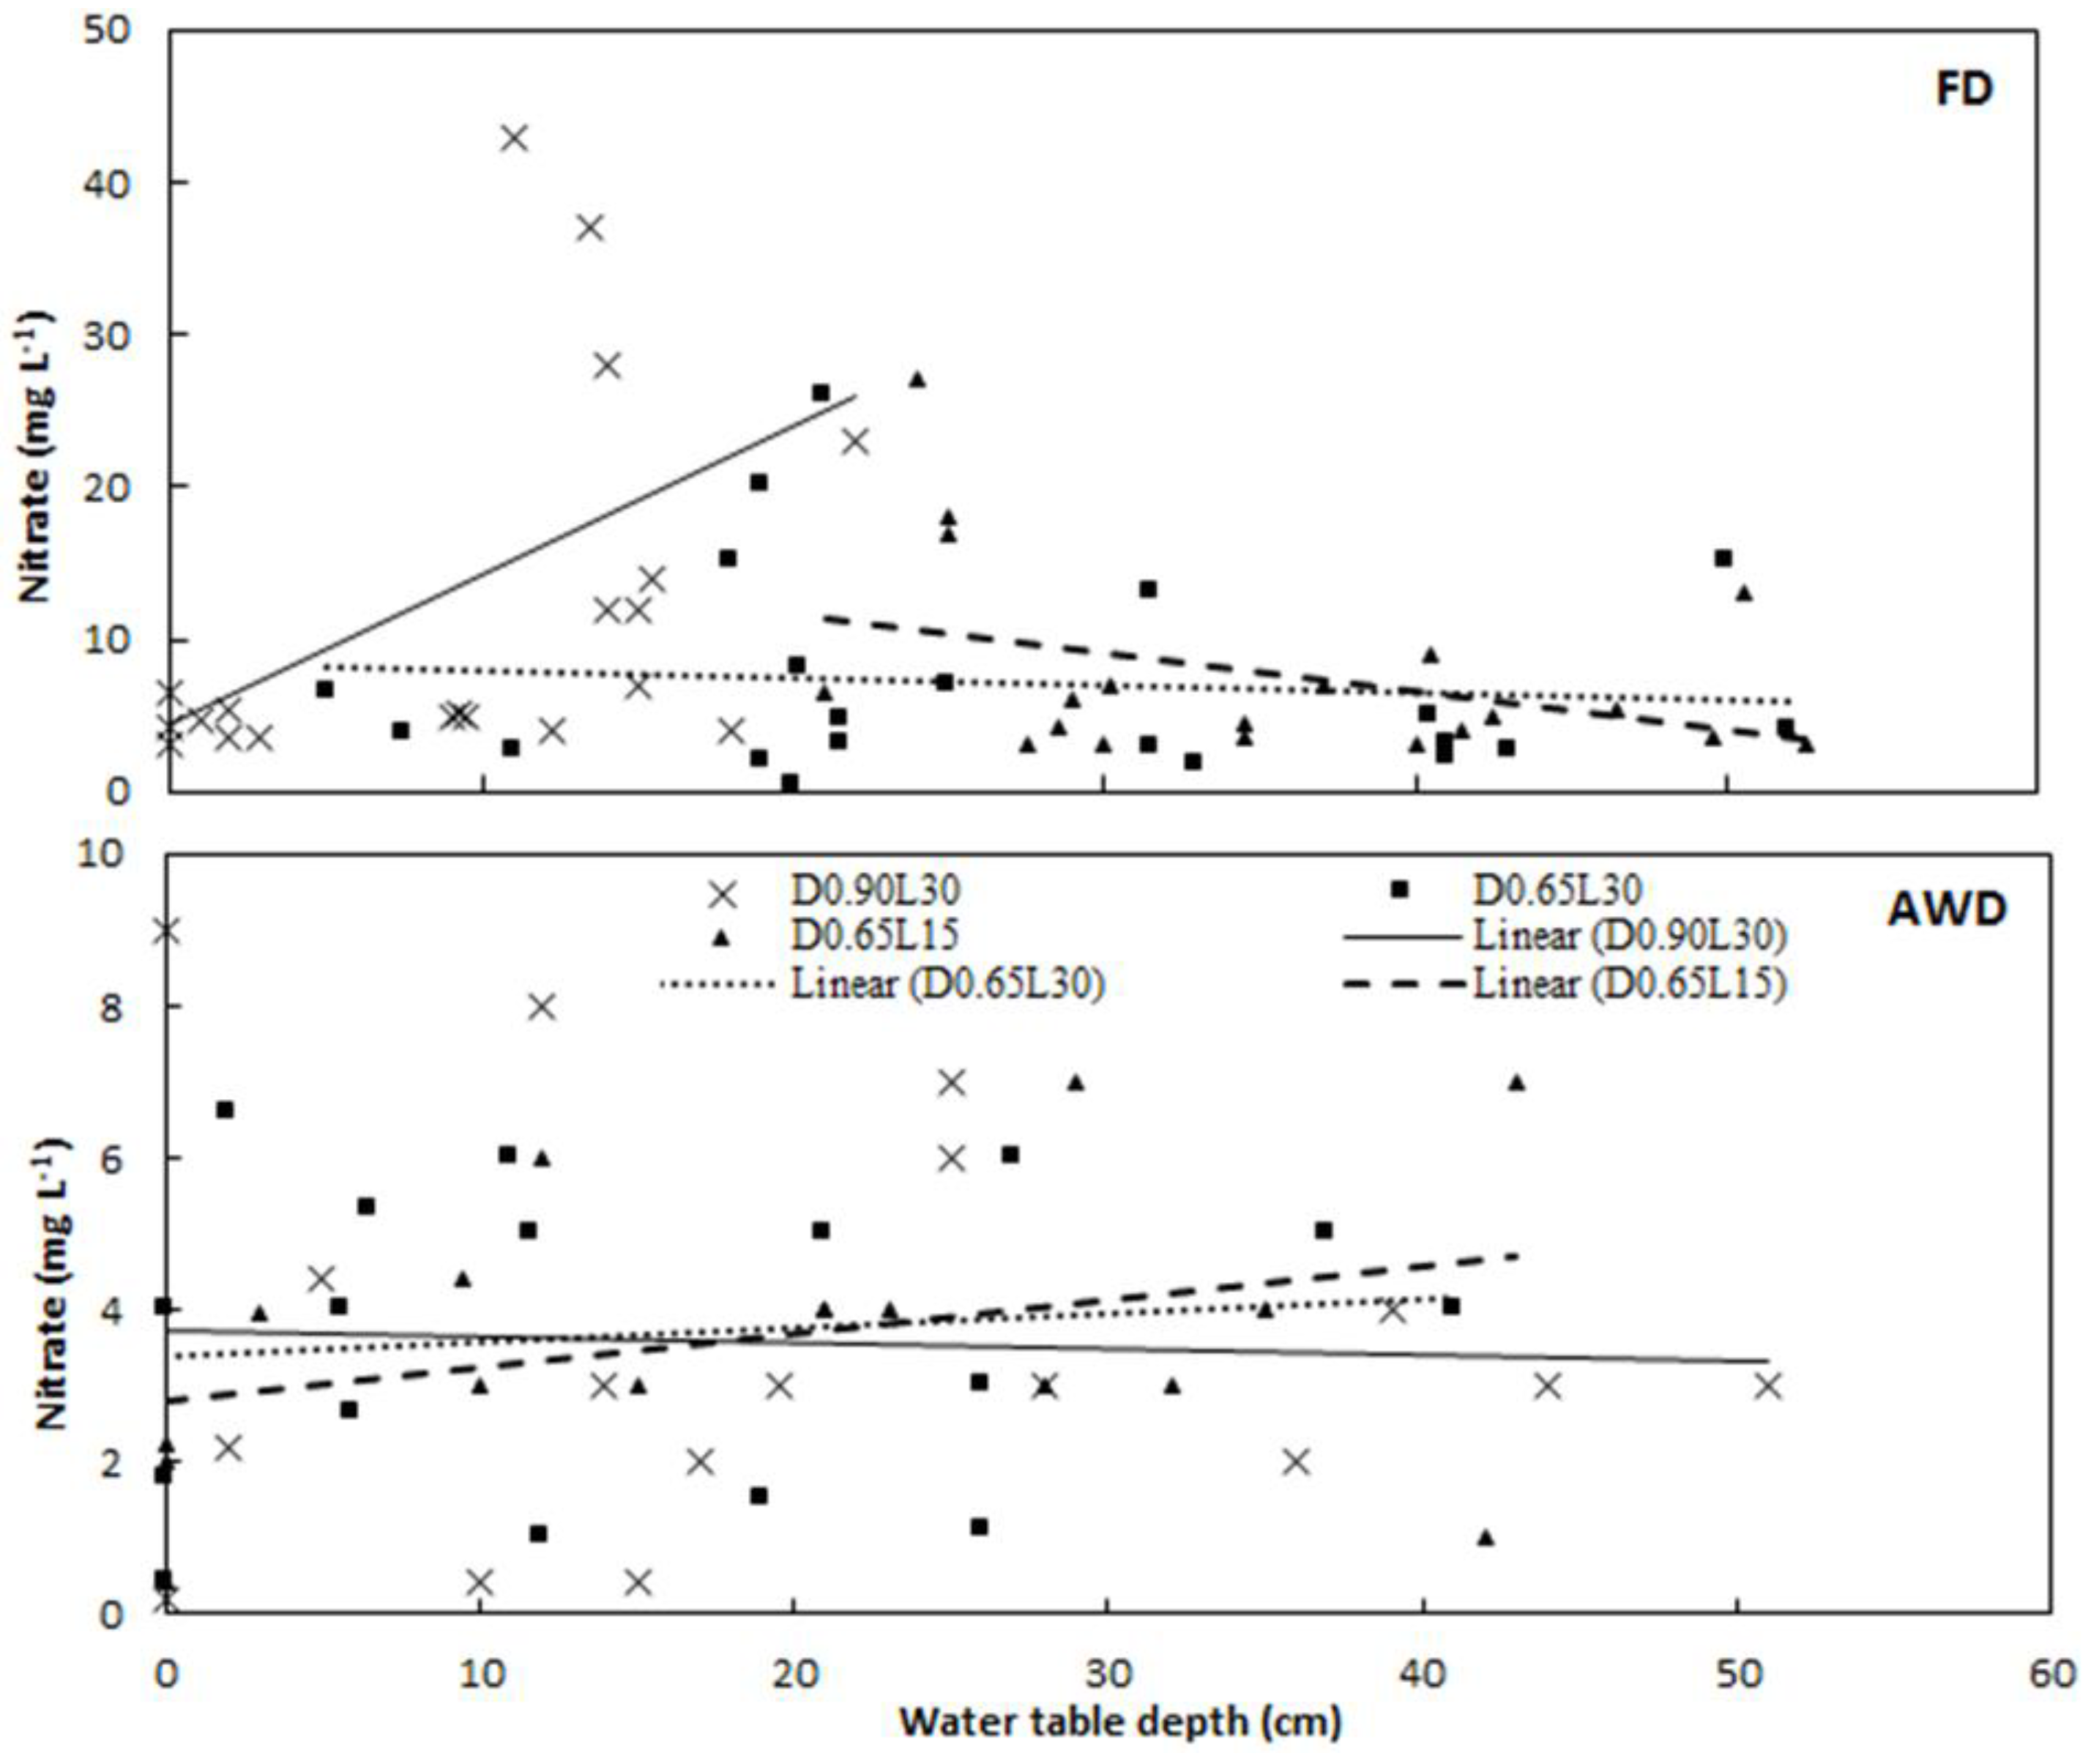
3.3.2. Nitrate Concentration in the Drainage Water and the Depth of the Water Table
In the 2016–2017 canola growing season, the seasonal average water table depths in the D0.90L30, bilevel, D0.65L30, and D0.65L15 drainage systems were 30, 63, 58, and 61 cm, respectively compared to 21, 24, 24, and 32 cm in the 2011–2012 canola-growing season. Deeper water tables provide thicker aerobic layers, resulting in more nitrification. Moreover, differences in climate conditions (precipitation and evaporation) may have influenced the nitrate concentration in drainage water [39]. Based on the seasonal averaged data, an increase in drain depth caused an increase in nitrate concentration in the drainage water; the minimum and maximum were found in the D0.65L30 and D0.90L30 systems, respectively. However, his hypothetical trend, which has also been reported in other studies, such as [40], was not found for the other growing seasons.
Water table fluctuations influence nitrate concentration in drainage water through nitrogen transformation in the soil profile. Controlled drainage, i.e., MSD or AWD, is a management strategy to increase nitrogen uptake by plants reducing the available nitrogen for leaching [10]. In this study, the water table fluctuations had different effects on drainage water nitrate in the rice- and canola-growing seasons under AWD and FD management, respectively. Nitrate concentration variation under FD was far greater and higher than under AWD (Figure 5). For shallow drains, the increase in the water table depth resulted in an increasing trend in nitrate concentration under AWD, while the reverse occurred under FD. Short periods of drainage under AWD have been reported to create oxidative conditions in the shallow drained area [41]. The decreasing trend in the nitrate-water table depth relationship in the D0.65L30 and D0.65L15 systems during the canola seasons (under FD) could be due to the frequent fluctuations of the water table and consequently, less available nitrogen was transformed to nitrate and leached out of the soil profile. Under FD, in the D0.90L30 drainage system, in spite of a shallow water table depth at sampling times (<20 cm), the increase in the depth of the water table clearly caused an increase in the nitrate concentration in the drainage water.
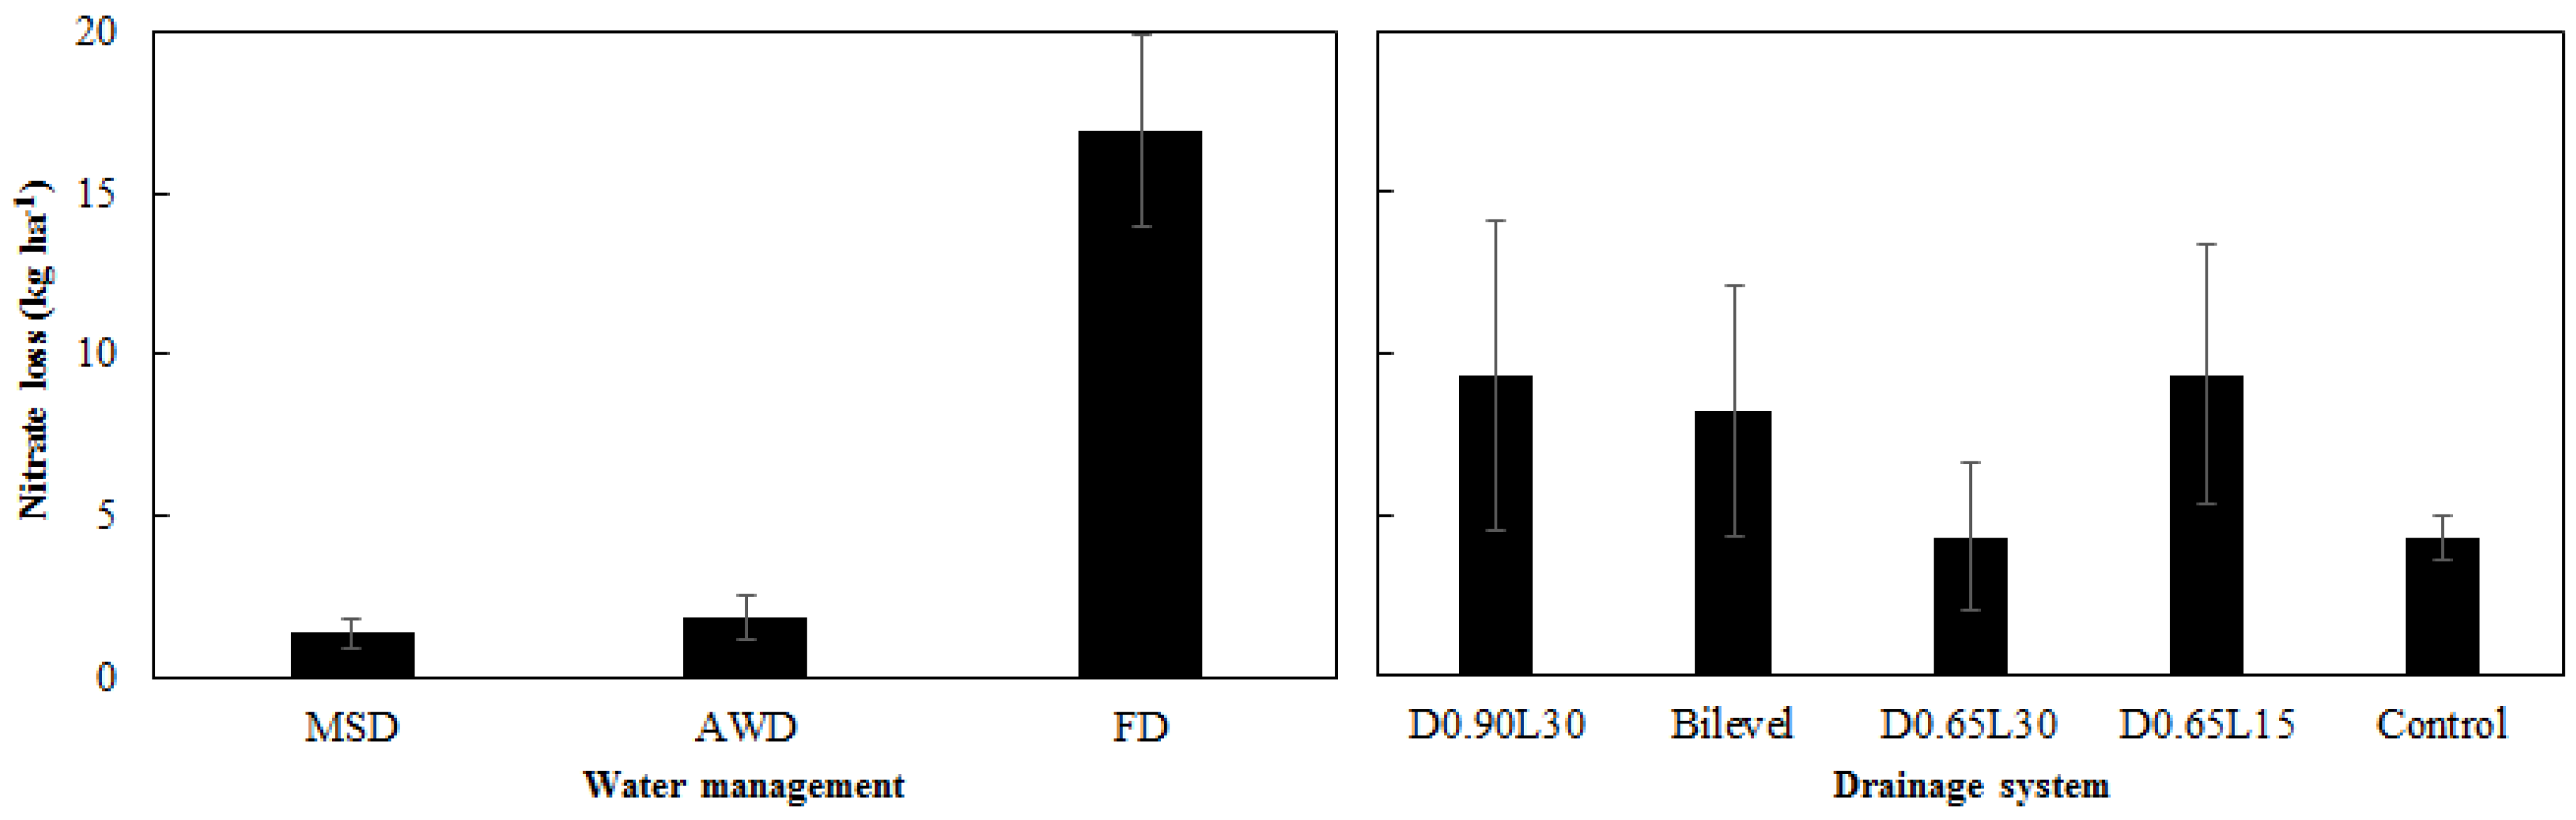
3.3.3. Nitrate Losses through the Drainage Systems
Subsurface drainage systems may cause losses in various forms of nitrogen through the drainage effluent [42]. Under FD, nitrate losses were significantly higher than those under MSD and AWD. There was no significant difference between the losses under MSD and AWD (Figure 6, left). It has been reported that the time between fertilization and the beginning of drainage as well as the period of drainage both influence nitrogen uptake by rice plants [23]. Moreover, transformation of nitrate to other compounds of nitrogen likely resulted in less nitrate being available for losses through the drainage systems. In canola cropping, nitrate losses in 2016–2017 were considerably higher than in 2011–2012. Part of these increased losses may be related to the improved soil structure and formation of flow paths in the soil profile, which occurred after the installation of the subsurface drainage systems [35]. As mentioned earlier, nitrate concentration in the drainage effluents were much higher in the 2016–2017 canola season than in 2011–2012 season (Table 6). The nitrate losses varied between 4.32 kg ha−1 for D0.65L30 and 9.35 kg ha−1 for D0.65L15 (Figure 6, right). Total nitrate losses through D0.65L30 were comparable with the control treatment, indicating that suitable subsurface drainage may have fewer environmental effects from a nitrate loss viewpoint than the conventional free drainage practices used in the study area. The installation of subsurface drainage systems provided suitable conditions for soil nitrogen uptake by plants during the canola-cropping season.
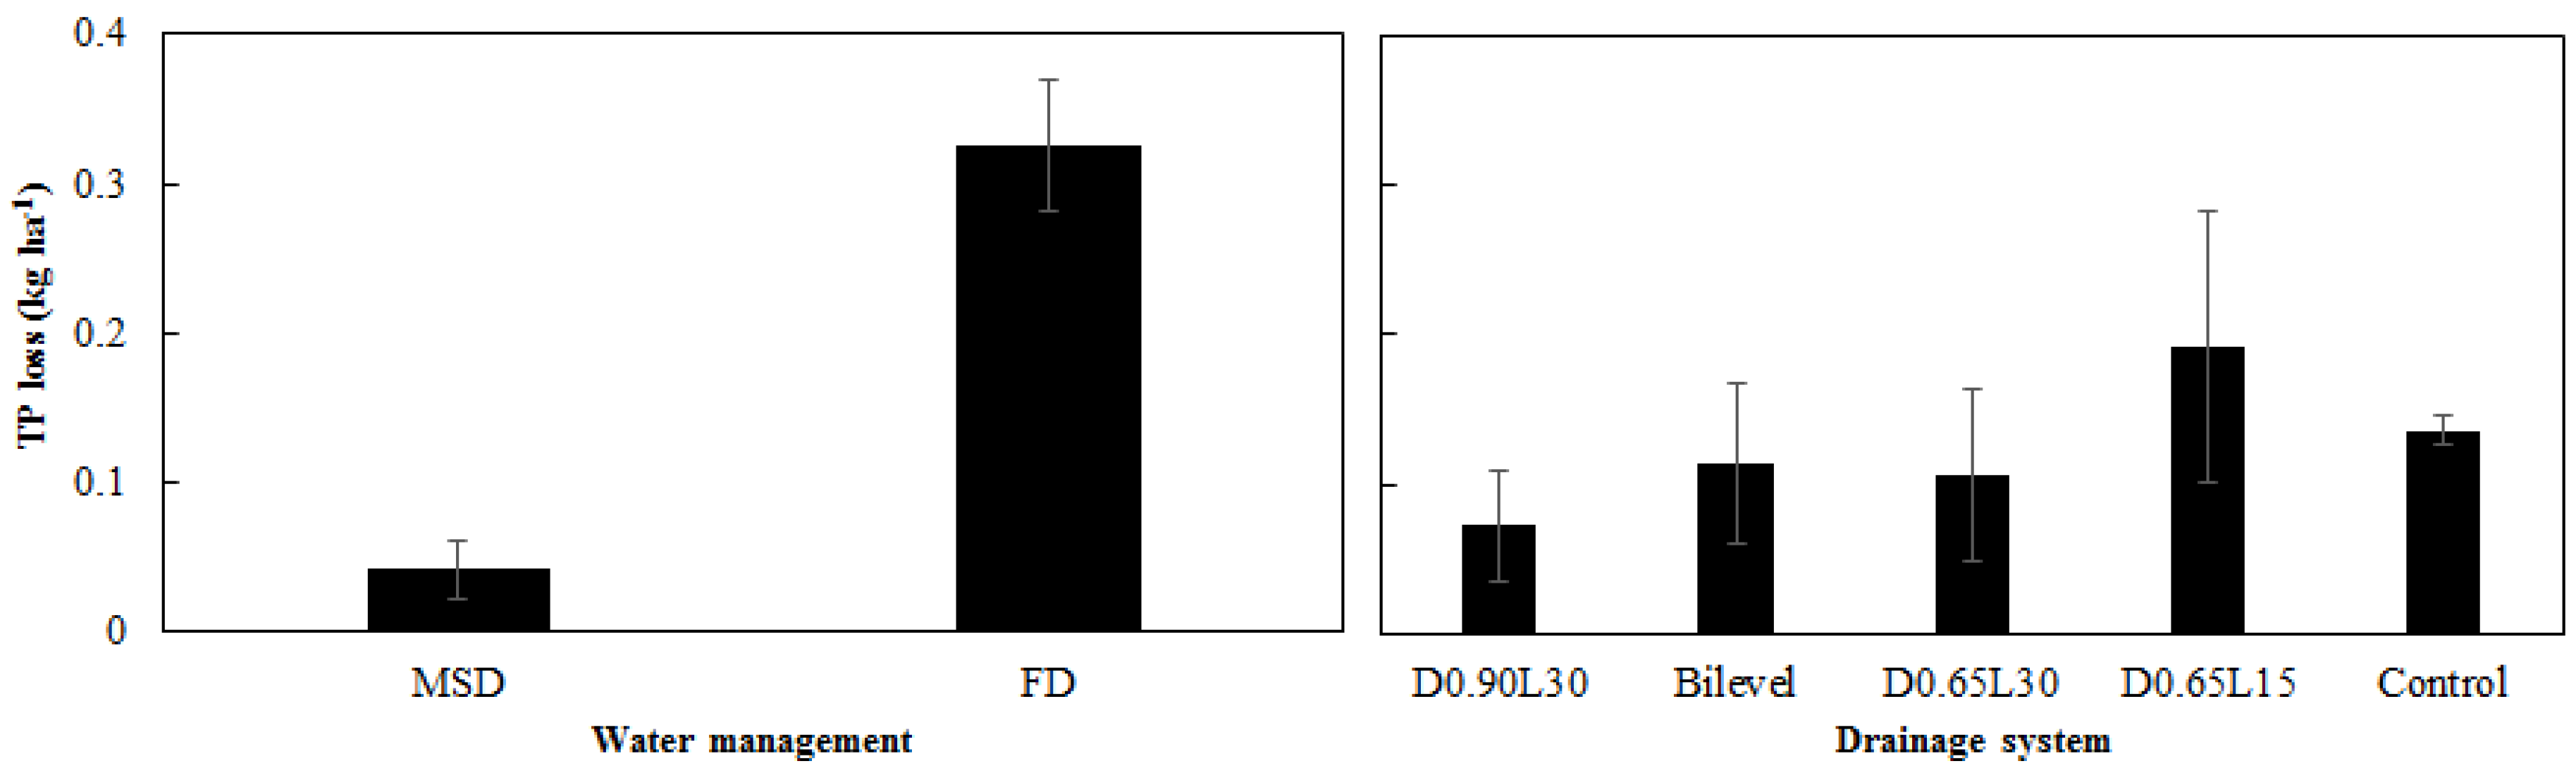
3.4. Phosphorous Losses through the Drainage Systems
Total phosphorus (TP) losses were monitored during the first three growing seasons after the installation of the drainage systems, namely rice under MSD in 2011, canola under FD in 2011–2012 and rice again under MSD in 2012. TP losses under FD were significantly higher than under MSD (Figure 7, left). Among the five drainage systems, D0.65L15 had the highest TP losses, although differences between the five systems were not significant, except for D0.90.L30 (the system with the lowest drainage intensity) (Figure 7, right). This indicates that shallower drains at narrower spacing (thus a higher drainage intensity) increase the likelihood of phosphorus losses compared to deeper drains with wider spacing (a lower drainage intensity). This observation is in agreement with the results of Poole [43], who demonstrated more P losses under shallow drainage systems than deeper ones. Narrow drain spacing or shallower drain depth decreases the lateral flow path to the drains and increases the preferential flow to the drains: both effects increase TP losses through subsurface drainage. Significant losses of P through subsurface drained fields have also been reported in other studies [44,45,46].
3.5. Crop Yields
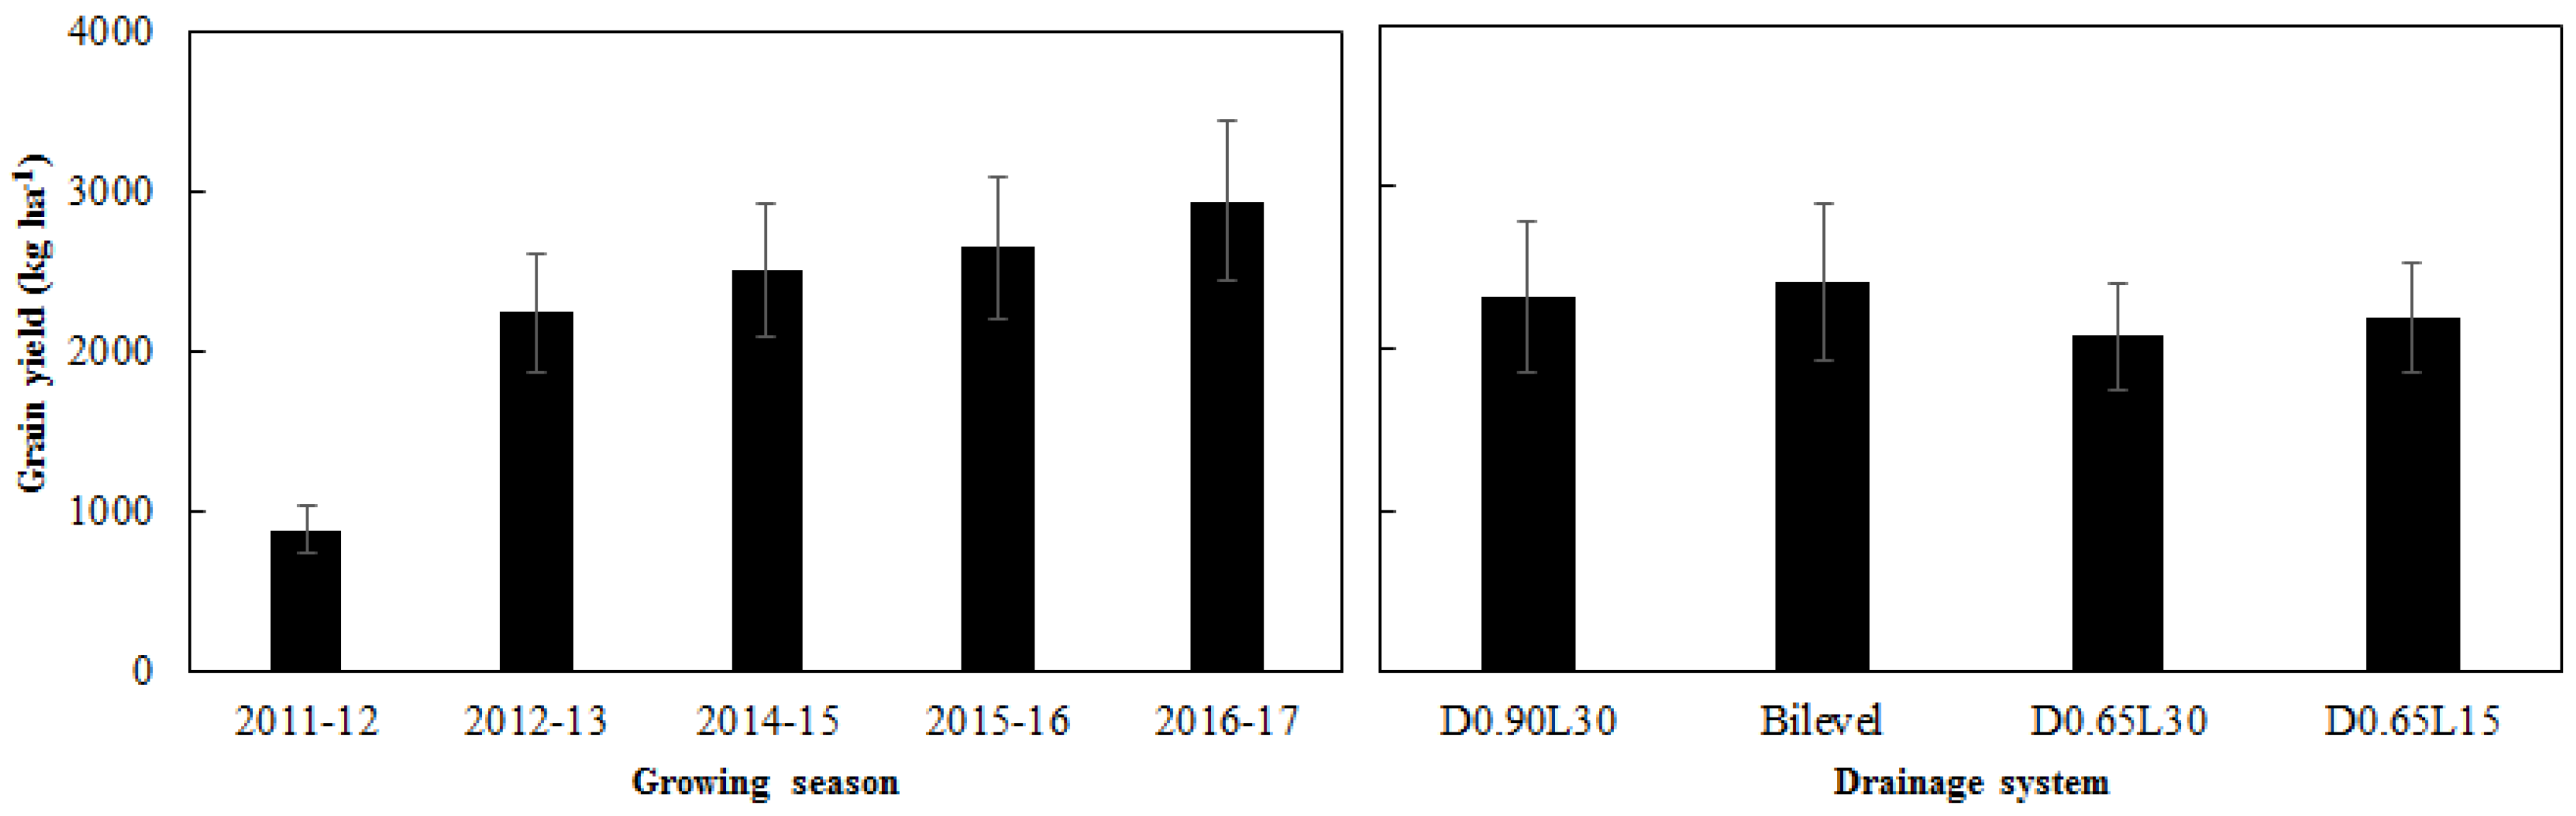
Canola yield increased from 0.89 ton ha−1 in 2011–2012 to 2.94 ton ha−1 in 2016–2017 (Figure 8, left). The increase was significant in the first three years after the installation of the subsurface drainage systems, but not significant in the following years. Based on the five-year data, the maximum canola yield was observed with the bilevel drainage system (Figure 8, right). The difference, however, was only significant between the bilevel and D0.65L30. The steady increase in canola yield clearly shows that the installation of subsurface drainage can have a very quick payback time. This observation is in agreement with many other studies [47,48,49,50], which showed that subsurface drainage could be an economic activity to improve crop production.
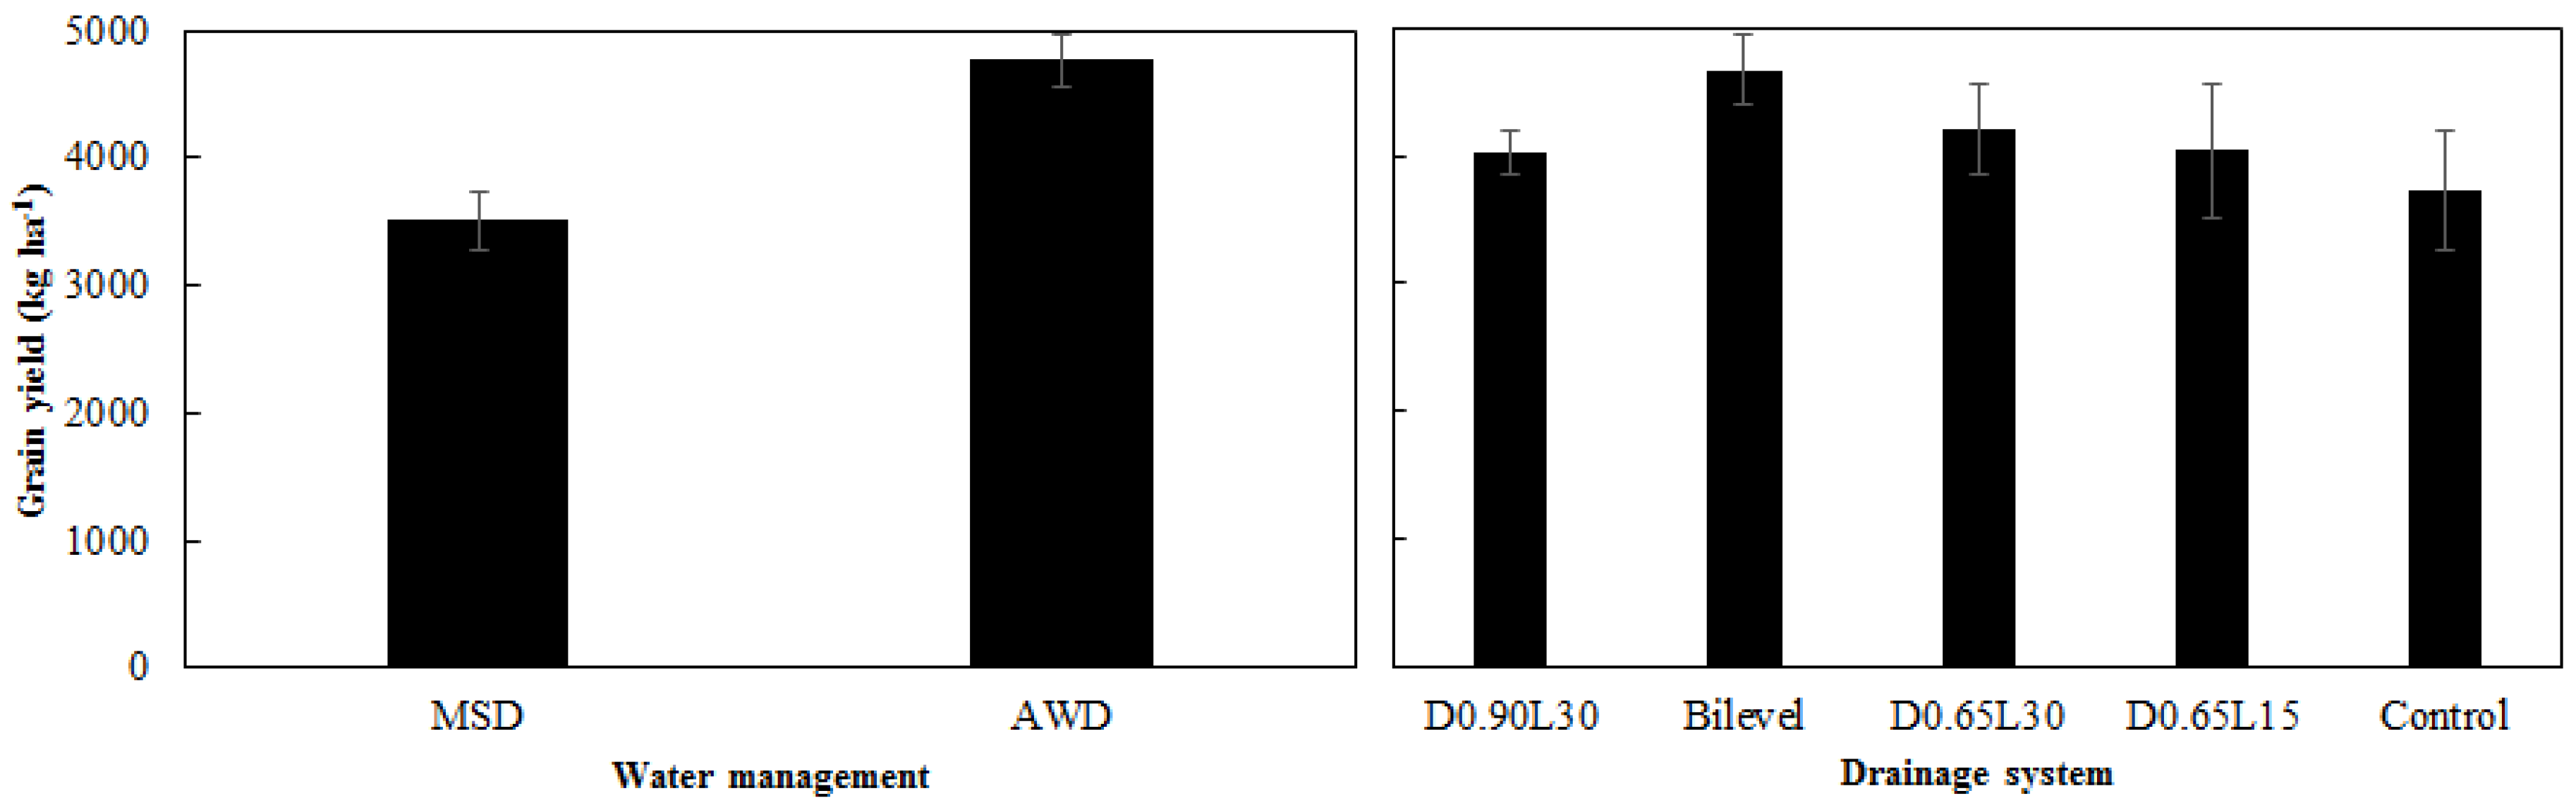
Rice yield responded well to the different types of irrigation and drainage management strategies. Rice yields in the fields under AWD in 2014 and 2015 were significantly higher than those in the MSD fields in 2011 and 2012, suggesting that AWD is a more suitable strategy than MSD in this region (Figure 9, left). Kudo et al. [50] reported that a similar strategy with alternate wetting and drying—namely a combination of flooding, MSD, and intermittent drainage—improved rice yield compared to only flooding or MSD. Moreover, integrated analysis of rice yields under these two water management strategies indicated that subsurface drainage systems resulted in increased rice yield compared with conventional farming in the region [14].
The maximum increase in rice yield was observed under the bilevel drainage design, followed by D0.65L30, D0.65L15, and D0.90L30. Various factors, such as agricultural inputs and practices, soil characteristics, and hydrological conditions influence crop yield [10]. Although conditions differed somewhat among growing seasons, these factors were considered similar during each season, with the only major difference being the type of the drainage system. Our results strongly indicate that subsurface drainage is beneficial to the rice yield compared to traditional drainage.
The yield data clearly shows that subsurface drainage has improved the productivity of the paddy fields through providing year-round crop production conditions, increasing rice yield as a major crop in the area, and increasing canola yield as well. Subsurface drainage has been reported to increase crop yield in some studies [48,49,51,52,53], through improving root zone environment from both viewpoints of supplying oxygen to soil and removing toxic substances, resulting in better conditions for root development than undrained conditions.
4. Summary and Conclusions
From 2011 to 2017, a field study was conducted in the pilot area of SANRU in Sari, Mazandaran Province, northern Iran, to test several integrated irrigation and drainage management strategies under different drainage systems, in order to improve the annual rotational cropping systems of rice and canola in paddy fields. Three methods or strategies to manage the subsurface drainage system were tested: free drainage (FD) in the winter season, when canola is cultivated; midseason drainage (MSD); and alternate wetting and drying (AWD) in the summer, during the rice growing season. The pilot consisted of subsurface drainage systems with four different combinations of drain depth (0.65 and 0.90 m) and spacing (15 and 30 m). The traditional surface drainage of the region’s consolidated paddy fields was used as the control.
Water table depth, outflow of the subsurface drainage system, nitrate, total phosphorous and salinity levels of the drainage effluent, and crop yield were monitored during four rice- and five canola-growing seasons. The lowest drainage rates, salinity, and N-loads were found under MSD, followed by AWD and FD, which had by far the largest outflows. For rice production, AWD appears to be more suitable than MSD, as AWD resulted in 36% higher rice yields. Subsurface drainage with FD resulted in a steady increase in the canola yield, from 0.89 ton ha−1 in 2011–2012 to 2.94 ton ha−1 in 2016–2017. The steady increase in canola yield clearly shows that the installation of subsurface drainage can have a very quick payback time.
Irrigation efficiencies for all treatments were rather low, mainly because of the high deep percolation losses. Subsequently, the leaching fractions were high, with, as a positive effect, soil salinity levels at well below the threshold values for yield reduction for both rice and canola. The salinity of the drainage water was high in the first growing season after the installation of the drainage system, but quickly decreased to safe levels and stabilized between 1.3 and 1.8 dS/m after the second year. No significant difference was found in the drainage effluent salinity between the three management treatments; average salinity varied between 1.4 and 1.5 dS/m.
Because of the higher drainage outflows, the total salt load during the growing seasons under FD was 6.4 and 4.2 times higher than those under MSD and AWD. For the drainage systems, a clear relationship was found between the drainage intensity and the salt load: the systems with the lowest intensity, i.e., D0.90L30 and D0.65L30, had significantly lower levels compared to the systems with a higher intensity (bilevel and D0.65L15), implying more intensive drainage and adequate leaching of salts results in healthier soil in the study field. Nitrate losses for the FD treatment were significantly higher compared to AWD and MSD, with no significant differences between the last two treatments. Not surprisingly, the drainage systems with the highest intensity (D0.65L15) had the highest total phosphorous losses, but the differences were low and generally not statistically significant.
Overall, it can be concluded that managed subsurface drainage can increase both water productivity and crop yield in poorly drained paddy fields, and at the same time reduce or minimize negative environmental effects, especially the reduction of salt and nutrient loads in the drainage effluent compared with conventional drainage in the study area.
Author Contributions
A.D.-N. assisted in the design and implementation of the experimental site, as well as collecting the data, writing, and revising the paper. H.R. assisted with the data analysis and revised the paper.
Acknowledgments
The authors would like to thank the Sari Agricultural Sciences and Natural Resources University for financing the project.
Conflicts of Interest
The authors declare no conflicts of interest.
References
- FAO. FAO Statistical Year Book; Food and Agriculture Organization of the United Nations: Rome, Italy, 2012; p. 352. [Google Scholar]
- Ausubel, J.H.; Wernick, I.K.; Waggoner, P.E. Peak Farmland and the Prospect for Land Sparing. Popul. Dev. Rev. 2013, 38, 221–242. [Google Scholar] [CrossRef]
- Meinzen-Dick, R.; Jackson, L.A. Multiple uses, multiple users of water resources. In Proceedings of the Voices from the Commons, the Sixth Biennial Conference of the International Association for the Study of Common Property, Berkeley, CA, USA, 5–8 June 1996; p. 32. [Google Scholar]
- Lampayana, R.M.; Rejesus, R.M.; Singleton, G.R.; Bouman, B.A.M. Adoption and economics of alternate wetting and drying water management for irrigated lowland rice. Field Crop Res. 2015, 170, 95–108. [Google Scholar] [CrossRef]
- Van der Hoek, W.; Sakthivadivel, R.; Renshaw, M.; Silver, J.B.; Birley, M.H.; Konradsen, F. Alternate wet/dry irrigation in rice cultivation: A practical way to save water and control malaria and Japanese encephalitis. In Research Report 47; International Water Management Institute: Colombo, Sri Lanka, 2001; p. 30. [Google Scholar]
- Peyron, M.; Bertora, C.; Pelissetti, S.; Said-Pullicino, D.; Celi, L.; Miniotti, E.; Romani, M.; Sacco, D. Greenhouse gas emissions as affected by different water management practices in temperate rice paddies. Agric. Ecosyst. Environ. 2016, 232, 17–28. [Google Scholar] [CrossRef]
- Itoh, M.; Sudo, S.; Mori, S.; Saito, H.; Yoshida, T.; Shiratori, Y.; Suga, S.; Yoshikawa, N.; Suzue, Y.; Mizukami, H.; et al. Mitigation of methane emissions from paddy fields by prolonging midseason Drainage. Agric. Ecosyst. Environ. 2011, 141, 359–372. [Google Scholar] [CrossRef]
- Kumar, A.; Nayak, A.K.; Mohanty, S.; Das, B.S. Greenhouse gas emission from direct seeded paddy fields under different soil water potentials in Eastern India. Agric. Ecosyst. Environ. 2016, 228, 111–123. [Google Scholar] [CrossRef]
- Zhi, M. Water Efficient Irrigation and Environmentally Sustainable Irrigated Rice Production in China. International Commission on Irrigation and Drainage. Available online: http://www.icid.org/wat_mao.pdf (accessed on 25 December 2017).
- Darzi-Naftchali, A.; Shahnazari, A. Influence of subsurface drainage on the productivity of poorly drained paddy fields. Eur. J. Agron. 2014, 56, 1–8. [Google Scholar] [CrossRef]
- FAO. FAO Statistical Year Book; Food and Agriculture Organization of the United Nations: Rome, Italy, 2014. [Google Scholar]
- Asgari, A.; Tavassoli, M.R.; Ejlali, F.; Sahebi, F.G.; Kafshdozan, F. Effect of land consolidation of paddy rice to improve agriculture water management. Int. J. Agric. Res. Rev. 2012, 2, 955–958. [Google Scholar]
- Chu, G.; Chen, T.; Wang, Z.; Yang, J.; Zhang, J. Morphological and physiological traits of roots and their relationships with water productivity in water-saving and drought-resistant rice. Field Crop Res. 2014, 162, 108–119. [Google Scholar] [CrossRef]
- Darzi-Naftchali, A.; Ritzema, H.; Karandish, F.; Mokhtassi-Bidgoli, A.; Ghasemi-Nasr, M. Alternate wetting and drying for different subsurface drainages systems to improve paddy yield and water productivity in Iran. Agric. Water Manag. 2017, 193, 221–231. [Google Scholar] [CrossRef]
- Meijide, A.; Gruening, C.; Goded, I.; Seufert, G.; Cescatti, A. Water management reduces greenhouse gas emissions in a Mediterranean rice paddy field. Agric. Ecosyst. Environ. 2017, 238, 168–178. [Google Scholar] [CrossRef]
- Ye, Y.; Liang, X.; Chen, Y.; Liu, J.; Gu, J.; Guo, R.; Li, L. Alternate wetting and drying irrigation and controlled—Release nitrogen fertilizer in late-season rice. Effect on dry matter accumulation, yield, water and nitrogen use. Field Crop Res. 2013, 144, 212–224. [Google Scholar] [CrossRef]
- Kim, Y.; Talucderf, M.S.A.; Kang, M.; Shim, K.M.; Kang, N.; Kim, J. Interannual variations in methane emission from an irrigated rice paddy caused by rainfalls during the aeration period. Agric. Ecosyst. Environ. 2016, 223, 67–75. [Google Scholar] [CrossRef]
- Pandey, A.; Mai, V.T.; Vu, D.Q.; Bui, T.P.L.; Mai, T.L.A.; Jensen, L.S.; de Neergaard, A. Organic matter and water management strategies to reduce methane and nitrous oxide emissions from rice paddies in Vietnam. Agric. Ecosyst. Environ. 2014, 196, 137–146. [Google Scholar] [CrossRef]
- Skaggs, R.W.; Fausey, N.R.; Evans, R.O. Drainage water management. J. Soil Water Conserv. 2012, 67, 167A–172A. [Google Scholar] [CrossRef]
- Darzi-Naftchali, A.; Mirlatifi, S.M.; Shahnazari, A.; Ejlali, F.; Mahdian, M.H. Effect of subsurface drainage on water balance and water table in poorly drained paddy fields. Agric. Water Manag. 2013, 130, 61–68. [Google Scholar] [CrossRef]
- Murphy, J.; Riley, J.P. A modified single solution method for the determination of phosphate in natural waters. Anal. Chim. Acta 1962, 27, 31–36. [Google Scholar] [CrossRef]
- SAS Institute. Version 9.1.3; SAS Institute: Cary, NC, USA, 2004. [Google Scholar]
- Darzi-Naftchali, A.; Shahnazari, A.; Karandish, F. Nitrogen loss and its health risk in paddy fields under different drainage managements. Paddy Water Environ. 2017, 15, 145–157. [Google Scholar] [CrossRef]
- Perry, C.J. Quantification and Measurement of a Minimum Set of Indicators of the Performance of Irrigation Systems; International Irrigation Management Institute: Colombo, Sri Lanka, 1996. [Google Scholar]
- Letey, J.; Hoffman, G.J.; Hopmans, J.W.; Grattan, S.R.; Suarez, D.L.; Corwin, D.L.; Oster, J.D.; Wu, L.; Amrhein, C. Evaluation of soil salinity leaching requirement guidelines. Agric. Water Manag. 2011, 98, 502–506. [Google Scholar] [CrossRef]
- Van Hoorn, J.W.; Van Alphen, J.G. Salinity control. In Drainage Principles and Applications, 3rd ed.; Ritzema, H.P., Ed.; ILRI Publication 16: Wageningen, The Netherlands, 2006; pp. 553–600. [Google Scholar]
- Christen, E.W.; Skehan, D. Design and management of subsurface drainage for improved water quality: A field trial. In CSIRO Land and Water Technical Report 6/99; CSIRO Land and Water: Griffith, Australia, 1999. [Google Scholar]
- Ayars, J.E.; Christen, E.W.; Hornbuckle, J.W. Controlled drainage for improved water management in arid regions irrigated agriculture. Agric. Water Manag. 2006, 86, 128–139. [Google Scholar] [CrossRef]
- Noory, H.; Liaghat, A. Water table management to improve drainage water quality in semiarid climatic conditions of Iran. J. Irrig. Drain. Eng. 2009, 135, 665–670. [Google Scholar] [CrossRef]
- McLeod, M.; Aislabie, J.; Ryburn, J.; McGill, A. Regionalizing potential for microbial bypass flow through New Zealand soils. J. Environ. Qual. 2008, 37, 1959–1967. [Google Scholar] [CrossRef] [PubMed]
- Adhya, T.K.; Linquist, B.; Searchinger, T.; Wassmann, R.; Yan, X. Wetting and Drying: Reducing Greenhouse Gas Emissions and Saving Water from Rice Production. In Working Paper, Installment 8 of Creating a Sustainable Food Future; World Resources Institute: Washington, DC, USA, 2014; Available online: http://www.worldresourcesreport.org (accessed on 25 December 2017).
- Rathore, H.S.; Nollet, L.M.L. Pesticides-Evaluation of Environmental Pollution; International Standard Book Number-13:978.1.4398.3625.5; CRC Press: Boca Raton, FL, USA, 2012. [Google Scholar]
- Magid, J.; Jensen, M.B.; Mueller, T.; Hansen, H.C.B. Phosphate leaching responses from unperturbed, anaerobic, or cattle mesotrophic sandy loam soils. J. Environ. Qual. 1999, 28, 1796–1803. [Google Scholar] [CrossRef]
- Koch, J.C.; Kikuchi, C.P.; Wickland, K.P.; Schuster, P. Runoff sources and flow paths in a partially burned, upland boreal catchment underlain by permafrost. Water Resour. Res. 2014, 50, 8141–8158. [Google Scholar] [CrossRef]
- Jafari-Talukolaee, M.; Darzi Naftchali, A.; Zare-Parvariji, L.; Ahmadi, M.Z. Investigating long-term effects of subsurface drainage on soil structure in paddy fields. Soil Tillage Res. 2018, 177, 155–160. [Google Scholar] [CrossRef]
- Toriyama, K.; Ando, H. Towards an understanding of the high productivity of rice with System of Rice Intensification (SRI) management from the perspectives of soil and plant physiological processes. Soil Sci. Plant Nutr. 2011, 57, 636–649. [Google Scholar] [CrossRef]
- Rahman, S.M.; Kakuda, K.I.; SaSaki, Y.; Ando, H. Effect of mid-drainage on root physiological activities, N uptake and yield of rice in North East Japan. Bull. Yamagata Univ. Agric. Sci. 2013, 16, 197–206. [Google Scholar]
- Chen, B.; Liu, E.; Tian, Q.; Yan, C.; Zhang, Y. Soil nitrogen dynamics and crop residues. A review. Agron. Sustain. Dev. 2014, 34, 429–442. [Google Scholar] [CrossRef]
- Ernstsen, V.; Olsen, P.; Rosenbom, A.E. Long-term monitoring of nitrate transport to drainage from three agricultural clayey till fields. Hydrol. Earth Syst. Sci. 2015, 19, 3475–3488. [Google Scholar] [CrossRef]
- Skaggs, R.W.; Chescheir, G.M. Effects of subsurface drain depth on nitrogen losses from drained lands. Trans. ASAE 2003, 46, 237–244. [Google Scholar] [CrossRef]
- Shiratori, Y.; Watanabe, H.; Furukawa, Y.; Tsuruta, H.; Inubushi, K. Effectiveness of a subsurface drainage system in poorly drained paddy fields on reduction of methane emissions. Jpn. Soc. Soil Sci. Plant Nutr. 2007, 53, 387–400. [Google Scholar] [CrossRef]
- Gilliam, J.W.; Skaggs, R.W. Controlled agricultural drainage to maintain water quality. J. Irrig. Drain. Eng. 1986, 112, 254–263. [Google Scholar] [CrossRef]
- Poole, C.A. The Effect of Shallow Subsurface Drains on Nitrate-n and Orthophosphorus Losses from Drained Agricultural Lands. Master’S Thesis, North Carolina State University, Raleigh, NC, USA, 2006; p. 238. [Google Scholar]
- Gardner, C.M.K.; Cooper, D.M.; Hughes, S. Phosphorus in soils and field drainage water in the Thame catchment, UK. Sci. Total Environ. 2002, 282, 253–262. [Google Scholar] [CrossRef]
- Gentry, L.E.; David, M.B.; Royer, T.V.; Mitchell, C.A.; Starks, K.M. Phosphorus transport pathways to stream in tile-drained agricultural watersheds. J. Environ. Qual. 2007, 36, 408–415. [Google Scholar] [CrossRef] [PubMed]
- Beauchemin, S.; Simard, R.R.; Cluis, D. Forms and concentration of phosphorus in drainage water of twenty-seven tile-drained soils. J. Environ. Qual. 1998, 27, 721–728. [Google Scholar] [CrossRef]
- Ritzema, H.P. Drain for Gain: Managing salinity in irrigated lands. Agric. Water Manag. 2016, 176, 18–28. [Google Scholar] [CrossRef]
- Ritzema, H.P.; Schultz, B. Optimizing subsurface drainage practices in irrigated agriculture in the semi-arid and arid regions: Experiences from Egypt, India and Pakistan. Irrig. Drain. 2011, 60, 360–369. [Google Scholar] [CrossRef]
- Ritzema, H.P.; Satyanarayana, T.V.; Raman, S.; Boonstra, J. Subsurface drainage to combat waterlogging and salinity in irrigated lands in India: Lessons learned in farmers’ fields. Agric. Water Manag. 2008, 95, 179–189. [Google Scholar] [CrossRef]
- Kudo, Y.; Noborio, K.; Shimoozono, N.; Kurihara, R. The effective water management practice for mitigating greenhouse gas emissions and maintaining rice yield in central Japan. Agric. Ecosyst. Environ. 2014, 186, 77–85. [Google Scholar] [CrossRef]
- Carter, C.E.; Camp, C.R. Drain spacing effects on water table control and sugarcane yields. Trans. ASAE 1994, 37, 1509–1513. [Google Scholar] [CrossRef]
- Mathew, E.K.; Panda, R.K.; Nair, M. Influence of subsurface drainage on crop production and soil quality in a low-lying acid sulphate soil. Agric. Water Manag. 2001, 47, 191–209. [Google Scholar] [CrossRef]
- Satyanarayana, T.V.; Boonstra, J. Subsurface drainage pilot area experiences in three irrigated project commands of Andhra Pradesh in India. Irrig. Drain. 2007, 56, 245–252. [Google Scholar] [CrossRef]
Figure 1.
Seasonal variation of rainfall, pan evaporation, and mean temperature during the study period.
Figure 1.
Seasonal variation of rainfall, pan evaporation, and mean temperature during the study period.

Figure 2.
Layout of the subsurface drainage systems and location of measuring instruments (1 to 12: plot nr.; O: location of observation wells and open-end lysimeter for measuring evaporation (E) and deep percolation (DP); ∆: location of closed bottom lysimeter for measuring evaporation (E); □: location of open lysimeter for measuring evapotranspiration (ET), ➞: subsurface drain lines; ⌧: location of drain outflow measurement.

Figure 3.
Relationship between drainage water electrical conductivity (EC) and water table depth for the free drainage (FD) during the canola growing seasons, and for AWD during the rice growing seasons.
Figure 3.
Relationship between drainage water electrical conductivity (EC) and water table depth for the free drainage (FD) during the canola growing seasons, and for AWD during the rice growing seasons.

Figure 4.
Total salt loads in the drainage water for the three water management strategies (left) and the five drainage systems (right).
Figure 4.
Total salt loads in the drainage water for the three water management strategies (left) and the five drainage systems (right).

Figure 5.
Relationship between the nitrate concentration in the drainage water and water table depth for the FD and AWD strategies during the canola and rice growing seasons, respectively.
Figure 5.
Relationship between the nitrate concentration in the drainage water and water table depth for the FD and AWD strategies during the canola and rice growing seasons, respectively.

Figure 6.
Total nitrate losses for the three water management strategies (left) and the five drainage systems (right).
Figure 6.
Total nitrate losses for the three water management strategies (left) and the five drainage systems (right).

Figure 7.
Average of total phosphorous (TP) losses under MSD and FD management strategies (left) and the five drainage systems (right).
Figure 7.
Average of total phosphorous (TP) losses under MSD and FD management strategies (left) and the five drainage systems (right).

Figure 8.
Increase in canola yield from 2011–2012 to 2016–2017 (left) and five-year average yield for the five drainage systems (right). Means with the same letter are not significantly different at p < 0.05 by least significant difference (LSD) test.
Figure 8.
Increase in canola yield from 2011–2012 to 2016–2017 (left) and five-year average yield for the five drainage systems (right). Means with the same letter are not significantly different at p < 0.05 by least significant difference (LSD) test.

Figure 9.
Rice yield for the MSD and AWD management strategies (left) and for the five drainage treatments (right). Means with the same letter are not significantly different at p < 0.05 by LSD test.
Figure 9.
Rice yield for the MSD and AWD management strategies (left) and for the five drainage treatments (right). Means with the same letter are not significantly different at p < 0.05 by LSD test.


Table 1.
Fertilizer applications during rice and canola growing seasons.
| Basal Fertilizer | 2nd Urea | 3rd Urea | 4th Urea | ||||||
|---|---|---|---|---|---|---|---|---|---|
| TSP | K2SO4 | Urea | |||||||
| (kg ha−1) | (kg ha−1) | (kg ha−1) | DAP | (kg ha−1) | DAP | (kg ha−1) | DAP | (kg ha−1) | |
| Rice: | |||||||||
| 2011 | 140 | 8 | 90 | ||||||
| 2012 | 9 | 90 | |||||||
| 2014 | 100 | 100 | 80 | 13 | 80 | 31 | 30 | ||
| 2015 | 50 | 50 | 100 | 12 | 50 | ||||
| Canola: | |||||||||
| 2011–2012 | 100 | 35 | 121 | 35 | |||||
| 2012–2013 | 155 | 35 | |||||||
| 2014–2015 | 21 | 70 | 128 | 70 | |||||
| 2015–2016 | 50 | 52 | 50 | ||||||
| 2016–2017 | 24 | 85 | 96 | 85 | 116 | 115 | |||
Basal: Broadcasting at sowing or planting; TSP: Triple superphosphate; K2SO4: Potassium sulphate; Urea: CO(NH2)2; DAP: Days after planting.
Table 2.
Water balance components for the three water management strategies.
| Crop | Rice | Canola | |||||||||
|---|---|---|---|---|---|---|---|---|---|---|---|
| Water Management | MSD | AWD | FD | ||||||||
| Growing Season | 2011 | 2012 | Average | 2014 | 2015 | Average | 2011–2012 | 2015–2016 | 2016–2017 | Average | |
| Rainfall (P) | (mm) | 137 | 74 | 105 | 86 | 89 | 88 | 394 | 558 | 403 | 480 |
| Irrigation (I) | (mm) | 618 | 699 | 658 | 591 | 698 | 645 | Rainfed | Rainfed | Rainfed | - |
| Evapotranspiration (E) | (mm) | 465 | 441 | 453 | 321 | 405 | 363 | 356 | 323 | 558 | 440 |
| Subsurface drainage outflow (D): | |||||||||||
| D0.65L15 | (mm) | 14 | 20 | 17 | 31 | 13 | 22 | 238 | 287 | 128 | 207 |
| Bilevel | (mm) | 6 | 25 | 16 | 70 | 28 | 49 | 203 | 364 | 89 | 226 |
| D0.65L30 | (mm) | 5 | 7 | 6 | 13 | 8 | 11 | 169 | 193 | 63 | 128 |
| D0.90L30 | (mm) | 3 | 7 | 5 | 48 | 9 | 29 | 174 | 189 | 81 | 135 |
| Average SSD outflow (D) | (mm) | 7 | 15 | 11 | 40 | 15 | 28 | 196 | 258 | 90 | 174 |
| Surface runoff (Control) (SR) | (mm) | 56 | 85 | 70 | 87 | 64 | 76 | - | - | - | |
| Deep percolation: | |||||||||||
| D0.65L15 | (mm) | 143 | 126 | 135 | 107 | 144 | 126 | ||||
| Bilevel | (mm) | 144 | 129 | 137 | 117 | 157 | 137 | ||||
| D0.65L30 | (mm) | 132 | 123 | 128 | 92 | 126 | 109 | ||||
| D0.90L30 | (mm) | 136 | 131 | 134 | 97 | 124 | 111 | ||||
| Control | (mm) | 122 | 110 | 116 | 87 | 119 | 103 | ||||
| Average deep percolation (DP) | (mm) | 135 | 124 | 130 | 100 | 134 | 117 | ||||
| ∆S = P + I − E − D − DR − SR | (mm) | 91 | 108 | 100 | 129 | 169 | 149 | −158 | −23 | −245 | −142 |
Table 3.
Irrigation efficiency based on the relative water supply (RWS).
| Water Management | MSD | AWD | ||||
|---|---|---|---|---|---|---|
| 2011 | 2012 | Average | 2015 | 2015 | Average | |
| RWS | 1.6 | 1.8 | 1.7 | 2.1 | 1.9 | 2.0 |
| RWS* | 1.3 | 1.5 | 1.4 | 1.8 | 1.6 | 1.7 |
Table 4.
Salinity of the irrigation and drainage water (dS/m) for the three management treatments and the five drainage systems.
Table 4.
Salinity of the irrigation and drainage water (dS/m) for the three management treatments and the five drainage systems.
| Drainage System | Growing Season | ||||||
|---|---|---|---|---|---|---|---|
| Rice 2011 | Canola 2011–2012 | Rice 2012 | Rice 2014 | Rice 2015 | Canola 2015–2016 | Canola 2016–2017 | |
| MSD | FD | MSD | AWD | AWD | FD | FD | |
| ECi (dS/m) | 1.12 | - | 1.29 | 1.25 | 1.30 | - | - |
| D0.65L15 | 2.04 b | 1.88 b | 1.44 a | 1.61 a | 1.73 a | 1.63 a | 1.50 b |
| Bilevel | 2.17 b | 1.94 a | 1.17 ab | 1.21 cd | 1.65 a | 1.55 ab | 1.57 a |
| D0.65L30 | 1.83 b | 1.55 c | 1.33 ab | 1.55 ab | 1.60 ab | 1.40 ab | 1.33 c |
| D0.90L30 | 1.62 b | 1.45 d | 1.08 b | 1.06 d | 1.19 c | 1.32 b | 1.26 d |
| Control | 4.24 a | - | 1.12 b | 1.32 bc | 1.51 b | - | - |
| Water management | MSD | AWD | FD | ||||
| ECaverage | 1.53 A | 1.44 A | 1.52 A | ||||
Means within a column followed by the same letter are not significantly different, according to the LSD at the 0.05 probability level. Moreover, the same capital letter indicates no significant differences in salinity concentration between the water management treatments.
Table 5.
Leaching fraction and corresponding soil salinity levels of the midseason drainage (MSD) and alternate wetting and drying (AWD) treatments.
Table 5.
Leaching fraction and corresponding soil salinity levels of the midseason drainage (MSD) and alternate wetting and drying (AWD) treatments.
| Water Management | MSD | MSD | AWD | AWD | |
|---|---|---|---|---|---|
| Growing Season | 2011 | 2012 | 2014 | 2015 | |
| P | (mm) | 137 | 74 | 86 | 89 |
| I | (mm) | 618 | 699 | 591 | 698 |
| I + P | 755 | 773 | 677 | 787 | |
| ET | (mm) | 465 | 441 | 321 | 405 |
| DP | (mm) | 135 | 124 | 100 | 134 |
| SSD discharge | (mm) | 7 | 15 | 40 | 15 |
| LF = (I + P − ET)/(I + P) | (-) | 0.38 | 0.43 | 0.53 | 0.49 |
| ECi | (dS/m) | 1.12 | 1.19 | 1.25 | 1.30 |
| ECe = ECi/2LF | (dS/m) | 1.46 | 1.39 | 1.19 | 1.34 |
Table 6.
Nitrate concentration (mg L−1) in the drainage water for the three management treatments and the five drainage systems.
Table 6.
Nitrate concentration (mg L−1) in the drainage water for the three management treatments and the five drainage systems.
| Drainage System | Growing Season | ||||||
|---|---|---|---|---|---|---|---|
| Rice 2011 | Canola 2011–2012 | Rice 2012 | Rice 2014 | Rice 2015 | Canola 2015–2016 | Canola 2016–2017 | |
| MSD | FD | MSD | AWD | AWD | FD | FD | |
| D0.65L15 | 6.67 a | 4.50 a | 12.42 a | 4.55 a | 3.57 ab | 10.15 b | 17.39 ab |
| Bilevel | 4.53 bc | 4.19 ab | 11.29 ab | 3.77 a | 6.00 a | 10.69 b | 12.21 b |
| D0.65L30 | 5.39 abc | 3.47 b | 9.23 ab | 3.66 a | 4.50 ab | 10.08 b | 11.37 b |
| D0.9L30 | 3.89 c | 4.63 a | 11.40 ab | 2.70 a | 4.67 ab | 21.85 a | 32.33 a |
| Control | 6.44 ab | - | 5.63 b | 4.81 a | 3.33 b | - | - |
| Water management | MSD | AWD | FD | ||||
| Nitrate | 7.63 AB | 4.24 B | 12.29 A | ||||
Means within a column followed by the same letter are not significantly different, according to the LSD at the 0.05 probability level. Moreover, the same capital letter indicates no significant difference in nitrate concentration between the water management treatments.
© 2018 by the authors. Licensee MDPI, Basel, Switzerland. This article is an open access article distributed under the terms and conditions of the Creative Commons Attribution (CC BY) license (http://creativecommons.org/licenses/by/4.0/).
Share and Cite
MDPI and ACS Style
Darzi-Naftchali, A.; Ritzema, H. Integrating Irrigation and Drainage Management to Sustain Agriculture in Northern Iran. Sustainability 2018, 10, 1775. https://doi.org/10.3390/su10061775
AMA Style
Darzi-Naftchali A, Ritzema H. Integrating Irrigation and Drainage Management to Sustain Agriculture in Northern Iran. Sustainability. 2018; 10(6):1775. https://doi.org/10.3390/su10061775
Chicago/Turabian StyleDarzi-Naftchali, Abdullah, and Henk Ritzema. 2018. "Integrating Irrigation and Drainage Management to Sustain Agriculture in Northern Iran" Sustainability 10, no. 6: 1775. https://doi.org/10.3390/su10061775
Note that from the first issue of 2016, this journal uses article numbers instead of page numbers. See further details here.