The Evolution of Renewable Energy Price Policies Based on Improved Bass Model: A System Dynamics (SD) Analysis


1
School of Economics and Management, North China Electric Power University, Changping, Beijing 102206, China
2
Beijing Key Laboratory of New Energy and Low-Carbon Development, North China Electric Power University, Changping, Beijing 102206, China
*
Author to whom correspondence should be addressed.
Sustainability 2018, 10(6), 1748; https://doi.org/10.3390/su10061748
Submission received: 5 May 2018
/
Revised: 21 May 2018
/
Accepted: 25 May 2018
/
Published: 26 May 2018
(This article belongs to the Collection Power System and Sustainability)
Abstract
:Many countries in the world have implemented many price support policies to promote the development of renewable energy, and there are evolutionary processes between different policies at different stages of national development. Existing literature has less research on the internal mechanism and alternative process of renewable energy price policies’ evolution process. In view of this, this paper innovatively introduces the classic model of innovation diffusion theory, the Bass model, into the renewable energy price mechanism, and improves it on the basis of the traditional Bass model, and then proposes a system dynamics (SD) simulation based on the improved Bass model to study the evolution process of the renewable energy price policies. This paper mainly studies the evolution process of the policies from feed-in tariff (FIT) to renewable portfolio standard (RPS), and takes China’s wind power industry as an example to simulate the model. The results show that FIT can effectively and quickly evolve to RPS based on the internal influence of the interaction among power generation enterprises and the external influence of government behaviors. All the power generation enterprises will implement RPS, and the amount of green power enterprises eventually grows steadily and slowly. In addition, increasing the decline rate of FIT subsidy and RPS unit fine can effectively promote the evolution of RPS policy, and also improve the amount of green power enterprises and the activity of the tradable green certificates (TGC) trading market.
1. Introduction
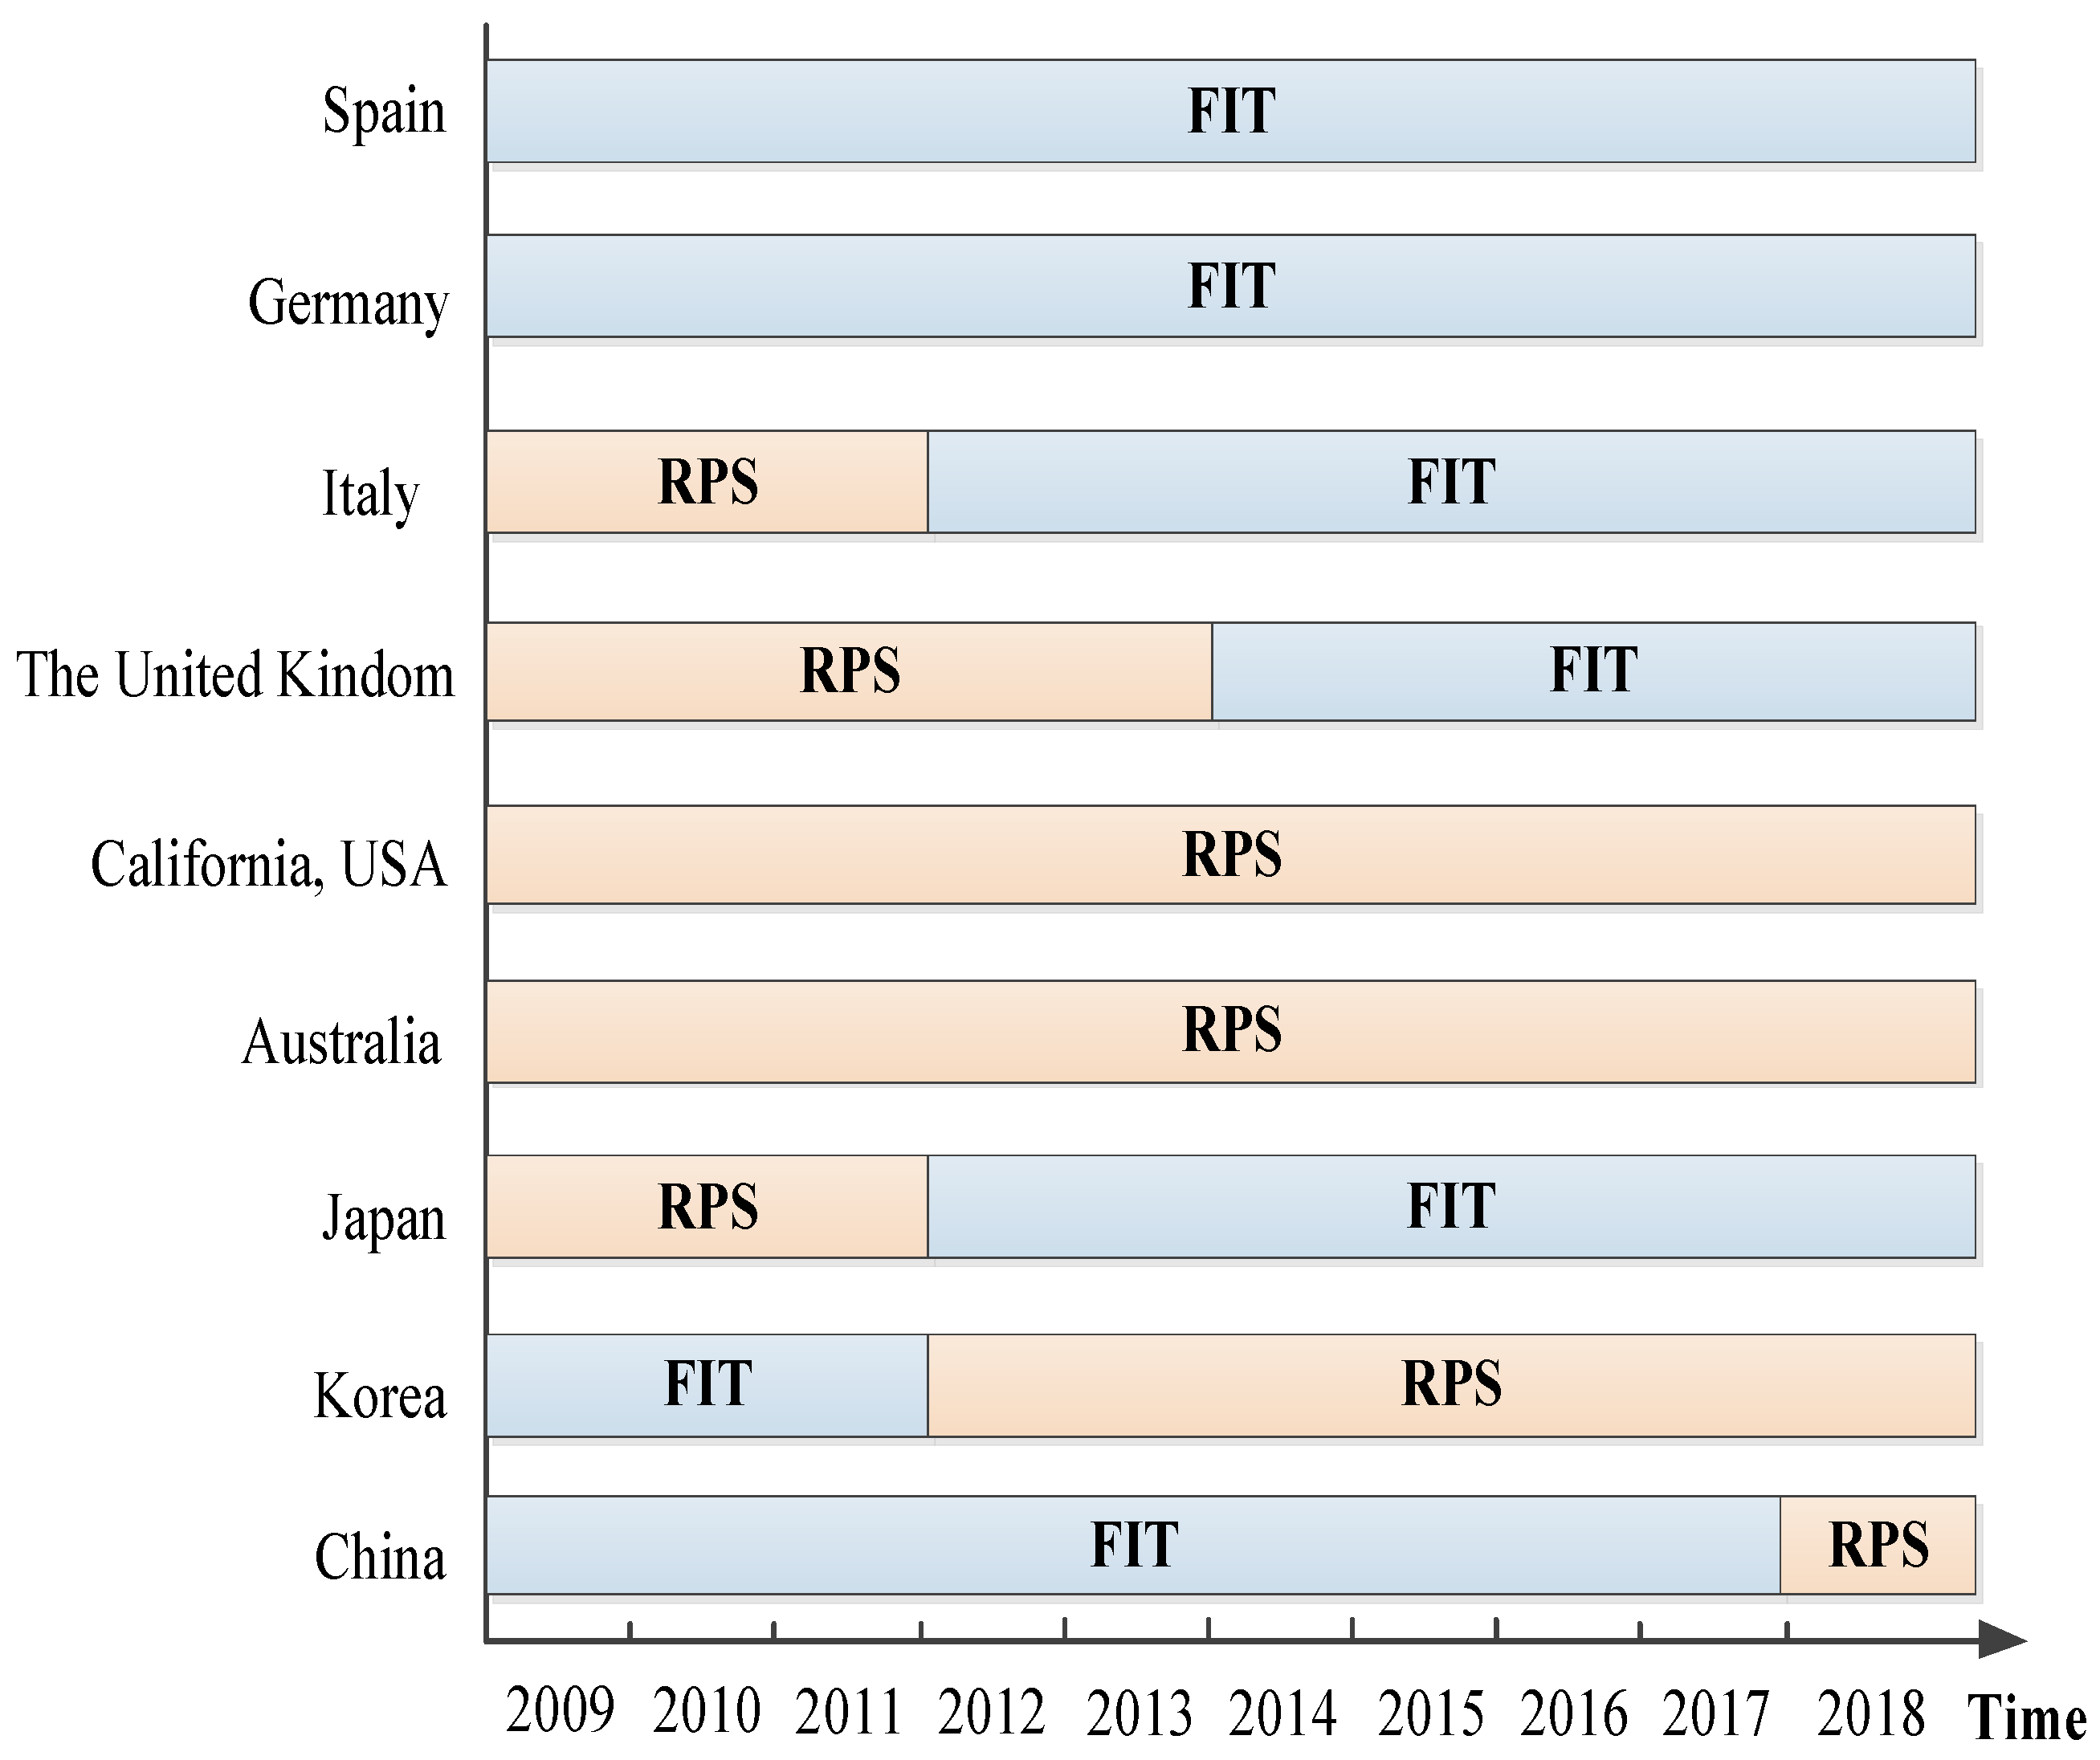
Many countries in the world have implemented a number of price support policies to promote the development of renewable energy. They have made institutional choices according to their energy policy goals and actual national conditions [1]. The policies and regulations of various countries are varied. The evaluation of these policies focuses on the strategic choice and social responsibility of the renewable energy industry. At present, all the renewable energy price support policies can be roughly divided into two categories, which are feed-in tariff (FIT) mechanism and renewable portfolio standard (RPS) [2]. The economic strength and resource conditions of a certain country are different at different stages of national development, thus, the renewable energy price policies will change, and there will be an evolutionary process between the policies. For example, China’s renewable energy is currently implementing FIT, and it will begin to implement RPS in 2018 according to the provisions of China’s power system reform [3]. The implementation and evolution of renewable energy price policies in typical countries and regions are shown in Figure 1.
The studies on the evolution of renewable energy price policies are not rich at present. Dong et al. [4] studied the evolution from RPS to FIT for the deployment of renewable energy in Japan by employing a dominant firm-competitive fringe model. They found that nonrenewable firms will suffer a reduction in revenue under both schemes, and the renewable producers behave competitively and act as price takers. Dong [5] examined the relative effectiveness of FI and RPS in promoting wind capacity development using panel data, and he founds that FIT increases total wind capacity more than RPS. Ming et al. [6] introduced the current development situation of renewable energy, analyzed the evolution and implementation effect of the renewable energy tariff policy, and discussed the problems of the renewable energy tariff policy in China. Pyrgou et al. [7] examined the regulatory and policy framework of FIT scheme, specifically its effect on both the electricity pricing as well as the local and European renewable energy sources market, and accordingly the definition of its feasibility as a scheme for the further development and promotion of renewable energy technologies. Boomsma et al. [1] studied the market and policy risk under different renewable electricity support schemes, and they found that the differences in market risk between support schemes like FIT and RPS are less than commonly believed due to price diversification. Schallenberg-Rodriguez [8] assessed the performance of RPS system and FIT system, and analyzed their advantages and disadvantages, thereby contributing to the worldwide debate on the suitability of the different renewable energy sources support systems. Aquila et al. [9] overviewed and discuss some long-term policies that have been applied in several countries, such as FIT and RPS, and the main advantages and disadvantages of these incentive strategies are emphasized, focusing on applications. Xu et al. [10] focused on the evolution, implementation status and problems of the wind power tariff policy in China. Shahnazari et al. [11] reported insights gained from an integrated real options and portfolio optimization model of electricity generation investment behaviur under political uncertainty over the futures of interacting carbon pricing and RPS instruments. Chang et al. [12] investigated the policy system in China which aims to facilitate the transition to sustainable construction, and the results show that the behaviors of various participants in the construction industry, including the government, developers, builders, suppliers, and designers, are regulated and controlled by these laws and regulations.
It can be seen that most of the existing literature has studied the influence of different renewable energy price policies on the electricity market’s development and the trading entities’ behaviors. Few scholars pay attention to the internal mechanism and logical relationship of the policy evolution and the replacement process between the original and new mechanisms. In view of this, this paper aims to fill this gap. This paper innovatively introduces the classic model of innovation diffusion theory, the Bass model, into the renewable energy price mechanism, and improves it on the basis of the traditional Bass model, and then proposes a system dynamics (SD) simulation based on the improved Bass model to study the evolution process of the renewable energy price policies. The SD model of the evolution of renewable energy price policies based on the improved Bass model proposed in this paper not only clearly reflects the internal mechanism and alternative process of policy evolution, but also effectively simulates the development trend of the electricity market under the change of the price mechanism, which has important theoretical research value and practical reference significance. The organization of the paper is as follows. Section 2 illustrates the improvements of traditional Bass model, and proposes the SD model of policies’ evolution. Section 3 provides the case study with China’s wind power. Section 4 discusses the impact of the change of the two endogenous variables on the results. The conclusion is given in Section 5.
2. Methodology
The Bass model was proposed by Bass in 1969. Its basic usage is used to describe the process of innovation diffusion. After the continuous research by scholars, it is used in various fields, such as product replacement and technological innovation. The basic principle of the Bass model is to integrate the external and internal influences on the technology from the overall market response. It is consistent with the characteristics of the evolutionary process of the renewable energy price policies, which are the government behaviors (external) and interactions among power generation enterprises (internal). This section firstly improves the Bass model, and then proposes the SD simulation model of price policies’ evolution. SD is a systems modeling and dynamic simulation methodology for the analysis of dynamic complexities in socio-economic and biophysical systems with long-term, cyclical, and low-precision requirements [13,14]. Some scholars have combined the Bass model with the SD simulation to study the innovation diffusion. Lucia et al. [15] combine the Bass model and SD simulation to develop a model of the German photovoltaic market for small plants on private houses and tests public policies. L.L.C. et al. [16] use the SD technique in conjunction with the Bass model to foresee the diffusion of photovoltaic systems in residential consumers throughout time. Benvenutti et al. [17] develop a SD model based on Bass model to investigate the impact of public policies in the long-term diffusion dynamics of alternative fuel vehicles in Brazil. It can be seen that SD provides an effective aid for studying the process of innovation diffusion.
2.1. Improved Bass Model
Fourt and Woodlock (1960) thought that diffusion patterns of technological innovation in potential markets could be described by Formula (1) through the study of some diffusion phenomena:
where, is the amount of companies accumulating technology innovations up to time . is the market potential. is the external influence coefficient (). is the amount of companies adopting technological innovation at time . This model only considers the effect of external influences on adopters, and the coefficient can be understood as the unit effect of external influences.
Mansfield (1961) considered that the diffusion law of technological innovations in the potential market can be described by Formula (2) by studying the diffusion process of more than a dozen industrial technological innovations:
where, is the internal influence coefficient (). This model only considers the effects of internal influences on potential adopters. The imitative coefficient reflects the interaction strength between adopters and non-users , and can be understood as the unit effect of internal influences.
In 1969, Bass combined the models of external influence and internal influence, and put forward the famous Bass model shown as Formula (3):
The proposed Bass model is based on a series of assumptions, which include: (1) The market potential remains unchanged over time; (2) the adopters are indifferent or homogeneous; (3) the innovative diffusion is not affected by marketing strategy; (4) the product performance remains unchanged over time; (5) the geographical boundaries of social systems do not change with the diffusion process; (6) the diffusion process is divided into two stages: no adoption and adoption; (7) there are no supply constraints; (8) the interaction among adopters plays a constant role in the diffusion of innovation; (9) a diffusion of innovation is independent of other innovations’ diffusion.
Some of the assumptions of the Bass model make inadequacies in practical applications. This study improves these deficiencies as follows:
The Bass model simply divides technological innovation into two stages in the diffusion process, which are adoption and no adoption. In fact, while digesting, absorbing, and utilizing technological innovation knowledge, the whole diffusion process should adopt a three-phase analysis mode of “do not adopt-await to adopt-adopt”, and the three phases are continuation in time and have time-delayed.
The Bass model assumes that the market potential remains the same over time. In reality, companies should consider entering and exiting behaviors in the technological innovation process. This study assumes that companies enter or exit the market within a certain range of probability, which means that market potential fluctuates within a certain range.
Since the market potential is not constant, the impact of the interaction among adopters on innovation diffusion should also be changed.
The key to the successful adoption of technological innovation by enterprises is the transfer and utilization of innovative knowledge. This is not analyzed in the Bass model. Actually, the absorption, digestion, and utilization of innovative knowledge are accompanied and play a decisive role in the whole process of technological innovation.
The Bass model only embodies the process of innovation and diffusion of new technologies, and does not reflect the replacement and evolution between new and original technologies.
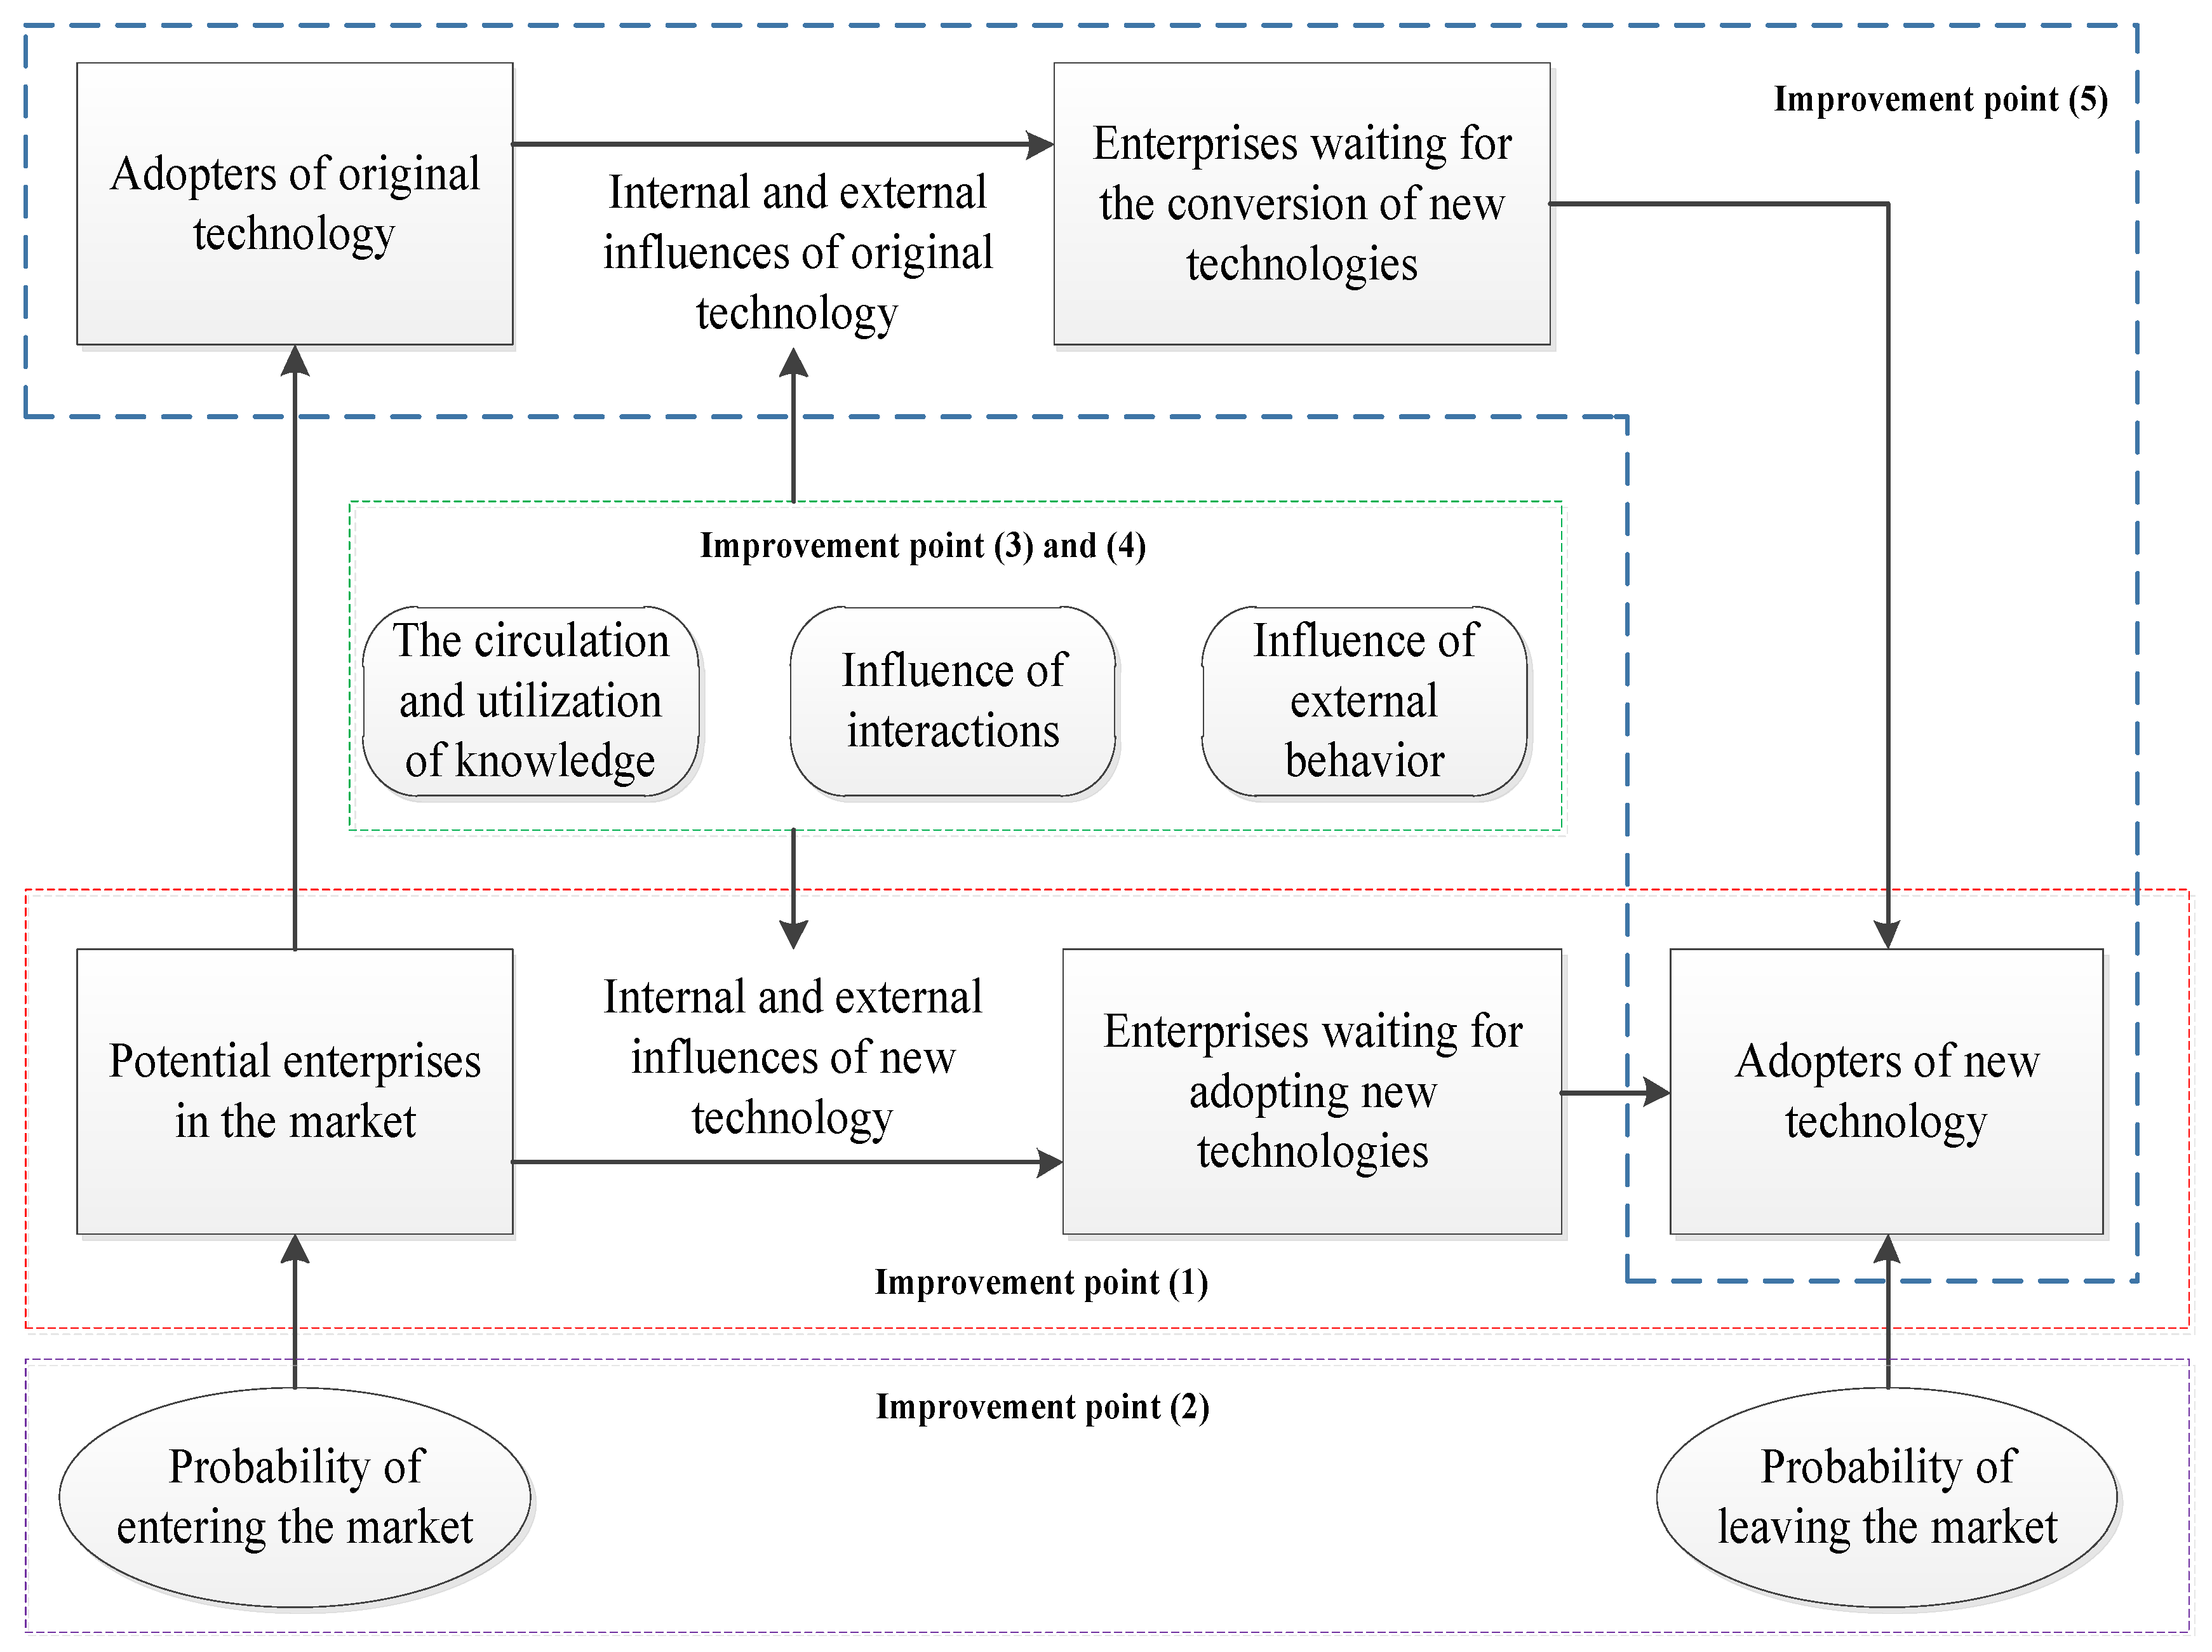
Based on the above five improvements, the logic framework of improved Bass model in this study is shown in Figure 2.
2.2. The SD Model of Policies’ Evolution
As mentioned in the introduction, the evolution of renewable energy price policies in different countries or regions is different, but its principles are basically the same. This study uses the evolution process of China’s current renewable energy price policy as an example, that is, the evolution from FIT to RPS. FIT is a scheme designed to accelerate investment in renewable energy technologies. It is a government-led regulatory mechanism that requires power grid enterprises to buy electricity from renewable energy producers at government-specified prices [18]. To encourage the development of the renewable energy power industry under FIT, the government subsidizes the electricity price of renewable energy power. RPS is a main promotion scheme of a quota obligation based on tradable green certificates (TGC) trading market. It is structured as a quantity regulation, letting the market determine a reasonable price for renewable energy power [19]. In this approach, governments set targets or quotas to ensure that power grid enterprises purchase a certain market share of capacity or generation of electricity coming from renewable energy sources [20]. To ensure the implementation of RPS, the government will punish power generation enterprises who do not fulfill their quota obligations by setting a fine.
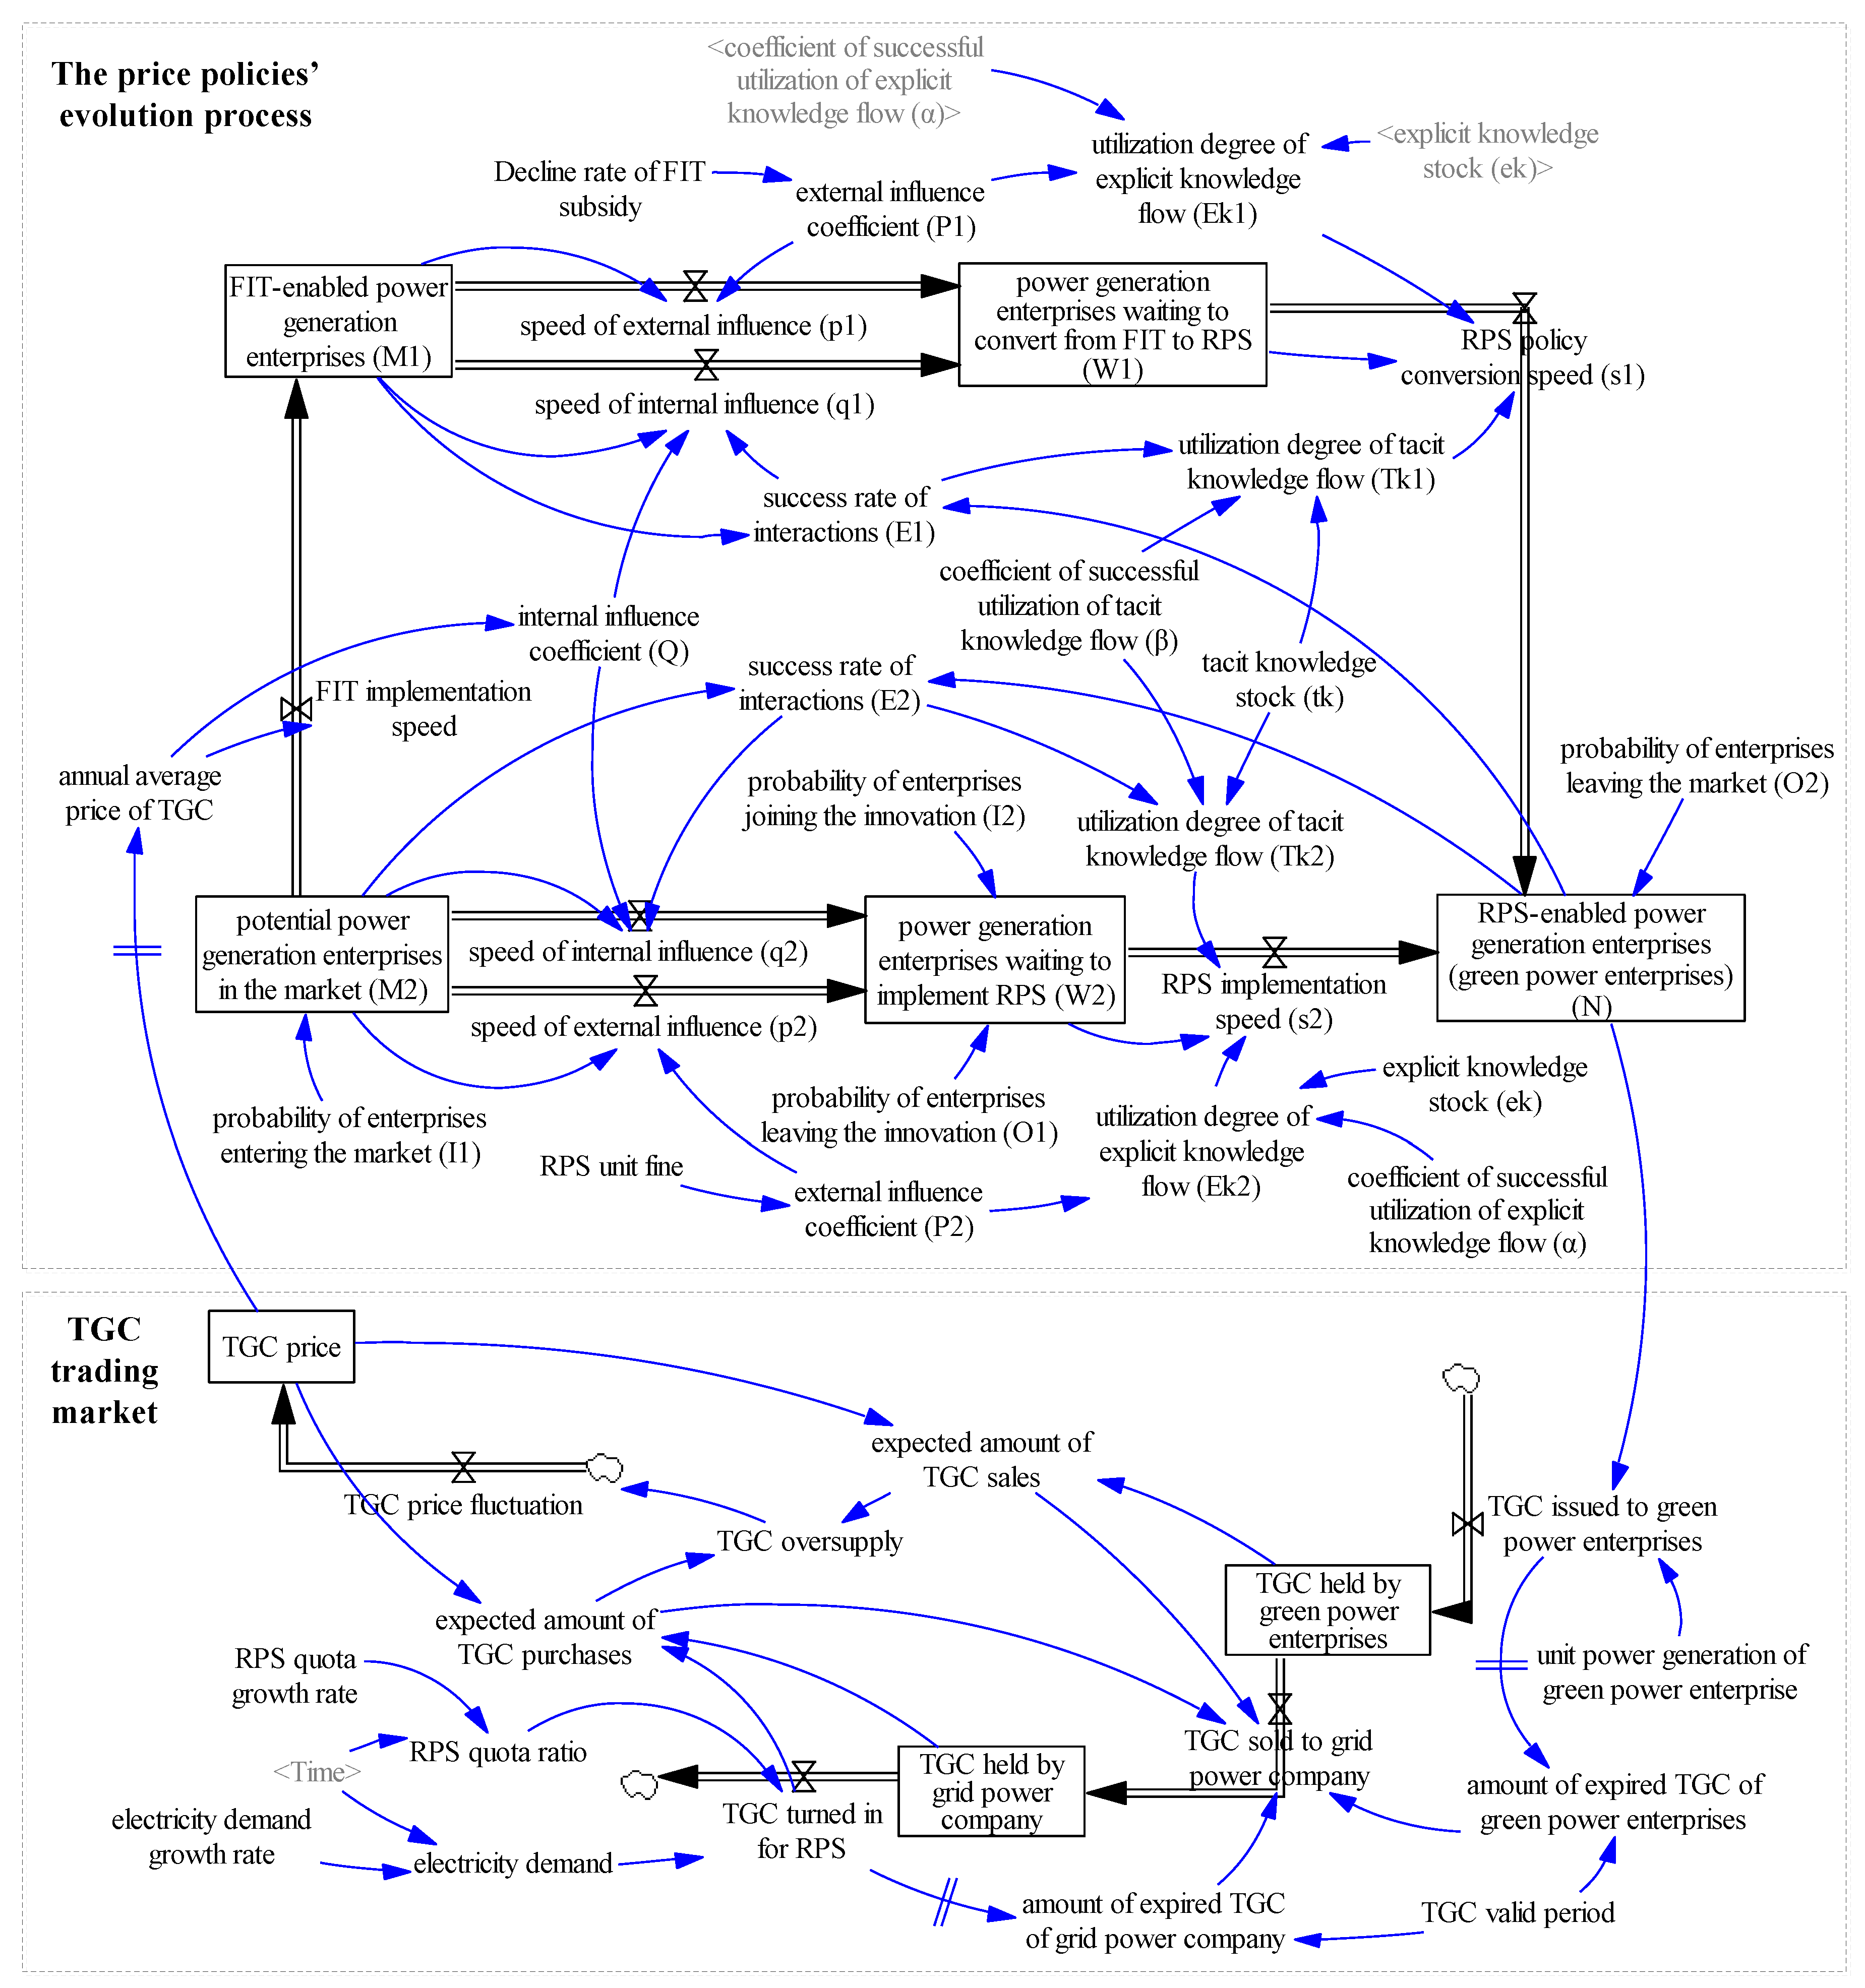
To clearly represent the dynamic evolution of price policies, we establish a stock and flow diagram (SFD) of evolution process from FIT to RPS using Vensim based on the logic framework of the improved Bass model above, as shown in Figure 3. The SFD is a good tool for modeling the cause and effect relationships between various components of the SD model [21]. The SFD is divided into two modules, which are the price policies’ evolution process module and the TGC trading market module. The specific analysis is as follows.
2.2.1. The Price Policies’ Evolution Process Module
The internal influence in the evolution of the price policy is mainly the interactions among power generation enterprises:
The speed of internal influence and is determined by the interactions among power generation enterprises that implement FIT or RPS, and the internal influence coefficient . Where, the interactions of FIT enterprises are represented by the interactive frequency between RPS-enabled power generation enterprises (hereinafter referred to as green power enterprises) and FIT-enabled power generation enterprises , and indicates the success rate of their interactions. Similarly, the interactions of RPS enterprises are represented by the interactive frequency between green power enterprises and potential power generation enterprises in the market , and indicates the success rate of their interactions. The reason that annual average price of TGC () affects is that the power generation enterprises will choose to implement different policy mechanisms according to the changes of . If is high, the power generation enterprises believe that trading TGC is profitable, which will promote the implementation of RPS. Therefore, and are positive correlation, is the economic parameter and greater than 0.
The external influence in the evolution process is mainly government behaviors. The government promotes the implementation of the RPS policy mainly through two strategies: on the one hand, it reduces the FIT subsidy to promote the FIT-enabled power generation enterprises to implement RPS; on the other hand, it sets a RPS fine to promote the market potential enterprises to implement RPS.
The speed of external influence and is determined jointly by and , and external influence coefficients and , respectively. Where, is affected by the decline rate of FIT subsidy, and is affected by RPS unit fine. and are economic parameters.
In the process of price policies’ evolution, the RPS policy conversion speed and RPS implementation speed are determined jointly by explicit knowledge and tacit knowledge that can be used by the power generation enterprises. From the perspective of knowledge accumulation, the essence of technological innovation is the integration, activation, innovation and utilization of existing knowledge bases. The activation, circulation and utilization of explicit knowledge are relatively easy, and that of tacit knowledge are relatively difficult. Tacit knowledge can be divided into internal tacit knowledge and external tacit knowledge. We use tacit knowledge stock to represent internal tacit knowledge, and use and to express the impact of external tacit knowledge, so that the utilization degree of tacit knowledge flow can be obtained as:
where, is the coefficient of successful utilization of tacit knowledge flow. Similarly, the utilization degree of explicit knowledge flow can be obtained as:
where, is the explicit knowledge stock. is the coefficient of successful utilization of explicit knowledge flow.
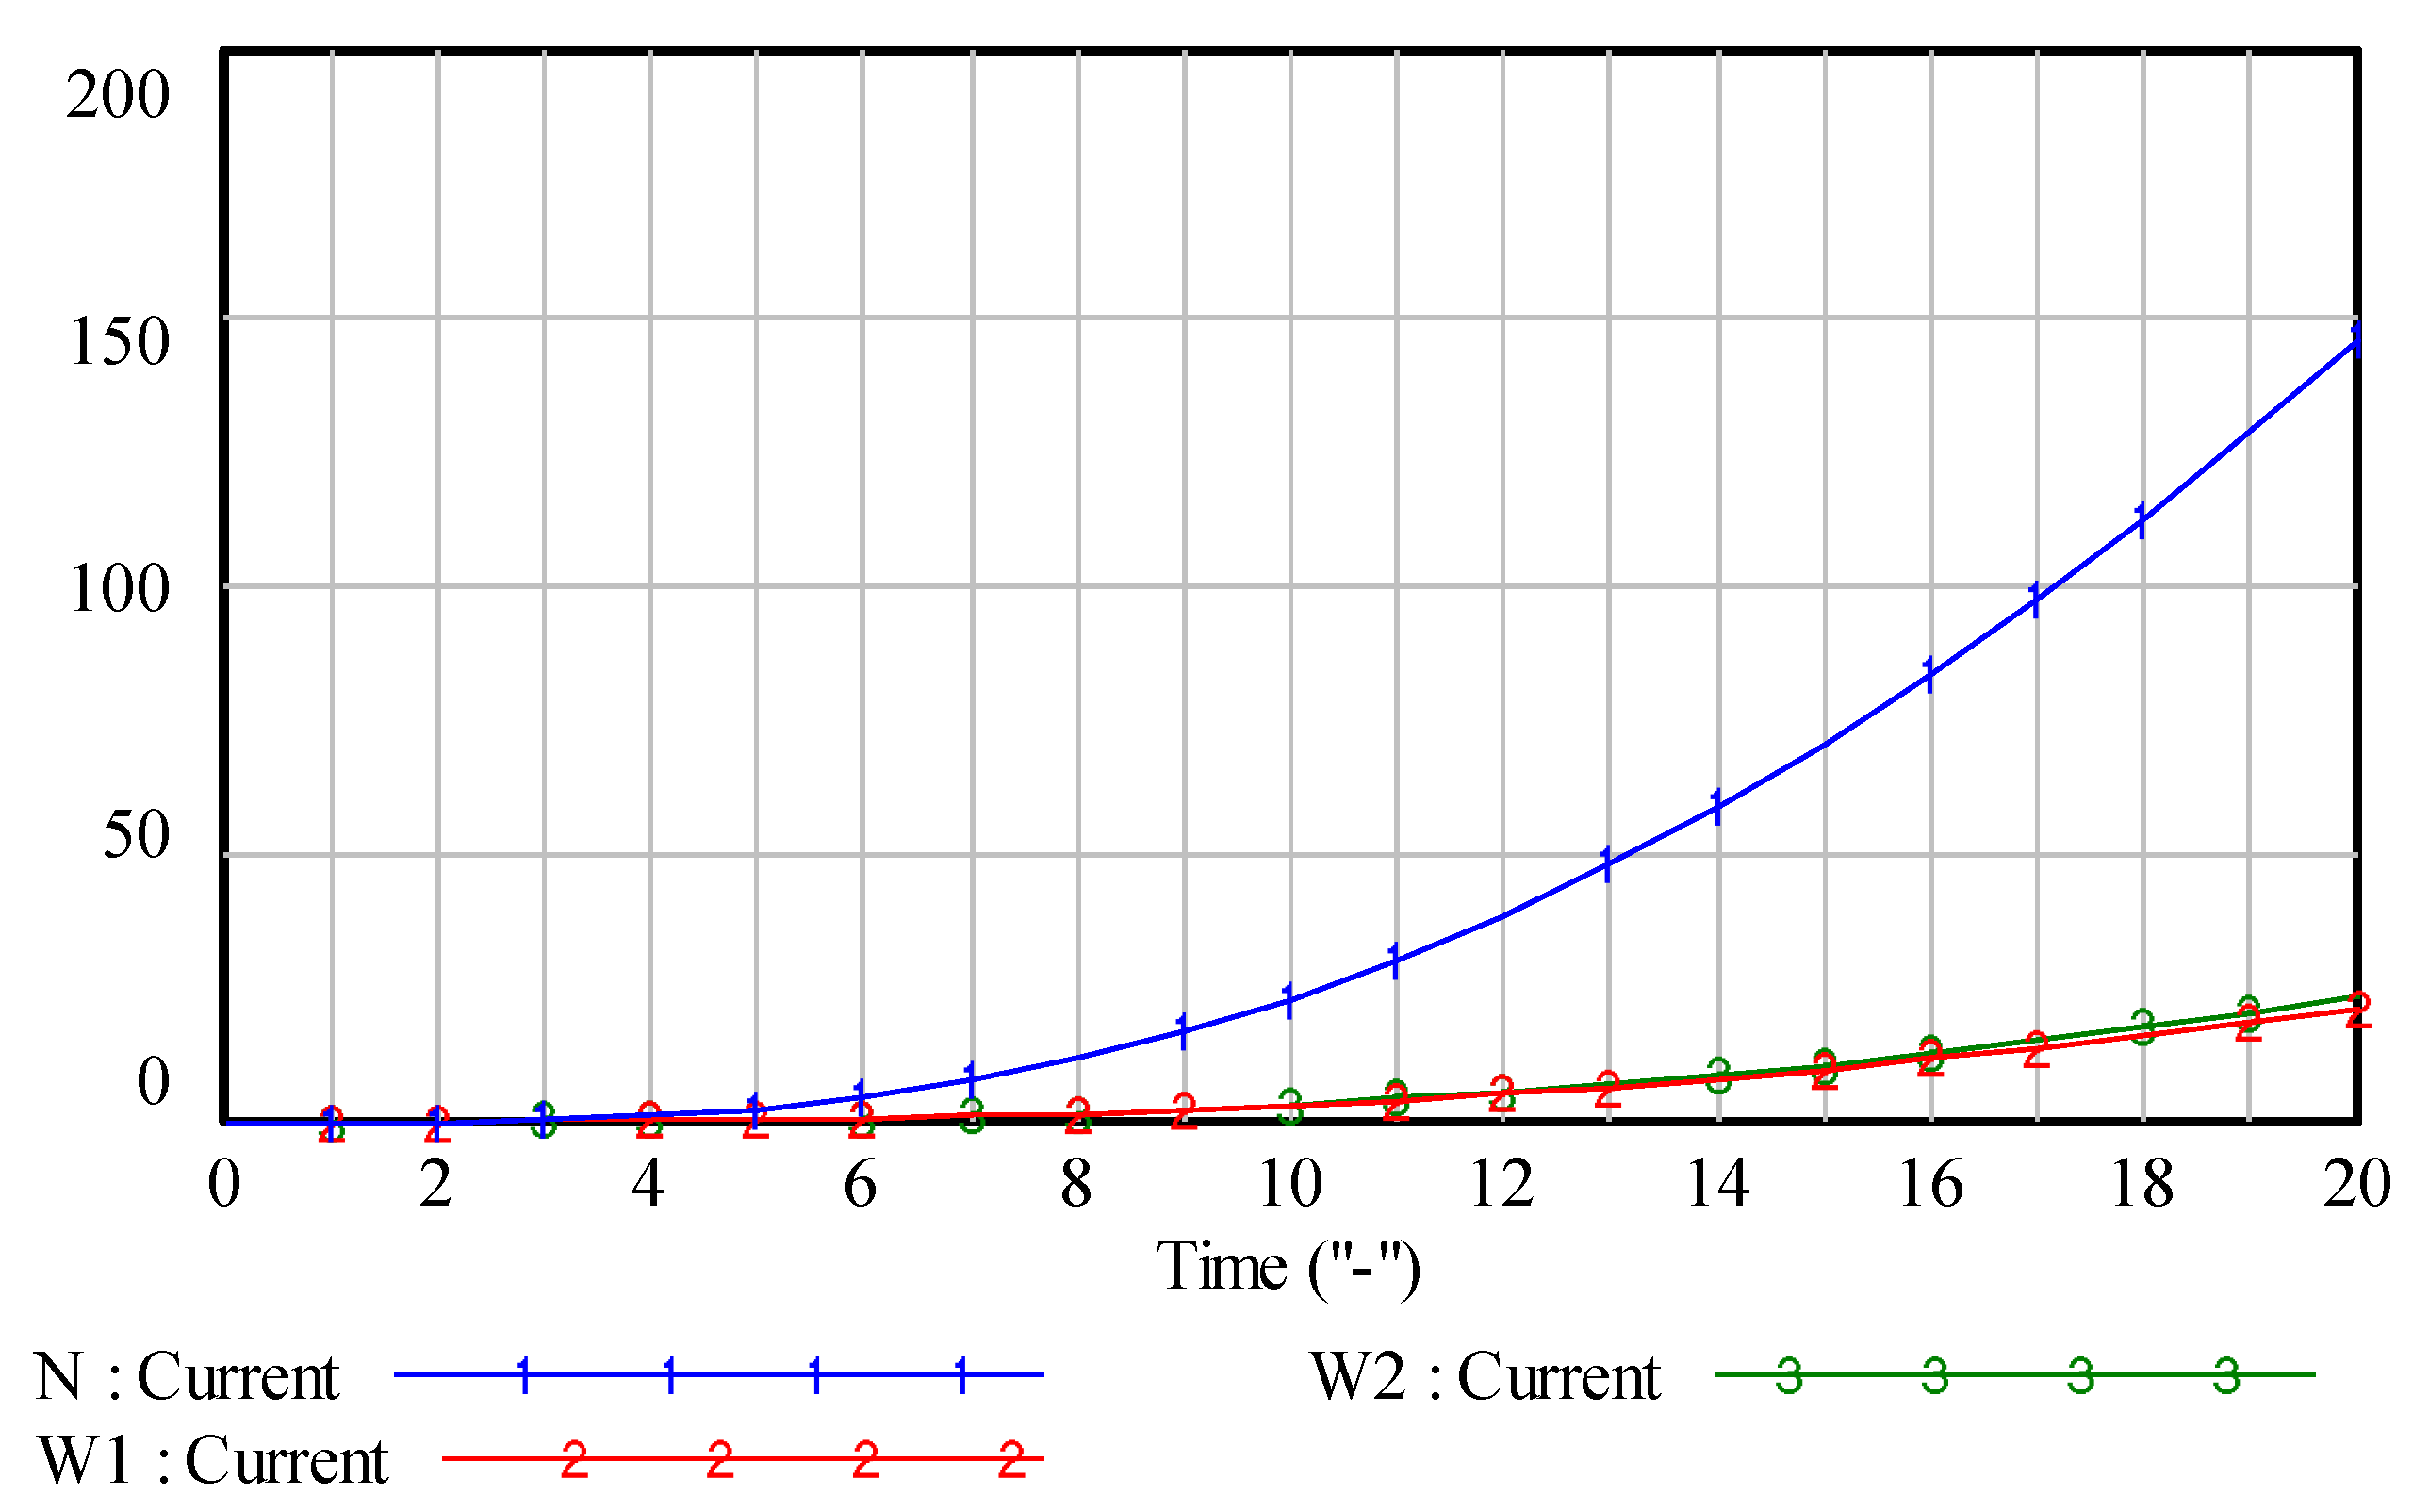
There are two processes passed from to , which are and . Both of these two processes are continuous, which means that there is a delay in time, that is, lags behind and , lags behind , and lags behind . This type of lag time can be expressed as a function in SD simulation. In addition, when considering the non-independence of the policies’ evolution process, we use the probability of enterprises entering or leaving the market , , , and to represent non-independent behaviors, which will cause fluctuations in market potential. In summary, the amounts of power generation enterprises in each phase are as follows:
where, , , , , and are the initial values of the amount of power generation enterprises in each phase. is the delayed time. To facilitate readers’ better understanding, we use a simple numerical example to illustrate Formulas (17)–(21). It is assumed that , , , , , , , , and the total time is 20, and then, , , , , . We use Vensim to test their change processes, and the results are shown as Figure 4 and Figure 5. The reason that FIT implementation speed is affected by is because if is high, the power generation enterprises believe that the TGC transaction is profitable, which will promote RPS implementation and be harmful to FIT implementation. Thus, FIT implementation speed and are negative correlation. is the economic parameter and greater than 0.
2.2.2. TGC Trading Market Module
The authors of this paper have studied and analyzed the TGC market transaction process under RPS in detail in the previous research. The main describes of TGC market are provided here. Interested readers can refer to the literature [18,19,20,21] for more detailed information.
TGC is a freely tradeable certificate similar to currency, which represents renewable energy power generation. In general, one unit TGC represents 1 kWh renewable energy power generation. The TGC trading market is a competitive market. The TGC trading volumes of the market is a certain percentage of electricity demand. This percentage is the RPS quota ratio set by the government, which can reflect the government’s policy objectives. In the TGC market, TGC demanders (such as power grid company) and TGC suppliers (such as green power enterprises) purchase and sell TGCs, respectively.
The expected amount of TGC sales () is based on TGC held by green power enterprises (), and changes with the change of TGC price (), that is the green power enterprises plan the sales amount by taking the ratio of the current to TGC initial price () as a reference [22]. When based on marginal cost price, is the difference between the long run marginal cost of renewable energy and that of traditional power. Thus, is shown as Formula (23). Similarly, the expected amount of TGC purchases () is shown as Formula (24). TGC held by a power grid company () is the difference between TGC sold to a power grid company () and TGC turned in for RPS (). According to Refs. [18,19,20,21], the TGC has a valid period, that is, TGC can be stored. When the quota meets the requirements, the TGC price is at a low level. At this time, the grid power company can trade with the green power enterprises at a lower price, and purchase the TGC. The stored TGC can be used in the next turn-in period. The green power enterprises need to sell TGCs, and the grid power company needs to turn TGCs in RPS before expiration. Thus, TGC valid period affects the amount of , which is shown by using extremal function as Formula (25) in Vensim, where is the amount of expired TGC of grid power company, and is the amount of expired TGC of green power enterprises. is determined by electricity demand and RPS quota ratio each year. In the competitive market, is directly determined by the trading volumes between the TGC demanders and the suppliers, and the greater the supply of TGC, the higher the TGC price. Thus, TGC price fluctuation () is negatively correlated with TGC oversupply (), as shown in Formula (26) [23]. is the adjustment coefficient. In addition, is the annual average value of , which is expressed as a smooth function in Vensim. The meaning of parameter is that the impact of the TGC price on the FIT implementation speed and the internal influence coefficient cannot be instantaneous, that is, the power generation enterprises need a certain reaction (delay) time to make a decision based on the change of TGC price, as shown in Formula (27). Where, is the delay time.
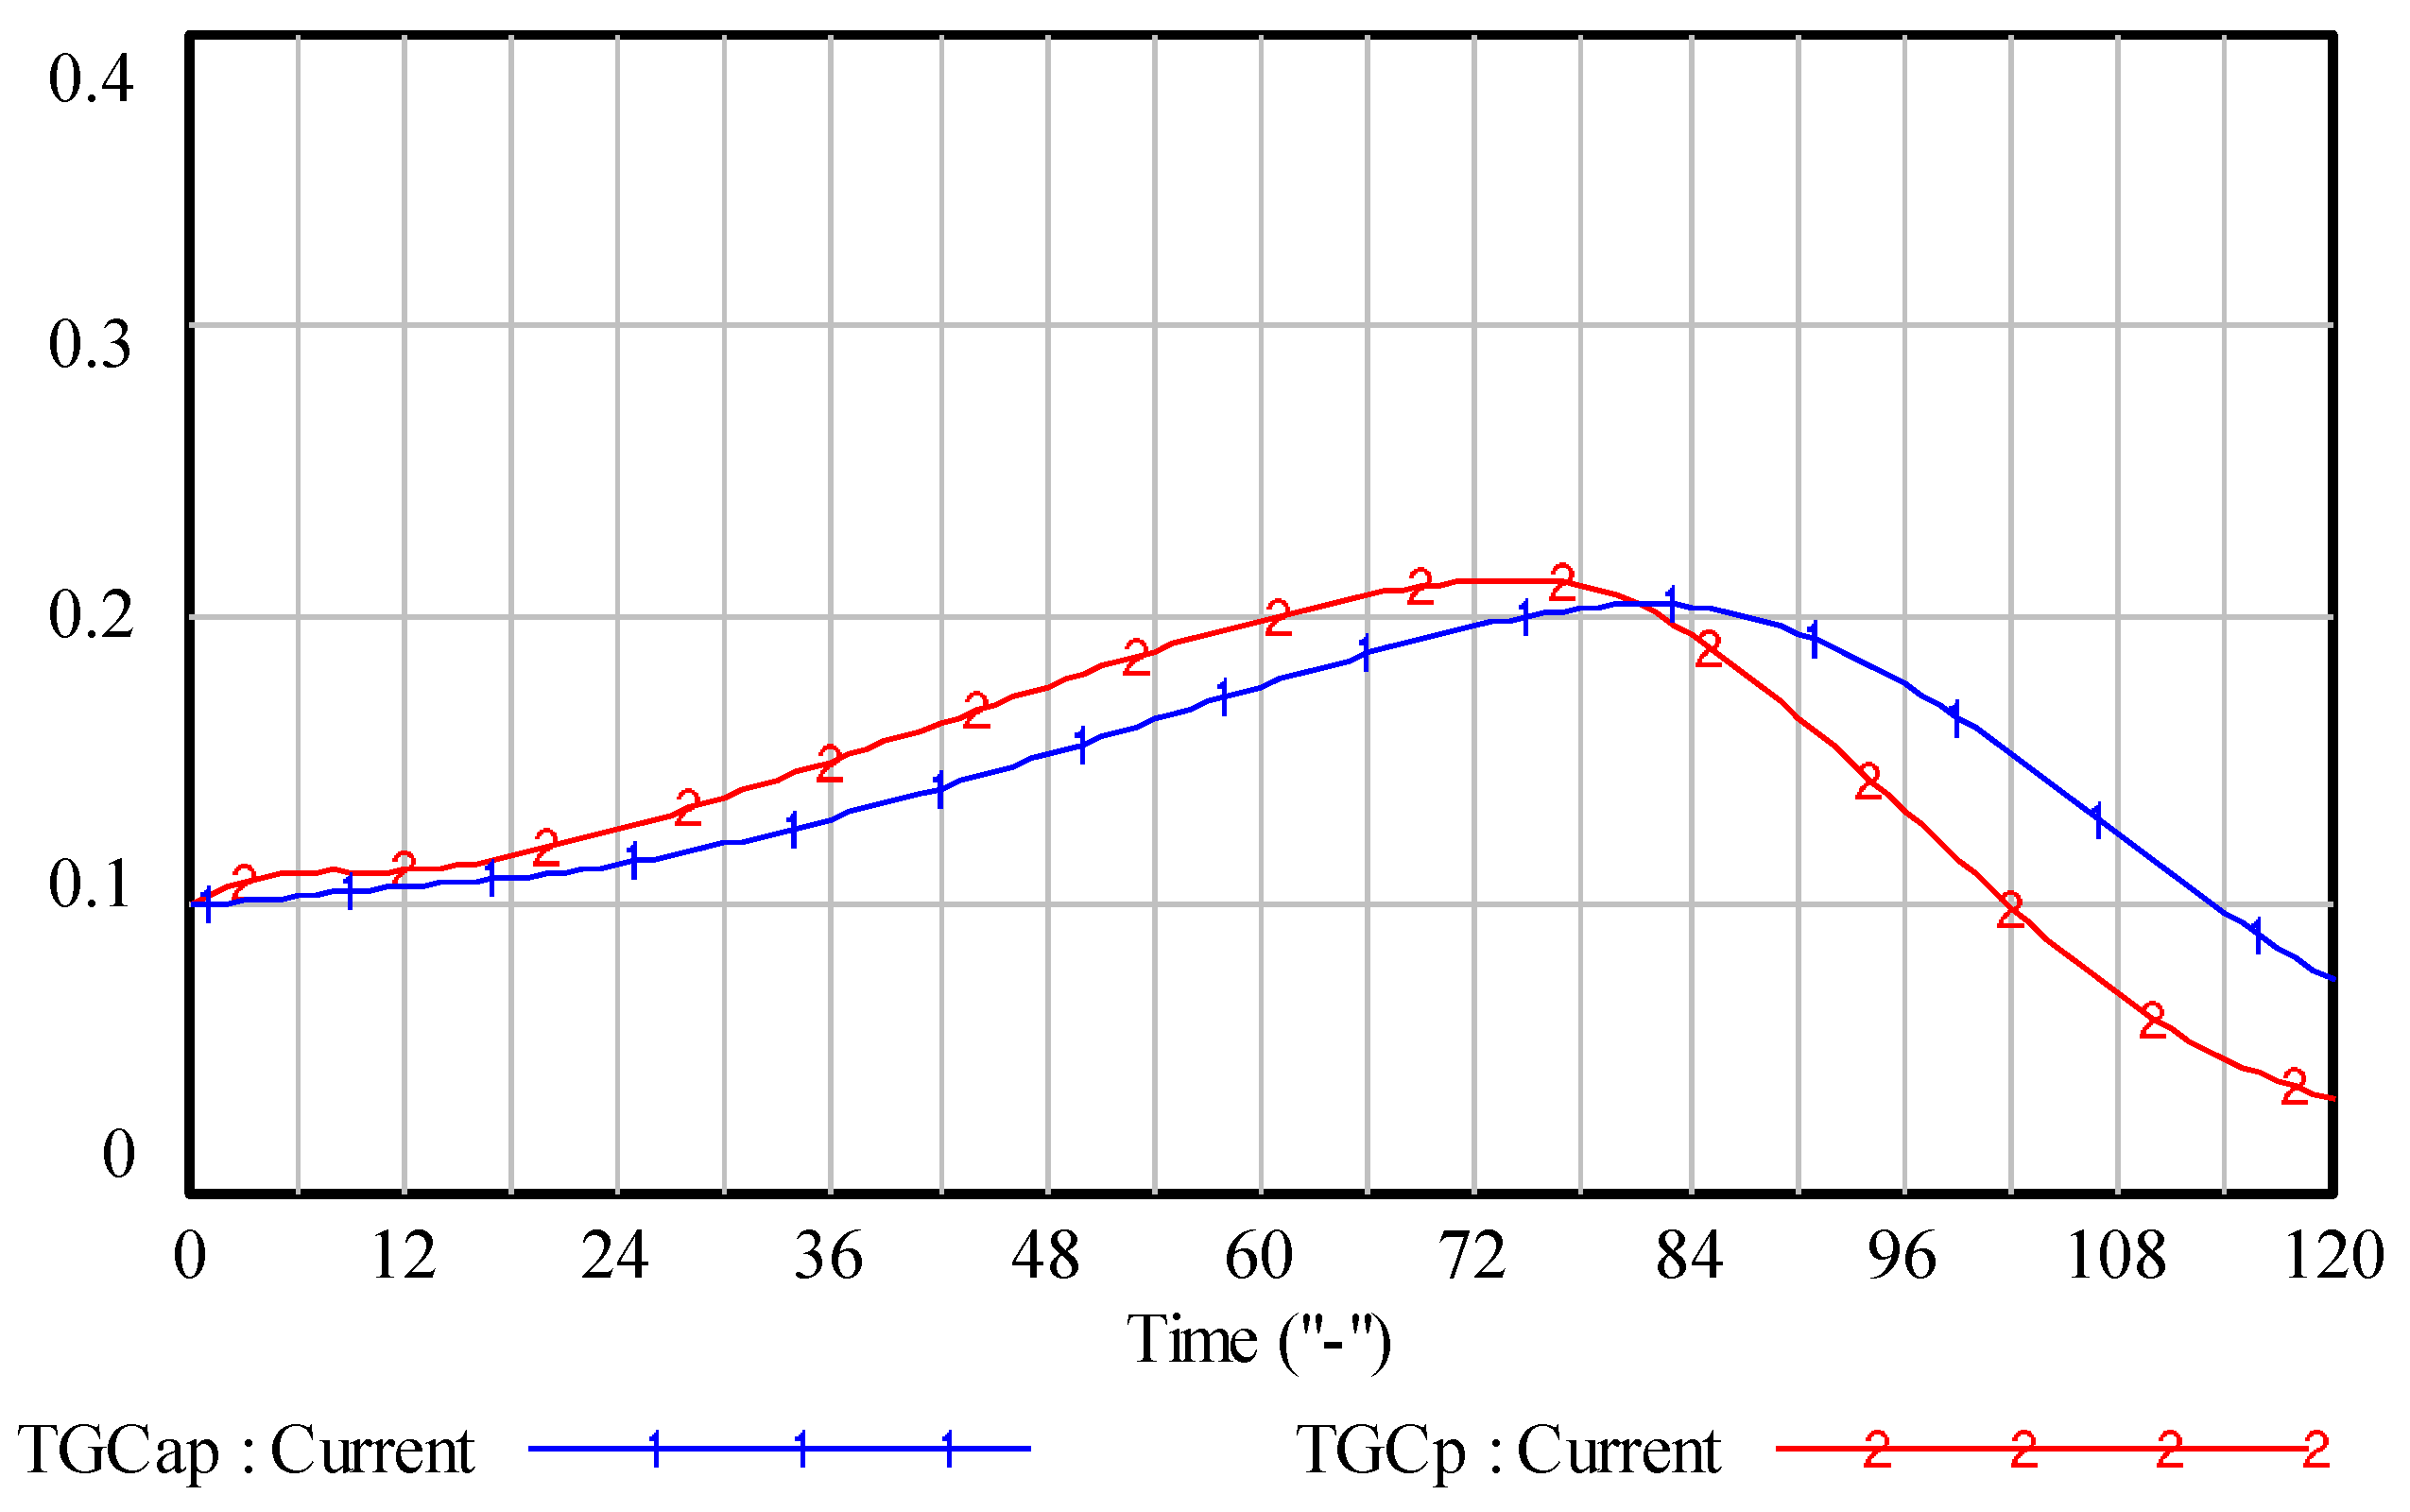
To facilitate readers’ better understanding, we use a simple numerical example to illustrate Formulas (23)–(27). It is assumed that , , and , and then . If and , and then ; if and , and then . It is assumed that , , , and , and then . It is assumed that and , and then . It is assumed that changes with time changes, and , the total time is 120, and then the test result of is shown as Figure 6.
3. Case Study
3.1. Data
This study uses China’s wind power as an example for simulation. On the one hand, wind power is currently a relatively mature industry with large installed capacity, low cost and mature technology in all renewable energy sources in China [24]. By the end of 2017, China’s wind power installed capacity ranked first in the world [25]. On the other hand, the wind power market is the first to start the implementation of RPS in China [3], and it has a certain representativeness. The initial time of the study was January 2016. The unit of time is month. The step size is one month. The total simulation time is 120 months (10 years).
According to Refs. [26,27], the current amount of FIT-enabled wind power enterprises is 150, that is, . We assume that the initial value of potential wind power enterprises in the market is 150, that is, . The initial value of the amount of wind power enterprises in other phases is 0, that is, , , and . According to Refs. [27,28], the decline rate of FIT subsidy of China’s wind power industry is 0.35% per month. According to Ref. [29],, , , and . All the initial values of TGC trading market is the same with Ref. [19], where, RPS unit fine is 1 yuan/kWh, is 0.1 yuan/kWh, the unit power generation of green power enterprise is 4.5 × 10⁶ kWh per month, the RPS quota growth rate is 0.0126 per month, and the electricity demand growth rate is 0.0025 per month. All the amounts and speeds in this study only represent numerical values, and there are no units for them.
3.2. Results and Analysis
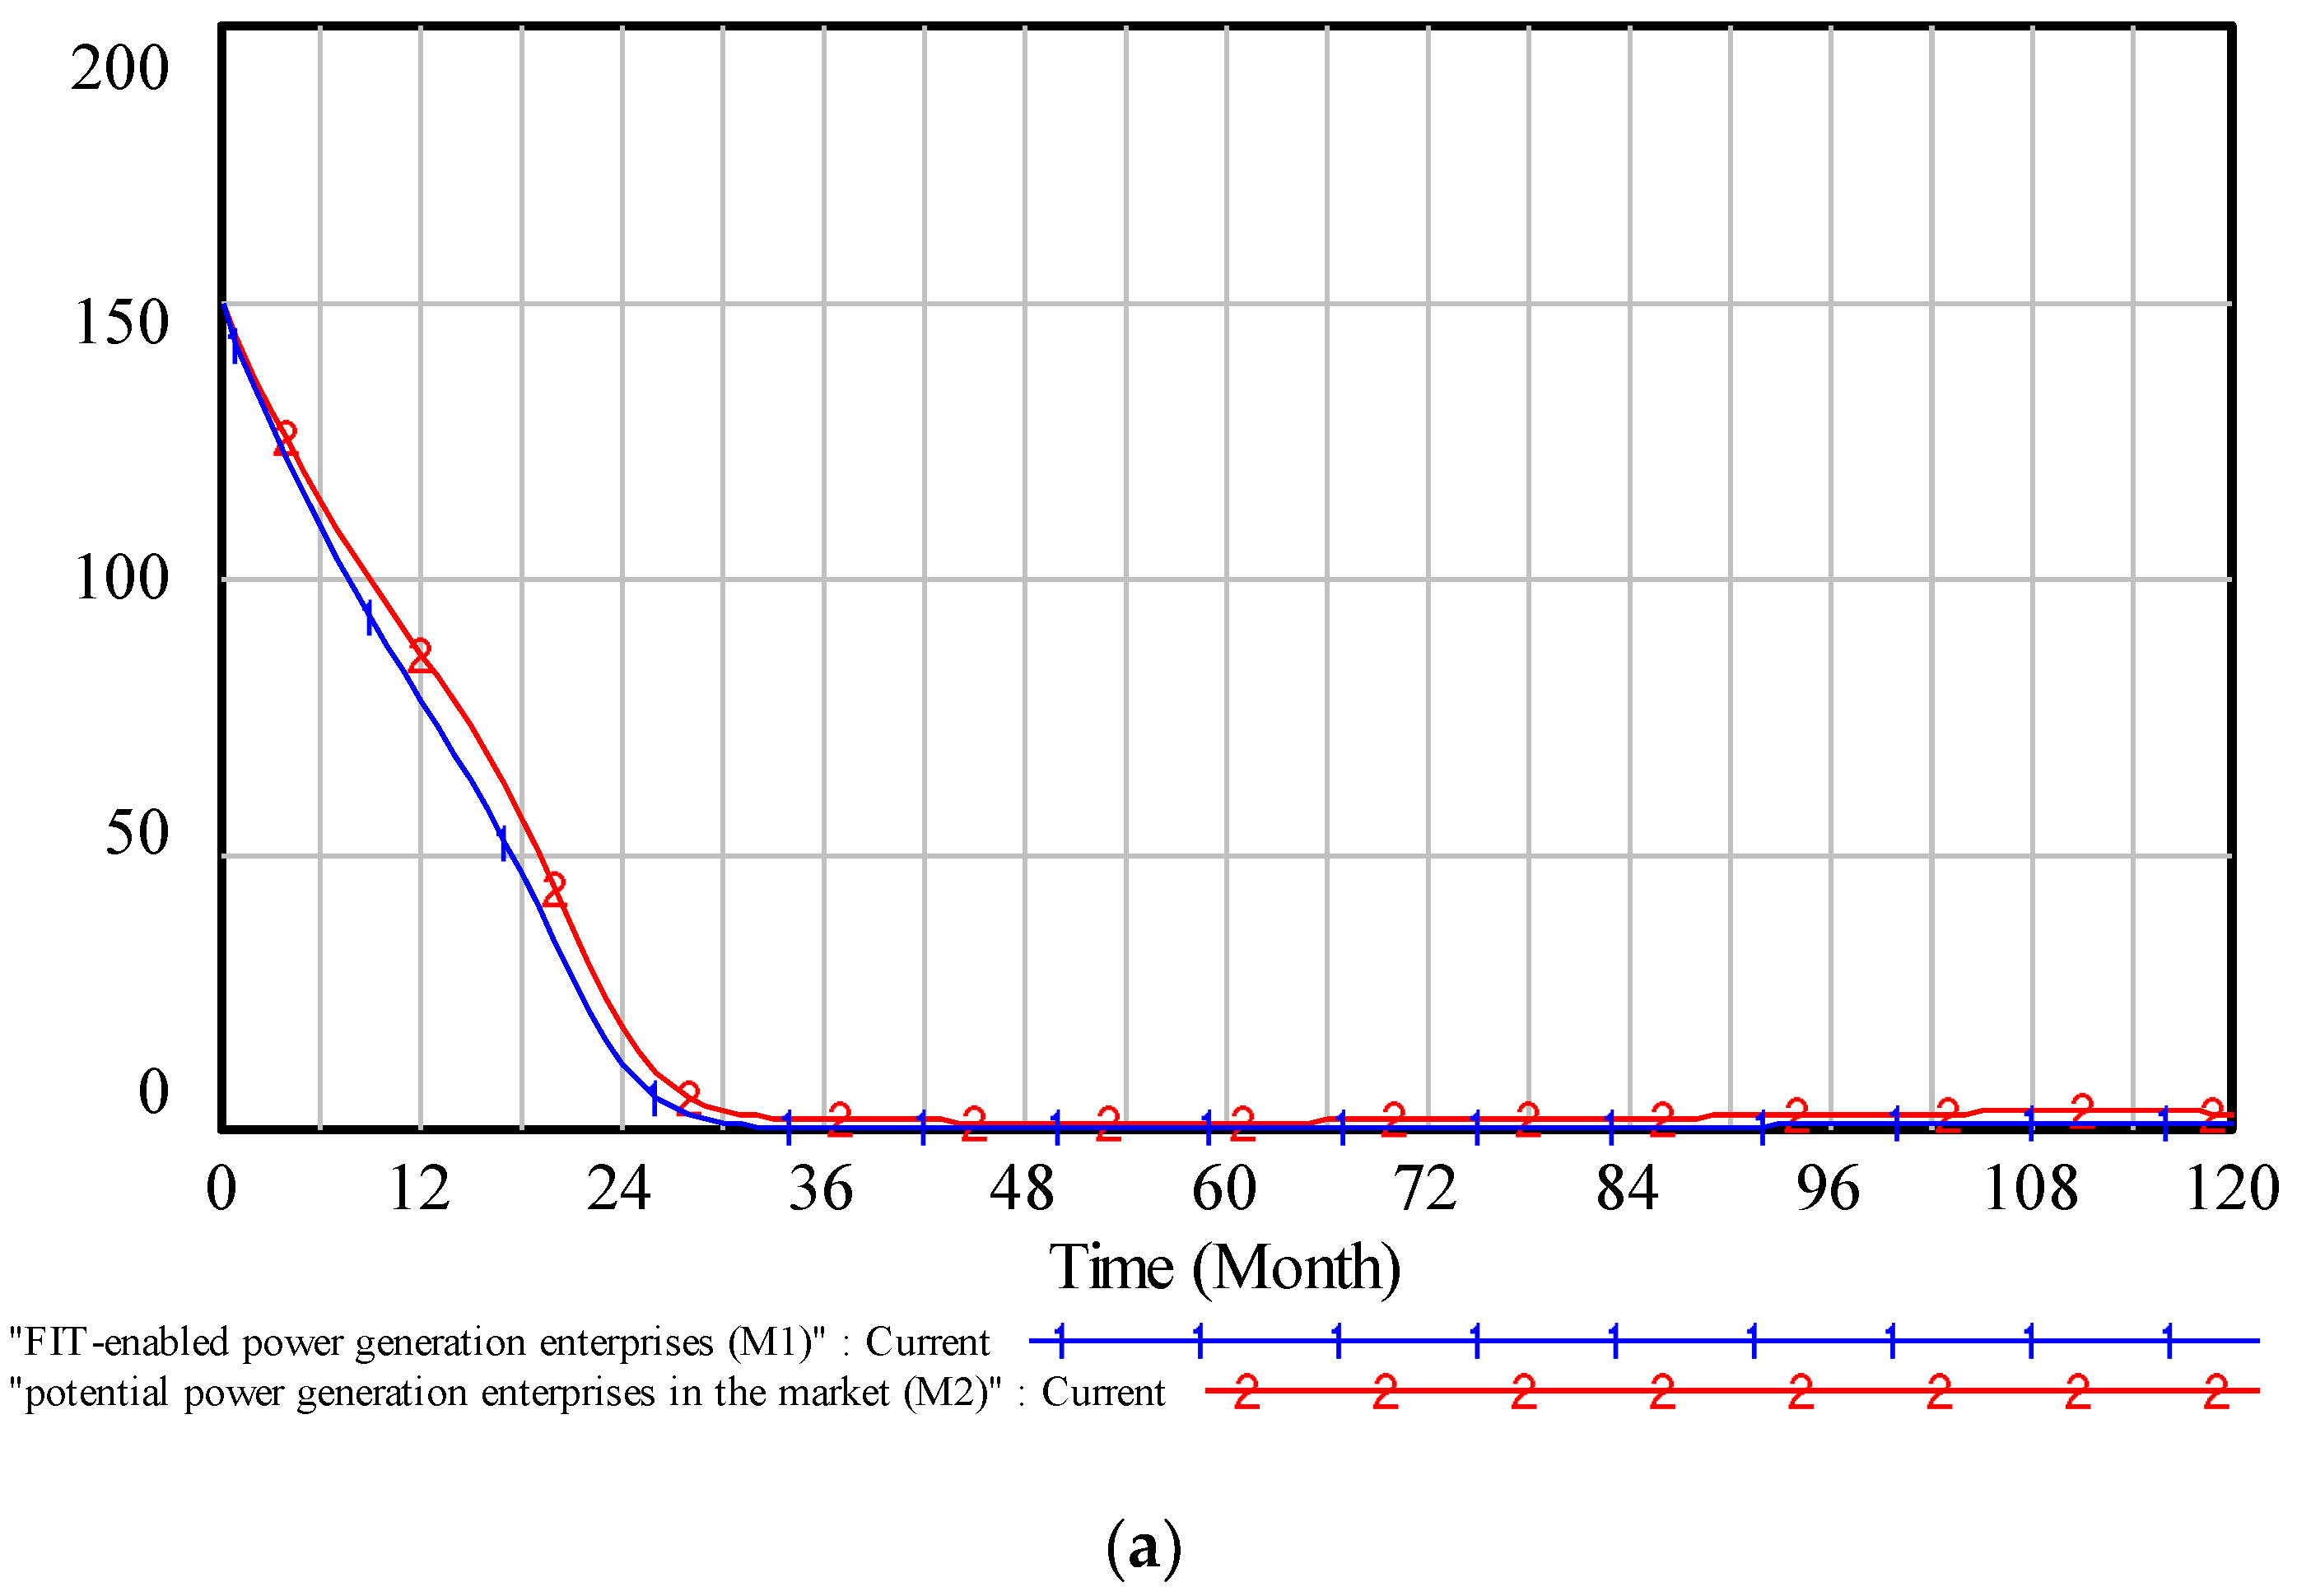
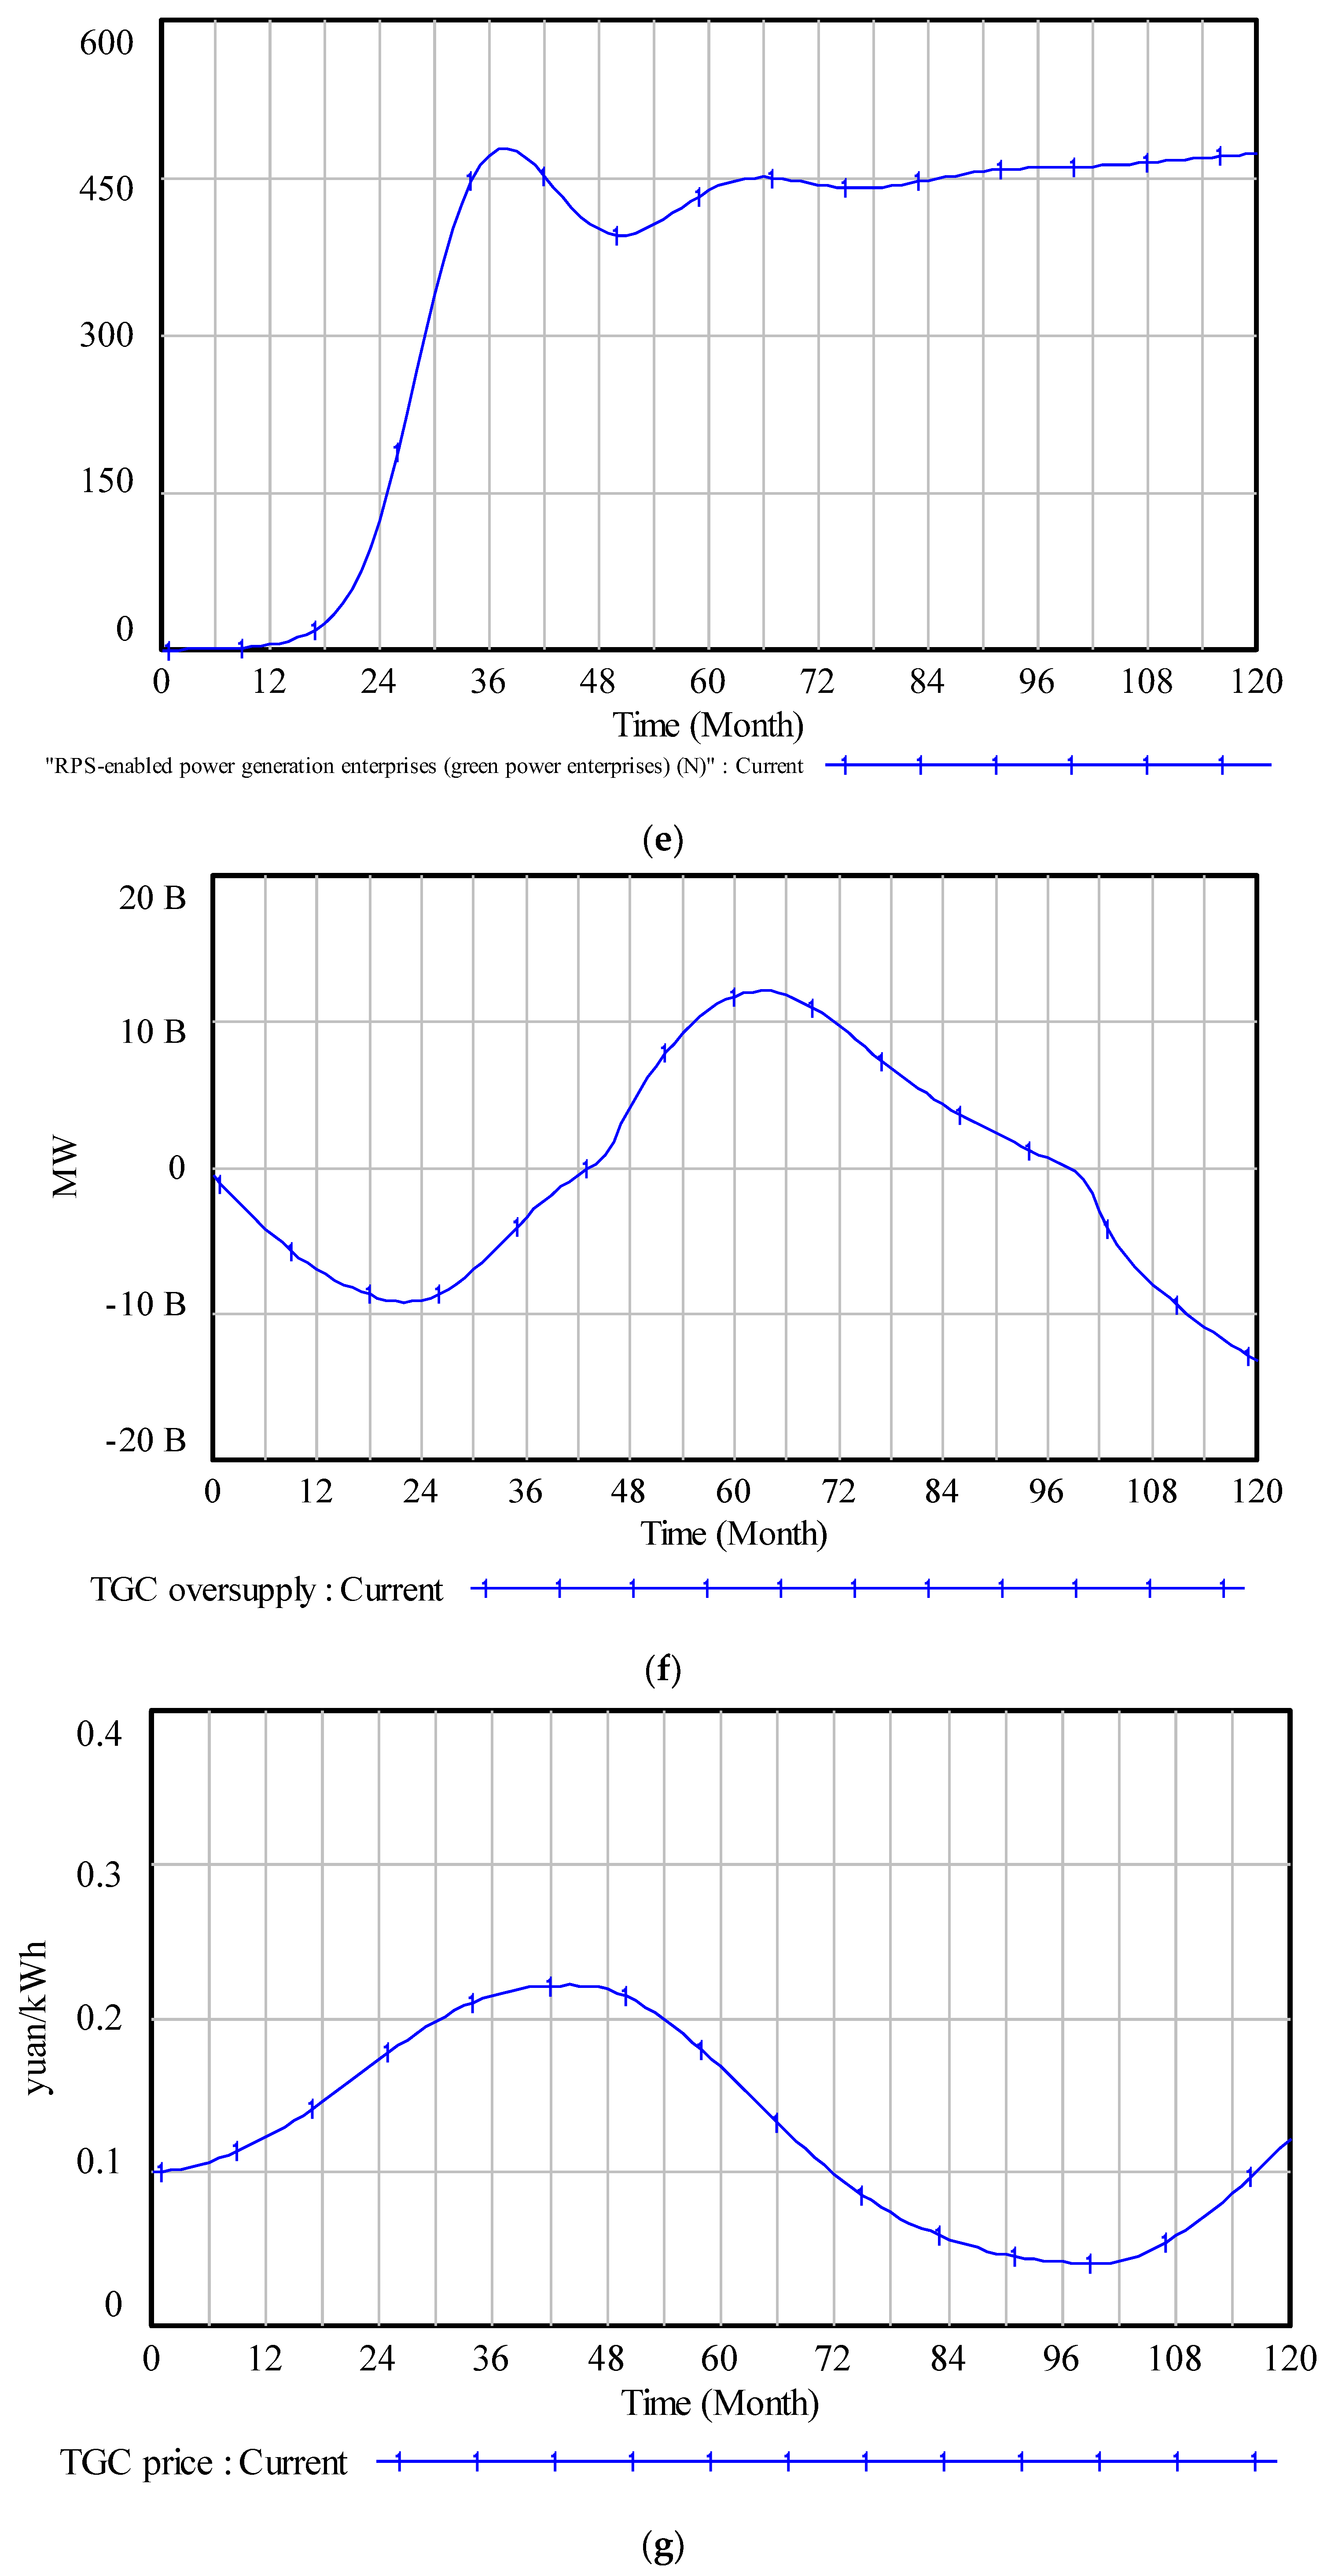
The simulation results are shown in Figure 7. By contrast, we find that the amount of potential wind power enterprises and speed of external influence in our simulation gradually decrease, and the speed of internal influence rises first and then declines, which are consistent with the results in Ref. [29]. The TGC price in our simulation rises first, then falls, and continues to fluctuate, which is consistent with the results in Refs. [18,19,20,21]. This proves that our simulation results are consistent with those of other scholars. In addition, we compare the simulation results of our study with China’s 13th Five-Year Plan data (Table 1), and find that the error is within a reasonable range (less than 5%), indicating that the model in this paper is reasonable.
We can see from Figure 7a that, the potential wind power enterprises in the market and the FIT-enabled power enterprises gradually decrease to 0, which means that FIT policy gradually evolves into RPS policy, and all the potential wind power enterprises and the FIT-enabled power enterprises eventually tend to implement RPS. We can see from Figure 7b–g that in the initial stage of RPS implementation (), TGC demand is greater than supply, and TGC oversupply is less than zero and gradually decreases, and TGC price gradually increases. This affects the speed of internal influence and , and at this time, wind power enterprises believe that trading TGC is profitable, thus, there are frequent interactions among power generation enterprises, and the success rate of interaction is high. and show a rapid upward trend, and and also increase. The green power enterprises grow slowly in the initial stage is due to the effects of time delays in the evolution of policies. With the orderly implementation of RPS (), the installed capacity of wind power gradually improves, and TGC supply increase. The TGC oversupply turns from falling to rising, and gradually becomes excess demand. At this time, TGC price begins to gradually decline after rising to the peak value of 0.22 yuan/kWh, resulting in the decrease of , , , and . Due to the time delays, the green power enterprises continue to grow rapidly, and then start to decline. As the growth of wind power installed capacity slows down and electricity demand continues to increase, TGC oversupply gradually declines again, and TGC price fluctuate accordingly. In the whole simulation time, the external influence and is continuously declining. Combined with internal and external influences, and continue to fluctuate and eventually stabilized, and the amount of green power enterprises fluctuates for a period of time and eventually grows steadily and slowly. (Note: B in the ordinate of Figure 7f is the counting unit automatically generated by Vensim software, and 1B = 1 × 10⁹).
4. Discussion
As mentioned above, the external influences in the model are mainly government behaviors, which are the decline of FIT subsidy and RPS unit fine. These two parameters are controllable by the government, and appear as exogenous variables in the model. The government can control the speed of RPS implementation by changing the decline rate of FIT subsidy and the size of RPS unit fine. Therefore, we will discuss the impact of changes in these two exogenous variables on policy evolution and the development of the TGC market in this section.
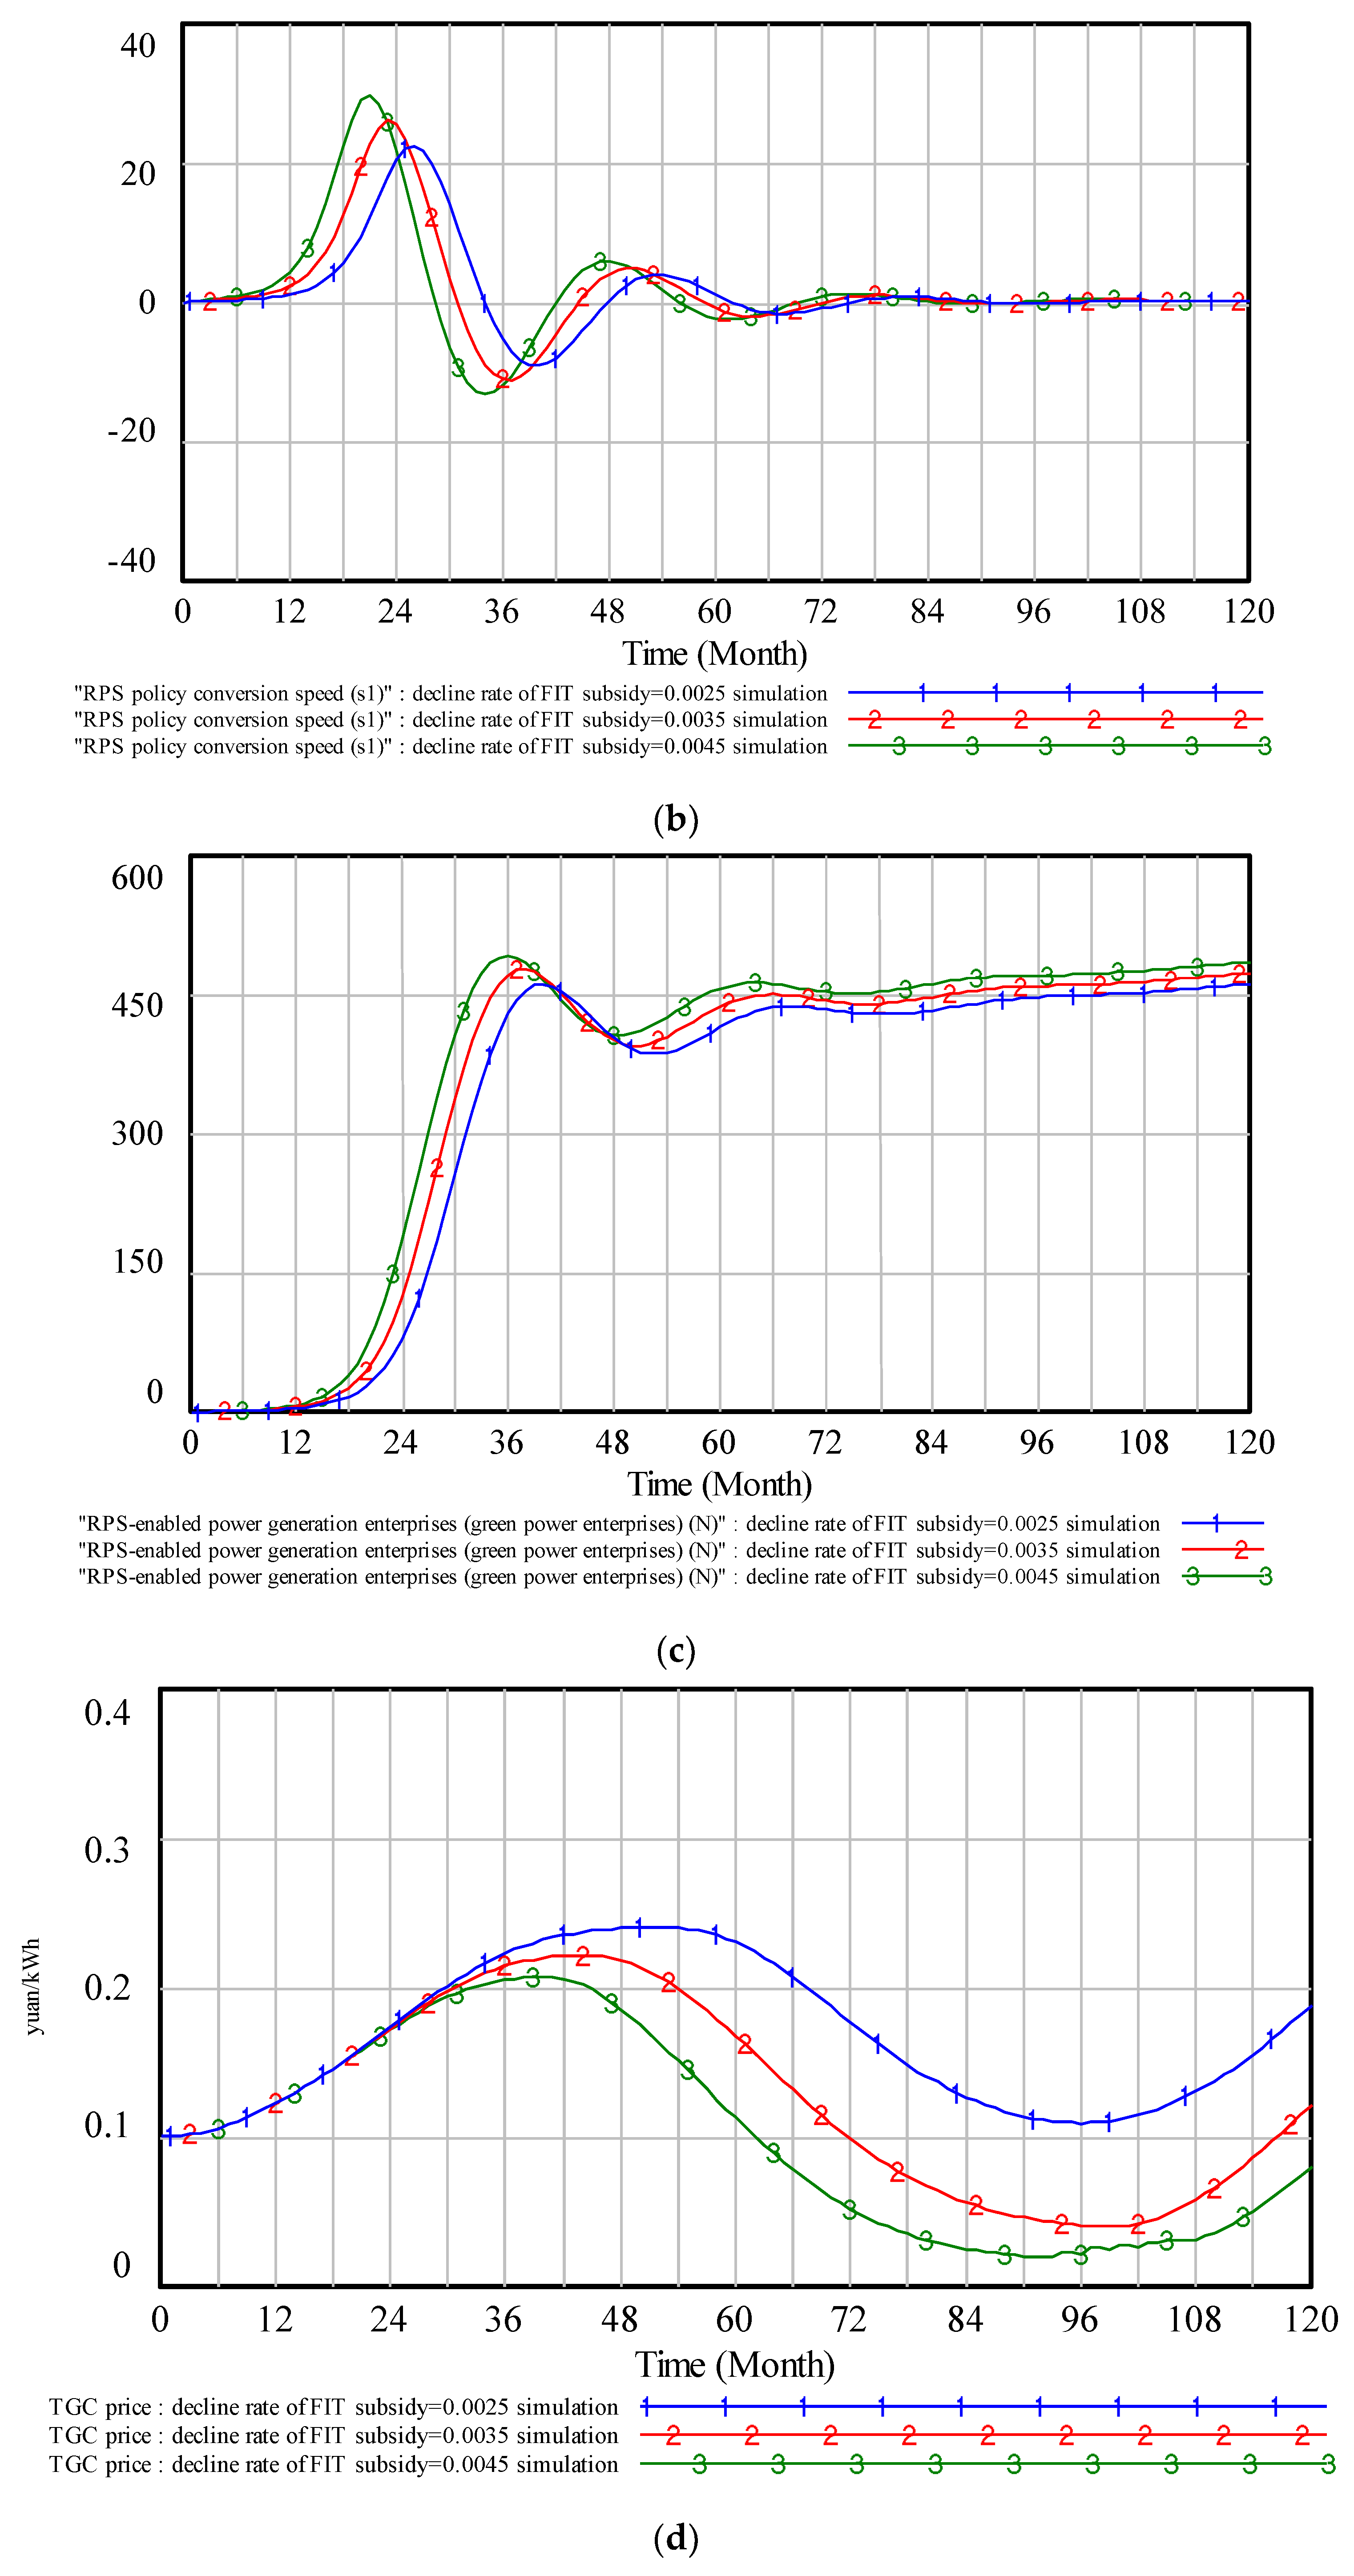
4.1. Decline Rate of FIT Subsidy
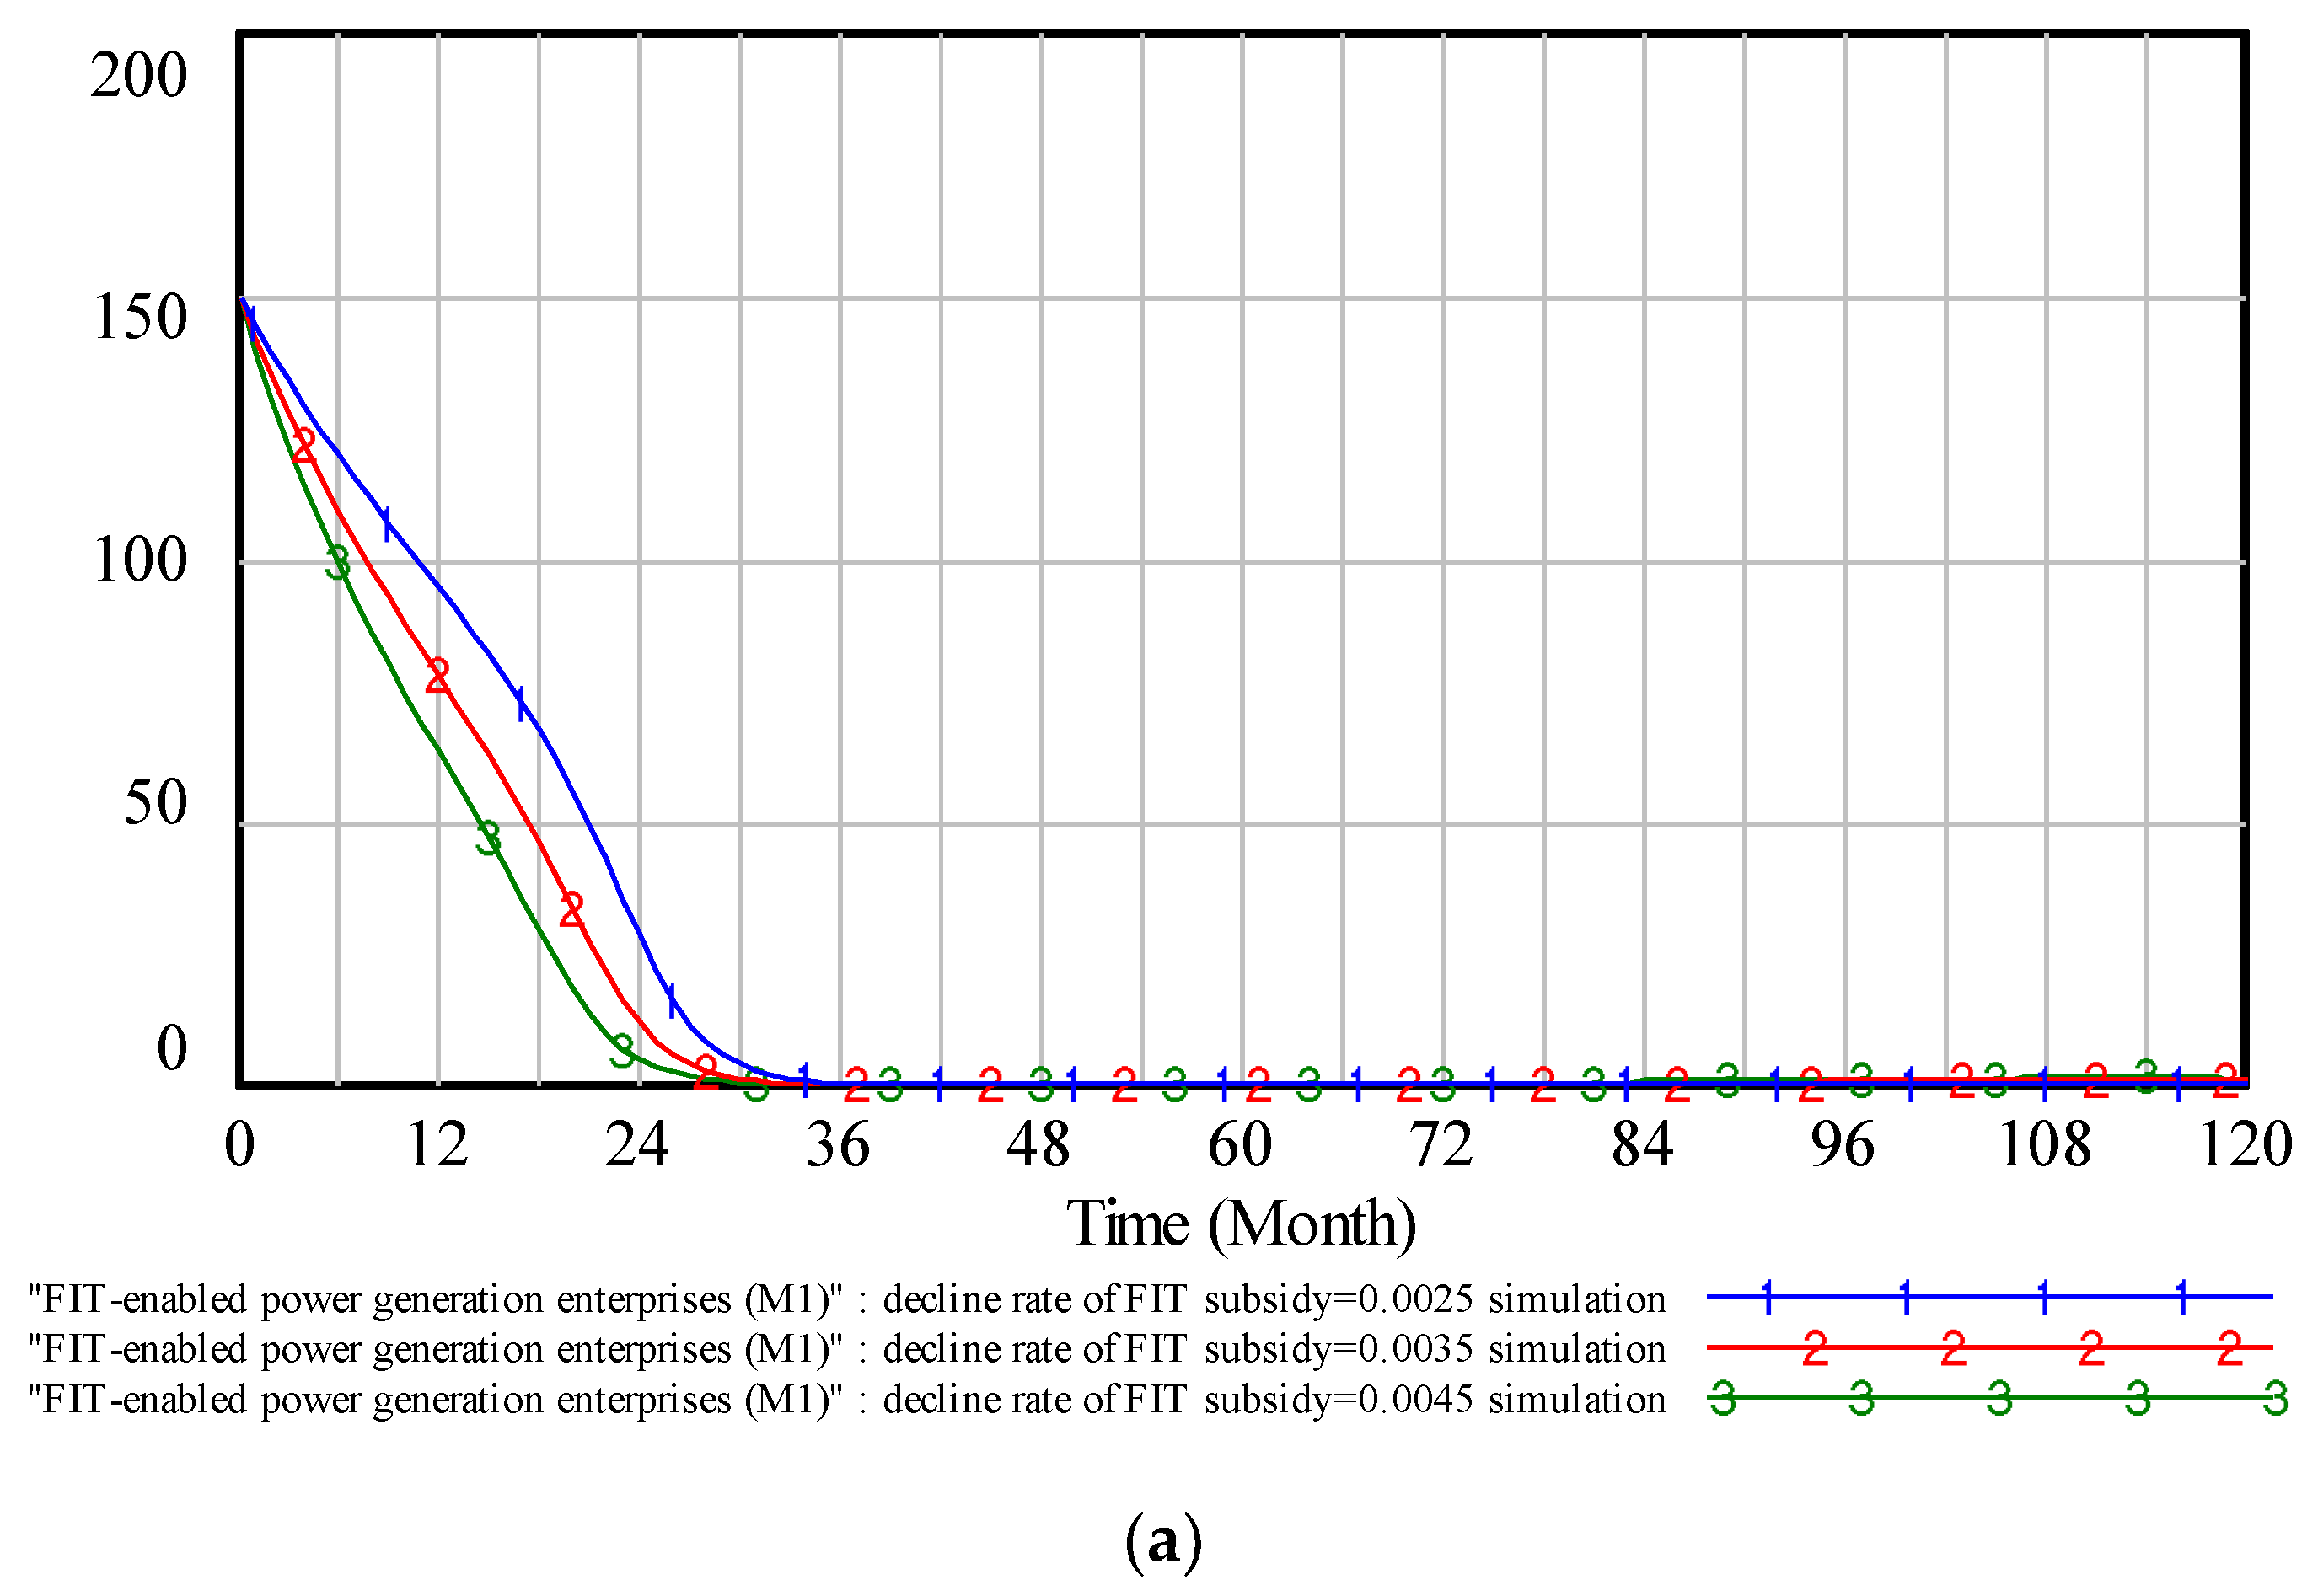
We set three scenarios of the decline rate of FIT subsidy as 0.25%, 0.35%, and 0.45% per month, respectively, and the results are shown as Figure 8. It shows that the higher the decline rate of FIT subsidy, the faster the amount of FIT-enabled wind power enterprises declines, and the faster the policy evolves (in Figure 8a); the greater the fluctuation of RPS policy conversion speed, indicating that the higher the utilization degree of knowledge flow, and the better the RPS policy evolution effect (in Figure 8b); the faster and more the green power enterprises grow (in Figure 8c); the greater the fluctuation of TGC price, and the more active the TGC trading market (in Figure 8d). Thus, it can be seen that increasing the decline rate of FIT subsidy contributes to the policies’ evolution, which can increase the amount of green power enterprises and the activity of the TGC trading market.
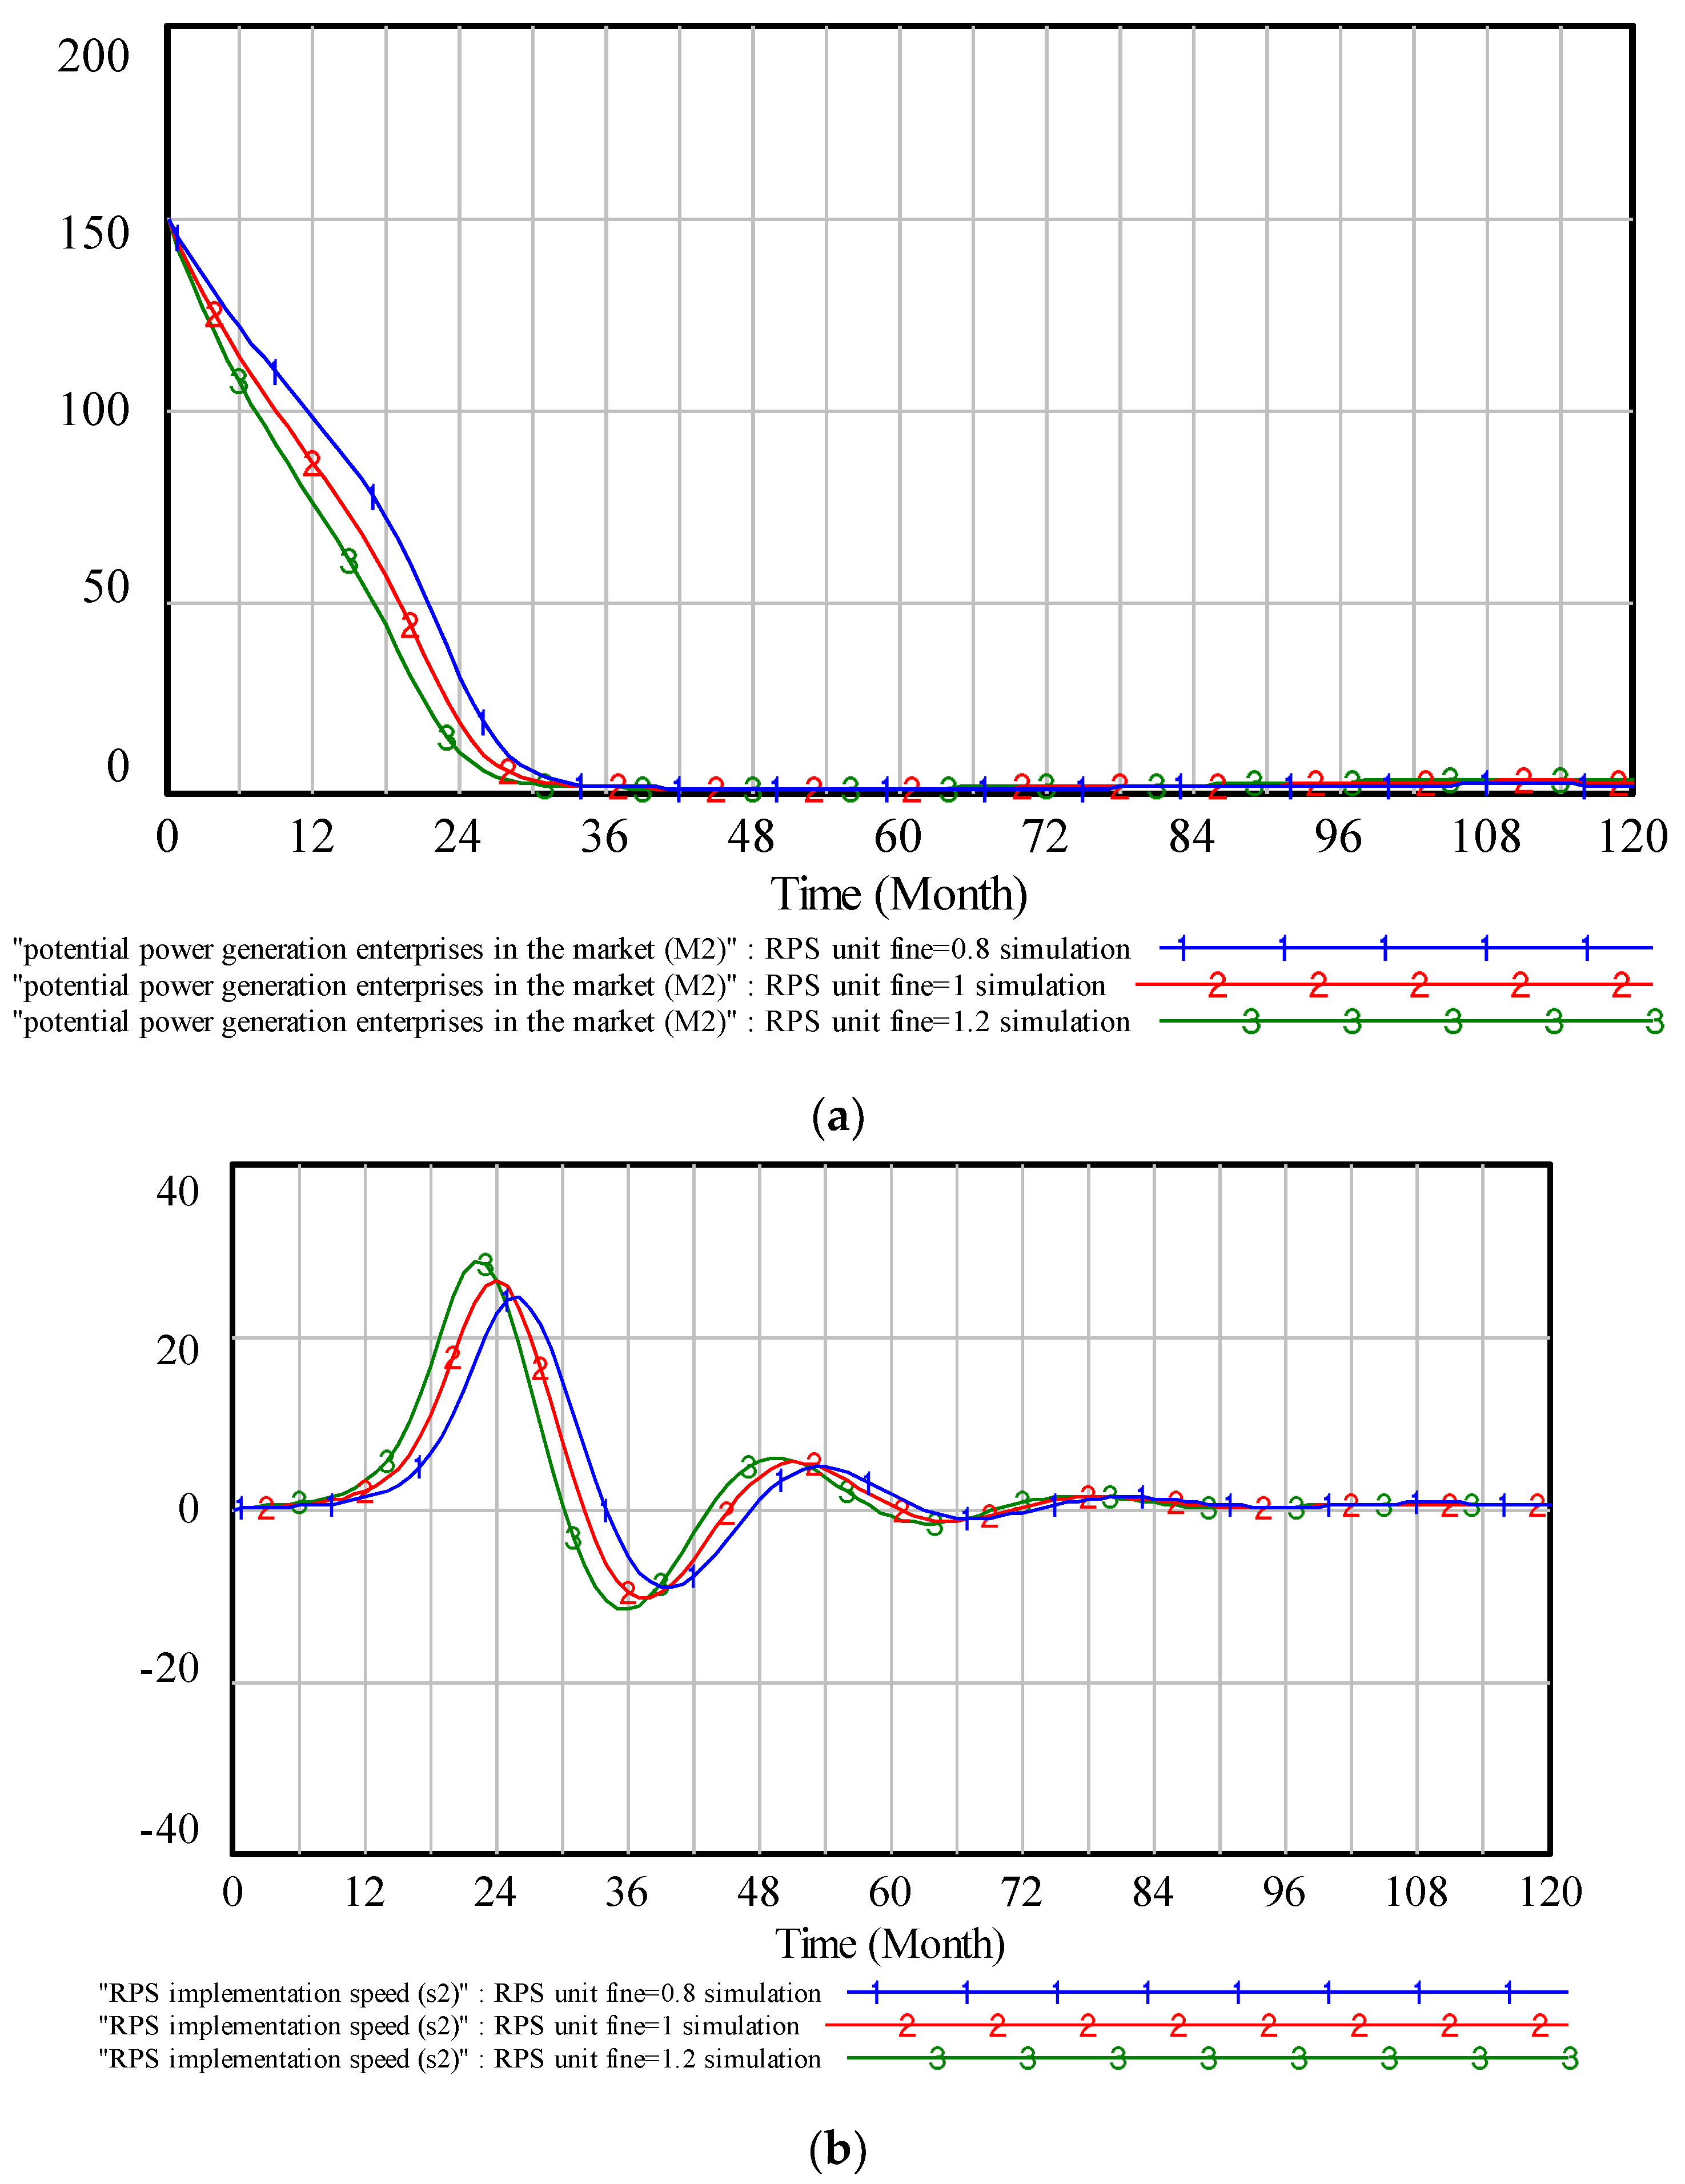
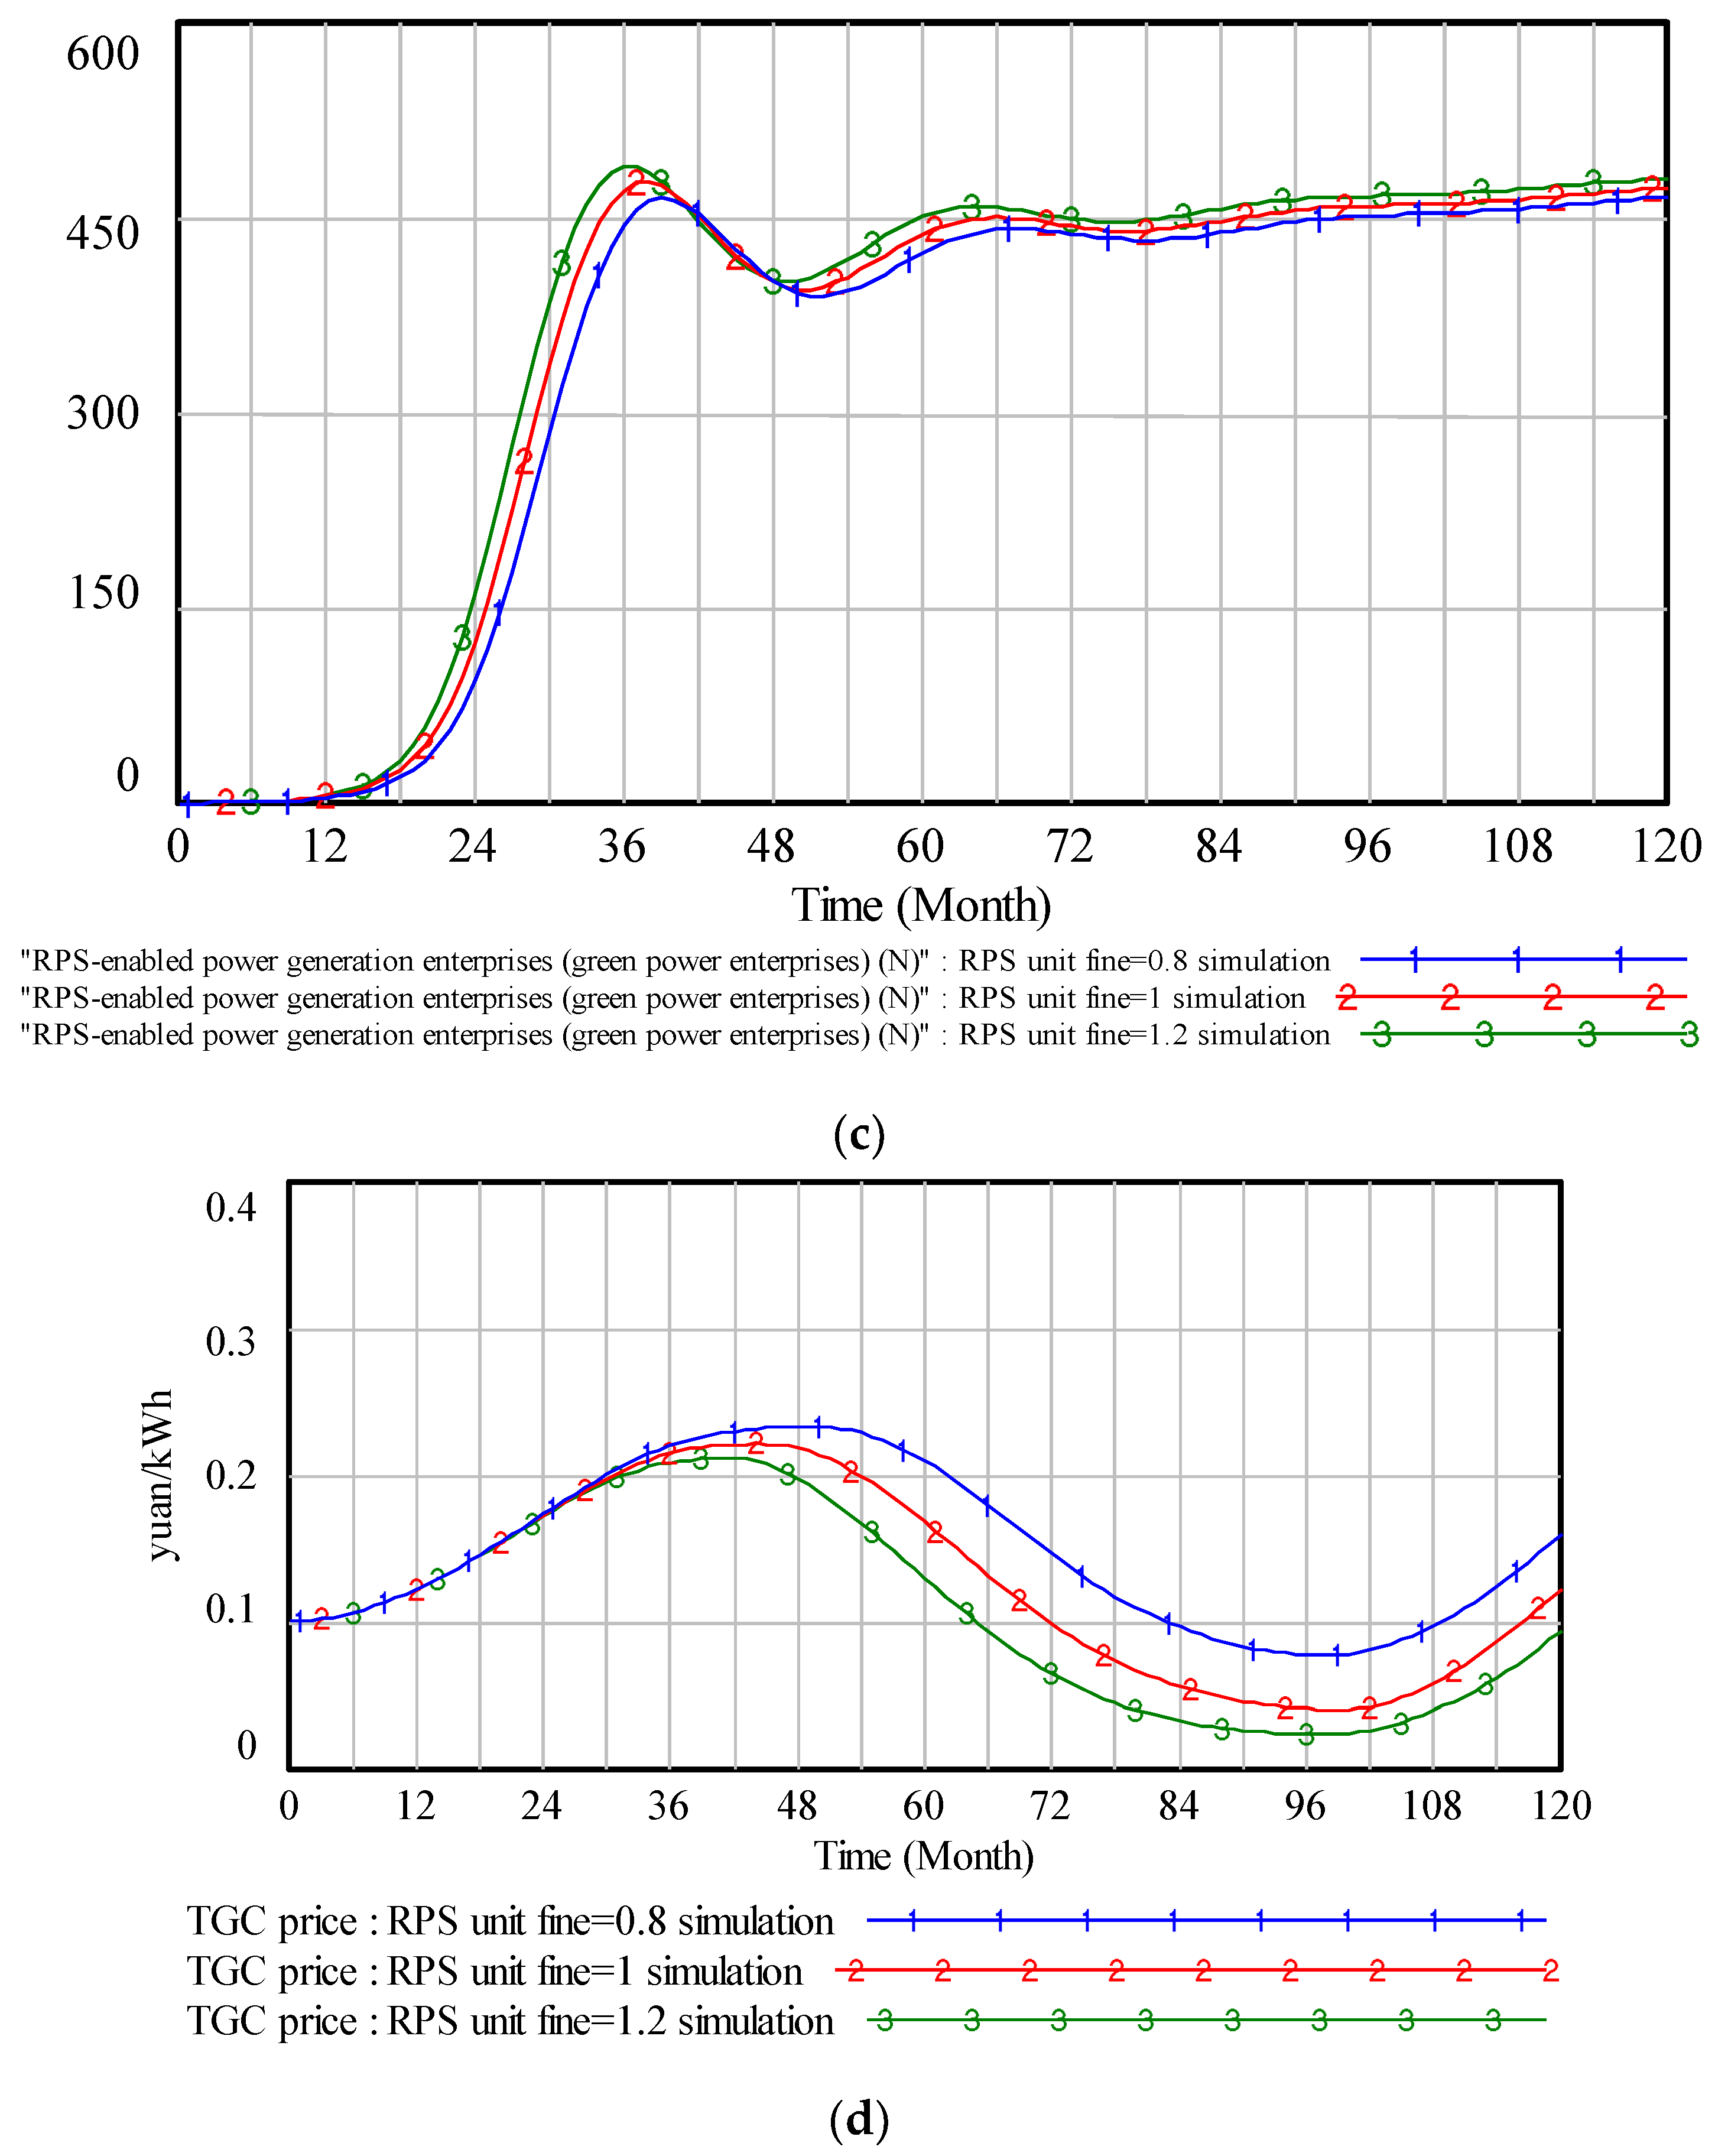
4.2. RPS Unit Fine
We set three scenarios of the RPS unit fine as 0.8 yuan/kWh, 1 yuan/kWh, and 1.2 yuan/kWh, respectively, and the results are shown as Figure 9. It shows that the higher the RPS unit fine, the faster the amount of potential wind power enterprises in the market declines, and the faster the policy evolves (in Figure 9a); the greater the fluctuation of RPS implementation speed, indicating that the higher the utilization degree of knowledge flow, and the better the RPS policy evolution effect (in Figure 9b); the faster and more the amount of green power enterprises grow (in Figure 9c); the greater the fluctuation of TGC price, and the more active the TGC trading market (in Figure 9d). Thus, it can be seen that increasing the RPS unit fine contributes to the policies’ evolution, which can increase the amount of green power enterprises and the activity of the TGC trading market.
5. Conclusions
This paper improves the traditional Bass model and proposes an evolutionary SD model of renewable energy price mechanism based on the improved Bass model. This study mainly improves the Bass model from the following aspects: (1) We divide the diffusion of technological innovation into three phases, and there is a delay effect between each phase. (2) We introduce the random probability of enterprises entering or leaving the market, and assume that the market potential fluctuates within a certain range. (3) We introduce the knowledge stock and consider its impact on the adoption speed of technological innovation. (4) We combine the original technology with the new technology to build the development system and consider the evolution process between them.
This paper mainly studies the evolution process of the policies from FIT to RPS, and takes China’s wind power industry as an example to simulate the model. The model and case study proposed in this paper are in good agreement with the Chinese government’s decisions. On the one hand, the external influences considered in our study are all mechanisms that the Chinese government is implementing or will implement. On the other hand, by comparing the simulation data of our study with the planning data of the Chinese government, it is found that the simulation results are in line with the development trend of China’s wind power in the future. The results show that, on the one hand, the power generation enterprises judge whether they are willing to implement RPS and communicate with each other by observing the fluctuation of TGC price, which forms the internal influence in the process of policy evolution. On the other hand, the government has an external influence on the evolution process by reducing FIT subsidies and setting RPS fine. Both of the internal and external influences affect the degree and speed of knowledge flow, thereby promoting policies’ evolution. The results of the evolution is that FIT can effectively and quickly evolve to RPS, and all the power generation enterprises will implement RPS, and the amount of green power enterprises eventually grows steadily and slowly. In addition, increasing the decline rate of FIT subsidy and RPS unit fine can effectively promote the evolution of RPS policy, and also improve the amount of green power enterprises and the activity of the TGC trading market.
This paper notes some limitations that are still to be improved upon. Many existing literature have studied the impact of FIT and RPS on the profits and risks of the renewable energy industry and produced different perspectives [30,31,32]. However, our study does not consider the role of profits and risks in the process of policies’ evolution. Future studies can comprehensively consider these factors, so that the research results will be more consistent with the actual situations.
Author Contributions
X.Z. was mainly responsible for the writing of the full text; Y.Z.Z. conceived and designed the experiments, and wrote the first half of the paper; Y.L. wrote the second half of the paper, and provided financial support.
Acknowledgments
This paper is supported by the Beijing Municipal Social Science Foundation (No. 16JDYJB031), the Fundamental Research Funds for the Central Universities (No. 2018ZD14), and the 111 Project (No. B18021).
Conflicts of Interest
The authors declare no conflicts of interest.
References
- Boomsma, T.K.; Linnerud, K. Market and policy risk under different renewable electricity support schemes. Energy 2015, 89, 435–448. [Google Scholar] [CrossRef]
- Kwon, T.H. Rent and rent-seeking in renewable energy support policies: Feed-in tariff vs. renewable portfolio standard. Renew. Sustain. Energy Rev. 2015, 44, 676–681. [Google Scholar] [CrossRef]
- National Development and Reform Commission. Notice on Trial Implementation of Renewable Energy Tradable Green Certificate Issuance and Voluntary Subscription Trading System; National Development and Reform Commission: Beijing, China, 2017. Available online: http://www.ndrc.gov.cn/gzdt/201702/t20170203_837121.html (accessed on 18 January 2017).
- Dong, Y.; Shimada, K. Evolution from the renewable portfolio standards to feed-in tariff for the deployment of renewable energy in Japan. Renew. Energy 2017, 107, 590–596. [Google Scholar] [CrossRef]
- Dong, C.G. Feed-in tariff vs. renewable portfolio standard: An empirical test of their relative effectiveness in promoting wind capacity development. Energy Policy 2012, 42, 476–485. [Google Scholar] [CrossRef]
- Ming, Z.; Liu, X.; Na, L.; Song, X. Overall review of renewable energy tariff policy in China: Evolution, implementation, problems and countermeasures. Renew. Sustain. Energy Rev. 2013, 25, 260–271. [Google Scholar] [CrossRef]
- Pyrgou, A.; Kylili, A.; Fokaides, P.A. The future of the Feed-in Tariff (FiT) scheme in Europe: The case of photovoltaics. Energy Policy 2016, 95, 94–102. [Google Scholar] [CrossRef]
- Schallenberg-Rodriguez, J. Renewable electricity support systems: Are feed-in systems taking the lead? Renew. Sustain. Energy Rev. 2017, 76, 1422–1439. [Google Scholar] [CrossRef]
- Aquila, G.; Pamplona, E.D.O.; Queiroz, A.R.D.; Junior, R.P.; Fonseca, M.N. An overview of incentive policies for the expansion of renewable energy generation in electricity power systems and the Brazilian experience. Renew. Sustain. Energy Rev. 2017, 70, 1090–1098. [Google Scholar] [CrossRef]
- Xu, S.C.; He, Z.X.; Gao, C. Analysis of the wind power tariff policy in China: Evolution, problems, and countermeasures. Fresenius Environ. Bull. 2018, 27, 898–909. [Google Scholar]
- Shahnazari, M.; McHugh, A.; Maybee, B.; Whale, J. Overlapping carbon pricing and renewable support schemes under political uncertainty: Global lessons from an Australian case study. Appl. Energy 2017, 200, 237–248. [Google Scholar] [CrossRef]
- Chang, R.D.; Soebarto, V.; Zhao, Z.Y.; Zillante, G. Facilitating the transition to sustainable construction: China’s policies. J. Clean. Prod. 2016, 131, 534–544. [Google Scholar] [CrossRef]
- Zhao, X.; Zhang, Y.; Liang, J.; Li, Y.; Jia, R.; Wang, L. The Sustainable Development of the Economic-Energy-Environment (3E) System under the Carbon Trading (CT) Mechanism: A. Chinese Case. Sustainability 2018, 10, 98. [Google Scholar] [CrossRef]
- Kamarzaman, N.A.; Tan, C.W. A comprehensive review of maximum power point tracking algorithms for photovoltaic systems. Renew. Sustain. Energy Rev. 2014, 37, 585–598. [Google Scholar] [CrossRef]
- Lucia, B.; Mauricio, U.M. Diffusion of photovoltaic technology in Germany: A sustainable success or an illusion driven by guaranteed feed-in tariffs? Energy 2018, 150, 289–298. [Google Scholar] [CrossRef]
- Dos Santos, L.L.C.; Canha, L.N.; Bernardon, D.P. Projection of the diffusion of photovoltaic systems in residential low voltage consumers. Renew. Energy 2018, 116, 384–401. [Google Scholar] [CrossRef]
- Benvenutti, L.M.M.; Ribeiro, A.B.; Mauricio, U.M. Long term diffusion dynamics of alternative fuel vehicles in Brazil. J. Clean. Prod. 2017, 164, 1571–1585. [Google Scholar] [CrossRef]
- Zhang, Y.Z.; Zhao, X.G.; Ren, L.Z.; Zuo, Y. The development of the renewable energy power industry under feed-in tariff and renewable portfolio standard: A case study of China’s wind power industry. J. Clean. Prod. 2017, 168, 1262–1276. [Google Scholar] [CrossRef]
- Zhao, X.G.; Zhang, Y.Z.; Ren, L.Z.; Zuo, Y.; Wu, Z.G. The policy effects of feed-in tariff and renewable portfolio standard: A case study of China’s waste incineration power industry. Waste Manag. 2017, 68, 711–723. [Google Scholar]
- Zhang, Y.; Zhao, X.; Zuo, Y.; Ren, L.; Wang, L. The Development of the Renewable Energy Power Industry under Feed-In Tariff and Renewable Portfolio Standard: A Case Study of China’s Photovoltaic Power Industry. Sustainability 2017, 9, 532. [Google Scholar] [CrossRef]
- Zhang, Y.Z.; Zhao, X.G.; Ren, L.Z.; Liang, J.; Liu, P.K. The development of China’s biomass power industry under feed-in tariff and renewable portfolio standard: A system dynamics analysis. Energy 2017, 139, 947–961. [Google Scholar]
- Ford, A.; Vogstad, K.; Flynn, H. Simulating price patterns for tradable green certificates to promote electricity generation from wind. Energy Policy 2007, 35, 91–111. [Google Scholar] [CrossRef]
- Zhao, X.; Feng, T.; Yang, Y. Impacting mechanism of renewable portfolio standard on China’s power source and its effect. Power Syst. Technol. 2014, 38, 974–979. [Google Scholar]
- Zhang, D.; Wang, J.; Lin, Y.; Huang, C.; Yang, J.; Huang, B.; Li, W. Present situation and future prospect of renewable energy in China. Renew. Sustain. Energy Rev. 2017, 76, 865–871. [Google Scholar] [CrossRef]
- BJX Net. China’s Wind Power Installed Capacity Ranked First in the World in 2017, 2018. Available online: http://news.bjx.com.cn/html/20180214/881099.shtml (accessed on 14 February 2018).
- BJX Net. China Wind Power Company’s Ranking and Market Share in 2017, 2018. Available online: http://news.bjx.com.cn/html/20180403/889653.shtml (accessed on 3 April 2018).
- Sohu Net. China Wind Power’s Development in 2018, 2018. Available online: www.sohu.com/a/216306530_99951840 (accessed on 12 January 2018).
- BJX Net. The On-Grid Price of China’s Wind Power from 2016 to 2020, 2015. Available online: http://news.bjx.com.cn/html/20151030/676493.shtml (accessed on 30 October 2015).
- Yang, G.; Ma, Z.; Chai, M. The system dynamics model and simulation based on improved Bass model. Stat. Decis. 2013, 13, 21–24. [Google Scholar]
- Choi, G.; Huh, S.-Y.; Heo, E.; Lee, C.-Y. Prices versus quantities: Comparing economic efficiency of feed-in tariff and renewable portfolio standard in promoting renewable electricity generation. Energy Policy 2018, 113, 239–248. [Google Scholar] [CrossRef]
- García-Álvarez, M.T.; Cabeza-García, L.; Soares, I. Analysis of the promotion of onshore wind energy in the EU: Feed-in tariff or renewable portfolio standard? Renew. Energy 2017, 111, 256–264. [Google Scholar] [CrossRef]
- Ritzenhofen, I.; Birge, J.R.; Spinler, S. The structural impact of renewable portfolio standards and feed-in tariffs on electricity markets. Eur. J. Oper. Res. 2016, 255, 224–242. [Google Scholar] [CrossRef]
Figure 1.
The renewable energy price policies in typical countries and regions.

Figure 2.
The logic framework of the improved Bass model.

Figure 3.
The stock and flow diagram (SFD) of evolution process from feed-in tariff (FIT) to renewable portfolio standard (RPS).
Figure 3.
The stock and flow diagram (SFD) of evolution process from feed-in tariff (FIT) to renewable portfolio standard (RPS).

Figure 4.
The rest results of and .

Figure 5.
The rest results of , , and .

Figure 6.
The test result of .

Figure 7.
The simulation results of policies’ evolution. (a) The change of and; (b) The change of and ; (c) The change of and ; (d) The change of and ; (e) The change of ; (f) The change of TGC oversupply; (g) The change of TGC price.
Figure 7.
The simulation results of policies’ evolution. (a) The change of and; (b) The change of and ; (c) The change of and ; (d) The change of and ; (e) The change of ; (f) The change of TGC oversupply; (g) The change of TGC price.


Figure 8.
The simulation results under various decline rates of FIT subsidy.(a) The change of under various decline rates of FIT subsidy; (b) The change of under various decline rates of FIT subsidy; (c) The change of under various decline rates of FIT subsidy; (d) The change of TGC price under various decline rates of FIT subsidy.


Figure 9.
The simulation results under various RPS unit fines. (a) The change of under various RPS unit fines; (b) The change of under various RPS unit fines; (c) The change of under various RPS unit fines; (d) The change of TGC price under various RPS unit fines.
Figure 9.
The simulation results under various RPS unit fines. (a) The change of under various RPS unit fines; (b) The change of under various RPS unit fines; (c) The change of under various RPS unit fines; (d) The change of TGC price under various RPS unit fines.


Table 1.
The comparison of simulation results with planning data.
| 13th Five-Year Plan | Simulation Results | Error | |
|---|---|---|---|
| The installed capacity of wind power | 2.1 × 10⁸ kW | 2.03 × 10⁸ kW | 3.33% |
| The power generation of wind power | 4.2 × 10¹¹ kWh | 4.01 × 10¹¹ kWh | 4.52% |
© 2018 by the authors. Licensee MDPI, Basel, Switzerland. This article is an open access article distributed under the terms and conditions of the Creative Commons Attribution (CC BY) license (http://creativecommons.org/licenses/by/4.0/).
Share and Cite
MDPI and ACS Style
Zhao, X.-g.; Zhang, Y.-z.; Li, Y.-b. The Evolution of Renewable Energy Price Policies Based on Improved Bass Model: A System Dynamics (SD) Analysis. Sustainability 2018, 10, 1748. https://doi.org/10.3390/su10061748
AMA Style
Zhao X-g, Zhang Y-z, Li Y-b. The Evolution of Renewable Energy Price Policies Based on Improved Bass Model: A System Dynamics (SD) Analysis. Sustainability. 2018; 10(6):1748. https://doi.org/10.3390/su10061748
Chicago/Turabian StyleZhao, Xin-gang, Yu-zhuo Zhang, and Yan-bin Li. 2018. "The Evolution of Renewable Energy Price Policies Based on Improved Bass Model: A System Dynamics (SD) Analysis" Sustainability 10, no. 6: 1748. https://doi.org/10.3390/su10061748
Note that from the first issue of 2016, this journal uses article numbers instead of page numbers. See further details here.