Achieving Turkey’s INDC Target: Assessments of NCCAP and INDC Documents and Proposing Conceivable Policies


1
Department of Economics, Izmir University of Economics, Sakarya Caddesi, No: 156, Balçova, İzmir 35330, Turkey
2
Department of Economics, Ege University, Bornova, İzmir 35040, Turkey
*
Author to whom correspondence should be addressed.
Sustainability 2018, 10(6), 1722; https://doi.org/10.3390/su10061722
Submission received: 22 March 2018
/
Revised: 14 May 2018
/
Accepted: 21 May 2018
/
Published: 24 May 2018
Abstract
:In 2015, Turkey submitted its Intended Nationally Determined Contribution (INDC) to the United Nations Framework on Climate Change Convention (UNFCCC) before the Paris Conference of the Parties (COP 21), expressing its intention to decrease emissions level at a rate of 21% from business as usual. This emissions reduction target is important as it is the first one for Turkey. However, Turkey faces unemployment problems and needs to sustain its growth. In this study, an Environmentally Extended Social Accounting Matrix (SAM), based on 2012 Input–Output data, was created, emissions reduction potentials of the National Climate Change Action Plan (NCCAP) together with the INDC were calculated, and alternative policies to reduce emissions to the target level and to boost the economy were proposed separately. The study finds that both the preparation and implementation of the previous national documents are problematic, and that Turkey was not meticulous about implementation of the climate mitigation policies in the previous national documents. The study also finds that reaching the emissions target with the INDC policies seems impossible and more conceivable policies are needed, and recommends that the INDC target and document itself should be revised substantially.
1. Introduction
The year 2015 was a milestone in climate change actions, as 196 Parties came together, 147 Parties submitted 119 Intended Nationally Determined Contributions (INDCs) (28 EU member countries submitted one aggregate INDC) which covered 86% of global emissions [1,2]. The Paris Agreement also was signed with the objective to keep the global temperature below 1.5 or 2 °C above pre-industrial levels, recognizing that this would significantly reduce the risks and impacts of climate change [3]. INDCs were adopted as the national plans solely addressing climate change mitigation after 2020 and were submitted prior to the Paris Conference of the Parties (COP 21). Each party will continue to prepare, communicate and submit its Nationally Determined Contribution (NDC) at the end of every five-year period as the Paris Agreement requires [3]. The agreement is binding as monitoring and reporting by technical experts is required but flexible as each Party can establish its targets and modes of implementation [4]. Furthermore, both Annex 1 and non-Annex 1 countries have to prepare the NDCs and are eligible for stock taking of emissions and expert reviews as required in the agreement [3]. Although the INDCs vary in structure and content, and are insufficient to reverse the upward trend of global emissions by 2025 or 2030 and to keep the global temperature below the so-called 2 °C limit; the agreement indicates a significant increase in the number of countries taking climate actions, including developing countries. The agreement also promises hope for broad adoption with flexibility in determining commitments and with the requirement of regular reporting and external monitoring, even though it does not include any enforcement mechanism. In contrast to the Kyoto period, the INDCs created a growing awareness among developing countries about the need to take an active role in mitigation.
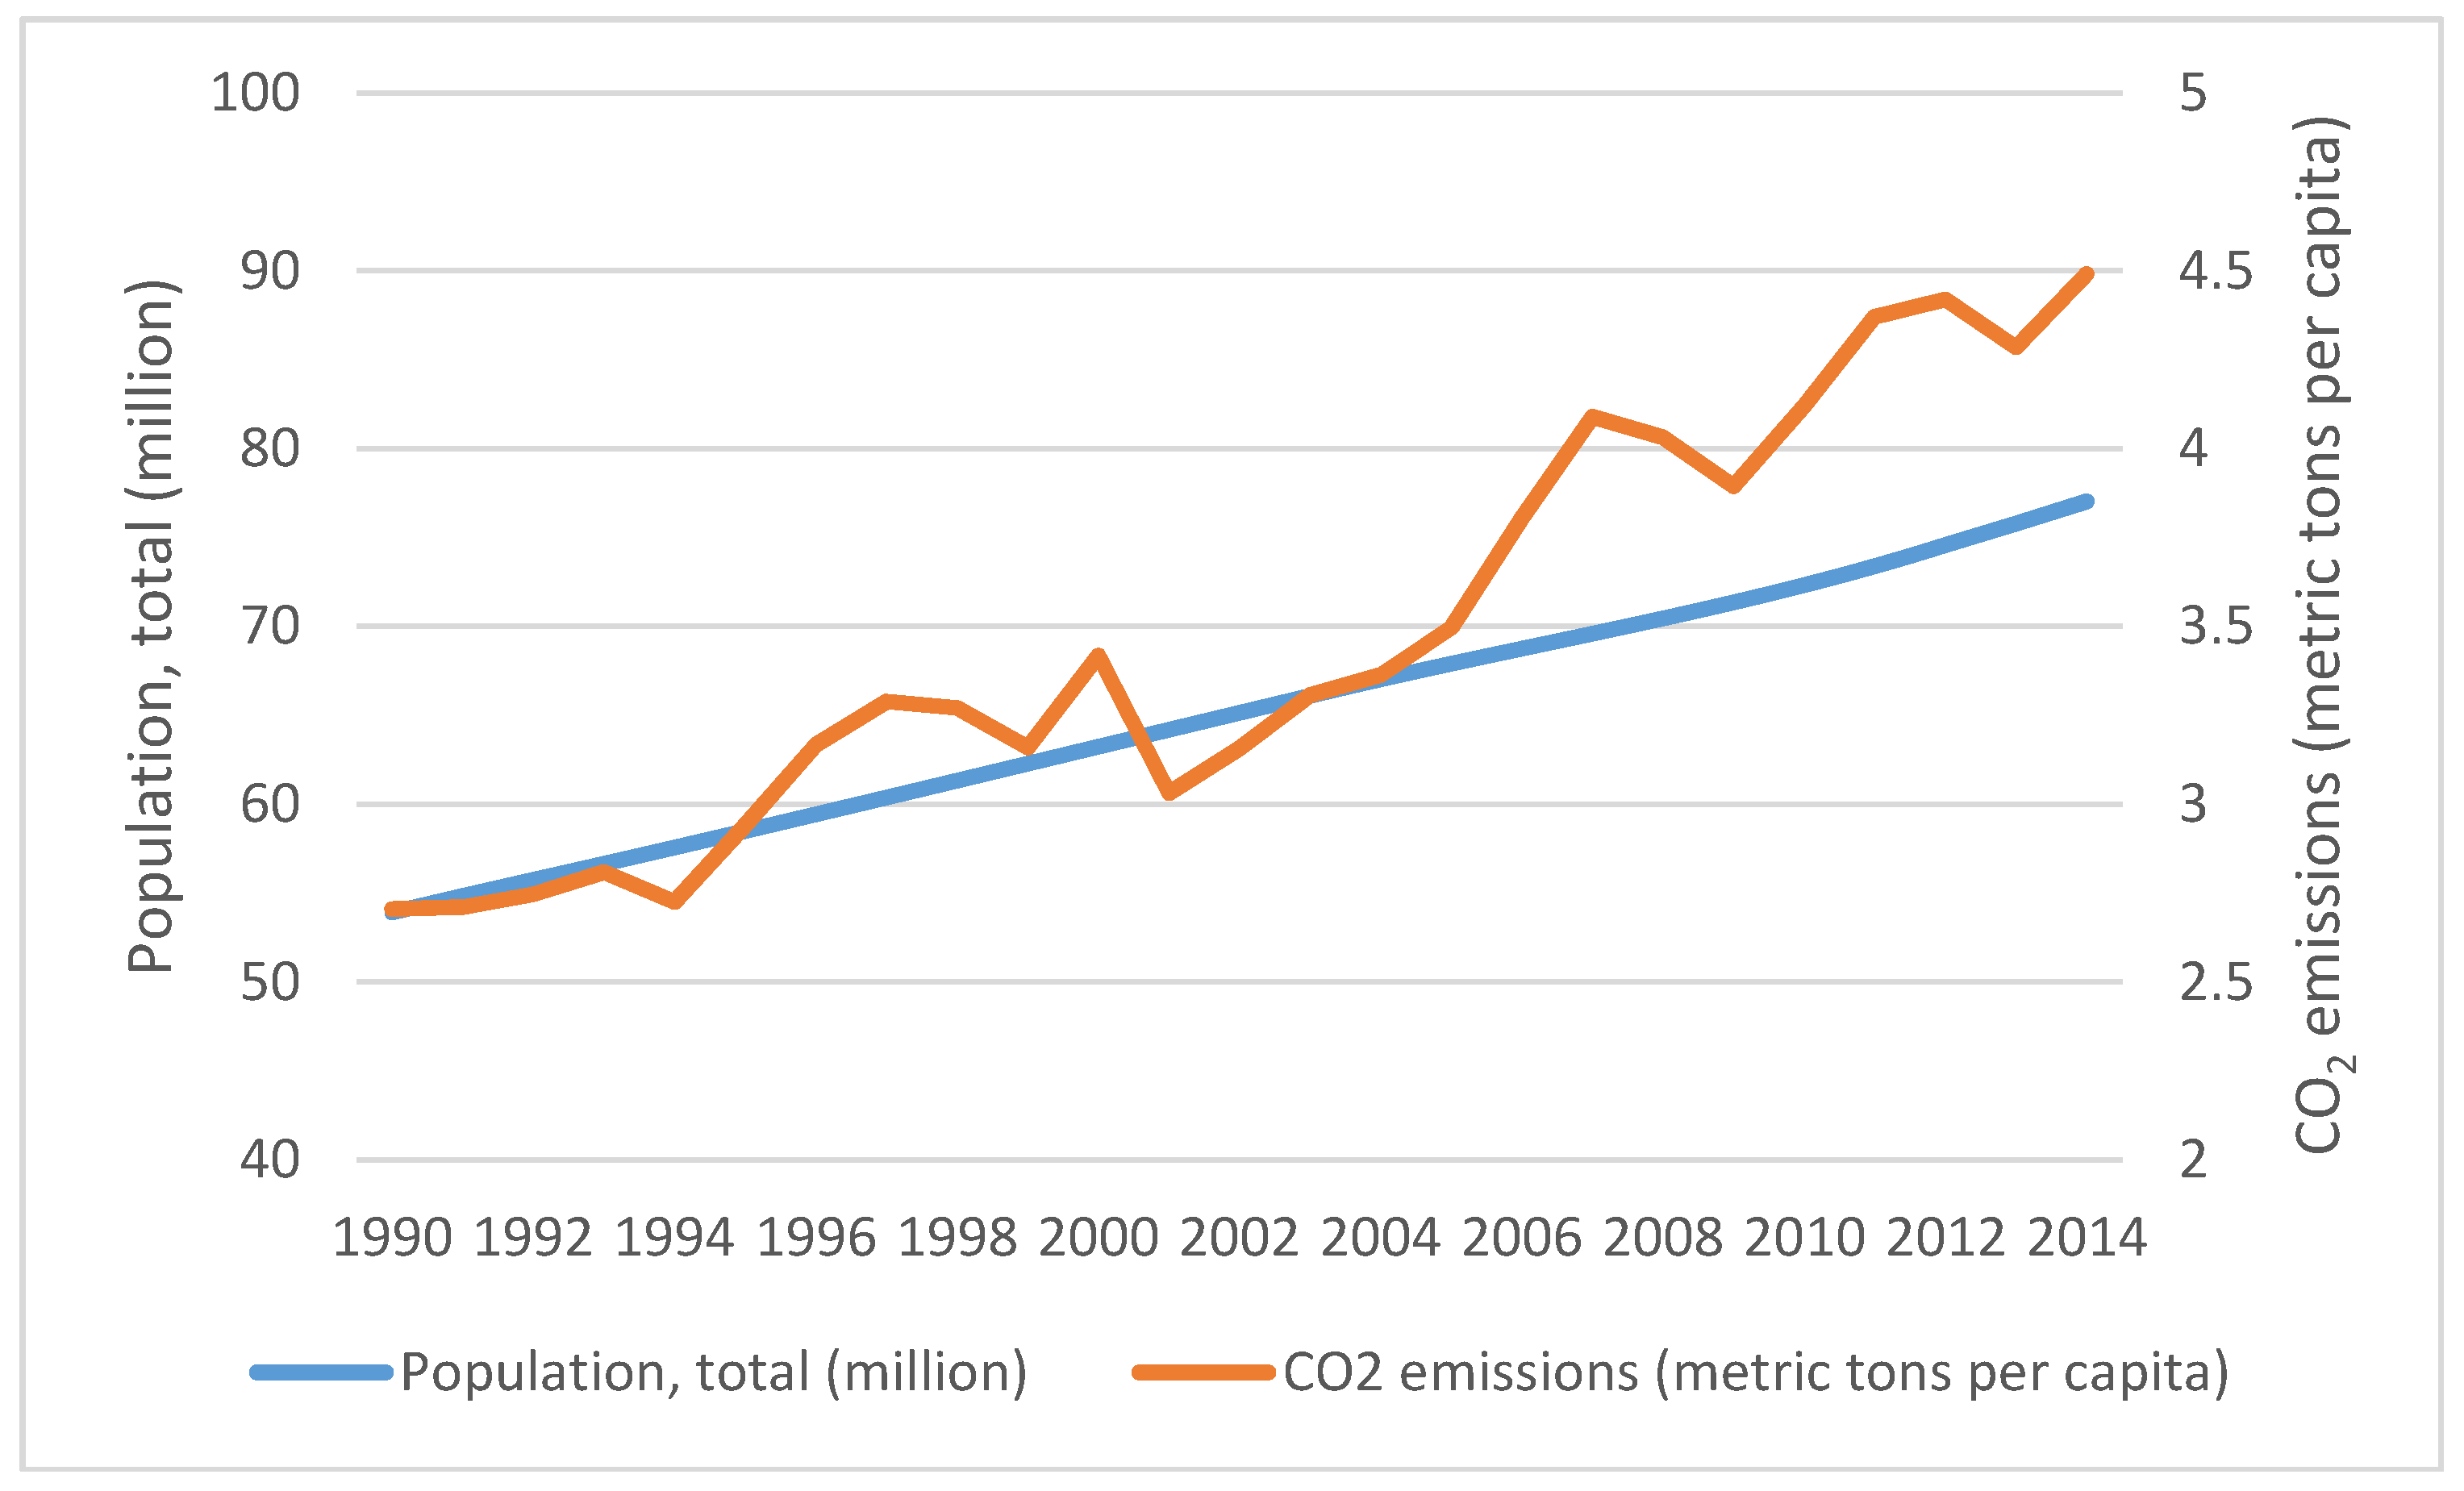
Turkey submitted its INDC to the UNFCCC in 2015, before the COP 21, with an emissions reduction target of a level of emissions 21% lower than the business as usual scenario by 2030 [5]. Since 1990, greenhouse gas emissions in Turkey increased by 122% to 475.1 Mt CO2 eq. in 2015 [6]. The highest portion of total greenhouse gas emissions, 71.56%, originated from the energy sector; 12.78% originated from industrial processes, 12.08% from agriculture, and 3.56% from waste [6]. Absorption by land increased from 30.3 Mt CO2 eq. in 1990 to 64 Mt CO2 eq. in 2015, an increase of 111.92% [6]. As seen from Figure 1, the rise in greenhouse gas emissions per capita is steeper than population increase, indicating a tendency towards carbon-intensive activities. For the year 2014, Turkey (4.49 metric tons per capita) still has the lowest values in per capita greenhouse gas emissions among all OECD countries (9.53 metric tons per capita) and the EU (6.38 metric tons per capita) [7]. Despite this relatively low level compared to the OECD average and EU, its trend in emissions per capita is a cause for concern.
However, climate change is not the only issue that Turkey faces. Currently, Turkey’s economy faces important risks. Challenges include long standing unemployment and sustaining economic growth in the face of domestic threats and regional uncertainties. The Turkish economy experienced periods of high growth in the last decade made possible by strong domestic demand but overly funded by debt-creating capital inflows. Turkey’s current account position has severely deteriorated since the early 2000s. Due to high import dependency in production, high global risk as well as weak and unstable liquidity conditions, the current account deficit has been a great cause for concern. According to Kara and Sarıkaya [9], the 2011 policies of the Central Bank of Turkey which aimed to remove financial excesses and avoid significant exchange rate deterioration helped remove the cyclical part of the deficit, but the remaining sizeable part requires structural reforms which would bring about significant sacrifices in economic growth in the short term. Many consider high current account deficits to be a key economic weakness in the Turkish economy.
Moreover, Turkey has become increasingly more volatile politically and socially over the last decade. Widespread street protests took place against the government in the summer of 2013, known as Gezi Park Protests [10]. In June 2015, a controversial election took place and the following year Turkey witnessed its most severe terrorist attacks ever, with several bomb attacks the following year [11]. The Syrian civil war caused mass migration, placing an additional important social burden on Turkey [12,13]. After the failed coup attempt in July 2016, a state of emergency was declared which has yet to be lifted, adding to the uncertainty surrounding the Turkish economy.
To achieve strong and sustainable growth, domestic savings should increase, domestic demand to GDP ratio should decrease, and exports should be considerably strengthened. This can be seen by comparing 2000–2016 period averages of gross domestic savings (% of GDP) (TR: 23.36, others: 25.83), final consumption expenditure (% of GDP) (TR: 76.64, others: 74.16), and exports of goods and services (% of GDP) (TR: 22.50, others: 26.21) ratios of Turkey and the 16 countries above of Turkey in GDP ranking [8,14].
The unemployment rate has also increased in the post–2000 period. According to the “Employment Outlook 2017” report of the OECD [15], unemployment in Turkey exhibited an upward trend from 2012 to a peak of 11.7% in February 2017 and is expected to remain at 10% until the end of 2018, in sharp contrast with the OECD average (5.9% in 2017).
Given the expanding international dimension of climate change mitigation, environmental concerns have become a fertile ground for scholarly debate. Studying a combination of economic and emissions mitigating policies is a common practice in this line of debate. After Parties signed the Paris Agreement, many scientists conducted studies on vagueness and comparability of INDCs, Pauw et al. [16], Seo [17], Winkler et al. [18]; the gap between the global target and national contributions, Benveniste et al. [19], Höhne et al. [20]; and supplies and uses of financial resources under the UNFCCC, Ghezloun et al. [21], Zhang and Pan [22]. There were studies assessing the INDCs and evaluating implications of the policies set forth therein on a single country, Djurovic et al. [23], Chunark et al. [24], Siagian et al. [25], Oshiro et al. [26], Wu et al. [27], Rasiah et al. [28], Busby and Shidore [29]; and on multiple countries, Lee et al. [30], Liu et al. [31]. As the INDCs are considered the first emissions reduction pledges for many developing countries and due to the slightly more binding structure of the Paris Agreement compared with the Kyoto Protocol, INDCs of developing countries have many aspects to study. As a developing country and in regard to the concerns mentioned above, this study aims to analyze the INDC document of Turkey. This study addresses the following previously unanswered questions: What is the emissions mitigation potential of the INDC? What are the emissions mitigation potentials of the previous national documents, i.e., the National Climate Change Action Plan (NCCAP) developed by the Ministry Environment and Urbanization [32]? To what extent were these policies put into practice? Are alternatives to the INDC policies needed? Which policies will be more effective in reaching the INDC target? Can the target be achieved by policies that boost the economy? To answer these questions, an Environmentally Extended Social Accounting Matrix (SAM) was prepared from the 2012 input-output table of Turkey, and an analysis of policies drawn from the goals of the previous national climate change documents and policies generated by the authors was conducted using Multiplier Analysis method.
The remainder of this paper is structured as follows. The second section gives information about previous studies in the climate change mitigation field. The third section presents data sources and construction steps, and the structure of multiplier analysis method. In the fourth section, policy shocks are described and results of the simulations are reported. The last section discusses the results of the study.
2. Literature Review
Researchers have assessed the impacts of climate policy by various analytical methods. Modelling options can be grouped into three [33]: Integrated Assessment Models (IAMs), top-down and bottom-up models, and Multi-Criteria Analysis. IAMs consider both the economic and biophysical systems and their interactions, such as how increased GHGs in the atmosphere affect temperature, and how temperature change causes quantifiable economic losses. Top-down and bottom-up models are two approaches in Cost-Benefit Analysis (CBA). Top-down models evaluate the system based on aggregate economic variables, whereas bottom-up models consider technological options or project-specific climate change mitigation policies. Multi-Criteria Analysis (MCA) is applied when it is difficult to reduce all objectives to a single metric, and due to nature of the analysis, the researcher does not have to determine how outcomes are traded-off. A significant number of climate policy assessments have been conducted with the help of climate policy models; Stern Report employed the PAGE model [34], US Environmental Protection Agency (EPA) suggested policies using the EMPAX–CGE model [35], Hu et al. [36] compared global warming policies by using the DICE model, and Toshiyuki and Goto [37] examined the legal validity of US Clean Air Act by using Data Envelopment Analysis (DEA) model.
More recent studies concentrate on the INDCs and the Paris Agreement. Qi and Weng [38], analyzed the impacts of a linked emissions trading system (ETS) for Annex 1 countries to achieve the INDC emissions reduction target. Running a multi-regional CGE model, they concluded that a linked ETS would have different impacts on output, energy consumption and GDP of the participating country depending on whether it is a permit exporter or importer but would slightly increase the economic aggregate of the participating countries. Gu and Wang [39], employed a climate-economy integrated assessment model to investigate the possibility of achieving the global INDC target with the existing R&D investment rates. They concluded that even if most of the countries achieved their INDC targets by 2030, the 2 °C target would be difficult to achieve without higher R&D investment rates. They suggested that if transfer of advanced low-carbon technologies to developing countries increased and if a policy mix including different mitigation measures in addition to R&D development was implemented, temperature increase could remain below 2 °C. Dong, et al. [40] predicted the possibility of achieving emissions reduction targets of the ten most emitting countries by analyzing CO2 emissions, primary energy consumption, and share of renewable energy data between 1991 and 2015. They used trend extrapolation and back propagation (BP) neural network methods to overcome the weakness of Multiple Linear Regression (MLR) and the assumptions of Environmental Kuznets Curve (EKC). The study concluded that China, India and Russia would achieve their targets, but USA, Japan, Germany and South Korea would not; the remaining countries, namely, Saudi Arabia, Iran and Indonesia would be a matter of debate in the future as they had not committed to any targets.
A limited number of studies have also employed climate policy models with different aims in Turkey. One of the earliest studies in the field, Telli, Voyvoda and Yeldan [41], intended to study the economic impacts of various possible mitigation policies because of accession negotiations with the EU which set an ambitious target to reduce its greenhouse gas emissions 20% below the level of 1990 by 2020, in compliance with the Kyoto Protocol. With this motivation, they developed a CGE model, projected for the 2006–2020 period, and concluded that possible emissions mitigation targets could worsen the existing state of employment and create a need to finance mitigation investments. They proposed a policy reducing existing tax rates and applying carbon and energy taxes. In another study, Akin-Olcum and Yeldan [42] analyzed several emissions trading system (ETS) regimes for Turkey under the EU 20–20–20 emissions target and its revised version, 30%. The authors built a multi-regional, multi-sectoral applied general equilibrium model, and found that Turkey would have economic gains from linking with the EU ETS under the 20% cap, but it would suffer critical output loss under the 30% cutback. Bouzaher, Sahin and Yeldan [43] built a 12-sector, dynamic CGE model which included CO2 and Particulate Matter (PM10) emissions, solid waste and waste water discharges. The authors aimed to identify viable policies for the 2010–2030 period to realize green growth in Turkey. They proposed a policy that consisted of taxing emissions from PM10 and CO2, taxing solid waste and waste water discharge, and spending the revenue for creating green jobs as well as R&D induced innovation.
Acar and Yeldan [44] assessed the impact of current coal subsidies on macro indicators and CO2 emissions by running a multi–region CGE model between 2015 and 2030. They found that elimination of subsidies for coal results in a slight reduction in GDP, but a substantial decrease in CO2 emissions. The study was written at the time of Turkey’s INDC submission, but it was not conducted in the INDC context. The authors referred to the emissions reduction target of the INDC document as they compared the official business as usual (BAU) projections with their own BAU projections. They found the official projections too high and not in line with the recent Turkish historical pathway. Kolsuz and Yeldan [45] implemented an applied general equilibrium model with the aim of increasing employment, abatement of environmental pollution, and reaching a higher rate of disposable income. They concluded that a policy introducing environmental taxes on pollutants, creating an institutional mechanism to earmark these tax revenues for green employment, and halving the existing labor taxes within a more flexible labor market could expand labor employment by 9.2%, expand GDP by 1.6%, and reduce total CO2 eq. emissions by 19.7% by 2030 in comparison to the business as usual path.
Two studies were conducted on Turkey’s INDC document, one of them was made before submission of the INDC and one after. The report entitled “Low carbon Development Pathways and Priorities for Turkey” was prepared in partnership with WWF—Turkey and Istanbul Policy Center (IPC) [46]. A CGE model was developed to determine a low carbon development pathway up to 2030. The report was prepared before the Paris Conference, and even before the submission of Turkey’s INDC. The authors created three scenarios: official plans scenario which used growth rates of official economic program, business as usual scenario based on more realistic growth rates, and 2 °C pathway scenario which included mitigation policies. A policy introducing a carbon tax whose proceeds will be used to fund investments in renewable energy and assuming autonomous energy efficiency gains was proposed. However, as the proposed policy would realize only two thirds of the total emissions reduction needed to meet the 2 °C target as calculated by the authors by using Climate Change Reference Calculator (CERC), additional policies from other studies were also proposed, without being simulated by the CGE model. The study also explored the case of late implementation and concurred with studies from other parts of the world: late action can cause devastating impacts and economic damage.
Turkish Industry and Business Association (TUSIAD) released a report entitled “Addressing Climate Change from An Economic Policy Perspective” after the INDC was submitted [47]. The report aimed to address the policy options for Turkey considering the relevant practices worldwide in the post–2020 period. A dynamic CGE model was formulated to measure potential economic effects of applying a tax to reduce emissions in Turkey under two scenarios created by the authors: A reference scenario including an energy tax for achieving the 21% reduction target and an alternative scenario including the energy tax accompanied by a reduction in other taxes, such as the tax on employment. The reference scenario reduced emissions by 21% but caused an 8.7% decline in national income; and the alternative scenario reduced emissions by 15.5% but caused a 3.7% decline in national income. Unfortunately, it was impossible to conduct another analysis for the Emissions Trading System (ETS) due to lack of detailed carbon emissions data at the sectoral level and unsuitability of the theoretical basis for this kind of modelling. The study concluded by suggesting a comprehensive policy package consisting not only of implementing the ETS and/or neutral taxation but also of adopting new measures and technologies to increase energy efficiency, subsidies and practices to spread the use of renewables, and tax advantages for low-carbon products. The authors claimed that such a package would increase employment and provide incentives for investing in alternative technologies for the transition towards a low-carbon economy.
Unlike the aforementioned studies, this study constructs an Environmentally Extended SAM of Turkey for the year 2012 and examines emissions mitigation potentials of two national documents, the NCCAP and the INDC. It interprets the tenacity of Turkey in implementing climate policies by comparing the emissions mitigation potential of the NCCAP for 2015 to existing emissions inventory in 2015. It interprets the INDC policies and proposes alternative policies to reach the emissions mitigation target in the INDC. Additionally, the study proposes output, GDP and employment increasing policies based on multipliers and states whether these policies can reduce emissions or not.
3. Data and Method: Environmentally Extended SAM, Multiplier Analysis and Multipliers
In order to assess the potential and the efficiency of mitigation goals, Turkish data was organized in the form of an Environmentally Extended SAM. Sectors were determined to correspond to the sectors in the National Inventory Reports (NIRs) and the sectors in the national climate documents [5,6,32]. A SAM was constructed with data from different national economic statistics and extended to an Environmentally Extended SAM with emissions and other environmental data published by public institutions. The Environmentally Extended SAM construction steps are detailed in Supplementary File 1 and sectoral mapping is also given in Supplementary File 1.
SAM is a representation of all socio-economic transactions in a matrix and provides a numeric definition of resource allocation of the economic cycle [48,49]. SAM is a two-entry accounting system, grounded on the principle of equal row and column totals. The rows of SAM show the income of accounts, columns show expenditures. In Table 1, SAM for an open economy is shown through five essential accounts: production activities, products, institutions, saving-investment and rest of world (ROW) [50].
Data for the SAM were collected from different economic statistics published by public institutions. This study takes the most recent Turkish input–output table (2012 input–output table) as base and uses 2012 values of all other variables and indicators, differing from all of the recent studies mentioned above. The previous studies used the 2002 input–output table as it was or updated it. The 2002 data were criticized for being dated. The aggregate SAM was constructed and then balanced to determine the general structure of the actual SAM [51,52]. It is presented in Table 2.
Sectors in the SAM were determined by considering emissions potentials of them. After carefully reviewing the sectors in the last NIR document and the sectors in the national climate change documents [5,6,32], the sectors of the SAM were determined as: agriculture, coal mining, petroleum and natural gas extraction, food, coke and refined petroleum products, chemistry, mineral, metal, waste, railway transport, highway transport, water transport, air transport, industry, service, electricity from coal, electricity from petroleum, electricity from natural gas, electricity from hydropower, and electricity from renewable resources. Subsequently, a sectoral mapping between these sectors and the sectors in the input/output table was generated, and the requisite aggregation and disaggregation operations were determined.
The above sectors were also grouped into the following main sectors: agriculture, energy, industry, transportation, and waste. The main sectors were included to ease generation of policies because the goals in the NCCAP and INDC documents had been grouped into these main sectors. The main sectors are also listed in the sectoral mapping in Supplementary File 1.
The SAM was constructed following the steps described in the literature, and all the steps are given in detail in Supplementary File 1.
The SAM was then transformed into an Environmentally Extended SAM. Environmentally Extended SAM is an extension of SAM consisting of economic and environmental activities in a unique framework. Environmentally Extended SAM is necessary because SAM ignores the relationship between the environment and the economy. Transformation is usually done by adding three types of accounts: substances, depletable resources, and environmental themes. The Environmentally Extended SAM constructed in this study includes greenhouse gases as substances, hard coal and lignite as depletable resources, and total inventories of greenhouse gases in CO2 eq. unit as environmental themes. In line with common practices, the SAM accounts are in monetary units and the environmental accounts are in physical units.
Coal, petroleum, natural gas and land are usually added to Environmentally Extended SAMs as depletable resources, but of these, this study includes only coal in this account because Turkey is very poor in petroleum and natural gas resources. It has a small amount of hard coal and a significant amount of lignite coal reserves. However, lignite coals in the country has low–calorific values. The reports by the Turkish Hard Coal Enterprise Institution [53] and by the Turkish Coal Enterprises Institution [54] state that Turkey has 1.3 billion tons of hard coal and 14.1 billion tons of lignite coal reserves. The report of the Turkish Coal Enterprises [55], states that calorific values of the reserves are between 1000 kcal/kg and 4200 kcal/kg, and 90% of the reserves have lower values than 3000 kcal/kg. The report also states that Turkish lignite reserves are more appropriate for electricity production due to their calorific values. Kara [56] determines the future of lignite reserves in Turkey as ambiguous, as costs are too high to compete with imported coal and they have high greenhouse gas emissions levels. He claims that they will be an option in the future only if coal, petroleum and natural gas prices increase altogether and new plants are established which are environmentally friendly and highly compatible with local reserves. Nevertheless, Turkey is already building new coal–fired electricity plants and will continue to build as stated in the development plans of the Ministry of Development and the strategy documents of the Ministry of Environment and Urban Planning. It wants to reduce foreign dependency by utilizing all domestic coal reserves. Accordingly, coal use and reserves were added to this study. Land is another depletable resource generally included in Environmentally Extended SAMs, but is excluded in this study, as the INDC target omitted Land Use and Land Use Change (LULUCF) emissions.
In the environment, there exist different types of substances which cause damage to natural resources basically in the form of pollution of air, water, and soil. This study, however, included only greenhouse gases as substances. The gases included are CO2, N2O, CH4, HFCs, PFCs, SF6 and NF3.
The column of environmental theme account shows sector specific gross greenhouse gas emissions of Turkey in CO2 eq. unit. The column total of this account is equal to Turkey’s total GHG inventory. The Environmentally Extended SAM is given in Supplementary File 2.
The most convenient way to transform a SAM into a model is to assume that all relations are linear, and to take prices as constant. In this way, SAM can be used to analyze impacts of shocks given to exogenous variables. This method is known as SAM Multiplier Analysis, an extension of Input-Output Analysis.
Recent literature suggests that CGE models are the method of choice in climate change modeling in Turkey. However, in this study, SAM Multiplier Analysis was employed instead for two main reasons. The first reason was complexity and size of the data. There were 5 electricity sectors producing the same product, electricity, and 15 non–electricity sectors producing 15 different products. This would necessitate separate modeling structures for these sectors. In addition, there would be separate agents representing household, government, and investment, and one Armington agent determining import–domestic good demands. CGE method, if applied, would involve making numerous assumptions about nesting structures, function types, and parameters. Rose [57] states that CGE models are based on more restrictive assumptions than Input–Output and SAM models. Klijs et al. [58] supports this argument by stating that CGE models are not standardized and come in many forms, differing substantially in model structure, complexity, and assumptions; on the contrary, SAM Multiplier Analysis is applied in a standard way making its results comparable. The second reason was that the goals in the national documents were more amenable to being treated as final demand shocks than to being defined with other economic tools such as taxes/subsidies, quotas or price ceilings/floors which are usually applied in CGEs.
Another important point is that while SAM Multiplier Analysis is for simulating short run adjustments, in this study, the method is also used to simulate the goals in the INDC document which were planned for 2030. For the goals stated as ratios, targeted ratios were compared with existing ratios in 2012, and differences were applied as shocks. For the goals given in values not ratios, existing values in 2012 were updated to 2030 by using the growth rate in the INDC document, then targeted values were compared with these updated values and the differences were applied as shocks. Thus, without updating the SAM to 2030, goals were transformed to shocks, and SAM Multiplier Analysis was applied for long term in good faith and with confidence.
As for choosing SAM Multiplier Analysis over Input–Output method, SAM is regarded as a more thorough methodology because a traditional I–O model focuses on flows among actors involved in production but a SAM also includes the interdependence of production with the rest of society [59,60,61,62]. Traditional Input–Output multiplier analysis takes two forms: open and closed. The open model is criticized for underestimating the regional economic impacts because keeping households exogenous to the model omits the impact of households’ spending of wage income as a result of the change in final demand for an industry’s output [63,64,65]. In closed form, household consumption (in column) and labor income (in row) are included in the endogenous matrix, so in the Leontief inverse. Such an inclusion solves the problem above and provides a square invertible matrix, but it is not a consistent approach as incomes from capital and other factors which belong to households are not included in the endogenous matrix. In contrast, SAM includes all factor accounts and the household account in the endogenous matrix more properly.
The main limitation of SAM Multiplier Analysis is that it allows changes only in exogenous accounts. Closure of the SAM (definition of endogenous accounts) in the most appropriate manner is key in this method. Different closure rules were adopted by scientists in previous studies, i.e., Sánchez Chóliz and Duarte [66] described an alternative approach that defining only the household as exogenous account and examining the economic system impacts resulting from changes in household consumption behavior. In this study, the inter-industry transaction submatrix was closed to contain all the necessary behavioral and technical relationships of the economic system in a consistent manner. The exogenous accounts were composed of the government, saving-investment, and exports. Another rationale was that these accounts are commonly used policy tools in an economy; government expenditure is used as a direct policy tool, and export and saving-investment are used as indirect policy tools. This allowed changes only in these accounts so only these were subject to shocks. However, the goals in the national climate documents of Turkey cover the entire economy which necessitate shocks over total final demand including household consumption. Thus, the effects of the shocks could be higher.
The basic approach to multiplier analysis is to calculate column shares (column coefficients) to represent structure, and then, similar to an input–output model, to calculate matrix multipliers. To do this, some accounts must be determined as exogenous, otherwise the matrix will not be invertible, and there will be no multipliers at all. Defining the endogenous transactions as production, factors of production, and households helps to focus on the interaction between two sets of agents (production activities and households) interacting through two sets of markets (factors and commodities) [67]. This structure was followed in this study; production, labor, capital, and household accounts of the SAM were set as endogenous; government, saving-investment, and rest of world accounts were set as exogenous. After determining endogenous and exogenous accounts, changes in gross output were calculated with the following formulas:
where ∆xd denotes the change in the output, (I − A)−1 term is the Leontief inverse, ∆f is a given change in final demand, A denotes the technical coefficients matrix and I denotes the identity matrix.
Technical coefficient matrix is formulated as follows:
where S denotes the endogenous matrix and (Xd)−1 denotes a diagonal matrix whose diagonal elements are defined as the total output of each industry.
Changes in depletable resources and pollutant were calculated with the following formulas:
where D is a matrix defining the depletable resource amount used to produce 1.00 monetary unit output of ith sector, P is a matrix defining pollutant amount released to environment by producing 1.00 monetary unit output of ith sector.
Derivation of the predictive model was compiled by the authors in conformity with the study’s SAM structure and it is given in Supplementary File 1.
4. National Documents Policies, Alternative Policies and Results of Analysis
Six simulation categories were created: NCCAP, INDC, emissions decreasing, developmental, GDP increasing, and employment increasing.
The primary aim of the NCCAP, INDC, and emissions decreasing simulations was emissions mitigation. The NCCAP simulations were conducted to investigate the emissions and economic effects of this document. The INDC simulations were conducted for the INDC document. Emissions decreasing simulations were the authors’ own policies presented as alternatives to the INDC’s. The goals in the NCCAP and the INDC were interpreted as efficiency or transition to low carbon economy policies and emissions decreasing simulations were compatible with this interpretation. In these three simulation categories, two types of shocks were applied: “increasing efficiency” and “transferring volume”. Increasing efficiency type shocks were planned as decrease shocks where the same amount of output could be obtained with less input. This led to a decline in emissions and coal use, since less input was used, but no shrinkage in the economy, as the same amount of output was produced. In these simulations, changes in emissions, hard coal use and lignite use were taken into consideration, but changes in output, employment, and GDP were ignored. In fact, increasing efficiency arises from technological development and necessitates changes in input output (technical) coefficients. Pal and Pohit [68] decreased the technical coefficient of related input in the event of an efficiency increase and added this share to the capital input. However, to avoid complicating the model further, the technical coefficients were not changed in this study. Transferring volume type shocks reallocated output from high emitting to low emitting sectors for transition to a low-carbon economy. It was assumed that excess demand in the transferring sector could be met by imports, and excess supply in the receiving sector could be sold to the government and to the ROW. In this type of shocks, changes in output, employment and GDP were taken into account together with changes in emissions and coal use.
The essential aim of developmental, employment increasing, and GDP increasing simulations was increasing gross output, employment, and GDP respectively. These three simulation categories were created by the authors according to output, employment and GDP multipliers calculated from the SAM. The multipliers are given in Table 3. In these three simulation categories, two types of shocks were applied: “increasing efficiency” and “transferring volume”. Increasing efficiency type shocks were planned as increase shocks, where more output could be obtained with the same amount of input. This resulted in economic growth since more output was produced but did not change emissions level or coal use amounts since the same amount of input was used. This time, changes in emissions, hard coal use and lignite use were ignored but changes in output, GDP, and employment were taken into consideration. Transferring volume types shocks reallocated output from sectors in the zero or low multiplier categories to sectors in the high or very high multiplier categories. It was assumed that excess demand in the transferring sector could be met by imports, and excess supply in the receiving sector could be sold to the government and to the ROW. Changes in all six indicators; emissions, hard coal use, lignite use, output, employment, and GDP were taken into account.
Treating efficiency differently in emissions mitigation policies and economic growth policies and achieving transition to low carbon economy via transfers from high to low emitting sectors may be appraised as useful approaches for other studies.
Shocks were exogenous final demand shocks, as multiplier analysis is a method calculating output change arising from a change in exogenous final demands; namely government expenditure, investment, and export in this model. Shocks results could be summed, multiplied, or divided, and proposed as policy mixes. An identifying number was given to each shock and changes in emissions, output, employment, GDP, hard coal use, and lignite use (six indicators) were calculated. Shocks and their results are given in tables in each subheading. Detailed explanations of shocks are given in Supplementary File 3.
4.1. NCCAP Policies
To evaluate the implementation performance of previous emissions policies of the Turkish Government, all of the following recent documents were examined: Turkey’s Strategic Vision 2023, 10th Development Plan, New Investment Incentive Plan, Input Supply Strategy and Action Plan, Energy Efficiency Strategy Paper, Electricity Market and Security of Supply Strategy Paper, and the most recent strategy papers of the Ministry of Environment and Urbanization, the Ministry of Energy and Natural Resources, the Ministry of Development, the Ministry of Industry and Trade, and the Ministry of Science, Industry and Technology. Some of these documents did not include any emissions mitigation policies or goals and many of those did, did not have measurable ones. The few documents with measurable policies and goals presented further challenges for scenario analysis. Emissions targets and policies could not be aggregated into one sector, and also, they were in various units, not monetary units. Furthermore, these documents gave different years of completion for some of the same targets. Only the National Climate Change Action Plan (NCCAP) included appropriate emissions mitigation goals and was comprehensive; therefore, this document was taken as the basis for evaluating the performance of emissions mitigation policies of the previous documents. NCCAP simulations category was created. All of the goals in the NCCAP were examined, and measurable goals were transformed into shocks. Before that, the goals which had a different deadline than 2015 were revised for 2015, demoted to 2015. In this way, simulation results could be compared with the existing emissions inventory in 2015. The reader is referred to Supplementary File 3 for detailed information about transforming the NCCAP goals to shocks.
Five of the seven main sectors in the NCCAP document were included. Forestry was left out of this study as it is a LULUCF sector. Building was also excluded due to lack of separate data for public, private, and residential buildings. In addition, residential buildings were high in number, therefore, the building sector should have been evaluated within consumer side, rather than producer side. Eight shocks were generated from the NCCAP goals. Shocks and their results are given in Table 4.
The first four shocks were in the energy main sector. Primary energy efficiency shock, NCCAP01, caused minute reductions in emissions and coal use. Electricity efficiency shock, NCCAP02, resulted in significant declines in emissions level and coal use. Transfer shock from fossil electricity sectors to the hydro electricity sector, NCCAP03, aimed to utilize entire technical and economic potential for hydroelectric energy. It provided the biggest emissions reduction among other shocks and was far better in coal use also. NCCAP04 which foresees reducing losses and illicit use in electricity distribution, performed better in emissions mitigation and coal use than NCCAP01 but fell short compared to the other two scenarios.
NCCAP05, NCCAP06, NCCAP07 shocks were applied in the transport main sector as transfer shocks. NCCAP05 and NCCAP07 were the same transfers, transfers from highway to railway transport, but they were in different amounts. They both decreased emissions and caused very small declines in employment and GDP. NCCAP06, a transfer from highway to water transportation, decreased emissions but increased employment, GDP, and output very slightly.
NCCAP08 was the only shock in the waste sector, a 10% decrease in waste amount. Emissions decrease amounted to 0.05%, hard coal use and lignite use decreased at same rates, 0.02%.
Total emissions reduction obtained from NCCAP simulations was 2.69%. Employment decreased at a rate of 0.06%; GDP decreased at a rate of 0.01%; and output increased at a rate of 0.01%. Decrease in coal use was greater than in emissions, hard coal and lignite use decreased at rates of 3.25% and 7.16%, respectively. Consequently, if Turkey had applied the NCCAP policies between 2012 and 2015, emissions level in 2015 would be 436.82 Mt CO2 eq., 2.69% less than the existing 2012 level, 448.9 Mt CO2 eq. However, the actual figure was 475.1 Mt CO2 eq., 5.84% more than the 2012 level. It can therefore be considered that in the 2012–2015 period, the application of NCCAP policies failed to reach expectations.
4.2. INDC Policies
In the INDC simulations, measurable goals in the Turkish INDC document were determined and transformed into final demand shocks. Many of the INDC document goals did not have quantitative targets. The INDC gave reference to some national strategy and action plans for detailed information about these goals. These documents were reviewed with the hope to quantify the goals but it was found that they had been prepared for purposes that were completely different from the INDC and so were found inadequate for this purpose. Only three shocks could be generated from the INDC document goals, and all of them were in the energy main sector. Different from the NCCAP shocks, the INDC shocks were calculated by taking into account a growth rate taken from the INDC document. In the INDC, only the emissions level was estimated for the year 2030 and no estimates were given for any other values. Growth rate of emissions was calculated as 5.51% per year. When transforming the INDC goals into shocks, firstly, existing 2012 values were extrapolated for 2030 by applying this growth rate. Secondly, differences between these updated values and targeted values were determined. These differences constituted the shocks. The Environmentally Extended SAM was never updated but changes required by the goals for the year 2030 were calculated and applied as shocks on the Environmentally Extended SAM. Detailed information about transformation of the INDC goals to shocks are given in Supplementary File 3. The shocks and their results are summarized in Table 5.
INDC01 and INDC02 shocks were transfer shocks, transferring volume to renewable and hydroelectricity sectors, respectively. INDC02 further reduced emissions and coal use compared to INDC01 because it was a greater shock. INDC03 shock was a decrease shock at a rate of 15% which aimed at reducing electricity transmission and distribution losses. INDC03 gave a better result than INDC01 in emissions reduction, but there was a less decrease in coal use. It is because INDC01 replaces coal with renewable resources but INDC03 decreases final demands of all electricity producing sectors.
These three shocks reduced emissions by 3.20%, a far weaker decrease than the INDC target. Output, employment and GDP changes were zero; hard coal use and lignite use changes were significant, −6.95% and −15.33%, respectively. It appears impossible to reach the INDC emissions mitigation target based on its own policies.
4.3. Emissions Decreasing Policies
Emissions decreasing simulations were generated with an aim of reaching the INDC emissions mitigation target by employing policies that are more plausible than the INDC policies. The target year for these shocks was also 2030. Various shocks were essentially motivated by the NCCAP and the INDC documents. As a result, some emissions decreasing shocks ended up being the same with some of the NCCAP and the INDC shocks above. The remaining shocks were generated by the authors taking emission coefficients into account. To generate these shocks, sectors were categorized into four: very high, high, low and zero. The identification of the four categories was performed in three steps. Initially, each sector’s CO2 equivalent emissions total was taken from the Environmentally Extended SAM, these totals were divided by gross output of the same sector, and emission coefficients were calculated for each sector. These coefficients were in kg CO2 equivalent per thousand Turkish Lira. Then, mean of these coefficients (coefficient mean) was calculated, 428 kg CO2 eq./thousand TL. Finally, another mean (gross mean) was calculated as 109 kg CO2 eq./thousand TL by dividing total emissions inventory by total gross output in the economy. Sectors with emission coefficients greater than coefficient mean were classified as “very high”, those with emission coefficients between coefficient mean and gross mean were classified as “high”, those with coefficients less than gross mean were classified as “low”, and, those with zero emissions were classified as “zero”. This categorization can be seen in Table 6.
Fourteen shocks were prepared in total in all main sectors (energy, industry, transportation, waste and agriculture). The shocks and their results are presented in Table 7. The first eight shocks were in the energy main sector. The primary energy shock, EMIS01, which was the same as the first NCCAP shock, had weak results for emissions, hard coal use and lignite use. EMIS02 and EMIS05 were the same shocks in magnitude but were instigated by different policies, increasing efficiency in electricity use and reducing losses in electricity distribution, respectively. The reduction in emissions for both was 0.63% and the reductions in hard coal and lignite use amounts were 0.83% and 1.79%, respectively. These shocks performed better than the primary energy shock, EMIS01. EMIS04 aimed to apply co-generation technology in coal, petroleum and natural gas electricity sectors. It produced a similar result to EMIS02 and EMIS05 in emissions reduction and coal use despite being a smaller volume shock.
EMIS03, which incidentally is the same as the second INDC shock, transfers electricity production to hydroelectricity sector away from electricity generating sectors using coal, petroleum and natural gas, in that order. This policy achieved the largest emissions reduction and the most significant reduction in coal use as the most aggressive policy in the energy main sector.
EMIS06 was a transfer shock to renewable electricity sector from coal electricity sector. Emissions reduction was 0.14%, hard coal use reduction was 0.38%, and lignite use reduction was 0.85%. EMIS08 was a transfer shock from natural gas sector to renewable electricity sector and brought 0.12% reduction in emissions. EMIS06 performed better than EMIS08 in coal use reduction as expected. EMIS07 was a transfer shock from electricity generation using petroleum sector to renewable electricity sector; but as the share of petroleum is very low, the change in emissions was very low and the changes in other indicators were zero. Sum of these transfer shocks, EMIS06, EMIS07, and EMIS08, provided less emissions reduction than EMIS04, the increasing efficiency shock at the same rate in the same sectors.
In the industry main sector, only one shock was run. EMIS09, a 10% transfer shock from mineral (very high emitting) to service (zero emitting), reached 0.22% decrease in emissions accompanied by a 0.05% decrease in employment and a 0.01% decrease in GDP.
In transportation main sector, increasing efficiency shock to be achieved by convincing people to use more public transport and putting sustainable transport solutions into practice, EMIS12, achieved the greatest emissions reduction among other shocks in transportation, 0.9%. It also decreased hard coal and lignite use at rates of 0.41% and 0.5%, respectively. Transferring volume from highway to railway shock, EMIS10, did not perform as well as transferring volume from highway to seaway shock, EMIS11. EMIS11 decreased emissions level to a greater extent than EMIS10 and also increased employment, GDP, and output.
A 10% decrease shock, EMIS13, aimed at efficiency in waste management. The shock resulted in a 0.05% decrease in emissions, 0.02% decrease in hard coal use, and 0.02% decrease in lignite use. Changes in output, employment and GDP were ignored as it was an increasing efficiency shock.
A 10% decrease shock in agriculture, EMIS14, is planned to be achieved by fuel saving, avoiding excess use of fertilizers, and implementing modern practices. Emissions, hard coal use and lignite use decreased at rates of 0.76%, 0.38% and 0.45%, respectively.
When all of the emissions decreasing shocks were considered, a policy mix consisting of all shocks except EMIS03 achieved a 4.54% reduction in emissions level. Hard coal use and lignite use in this policy mix decreased at rates of 3.61% and 6.99%. This policy mix, combination of all shocks except EMIS03, also failed to reach the INDC emissions mitigation target. The economy did not shrink but grew, although very slightly. Employment, GDP, and output increased at rates of 0.06%, 0.03%, and 0.02%. This was an expected result because the shocks were either increasing efficiency or transferring volume shocks, increasing efficiency shocks were planned so as not to change output levels and transferring volume shocks were planned in such a way so that gains or losses were allowed only due to transfers among sectors.
EMIS03 envisaged transferring production away from coal, petroleum, and natural gas electricity generation towards hydroelectricity to tap into the entire hydroelectricity potential in Turkey. It was not preferred as it meant increasing hydroelectric capacity by 60.67% which is technically possible but not plausible from an economic point of view. Furthermore, hydro electricity production has detrimental impacts on land use and wild life.
Even though the policy mix presented above was far from achieving the target of 21%, it consisted of more conceivable policies than the INDC policies. The proposed policies are greater in number, spread throughout the economy, and easier to implement.
4.4. Multiplier Policies
In each platform and each document submitted or published, Turkey repeats its determination to sustain economic growth while mitigating emissions. This paper presents simulations based on output, employment, and GDP multipliers that enhance growth and increase employment to address the question of whether sustaining economic growth is possible while realizing the INDC target.
Sectors having high multiplier values have a greater effect on the economy than those with low multiplier values. Therefore, sectors were categorized into four levels according to their multiplier values: very high, high, low and zero. Categorization was based on the mean and standard deviation of multipliers and can be seen in Table 6. Sectors which have multipliers greater than the mean plus one standard deviation were classified as “very high”. Sectors with multipliers between the mean and mean plus one standard deviation were classified as “high”. Sectors with multipliers between the mean and one standard deviation less than the mean were classified as “low”. Finally, sectors with multipliers between one standard deviation less than the mean and zero were classified as “zero”.
Only the energy, industry, and agriculture main sectors were subjected to multiplier shocks. Waste and transportation sectors were left out of the multiplier analysis as it is not reasonable to boost the economy by promoting these sectors.
GDP multiplier shocks and output multiplier shocks occurred the exact same even though multipliers and sector categories were different. For this reason, the shocks and their results are given together in Table 8 but separately in Supplementary File 3. OUT01 was a 10% increase shock given to all electricity producing sectors due to efficiency increase. Output, GDP, and employment increases were very low and change in emissions, hard coal use and lignite use were ignored. OUT02 was a 10% transfer shock from low output sectors, chemistry, metal and industry, to high output sectors, service, mineral and food. Output increased at a rate of 0.78% but the increase in GDP and employment was much greater, 2% and 2.23%, respectively. However, this shock caused emissions level and lignite use to increase as well, at rates of 0.68% and 0.94%, respectively. OUT03 shock was an increasing efficiency shock and caused the highest levels of increase in macroeconomic indicators; 5.30% in output, 6.22% in GDP, 6.47% in employment. Changes in emissions level and coal use were ignored. OUT04 was an increase shock in the agriculture sector and outperformed OUT01 in all macroeconomic indicators; output increased at a rate of 0.5%, GDP and employment increased at rates of 0.61 and 0.38, respectively. When all of the output shocks were considered, OUT02 and OUT03 policies stood out. These shocks brought about significant increase also in employment and GDP. However, rather than achieving any reduction in emissions level, they increased.
When employment increasing shocks were considered, EMP01 shock was the same as OUT01 shock, and these could be interpreted as weak shocks. EMP02 was a 10% transfer shock from sectors having low employment multiplier, chemistry and metal, to sectors having high employment multiplier, service, mineral, food and industry. It caused low rates of increase in output, GDP, and employment; also, emissions level increased. EMP03 was the largest shock which was a 10% increasing efficiency shock in food, mineral, service, and industry sectors. The shock produced 8.42%, 9%, 9.23% increases in output, GDP, and employment, respectively. This shock was a larger version of OUT03 shock. EMP04 was the same as OUT04 and performed best in GDP. Employment increasing policies and their results are listed in Table 9. These shocks led to the same conclusion as the output increasing shocks that is none were capable of reducing emissions.
5. Discussion
INDC simulation results suggest that the INDC policies can only reduce emissions level by 3.20% even though the policies require major changes in the economic structure and are difficult to implement. In addition, very few of the INDC goals are measurable, unambiguous, and reportable. Thus, only three goals, all in the electricity sectors, could be transformed into policies. The INDC Content Brief Report of Turkey produced by the World Bank [69] reviewed the INDC under six titles (cost of implementation, capacity building needs, technology needs, unconditional part of mitigation target, conditional part of mitigation target, emissions reduction potential); and unfortunately, the document was found deficient in all of these. There is widespread concern about the accuracy of the INDC BAU projections. The report by WWF-Turkey and IPC [46] which was prepared before the INDC submission, consisted of two different scenarios, official plans scenario with the growth rates of Turkey’s official economic program and BAU scenario with more realistic growth rates. Acar and Yeldan [44] found the emissions projection in the INDC too high and not in line with the recent Turkish historical pathway. The report by TUSIAD [47] prepared its own BAU scenario by using Climate Equity Reference Project (CERP) which uses projections of IMF, McKinsey, and the World Bank. In addition, the results of this study show that emissions reduction obtained by applying the NCCAP policies for three years is only slightly less than emissions reduction obtained by applying the INDC policies for ten years. This is not surprising as the NCCAP policies are both numerous and measurable, yet it is disconcerting that the NCCAP is more comprehensive even though it was a reference for the INDC.
Moreover, two of the three measurable policies in the document concerned shifting electricity production to renewable and hydro electricity generation sectors; however, recently Turkey has pursued a strong commitment to utilizing all its coal reserves. Turkey hopes to decrease dependency on imports in energy with this decision, which is set out in the strategy documents of the Ministry of Energy and Natural Resources and in the 5-year development plans of the Ministry of Development. In light of all this, the INDC document can’t be considered to be convincing.
Among the emissions decreasing policies, two seem promising in the energy main sector: the policy of increasing efficiency in electricity generation from fossil fuels by implementing cogeneration technologies, and the policy of replacing fossil fuels with renewable resources in electricity production. Turkey should give priority to coal when implementing the latter, because coal has a higher potential in emissions reduction. Reducing losses and preventing illicit use in electricity distribution and raising efficiency in electricity use are other notable policies in the energy main sector. Increasing efficiency in road transportation by convincing people to use more public transport and putting sustainable transport solutions into practice is notable among other policies in the transportation main sector. Transferring volume to low emitting modes also contributes significantly. Increasing efficiency by land consolidation and applying modern and sustainable practices in vegetal and animal production in the agriculture sector is also effective. In the high emitting mineral sector, shrinking domestic production and importing from the countries that produce with low-carbon technologies, is the most effective policy in the industry main sector. However, given the high trade deficits in Turkey, this is unlikely to be possible in the near future. These policies should be of top priority for Turkey and may also be priorities for other developing countries if their patterns of emissions are similar with Turkey.
However, the policy mix proposed by the authors among emissions decreasing policies provides a 4.54% decrease in emissions level. This policy mix is economy-wide and easier to implement compared to the policies in the INDC document, yet the 21% target can’t be achieved. Achieving the INDC emissions mitigation target does not seem possible, either through increasing efficiency shocks or transferring volume to low carbon economy shocks, or with any mixes of them. Achieving the target requires producing forceful policies.
Multiplier simulations generated by the authors showed that boosting the economy is possible by increasing efficiency in sectors with high multipliers or transferring volume to these sectors, but this results in higher not lower emissions. This indicates that it is impossible to achieve such a high target with policies that involve only economic concerns.
Comparison of results of the NCCAP simulation with the existing 2015 emissions inventory showed that Turkey missed an opportunity to decrease its emissions by 2.69%, but emissions increased by 5.84% instead. This raises doubt about Turkey’s determination in the climate mitigation field. Although the NCCAP contained a decision on the establishment of a committee to monitor and evaluate the implementation status, this unit has yet to issue such a report. Furthermore, the documents published after the NCCAP and given as references in the INDC document do not include any information about implementation of the NCCAP goals; 10th National Development Plan, National Strategy on Industry, Energy Efficiency Strategy Paper, National Strategy and Action Plan on Recycling, National Legislation on Monitoring, Reporting and Verification of GHG emissions, National Smart Transportation Systems Strategy (2014–2023) and its Action Plan (2014–2016). Turhan et al. [70] also criticized Turkey as maintaining a peculiar position under UNFCCC for two decades, and with the new climate regime now in place, they claimed that the country’s mitigation pledges were falling short of expectations both in terms of realistic projections and its ambition to step up in the post–2020 period.
It is necessary to point out an important issue about the goals in the NCCAP and INDC documents and the way in which they were transformed into shocks. The NCCAP and INDC goals were set over the entire economy, however this study generated shocks over exogenous final demand accounts. Household consumption was not included because the household account is taken as endogenous in the Multiplier Analysis method in order to comprise income effects. As exogenous final demand accounts constituted 49% of total final demand in this Environmentally Extended SAM, the NCCAP and the INDC simulations results can be interpreted as being higher than they currently were. Emissions decreasing shocks generated by the authors can be interpreted the same, as these were also set over the entire economy. Although this is the issue, this does not change conclusions drawn on the NCCAP and the INDC documents and the emissions decreasing simulations since the emissions target is so far off from any simulation outcome.
In conclusion, as reaching the INDC target seems impossible for Turkey, the INDC target and the document itself should be revised in 2020 in accordance with the Paris Agreement which foresees an update of NDCs every five years. As each Party will undergo a technical expert review during the period, the document should also be supported by a series of analyses that determining mitigation target and actions to be taken. This will also help Turkey to be eligible to receive international support for its financial, technology and capacity-building needs. Another failure in the INDC would not only make Turkey more vulnerable to this seemingly inevitable change, but also can completely undermine any opportunity it has to shape the process.
Supplementary Materials
Author Contributions
All authors conceived and designed the research together; A.A. and Ç.D. prepared the data; A.A. performed the experiments; all authors wrote the paper together.
Acknowledgments
No grants were received for the research. No funds were received for the cost to publish in open access.
Conflicts of Interest
The authors declare no conflict of interest.
References
- UNFCCC. Nationally Determined Contributions (NDCs)—The Paris Agreement and NDCs. 2018. Available online: https://unfccc.int/process-and-meetings/the-paris-agreement/nationally-determined-contributions-ndcs#eq-2 (accessed on 22 April 2018).
- UNFCCC. Synthesis Report on the Aggregate Effect of the INDCs. 2018. Available online: https://unfccc.int/process-and-meetings/the-paris-agreement/nationally-determined-contributions-ndcs#eq-5 (accessed on 22 April 2018).
- UNFCCC. Paris Agreement. 2016. Available online: https://unfccc.int/process-and-meetings/the-paris-agreement/the-paris-agreement (accessed on 22 April 2018).
- Climate Policy Info Hub. History of the UN Climate Negotiations—Part 2—From 2011 to 2015. 2016. Available online: http://climatepolicyinfohub.eu/history-un-climate-negotiations-part-2-2011-2015 (accessed on 22 April 2018).
- Republic of Turkey. Intended Nationally Determined Contribution. 2015. Available online: http://www4.unfccc.int/submissions/INDC/Published%20Documents/Turkey/1/The_INDC_of_TURKEY_v.15.19.30.pdf (accessed on 11 November 2017).
- UNFCCC. National Inventory Reports 2016—Turkey. 2017. Available online: http://unfccc.int/national_reports/annex_i_ghg_inventories/national_inventories_submissions/items/10116.php (accessed on 11 November 2017).
- World Bank. CO2 Emissions (Metric Tons Per Capita). 2018. Available online: http://data.worldbank.org/indicator/EN.ATM.CO2E.PC?end=2013&start=2013 (accessed on 4 March 2018).
- World Bank. World Development Indicators. 2018b. Available online: http://databank.worldbank.org/data/reports.aspx?source=world-development-indicators# (accessed on 8 March 2018).
- Kara, H.; Sarıkaya, C. Current Account Deficit in Turkey: Cyclical or Structural? Tusiad Economic Research Forum Working Paper Series; Working Paper 1420; Koc University: Istanbul, Turkey, 2014. [Google Scholar]
- Yardimci-Geyikci, S. Gezi Park Protests in Turkey: A Party Politics View. Political Quart. 2014, 85, 445–453. [Google Scholar] [CrossRef]
- Guneyli, A.; Ersoy, E.; Kıralp, S. Terrorism in the 2015 Election Period in Turkey: Content Analysis of Political Leaders’ Social Media Activity. J. Univ. Comput. Sci. 2017, 23, 256–279. [Google Scholar]
- Esen, O.; Ogus-Binatlı, A. The Impact of Syrian Refugees on the Turkish Economy: Regional Labour Market Effects. Soc. Sci. 2017, 6, 129. [Google Scholar] [CrossRef]
- İçduygu, A. Syrian Refugees in Turkey-The Long Road Ahead; Migration Policy Institute (MPI): Washington, CD, USA, 2015. [Google Scholar]
- World Bank. Gross Domestic Product 2016. 2018. Available online: https://databank.worldbank.org/data/download/GDP.pdf (accessed on 8 March 2018).
- OECD. How Does TURKEY Compare? 2017. Available online: https://www.oecd.org/turkey/Employment-Outlook-Turkey-EN.pdf (accessed on 11 November 2017).
- Pauw, W.P.; Klein, R.J.T.; Mbeva, K.; Dzebo, A.; Cassanmagnago, D.; Rudloff, A. Beyond headline mitigation numbers: We need more transparent and comparable NDCs to achieve the Paris Agreement on climate change. Clim. Chang. 2018, 147, 23–29. [Google Scholar] [CrossRef]
- Seo, S.N. Beyond the Paris Agreement: Climate Change Policy Negotiations and Future Directions. Reg. Sci. Policy Pract. 2017, 9, 121–140. [Google Scholar] [CrossRef]
- Winkler, H.; Hohne, N.; Cunliffe, G.; Kuramochi, T.; April, A.; de Villafrance Casas, M.J. Countries start to explain how their climate contributions are fair: More rigour needed. Int. Environ. Agreem. Polit. Law Econ. 2017, 18, 99–115. [Google Scholar] [CrossRef]
- Benveniste, H.; Boucher, O.; Guivarch, C.; Le Treut, H.; Criqui, P. Impacts of nationally determined contributions on 2030 global greenhouse gas emissions: Uncertainty analysis and distribution of emissions. Environ. Res. Lett. 2018, 13, 014022. [Google Scholar] [CrossRef]
- Höhne, N.; Kuramochi, T.; Warnecke, C.; Röser, F.; Fekete, H.; Hagemann, M.; Day, T.; Tewari, R.; Kurdziel, M.; Sterl, S.; et al. The Paris Agreement: Resolving the inconsistency between global goals and national contributions. Clim. Policy 2017, 17, 16–32. [Google Scholar] [CrossRef]
- Ghezloun, A.; Saidane, A.; Merabet, H. The COP 22: New Commitments in Support of the Paris Agreement. Energy Proc. 2017, 119, 10–16. [Google Scholar] [CrossRef]
- Zhang, W.; Pan, X. Study on the Demand of Climate Finance for Developing Countries Based on Submitted INDC. Adv. Clim. Chang. Res. 2016, 7, 99–104. [Google Scholar] [CrossRef]
- Djurovic, G.; Cetkovic, J.; Djurovic, V.; Jablan, N. The Paris Agreement and Montenegro’s INDC: Assessing the Environmental, Social, and Economic Impacts of Selected Investments. Pol. J. Environ. Stud. 2018, 27, 1019–1032. [Google Scholar] [CrossRef]
- Chunark, P.; Limmeechokchai, B.; Fujimori, S.; Masui, T. Renewable Energy Achievements in CO2 Mitigation in Thailand’s NDCs. Renew. Energy 2017, 114, 1294–1305. [Google Scholar] [CrossRef]
- Siagian, U.W.R.; Yuwono, B.B.; Fujimori, S.; Masui, T. Low-Carbon Energy Development in Indonesia in Alignment with Intended Nationally Determined Contribution (INDC) by 2030. Energies 2017, 10, 52. [Google Scholar] [CrossRef] [Green Version]
- Oshiro, K.; Kainuma, M.; Masui, T. Implications of Japan’s 2030 Target for Long-term Low Emission Pathways. Energy Policy 2017, 110, 581–587. [Google Scholar] [CrossRef]
- Wu, J.; Fan, Y.; Xia, Y. How Can China Achieve Its Nationally Determined Contribution Targets Combining Emissions Trading Scheme and Renewable Energy Policies? Energies 2017, 10, 1166. [Google Scholar] [CrossRef]
- Rasiah, R.; Al-Amin, A.Q.; Habib, N.M.; Chowdhury, A.H.; Ramu, S.C.; Ahmed, F.; Filho, W.L. Assessing climate change mitigation proposals for Malaysia: Implications for emissions and abatement costs. J. Clean. Prod. 2017, 167, 163–173. [Google Scholar] [CrossRef]
- Busby, J.W.; Shidore, S. When decarbonization meets development: The sectoral feasibility of greenhouse gas mitigation in India. Energy Res. Soc. Sci. 2017, 23, 60–73. [Google Scholar] [CrossRef]
- Lee, C.T.; Lim, J.S.; Fan, Y.V.; Liu, X.; Fujiwara, T.; Klemes, J.J. Enabling low-carbon emissions for sustainable development in Asia and beyond. J. Clean. Prod. 2017, 176, 726–735. [Google Scholar] [CrossRef]
- Liu, Y.; Wang, F.; Zheng, J. Estimation of Greenhouse Gas Emissions from the EU, US, China, and India up to 2060 in Comparison with Their Pledges under the Paris Agreement. Sustainability 2017, 9, 1587. [Google Scholar] [CrossRef]
- Ministry of Environment and Urbanization. 2011. Available online: http://www.dsi.gov.tr/docs/iklim-degisikligi/ıdepeng.pdf?sfvrsn=2 (accessed on 4 March 2018).
- IPCC. Climate Change 2014: Mitigation of Climate Change—Contribution of Working Group III to the Fifth Assessment Report of the Intergovernmental Panel on Climate Change; Cambridge University Press: Cambridge, UK; New York, NY, USA, 2014. [Google Scholar]
- Plambeck, E.L.; Hope, C. PAGE95: An Updated Valuation of the Impacts of Global Warming. Energy Policy 1996, 24, 783–793. [Google Scholar] [CrossRef]
- RTI International—Health, Social, and Economics Research. In EMPAX-CGE Model Documentation—Interim Report; RTI Project Number 0209897.002.041; 2008.
- Hu, Z.; Cao, J.; Hong, L.J. Robust Simulation of Global Warming Policies Using the DICE model. Manag. Sci. 2012, 58, 2190–2206. [Google Scholar] [CrossRef]
- Toshiyuki, S.; Goto, M. Returns to Scale vs. Damages to Scale in Data Envelopment Analysis: An Impact of U.S. Clean Air Act on Coal-Fired Power Plants. Omega 2013, 41, 164–175. [Google Scholar]
- Qi, T.; Weng, Y. Economic impacts of an international carbon market in achieving the INDC targets. Energy 2016, 109, 886–893. [Google Scholar] [CrossRef]
- Gu, G.; Wang, Z. Research on global carbon abatement driven by R&D investment in the context of INDCs. Energy 2018, 148, 662–675. [Google Scholar]
- Dong, C.; Dong, X.; Jiang, Q.; Dong, K.; Liua, G. What is the Probability of Achieving the Carbon Dioxide Emission Targets of the Paris Agreement? Evidence from the Top Ten Emitters. Sci. Total Environ. 2018, 622, 1294–1303. [Google Scholar] [CrossRef]
- Telli, C.; Voyvoda, E.; Yeldan, E. Economics of Environmental Policy in Turkey: A General Equilibrium Investigation of the Economic Evaluation of Sectoral Emission Reduction Policies for Climate Change. J. Policy Model. 2008, 30, 321–340. [Google Scholar] [CrossRef] [Green Version]
- Akin Olcum, G.; Erinc, Y. Economic Impact Assessment of Turkey’s Post-Kyoto Vision on Emission Trading. Energy Policy 2013, 60, 764–774. [Google Scholar] [CrossRef]
- Bouzaher, A.; Sahin, S.; Yeldan, E. How to Go Green: A General Equilibrium Investigation of Environmental Policies for Sustained Growth with an Application to Turkey’s Economy. Lett. Spat. Res. Sci. 2015, 8, 49–76. [Google Scholar] [CrossRef] [Green Version]
- Acar, S.; Yeldan, E. Environmental impacts of coal subsidies in Turkey: A general equilibrium analysis. Energy Policy 2016, 90, 1–15. [Google Scholar] [CrossRef]
- Kolsuz, G.; Yeldan, C. Economics of climate change and green employment: A general equilibrium investigation for Turkey. Renew. Sustain. Energy Rev. 2017, 70, 1240–1250. [Google Scholar] [CrossRef]
- WWF and the IPC. Low Carbon Development Pathways and Priorities for Turkey. 2015. Available online: http://www.wwf.org.tr/?5060# (accessed on 9 October 2017).
- Tusiad. Ekonomi Politikaları Perspektifinden İklim Değişikliğiyle Mücadele; Tusiad: Tepebaşı, İstanbul, 2016. [Google Scholar]
- Round, J.I. Constructing SAMs for Development Policy Analysis: Lessons Learned and Challenges Ahead. Econ. Syst. Res. 2003, 15, 161–183. [Google Scholar] [CrossRef]
- Keuning, S.J.; Ruijter, W.A. Guideliness to the Construction of a Social Accounting Matrix. Rev. Income Wealth 1998, 34, 71–100. [Google Scholar] [CrossRef]
- Erten, H. Türkiye için Sektörel Sosyal Hesaplar Matrisi Üretme Yöntemi ve İstihdam Üzerine bir Hesaplanabilir Genel Denge Modeli Uygulaması; State Planning Organization: Ankara, Turkey, 2009.
- Turkstat. Input-Output Table. 2012. Available online: http://www.turkstat.gov.tr/PreTablo.do?alt_id=1021 (accessed on 11 November 2017).
- General Directorate of Budget and Fiscal Control of Turkey. Consolidated Budget Revenues. 2016. Available online: http://www.bumko.gov.tr/TR,160/konsolide-butce-buyuklukleri-program-butce-siniflandirm-.html (accessed on 11 August 2017).
- Turkish Hard Coal Enterprise Institution. Taşkömürü Sektör Raporu—2016. 2015. Available online: http://www.taskomuru.gov.tr/file//duyuru/TTK_2015_Sektor_Raporu.pdf (accessed on 25 May 2017).
- Turkish Coal Enterprises Institution, 2015. Available online: http://www.tki.gov.tr/depo/2017/2013yillikfaaliyetraporu.pdf (accessed on 25 May 2017).
- Turkish Coal Enterprises Institution. Kömür Sektör Raporu (Linyit)—2013. 2014. Available online: http://www.enerji.gov.tr/File/?path=ROOT%2F1%2FDocuments%2FSekt%C3%B6r%20Raporu%2FK%C3%B6m%C3%BCr%20Sekt%C3%B6r%20Raporu%20-%20Linyit%202013.pdf (accessed on 25 May 2017).
- Kara, M. Yerli kömür: Teşviklesek de mi yaksak? Yoksa geleceğe mi saklasak? 2016. Available online: https://www.dunya.com/ekonomi/yerli-komur-tesviklesek-de-mi-yaksak-yoksa-gelecege-mi-saklasak-haberi-318544 (accessed on 25 May 2017).
- Rose, A. Input-Output Economics and Computable General Equilibrium Models. Struct. Chang. Econ. Dyn. 1995, 6, 295–304. [Google Scholar] [CrossRef]
- Klijs, J.; Heijman, W.; Korteweg maris, D.; Bryon, J. Criteria for Comparing Economic Impact Models of Tourism. Tour. Econ. 2012, 18, 1175–1202. [Google Scholar] [CrossRef]
- Bulmer-Thomas, V. Input-Output Analysis in Developing Countries; John Wiley and Sons, Inc.: New York, NY, USA, 1982. [Google Scholar]
- Rose, A.; Steven, B.; Davis, G. Natural Resource Policy and Income Distribution; Johns Hopkins Press: Baltimore, MD, USA, 1988. [Google Scholar]
- Thorbecke, E. Social Accounting Matrices and Social Accounting Analysis; Isard, W., Azis, K.J., Drennan, M.P., Miller, R.E., Saltzman, S., Thorbecke, E., Eds.; Methods of Interregional and Regional Analysis; Ashgate Publishing Limited: Adershot, UK, 1998. [Google Scholar]
- Wagner, J.E. Estimating the economic impacts of tourism. Ann. Tour. Res. 1997, 24, 592–608. [Google Scholar] [CrossRef]
- Miller, R.E. Regional and Interregional Input–Output Analysis; Isard, W., Azis, K.J., Drennan, M.P., Miller, R.E., Saltzman, S., Thorbecke, E., Eds.; Methods of Interregional and Regional Analysis; Ashgate Publishing Limited: Adershot, UK, 1998. [Google Scholar]
- Miller, R.E.; Blair, P.D. Input-Output Analysis: Foundations and Extensions; Prentice Hall: Englewood Cliffs, NJ, USA, 1985. [Google Scholar]
- Martinez de Anguita, P.; Wagner, J.E. Environmental Social Accounting Matrices: Theory and Applications; Routledge: Oxon, UK, 2010. [Google Scholar]
- Sánchez Choliz, J.; Duarte, R. Environmental impact of household activity in Spain. Ecol. Econ. 2007, 62, 308–318. [Google Scholar] [CrossRef]
- Round, J. Social Accounting Matrices and SAM-based Multiplier Analysis; Pereira da Silva, L.A., Bourguignon, F., Eds.; Techniques for Evaluating the Poverty Impact of Economic Policies; World Bank and Oxford University Press: Oxford, UK, 2003. [Google Scholar]
- Pal, B.D.; Pohit, S. Environmentally Extended Social Accounting Matrix for Climate Change Policy Analysis for India. J. Reg. Dev. Plan. 2014, 3, 61–76. [Google Scholar]
- World Bank. INDC Content Briefs—Turkey. 2016. Available online: http://spappssecext.worldbank.org/sites/indc/PDF_Library/TR.pdf (accessed on 9 October 2017).
- Turhan, E.; Cerit-Mazlum, S.; Sahin, U.; Sorman, A.H.; Gundoğan, A.C. Beyond special circumstances: Climate change policy in Turkey 1992–2015. Wiley Interdiscip. Rev. Clim. Chang. 2016, 7, 448–460. [Google Scholar] [CrossRef]
- TurkStat. Some Basic Indicators by Economic Activity. 2017. Available online: http://www.turkstat.gov.tr/PreTablo.do?alt_id=1035 (accessed on 11 November 2017).
- TurkStat. Employment and Some Basic Indicators by Economic Activity. 2017. Available online: http://www.turkstat.gov.tr/PreTablo.do?alt_id=1035 (accessed on 11 November 2017).
- TurkStat. Fixed Capital Investment and Sales by Economic Activity. 2017. Available online: http://www.turkstat.gov.tr/PreTablo.do?alt_id=1035 (accessed on 11 November 2017).
- TurkStat. Electricity Generation and Shares by Energy Resources. 2017. Available online: http://www.turkstat.gov.tr/PreTablo.do?alt_id=1035 (accessed on 11 November 2017).
- TurkStat. Monthly Solid Fuel Statistics, I. Quarter 2012. 2012. Available online: http://www.turkstat.gov.tr/PreHaberBultenleri.do?id=13138 (accessed on 11 November 2017).
- TurkStat. Monthly Solid Fuel Statistics, II. Quarter 2012. 2012. Available online: http://www.turkstat.gov.tr/PreHaberBultenleri.do?id=13143 (accessed on 11 November 2017).
- TurkStat. Solid Fuels, III. Quarter 2012. 2012. Available online: http://www.turkstat.gov.tr/PreHaberBultenleri.do?id=13413 (accessed on 11 November 2017).
- TurkStat. Solid Fuels, IV. Quarter 2012. 2012. Available online: http://www.turkstat.gov.tr/HbPrint.do?id=13475 (accessed on 11 November 2017).
- Leontief, W. Quantitative input–output relations in the economic system of the United States. Rev. Econ. Stat. 1936, 18, 105–125. [Google Scholar] [CrossRef]
Figure 1.
Greenhouse Gas Emissions per Capita and Population between 1990 and 2014 (Source: Authors’ compilations from World Bank [7,8]).


Table 1.
Basic Social Accounting Matrix (SAM) structure for an open economy.
| Activities | Products | Institutions | Saving-Investment | Rest of World | Total | |
|---|---|---|---|---|---|---|
| Activities | Domestic supplies (DC) | Total supply | ||||
| Products | Intermediate inputs (INT) | Consumption (C) | Investment (I) | Export (X) | Total demand of products | |
| Institutions | National Income (Y) | National income | ||||
| Saving-investment | Savings | Foreign savings (M-X) | Total savings | |||
| Rest of World | Import (M) | Rest of world income | ||||
| Total | Production cost | Total supply of products | National income | Total investment | Rest of world expenditure |
Source: Authors’ adaptation from Erten [50].
Table 2.
Aggregated SAM.
| Production | Factors of Production | Household | Government | Saving/Investment | Rest of world | Total | |||
|---|---|---|---|---|---|---|---|---|---|
| Labor | Capital | ||||||||
| Production | 1,490,848,056 | 1,019,043,334 | 241,346,560 | 425,512,803 | 322,634,496 | 3,499,385,249 | |||
| Factors of production | Labor | 438,577,769 | 438,577,769 | ||||||
| Capital | 941,948,340 | 941,948,340 | |||||||
| Household | 438,577,769 | 941,948,340 | 1,380,526,109 | ||||||
| Government | 179,686,122 | 63,502,297 | 243,188,419 | ||||||
| Saving/Investment | 297,980,477 | 1,841,858 | 125,690,468 | 425,512,803 | |||||
| Rest of world | 448,324,964 | 448,324,964 | |||||||
| Total | 3,499,385,250 | 438,577,769 | 941,948,340 | 1,380,526,108 | 243,188,419 | 425,512,803 | 448,324,964 | ||
Table 3.
Multipliers calculated from the Extended Social Accounting Matrix (ESAM).
| Agriculture | Coal Mining | Petroluem, Natural Gas Extraction | Food | Coke, Refined Petroleum | Chemistry | |
|---|---|---|---|---|---|---|
| Accounting multipliers | 7.57 | 2.91 | 2.91 | 7.73 | 3.23 | 4.16 |
| Output/output multipliers | 3.88 | 1.86 | 1.86 | 4.29 | 2.27 | 2.64 |
| Employment/Output multipliers | 0.37 | 0.16 | 0.16 | 0.45 | 0.14 | 0.25 |
| Value added/output multipliers | 1.85 | 0.52 | 0.52 | 1.72 | 0.48 | 0.76 |
| Mineral | Metal | Waste | Railway transport | Highway transport | Water Transport | |
| Accounting multipliers | 6.58 | 4.3 | 4.38 | 6.82 | 6.87 | 7.04 |
| Output/output multipliers | 3.79 | 2.82 | 2.57 | 3.7 | 3.71 | 3.8 |
| Employment/Output multipliers | 0.44 | 0.22 | 0.26 | 0.36 | 0.39 | 0.45 |
| Value added/output multipliers | 1.4 | 0.74 | 0.9 | 1.56 | 1.58 | 1.62 |
| Air transport | Industry | Service | Elec.coal | Elec.pet. | Elec.nat.gas | |
| Accounting multipliers | 5.36 | 5.76 | 7.75 | 7.37 | 7.37 | 7.37 |
| Output/output multipliers | 3.2 | 3.38 | 3.97 | 4.64 | 4.64 | 4.64 |
| Employment/Output multipliers | 0.4 | 0.37 | 0.65 | 0.38 | 0.38 | 0.38 |
| Value added/output multipliers | 1.08 | 1.19 | 1.89 | 1.36 | 1.36 | 1.36 |
| Elec.hydro | Elec.renew. | Labor | Capital | Household | ||
| Accounting multipliers | 7.37 | 7.37 | 7.24 | 7.24 | 6.24 | |
| Output/output multipliers | 4.64 | 4.64 | - | - | - | |
| Employment/Output multipliers | 0.38 | 0.38 | - | - | - | |
| Value added/output multipliers | 1.36 | 1.36 | - | - | - |
Source: Authors’ calculations.
Table 4.
National Climate Change Action Plan (NCCAP) policies and results.
| Sector | Policy for 2015 | Shock Number | Change of Total Greenhouse Gas Inventory (%) | Change in Employment (%) | Change in GDP (%) | Change in Output (%) | Change in Hard Coal Use (%) | Change in Lignite Use (%) |
|---|---|---|---|---|---|---|---|---|
| ENERGY | INCREASING EFFICIENCY TYPE SHOCK: A 10% decrease shock in exogenous final demand accounts of primary energy sectors (coal mining; petroleum and natural gas extraction; manufacturing of coke and refined petroleum) with an aim of reducing primary energy intensity. | NCCAP01 | −0.09 | na | na | na | −0.05 | −0.06 |
| INCREASING EFFICIENCY TYPE SHOCK: A 10% decrease shock in exogenous final demand accounts of all electricity producing sectors with an aim of increasing efficiency. | NCCAP02 | −0.63 | na | na | na | -0.83 | −1.79 | |
| TRANSFERRING VOLUME TYPE SHOCK: A transfer shock in exogenous final demand accounts from coal electricity sector to hydro electricity sector at a rate of 16.3% of total electricity exogenous final demand with an aim of increasing clean energy in energy production. | NCCAP03 | −0.82 | 0.00 | 0.00 | 0.00 | −2.18 | −4.92 | |
| INCREASING EFFICIENCY TYPE SHOCK: A decrease shock in all electricity sectors at a rate of 2.18% with an aim of reducing losses and illicit use in electricity distribution. | NCCAP04 | −0.14 | na | na | na | −0.18 | −0.39 | |
| TRANSPORTATION | TRANSFERRING VOLUME TYPE SHOCK: A transfer shock in exogenous final demand accounts from highway transport to railway transport at a rate of 10% of highway transport exogenous final demand with an aim of ensuring balanced utilization of transport modes. | NCCAP05 | −0.22 | −0.05 | −0.01 | 0.00 | 0.00 | 0.00 |
| TRANSFERRING VOLUME TYPE SHOCK: A transfer shock in exogenous final demand accounts from highway transport to water transport at a rate of 10% of highway transport exogenous final demand with an aim of ensuring balanced utilization of transport modes. | NCCAP06 | −0.30 | 0.08 | 0.02 | 0.01 | 0.00 | 0.02 | |
| TRANSFERRING VOLUME TYPE SHOCK: A transfer shock in exogenous final demand accounts from highway transport to railway transport at a rate of 20% of highway transport exogenous final demand with an aim of ensuring balanced utilization of transport modes. | NCCAP07 | −0.44 | −0.09 | −0.02 | 0.00 | 0.00 | −0.01 | |
| WASTE | INCREASING EFIICIENCY TYPE SHOCK: A 10% decrease in all waste amount with an aim of ensuring effective waste management. | NCCAP08 | −0.05 | na | na | na | −0.02 | −0.02 |
| Total | −2.69 | −0.06 | −0.01 | 0.01 | −3.25 | −7.16 | ||
Source: Authors’ compilation from NCCAP document [32] and authors’ calculations.
Table 5.
Intended Nationally Determined Contribution (INDC) policies and results.
| Sector | Policy for 2030 | Shock Number | Change of Total Greenhouse Gas Inventory (%) | Change in Employment (%) | Change in GDP (%) | Change in Output (%) | Change in Hard Coal Use (%) | Change in Lignite Use (%) |
|---|---|---|---|---|---|---|---|---|
| ENERGY | TRANSFERRING VOLUME TYPE SHOCK: A transfer shock in exogenous final demand accounts from coal electricity sector to renewable electricity sector at a rate of 14.3% of total electricity exogenous final demand with an aim of increasing renewable resources in production. | INDC01 | −0.72 | 0.00 | 0.00 | 0.00 | −1.91 | −4.30 |
| TRANSFERRING VOLUME TYPE SHOCK: A transfer shock in exogenous final demand accounts first from coal electricity, then petroleum electricity, then natural gas electricity sectors to hydro electricity sector at a rate of 32.4% of total electricity exogenous final demand with an aim of tapping the whole hydroelectric potential. | INDC02 | −1.54 | 0.00 | 0.00 | 0.00 | −3.79 | −8.55 | |
| INCREASING EFFICIENCY TYPE SHOCK: A decrease shock in all electricity sectors at a rate of 15% with an aim of reducing electricity transmission and distribution losses. | INDC03 | −0.94 | na | na | na | −1.25 | −2.68 | |
| Total | −3.20 | 0.00 | 0.00 | 0.00 | −6.95 | −15.53 | ||
Source: Authors’ compilation from INDC document [5] and authors’ calculations.
Table 6.
Sector categories according to output, employment, value added multipliers and emission coefficients.
Table 6.
Sector categories according to output, employment, value added multipliers and emission coefficients.
| Sectors | Output Multiplier | Category | Employment Multiplier | Category | Value Added Multiplier | Category | Emission Coefficient (kg CO2 eq./billion TL) | Category |
|---|---|---|---|---|---|---|---|---|
| Agriculture | 3.88 | high | 0.37 | high | 1.85 | very high | 279.48 | high |
| Coal mining | 1.86 | zero | 0.16 | zero | 0.52 | zero | 188.50 | high |
| Petroleum, natural gas extraction | 1.86 | zero | 0.16 | zero | 0.52 | zero | 146.98 | high |
| Food | 4.29 | high | 0.45 | high | 1.72 | very high | 11.90 | low |
| Coke, refined petroleum | 2.27 | zero | 0.14 | zero | 0.48 | zero | 62.63 | low |
| Chemistry | 2.64 | low | 0.25 | low | 0.76 | zero | 52.17 | low |
| Mineral | 3.79 | high | 0.44 | high | 1.40 | high | 1084.06 | very high |
| Metal | 2.82 | low | 0.22 | zero | 0.74 | zero | 104.01 | low |
| Waste | 2.57 | zero | 0.26 | low | 0.90 | low | 388.47 | high |
| Railway transport | 3.70 | high | 0.36 | high | 1.56 | high | 102.13 | low |
| Highway transport | 3.71 | high | 0.39 | high | 1.58 | high | 266.58 | high |
| Water transport | 3.80 | high | 0.45 | high | 1.62 | high | 79.28 | low |
| Air transport | 3.20 | low | 0.40 | high | 1.08 | low | 139.50 | high |
| Industry | 3.38 | low | 0.37 | high | 1.19 | low | 27.53 | low |
| Service | 3.97 | high | 0.65 | very high | 1.89 | very high | 0.00 | zero |
| Elec.coal | 4.64 | very high | 0.38 | high | 1.36 | high | 1873.27 | very high |
| Elec.pet. | 4.64 | very high | 0.38 | high | 1.36 | high | 1435.07 | very high |
| Elec.nat.gas | 4.64 | very high | 0.38 | high | 1.36 | High | 1040.99 | very high |
| Elec.hydro | 4.64 | very high | 0.38 | high | 1.36 | High | 0.00 | zero |
| Elec.renew | 4.64 | very high | 0.38 | high | 1.36 | High | 0.00 | zero |
| Categorization information | Category | Interval | Category | Interval | Category | Interval | Category | Interval |
| zero | >0 | zero | >0 | Zero | >0 | zero | =0 | |
| low | >2.64 | low | >0.23 | Low | >0.8 | low | <109 | |
| high | >3.55 | high | >0.35 | High | >1.23 | high | <428 | |
| very high | >4.46 | very high | >0.47 | very high | >1.66 | very high | >428 |
Source: Author’s calculations. See in text for classifications.
Table 7.
Emissions decreasing policies and results.
| Sector | Policy for 2030 | Shock Number | Change of Total Greenhouse Gas Inventory (%) | Change in Employment (%) | Change in GDP (%) | Change in Output (%) | Change in Hard Coal Use (%) | Change in Lignite Use (%) |
|---|---|---|---|---|---|---|---|---|
| ENERGY | INCREASING EFFICIENCY TYPE SHOCK: A 10% decrease shock in exogenous final demand accounts in primary energy sectors (coal mining, petroleum natural gas extraction, coke, refined petroleum) with an aim of reducing primary energy intensity. | EMIS01 | −0.09 | na | na | na | −0.05 | −0.06 |
| INCREASING EFFICIENCY TYPE SHOCK: A 10% decrease shock in exogenous final demand accounts of all electricity producing sectors with an aim of raising efficiency in electricity use. | EMIS02 | −0.63 | na | na | na | −0.83 | −1.79 | |
| TRANSFERRING VOLUME TYPE SHOCK: A transfer shock in exogenous final demand accounts first from coal electricity, then petroleum electricity, then natural gas electricity sectors to hydro electricity sector at a rate of 32.4% of total electricity exogenous final demand with an aim of tapping the whole hydroelectric potential. | EMIS03 | −1.54 | 0.00 | 0.00 | 0.00 | −3.79 | −8.55 | |
| INCREASING EFFICIENCY TYPE SHOCK: A 10% decrease shock in exogenous final demand accounts in coal, petroleum and natural gas electricity production with an aim of increasing efficiency by co-generation technologies. | EMIS04 | −0.53 | na | na | na | −0.71 | −1.53 | |
| INCREASING EFFICIENCY TYPE SHOCK: A 10% decrease shock in exogenous final demand accounts in all electricity producing sectors with an aim of reducing losses and illicit use in electricity distribution. | EMIS05 | −0.63 | na | na | na | −0.83 | −1.79 | |
| TRANSFERRING VOLUME TYPE SHOCK: A 10% transfer shock in exogenous final demand accounts from coal electricity to renewable electricity with an aim of increasing share of clean energy in electricity production. | EMIS06 | −0.14 | 0.00 | 0.00 | 0.00 | −0.38 | −0.85 | |
| TRANSFERRING VOLUME TYPE SHOCK: A 10% transfer shock in exogenous final demand accounts from petroleum electricity to renewable electricity with an aim of increasing share of clean energy in electricity production. | EMIS07 | −0.003 | 0.000 | 0.000 | 0.000 | 0.000 | 0.000 | |
| TRANSFERRING VOLUME TYPE SHOCK: A 10% transfer shock in exogenous accounts from natural gas electricity to renewable electricity with an aim of increasing share of clean energy in electricity production. | EMIS08 | −0.12 | 0.00 | 0.00 | 0.00 | 0.00 | 0.00 | |
| INDUSTRY | TRANSFERRING VOLUME TYPE SHOCK: A 10% transfer shock in exogenous accounts from mineral sector to service sector with an aim of decreasing greenhouse gas intensity per GDP produced in industry main sector. | EMIS09 | −0.18 | 0.03 | 0.02 | 0.00 | −0.01 | −0.02 |
| TRANSPORTATION | TRANSFERRING VOLUME TYPE SHOCK: A 10% transfer shock in exogenous accounts from highway transportation to railway transportation with an aim of decreasing CO2 equivalent intensity in transportation. | EMIS10 | −0.22 | −0.05 | −0.01 | 0.00 | 0.00 | 0.00 |
| TRANSFERRING VOLUME TYPE SHOCK: A 10% transfer shock in exogenous accounts from highway transportation to water transportation with an aim of decreasing CO2 equivalent intensity in transportation. | EMIS11 | −0.30 | 0.08 | 0.02 | 0.02 | 0.00 | 0.02 | |
| INCREASING EFFICIENCY TYPE SHOCK: A 10% decrease shock in exogenous accounts in highway transportation. | EMIS12 | −0.90 | na | na | na | −0.41 | −0.50 | |
| WASTE | INCREASING EFFICIENCY TYPE SHOCK: A 10% decrease shock in exogenous accounts in waste sector. | EMIS13 | −0.05 | na | na | na | −0.02 | −0.02 |
| AGRICULTURE | INCREASING EFFICIENCY TYPE SHOCK: A 10% decrease shock in exogenous accounts in agriculture sector. | EMIS14 | −0.76 | na | na | na | −0.38 | −0.45 |
| Total | −6.09 | 0.06 | 0.03 | 0.02 | −7.40 | −15.54 | ||
| Policy mix proposed by the authors | −4.54 | 0.06 | 0.03 | 0.02 | −3.61 | −6.99 | ||
Source: Authors’ calculations.
Table 8.
Developmental and GDP increasing policies and results.
| Sector | Policy for 2030 | Shock Number | Change of Total Greenhouse Gas Inv. (%) | Change in Emp. (%) | Change in GDP (%) | Change in Output (%) | Change in Hard Coal Use (%) | Change in Lignite Use (%) |
|---|---|---|---|---|---|---|---|---|
| ENERGY | INCREASING EFFICIENCY TYPE SHOCK: A 10% increase shock in exogenous final demand accounts of all electricity producing sectors. | OUT01/GDP01 | na | 0.10 | 0.12 | 0.16 | na | na |
| INDUSTRY | TRANSFERRING VOLUME TYPE SHOCK: A 10% transfer shock in exogenous final demand accounts from chemistry, metal, industry sectors to service, mineral, food sectors. | OUT02/GDP02 | 0.68 | 2.23 | 2.00 | 0.78 | −0.26 | 0.94 |
| INCREASING EFFICIENCY TYPE SHOCK: A 10% increase shock in exogenous final demand accounts of food, mineral, service sectors. | OUT03/GDP03 | na | 6.47 | 6.22 | 5.30 | na | na | |
| AGRICULTURE | INCREASING EFFICIENCY TYPE SHOCK: A 10% increase shock in exogenous final demand accounts of agriculture sector. | OUT04/GDP04 | na | 0.38 | 0.61 | 0.50 | na | na |
| Total | 0.68 | 9.19 | 8.95 | 6.73 | -0.26 | 0.94 | ||
Source: Authors’ calculations.
Table 9.
Results of employment increasing policies generated by the authors.
| Sector | Policy for 2030 | Shock Number | Change of Total Greenhouse Gas Inv. (%) | Change in Emp. (%) | Change in GDP (%) | Change in Output (%) | Change in Hard Coal Use (%) | CHANGE in lignite Use (%) |
|---|---|---|---|---|---|---|---|---|
| ENERGY | INCREASING EFFICIENCY TYPE SHOCK: A 10% increase shock in exogenous final demand accounts of all electricity producing sectors. | EMP01 | na | 0.10 | 0.12 | 0.16 | na | na |
| INDUSTRY | TRANSFERRING VOLUME TYPE SHOCK: A 10% transfer shock in exogenous final demand accounts from chemistry, metal sectors to service, mineral, food, industry sectors. | EMP02 | 0.08 | 0.34 | 0.32 | 0.16 | −0.28 | 0.15 |
| INCREASING EFFICIENCY TYPE SHOCK: A 10% increase shock in exogenous final demand accounts of food, mineral, service, and industry sectors. | EMP03 | na | 9.23 | 9.00 | 8.42 | na | na | |
| AGRICULTURE | INCREASING EFFICIENCY TYPE SHOCK: A 10% increase shock in exogenous final demand accounts of agriculture sector. | EMP04 | na | 0.38 | 0.61 | 0.50 | na | na |
| Total | 0.08 | 10.05 | 10.05 | 9.23 | −0.28 | 0.15 | ||
Source: Authors’ calculations.
© 2018 by the authors. Licensee MDPI, Basel, Switzerland. This article is an open access article distributed under the terms and conditions of the Creative Commons Attribution (CC BY) license (http://creativecommons.org/licenses/by/4.0/).
Share and Cite
MDPI and ACS Style
Alkan, A.; Oğuş Binatlı, A.; Değer, Ç. Achieving Turkey’s INDC Target: Assessments of NCCAP and INDC Documents and Proposing Conceivable Policies. Sustainability 2018, 10, 1722. https://doi.org/10.3390/su10061722
AMA Style
Alkan A, Oğuş Binatlı A, Değer Ç. Achieving Turkey’s INDC Target: Assessments of NCCAP and INDC Documents and Proposing Conceivable Policies. Sustainability. 2018; 10(6):1722. https://doi.org/10.3390/su10061722
Chicago/Turabian StyleAlkan, Ayla, Ayla Oğuş Binatlı, and Çağaçan Değer. 2018. "Achieving Turkey’s INDC Target: Assessments of NCCAP and INDC Documents and Proposing Conceivable Policies" Sustainability 10, no. 6: 1722. https://doi.org/10.3390/su10061722
Note that from the first issue of 2016, this journal uses article numbers instead of page numbers. See further details here.